
Growth, Xylem Vulnerability to Cavitation and Leaf Cell Response to Dehydration in Tree Seedlings of the Caribbean Dry Forest

1
UMR EcoFoG, Université des Antilles, CNRS, CIRAD, INRAE, AgroParisTech, Université de Guyane, UFR SEN, BP. 592, F-97159 Pointe-à-Pitre, France
2
INRAE, UMR 547 PIAF, F-63100 Clermont-Ferrand, France
3
University Blaise Pascal, UMR 547 PIAF, F-63000 Clermont-Ferrand, France
4
LESSEM, INRAE, University Grenoble Alpes, F-38402 Saint-Martin-d’Hères, France
*
Author to whom correspondence should be addressed.
Forests 2023, 14(4), 697; https://doi.org/10.3390/f14040697
Submission received: 15 January 2023
/
Revised: 15 February 2023
/
Accepted: 15 February 2023
/
Published: 28 March 2023
(This article belongs to the Special Issue Drought Tolerance Traits and Growth in Trees)
Abstract
:The characterisation of ecological strategies to predict drought response is still lacking for Caribbean dry forest seedlings. This study documents growth characteristics and tolerance to drought via xylem hydraulic and leaf cell properties of three dominant native species of the Caribbean dry forest. Twenty morphological and physiological traits were assessed in Citharexylum spinosum, Guaiacum officinale and Guapira fragrans in greenhouse conditions. The seedlings displayed contrasting growth rates, which were positively correlated with the capacity to quickly develop a large leaf area and root fraction. The three species had a similar xylem tolerance to embolism (P50: −4 MPa) but differed in leaf cell tolerance to dehydration, which was negatively correlated with RGR (R2 > 0.87). The slowest-growing, G. officinale, had high leaf tolerance to cell dehydration due to low ΨTLP and πo, but displayed a narrow hydraulic safety margin. The leaves of the fast-growing C. spinosum were sensitive to leaf dehydration but exhibited a surprisingly wide stem hydraulic safety margin. G. fragrans had intermediate traits. Our results showed that dry forest seedling growth in similar environments can exhibit distinct carbon growth strategies as well as contrasting water-use strategies, primarily as they relate to drought resistance, due to variation in root development and leaf cell resistance to dehydration. Our study thus provides an approach to estimate species performance under drought conditions.
1. Introduction
In the current context of biodiversity crises and global change, forest conservation and restoration are recognised as a global priority [1]. Historically, in tropical areas, even though moist forests have received considerably less attention, their dry counterparts received little interest [2]. Tropical dry forests (TDFs) are still often neglected in global studies of forest ecosystems [3] and remain poorly known, whereas they are recognised as the most threatened of tropical terrestrial ecosystems worldwide [4]. TDFs represented 42% of tropical forests 40 years ago [5], but anthropogenic disturbance (timber and charcoal extraction) and land conversion to agriculture turned remaining TDFs into secondary forests or cattle pastures [2]. In this fragile and highly fragmented in its global distribution ecosystem, natural recovery is slow and uncertain [6,7] and many species are critically endangered [8]. More than half of all TDFs are found in the neotropics, with over 9% of these in the insular Caribbean [9]. This biodiversity hotspot [10] covers 0.5% of the total neotropical land area and thus makes a disproportionate contribution to global TDF cover. Dry forests of the insular Caribbean are floristically and structurally distinct from those of continental systems, displaying high endemism and shorter height [5,11]. Caribbean islands are also identified as a climate hotspot [12] where TDFs are threatened by the increased drought risk brought by climate change [13,14]. The predicted cumulative effect of recurring short-term droughts could affect TDF species’ survival, distribution and development [15,16].
The understanding of plant ecological strategies, including response to drought in TDFs, is of crucial importance to both promote resilient restoration, as a nature-based solution to mitigate climate change, and predict the future dynamics of TDFs [17]. Most studies aiming to characterise TDF ecological strategies focus on the adult stage [18,19], and less on the seedling stage [20,21]. However, the ontogenetic shifts reported in traits for trees indicate that strategies identified in adults cannot be extended to their seedlings [22,23]. Seedlings are particularly exposed to water stress because the seedlings’ root systems are confined to the drier, upper soil layers and have limited access to water [24,25]. Soil drought is also one of the most important factors affecting seedling mortality, growth and recruitment [24,25,26]. Seedlings of TDF species are known to present adaptive traits and form deeper roots and a much larger root/shoot ratio compared to species from tropical wet forests, which could be a strategy to tolerate periods of soil drought [21]. Thus, the role of drought tolerance in promoting establishment requires particular attention because of its direct impact on survival in the early life stages, regeneration, community assembly dynamics and also forest structure and species composition [27,28] in TDF.
Species living under similar environmental conditions (i.e., light and water availability) may differ in growth potential and drought response [29,30,31]. They rank along an acquisitive-conservative strategy continuum of ecological strategies, identified at adult and seedling stage, resulting from a pattern of trait covariation that captures the balance between construction costs and growth potential [32]. Species with higher growth rates (RGR) have a strategy of fast ‘carbon acquisition’ that often involves greater carbon assimilation rate, leaf area and specific leaf area [33]. Species with slower growth rates follow a ‘conservative’ strategy; they usually exhibit opposite characteristics, such as lower carbon assimilation rate, leaf area and specific leaf area. Fast-growing trees are often pioneer species, displaying low wood density, deciduous foliage and large stature. Slow-growing species are often climax species and tend to have high wood density, evergreen foliage and small stature [34,35].
Few studies explain the physiological responses of seedlings affected by the disruption of the water fluxes due to drought. An adjustment in leaf stomatal conductance, osmotic potential, tissue elasticity and xylem conductance has been described [36]. TDF species differ widely in their response to drought [37]. Drought affects cavitation in the xylem vessels, which restricts the flow of water into the plant [38], and loss of turgor of leaf cells, which may result in wilting [39]. According to several studies, xylem tolerance to cavitation plays a significant role in drought tolerance in tropical biomes [15,40]. To measure xylem hydraulic tolerance to cavitation, a variety of methods, aiming to establish vulnerability curves (i.e., bench dehydration, centrifugation, pressure sleeve or Cavitron) have been developed and tested over the years [41]. The most reliable of those that avoid experimental artifacts consists in experimentally constructing the curve of xylem vulnerability to drought-induced embolism on stem samples drying out in the laboratory [41]. The water potential that results in a 50% loss of conductivity (P50) is a parameter commonly used to assess plant tolerance to embolism [38,39].
A complementary ex situ approach used to investigate plant response to drought focuses on leaf cell tolerance to drought, assessed according to parameters of the pressure–volume (P-V) curve. This corresponds to the curve fitted to the variation in leaf water potential in relation to leaf water content during progressive leaf dehydration. Several parameters are extracted from this curve, such as the leaf water potential at turgor loss point (ΨTLP), the osmotic potential at full turgor (πo) and the bulk modulus of cell elasticity (ε). ΨTLP is another key trait that contributes to plant-level drought tolerance [40,42]. For example, the more negative ΨTLP is, the wider is the range of water potentials at which the leaf stays turgid and functional [39,42].
Plant tolerance to desiccation can thus be appreciated by studies on xylem cavitation and cell turgor using ex situ methods involving stem or leaf dehydration in the laboratory without setting up a factorial design experiment (well-irrigated plants versus non-irrigated plants under water stress). Determining P50 and ΨTLP can also help to predict the effects of drought on species mortality. The risk of plant hydraulic failure during drought can be estimated as the difference between ΨTLP and the water potential that causes xylem dysfunction (P50), called the TLP-based hydraulic safety margin (HSM) [43].
Since stomatal regulation prevents excessive embolism but also reduces CO2 acquisition, a plant’s hydraulic traits are highly correlated with its capacity to assimilate carbon [44,45,46]. Consequently, plant hydraulics could play an important role in a plant’s position along the acquisitive–conservative continuum in tropical forests [46,47]. In TDFs, the few studies that have examined the links between plant hydraulic traits and carbon assimilation and use revealed contrasting results, ranging from no correlation in 12 Mexican seedlings [48] to significant correlations in 13 Bolivian seedlings [49]. Further investigations are therefore required to document these functional relationships at the early stages.
We considered how morphological and physiological traits influence growth rates in three TDF species, using a greenhouse experiment. We tested the hypothesis according to which Caribbean TDF seedlings with contrasting growth strategies should also exhibit distinct drought tolerance traits, in the stem and/or leaf. We expected acquisitive species to invest in fast growth and associated traits at the expense of a more vulnerable hydraulic system, and more conservative species to be more drought resistant. In order to understand the drought response of TDF species, we quantified and compared growth rates and tolerance to dehydration in seedlings of three dominant tree species of the Caribbean dry forest (Citharexylum spinosum, Guaiacum officinale and Guapira fragrans). We analysed factors likely to govern biomass accumulation, such as morphology, biomass allocation and photosynthesis. Plant drought tolerance was studied by monitoring the effects of experimentally induced dehydration on plant fragments (stem, leaf) ex situ, in the laboratory.
Because approaches that combine functional traits with whole plant performance are scarce, this study, which includes the selection of a set of complete, relevant traits, will contribute to our understanding of how traits influence fitness in TDF, a poorly known ecosystem. This study should be impactful in terms of its contribution to the field because the trait data used are time intensive to collect, which limits their popularity, yet they are critically important for understanding how plants adapt to drought conditions.
2. Materials and Methods
2.1. Plant Material and Experimentation
The three native canopy species selected for this experiment are widely distributed in the neotropics and are dominant species in three different stages (pioneer, intermediate and climax species) of the natural TDF succession [50]. The pioneer species, Citharexylum spinosum (L.), is a heliophilous, fast-growing semideciduous species. The species from the intermediate succession stages, Guapira fragans (Dum. Cours.), is a ubiquitous evergreen species, widely distributed from moist to dry forests, with a medium growth rate. Because of their fast and abundant seed production and their wide ecological tolerance, both are potentially suitable for dry forest restoration programmes. C. spinosum is also highly recommended in soil bioengineering for riparian forest restoration [51]. The climax species, Guaiacum officinale, is an evergreen species with a slower growth rate. G. officinale is a threatened hardwood species with high ecological value. It has also been included in the red list of IUCN since 1993 and local programmes of population reinforcement are scheduled for conservation purposes. It grows exclusively in extremely dry areas of the neotropical dry forest.
The experiments were carried out at the University of French West Indies (Pointe-à-Pitre, Guadeloupe FWI, 16°13′27″ N, 61°31′44″ W) from June to September 2013 under semi-controlled conditions. The seeds were collected in the Botanical Park of Petit Canal, where annual precipitation rank between 900 and 1400 mm, with 10 months of water deficit and pre-sown in small pots. Two weeks later, 30 individuals of each species with similar heights were selected and individually transferred to 1.5 L pots (diameter: 9 cm; height: 25 cm) containing commercial peat (pH H2O: 6; N: 120 mg L−1; P2O5: 140 mg L−1; K2O: 160 mg L−1) and 30 g of physiolith (Secma eurofertil, CaCO3: 80%, MgCO3: 7%, amino purine molecules: 3%) to neutralise peat pH and prevent deficiencies in trace elements. In the greenhouse, the seedlings were watered to field capacity every two days and exposed to 50% of the daylight. Mean daily air temperature, relative humidity and solar radiation in the greenhouse during growth were respectively 38.4 ± 7.3 °C, 73.8 ± 4.7% and 42.1 ± 54.8 J cm−2.
After 18 weeks of development, at the end of the experiment, four seedlings per species were used for the biomass measurements, fifteen for constructing the xylem vulnerability curve, five for leaf traits and plant transpiration analyses and five for establishing the P-V curve (detailed below). The abbreviations and units used for the traits studied are summarised in Table 1. The number of individuals used for each trait are summarised in Figure 1.
2.2. Morphometric and Biomass Measurements
Stem height above the hypocotyl was measured on five individuals of each species. Leaf area was measured with a leaf area meter (Licor3000C, Li-Cor, NE, USA, maximum accuracy = 0.01 cm2). All the adult leaves of each individual (totalling 30, 10 and 8 leaves for C. spinosum, P. fragrans and G. officinale, respectively) were oven-dried at 75 °C for 48 h and then weighed using a precision balance (Sartorius, CPA 225D, Germany). SLA was calculated as the ratio of leaf area to leaf dry weight. Stomatal density (abaxial and adaxial) and ostiole length were obtained from epidermal imprints of fresh leaf surfaces made with clear nail polish on four leaves, each from a different individual, per species. The measurements were carried out on photographs taken with an optical microscope (Nikon Eclipse 80i and camera Nikon digital DXM 1200F, Nikon instrument Europe BV). Counts were performed with the Mesurim pro 3.4 software (3.4 ©J-F. Madre, Academy of Amiens, Amiens, France).
For biomass measurements, 15 seeds per species were oven-dried at 75 °C for one week and weighed to obtain seed mass. The roots, stems (including branches) and leaves of four individuals were separated and dried for 48 h at 75 °C. The leaf, stem and root mass fractions (respectively, LMF, SMF and RMF, i.e., dry mass per unit of dry plant mass in %) and the shoot/root ratio were calculated. Relative growth rate (RGR in g g−1 wk−1) over the study intervals was also calculated for each plant, with the following formula:
where Mi and Mf represent, respectively, the initial and final above-ground biomass and T is the corresponding time interval in weeks, i.e., 18 [52]. The initial above-ground biomass was equal to the seed mass.
2.3. Leaf Gas Exchange
The measurements of leaf gas exchanges were conducted between 9:00 and 12:00 (solar time) on the most recent fully expanded and sun-exposed leaf of four randomly selected seedlings per species. The response curves were established using a portable IRGA system (Ciras-2, PP systems, Hitchin, UK). For the A-light response curve, the photosynthetic photon flux density (PPFD) was adjusted to 2000, 1500, 1000, 750, 500, 200, 100, 50 and 0 µmol m−2 s−1. All measurements were conducted at a constant CO2 concentration of 380 ppm and at a constant leaf temperature of 25 °C. From these relationships, the light-saturated net photosynthesis rate (Asat) was obtained using the Lobo et al. (2013) [53] spreadsheet. Maximal stomatal conductance (gs) was recorded.
For each plant, Atot was calculated as Asat x Total plant LA.
2.4. Wood Density, Stem Water Content and Huber Value
Following Simpson (1993) [54], stem wood density (SWD) was measured on four stems per species as the ratio of dry weight to fresh volume. Stem water content (SWC) was calculated as follows:
where Wf is the fresh weight obtained after complete hydration in distilled water during five days (at 6 °C) and Wd is the dry weight after 7 days in the oven at 75 °C. Weight was measured on an electronic balance (Sartorius, CPA 225D, Germany, 0–100 ± 0.00001 g).
The Huber value (Hv) corresponds to the sapwood-to-leaf ratio, which describes the balance between transpiration and sapwood water supply. Leaf and sapwood areas were determined destructively from three individuals per species. Sapwood was distinguished from heartwood by staining with phloxine dye, because of its ability to migrate rapidly upwards, but also to not diffuse passively beyond the conductive zone, using the free transpiration method [55,56]. The stem section at collar level was cut under water and dipped into a beaker of 2% aqueous solution of Phloxine B (Sigma Aldrich, Burlington, NJ, USA). Sapwood area was measured at the penultimate internode level. The individuals were allowed to transpire for 10–20 min. Photomicrographs of fresh cuts (Nikon Eclipse 80 i and camera Nikon digital DXM 1200F, Nikon instrument Europe BV, Amsterdam, The Netherlands) were processed using the Mesurim software to measure the stained area. Leaf area was assessed as above by measuring all the leaves present beyond the cut (between cut section and apical meristem).
2.5. Pressure–Volume Curves
Pressure–volume curves were constructed using the most recently fully expanded leaf of three seedlings. The leaves, with their petiole, were cut in deionised water at dawn, then wrapped in plastic and re-hydrated in water overnight, in the dark. Pressure–volume curves were constructed by measuring leaf water potential and weight as leaves were dried by progressively increasing the pressure in a pressure chamber. Measurements were continued until at least five data points were recorded after the turgor loss point. Leaves were then oven-dried at 70 °C for 48 h and weighed with an electronic balance (Sartorius, CPA 225D). The parameters obtained were the osmotic potential at full turgor (πo), the water potential at the turgor loss point (ΨTLP) and the bulk modulus of elasticity (ε (Mpa)). This last parameter was determined following Schulte (1985) [57] using the expression:
where ΔP is the change in turgor pressure (MPa) and ΔRWC is the change in relative water content between full turgor and zero turgor.
2.6. Xylem Embolism Vulnerability Curves
The vulnerability curves show the percentage loss in hydraulic conductivity as a function of xylem water potential. They were established following the bench dehydration method of Sperry et al. (1988) [58]: the seedlings were cut and left to dehydrate freely in an air-conditioned room at 25 °C. Five petioles/rachises per seedling were measured in sequence of increasing dehydration. After each dehydration increment, the seedlings were placed in a black plastic bag for 6 h to allow the water potential of leaves and stems to reach equilibrium. Pressure was estimated with a pressure chamber (PMS1000, PMS Instrument Co., Corvallis, OR, USA) on three leaves prior to embolism estimation. Petioles were inserted in an XYL’EM (Bronkhorst, Montigny-Les-Cormeilles, France) flow meter manifold attached to a pressurised reservoir filled with a flow solution of 10 mM of KCl in degassed and filtered (0.2 µm) distilled water. Solution injection always followed the direction of natural water flow from sample base to top. The native conductance K at low pressure (6 kPa) was measured first and then the maximum conductance Kmax after flushing at high pressure (0.1 Mpa). The percentage loss of hydraulic conductivity (PLC) was calculated using the equation of Tyree and Sperry (1989) [38]:
PLC values were plotted against mean xylem pressure to draw the vulnerability curve for each species, and a sigmoid exponential function was fitted to the experimental data obtained [59]:
where P50 is the pressure causing a 50% loss of hydraulic conductivity and s is the slope parameter. P50 and s were estimated for each species using the Xlstat software V. 2022.4.1 (Addinsoft, France).
2.7. TLP-Based Hydraulic Safety Margin
The TLP-based hydraulic safety margin (HSM) is the risk that a plant will experience hydraulic failure in the driest conditions it normally experiences. It can be defined as the difference between water potential at stomatal closure and P50 [60]. This safety margin quantifies the extent to which early stomatal closure prevents the risk of hydraulic failure for a species [61]. Although stomatal closure occurs before leaf turgor loss during drought, ΨTLP is an indicator of the water potential at stomatal closure across species [62]. Therefore, using this definition, HSM is calculated as ΨTLP − P50.
2.8. Plant Transpiration
Nocturnal and diurnal plant transpiration (mg m−2 s−1) was measured by successive weighing over 24 h. In five individuals of each species, the pot was bagged (leaving out the shoot) just after nightfall and weighed using a balance Sartorius Signum 1 (Germany, 0–7000 ± 0.1 g). The purpose of bagging is to avoid loss of water through soil evaporation. All individuals were weighed again the following morning at sunrise and again just after nightfall. For each seedling, weight loss per unit of time and per unit of leaf area corresponds to the water lost by transpiration.
2.9. Statistical Analyses
Statistical analyses were performed with the Xlstat software (Addinsoft, V. 2022.4.1) to test the specific differences between means of individual groups; sample sizes (n) are shown in Figure 1. One way analysis of variance (ANOVA) in combination with a post hoc Tukey’s multiple comparison was used to test for significant differences in traits of leaf morphology, plant water status, leaf physiology, carbon allocation and carbon acquisition in seedlings across species. In all statistical analyses, values were considered significantly different at alpha < 0.05. Pearson’s correlation analysis was used to explore relationships between growth (RGR), traits related to carbon assimilation and drought tolerance traits.
3. Results
3.1. Growth and Carbon Acquisition
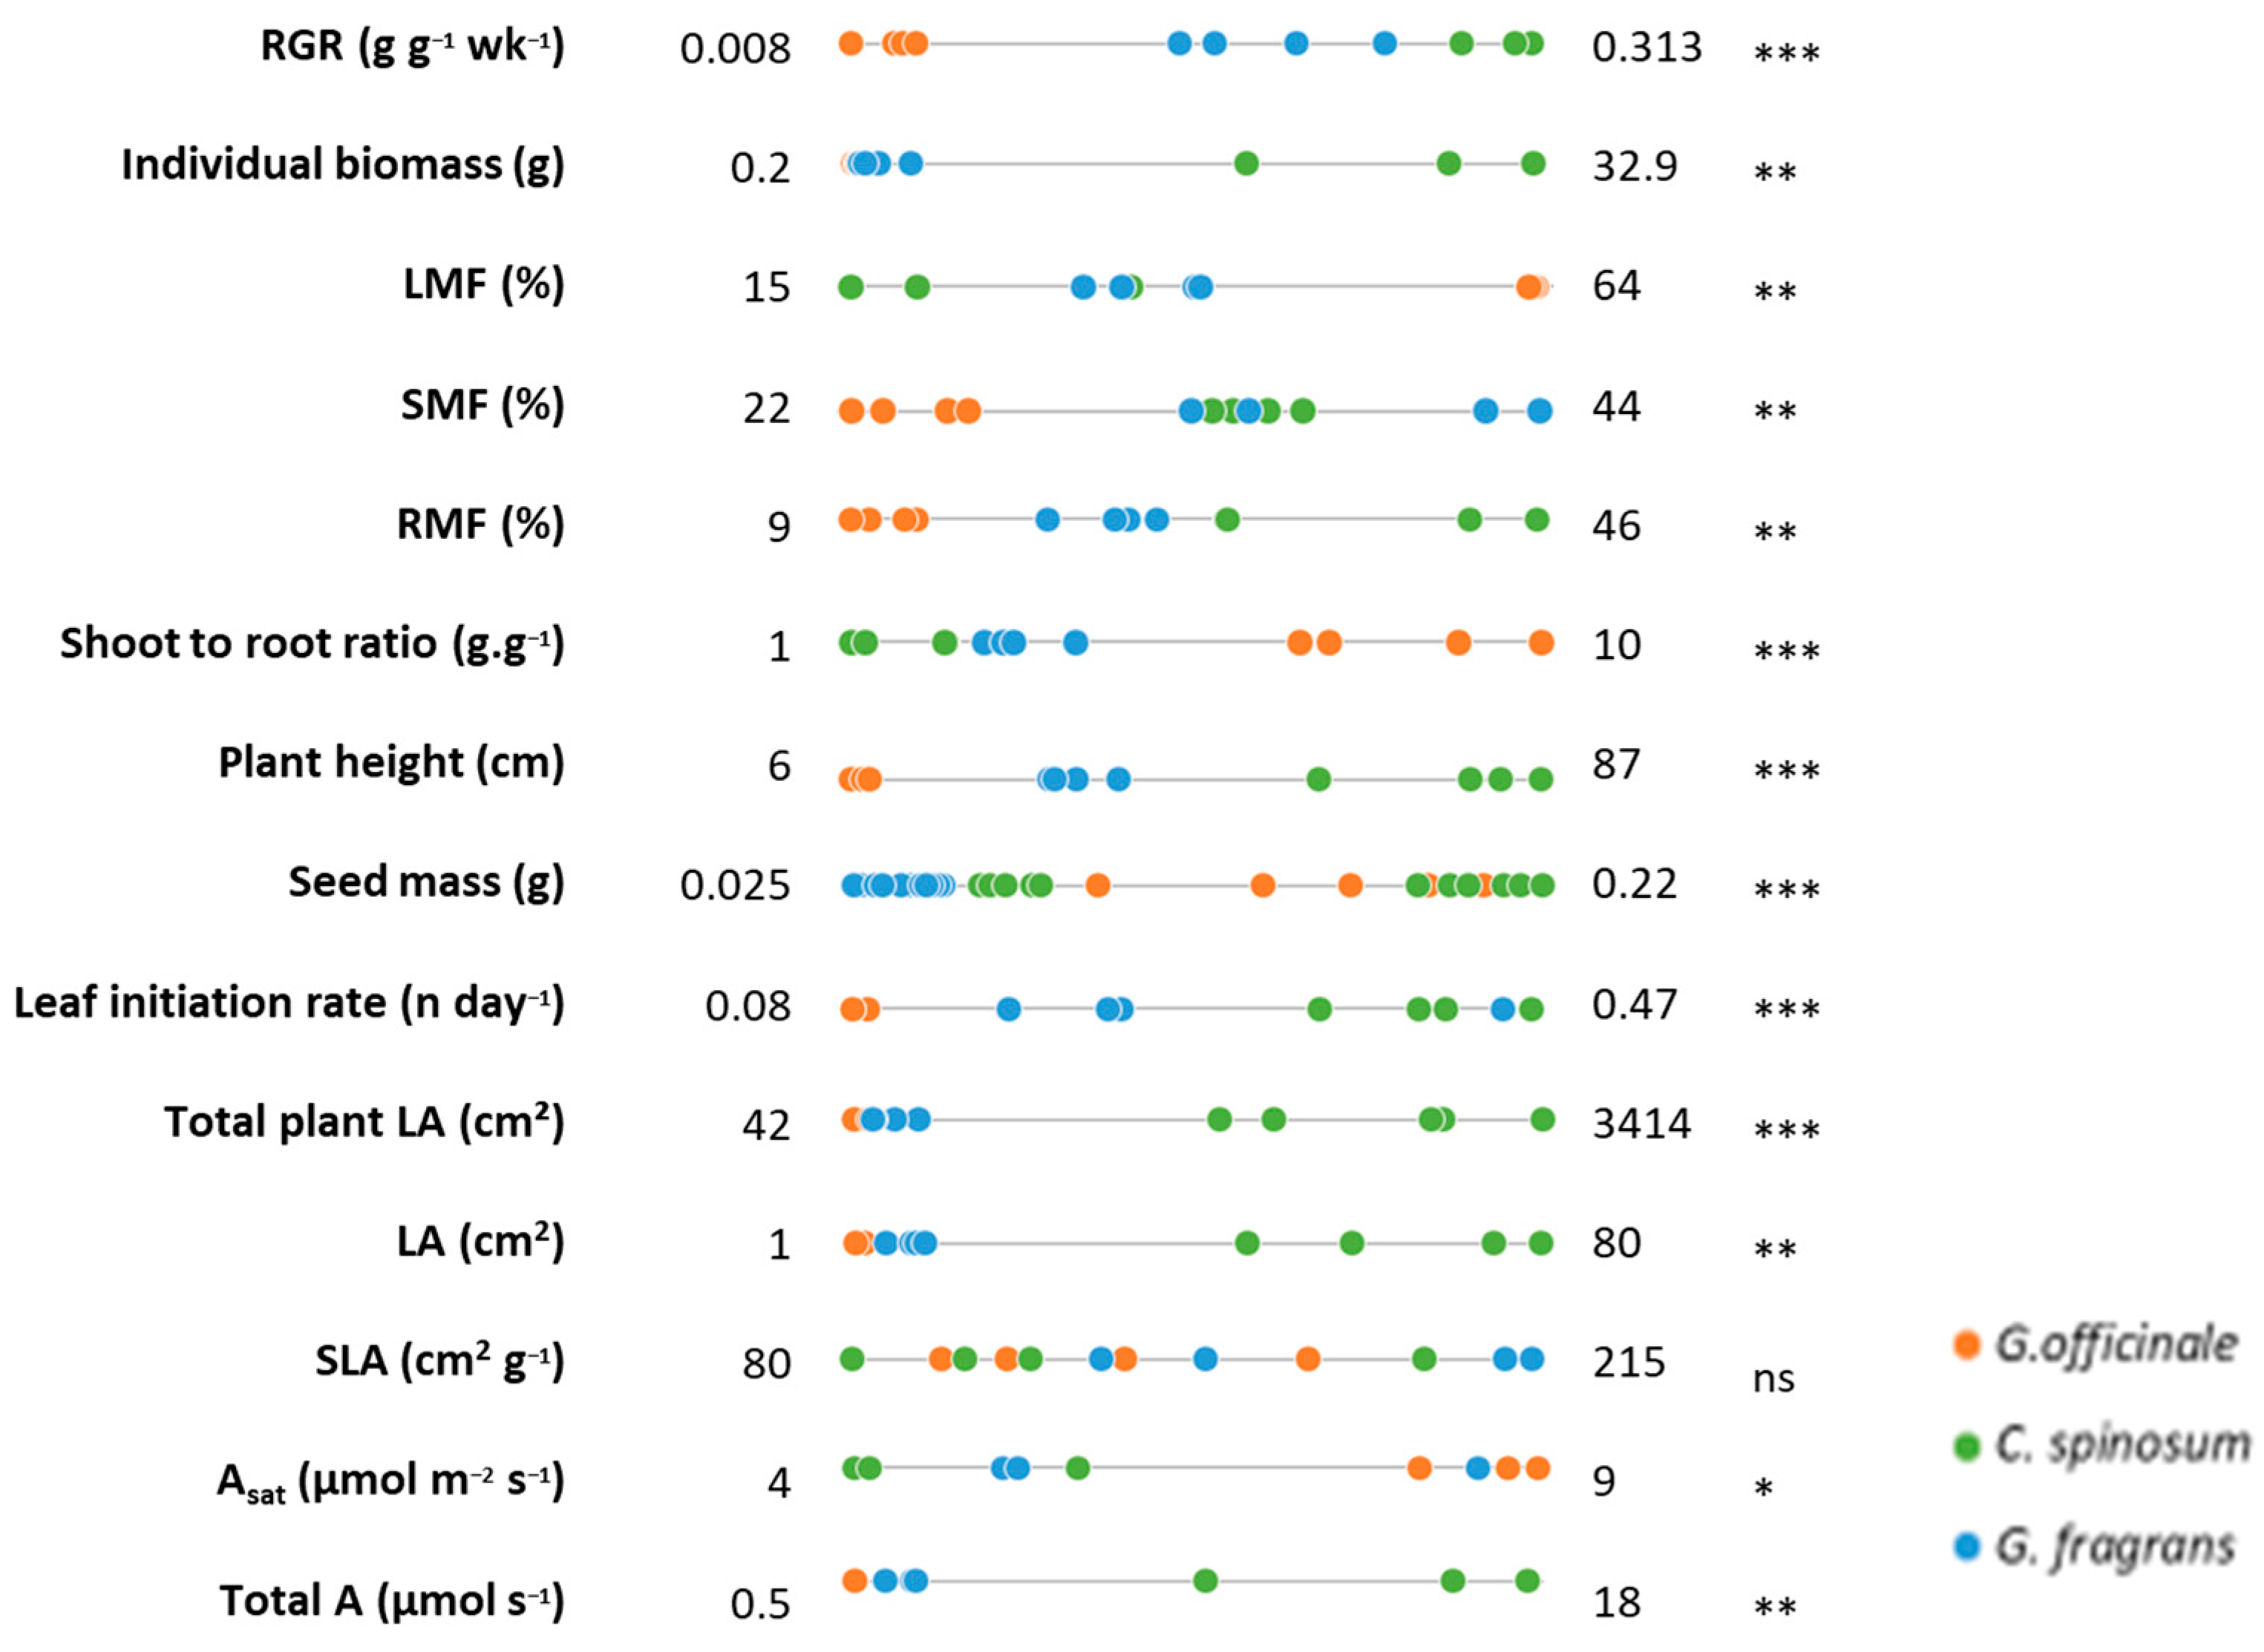
The species studied exhibited clear growth differences (Figure 2). Their seedlings’ RGR, biomass allocation patterns, morphological traits (Figure 3, see Supplementary Materials Table S1 for details) and photosynthetic capacities (Figure 4) varied significantly.
C. spinosum had the fastest RGR (mean 0.303 g g−1 wk−1), with biomass roughly equally distributed among the leaf, stem and root compartments (mean LMF, SMF and RMF all close to 33%). This species also exhibited the fastest leaf initiation rate, with roughly three leaves emitted per week, and reached the greatest height (mean 81 cm) after 5 months of growth. Even though its asat per leaf unit was the lowest (mean 4.8 µmol m−2 s−1), the fact that its total leaf area was the greatest (mean 2627 cm2) gave C. spinosum the highest Atot at the scale of the whole plant (mean 14 µmol s−1).
At the opposite end of the scale, G. officinale exhibited the lowest biomass (mean 0.38 g), RGR (mean 0.026 g g−1 wk−1) and leaf initiation rate, with roughly half a leaf emitted per week. Biomass (mean 89%) was mainly invested in the shoot. G. officinale was also the smallest species, with a mean height of 8 cm at the end of the experiment. G. officinale had the highest mean Asat (9.9 µmol m−2 s−1), but since it had the lowest total leaf area (mean 69 cm2) it also displayed the lowest Atot (mean 0.5 µmol s−1).
G. fragrans displayed intermediate values in biomass (mean 1.45 g), RGR (mean 0.195 g g−1), leaf initiation rate (1.5 leaves per week), Asat (mean 6.7 µmol m−2 s−1), total leaf area (mean 222 cm2) and height (mean 33 cm). Its biomass allocation pattern was similar to that of C. spinosum, with mean LMF, RMF and SMF between 23 and 39%, whereas its mean Atot was close to that of G. officinale (mean 1.7 µmol s−1).
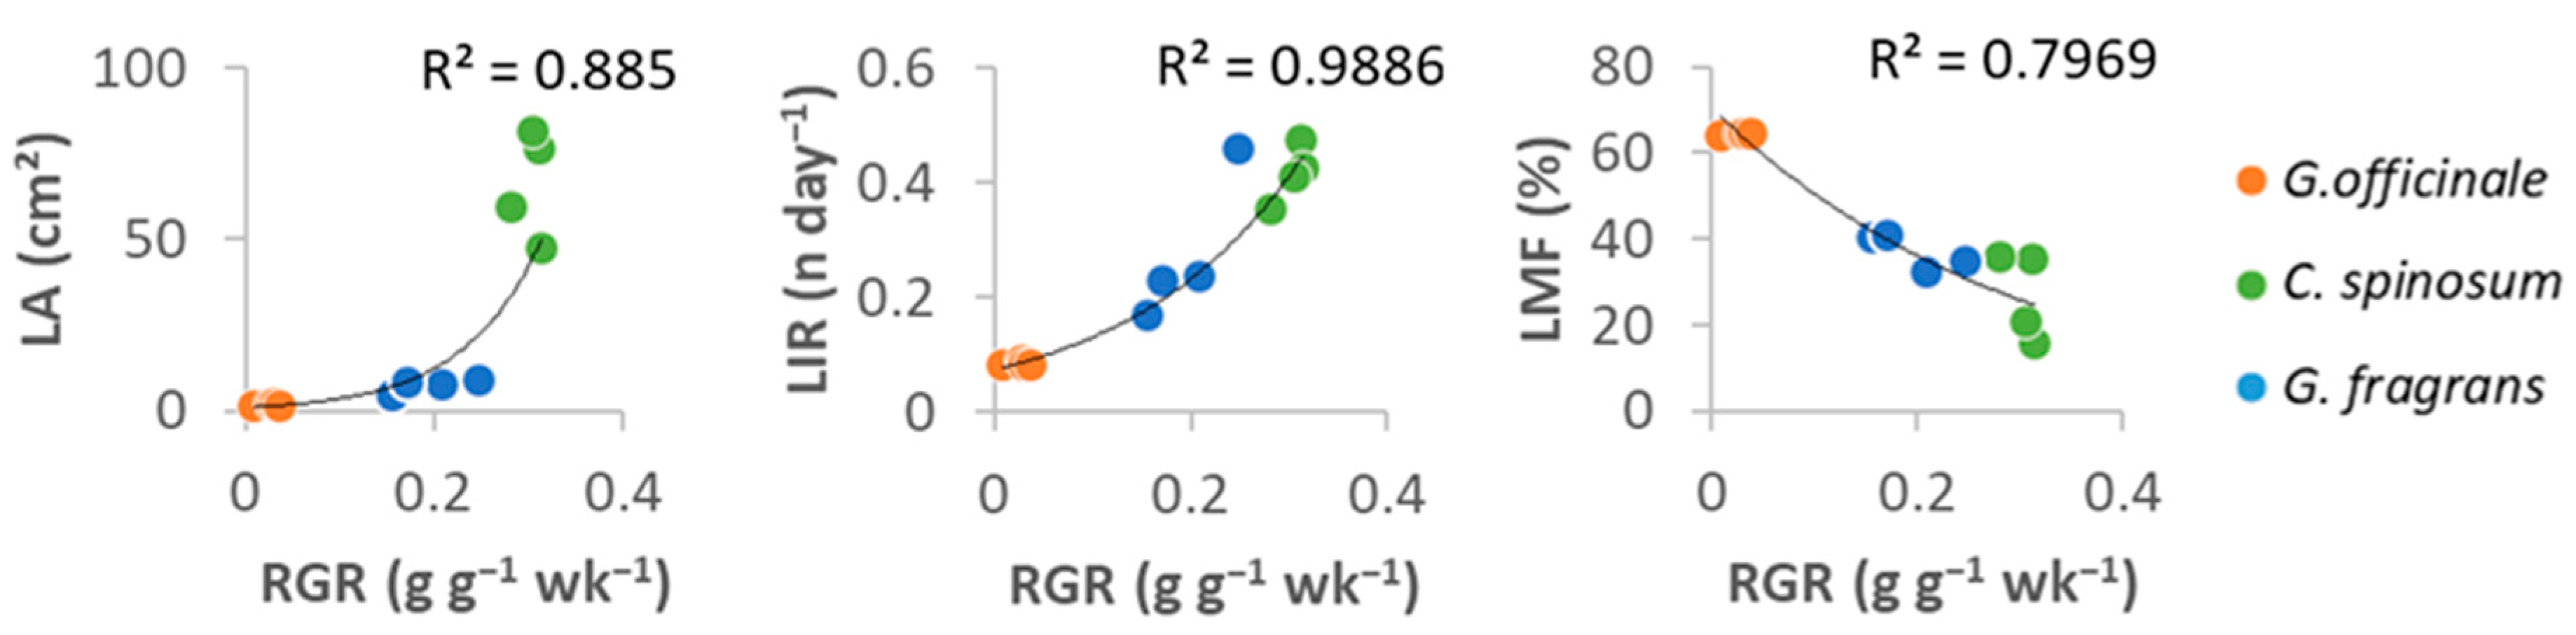
RGR was positively correlated with several morphological leaf traits (i.e., R2 > 0.8 for LIR, LA and LMF with p < 0.05, Figure 5, Supplementary Materials Table S2). RGR also increased with the plant’s ability to develop its root system (low LMF, R2 = −0.95, p < 0.0001).
3.2. Water Management
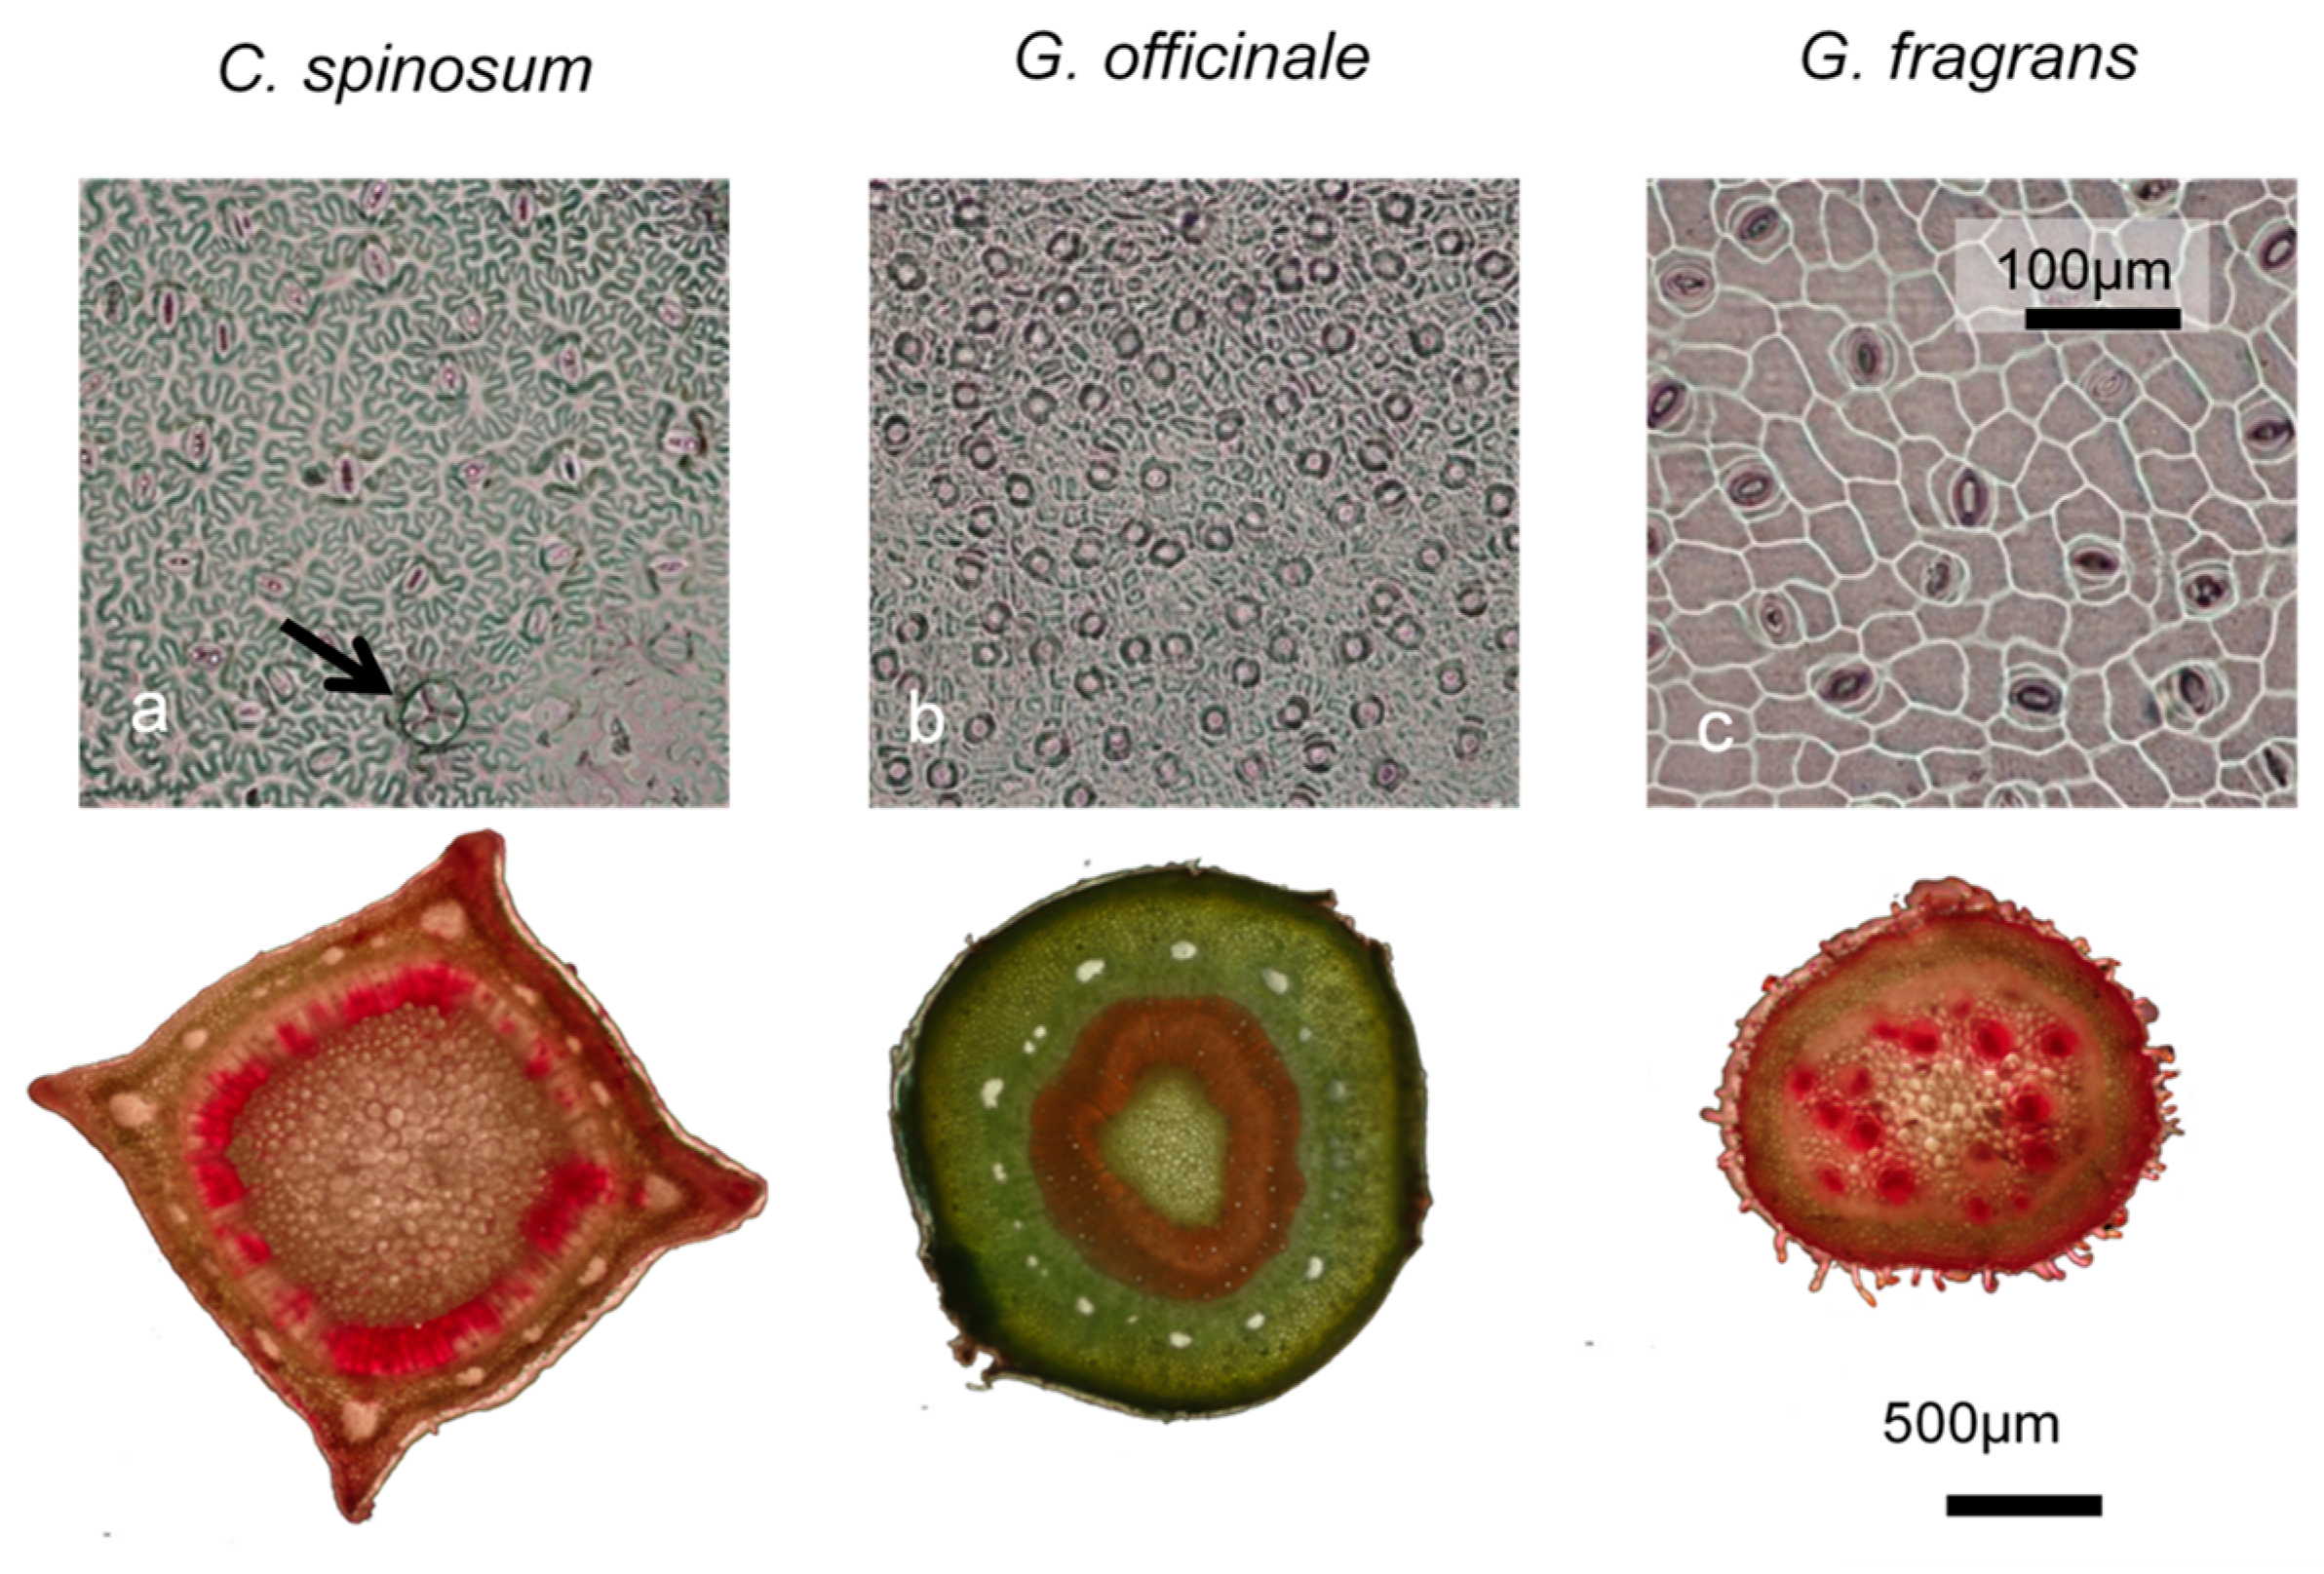
Clear differences in water use and drought tolerance traits appeared between leaves of G. officinale on the one hand and those of G. fragrans and C. spinosum on the other. G. officinale displayed higher Huber value, stomatal density and stomatal conductance than both G. fragrans and C. spinosum (Figure 6). As can be seen in the parameters obtained from the pressure–volume curves (Figure 7, Supplementary Materials Table S3), G. officinale had the lowest osmotic potential at full turgor (mean −2.79 MPa), leaf water potential at turgor loss point (mean -3.04 MPa) and the highest elasticity modulus (mean 32.7 MPa). C. spinosum and G. fragrans exhibited comparable and higher osmotic potential at full turgor (mean −1.7 and −1.47 MPa, respectively) and leaf water potential at turgor loss point (mean −1.30 and −1.66 MPa, respectively), and lower elasticity modulus (mean 10.9 and 15.8 MPa, respectively). However, G. fragrans differed from the other species in wood traits, displaying the highest SWC (mean 153%) and the lowest SWD (mean 0.38 g cm−3).
Xylem vulnerability curves did not show any interspecific variations and P50 values were similar in all three species. Consequently, HSM was lowest in G. officinale (mean 1.46 MPa), greatest in C. spinosum (mean 2.9 MPa) and intermediate in G. fragrans (mean 2.2 MPa).
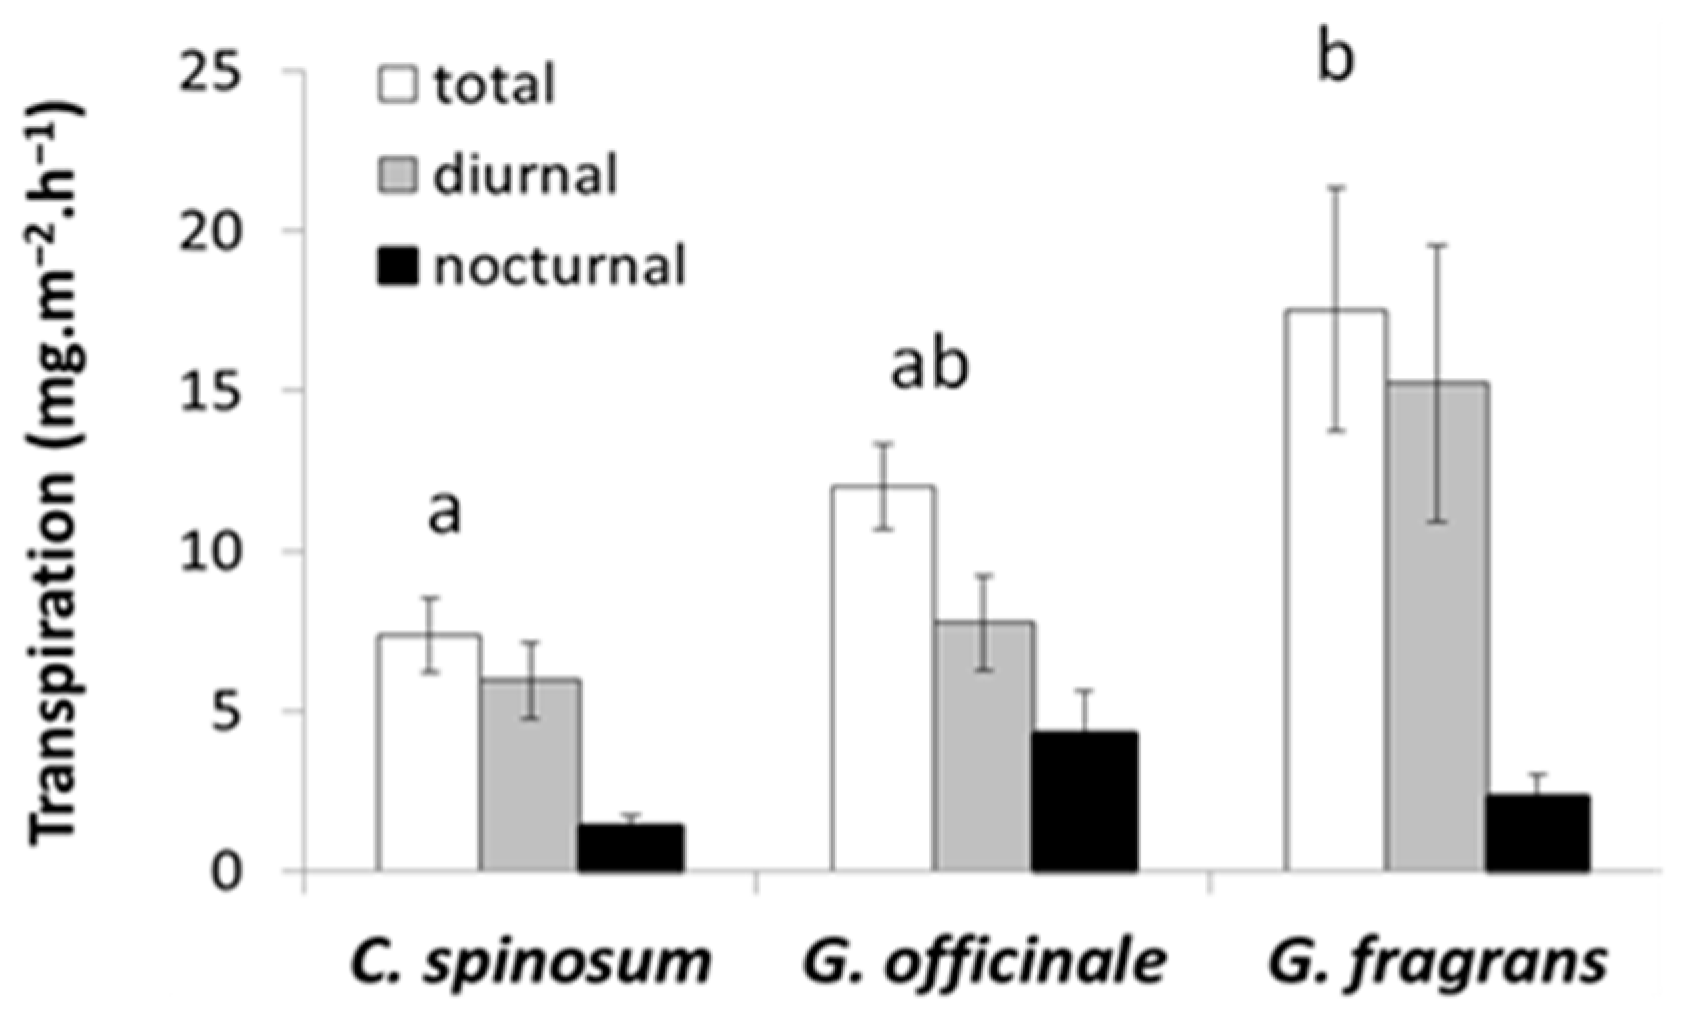
Total plant transpiration differed between species and nocturnal transpiration rate appeared fairly high in all three species (Figure 8). C. spinosum had the lowest total transpiration rate (mean 7.5 mg m−2 s−1) whereas G. fragrans had the highest (mean 17.3 mg m−2 s−1). G. officinale exhibited intermediate values with a mean total transpiration rate of 13.3 mg m−2 s−1, but its nocturnal transpiration rate was the highest (mean 4.3 mg m−2 s−1), a rate almost four times that measured in C. spinosum, the species with the lowest nocturnal transpiration rate.
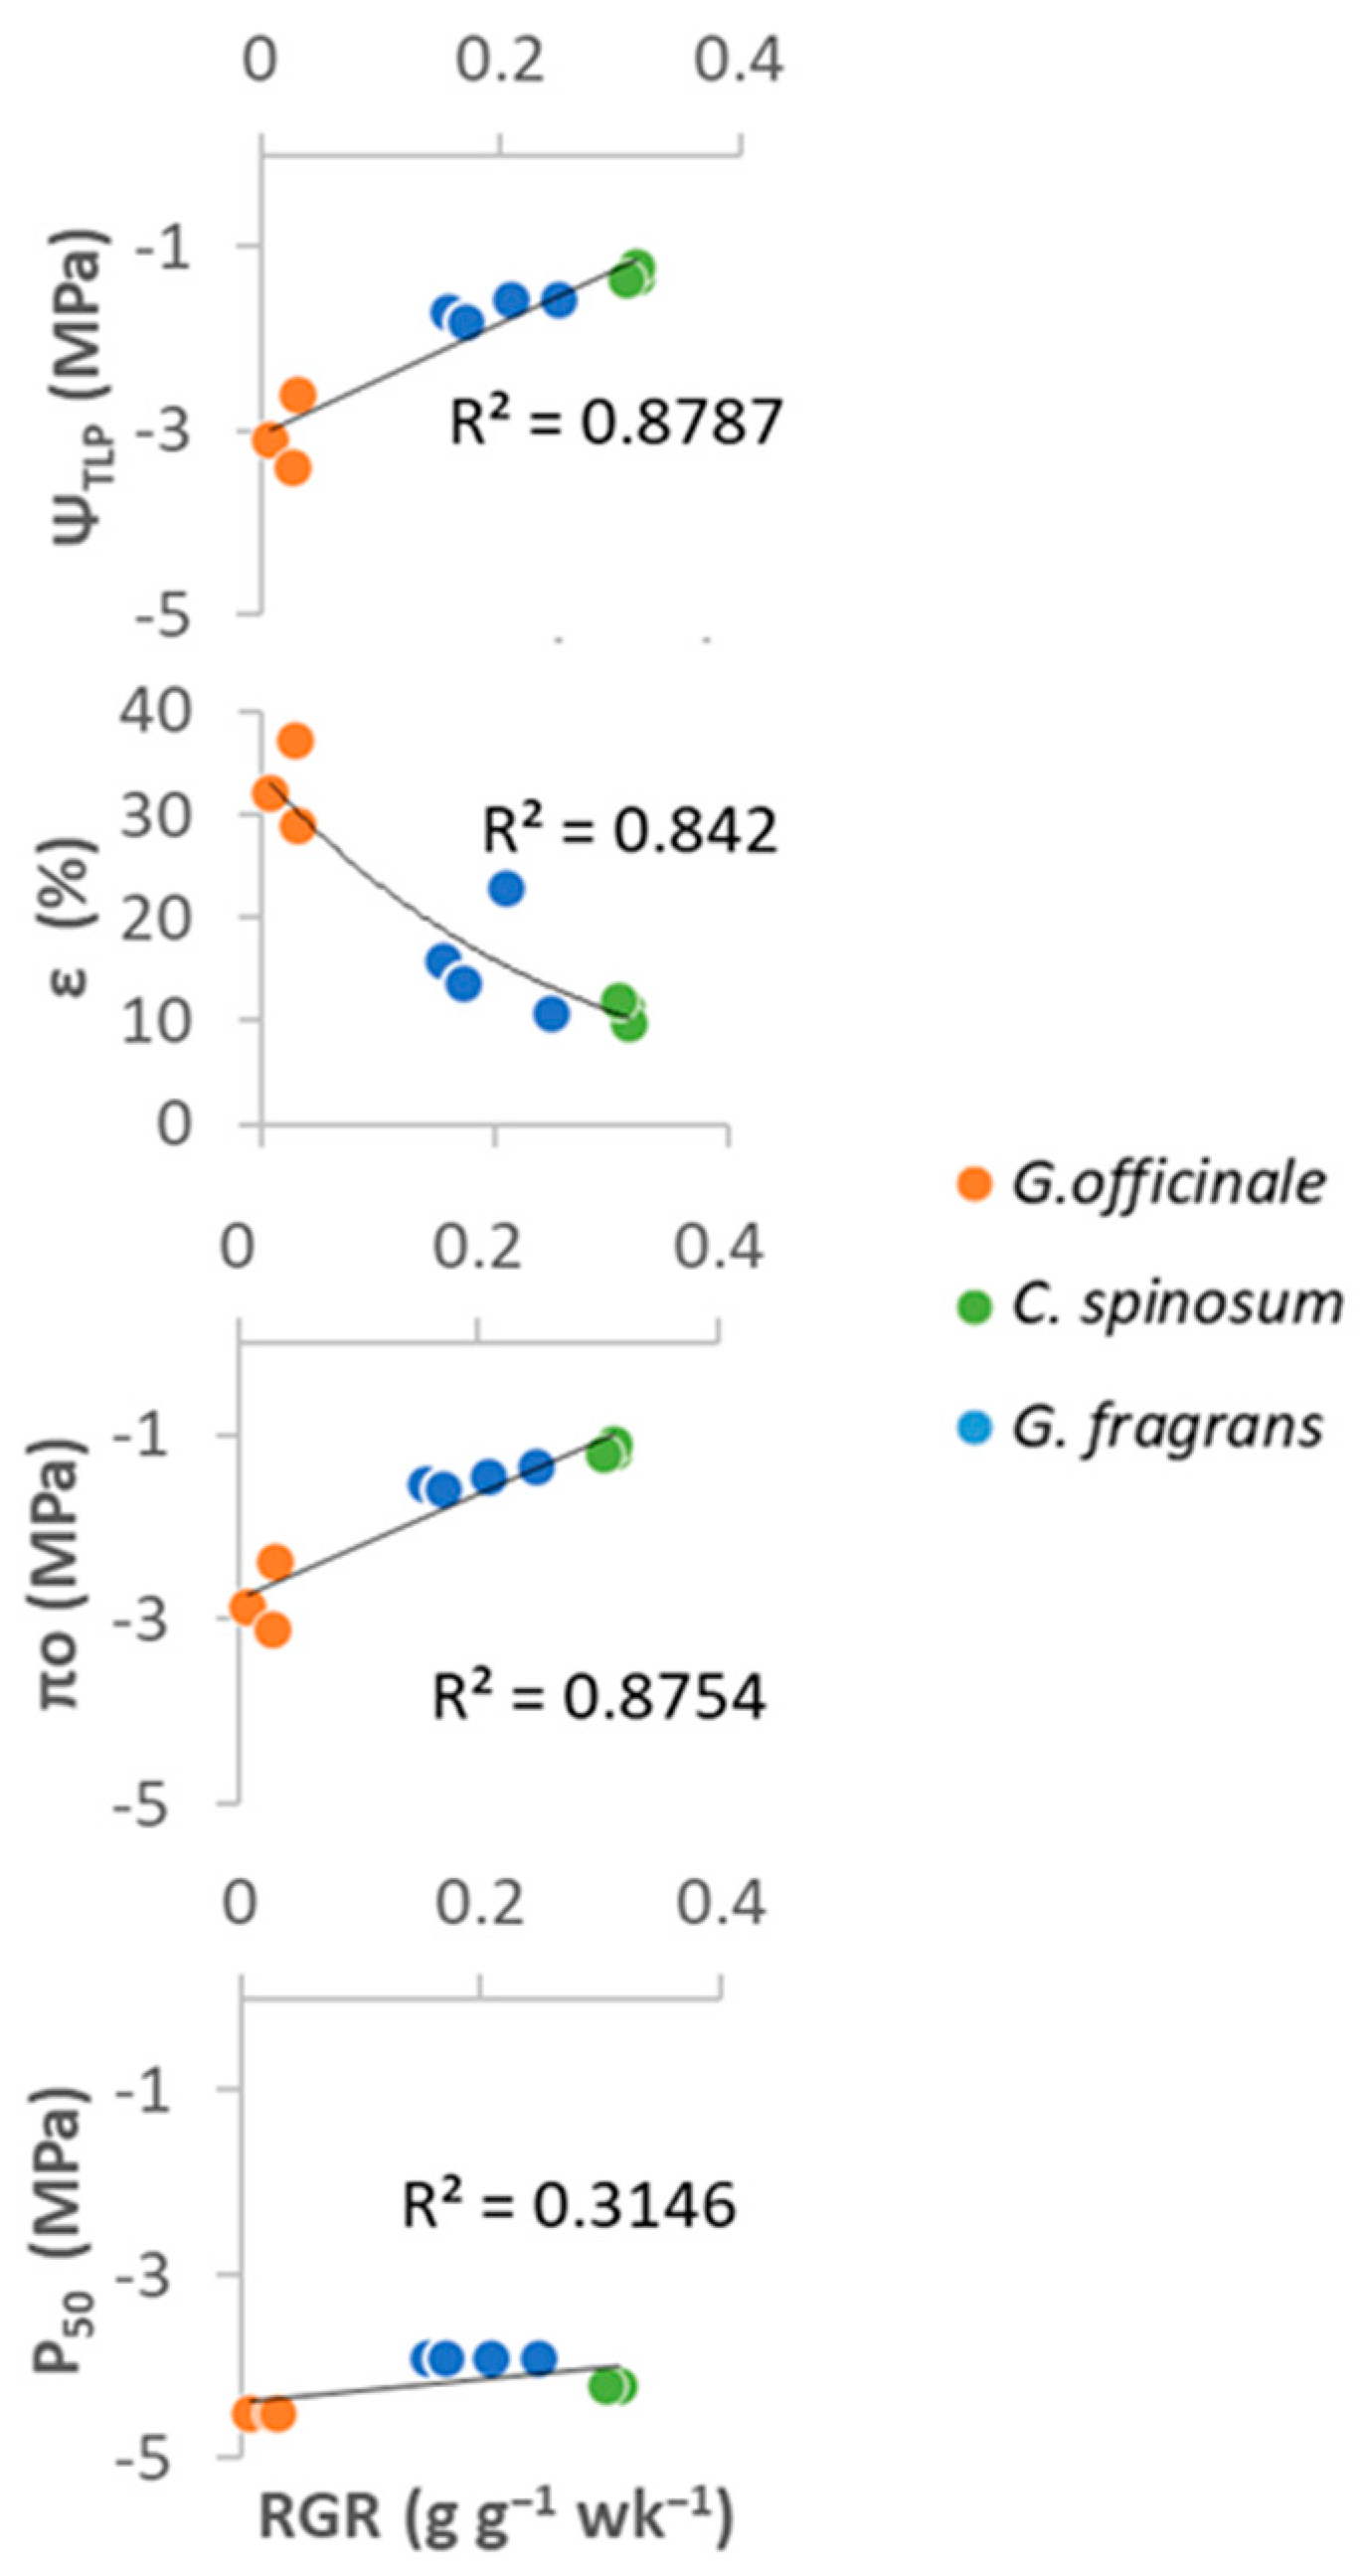
Significant correlations appeared between RGR and leaf drought tolerance traits at the leaf level, and C. spinosum, which had the highest RGR, tended to exhibit a higher πo and Ψtlp (R2 > 0.93, p < 0.0001). However, no relationship was found between RGR and P50 (Figure 9, Supplementary Materials Table S2).
4. Discussion
In conditions of high water availability, the differences observed between the three species studied in carbon acquisition and use result from variation in leaf development. C. spinosum was the most acquisitive species, G. officinale displayed more conservative traits and G. fragrans had an intermediate strategy. This diversity also corresponded to contrasting strategies with respect to drought tolerance. Unexpectedly, the three species were fairly similar regarding vulnerability to cavitation. However, due to significant disparities in their ΨTLP, the risk of plant hydraulic failure during drought differed, being lower in C. spinosum, higher in G. officinale and intermediate in G. fragrans.
4.1. Different Growth Strategies in Seedlings of the Caribbean Dry Forest
In this study, we used traits associated with light capture and use, water use, and growth. Differences in trait co-variation patterns can reflect differences in resource-use strategies among co-occurring species. The fast-growing species C. spinosum maximised its total leaf area with large leaves (55 cm2) and a high rate of leaf initiation (three leaves per week), and this was associated with fast reproductive maturity (flowering at 4 months, results not shown). The large surface area intercepting sunlight ensures high total carbon fixation rate despite low photosynthetic activity in this species. It also appears that C. spinosum has an efficient acquisitive strategy regarding water, light and soil nutrients due to fast root development. This potential for growth certainly confers an advantage in competing with other species and in opportunistically achieving fast growth during the rainy season.
At the opposite end of the scale, G. officinale had the slowest RGR and the smallest total leaf area, 40 times less than C. spinosum. Despite high carbon allocation to leaves and the greatest Asat, the carbon fixation potential of G. officinale remained low at the scale of the whole plant. This evergreen species has a conservative strategy in keeping with its usual habitat, a xeric environment with poor soils, typically a rocky reef topped with a thin humus layer [50]. G. fragrans displayed intermediate growth rate and leaf traits (i.e., LIR, LA and LMF).
Like C. spinosum, G. fragrans is a heliophilous species with an early to intermediate position in the natural succession [50]. Such species tend to be opportunistic and fast-growing [33], but our results revealed significant differences that could be linked to distinct leaf habits [35]. C. spinosum is a semideciduous species that sheds its leaves at the onset of the dry season and leafs out again quickly, within a few weeks. Like most deciduous tropical species, it exhibited an acquisitive strategy involving a fast return on the costs of foliage construction and maintenance [35]. The evergreen G. fragrans displays a more conservative resource-use strategy, which accords with previous studies that have found more conservative leaf traits coupled with long leaf lifespans in evergreen species.
4.2. Interspecific Differences in Water Use and Drought Tolerance
Vulnerability to cavitation was fairly similar in the three species studied, with mean P50 ranging between −3.9 and −4.5 MPa, which are low values comparable with published data on tropical dry forests species [43,63]. This finding is striking, given the wide interspecific differences we observed in RGR and the broad spectrum of P50 values published for tropical forest species (from −0.53 MPa to −6.27 MPa reported among 300 TDF species by Guillemot et al. 2022 [43]). Moreover, we did not find the significant differences in P50 described between semideciduous and evergreen TDF species in other studies [63]. This suggests, as in certain previous reports [49], that stem hydraulics characteristics in TDF species may not necessarily be related to phenological behaviour at the seedling stage.
Conversely, the parameters of the P-V curves revealed several types of leaf response to desiccation. G. officinale had a significantly more negative ΨTLP than the other two species studied here and most TDF species documented [43,63]. G. officinale also displayed a strongly negative πo value of −2.8 MPa, which denotes a high osmotic accumulation that enables this species to efficiently extract water from a drying soil [39]. This probably contributes to the Ψ imbalance between plant and soil and to the significant nocturnal transpiration rate observed in this species in well-watered conditions (Figure 8; [64]). The bulk flow of water into the roots during the night could promote nutrient uptake [65], a useful strategy especially in resource-poor environments such as the skeletal soils of Caribbean TDFs. The enhanced transpiration is consistent with the high stomatal density, Hv and gs, which contribute to leaf cooling [66]. G. officinale has rigid cell walls (high ε), which may be an advantage for maintaining cell integrity during rehydration after a period of drought since it prevents the cell wall from breaking up and the cell from bursting under high turgid cell potential [67]; water storage in the stem (92%) may delay damage to the cell. G. officinale could be considered as particularly resistant to dehydration given the capacity of its leaves to maintain cell turgor and therefore metabolic activity during dehydration.
G. fragrans and C. spinosum were fairly similar regarding the parameters related to water management (stomatal density, Hv and gs) and drought tolerance (the parameters derived from the P-V curves). The most remarkable differences between the two species concerned stem water storage (Figure 6, Supplementary Materials Table S3). G. fragrans has a lower stem density than C. spinosum and other tree seedlings of the Mexican dry forest [48]. The wood of its stem contains vessels with a large lumen and thin cell walls, and a high proportion of parenchyma, in which most of the water could be stored. Its greater capacity to store water makes it better equipped to buffer xylem water deficits, mitigate negative effects of soil desiccation [68] and increase its transpiration rate [69]. Our findings are consistent with studies showing that species with contrasting strategies and different combinations of drought tolerance traits can coexist in the same conditions of water deficit [70].
ΨTLP, not P50, determined HSM in the Caribbean TDF seedlings we studied, in contrast with previous findings on adult TDF trees [43]. In tropical forests, fast-growing plants tend to have a higher risk of embolism with lower HSM compared with slow-growing plants [47]. Our results showed an opposite trend. C. spinosum and G. fragrans, the fastest-growing species, exhibited HSM values among the widest of 300 TDF species documented [43], whereas G. officinale, the slowest-growing species, had a narrower HSM.
Most of the studies aiming to characterise ecological strategies focus on the adult stage, as recommended in standard protocols [55]. Shifting the focus to the seedling stage, albeit on a small number of species, as is the case here, reveals distinctive, unexpected patterns and emphasises the need to take these early stages in consideration when examining the strategies adopted by species in the face of drought.
Interspecific differences in RGR in well-watered conditions were significantly correlated with the parameters of the P-V curves. This suggests that maintaining a low osmotic potential represents a high energetic cost for TDF seedlings, and that slow-growing species are less sensitive to variations in water availability. However, the limited HSM of G. officinale revealed the vulnerability of this species, in which seedling survival could be affected by severe droughts. C. spinosum appeared to perform remarkably well and to be less vulnerable to drought. This species is highly recommendable in restoration projects. G. fragrans, despite its more modest performance, is fairly well protected against hydraulic failure during droughts and develops sufficiently fast to be compatible with TDF restoration programmes.
5. Conclusions
We present here the first experimental study focusing on the link between whole plant performances and functional traits in Caribbean TDF seedlings. Our results provide valuable new information on the growth and drought response of three tree species in their establishment phase. By analysing a combination of functional traits that is rarely reported, we uncovered novel information regarding the resource-use strategies of these species.
In the case of G. officinale, its slow growth (conservative strategy) is associated with substantial carbon costs (respiration, osmoticum production) and a greater capacity to resist drought—it needs and uses less soil water (slow leaf development) and has greater tolerance to leaf dehydration (low ΨTLP), which is consistent with its evergreen phenology. However, its narrow TLP-based HSM indicates that it operates close to its point of hydraulic failure, making it particularly vulnerable to severe droughts. This vulnerability must be taken into account in conservation programmes targeting this endangered species. In contrast, C. spinosum is characterised by a fast growth rate (acquisitive strategy). Opportunistic growth during the rainy season could be associated with leaf cells that become quickly flaccid during dry conditions (high ΨTLP) and are shed when these dry conditions prevail, in keeping with the deciduous leaf phenology of this species. Its wide TLP-based HSM indicates a safe hydraulic strategy, making this species particularly interesting for extensive use in restoration programmes. G. fragrans, even though its growth is not quite as dynamic as that of C. spinosum, also enjoyed a wide HSM, making this species a relevant candidate for such uses.
Despite their distinct growth strategies, which were positively correlated with the capacity to quickly develop leaves, increase root mass fraction and ensure a high whole-plant C assimilation, all three species exhibited similar high xylem tolerance to embolism (P50: −4 MPa). We found evidence of variation in drought resistance and water-use strategies among species spanning a wide range of conservative-acquisitive carbon use. Indeed, their water-use strategies were strongly influenced by hydraulic safety margin and root mass fraction, which had knock-on effects for whole-plant carbon assimilation.
Even though further investigations encompassing a larger number of species are required to confirm our observations, this preliminary approach associating growth analysis and two methods of desiccation in the laboratory applied to leaves and stems appears relevant for clarifying ecological strategies. The study of functional and morphological traits at different plant levels is therefore necessary to understand mechanisms underlying seedling drought responses and to identify the species most resistant to drought in the current context of climate change.
Supplementary Materials
The following supporting information can be downloaded at: https://www.mdpi.com/article/10.3390/f14040697/s1. Table S1: Growth, carbon allocation and traits of carbon acquisition in seedlings of C. spinosum, G. officinale and G. fragrans. For each trait, different alphabetic designations indicate significant differences between means ±SE values (p < 0.05); Table S2: Correlation matrix (Pearson coefficient) between relative growth rate and a number of leaf traits (1st table), and between relative growth rate, 50 percent of loss conductance (P50) and P-V curve parameters (2nd table). LAtot is the total leaf area of a single individual plant, and Atot is the total assimilation rate for a plant at light saturation. The meanings of the other abbreviations (LIR, SLA, LA, RGR, LMF, πo, ΨTLP, ε and P50) can be found in Table 1. The numbers in the matrices are the respective R2 values, indicated in bold when the correlation is significant (* p < 0.05, ** p < 0.01, *** p < 0.001); Table S3: Plant characteristics with respect to water relations: wood, stomatal and hydraulic traits and pressure–volume parameters. Parameters derived from the pressure–volume curves: πo (osmotic potential at full turgor), ΨTLP (water potential at turgor loss point), RWCTLP (relative water content at turgor loss point) and ε (elasticity modulus). Parameters estimated from the function fitted to the vulnerability curves: s (slope of sigmoid model for vulnerability curve), P50 (the water potential at 50% cavitation) and R2 (correlation coefficient of the fit). For each trait, different alphabetic designations indicate significant differences between mean ± SE values (p < 0.05); Table S4: dataset.
Author Contributions
Conceptualization, E.M. and M.D.; data curation, E.M.; formal analysis, E.M.; funding acquisition, E.M. and M.D.; investigation, E.M.; methodology, E.M. and M.D.; project administration, M.D.; resources, M.D.; supervision, M.D.; validation, H.C. and M.D.; visualization, E.M.; writing—original draft, E.M.; writing—review and editing, H.C., A.E. and M.D. All authors have read and agreed to the published version of the manuscript.
Funding
This research received funding from the Petit Canal Botanical Park.
Data Availability Statement
The data supporting the results reported can be found in the Supplementary Materials.
Acknowledgments
We thank the Petit Canal Botanical Park and its director, Pierre Lombion, for financial support, and Daniel Imbert for his keen interest and sensible advice in the experimental phase. We are also grateful to Gilles Leblond (BIOS) and to Alain Rousteau for their help in developing research on the gaïacwood tree, as well as to Erika Lucien and Mukherji Sami for their technical assistance. We also thank Anya Cockle-Bétian for improving the English.
Conflicts of Interest
The authors declare no conflict of interest.
References
- Chazdon, R.L.; Brancalion, P.H.S.; Lamb, D.; Laestadius, L.; Calmon, M.; Kumar, C. A policy-driven knowledge agenda for global forest and landscape restoration. Conserv. Lett. 2017, 10, 125–132. [Google Scholar] [CrossRef]
- Hasnat, G.T.; Hossain, M.K. Global overview of tropical dry forests. In Handbook of Research on the Conservation and Restoration of Tropical Dry Forests; IGI Global: Hershey, PA, USA, 2020; pp. 1–23. [Google Scholar] [CrossRef]
- Dexter, K.G.; Smart, B.; Baldauf, C.; Baker, T.R.; Balinga, M.P.B.; Brienen, R.J.W.; Fauset, S.; Feldpausch, T.R.; Silva, L.F.-D.; Muledi, J.; et al. Floristics and biogeography of vegetation in seasonally dry tropical regions. Int. For. Rev. 2015, 17, 10–32. [Google Scholar] [CrossRef]
- Janzen, D.H. Tropical dry forests. In Biodiversity; National Academy of Sciences/Smithsonian Institution: Washington, DC, USA, 1988; Volume 15, pp. 130–137. [Google Scholar]
- Murphy, P.G.; Lugo, A.E. Ecology of tropical dry forest. Annu. Rev. Ecol. Syst. 1986, 17, 67–88. [Google Scholar] [CrossRef]
- Lamb, D.; Erskine, P.D.; Parrotta, J.A. Restoration of Degraded Tropical Forest Landscapes. Science 2005, 310, 1628–1632. [Google Scholar] [CrossRef] [Green Version]
- Meli, P.; Holl, K.D.; Rey Benayas, J.M.; Jones, H.P.; Jones, P.C.; Montoya, D.; Moreno Mateos, D. A Global Review of Past Land Use, Climate, and Active vs. Passive Restoration Effects on Forest Recovery. PLoS ONE 2017, 12, e0171368. [Google Scholar] [CrossRef] [Green Version]
- UICN. Liste Rouge de la Flore Vasculaire de Guadeloupe; UICN: Paris, France, 2019. [Google Scholar]
- Portillo-Quintero, C.A.; Sánchez-Azofeifa, G.A. Extent and Conservation of Tropical Dry Forests in the Americas. Biol. Conserv. 2010, 143, 144–155. [Google Scholar] [CrossRef]
- Kobayashi, Y.; Okada, K.; Mori, A.S. Reconsidering Biodiversity Hotspots Based on the Rate of Historical Land-Use Change. Biol. Conserv. 2019, 233, 268–275. [Google Scholar] [CrossRef]
- Banda, K.; Delgado, A.; Dexter, K.; Linares, R.; Oliveira, A.; Prado, D.; Pullan, M.; Quintana, C.; Riina, R.; Rodríguez, M.G.M.; et al. Plant diversity patterns in neotropical dry forests and their conservation implications. Science 2016, 353, 1383–1387. [Google Scholar]
- Giorgi, F. Climate Change Hot-Spots. Geophys. Res. Lett. 2006, 33, 101029. [Google Scholar] [CrossRef]
- Allen, K.; Dupuy, J.M.; Gei, M.G.; Hulshof, C.; Medvigy, D.; Pizano, C.; Salgado-Negret, B.; Smith, C.M.; Trierweiler, A.; Van Bloem, S.J.; et al. Will Seasonally Dry Tropical Forests Be Sensitive or Resistant to Future Changes in Rainfall Regimes? Environ. Res. Lett. 2017, 12, 023001. [Google Scholar] [CrossRef] [Green Version]
- Vichot-Llano, A.; Martinez-Castro, D.; Bezanilla-Morlot, A.; Centella-Artola, A.; Giorgi, F. Projected Changes in Precipitation and Temperature Regimes and Extremes over the Caribbean and Central America Using a Multiparameter Ensemble of RegCM4. Int. J. Climatol. 2020, 41, 1328–1350. [Google Scholar] [CrossRef]
- Choat, B.; Jansen, S.; Brodribb, T.J.; Cochard, H.; Delzon, S.; Bhaskar, R.; Bucci, S.J.; Feild, T.S.; Gleason, S.M.; Hacke, U.G.; et al. Global Convergence in the Vulnerability of Forests to Drought. Nature 2012, 491, 752–755. [Google Scholar] [CrossRef] [Green Version]
- González-M, R.; Posada, J.M.; Carmona, C.P.; Garzón, F.; Salinas, V.; Idárraga-Piedrahita, Á.; Pizano, C.; Avella, A.; López-Camacho, R.; Norden, N.; et al. Diverging Functional Strategies but High Sensitivity to an Extreme Drought in Tropical Dry Forests. Ecol. Lett. 2020, 24, 451–463. [Google Scholar] [CrossRef] [PubMed]
- Poorter, L.; Rozendaal, D.M.A.; Bongers, F.; de Almeida-Cortez, J.S.; Almeyda Zambrano, A.M.; Álvarez, F.S.; Andrade, J.L.; Villa, L.F.A.; Balvanera, P.; Becknell, J.M.; et al. Wet and Dry Tropical Forests Show Opposite Successional Pathways in Wood Density but Converge over Time. Nat. Ecol. Evol. 2019, 3, 928–934. [Google Scholar] [CrossRef]
- Méndez-Alonzo, R.; Paz, H.; Zuluaga, R.C.; Rosell, J.A.; Olson, M.E. Coordinated Evolution of Leaf and Stem Economics in Tropical Dry Forest Trees. Ecology 2012, 93, 2397–2406. [Google Scholar] [CrossRef] [Green Version]
- Hulshof, C.; Martinez-Yrizar, A.; Burquez, A.; Boyle, B. Plant Functional Trait Variation in Tropical Dry Forests: A Review and Synthesis. In Tropical Dry Forests in the Americas; Sanchez-Azofeifa, A., Powers, J.S., Fernandes, G.W., Quesada, M., Eds.; CRC Press: Boca Raton, USA, 2013. [Google Scholar] [CrossRef]
- Khurana, E.K.T.A.; Singh, J.S. Ecology of seed and seedling growth for conservation and restoration of tropical dry forest: A review. Environ. Conserv. 2001, 28, 39–52. [Google Scholar] [CrossRef] [Green Version]
- Poorter, L.; Markesteijn, L. Seedling Traits Determine Drought Tolerance of Tropical Tree Species. Biotropica 2008, 40, 321–331. [Google Scholar] [CrossRef]
- Rojas, A.; Moreno, L.; Melgarejo, L.M.; Rodríguez, M.A. Physiological response of gmelina (Gmelina arborea Roxb.) to hydric conditions of the colombian Caribbean. Agron. Colomb. 2012, 30, 52–58. [Google Scholar]
- Mediavilla, S.; Escudero, A. Stomatal responses to drought of mature trees and seedlings of two co-occurring Mediterranean oaks. For. Ecol. Manag. 2004, 187, 281–294. [Google Scholar] [CrossRef]
- Poorter, L.; Hayashida-Oliver, Y. Effects of Seasonal Drought on Gap and Understorey Seedlings in a Bolivian Moist Forest. J. Trop. Ecol. 2000, 16, 481–498. [Google Scholar] [CrossRef] [Green Version]
- Tyree, M.T.; Engelbrecht, B.M.J.; Vargas, G.; Kursar, T.A. Desiccation Tolerance of Five Tropical Seedlings in Panama. Relationship to a Field Assessment of Drought Performance. Plant Physiol. 2003, 132, 1439–1447. [Google Scholar] [CrossRef] [PubMed] [Green Version]
- Gerhardt, K. Tree seedling development in tropical dry abandoned pasture and secondary forest in Costa Rica. J. Veg. Sci. 1993, 4, 95–102. [Google Scholar] [CrossRef]
- Bartlett, M.K.; Zhang, Y.; Yang, J.; Kreidler, N.; Sun, S.-W.; Lin, L.; Hu, Y.-H.; Cao, K.-F.; Sack, L. Drought Tolerance as a Driver of Tropical Forest Assembly: Resolving Spatial Signatures for Multiple Processes. Ecology 2016, 97, 503–514. [Google Scholar] [CrossRef] [PubMed] [Green Version]
- Green, P.T.; Harms, K.E.; Connell, J.H. Nonrandom, Diversifying Processes Are Disproportionately Strong in the Smallest Size Classes of a Tropical Forest. Proc. Natl. Acad. Sci. USA 2014, 111, 18649–18654. [Google Scholar] [CrossRef] [PubMed] [Green Version]
- Akram, M.A.; Zhang, Y.; Wang, X.; Shrestha, N.; Malik, K.; Khan, I.; Ma, W.; Sun, Y.; Li, F.; Ran, J.; et al. Phylogenetic independence in the variations in leaf functional traits among different plant life forms in an arid environment. J. Plant Physiol. 2022, 272, 153671. [Google Scholar] [CrossRef]
- Sobrado, M.A. Cost-Benefit Relationships in Deciduous and Evergreen Leaves of Tropical Dry Forest Species. Funct. Ecol. 1991, 5, 608. [Google Scholar] [CrossRef]
- Eamus, D. Ecophysiological Traits of Deciduous and Evergreen Woody Species in the Seasonally Dry Tropics. Trends Ecol. Evol. 1999, 14, 11–16. [Google Scholar] [CrossRef] [Green Version]
- Gorné, L.D.; Díaz, S.; Minden, V.; Onoda, Y.; Kramer, K.; Muir, C.; Michaletz, S.T.; Lavorel, S.; Sharpe, J.; Jansen, S.; et al. The Acquisitive–Conservative Axis of Leaf Trait Variation Emerges Even in Homogeneous Environments. Ann. Bot. 2020, 129, 709–722. [Google Scholar] [CrossRef]
- Kitajima, K.; Myers, J.A. Seedling ecophysiology: Strategies toward achievement of positive net carbon balance. In Seedling Ecology and Evolution; Allessio Leck, M., Parker, T.V., Simpson, R.L., Eds.; Cambridge University Press: Cambridge, UK, 2008; pp. 172–188. [Google Scholar]
- Turner, I.M. The Ecology of Trees in the Tropical Rain Forest; Cambridge University Press: Cambridge, UK, 2001. [Google Scholar]
- Ribeiro, D.R.; Silva, J.L.A.; do Nascimento, M.T.; Vitória, A.P. Leaf Habits and Their Relationship with Leaf and Wood Traits in Tropical Dry Forests. Trees 2021, 36, 7–24. [Google Scholar] [CrossRef]
- Garkoti, S.C.; Zobel, D.B.; Singh, S.P. Variation in drought response of sal (Shorea robusta) seedlings. Tree Physiol. 2003, 23, 1021–1030. [Google Scholar] [CrossRef] [Green Version]
- Chaturvedi, R.K.; Tripathi, A.; Raghubanshi, A.S.; Singh, J.S. Functional Traits Indicate a Continuum of Tree Drought Strategies across a Soil Water Availability Gradient in a Tropical Dry Forest. For. Ecol. Manag. 2021, 482, 118740. [Google Scholar] [CrossRef]
- Tyree, M.T.; Sperry, J.S. Vulnerability of xylem to cavitation and embolism. Annu. Rev. Plant Phys. Mol. Bio. 1989, 40, 19–38. [Google Scholar] [CrossRef]
- Bartlett, M.K.; Scoffoni, C.; Sack, L. The Determinants of Leaf Turgor Loss Point and Prediction of Drought Tolerance of Species and Biomes: A Global Meta-Analysis. Ecol. Lett. 2012, 15, 393–405. [Google Scholar] [CrossRef]
- Anderegg, W.R.L.; Klein, T.; Bartlett, M.; Sack, L.; Pellegrini, A.F.A.; Choat, B.; Jansen, S. Meta-Analysis Reveals That Hydraulic Traits Explain Cross-Species Patterns of Drought-Induced Tree Mortality across the Globe. Proc. Natl. Acad. Sci. USA 2016, 113, 5024–5029. [Google Scholar] [CrossRef] [Green Version]
- Cochard, H.; Badel, E.; Herbette, S.; Delzon, S.; Choat, B.; Jansen, S. Methods for Measuring Plant Vulnerability to Cavitation: A Critical Review. J. Exp. Bot. 2013, 64, 4779–4791. [Google Scholar] [CrossRef] [PubMed] [Green Version]
- Maréchaux, I.; Bartlett, M.K.; Sack, L.; Baraloto, C.; Engel, J.; Joetzjer, E.; Chave, J. Drought Tolerance as Predicted by Leaf Water Potential at Turgor Loss Point Varies Strongly across Species within an Amazonian Forest. Funct. Ecol. 2015, 29, 1268–1277. [Google Scholar] [CrossRef]
- Guillemot, J.; Martin-StPaul, N.K.; Bulascoschi, L.; Poorter, L.; Morin, X.; Pinho, B.X.; Maire, G.; Bittencourt, P.; Oliveira, R.S.; Bongers, F.; et al. Small and Slow Is Safe: On the Drought Tolerance of Tropical Tree Species. Glob. Chang. Biol. 2022, 28, 2622–2638. [Google Scholar] [CrossRef]
- Brodribb, T.J.; McAdam, S.A.M. Evolution of the Stomatal Regulation of Plant Water Content. Plant Physiol. 2017, 174, 639–649. [Google Scholar] [CrossRef] [Green Version]
- Sperry, J.S.; Venturas, M.D.; Anderegg, W.R.L.; Mencuccini, M.; Mackay, D.S.; Wang, Y.; Love, D.M. Predicting Stomatal Responses to the Environment from the Optimization of Photosynthetic Gain and Hydraulic Cost. Plant Cell Environ. 2016, 40, 816–830. [Google Scholar] [CrossRef]
- Eller, C.; Barros, F.d.V.; Rowland, L.; Bittencourt, P.; Rowland, L.; Mencuccini, M.; Oliveira, R.S. Xylem Hydraulic Safety and Construction Costs Determine Tropical Tree Growth. Plant Cell Environ. 2018, 41, 548–562. [Google Scholar] [CrossRef]
- Oliveira, R.S.; Eller, C.B.; Barros, F.d.V.; Hirota, M.; Brum, M.; Bittencourt, P. Linking Plant Hydraulics and the Fast–Slow Continuum to Understand Resilience to Drought in Tropical Ecosystems. New Phytol. 2021, 230, 904–923. [Google Scholar] [CrossRef] [PubMed]
- Pineda-García, F.; Paz, H.; Meinzer, F.C. Drought Resistance in Early and Late Secondary Successional Species from a Tropical Dry Forest: The Interplay between Xylem Resistance to Embolism, Sapwood Water Storage and Leaf Shedding. Plant Cell Environ. 2012, 36, 405–418. [Google Scholar] [CrossRef] [PubMed]
- Markesteijn, L.; Poorter, L.; Paz, H.; Sack, L.; Bongers, F. Ecological Differentiation in Xylem Cavitation Resistance Is Associated with Stem and Leaf Structural Traits. Plant Cell Environ. 2010, 34, 137–148. [Google Scholar] [CrossRef] [PubMed]
- Rollet, B. Description des espèces. In Arbres des Petites Antilles Tome 2; O.N.F.: Paris, France, 2010. [Google Scholar]
- Mira, E.; Rousteau, A.; Tournebize, R.; Robert, M.; Evette, A. Evaluating the Suitability of Neotropical Trees and Shrubs for Soil and Water Bioengineering: Survival and Growth of Cuttings from Ten Caribbean Species. Ecol. Eng. 2022, 185, 106808. [Google Scholar] [CrossRef]
- Hunt, R. Plant Growth Curves. The Functional Approach to Plant Growth Analysis; Edward Arnold Ltd.: London, UK, 1982. [Google Scholar]
- de Lobo, F.A.; de Barros, M.P.; Dalmagro, H.J.; Dalmolin, Â.C.; Pereira, W.E.; de Souza, É.C.; Vourlitis, G.L.; Ortíz, C.E. Fitting Net Photosynthetic Light-Response Curves with Microsoft Excel—A Critical Look at the Models. Photosynthetica 2013, 51, 445–456. [Google Scholar] [CrossRef]
- Simpson, W.T. Specific Gravity, Moisture Content, and Density Relationship for Wood; General Technical Report FPL-GTR-76; United States Department of Agriculture: Washington, DC, USA, 1993.
- Pérez-Harguindeguy, N.; Díaz, S.; Garnier, E.; Lavorel, S.; Poorter, H.; Jaureguiberry, P.; Bret-Harte, M.S.; Cornwell, W.K.; Craine, J.M.; Gurvich, D.E.; et al. Corrigendum to: New Handbook for Standardised Measurement of Plant Functional Traits Worldwide. Aust. J. Bot. 2016, 64, 715. [Google Scholar] [CrossRef] [Green Version]
- Mayr, S.; Cochard, H. A new method for vulnerability analysis of small xylem areas reveals that compression wood of Norway spruce has lower hydraulic safety than opposite wood. Plant Cell Environ. 2003, 26, 1365–1371. [Google Scholar] [CrossRef] [Green Version]
- Schulte, P.J.; Hinckley, T.M. A Comparison of Pressure-Volume Curve Data Analysis Techniques. J. Exp. Bot. 1985, 36, 1590–1602. [Google Scholar] [CrossRef]
- Sperry, J.S.; Donnelly, J.R.; Tyree, M.T. A Method for Measuring Hydraulic Conductivity and Embolism in Xylem. Plant Cell Environ. 1988, 11, 35–40. [Google Scholar] [CrossRef]
- Pammenter, N.W.; Van der Willigen, C.A. Mathematical and Statistical Analysis of the Curves Illustrating Vulnerability of Xylem to Cavitation. Tree Physiol. 1998, 18, 589–593. [Google Scholar] [CrossRef] [Green Version]
- Peters, J.M.R.; López, R.; Nolf, M.; Hutley, L.B.; Wardlaw, T.; Cernusak, L.A.; Choat, B. Living on the Edge: A Continental-scale Assessment of Forest Vulnerability to Drought. Glob. Chang. Biol. 2021, 27, 3620–3641. [Google Scholar] [CrossRef] [PubMed]
- Martin-StPaul, N.; Delzon, S.; Cochard, H. Plant Resistance to Drought Depends on Timely Stomatal Closure. Ecol. Lett. 2017, 20, 1437–1447. [Google Scholar] [CrossRef] [PubMed]
- Brodribb, T.J.; Holbrook, N.M. Stomatal Closure during Leaf Dehydration, Correlation with Other Leaf Physiological Traits. Plant Physiol. 2003, 132, 2166–2173. [Google Scholar] [CrossRef] [Green Version]
- Vargas, G.G.; Brodribb, T.J.; Dupuy, J.M.; González-M, R.; Hulshof, C.M.; Medvigy, D.; Allerton, T.A.P.; Pizano, C.; Salgado-Negret, B.; Schwartz, N.B.; et al. Beyond Leaf Habit: Generalities in Plant Function across 97 Tropical Dry Forest Tree Species. New Phytol. 2021, 232, 148–161. [Google Scholar] [CrossRef]
- Bucci, S.J.; Scholz, F.G.; Goldstein, G.; Meinzer, F.C.; Hinojosa, J.A.; Hoffmann, W.A.; Franco, A.C. Processes preventing nocturnal equilibration between leaf and soil water potential in tropical savanna woody species. Tree Physiol. 2004, 24, 1119–1127. [Google Scholar] [CrossRef] [PubMed]
- McDonald, E.P.; Erickson, J.E.; Kruger, E.L. Research Note: Can Decreased Transpiration Limit Plant Nitrogen Acquisition in Elevated CO2? Funct. Plant Biol. 2002, 29, 1115. [Google Scholar] [CrossRef]
- Gates, D.M. Transpiration and leaf temperature. Annu. Rev. Plant Physiol. 1968, 19, 211–238. [Google Scholar] [CrossRef] [Green Version]
- Clifford, S.C.; Arndt, S.K.; Corlett, J.E.; Joshi, S.; Sankhla, N.; Popp, M.; Jones, H.G. The Role of Solute Accumulation, Osmotic Adjustment and Changes in Cell Wall Elasticity in Drought Tolerance in Ziziphus Mauritiana (Lamk.). J. Exp. Bot. 1998, 49, 967–977. [Google Scholar] [CrossRef]
- Stratton, L.; Goldstein, G.; Meinzer, F.C. Stem Water Storage Capacity and Efficiency of Water Transport: Their Functional Significance in a Hawaiian Dry Forest. Plant Cell Environ. 2000, 23, 99–106. [Google Scholar] [CrossRef]
- Aasamaa, K.; Sõber, A.; Rahi, M. Leaf Anatomical Characteristics Associated with Shoot Hydraulic Conductance, Stomatal Conductance and Stomatal Sensitivity to Changes of Leaf Water Status in Temperate Deciduous Trees. Funct. Plant Biol. 2001, 28, 765. [Google Scholar] [CrossRef]
- Brum, M.; Vadeboncoeur, M.A.; Ivanov, V.; Asbjornsen, H.; Saleska, S.; Alves, L.F.; Penha, D.; Dias, J.D.; Aragão, L.E.O.C.; Barros, F.; et al. Hydrological Niche Segregation Defines Forest Structure and Drought Tolerance Strategies in a Seasonal Amazon Forest. J. Ecol. 2018, 107, 318–333. [Google Scholar] [CrossRef] [Green Version]
Figure 1.
Overview of traits related to carbon and water management. The number of replicates used is indicated in the circles (the number of individuals considered per species for each group of traits).
Figure 1.
Overview of traits related to carbon and water management. The number of replicates used is indicated in the circles (the number of individuals considered per species for each group of traits).

Figure 2.
Five-month-old seedlings of C. spinosum (a), G. officinale (b) and G. fragrans (c). C. spinosum was the fastest-growing species and G. officinale the slowest-growing.
Figure 2.
Five-month-old seedlings of C. spinosum (a), G. officinale (b) and G. fragrans (c). C. spinosum was the fastest-growing species and G. officinale the slowest-growing.

Figure 3.
Growth, carbon allocation and traits of carbon acquisition in seedlings of C. spinosum, G. officinale and G. fragrans. For each trait, significant differences between species are indicated (* p < 0.05, ** p < 0.01, *** p < 0.001, ns: non significant). See Table 1 for acronyms.
Figure 3.
Growth, carbon allocation and traits of carbon acquisition in seedlings of C. spinosum, G. officinale and G. fragrans. For each trait, significant differences between species are indicated (* p < 0.05, ** p < 0.01, *** p < 0.001, ns: non significant). See Table 1 for acronyms.

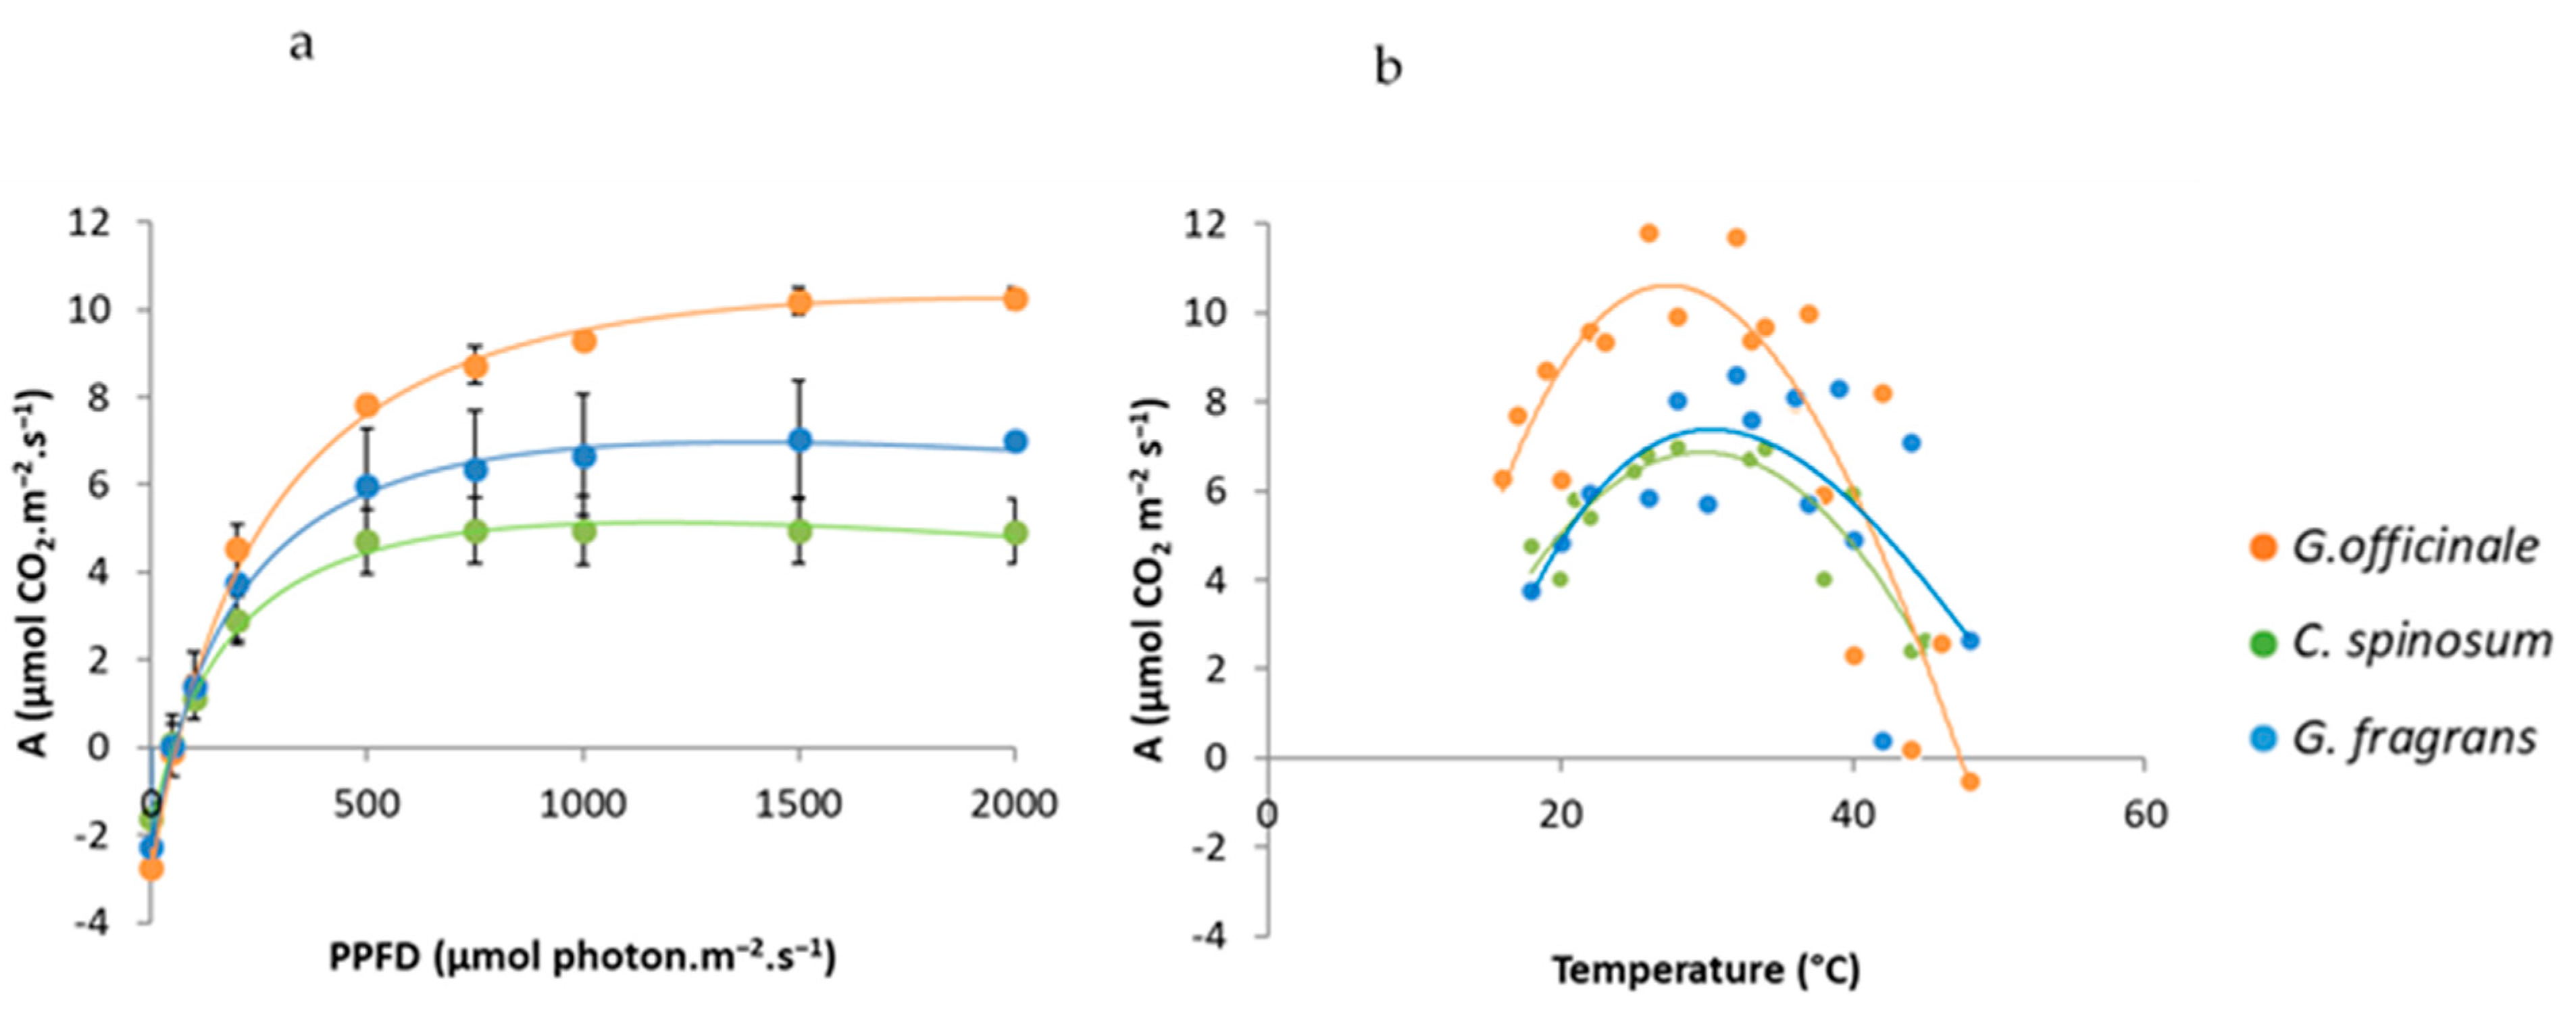
Figure 4.
Photosynthetic response curves to light (a) and temperature (b); n = 4 for each curve; bars represent SE.
Figure 4.
Photosynthetic response curves to light (a) and temperature (b); n = 4 for each curve; bars represent SE.

Figure 5.
Relationships between relative growth rate (RGR) and leaf initiation rate (LIR), leaf area (LA) and leaf mass fraction (LMF) in seedlings of the three species studied (four individuals per species). See Supplementary Materials Table S2 for Pearson correlation matrix of traits.
Figure 5.
Relationships between relative growth rate (RGR) and leaf initiation rate (LIR), leaf area (LA) and leaf mass fraction (LMF) in seedlings of the three species studied (four individuals per species). See Supplementary Materials Table S2 for Pearson correlation matrix of traits.

Figure 6.
Imprints of the abaxial side of leaves of C. spinosum (a), G. officinale (b) and G. fragrans (c) showing density and size of stomata. Wood cross section after phloxine treatment showing the fraction of functional xylem vessels coloured in red; C. spinosum is the only species to possess trichomes (arrow). G. officinale had the smallest stomata, the highest stomatal density and the greatest stem cross section devoted to water transport.

Figure 7.
Plant traits with respect to water relations: wood and stomatal traits, pressure–volume parameters (πo: osmotic potential at full turgor, ΨTLP: water potential at turgor loss point and ε: elasticity modulus) and hydraulic traits (P50 and mean HSM). For each trait, significant differences between species are indicated (** p < 0.01, *** p < 0.001 ns: non significant). See Table 1 for acronyms.

Figure 8.
Diurnal, nocturnal and total transpiration rates per unit of leaf area in the three species. Bars represent the standard error. The superscript letters designate species with significantly different total transpiration rates according to the ANOVA and Tukey’s test (p < 0.05).
Figure 8.
Diurnal, nocturnal and total transpiration rates per unit of leaf area in the three species. Bars represent the standard error. The superscript letters designate species with significantly different total transpiration rates according to the ANOVA and Tukey’s test (p < 0.05).

Figure 9.
Relationships between relative growth rate (RGR) and four drought tolerance traits in seedlings of the three species studied (four individuals per species).
Figure 9.
Relationships between relative growth rate (RGR) and four drought tolerance traits in seedlings of the three species studied (four individuals per species).


Table 1.
Symbols and units for all traits concerning biomass, leaf gas exchange, leaf morphology and anatomy, wood traits, hydraulics and pressure–volume curve parameters.
Table 1.
Symbols and units for all traits concerning biomass, leaf gas exchange, leaf morphology and anatomy, wood traits, hydraulics and pressure–volume curve parameters.
| Abbreviation | Name | Unit |
|---|---|---|
| Atot | Total carbon assimilation rate at the scale of the whole plant | µmol s−1 |
| Asat | Light-saturated rate of carbon assimilation | mmol m−2 s−1 |
| Ds | Stomatal density | n m−2 |
| gs | Stomatal conductance | mmol m−2 s−1 |
| Hv | Huber value (sapwood area/leaf area) | (×10−4) cm−2 cm−2 |
| HSM | Hydraulic safety margin | MPa |
| LA | Leaf area unit | cm2 |
| LIR | Leaf initiation rate | n day−1 |
| LMF | Leaf mass fraction (leaf mass/plant mass) | % |
| P50 | Pressure causing 50% loss of conductance | MPa |
| PLC | Percent loss of hydraulic conductivity | % |
| PPFD | Photosynthetic photon flux density | µmol (photon) m−2 s−1 |
| RGR | Relative growth rate | g g−1 wk−1 |
| RMF | Root mass fraction (root mass/plant mass) | % |
| s | Slope of the vulnerability curve | % MPa−1 |
| SLA | Specific leaf area (leaf area/leaf mass) | cm2 g−1 |
| SMF | Stem mass fraction (stem mass/plant mass) | % |
| SWC | Stem water content | % |
| SWD | Stem wood density | g cm−3 |
| ε | Bulk modulus of elasticity | MPa |
| πo | Osmotic potential at full turgor | MPa |
| Ψ | Leaf water potential | MPa |
| ΨTLP | Leaf water potential at the turgor loss point | MPa |
Disclaimer/Publisher’s Note: The statements, opinions and data contained in all publications are solely those of the individual author(s) and contributor(s) and not of MDPI and/or the editor(s). MDPI and/or the editor(s) disclaim responsibility for any injury to people or property resulting from any ideas, methods, instructions or products referred to in the content. |
© 2023 by the authors. Licensee MDPI, Basel, Switzerland. This article is an open access article distributed under the terms and conditions of the Creative Commons Attribution (CC BY) license (https://creativecommons.org/licenses/by/4.0/).
Share and Cite
MDPI and ACS Style
Mira, E.; Cochard, H.; Evette, A.; Dulormne, M. Growth, Xylem Vulnerability to Cavitation and Leaf Cell Response to Dehydration in Tree Seedlings of the Caribbean Dry Forest. Forests 2023, 14, 697. https://doi.org/10.3390/f14040697
AMA Style
Mira E, Cochard H, Evette A, Dulormne M. Growth, Xylem Vulnerability to Cavitation and Leaf Cell Response to Dehydration in Tree Seedlings of the Caribbean Dry Forest. Forests. 2023; 14(4):697. https://doi.org/10.3390/f14040697
Chicago/Turabian StyleMira, Eléonore, Hervé Cochard, André Evette, and Maguy Dulormne. 2023. "Growth, Xylem Vulnerability to Cavitation and Leaf Cell Response to Dehydration in Tree Seedlings of the Caribbean Dry Forest" Forests 14, no. 4: 697. https://doi.org/10.3390/f14040697
Note that from the first issue of 2016, this journal uses article numbers instead of page numbers. See further details here.