

PIP2;10 Enhances Drought Tolerance via Promoting Water-Retaining Capacity in Populus

State Key Laboratory of Tree Genetics and Breeding, Beijing Forestry University, Beijing 100083, China
*
Author to whom correspondence should be addressed.
†
These authors contributed equally to this work.
Forests 2023, 14(4), 696; https://doi.org/10.3390/f14040696
Submission received: 1 February 2023
/
Revised: 18 March 2023
/
Accepted: 27 March 2023
/
Published: 28 March 2023
(This article belongs to the Special Issue Abiotic Stress in Tree Species)
Abstract
:Drought is an adverse environmental factor for plant growth and development. Aquaporins play an influential role in water uptake and transport in plants. However, the function of PagPIP2;10 in response to drought stress remains largely unclear. Here, we report that the plasma membrane intrinsic protein PagPIP2;10 was in the cell membrane and induced by dehydration in the poplar 84K hybrids. The overexpression of PagPIP2;10 in poplars enhanced drought tolerance. The PagPIP2;10ox lines maintained a higher water retention content, photosynthetic rate, and proline content. Meanwhile, a lower content of MDA and transpiration and stomatal conductance were observed under drought stress than in that of the WT plants. A further analysis found that the PagPIP2;10ox lines decreased the stomatal aperture and accumulated more ROS in guard cells compared with WT after ABA treatment with the exception that the root hydraulic conductance of the PagPIP2;10ox lines was higher than that of the WT plants. These results imply that PagPIP2;10 played a positive role in enhancing drought stress via enhancing water-retaining capacity under drought stress.
1. Introduction
Drought is a major environmental factor limiting plant growth and reducing mortality in forests around the world. In response to adverse environments, plants have developed two strategies: shortening the life cycle and evolving drought tolerance mechanisms, which are of great significance for plants to resist drought stress [1,2].
The stomata distribute in the shoot epidermis, consist of two guard cells, and are the important channel for terrestrial plants to take part in restricting plant transpiration [3,4]. Under drought stress, guard cells sense and control stomatal movement, and a faster stomatal response increases intrinsic water use efficiency [5]. Their movement can be caused by many factors at different levels, including environmental (drought, salt, heat, and CO2 concentration), physiological (ROS, plant hormone, and Ca2+), and molecular levels [6]. Stomatal closure is an essential drought stress avoidance mechanism for plants in response to drought stress by limiting water loss. Abscisic acid and reactive oxygen species are considered to be key signaling molecules regulating stomatal movement in plants under drought conditions [4,5]. Under stress stimuli, the production of hydrogen peroxide (H2O2) in exosomes and its accumulation in guard cells are two of the key determinants of stomatal closure [4,6]. During drought, ABA delivery to guard cells promotes a cascade leading to stomatal closure and inhibition of stomatal opening, where ABA is received and bound to the PYR/PYL/RCAR (pyrabactin-resistance 1/pyrabactin resistance like/regulatory component of ABA receptor) [6]. The complex (ABA–PYR) interacts with negative regulator PP2Cs (protein phosphatases type-2C, e.g., ABI1), which functions in the ABA signal transduction pathway, activating the phosphorylation of downstream targets by Snf1-related protein kinase 2.6 (SnRK2.6) [6,7,8,9]. The activated targets are involved in the regulation of the movement of stomatal closure [6]. Among them, the activated targets include some membrane proteins, such as RbohF and RbohD [10], some anion exchange channels (e.g., GORK and SLAC) [11,12], and pump transporters (H+ATPase, e.g., aquaporins, AQPs) [13]. H2O2 produced by NADPH oxidases, such as RbohF and RbohD, accumulates in guard cells and activates the channel proteins, such as the Ca2+ channel, K+ channel, and aquaporins, resulting in K+ efflux and stomatal closure [14,15,16].
Aquaporins (AQPs) are indispensable transport proteins distributed across plant membrane systems and play an important role in regulating plant abiotic stress tolerance. AQPs are composed of five clades, namely small basic intrinsic proteins (SIPs), nodulin 26-like intrinsic proteins (NIPs), plasma membrane intrinsic proteins (PIPs), X intrinsic proteins (XIPs), and tonoplast intrinsic proteins (TIPs) [17]. Water movement inside and between tissues and organs in a plant mainly depends on the apoplastic and symplastic pathways. The apoplastic pathway is regulated by the change of water potential between the plant and the external environment [18]; the latter pathway is regulated by the AQP family, a set of conserved major intrinsic proteins (MIPs), that function as channel proteins [19,20,21,22]. In plants, AQPs facilitate the efficient transport of water molecules and small solutes between the membrane and the external environment in plants. For instance, AQPs are involved in the conduction of CO2 and water in the mesophyll, and silencing NtAQP1 reduces the chloroplast CO2 concentration, leading to a decrease in root hydraulic conductivity under drought stress [23,24]. OsNIP2;1 can conduct selenite, and a defect of OsNIP2;1 under selenite treatment leads to a significant decrease in Se content in shoot and xylem fluid [25]. AtNIP5;1 promotes boron influx into roots under low-boron environment [26]. BnaA3.NIP5;1 encodes a boronic acid channel, and overexpression lines show strong low boron tolerance [27]. Ectopic expression of TsTIP1;2 in Arabidopsis improves plant tolerance to drought, salt, and oxidative stress, and TsTIP1;2 was found in yeast cells and Xenopus oocytes to mediate the transmembrane conduction of H2O and H2O2 [28]. GmPIP2;9 overexpression lines significantly increase pod number and seed size, and both stomatal conductance and transpiration rate increase under drought conditions, suggesting that GmPIP2;9 enhances drought tolerance by enhancing water transport activity [29].
Populus is a dominant tree species for bioenergy, wood products, and environmental services, which are widespread all over the world [30]. However, most Populus are distributed in bare and dry lands of the northern hemisphere restricting the development of poplar forestry [31]. A total of 55 AQP family members were identified from Populus according to previous studies [32]. Some of them have been reported to be involved in stress responses, such as salt, drought, and wounding stress. For example, overexpression of PIP2;5 in poplars enhanced the tolerance of osmotic stress and low-temperature stress [33]. The overexpression of AQUA1 (PtTIP1;8) conferred Zn tolerance in yeast [34], whereas, the comprehensive function of poplar aquaporins and the function of each isoform remain poorly understood.
In this study, we isolated a PIP2 subfamily member PIP2;10 from poplar 84K hybrids (Populus alba × P. tremula var. glandulosa), which respond to dehydration stress. We generated the PagPIP2;10ox lines and analyzed the process in response to drought.
2. Materials and Methods
2.1. Plant Materials, Growth Conditions, and Treatments
The poplar 84K hybrids (P. alba × P. glandulosa), a commonly used material, were used in this study [35]. The 5 cm high seedlings were transplanted in seedling pots (10 cm × 10 cm × 10 cm) at the nursery garden of Beijing Forestry University, Haidian, Beijing, China (40°000 N, 116°200 E, 49 m above sea level). The seedlings were watered every three days for 50–60 days before treatment [36].
Determination of tissue expression: Tissues from two-month-old wild-type 84K poplars, including root, xylem, phloem, young leaves, mature leaves, and old leaves, were collected to examine the expression levels of PagPIP2;10 in different organs.
To analyze the dynamic response of PagPIP2:10 to drought, we treated the 84K poplars (both wild-type and overexpression lines) as follows:
PEG 6000 treatment: 2-month-old wild-type 84K poplars in similar conditions were preincubated for one week in Hoagland nutrient solution, greenhouse parameters: 22 °C, relative humidity 70%, and photoperiod 16/8; spectral energy distribution: red-orange light 44%–45%, yellow-green light 39%, and blue-violet light 16%. The experimental group was treated with 20% (m/V) polyethylene glycol (PEG) 6000 for 0, 1, 2, 4, 6, 8, 10, 12, and 24 h, and the control group was without PEG 6000.
Short-term drought treatment: Wild-type and overexpression 84K poplars of similar monthly growth were selected for short-term drought treatment. The poplars in pots were subjected to nine days of no watering to observe the phenotype and photographed and recorded. Initially, the relative soil water content (RWC) was 70%. During the drought, the experimental group was properly rewatered with an RWC of 35%, while the control group maintained an RWC of 70%.
ABA treatment: Two-month-old wild-type 84K poplars were selected, and the leaves were sprayed with 200 μM ABA (Sigma-Aldrich, St. Louis, MO, USA) until the liquid flowed off the leaves in bunches, sampled at 0, 0.5, 1, 2, 4, 6, 12, and 24 h. The control group was sprayed with distilled water.
The leaves of the poplars were collected, and three biological replicates were kept for each treatment time, immediately placed in liquid nitrogen, and stored at −80 °C for RT-qPCR analysis.
2.2. RNA Extraction and RT-qPCR Analysis
Total RNA was isolated from the control and dehydrated materials with EASY Plus Plant RNA Kit with DNase Ⅰ (Aidlab, Beijing, China). The NanoDrop 2000 spectrophotometer (Thermo Fisher Scientific, West Palm Beach, FL) and agarose gel electrophoresis were used to measure the quantity and quality of total RNA. About 2 µg RNA was carried out for reverse transcription using the FastQuant RT Kit (Tiangen Biotech, Beijing, China). 2−∆∆Ct was used to calculate relative gene expression in the study [37]. Primers were designed using Primer 5.0 (Sigma-Aldrich Corp., St. Louis, MO, USA), and the sequences are listed in Table S1. A 20 µL reaction systems were used for RT-qPCR, including 1 µL cDNA, 10 µL SYRB green RT-qPCR mix (Aidlab, Beijing, China), 0.5 µL each primer with a concentration of 10 μM, and 8 µL ddH2O. The RT-qPCR cycling parameters were 98 °C for 2 min, followed by 40 cycles of 98 °C for 10 s, 60 °C for 10 s, and 68 °C for 30 s. For the normalization of data, the poplar UBQ was used as an internal standard [36]. The experiment involved six biological replicates and four technical replicates.
2.3. Construction of the Evolutionary Tree, Sequence Analysis, and Subcellular Localization of PagPIP2;10 Proteins
The evolutionary tree of AQPs was constructed using the neighbor-joining (NJ) method of MEGA 7.0. Based on the AQPs identified in Arabidopsis thaliana, the AQPs in Populus trichocarpa were analyzed and identified by homologous sequence alignment, and the genes with value less than 10−3 in the comparison results were selected as candidates. The peptide sequences encoded by the AQP family were downloaded from the Phytozome Arabidopsis Sequence Database (http://phytozome-next.jgi.deo.gov/info/Athaliana_TAIR10) (accessed on 10 May 2021) and the Phytozome Poplar Sequence Database (http://phytozome-next.jgi.doe.gov/info/Ptrichocarpa_V3_1) (accessed on 10 May 2021). Using high-fidelity thermostable DNA polymerize Prime Star (Takara, R045A), the whole coding sequence (CDS) of PagPIP2;10 was amplified. DNAMAN V6 was used to perform the multiple sequence alignment for the proteins of PtrPIP2;10 and PagPIP2;10. The conserved domains were assessed using the conserved domain database (https://www.ncbi.nlm.nih.gov/cdd) (accessed on 11 May 2021). The physicochemical property of PagPIP2;10 was predicted using the ProtParam database (http://web.expasy.org/protparam/) (accessed on 12 May 2021). The transmembrane structure was analyzed using TMHMM server 2.0 (http://www.cbs.dtu.dk/services/TMHMM/) (accessed on 13 May 2021). The primer used was listed in Table S1.
PagPIP2;10 was put into plant binary expression vector 35S-GFP, which was rebuilt from pCAMBIA1300-GUS under the control of CaMV35S promoter to confirm the subcellular localization of PagPIP2;10. Transient transformation of the designed vector 35S: PagPIP2;10: GFP into tobacco leaves was performed [38]. The vector control used was 35S: GFP. After 48 h, the signal of GFP was detected using a confocal microscope (Leica TCS SP8; Leica, Wetzlar, Germany). The figure 488 nm (GFP) was the excitation wavelength.
2.4. Genetic Transformation of Poplar 84K
Before infecting poplar leaves, the recombinant vector 35S: PagPIP2;10-NOS was transformed into Agrobacterium tumefactions strain EHA105. The Agrobacterium-mediated transformation was performed as the previous method [36].
Total DNA was isolated using the CTAB technique [36], and materials were collected from the saplings selected using hygromycin B. The overexpression lines were verified at the DNA and RNA levels by PCR and RT-qPCR. For the normalization of data, the poplar UBQ was used as an internal standard [36]. The primers used are listed in Table S1.
2.5. Measurements of Photosynthesis Parameters
An infrared gas analysis system (Li-Cor, Lincoln, NE, USA) was used to measure the photosynthetic parameters during 0, 1, 3, 5, 7, and 9 days of water-deficient treatment. The wild-type and overexpression lines with the same growth state were moved to the greenhouse for two months, and the mature leaves at the same position were selected at 8–12 am to measure the net photosynthetic rate (Pn), transpiration rate (Tr), and stomatal conductance (Cond). The photosynthetically active radiation (PAR) intensity of the light response curve was set as 2000, 1800, 1500, 1200, 1000, 800, 600, 400, 200, 150, 100, and 50 μmol m−2 s−1, and the external CO2 concentration was 400 μmol mol−1. The external CO2 concentration of the CO2 response curve was 1800, 1500, 1200, 1000, 800, 600, 400, 200, 150, 100, and 50 μmol mol−1, and the PAR was set to 800 μmol m−2 s−1 [39]. Each treatment was performed with three biological replicates (n = 3), and values are means ± SE.
2.6. Measurement of Relative Water Content and Water Loss Rate
Two-month-old plants were dehydrated for nine days prior to being used in the relative water content (RWC) assay. To find RWC under drought stress, poplar leaves from WT and overexpression lines were sampled. The leaves were cut to determine the fresh weight (FW) and then submerged for 10 h in double-distilled water at room temperature in the dark, and the wet weight (WW) was recorded. Dry weight (DW) was measured after 48 h of drying at 80 °C. RWC was calculated as follows: RWC (%) = (FW − DW)/(WW − DW) × 100% [40]. Mature leaves from the same parts of two-month-old poplars were cut and weighed for recording (Wi), placed at room temperature, and the fresh weight loss (Wx) of leaves at different time points (0.5, 1, 1.5, 2, 3, 5, and 7 h) was recorded. Water loss rate calculation formula was WL (%) = Wx/Wi × 100%. Each treatment was performed with three biological replicates (n = 3), and values are means ± SE.
2.7. Measurement of Stomatal Aperture and ROS Accumulation in Guard Cells
Detection of stomatal apertures: the leaves were cut into small round pieces with 0.6 cm diameter and incubated in a stomata-opening solution containing 50 mM KCl, 50 mM CaCl2, and 10 mM MES/KOH (pH 6.1) for 2 h under light conditions. Then, 5 μM ABA was added, and the leaves were fixed with 2.5% glutaraldehyde after 0 h, 1 h, and 2 h [4,36]. Stomatal apertures were examined under a microscope, and their measurements were taken with Photoshop. A minimum of 30 stomata were computed and measured.
For ROS accumulation in the guard cell, H2DCF-DA (Sigma, D6883 HZB1212) was used for H2O2 detection [4,36]. Two-month-old seedlings (WT, PagPIP2;10ox lines) had their leaves submerged in 50 mM H2DCF-DA for 15 min while they were at room temperature and in the dark. The leaves were then treated with 5μM ABA and submerged in liquid 1/2 MS. The fluorescence signal was detected at a 488 nm excitation wavelength.
2.8. Measurement of Antioxidant Enzyme Activities
A total of 0.2 g of fresh leaf samples that were drought-treated for 9 days were ground in liquid nitrogen, extracted with phosphate buffer (pH 7.5), and centrifuged at 12,000 rpm for 20 min to obtain the supernatant. The absorbance at 560 nm was measured to calculate the superoxide dismutase (SOD) activity, as described by Beauchamp and Fridovich [41]. The activity of peroxidase (POD) was determined by measuring the change in absorbance at 470 nm using the method described by Hemeda and Klein [42]. The activity of catalase (CAT) was determined by measuring the reduction of H2O2 by the UV absorption method [43]. Each treatment was performed with three biological replicates (n = 3), and values are means ± SE.
2.9. Measurement of the Content of Proline, MDA, and Level of EL
Proline content was measured using the ninhydrin reaction method and detected at 515 nm [44]. Electrolyte leakage (EL) was measured as in the previous protocol [45]. After 9 days of water-deficit treatment, 9 leaf discs with 0.5 cm diameter were immersed in 10 mL deionized water for 8 h to determine the initial conductivity (Ci). The samples were then incubated for 30 min at 95 °C to destroy the leaf tissues and release all the electrolytes. The max conductivity (Cmax) was measured after the solution was cooled to room temperature. The EL was calculated using the equation EL (%) = (Ci/Cmax) × 100%. MDA was measured using the thiobarbituric acid (TBA)-reactive substances method [46]. Each treatment was performed with three biological replicates (n = 3), and values are means ± SE.
2.10. Measurement of Leaf Water Potential and Root Hydraulic Conductance
Determination of leaf water potential: two-month-old poplar seedlings were measured nondestructively in situ using the PSYPRO Water Potential System (Wescor) after 9 days of water-deficit treatment [39].
Determination of root hydraulic conductance (Lpr): two-month-old plants were grown hydroponically for one week. Three days before measurements, plants were subjected to osmotic stress by adding 15% (m/V) PEG 6000 to the growing medium. A high-pressure flow meter (HPFM) was used to determine the Lpr. Before the first measurement of root hydraulic conductance (Kr), the roots were placed in a container filled with nutrient solution or a solution supplemented with 15% (m/V) PEG 6000 for 30 min. Initially, 0.5 MPa of compressed N2 gas was applied to the pressure chamber, and then the pressure was gradually reduced by 0.02 MPa every 5 min until it reached 0.1 MPa. A smooth linear regression between supplied pressure and flow rate was obtained by applying decreasing pressure to the root. The slope was calculated as the Kr value. Determined root volumes using the water displacement method, divided Kr by root volume to calculate [47,48]. Each treatment was performed with three biological replicates (n = 3), and values are means ± SE.
2.11. Statistics
All data were statistically analyzed using Statistical Product and Service Solutions v. 17.0 (SPSS, Chicago, IL, USA). The Student’s t-test was used to generate p-values between the means for each individual. Differences at the 5% level were considered significant, and differences between groups are indicated with *.
3. Results
3.1. Characteristic of PagPIP2;10 in Poplar 84K
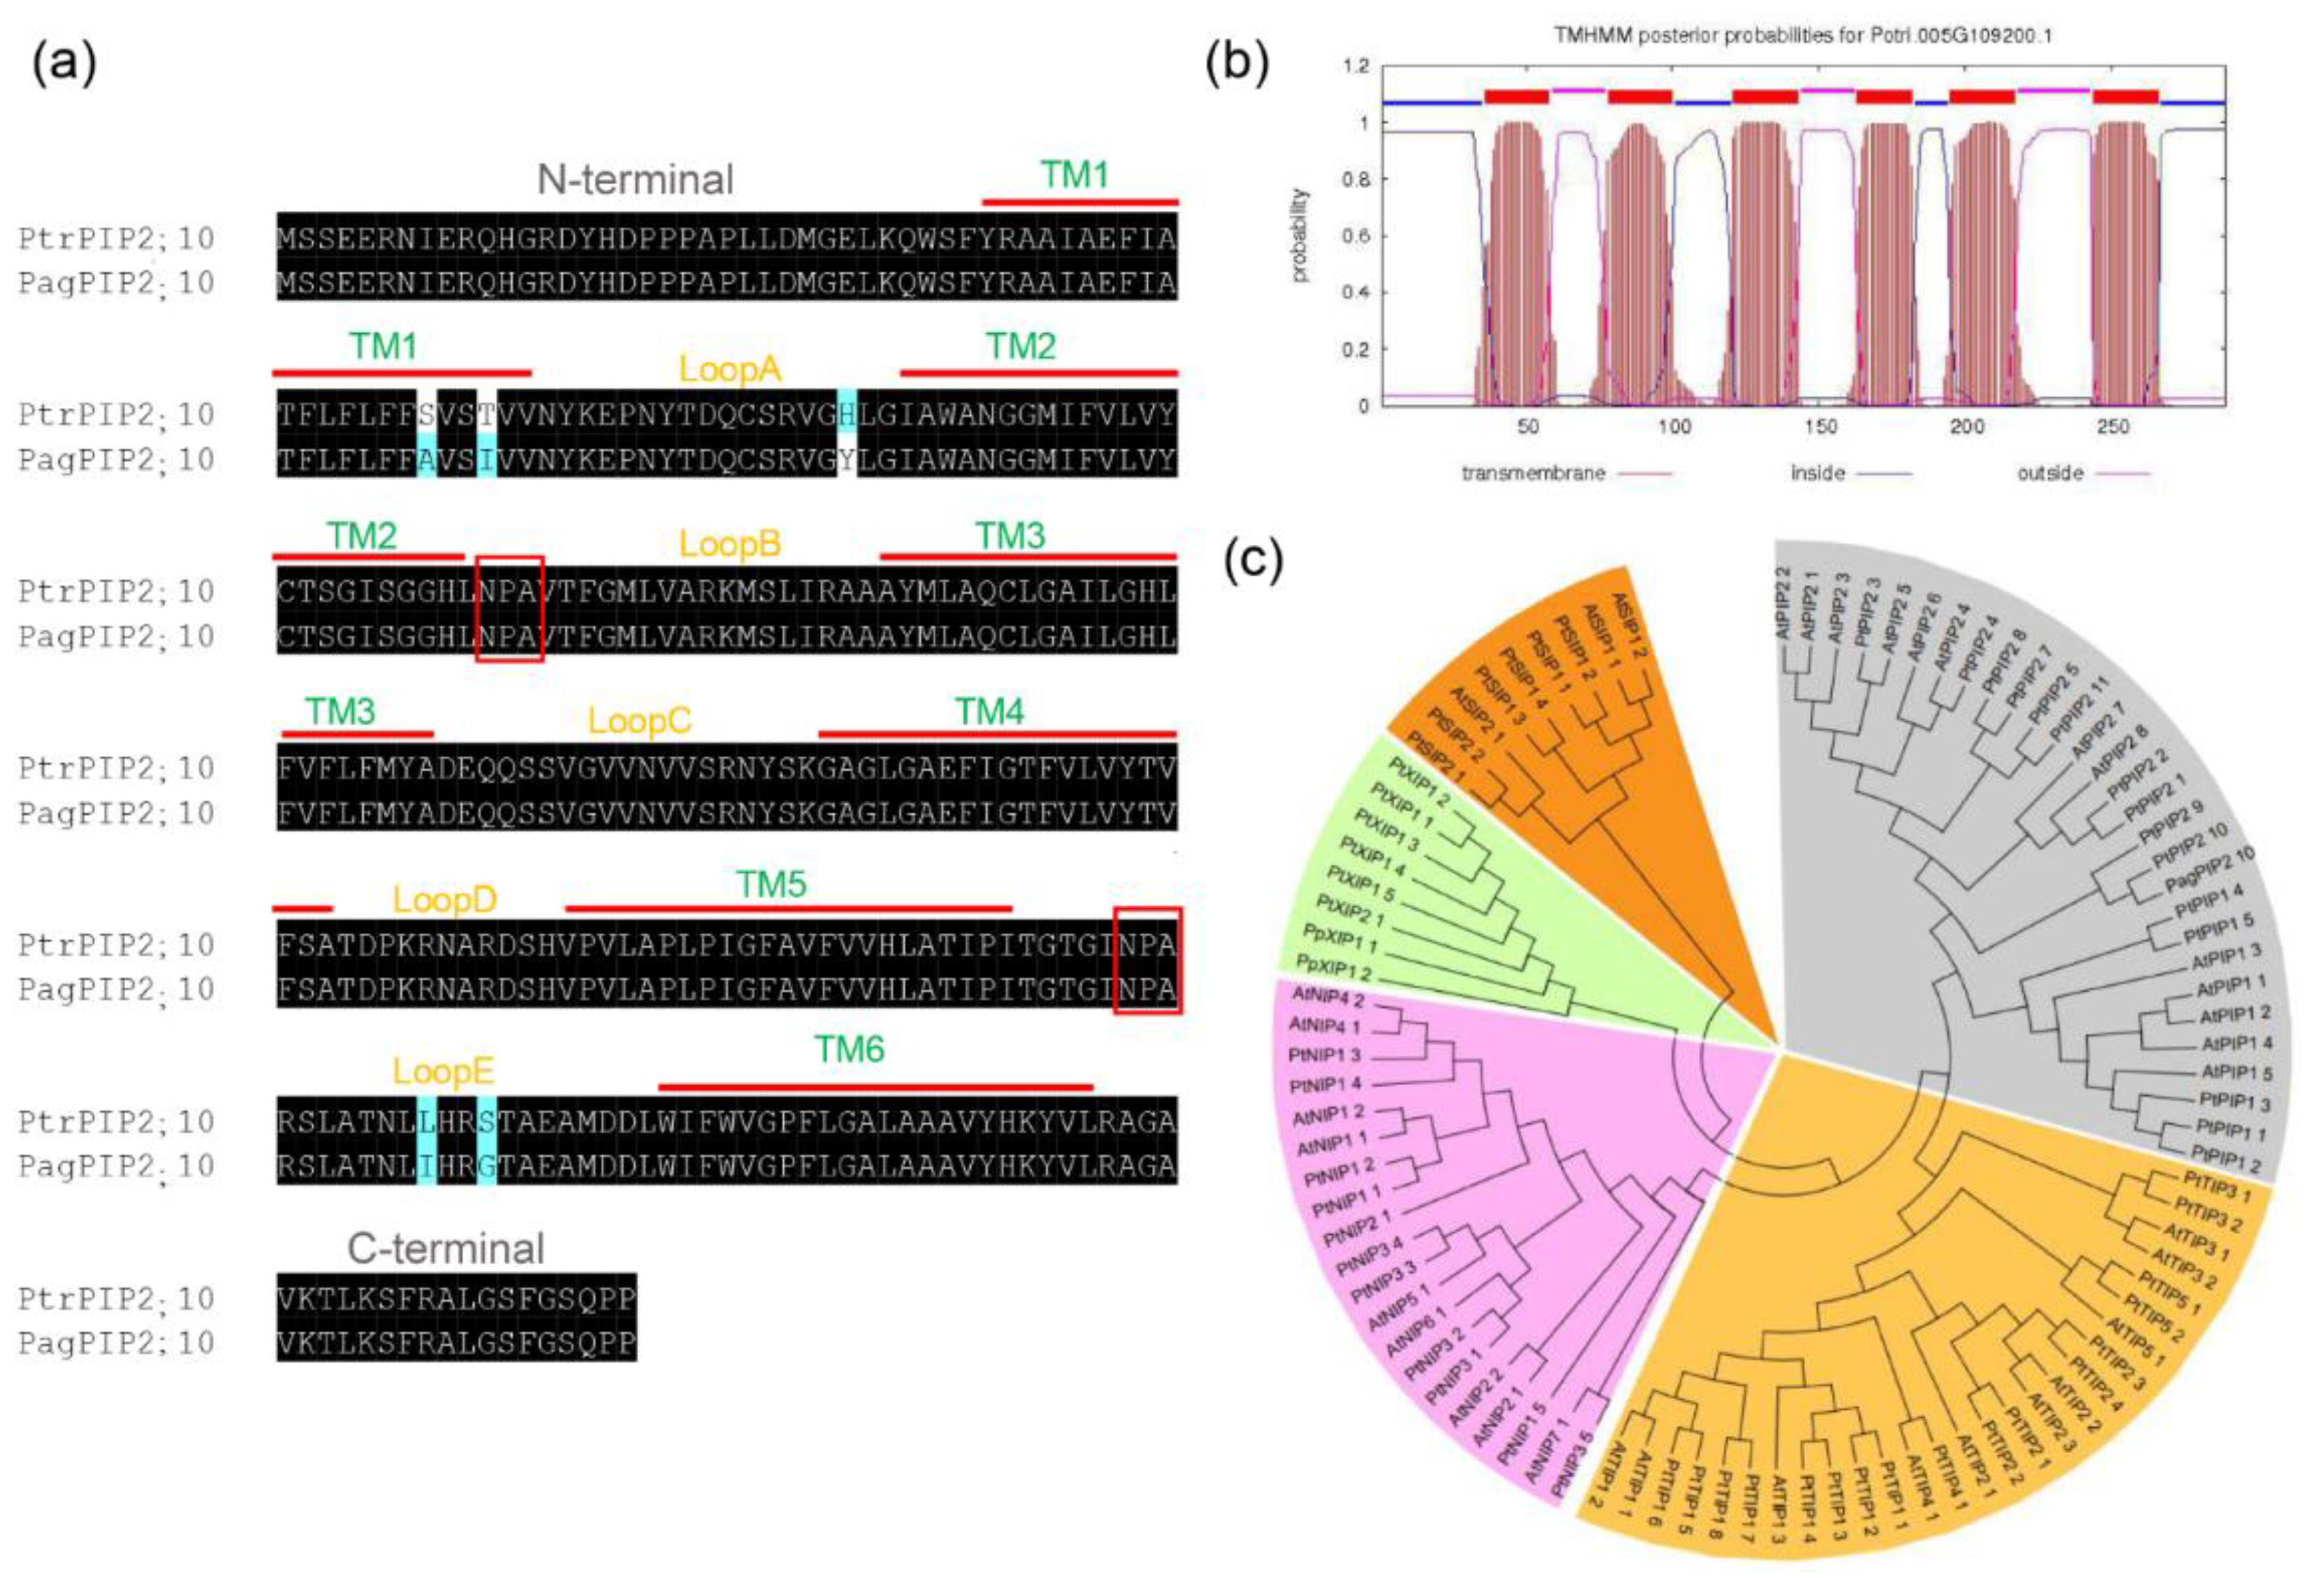
The AQP family members were found to respond positively to drought stress in previous studies, in which PIP2;10 in the PIP2 subfamily was shown to be upregulated in long-term drought stress (Figure S1) [49]. The complete coding sequence (CDS) of an aquaporin gene-coding plasma membrane intrinsic protein (PIP) was amplified from poplar 84K using primers designed according to the PtrPIP2;10. The amplified gene (PagPIP2;10) is composed of 867 base pairs and codes a 289 amino acid sequence. The sequence alignment result shows that the PagPIP2;10 shares 98.2% similarity with PtrPIP2;10 (Figure 1a).
The bioinformatics analysis revealed that the PagPIP2;10 is a 31.46 KDa hydrophobic protein and the isoelectric point is 8.94. PagPIP2;10 possesses six transmembrane helices with five loop (A–E) links to the helices. The two characterized NPA domains (Asparagine–Proline–Alanine) are contained in the conserved hydrophobic loops of B and E, which is the most important structure to maintain the function of PIPs (Figure 1a,b). To further analyze the protein homologous of PagPIP2;10, a phylogenetic tree was constructed for Arabidopsis thaliana, Populus trichocarpa, and poplar 84K PagPIP2;10. The figure shows that PagPIP2;10 is more similar to PtrPIP2;10 and belongs to the PIP2 subfamily members (Figure 1c). In brief, our results show that PagPIP2;10 is a member of PIP2 and is highly homologous with PtrPIP2;10.
3.2. Expression Pattern of PagPIP2;10 in Different Tissue and in Response to Osmotic Stress
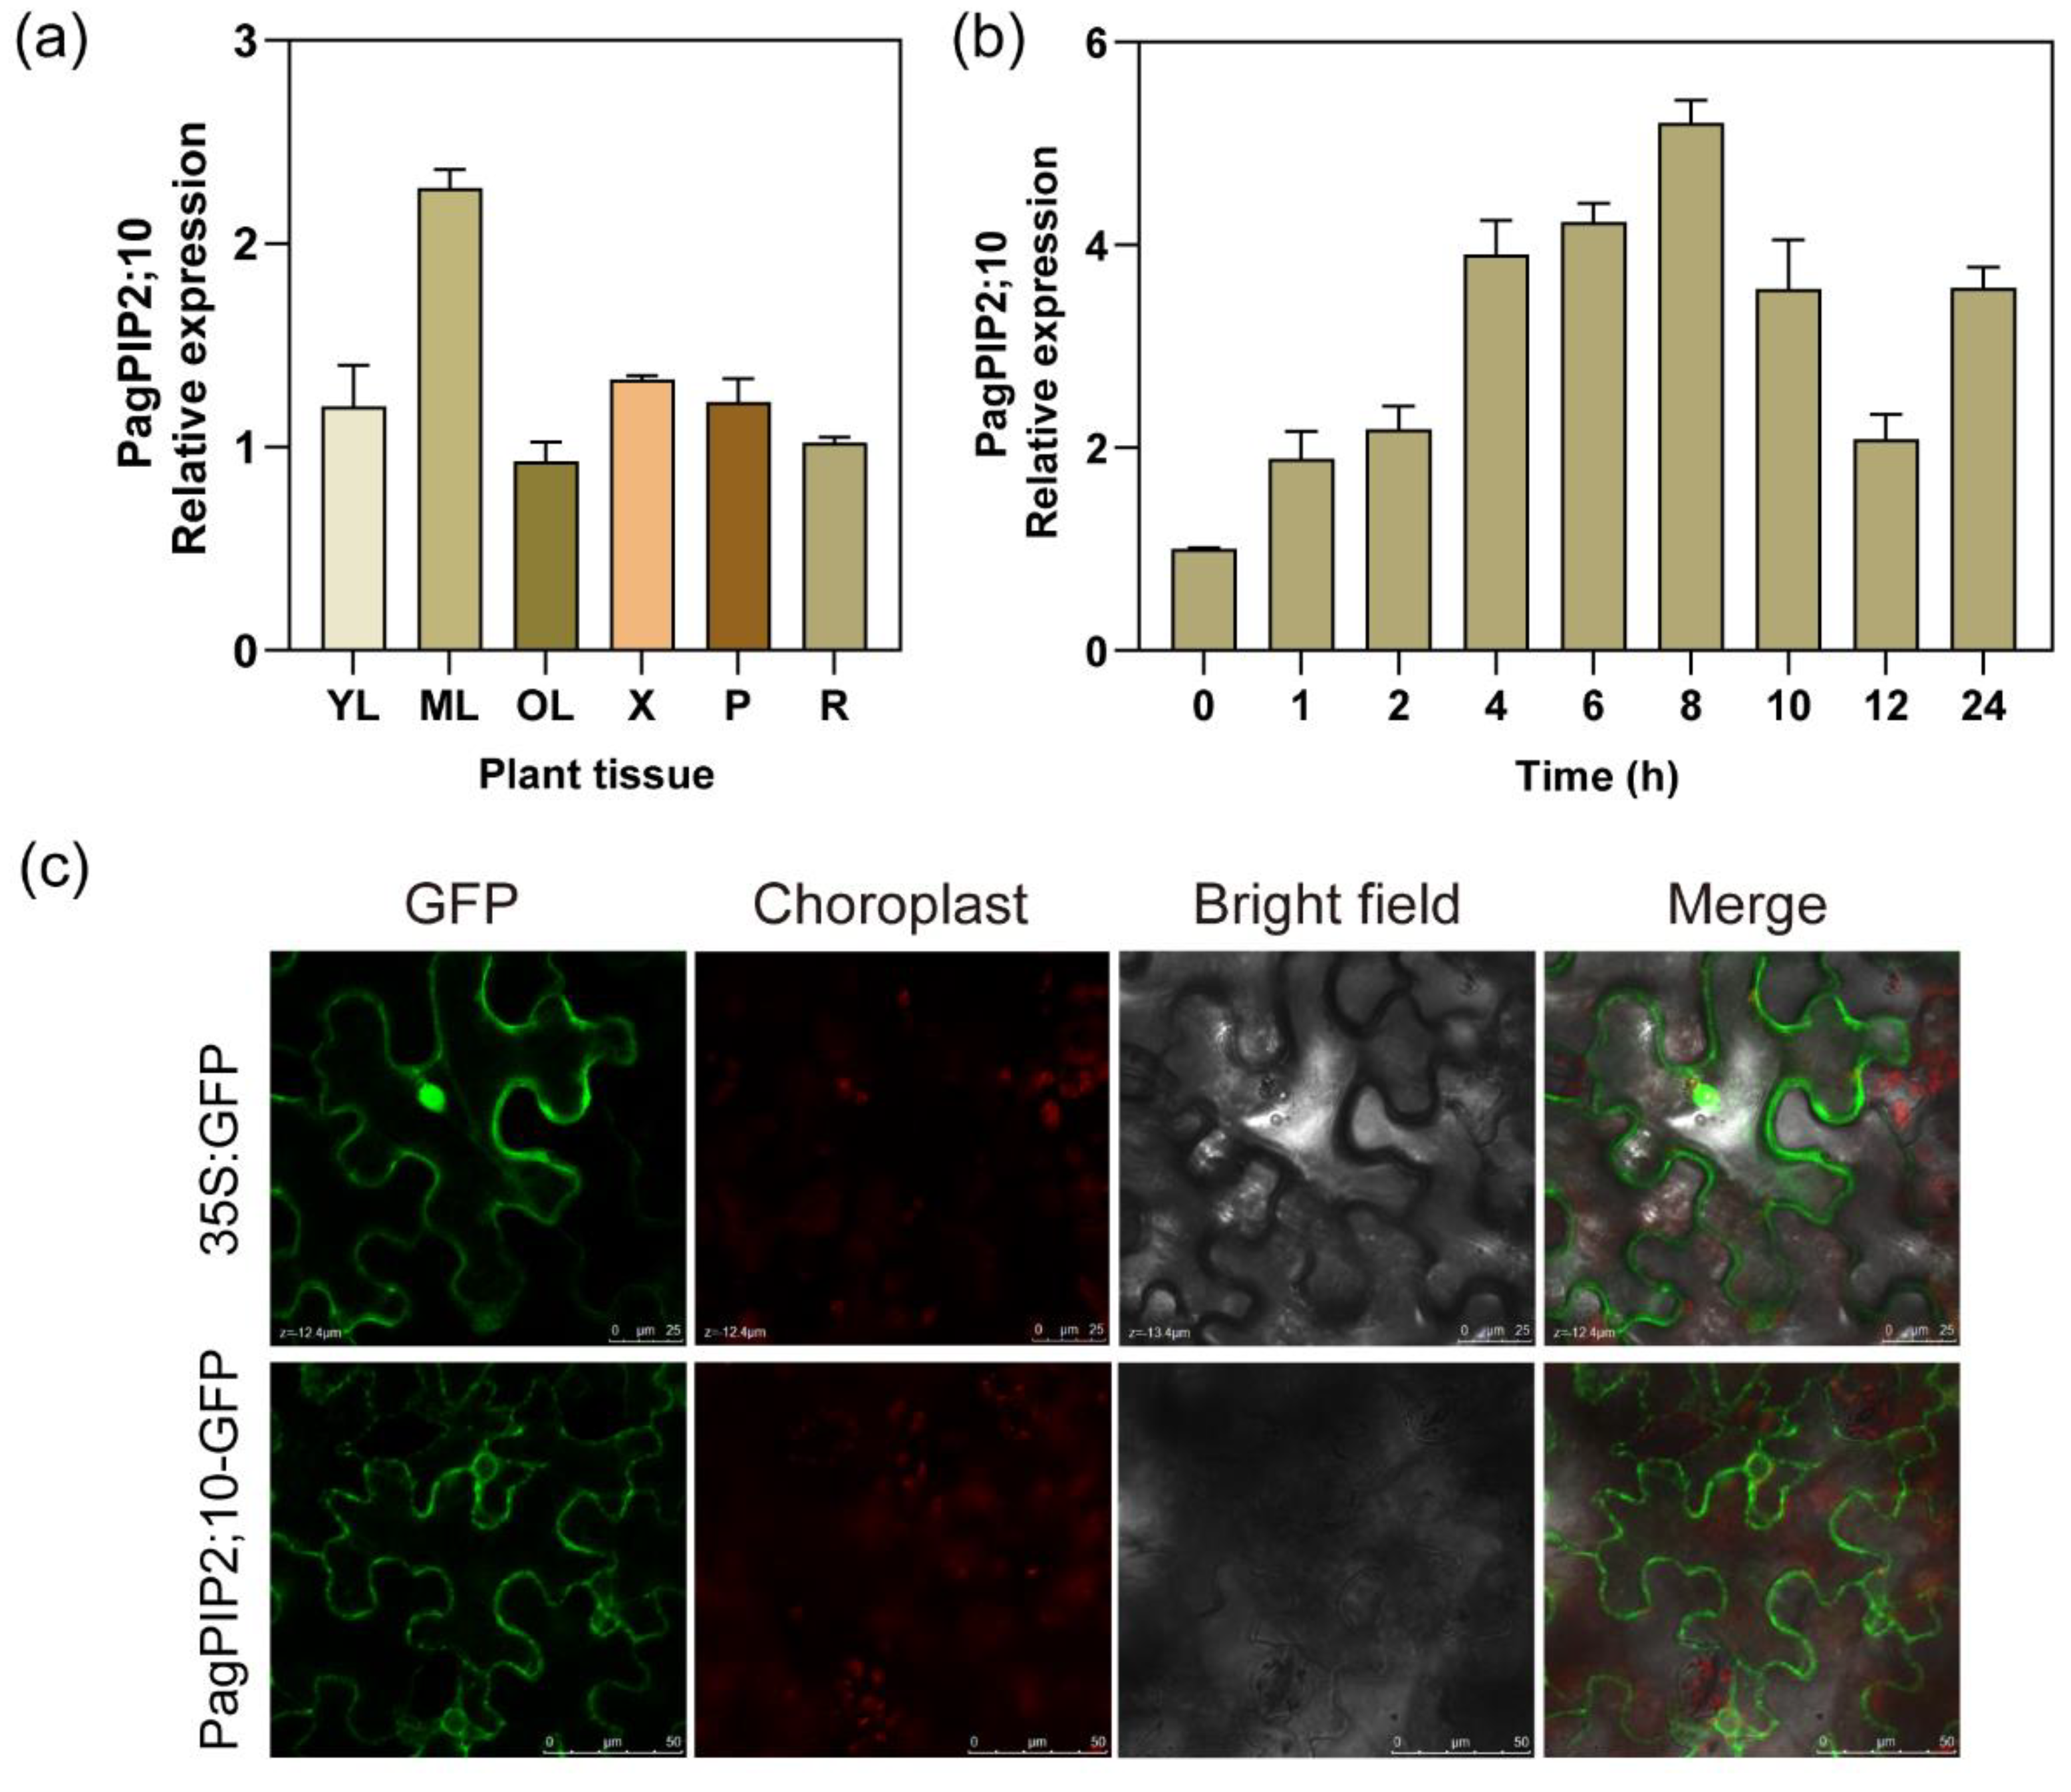
For analyzing the potential biology characteristics of PagPIP2;10, we estimated the relative expression level of it in the root, xylem, young leaves, mature leaves, and old leaves in poplar 84K. The results show that the transcription level of PagPIP2;10 is about two-fold in leaves than in other tissues. The results suggest that the PagPIP2;10 expresses primarily in leaves (Figure 2a). In order to clarify the expression pattern of PagPIP2;10 to drought stress, the whole plants were dehydrated at room temperature, and the results show that drought stress induced the upregulation of PagPIP2;10 within 8 h, reached the highest spot at 8 h after treatment, decreased within 8–12 h, and then increased after 12 h treatment (Figure 2b). However, we observed that the expression of PagPIP2;10 was not induced by ABA (Figure S2). In a word, PagPIP2;10 could be induced by drought stress and may function in resisting drought stress.
3.3. Subcellular Localization of the PagPIP2;10 Protein
The bioinformatics analysis revealed the transmembrane domains exhibited in the sequence of PagPIP2;10 (Figure 1a,b). To analyze the detail of the subcellular localization of PagPIP2;10, we fused the PagPIP2;10 with a green fluorescent protein (GFP). Then, the expression vectors 35S::PagPIP2;10::GFP and 35S::GFP were transformed into Agrobacterium EHA105. The transformed Agrobacterium EHA105 was injected into tobacco mesophyll cells for transient expression. The results show that the GFP signal of the control group (35S::GFP) was observed at the cell nucleus and cytoplasm, but the GFP signal of PagPIP2;10::GFP was observed at the cell membrane and karyotheca (Figure 2c). In general, our results show that the PagPIP2;10 contains transmembrane domains located at the cell membrane and karyotheca.
3.4. Overexpression of PagPIP2;10 Enhanced Tolerances to Drought Stress
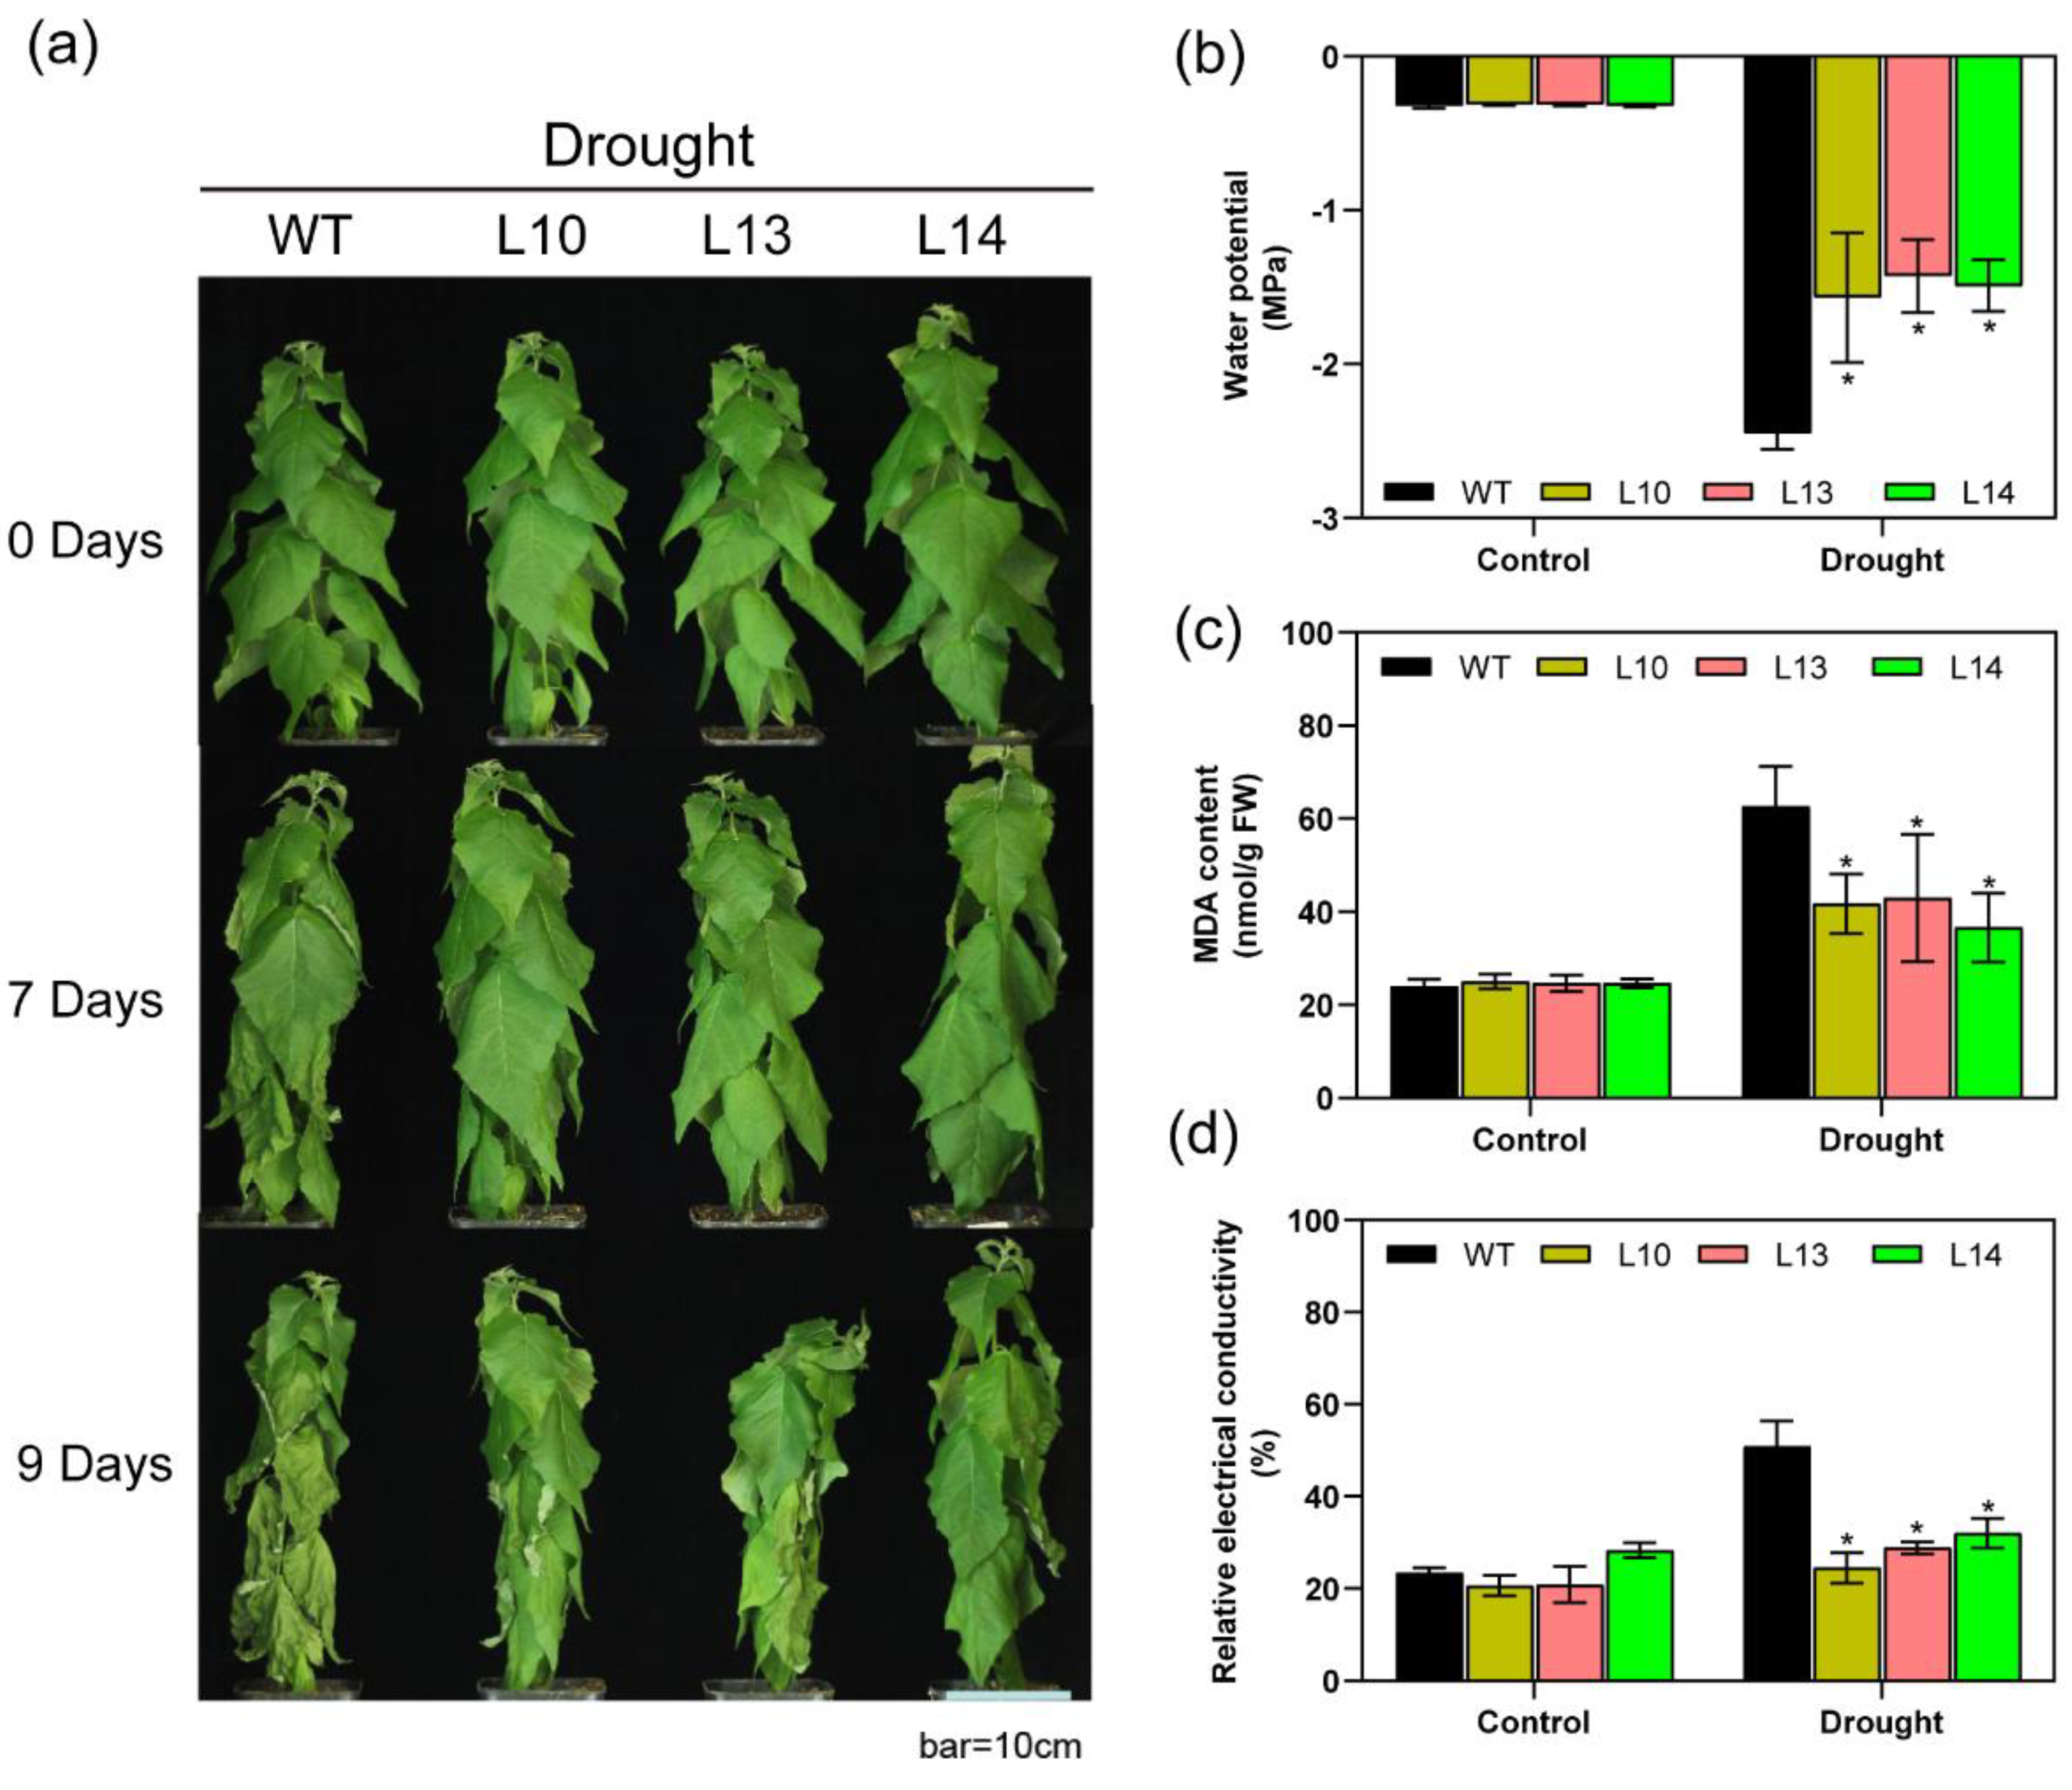
The PIP family members respond to drought in plants [50,51,52,53], and we hypothesized that the overexpression of PagPIP2;10 may enhance the poplar tolerance of drought. We generated the PagPIP2;10ox lines (Figure S3) and treated them with water deficit along with the WT lines. After 7 days of treatment, the leaves of the WT and PagPIP2;10ox lines exhibited slight wilting. After 9 days of treatment, the leaves of the WT plants exhibited more severe wilting than the PagPIP2;10ox lines (Figure 3a), with significant differences in water potential (Figure 3b). There was no significant difference between the WT and overexpression lines under normal conditions (control group).
Electrolyte leakage and MDA are important physiologic indexes for the integrity of the plant cell membranes [46,54]. After the water deficit, the EL levels of the PagPIP2;10ox lines were lower than those of the WT lines, whereas no significant differences were observed in the control (Figure 3d). The level of MDA had the same tendency as EL. After 9 days of water deprivation, the overexpression lines maintained a lower content of MDA than WT did (Figure 3c). The results indicate that the overexpression of PagPIP2;10 reduced the damage to the cell membrane. We measured the activity of SOD, POD, and CAT and found that PagPIP2;10 contributes to maintaining higher enzyme activity in poplars. Under normal conditional, overexpression lines had similar antioxidant enzyme activity with the WT lines. Overexpression plants maintained higher antioxidant enzyme activity after 9 days of drought stress (Figure S4). Overall, our findings indicate that PagPIP2;10 improved the tolerance of drought in poplars.
3.5. Overexpression of PagPIP2;10 Maintains Higher Photosynthesis
To analyze the effect of PagPIP2;10 on photosynthesis physiology under drought stress we determined the dynamic variation of photosynthesis rates during the water-deficit stress. As the figures show, the photosynthesis rates, stomatal conductance, and transpiration of the WT and overexpression lines decreased dramatically after drought stress. During the drought process, the photosynthesis rates of the overexpression lines decreased more slowly than the WT plants. After 4 days of drought stress, the photosynthesis rates of the WT lines are observably lower than the PagPIP2;10ox lines (Figure 4b).
3.6. Overexpression of PagPIP2;10 Retained More Water in Leaves
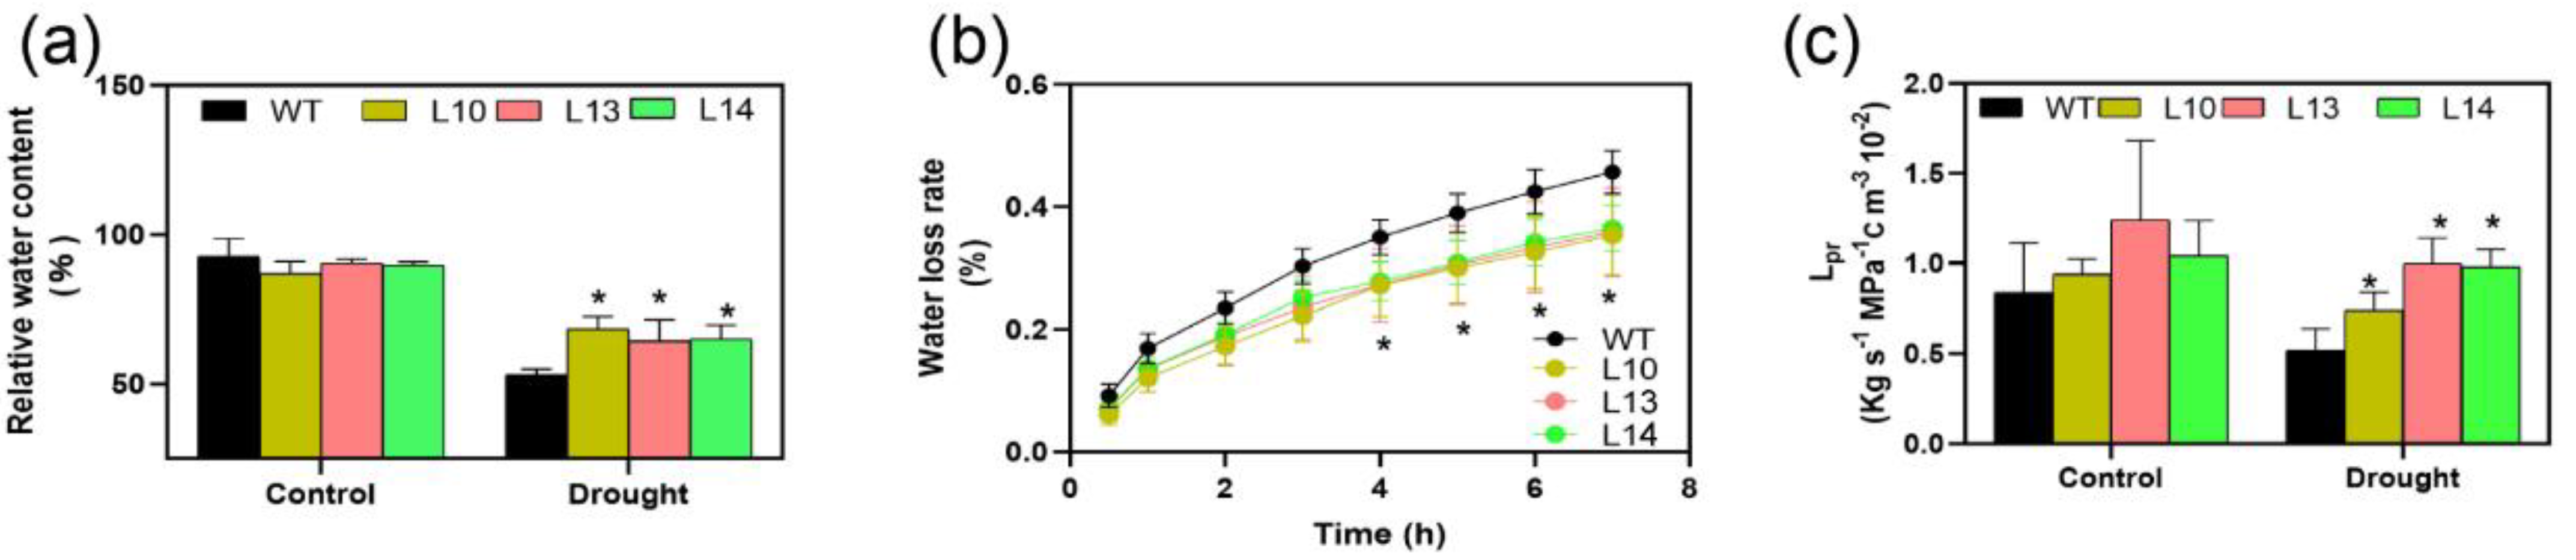
We found that both stomatal conductance and transpiration were reduced during water deficit (Figure 4a,c). The stomatal conductance of the overexpression lines was significantly lower than that of the WT lines during the first four days of the water-deficit treatment. The trend of the transpiration rate corresponded to the stomatal conductance (Figure 4c). In addition, we speculated whether changes in the transpiration rate were related to stomatal density. By measurement, we found that the overexpression of PagPIP2;10 did not alter stomatal density in poplars (Figure S5). Under water-deficit conditions, leaf RWC was significantly higher in the PagPIP2;10ox lines than in the WT lines (Figure 5a). We analyzed the rate of water loss using isolated leaves of the WT and PagPIP2;10ox lines. The results show that the WT lines maintained a faster rate of water loss than the overexpression lines during natural dehydration (Figure 5b). This suggests that PagPIP2;10 induces an accelerated rate of stomatal closure and reduced transpiration, which helps the poplar leaves retain more water.
As the PIP2 subfamily members are responsible for water transport, we also analyzed the root hydraulic conductivity (Lpr) of the WT and PagPIP2;10ox lines under drought conditions. The results show that drought stress decreased the root hydraulic conductivity in the WT and PagPIP2;10ox lines compared with natural conditions. However, the root hydraulic conductivity was observably higher in the PagPIP2;10ox lines compared with the WT lines (Figure 5c) with the exception that the proline content was significantly higher than that of the WT lines (Figure S4). In short, the overexpression of PagPIP2;10 maintained higher content of water in poplars.
3.7. PagPIP2;10 Promotes ABA-Induced Stomatal Closure
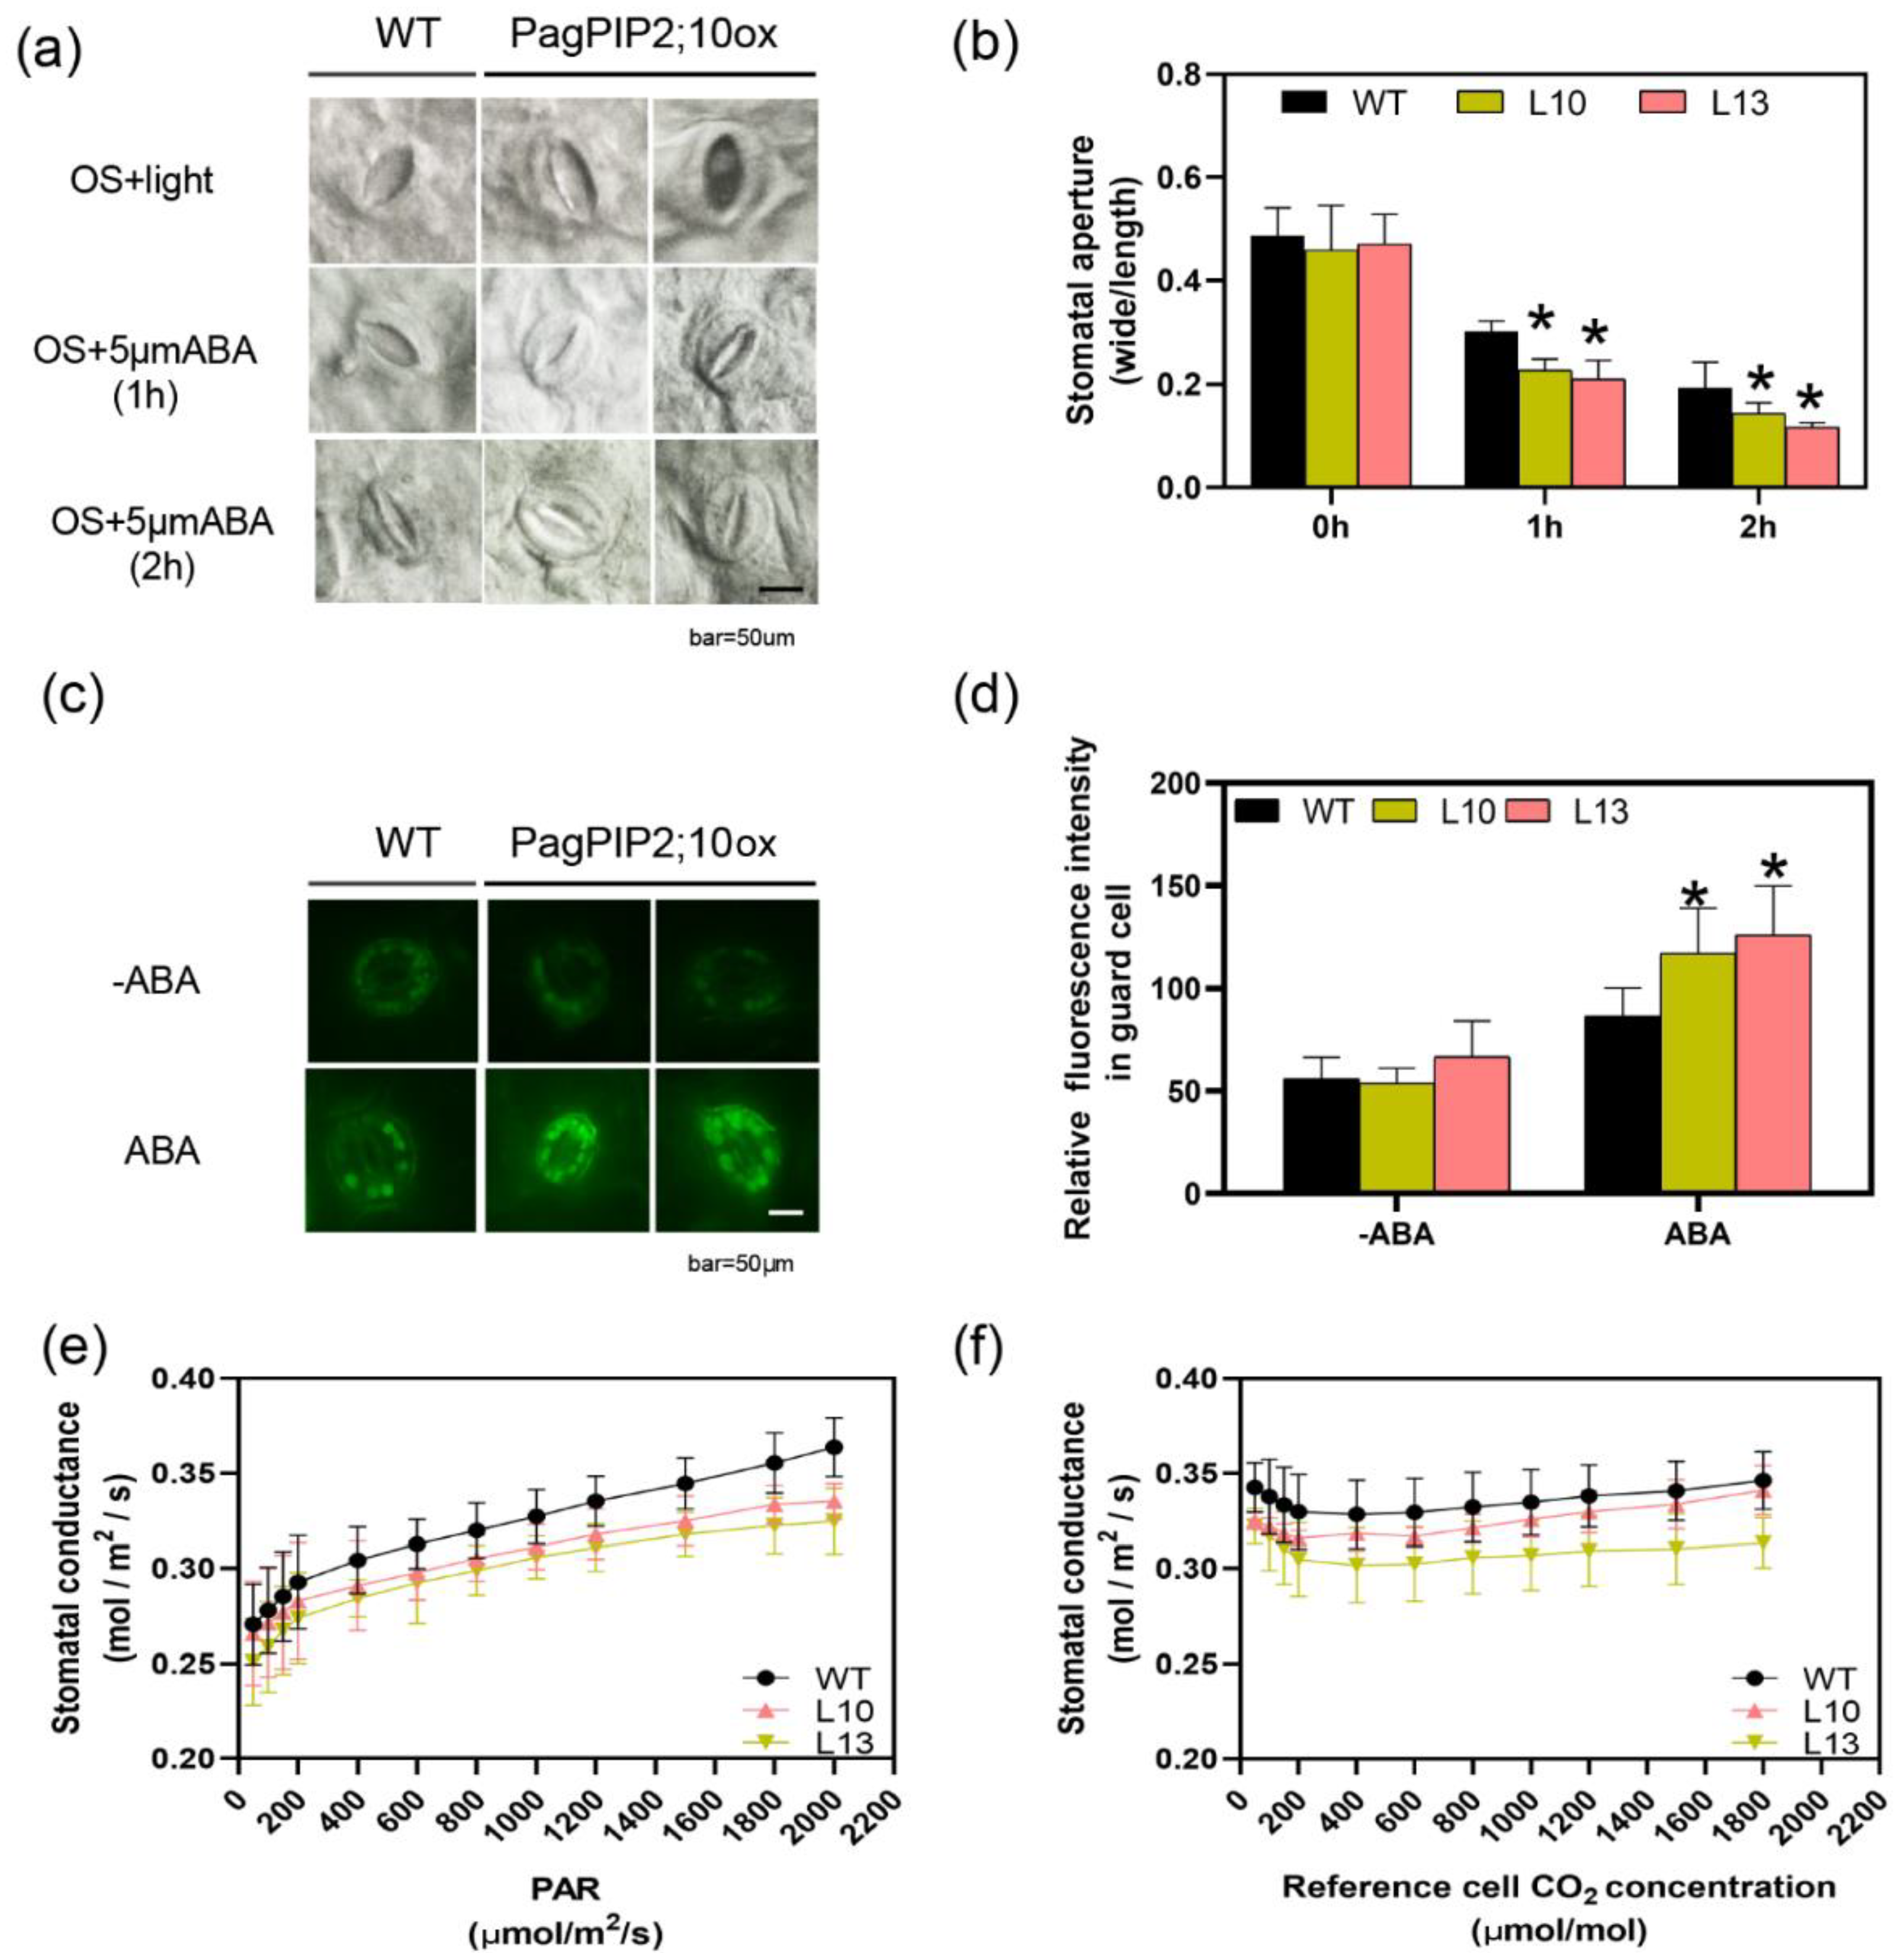
Drought stress induces the accumulation of ABA and ROS, which promotes stomatal closure. To verify whether PagPIP2;10 modified the ABA-induced stomatal closure, the leaves from the WT and PagPIP2;10ox lines were treated with ABA, and the stomatal aperture was analyzed. The results show the stomatal aperture of both the overexpression lines and the WT lines decreased after 1 h and 2 h of ABA treatment, but the stomatal aperture of the PagPIP2;10ox lines was smaller than that of the WT lines (Figure 6a,b). This indicated that the stomatal closure of the overexpression lines was faster than that of the WT lines after ABA treatment. Further analysis using the H2DCFDA probe revealed that ROS was significantly enriched in guard cells of the PagPIP2;10ox lines compared with the WT plants after ABA treatment (Figure 6c,d). We also analyzed the stomatal conductance response to different light intensities and CO2 concentrations. The results show the stomatal conductance of the PagPIP2;10ox lines did not vary significantly with the WT lines (Figure 6e,f).
4. Discussion
4.1. PagPIP2;10 Is a Classical Member of AQPs
The PIP family is composed of PIP1 and PIP2 subfamilies. PIP2 proteins have been revealed to be the major channels for water [55,56]. In the atpip2;2 mutant, the hydraulic conductivity of the root was reduced compared with the wild-type [57]. In P. trichocarpa, PIP2 subfamily members (PIP2;1, PIP2;2, PIP2;3, PIP2;4, PIP2;5, PIP2;6, PIP2;7, and PIP2;8) showed water channel activity [17]. The overexpression of PIP2;5 in poplars improved the tolerance of osmotic stress [33]. In this study, PagPIP2;10 is a classical PIP protein that possesses six transmembrane helices with five loop (A-E) links to the helices. The two characterized NPA motifs (Asparagine–Proline–Alanine), the most important structure to maintain the function of PIPs, is also contained in the conserved hydrophobic loops of B and E (Figure 1a,b). The phylogenetic tree analysis indicated the close genetic evolutionary relationship with the PIP2 subfamily of aquaporins (Figure 1c). It suggested that PagPIP2;10 is functionally conserved as PIP2 members. Consistent with these results, the overexpression of PagPIP2;10 in poplars improved the root water conductance compared with the WT plants. Furthermore, PagPIP2;10 targeted in the membrane (Figure 2c) supported that PagPIP2;10 is a transmembrane protein (Figure 1a,b). Therefore, PagPIP2;10 is a classical AQP.
4.2. PagPIP2;10 Is Candidate for Drought Tolerance Breeding
Transcription levels of AQPs in plants depend on the changing external environment factors, such as light, temperature, salinity, and drought [33]. For instance, in tobacco, drought stress increased the expression of NtAQP1 (a homologous gene of AtPIP1), while reducing the expression of NtPIP1;1 and NtPIP2;1 [58]. Reducing the expression level in tobacco by means of an antisense construct resulted in lower water stress resistance [59]. In jatropha curcas, JcPIP2 expression response to drought, the overexpression of PIP2 enhanced its drought tolerance [60]. Poplars overexpressing PIP2;5 are more resistant to water deficit stress [33]. In our study, we observed that PagPIP2;10 was mainly expressed in the leaves during normal conditions, and the expression level of PagPIP2;10 was induced by dehydration stress. To reveal the function of PagPIP2;10 under drought stress, we generated the PagPIP2;10 overexpression poplars under the control of the CaMV35S promoter. The overexpression lines maintained higher leaf water potential (Figure 3b) and photosynthetic rate (Figure 4b) compared with the WT plants during drought stress. Beyond that, the PagPIP2;10ox lines conferred a lower MDA content (Figure 3c) and higher activities of antioxidase enzymes, such SOD, POD, and CAT (Figure S4). These results indicate that PagPIP2;10 confers drought tolerance in poplars suggesting that PagPIP2;10 is a robust candidate gene for drought tolerance.
4.3. PagPIP2;10 Enhanced Drought Tolerance in Poplars by Promoting Stomatal Closure
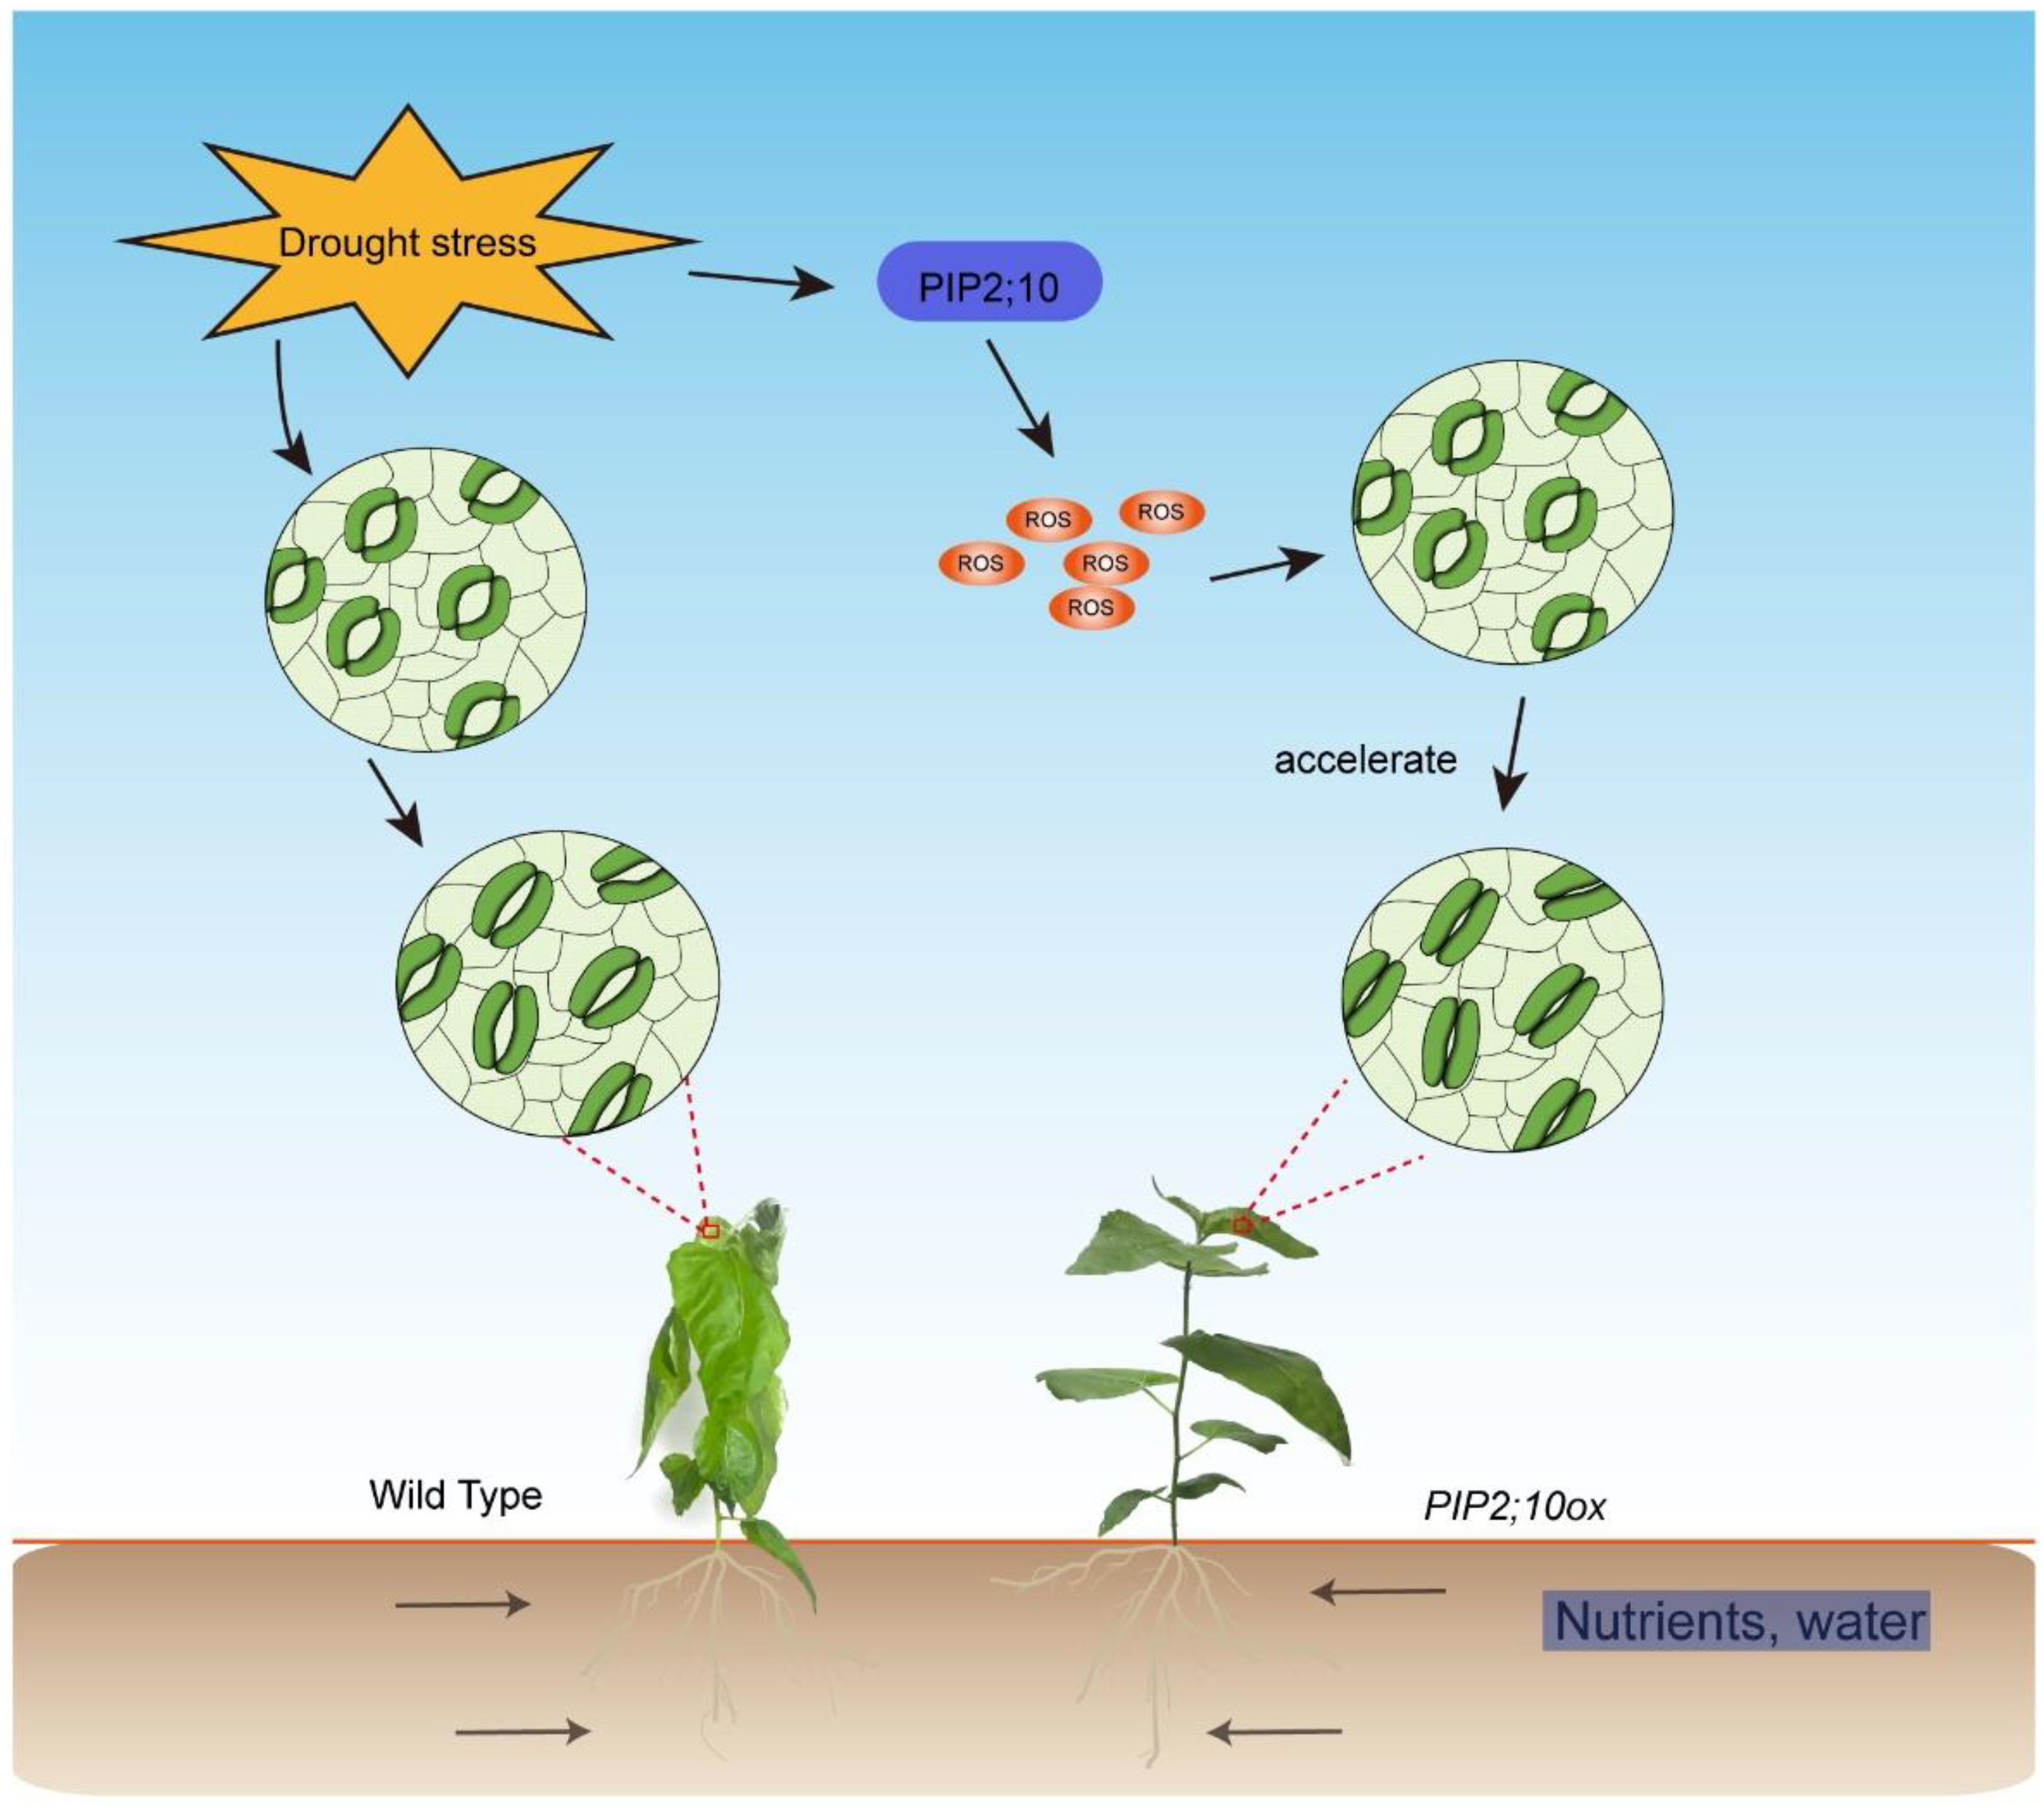
Stomata is the main channel for water and air exchange between plants and the external environment. Stomatal conductance is closely related to transpiration, CO2, and light [61]. In our study, the RWC values of the PagPIP2;10ox lines were significantly greater than those of the WT lines after dehydration. This suggests that the transpiration was lower in the PagPIP2;10ox lines than in the WT lines. Further investigations indicated that the stomatal closure was faster in the PagPIP2;10ox lines than in the WT lines after ABA treatment, suggesting that the reduced transpiration was caused by the faster stomatal closure. H2O2 is a crucial signal molecule in regulating ABA-induced stomatal closure under drought stress [62]. We found that H2O2 accumulated more in the PagPIP2;10ox guard cells than in the WT lines after ABA treatment, suggesting that it correlated with the faster stomatal closure. Previous studies have indicated that some PIP2 subfamily proteins participated in stomatal closure. In Arabidopsis thaliana, AtPIP2;1 is necessary for the ABA-induced stomatal closure, which is linked with the transportation of water and H2O2 [4,63,64]. In Zea mays, the PIP2;5-OE lines had accelerated stomatal closure upon ABA treatment, which was correlated with ROS accumulation [63]. In addition, ectopically expressing MdPIP1;3 in tomatoes reduced water loss by promoting guard cell closure under drought stress [65]. Consistent with these results, the expression level of PagPIP2;10 was not induced by ABA, suggesting that PagPIP2;10-promoted stomatal closure correlated with ROS transport. Furthermore, the stomatal conductance was not affected by light and CO2 concentration (Figure 6e, f), suggesting that PagPIP2;10 accelerated stomatal closure under drought stress via promoting ROS accumulation in guard cells (Figure 7).
According to previous research, AQPs contribute 80–90% of Lpr in plants under normal or drought stress conditions [4]. We observed that the overexpression of PagPIP2;10 enhanced the Lpr in poplars under drought stress, which helped poplars absorb more water under drought stress and enhanced drought tolerance, which partially explained the higher transpiration in overexpression lines than in the WT lines.
5. Conclusions
Our study reveals that PagPIP2;10 overexpression in poplar 84K enhanced the tolerance of drought stress and partially reduced water loss and increased root hydraulic conductance. In addition, the accumulation of ROS was higher in the guard cell of the PagPIP2;10ox lines after ABA treatment, which may result in the faster stomatal closure in the PagPIP2;10ox lines (Figure 7).
Supplementary Materials
The following supporting information can be downloaded at: https://www.mdpi.com/article/10.3390/f14040696/s1, Figure S1. Expression analysis of AQP family genes in poplars under drought stress. LD, long drought; SD, short drought; Figure S2. Expression level of PagPIP2;10 after treatment of ABA; Figure S3. Selection of overexpression lines. (a) PCR analysis of plants; (b) Relative expression level of PagPIP2;10 in selected lines by RT-qPCR; Figure S4. Activity of antioxidant enzymes in WT and overexpression lines after nine days of water deficit. (a) SOD activity; (b) POD activity; (c) CAT activity; and (d) Proline content. Each treatment was performed with three biological replicates (n = 3), and values are means ± SE. Data were analyzed through Student’s t- test in the ANOVA program of SPSS (IBM SPSS17.0). * indicates a significant difference compared with control (* p < 0.05); Figure S5. Stomatal density of WT and PagPIP2;10ox lines. Error bars are means ± SE (n = 30). Data were analyzed with the Student’s t-test in the ANOVA program of SPSS (IBM SPSS17.0); Table S1. RT-qPCR, PagPIP2;10 CDS and selected primers used in this study.
Author Contributions
Conceptualization, X.-Q.Y. and W.S.; methodology, X.-Q.Y. and W.S.; software, X.-Q.Y.; validation, X.-Q.Y., W.S. and C.L.; formal analysis, H.-L.W.; investigation, W.S.; resources, W.S.; data curation, X.-Q.Y.; writing—original draft preparation, W.S.; writing—review and editing, X.-Q.Y.; visualization, X.-Q.Y.; supervision, X.X.; project administration, X.X.; funding acquisition, W.Y. and X.X. All authors have read and agreed to the published version of the manuscript.
Funding
This research was funded by the National Key R&D Program of China during the 14th Five-year Plan Period (2021YFD2200103) and the National Natural Science Foundation of China (32071734, 31770649).
Institutional Review Board Statement
Not applicable.
Informed Consent Statement
Not applicable.
Data Availability Statement
Not applicable.
Conflicts of Interest
The authors declare no conflict of interest.
Abbreviations
AQPs: aquaporins; PYR/PYL/RCAR: pyrabactin-resistance 1/pyrabactin resistance like/regulatory component of ABA receptor; SnRK2.6: Snf1-related protein kinase 2.6; protein phosphatases type-2C: PP2Cs; PIPs: plasma membrane intrinsic proteins, TIPs: tonoplast intrinsic proteins, SIPs: small basic intrinsic proteins; NIPs: nodulin 26-like intrinsic proteins; XIPs: X intrinsic proteins.
References
- Hu, H.; Xiong, L. Genetic Engineering and Breeding of Drought-Resistant Crops. Annu. Rev. Plant Biol. 2014, 65, 715–741. [Google Scholar] [CrossRef] [PubMed]
- Li, J.; Li, Y.; Yin, Z.; Jiang, J.; Zhang, M.; Guo, X.; Ye, Z.; Zhao, Y.; Xiong, H.; Zhang, Z.; et al. OsASR5 enhances drought tolerance through a stomatal closure pathway associated with ABA and H2O2 signalling in rice. Plant Biotechnol. J. 2017, 15, 183–196. [Google Scholar] [CrossRef] [PubMed]
- Agata, D.; Szarejko, I. Open or Close the Gate—Stomata Action Under the Control of Phytohormones in Drought Stress Conditions. Front. Plant Sci. 2013, 4, 138. [Google Scholar]
- Grondin, A.; Rodrigues, O.; Verdoucq, L.; Merlot, S.; Leonhardt, N.; Maurel, C. Aquaporins Contribute to ABA-Triggered Stomatal Closure through OST1-Mediated Phosphorylation. Plant Cell 2015, 27, 1945–1954. [Google Scholar] [CrossRef] [PubMed] [Green Version]
- Lawson, T.; Vialet-Chabrand, S. Speedy stomata, photosynthesis and plant water use efficiency. New Phytol. 2019, 221, 93–98. [Google Scholar] [CrossRef] [Green Version]
- Pawłowicz, I.; Masajada, K. Aquaporins as a link between water relations and photosynthetic pathway in abiotic stress tolerance in plants. Gene 2019, 687, 166–172. [Google Scholar] [CrossRef]
- Nishimura, N.; Sarkeshik, A.; Nito, K.; Park, S.Y.; Wang, A.; Carvalho, P.C.; Lee, S.; Caddell, D.F.; Cutler, S.R.; Chory, J.; et al. PYR/PYL/RCAR family members are major in-vivo ABI1 protein phosphatase 2C-interacting proteins in Arabidopsis. Plant J. Cell Mol. Biol. 2010, 61, 290–299. [Google Scholar] [CrossRef]
- Santiago, J.; Dupeux, F.; Round, A.; Antoni, R.; Park, S.Y.; Jamin, M.; Cutler, S.R.; Rodriguez, P.L.; Márquez, J.A. The abscisic acid receptor PYR1 in complex with abscisic acid. Nature 2009, 462, 665–668. [Google Scholar] [CrossRef]
- Fujita, Y.; Nakashima, K.; Yoshida, T.; Katagiri, T.; Kidokoro, S.; Kanamori, N.; Umezawa, T.; Fujita, M.; Maruyama, K.; Ishiyama, K.; et al. Three SnRK2 protein kinases are the main positive regulators of abscisic acid signaling in response to water stress in Arabidopsis. Plant Cell Physiol. 2009, 50, 2123–2132. [Google Scholar] [CrossRef] [Green Version]
- Rodrigues, O.; Shan, L. Stomata in a state of emergency: H2O2 is the target locked. Trends Plant Sci. 2022, 27, 274–286. [Google Scholar] [CrossRef]
- Förster, S.; Schmidt, L.K.; Kopic, E.; Anschütz, U.; Huang, S.; Schlücking, K.; Köster, P.; Waadt, R.; Larrieu, A.; Batistič, O.; et al. Wounding-Induced Stomatal Closure Requires Jasmonate-Mediated Activation of GORK K+ Channels by a Ca2+ Sensor-Kinase CBL1-CIPK5 Complex. Dev. Cell 2019, 48, 87–99.e6. [Google Scholar] [CrossRef] [Green Version]
- Chater, C.; Gray, J.E. Stomatal closure: The old guard takes up the SLAC. Curr. Biol. CB 2015, 25, R271–R273. [Google Scholar] [CrossRef] [Green Version]
- Ueda, A.; Aihara, Y.; Sato, S.; Kano, K.; Mishiro-Sato, E.; Kitano, H.; Sato, A.; Fujimoto, K.J.; Yanai, T.; Amaike, K.; et al. Discovery of 2,6-Dihalopurines as Stomata Opening Inhibitors: Implication of an LRX-Mediated H+-ATPase Phosphorylation Pathway. ACS Chem. Biol. 2023, 18, 347–355. [Google Scholar] [CrossRef]
- Islam, M.M.; Ye, W.; Matsushima, D.; Rhaman, M.S.; Munemasa, S.; Okuma, E.; Nakamura, Y.; Biswas, M.S.; Mano, J.; Murata, Y. Reactive Carbonyl Species Function as Signal Mediators Downstream of H2O2 Production and Regulate [Ca2+]cyt Elevation in ABA Signal Pathway in Arabidopsis Guard Cells. Plant Cell Physiol. 2019, 60, 1146–1159. [Google Scholar] [CrossRef]
- Sirichandra, C.; Gu, D.; Hu, H.C.; Davanture, M.; Lee, S.; Djaoui, M.; Valot, B.; Zivy, M.; Leung, J.; Merlot, S. Phosphorylation of the Arabidopsis AtrbohF NADPH oxidase by OST1 protein kinase. FEBS Lett. 2009, 583, 3375. [Google Scholar] [CrossRef] [Green Version]
- Hu, Y.; Wu, Q.; Peng, Z.; Sprague, S.A.; Wang, W.; Park, J.; Akhunov, E.; Jagadish, K.S.V.; Nakata, P.A.; Cheng, N.; et al. Silencing of OsGRXS17 in rice improves drought stress tolerance by modulating ROS accumulation and stomatal closure. Sci. Rep. 2017, 7, 1590. [Google Scholar] [CrossRef] [Green Version]
- Secchi, F.; Maciver, B.; Zeidel, M.L.; Zwieniecki, M.A. Functional analysis of putative genes encoding the PIP2 water channel subfamily in Populus trichocarpa. Tree Physiol. 2009, 29, 1467–1477. [Google Scholar] [CrossRef] [Green Version]
- Maurel, C. Aquaporins and water permeability of plant membranes. Annu. Rev. Plant Physiol. Plant Mol. Biol. 1997, 48, 399–429. [Google Scholar] [CrossRef] [Green Version]
- Chaumont, F. Aquaporins Constitute a Large and Highly Divergent Protein Family in Maize. Plant Physiol. 2001, 125, 1206–1215. [Google Scholar] [CrossRef] [Green Version]
- Johanson, U.; Karlsson, M.; Johansson, I.; Gustavsson, S.; Kjellbom, P.J. The Complete Set of Genes Encoding Major Intrinsic Proteins in Arabidopsis Provides a Framework for a New Nomenclature for Major Intrinsic Proteins in Plants. Plant Physiol. 2001, 126, 1358–1369. [Google Scholar] [CrossRef] [Green Version]
- Maurel, C.; Santoni, V.; Luu, D.T.; Wudick, M.M.; Verdoucq, L. The cellular dynamics of plant aquaporin expression and functions. Curr. Opin. Plant Biol 2009, 12, 690–698. [Google Scholar] [CrossRef] [PubMed]
- Zhou, S.; Hu, W.; Deng, X.; Ma, Z.; Chen, L.; Huang, C.; Wang, C.; Wang, J.; He, Y.; Yang, G. Overexpression of the Wheat Aquaporin Gene, TaAQP7, Enhances Drought Tolerance in Transgenic Tobacco. PLoS ONE 2012, 7, e52439. [Google Scholar] [CrossRef] [PubMed] [Green Version]
- Otto, B.; Kaldenhoff, R. Cell-specific expression of the mercury-insensitive plasma-membrane aquaporin NtAQP1 from Nicotiana tabacum. Planta 2000, 211, 167–172. [Google Scholar] [PubMed]
- Sade, N.; Gallé, A.; Flexas, J.; Lerner, S.; Peleg, G.; Yaaran, A.; Moshelion, M. Differential tissue-specific expression of NtAQP1 in Arabidopsis thaliana reveals a role for this protein in stomatal and mesophyll conductance of CO2 under standard and salt-stress conditions. Planta 2014, 239, 357–366. [Google Scholar] [CrossRef]
- Zhao, X.Q.; Mitani, N.; Yamaji, N.; Shen, R.F.; Ma, J.F. Involvement of silicon influx transporter OsNIP2;1 in selenite uptake in rice. Plant Physiol. 2010, 153, 1871–1877. [Google Scholar] [CrossRef] [Green Version]
- Gómez-Soto, D.; Galván, S.; Rosales, E.; Bienert, P.; Abreu, I.; Bonilla, I.; Bolaños, L.; Reguera, M. Insights into the role of phytohormones regulating pAtNIP5;1 activity and boron transport in Arabidopsis thaliana. Plant Sci. Int. J. Exp. Plant Biol. 2019, 287, 110198. [Google Scholar] [CrossRef]
- He, M.; Wang, S.; Zhang, C.; Liu, L.; Zhang, J.; Qiu, S.; Wang, H.; Yang, G.; Xue, S.; Shi, L.; et al. Genetic variation of BnaA3.NIP5;1 expressing in the lateral root cap contributes to boron deficiency tolerance in Brassica napus. PLoS Genet. 2021, 17, e1009661. [Google Scholar] [CrossRef]
- Wang, L.L.; Chen, A.P.; Zhong, N.Q.; Ning, L.; Wu, X.M.; Fang, W.; Yang, C.L.; Romero, M.F.; Xia, G.X. The Thellungiella salsuginea Tonoplast Aquaporin TsTIP1;2 Functions in Protection Against Multiple Abiotic Stresses. Plant Cell Physiol. 2014, 55, 148–161. [Google Scholar] [CrossRef] [Green Version]
- Lu, L.; Dong, C.; Liu, R.; Zhou, B.; Wang, C.; Shou, H. Roles of Soybean Plasma Membrane Intrinsic Protein GmPIP2;9 in Drought Tolerance and Seed Development. Front. Plant Sci. 2018, 9, 530. [Google Scholar] [CrossRef] [Green Version]
- Tuskan, G.A.; Difazio, S.; Jansson, S.; Bohlmann, J.; Grigoriev, I.; Hellsten, U.; Putnam, N.; Ralph, S.; Rombauts, S.; Salamov, A.; et al. The genome of black cottonwood, Populus trichocarpa (Torr. & Gray). Science 2006, 313, 1596–1604. [Google Scholar]
- Amlin, N.M.; Rood, S.B. Drought stress and recovery of riparian cottonwoods due to water table alteration along Willow Creek, Alberta. Trees 2003, 17, 351–358. [Google Scholar] [CrossRef]
- Almeida Rodriguez, A.M.; Cooke, J.E.K.; Yeh, F.; Zwiazek, J.J. Functional characterization of drought-responsive aquaporins in Populus balsamifera and Populus simonii × balsamifera clones with different drought resistance strategies. Physiol. Plant. 2010, 140, 321–333. [Google Scholar] [CrossRef]
- Ranganathan, K.; Cooke, J.E.K.; El Kayal, W.; Equiza, M.A.; Vaziriyeganeh, M.; Zwiazek, J.J. Over-expression of PIP2;5 aquaporin alleviates gas exchange and growth inhibition in poplars exposed to mild osmotic stress with polyethylene glycol. Acta Physiol. Plant 2017, 39, 187. [Google Scholar] [CrossRef]
- Ariani, A.; Barozzi, F.; Sebastiani, L.; Di Toppi, L.S. AQUA1 is a mercury sensitive poplar aquaporin regulated at transcriptional and post-translational levels by Zn stress. Plant Physiol. Biochem. 2018, 135, 588–600. [Google Scholar] [CrossRef]
- He, F.; Li, H.G.; Wang, J.J.; Su, Y.; Wang, H.L.; Feng, C.H.; Yang, Y.; Niu, M.X.; Liu, C.; Yin, W.; et al. PeSTZ1, a C2H2-type zinc finger transcription factor from Populus euphratica, enhances freezing tolerance through modulation of ROS scavenging by directly regulating PeAPX2. Plant Biotechnol. J. 2019, 17, 2169–2183. [Google Scholar] [CrossRef] [Green Version]
- He, F.; Wang, H.; Li, H.; Su, Y.; Li, S.; Yang, Y.; Feng, C.; Yin, W.; Xia, X. PeCHYR1, a ubiquitin E3 ligase from Populus euphratica, enhances drought tolerance via ABA-induced stomatal closure by ROS production in Populus. Plant Biotechnol. J. 2018, 16, 1514–1528. [Google Scholar] [CrossRef] [Green Version]
- Wang, H.; Chen, J.; Tian, Q.; Wang, S.; Xia, X.; Yin, W. Identification and validation of reference genes for Populus euphratica gene expression analysis during abiotic stresses by quantitative real-time PCR. Physiol. Plant. 2014, 152, 529–545. [Google Scholar] [CrossRef]
- Cui, F.; Liu, L.; Zhao, Q.; Zhang, Z.; Li, Q.; Lin, B.; Wu, Y.; Tang, S.; Xie, Q. Arabidopsis Ubiquitin Conjugase UBC32 Is an ERAD Component That Functions in Brassinosteroid-Mediated Salt Stress Tolerance. Plant Cell 2012, 24, 233–244. [Google Scholar] [CrossRef] [Green Version]
- Wang, C.; Liu, S.; Dong, Y.; Zhao, Y.; Geng, A.; Xia, X.; Yin, W. PdEPF1 regulates water-use efficiency and drought tolerance by modulating stomatal density in poplar. Plant Biotechnol. J. 2016, 14, 849–860. [Google Scholar] [CrossRef] [Green Version]
- Li, J.; Yu, G.; Sun, X.; Liu, Y.; Liu, J.; Zhang, X.; Jia, C.; Pan, H. AcPIP2, a plasma membrane intrinsic protein from halophyte Atriplex canescens, enhances plant growth rate and abiotic stress tolerance when overexpressed in Arabidopsis thaliana. Plant Cell Rep 2015, 34, 1401–1415. [Google Scholar] [CrossRef]
- Beauchamp, C. Superoxide dismutase: Improved assays and an assay applicable to acrylamide gel. Anal. Biochem 1971, 44, 276–287. [Google Scholar] [CrossRef] [PubMed]
- Hemeda, H.M.; Klein, B.P. Effects of Naturally Occurring Antioxidants on Peroxidase Activity of Vegetable Extracts. J. Food Sci. 1990, 55, 184–185. [Google Scholar] [CrossRef]
- Patra, K.H.; Kar, M.; Mishra, D. Catalase Activity in Leaves and Cotyledons during Plant Development and Senescence 1). Biochem. Und Physiol. Pflanz. 1978, 172, 385–390. [Google Scholar] [CrossRef]
- Bates, L.S.; Waldren, R.P.; Teare, I.D. Rapid Determination of Free Proline for Water-Stress Studies. Plant Soil 1973, 39, 205–207. [Google Scholar] [CrossRef]
- Shi, H.; Ye, T.; Chen, F.; Cheng, Z.; Wang, Y.; Yang, P.; Zhang, Y.; Chan, Z. Manipulation of arginase expression modulates abiotic stress tolerance in Arabidopsis: Effect on arginine metabolism and ROS accumulation. J. Exp. Bot. 2013, 64, 1367–1379. [Google Scholar] [CrossRef] [Green Version]
- Li, D.; Song, S.; Xia, X.; Yin, W. Two CBL genes from Populus euphratica confer multiple stress tolerance in transgenic triploid white poplar. Plant Cell Tissue Organ Cult. (PCTOC) 2012, 109, 477–489. [Google Scholar] [CrossRef]
- Xu, H.; Kemppainen, M.; El, K.W.; Lee, S.H.; Pardo, A.G.; Cooke, J.E.; Zwiazek, J.J. Overexpression of Laccaria bicolor aquaporin JQ585595 alters root water transport properties in ectomycorrhizal white spruce (Picea glauca) seedlings. New Phytol. 2015, 205, 757–770. [Google Scholar] [CrossRef]
- Kamaluddin, M.; Zwiazek, J.J. Ethylene enhances water transport in hypoxic aspen. Plant Physiol. 2002, 128, 962–969. [Google Scholar] [CrossRef] [Green Version]
- Filichkin, S.A.; Hamilton, M.; Dharmawardhana, P.D.; Singh, S.K.; Sullivan, C.; Ben-Hur, A.; Reddy, A.; Jaiswal, P. Abiotic Stresses Modulate Landscape of Poplar Transcriptome via Alternative Splicing, Differential Intron Retention, and Isoform Ratio Switching. Front. Plant Sci. 2018, 9, 5. [Google Scholar] [CrossRef] [Green Version]
- Sreedharan, S.; Shekhawat, U.K.S.; Ganapathi, T.R. Transgenic banana plants overexpressing a native plasma membrane aquaporin MusaPIP1;2 display high tolerance levels to different abiotic stresses. Plant Biotechnol. J. 2013, 11, 942–952. [Google Scholar] [CrossRef]
- Wang, X.; Gao, F.; Bing, J.; Sun, W.; Feng, X.; Ma, X.; Zhou, Y.; Zhang, G. Overexpression of the Jojoba Aquaporin Gene, ScPIP1, Enhances Drought and Salt Tolerance in Transgenic Arabidopsis. Int. J. Mol. Sci. 2019, 20, 153. [Google Scholar] [CrossRef] [Green Version]
- Cui, X.; Hao, F.; Chen, H.; Chen, J.; Wang, X. Expression of the Vicia faba VfPIP1 gene in Arabidopsis thaliana plants improves their drought resistance. J. Plant Res 2008, 121, 207–214. [Google Scholar] [CrossRef]
- Alavilli, H.; Awasthi, J.P.; Rout, G.R.; Sahoo, L.; Lee, B.; Panda, S.K. Overexpression of a Barley Aquaporin Gene, HvPIP2;5 Confers Salt and Osmotic Stress Tolerance in Yeast and Plants. Front. Plant Sci. 2016, 7, 1566. [Google Scholar] [CrossRef] [Green Version]
- Shi, H.; Ye, T.; Zhu, J.K.; Chan, Z. Constitutive production of nitric oxide leads to enhanced drought stress resistance and extensive transcriptional reprogramming in Arabidopsis. J. Exp. Bot. 2014, 65, 4119. [Google Scholar] [CrossRef] [Green Version]
- Chrispeels, M.J.; Morillon, R.; Maurel, C.; Gerbeau, P.; Kjellbom, P.; Johansson, I. Aquaporins of plants: Structure, function, regulation, and role in plant water relations. Curr. Top. Membr. 2001, 51, 277–334. [Google Scholar]
- Lopez, D.; Amira, M.B.; Brown, D.; Muries, B.; Brunel-Michac, N.; Bourgerie, S.; Porcheron, B.; Lemoine, R.; Chrestin, H.; Mollison, E.; et al. The Hevea brasiliensis XIP aquaporin subfamily: Genomic, structural and functional characterizations with relevance to intensive latex harvesting. Plant Mol. Biol. 2016, 91, 375–396. [Google Scholar] [CrossRef]
- Javot, H.; Lauvergeat, V.; Santoni, V.; Martin-Laurent, F.; Güçlü, J.; Vinh, J.; Heyes, J.; Franck, K.I.; Schäffner, A.R.; Bouchez, D.; et al. Role of a Single Aquaporin Isoform in Root Water Uptake. Plant Cell 2003, 15, 509–522. [Google Scholar] [CrossRef] [Green Version]
- Majid, M.; Akbar, M.; Tomoaki, H.; Maki, K. Drought Stress Alters Water Relations and Expression of PIP-Type Aquaporin Genes in Nicotiana tabacum Plants. Plant Cell Physiol. 2008, 49, 801–813. [Google Scholar]
- Siefritz, F. PIP1 plasma membrane aquaporins in tobacco: From cellular effects to function in plants. Plant Cell 2002, 14, 869–876. [Google Scholar] [CrossRef] [Green Version]
- Zhang, Y.; Wang, Y.; Jiang, L.; Ying, X.U.; Wang, Y.; Daihua, L.U.; Chen, F. Aquaporin JcPIP2 is Involved in Drought Responses in Jatropha curcas. Acta Bioch. Bioph. Sin. 2010, 39, 787–794. [Google Scholar] [CrossRef] [Green Version]
- Amir, J.R.; Xue, J.; Clearwater, M.J.; Meason, D.F.; Clinton, P.W.; Domec, J.H. Aquaporin regulation in roots controls plant hydraulic conductance, stomatal conductance, and leaf water potential in Pinus radiata under water stress. Plant Cell Environ. 2019, 42, 719–729. [Google Scholar]
- Bi, G.; Hu, M.; Fu, L.; Zhang, X.; Zuo, J.; Li, J.; Yang, J.; Zhou, J.M. The cytosolic thiol peroxidase PRXIIB is an intracellular sensor for H2O2 that regulates plant immunity through a redox relay. Nat. Plants 2022, 8, 1160–1175. [Google Scholar] [CrossRef] [PubMed]
- Rodrigues, O.; Reshetnyak, G.; Grondin, A.; Saijo, Y.; Leonhardt, N.; Maurel, C.; Verdoucq, L. Aquaporins facilitate hydrogen peroxide entry into guard cells to mediate ABA- and pathogen-triggered stomatal closure. Proc. Natl. Acad. Sci. USA 2017, 114, 9200–9205. [Google Scholar] [CrossRef] [PubMed] [Green Version]
- Ding, L.; Chaumont, F. Aquaporin mediating stomatal closure is associated with water conservation under mild water deficit. bioRxiv 2020, 42234. [Google Scholar] [CrossRef]
- Wang, L.; Li, Q.T.; Lei, Q.; Feng, C.; Zheng, X.; Zhou, F.; Li, L.; Liu, X.; Wang, Z.; Kong, J. Ectopically expressing MdPIP1;3, an aquaporin gene, increased fruit size and enhanced drought tolerance of transgenic tomatoes. BMC Plant Biol. 2017, 17, 246. [Google Scholar] [CrossRef] [Green Version]
Figure 1.
Sequence analysis of PagPIP2;10. (a) Sequence alignment PtrPIP2;10 and PagPIP2;10; (b) Transmembrane secondary structure of the PagPIP2;10 protein predicted using TMHMM, TMD 1–6 and loops A–E, with two NPA domains (highlight with red color) in loops B and E, respectively; (c) Phylogenetic tree of PagPIP2;10, AtPIPs, and PtrPIPs.

Figure 2.
PagNBR1 expression patterns and subcellular location. (a) The relative expression levels of the PagPIP2;10 in different tissues, R, root; YL, young leaves; X, xylem; P, phloem; ML, mature leaves; OL, old leaves, (b) Relative PagPIP2;10 expression levels under dehydration conditions simulated by 20% PEG 6000; (c) Subcellular location of PagPIP2;10 in tobacco leaves. Total RNA was isolated from leaf samples collected at indicated times. Each treatment was performed with three biological replicates (n = 3), and values are means ± SE. * indicates a significant difference compared with the control (* p < 0.05).

Figure 3.
PagPIP2;10 overexpression enhances drought stress tolerance in poplars. (a) Effects of drought stress on the growth of wild-type (WT) plants and PagPIP2;10ox lines (L10, L13, and L14). About 60-day-old plants were withheld water for 9 days and photographed before and after treatment. Bar = 10 cm; (b) leaf water potential after 9 days water-deficit treatment; (c) MDA content, and (d) Relative electrical conductivity after 9 days water-deficit treatment. Each treatment was performed with three biological replicates (n = 3), and values are means ± SE. Data were analyzed with the Student’s t-test in the ANOVA program of SPSS (IBM SPSS17.0). * indicates a significant difference compared with the control (* p < 0.05).

Figure 4.
Parameters of poplars during nine days of water deficit. (a) Stomatal conductance, (b) Net CO2 assimilation, and (c) Transpiration. Each treatment was performed with three biological replicates (n = 3), and values are means ± SE. Data were analyzed with the Student’s t-test in the ANOVA program of SPSS (IBM SPSS17.0). * indicates a significant difference compared with the control (* p < 0.05).

Figure 5.
Relative water content in leaves and root hydraulic conductance. (a) Relative leaf water content of WT and PagPIP2;10ox lines after nine days of water deficit; (b) The water loss rate in detached leaves at room temperature; (c) Root hydraulic conductance after three days of treatment with 15% (m/V) PEG 6000. Data were analyzed with the Student’s t-test in the ANOVA program of SPSS (IBM SPSS17.0). * indicates a significant difference compared with the control (* p < 0.05).

Figure 6.
PagPIP2;10 promotes ABA-induced stomatal closure via ROS production. (a) ABA-induced stomatal closure in the leaves of WT and PagPIP2;10ox lines; leaves were incubated in stomata-opening solution (OS) for 2 h under light conditions and then treated with 5 μM ABA for 2 h (OS + ABA, n = 30); (b) Stomatal aperture after 0, 1, and 2 h of ABA treatment (n = 30); (c) ABA-induced H2O2 accumulation in the guard cells of WT and PagPIP2;10ox lines colored with H2DCFDA (n = 30); (d) Quantification of H2O2 accumulation in the guard cells of WT and PagPIP2;10ox lines (n = 30); (e) Stomatal conductance under different photosynthetically active radiation (PAR); (f) Stomatal conductance under different CO2 concentrations. Scale bars = 50 μm. Error bars are means ± SE (n = 3). Data were analyzed with the Student’s t-test in the ANOVA program of SPSS (IBM SPSS17.0). * indicates a significant difference compared with the control (* p < 0.05).

Figure 7.
A possible working model for PagPIP2;10 improves drought tolerance. PIP2;10 transcription is induced by drought, which promotes ROS accumulation in guard cells and accelerates stomatal closure rate; the Lpr of overexpression lines was higher than WT.
Figure 7.
A possible working model for PagPIP2;10 improves drought tolerance. PIP2;10 transcription is induced by drought, which promotes ROS accumulation in guard cells and accelerates stomatal closure rate; the Lpr of overexpression lines was higher than WT.

Disclaimer/Publisher’s Note: The statements, opinions and data contained in all publications are solely those of the individual author(s) and contributor(s) and not of MDPI and/or the editor(s). MDPI and/or the editor(s) disclaim responsibility for any injury to people or property resulting from any ideas, methods, instructions or products referred to in the content. |
© 2023 by the authors. Licensee MDPI, Basel, Switzerland. This article is an open access article distributed under the terms and conditions of the Creative Commons Attribution (CC BY) license (https://creativecommons.org/licenses/by/4.0/).
Share and Cite
MDPI and ACS Style
Yu, X.-Q.; Su, W.; Liu, C.; Wang, H.-L.; Yin, W.; Xia, X. PIP2;10 Enhances Drought Tolerance via Promoting Water-Retaining Capacity in Populus. Forests 2023, 14, 696. https://doi.org/10.3390/f14040696
AMA Style
Yu X-Q, Su W, Liu C, Wang H-L, Yin W, Xia X. PIP2;10 Enhances Drought Tolerance via Promoting Water-Retaining Capacity in Populus. Forests. 2023; 14(4):696. https://doi.org/10.3390/f14040696
Chicago/Turabian StyleYu, Xiao-Qian, Wanlong Su, Chao Liu, Hou-Ling Wang, Weilun Yin, and Xinli Xia. 2023. "PIP2;10 Enhances Drought Tolerance via Promoting Water-Retaining Capacity in Populus" Forests 14, no. 4: 696. https://doi.org/10.3390/f14040696
Note that from the first issue of 2016, this journal uses article numbers instead of page numbers. See further details here.