
The Effect of Human Trampling Activity on a Soil Microbial Community at the Urban Forest Park
by
 ,
,
Qianqian Liu
1,
Wensui Li
1,
Hui Nie
1,
Xiaorui Sun
1 ,
,
Lina Dong
2,
Liu Xiang
1,
Jinchi Zhang
1,* and
Xin Liu
1,* 1
Co-Innovation Center for Sustainable Forestry in Southern China, Jiangsu Province Key Laboratory of Soil and Water Conservation and Ecological Restoration, Nanjing Forestry University, Nanjing 210037, China
2
Zhongshan Cemetery Administration, Nanjing 210037, China
*
Authors to whom correspondence should be addressed.
Forests 2023, 14(4), 692; https://doi.org/10.3390/f14040692
Submission received: 2 March 2023
/
Revised: 24 March 2023
/
Accepted: 25 March 2023
/
Published: 28 March 2023
(This article belongs to the Special Issue Effects of Disturbances on Forest Soil Biochemistry)
Abstract
:Soil degradation resulting from human trampling in urban forest parks can negatively impact the taxonomic diversity and function of soil microbial communities. In this study, we established long-term, fixed large plots in Zijin Mountain Urban Forest Park in Nanjing, China, to assess the level of trampling pressure. Soil samples were collected from depths of 0–10 cm, 10–20 cm, and 20–30 cm for light trampling (LD), moderate trampling (MD), severe trampling (SD), extreme trampling (ED), and a no-trampling control (CK). The effects of different trampling pressures on soil were studied, including soil nutrient indices, microbial biomass, and the taxonomic diversity of fungi and bacteria. ANOVA and structural equation modeling (SEM) were employed to investigate the impacts of human trampling on the microbial community structure and function. The results indicated that soil organic carbon, ammonium, and acid phosphatase activity were the primary driving factors of microbial community change. Soil microbial diversity initially increased and then decreased with increasing trampling intensity. The changes in soil microbial function and classification were found to be associated with the intensity of trampling. Moderate trampling could enhance the diversity of the soil microbial community. The succession pattern of the fungi and bacteria communities was distinct, and the composition of the bacteria community remained relatively stable. Trampling impacts vegetation and soil structure, which then affects the structure and function of the microbial community. This study provides an essential foundation for the restoration of compacted soil in urban forest parks through targeted monitoring and management efforts.
1. Introduction
Urban forest parks provide a wide range of ecosystem services and contribute to urban sustainability and human well-being [1]. They play a crucial role in regulating the urban ecological environment while allowing human recreation activities [2]. At the same time, they both protect natural biodiversity and allow human recreation activities [3]. As an essential component of the forest ecosystem, soil microorganisms play a vital role in maintaining soil structure and function. They form a feedback system with vegetation growth and development through changes in soil physical and chemical properties and structural functions, thus forming a critical connection between above-ground and subsurface ecosystem components [4,5,6]. However, human trampling activities in urban forest parks can have negative effects, resulting in the degradation of natural systems [7]. Long-term trampling of bare land of different sizes can lead to the reduction of plant diversity, soil erosion, and other ecological problems. Therefore, it is important to take measures to protect and manage urban forest parks to maintain their ecological function and biodiversity.
The continuous increase of human trampling activities has caused erosion of urban soil the destruction of the original soil system [8]. Compaction caused by serious trampling reduces soil pore space, hinders plant growth, and increases the possibility of erosion [9]. It has also been found that moderate trampling compaction reduces gas diffusion by reducing air-filled pores, leading to the accumulation of ethylene and triggering a growth-stimulating hormonal response [10]. Long-term trampling can significantly impact soil’s physical and biological properties. Previous studies have demonstrated that soil compaction resulting from anthropogenic trampling activities leads to reduced soil pore connectivity, air permeability, and rooting space, along with alterations in nutrient flow and biological activity. Additionally, soil compaction can contribute to surface runoff, soil erosion, nutrient leaching, and an increase in greenhouse gas emissions [11,12]. At the same time, soil microorganisms play a crucial role in the biogeochemical cycling of soil nutrients, nutrient absorption, and soil stabilization. Therefore, they greatly influence the nutrient dynamics in the soil [13].
Currently, the majority of research on trampling activities is focused on the degradation of grasslands and meadows caused by overgrazing. These studies typically investigate the correlation between arbuscular mycorrhizal fungi (AMF) community structure and soil structure [14,15], and most of the studies examining soil degradation caused by human trampling activities also focus on the influence of soil physical and chemical properties [16]. Studies on the effects of human trampling on soil microbial characteristics are inconsistent or ambiguous [17,18]. Previous studies have commonly focused on measuring microbial biomass, abundance, and other related parameters, but research findings regarding the impact of trampling on microbial community structure have been inconsistent. Some literature suggests that soil trampling and compaction may have significant and long-lasting effects on both the structure and function of soil microorganisms [19,20,21,22].
Nanjing Zijin Mountain National Forest Park is the first large urban forest park in China, and it is rated as a “national forest park”. In urban forest green spaces, it has been reported that the average annual visitor flow of forest parks has been fluctuating around 10 million people in recent years, posing a significant challenge to the sustainable utilization and ecological environment of these areas. Therefore, in this study, we set up a large fixed-area plot in Zijin Mountain National Forest Park to comprehensively evaluate the soil physical and chemical properties and microbial characteristics under trampling disturbance, and to observe the soil microbial community structure and related functions: First, we monitored the soil system changes after human trampling; next, we detected the effects of irreversible negative effects on the function of soil ecosystem, determined its bearing threshold, and evaluated the recovery ability of compacted soil, providing an important basis for later management and restoration.
2. Materials and Methods
2.1. Site Description
The study area is located in the northeast of Xuanwu District of Nanjing (118°81′–118°88′ E, 32°04′–32°09′ N) with an altitude of 448.8 m. The region has a subtropical monsoon climate with an annual average precipitation of 1530.1 mm and an annual average temperature of 19.6 °C. The area enjoys abundant sunlight, rainfall, and a mild climate, resulting in a frost-free period of 322 days. The Xiangshan group of Jurassic Middle and Lower series dominates the distribution of both the ridge and the south slope, with the bottom comprising a thick quartz conglomerate. The soil is classified as yellow-brown soil and yellow-brown forest soil, while the landform is mainly characterized by low mountains and hills. The pH of the soil ranges from 4.8 to 6.0; the soil texture is mainly sandy loam; the bulk density ranges from 1.35 to 1.65 g/cm3. The forest coverage rate is 70.2%, and the dominant tree species include Quercus acutissima Carruth., Liquidambar formosana, Cyclobalanopsis glauca, Photinia serrulate. It is characterized by coniferous and broad-leaved forests, with Pinus massoniana Lamb and Ilex chinensis being the predominant species. The main vegetation communities in the park include coniferous broad-leaved mixed forest, deciduous broad-leaved mixed forest, deciduous evergreen broad-leaved mixed forest, and a small amount of artificial bamboo forest. Currently, most of the forest is deciduous evergreen broad-leaved mixed forest, which has developed naturally over many years. In the southwest area of the park, there are noticeable signs of human disturbance; several narrow and long forest gaps have formed. More than 300 bare land paths and patches of different sizes have been formed by human trampling over several decades, leading to environmental issues such as reduced biodiversity and soil erosion.
2.2. Experimental Design
In April 2021, a large fixed-area plot was established in the southern part of Zijin Mountain Forest Park. The plot is a deciduous evergreen broad-leaved mixed forest that has developed naturally over many years, with similar mature tree (diameter at breast height ≥ 5 cm) density. The adjacent grid method was used to divide the large plot into 100 survey quadrats, each measuring 1010 m. The tree species, diameter at breast height, height, crown width, and coordinates of trees with diameter at breast height ≥ 5 cm were recorded. Additionally, five 11 m quadrats were established in each 10 ∗ 10 m quadrat, one at each corner and one in the center, to investigate the shrubs, herbs, vines, and young trees. The coverage of each quadrat was recorded, and the Simpson index and Shannon index were calculated to indicate the diversity of each quadrat. For the herbaceous layer in each quadrat, the name, height (cm), species coverage (%), and total vegetation coverage (%) were recorded. The quadrats were then classified according to mean coverage and randomly selected for the study. The space between all study plots was more than 10 m, and the average daily human flow of each quadrat was recorded by a regular researcher to reduce uncertainty. More detailed information can be found in Table 1.
2.3. Sample Collection and Measurement
2.3.1. Sample Collection and Pretreatment
From April to May 2021, five groups of 10 ∗ 10 m plots were selected according to the quadrate classification, and three plots were set to be repeated. Soil samples were collected by removing dead branches and leaves from the soil surface. Samples were collected from depths of 0–10 cm, 10–20 cm, and 20–30 cm; five different sampling plots and three soil depth levels were each set up with three replicates (n = 5 ∗ 3 ∗ 3). The samples were screened using a 2 mm mesh to remove gravel and animal and plant remains. Soil physical properties were determined using the ring knife method, and the soil samples were stored in sterile sealed bags. One sample was stored at −80 °C and sent to a biological company for the determination of soil bacteria 16S and fungi ITS, while the other sample was air-dried and screened for the determination of soil chemical properties.
2.3.2. Soil Physico-Chemical Analysis
Unless otherwise mentioned, all soil tests were carried out according to standard protocols. Soil compaction was measured using a soil compaction detector (JSD-A1). Other physical properties of the soil were determined using the ring knife method in accordance with LY/T1215-1999 “Measurement of physical properties of forest soil moisture”. Available potassium was extracted with 1 mol/L acetic acid and measured by flame photometry. Available phosphorus was extracted by the hydrochloric acid-sulfuric acid method, and ammonium and nitrate nitrogen were determined using a continuous flow analyzer/SAKLAR SAN++/S-011300110537. Microbial biomass carbon (MBC) and nitrogen (MBN) were measured by chloroform fumigation extraction, different treatments were analyzed using a TOC analyzer (TOC-L, Shimadzu, Japan), with a conversion factor of 0.45. Total carbon and nitrogen were determined by an elemental analyzer (vario MACRO cube-CNS) [22,23,24,25,26,27].
2.3.3. Diversity Detection of Soil Microorganisms
Soil DNA Extraction and PCR Amplification
Total DNA from 0.5 g of rhizosphere soil samples was extracted using FastDNA® Spin Kit for Soil (MP Biomedicals, U.S). The DNA extract was checked on 1% agarose gel, and DNA concentration and purity were determined with NanoDrop 2000 UV-vis spectrophotometer (Thermo Scientific, Wilmington, USA). Bacteria 16S rRNA was subjected to PCR amplification using 338F (5′-ACTCCTACGGGAGGCAGCAG-3′) and 806R (5′-GGACTACHVGGGTWTCTAAT-3′) primers for 16S V3–V4 variable region [28]. Fungus ITS was subjected to PCR amplification using ITS1F (5′-CTTGGTCATTTAGAGGAAGTAA-3′) and ITS2R (5′-GCTGCGTTCTTCATCGATGC-3′) primers for ITS1 regions [29].
Illumina Miseq Sequencing
PCR was performed using TransGen AP221-02: TransStart Fastpfu DNA Polymerase, and the PCR instrument used was the ABI GeneAmp® 9700. All samples were tested under formal experimental conditions, with three replicates for each sample. The PCR products of the same sample were mixed and detected by 2% agarose gel electrophoresis. The PCR products were recovered by gel extraction using the AxyPrep DNA Gel Recovery Kit (AXYGEN) and eluted in Tris_HCl. The PCR products were then subjected to 2% agarose gel electrophoresis and quantified using the QuantiFluor™-ST Blue Fluorescence Quantitation System (Promega Corporation, Madison, WI, USA), according to the preliminary electrophoresis results. The Illumina adapter sequences were added to the ends of the target region by PCR using the TruSeqTM DNA Sample Prep Kit. After denaturation and annealing, the other end of the DNA fragment on the chip randomly complemented another primer nearby, and PE reads were obtained by Illumina sequencing.
2.4. Statistical Analyses
Herbaceous species diversity and species richness were calculated by the following formula:
where S is the number of species in the community;
Simpson index DS = 1 − ∑Pi2,
Shannon–Wiener index H = −∑PilnPi,
Gleason DG = S/lnA
Shannon–Wiener index H = −∑PilnPi,
Gleason DG = S/lnA
A is community area;
N is the number of individual species in the community;
Pi = ni/Ni represents the number of individuals of the ith species as a proportion of the number of individuals of all species.
ANOVA and multiple means comparisons of soil physical and chemical properties, MBC, and MBN indicators were performed using Excel 2019 (Microsoft Corporation, Redmond, WA, USA) and SPSS 20.0 (IBM Corporation, Armonk, NY, USA). ANOVA analysis was conducted using Origin 2023. FUNGuild was used to obtain the functional classification of fungi in the samples and the abundance information of each functional classification. Community composition analysis was performed using the “ggplot2” package in R, based on the sequence number of each microorganism in the sample, i.e., the microorganism’s relative abundance; heatmap of the community was performed using the “vegan” package in R. Correlation analysis was performed using the “linkET” package in R. Structural equation model (SEM) with AMOS 21.0 (AMOS Development Corporation, Chicago, IL, USA) was used to evaluate the direct and indirect relationships between soil physicochemical indicators and microbial diversity indices. SEMs for both fungi and bacteria were evaluated.
3. Results
3.1. Soil Microbial Biomass Carbon and Nitrogen in Different Trampling Disturbances and Different Soil Depths
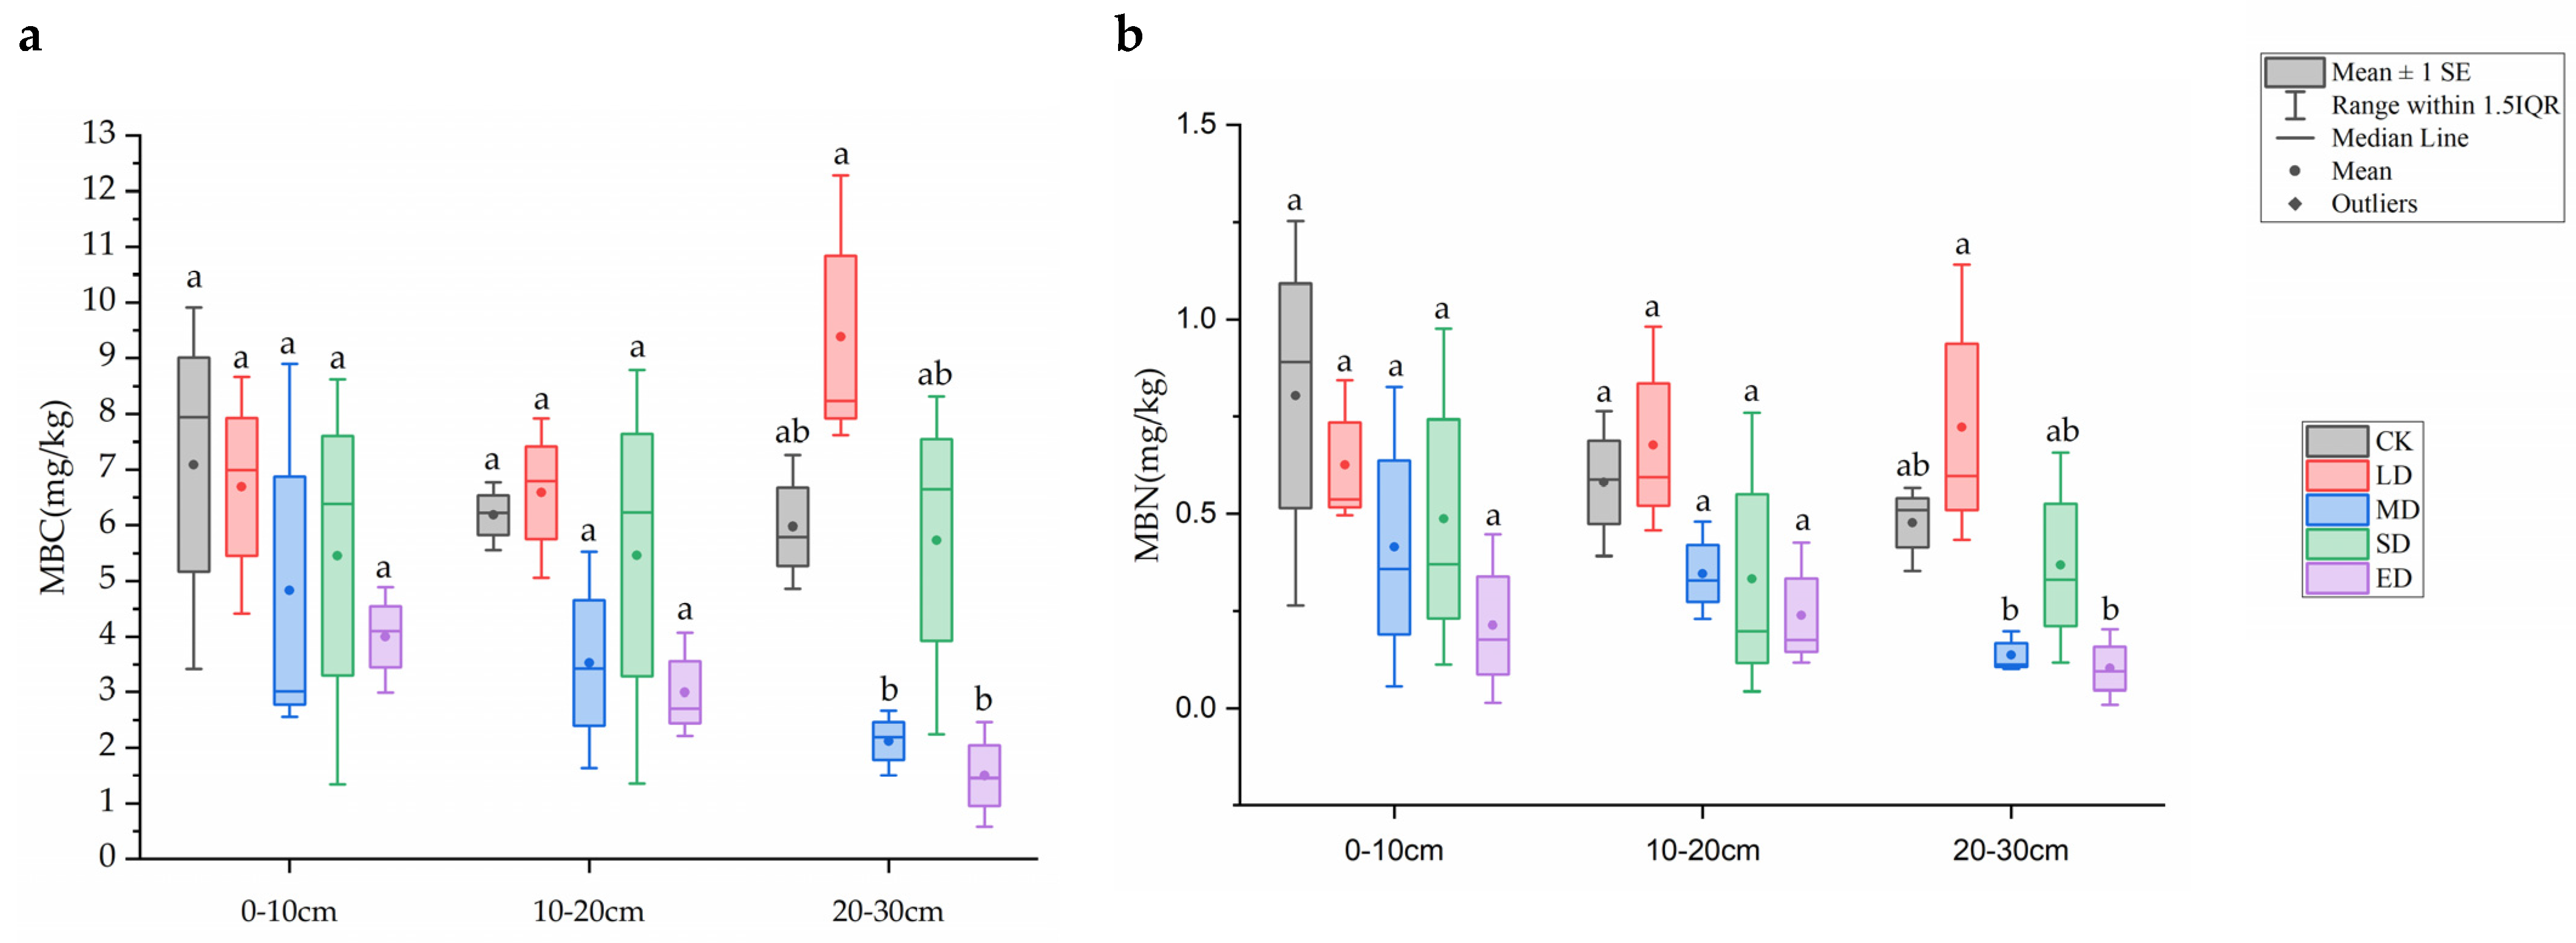
It can be seen in Figure 1, as trampling disturbance increased, MBC and MBN in the 0–10 cm soil layer showed a trend of first decreasing, then increasing, and then decreasing again. In both the 10–20 cm and 20–30 cm soil layers, the light disturbance (LD) treatment was higher than the other treatment groups in the same layer. In each soil layer, the extreme disturbance (ED) treatment was lower than the other treatment groups in the same layer. Specifically, in the 20–30 cm soil layer, MBC and MBN in the extreme disturbance treatment (ED) were significantly lower than those in the control group (CK) (p < 0.05).
3.2. Microbial Community Composition under Different Trampling Disturbances and Soil Depths
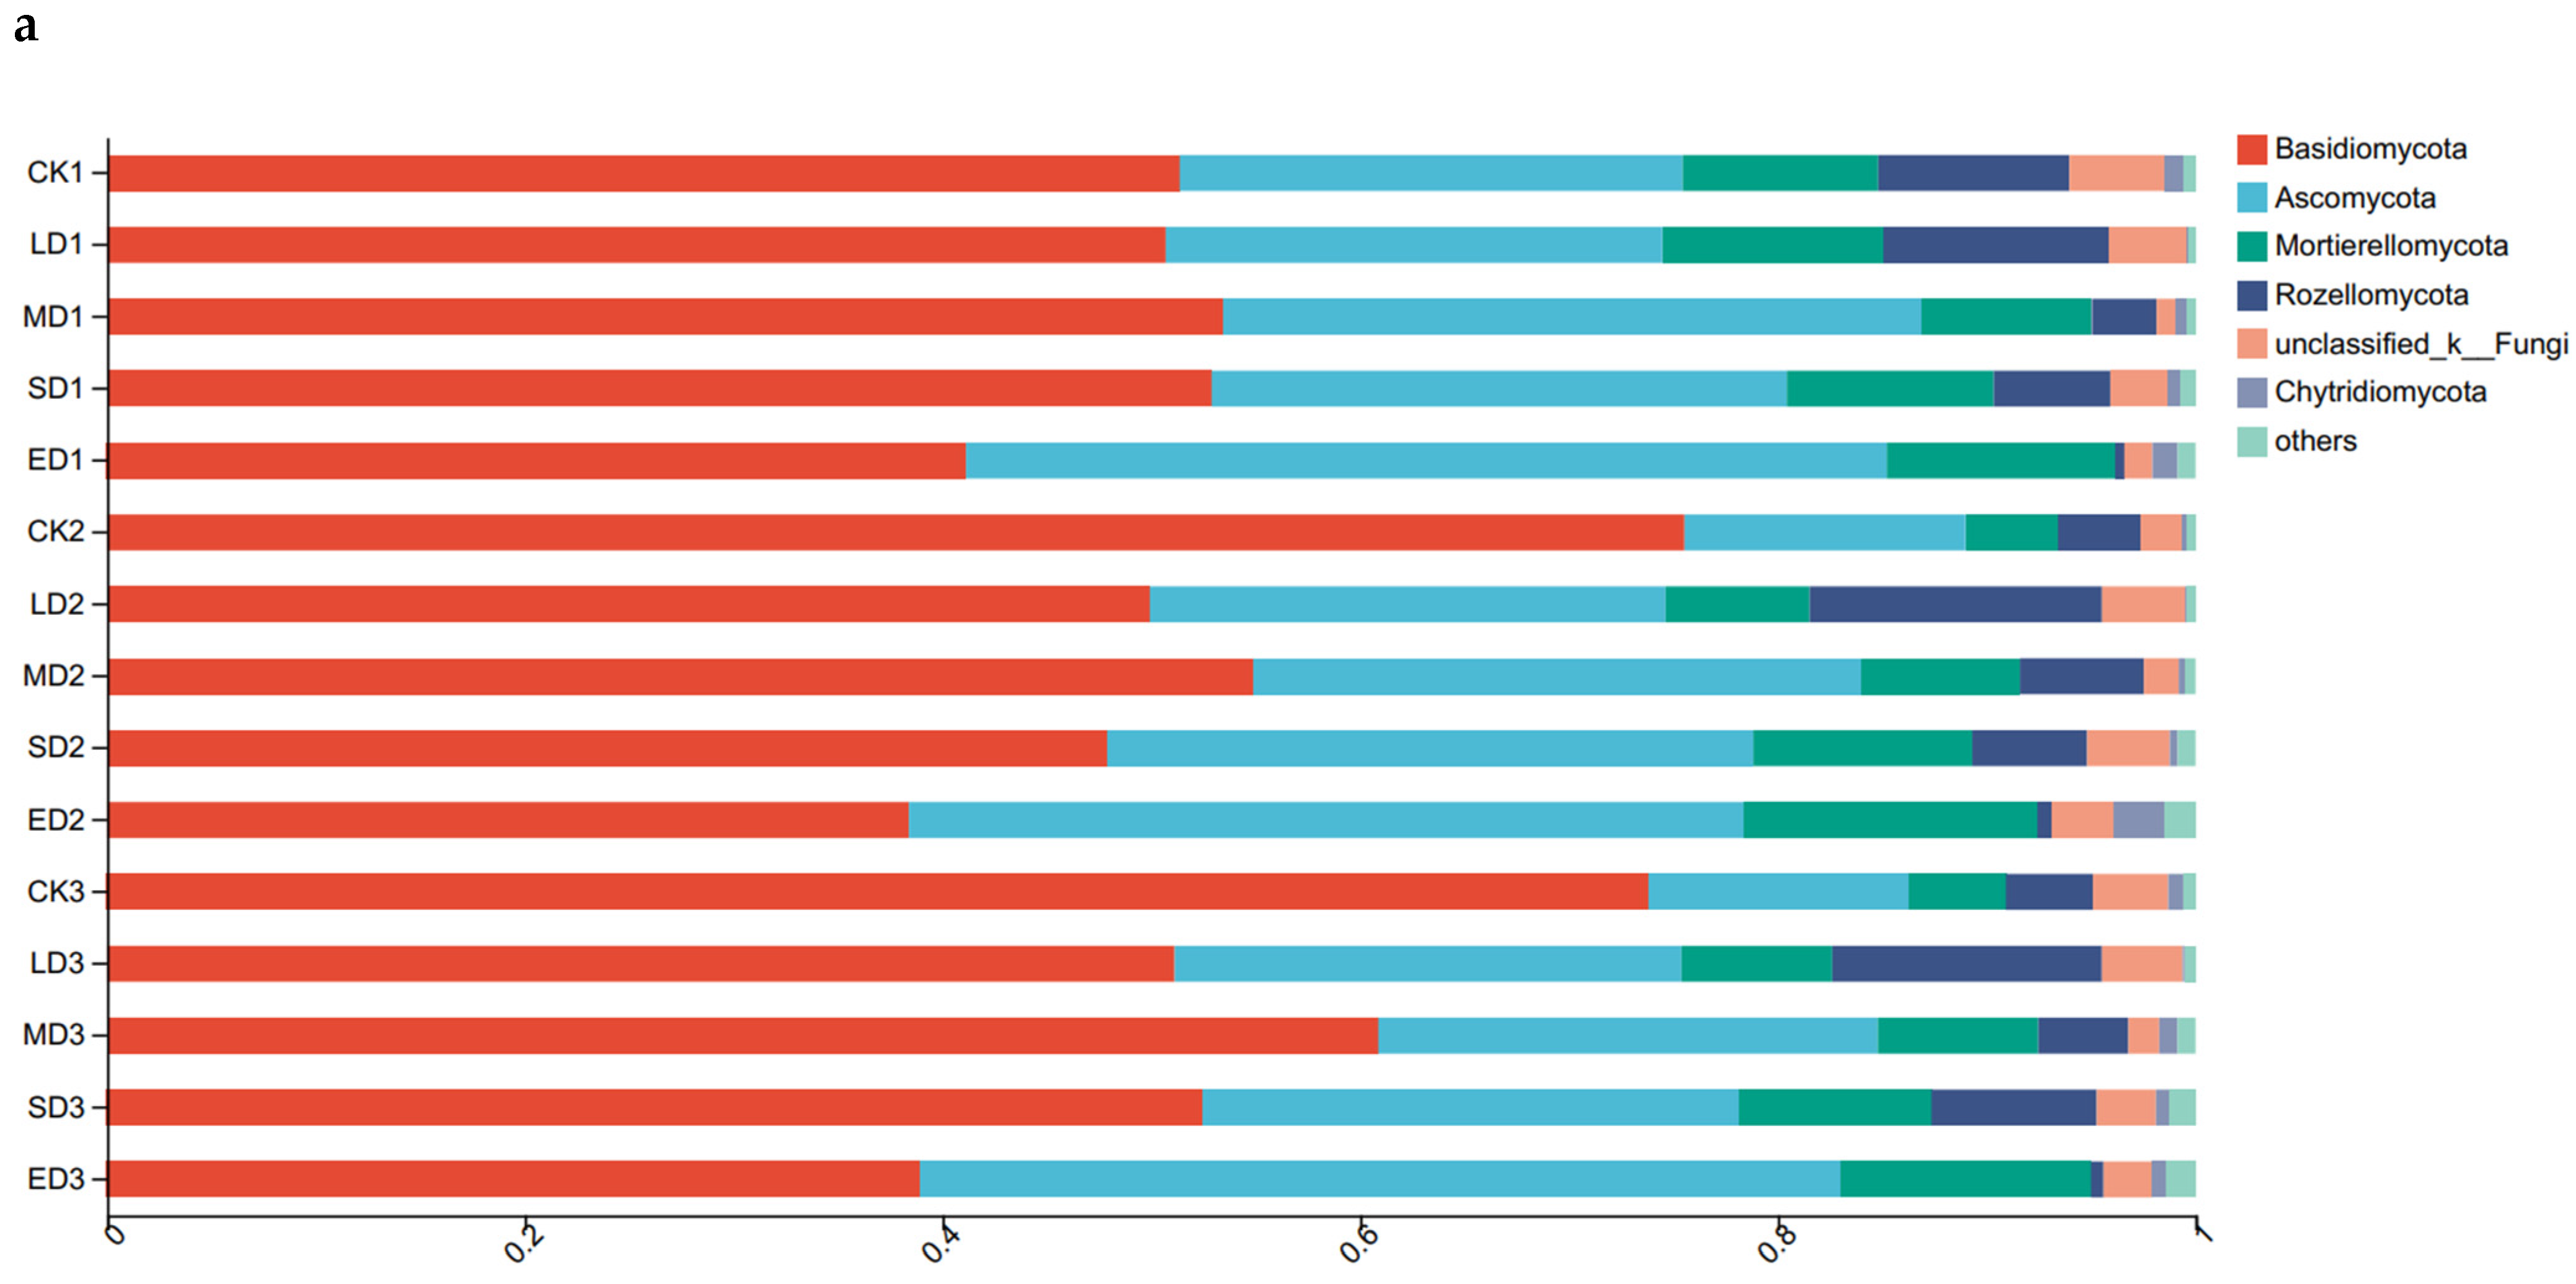
The fungal community composition at different trampling disturbances and soil depths was examined using column diagram analysis (Figure 2a). Basidiomycota and Ascomycota were the dominant groups of fungi in the soil, followed by Mortierellomycota and Rozellomycota. In all soil layers, Basidiomycota showed a clear decrease in relative abundance with increasing trampling intensity, while Ascomycota exhibited a clear increase. The relative abundance of Mortierellaomycota increased correspondingly. Rozellomycota displayed a trend of initially increasing and then decreasing, with the highest values in light disturbance (LD). Chytridiomycota exhibited the highest relative abundance under extreme disturbance (ED) in the 0–10 cm and 10–20 cm soil layers, but did not show a clear change at 20–30 cm. An increase of relative abundance in Basidiomycota was visible between CK1 and both CK2 and CK3, but not between CK2 and CK3. Moreover, Ascomycota exhibited the opposite behavior as it decreased, as can be seen in Figure 2. Soil depth did not exhibit regular changes in the other trampling treatments.
Based on the results of the column diagram analysis of the bacterial community, the composition of the community structure at the phylum level under different trampling disturbances and soil depths can be determined (Figure 2b). The samples soil contained four major bacterial groups, namely Chloroflexi, Actinobacteriota, Proteobacteria, and Acidobacteriota. There were similar trends of Actinobacteria in the 0–10 cm and 10–20 cm soil layers, showing an initial increase and subsequent decrease in response to different trampling disturbances, with the highest relative abundance in the light disturbance (LD). In contrast, the highest relative abundance in the 20–30 cm soil layer was observed in the extreme disturbance (ED) treatment. Proteobacteria showed no regular change, but extreme disturbance (ED) had lower relative abundance than CK. In all three soil layers, the relative abundance of Proteobacteria was clearly higher in extreme disturbance (ED), medium disturbance (MD), and severe disturbance (SD) treatments compared to the same soil layer of CK. Acidobacteriota showed no apparent change, with CK having a higher relative abundance than other trampling treatments.
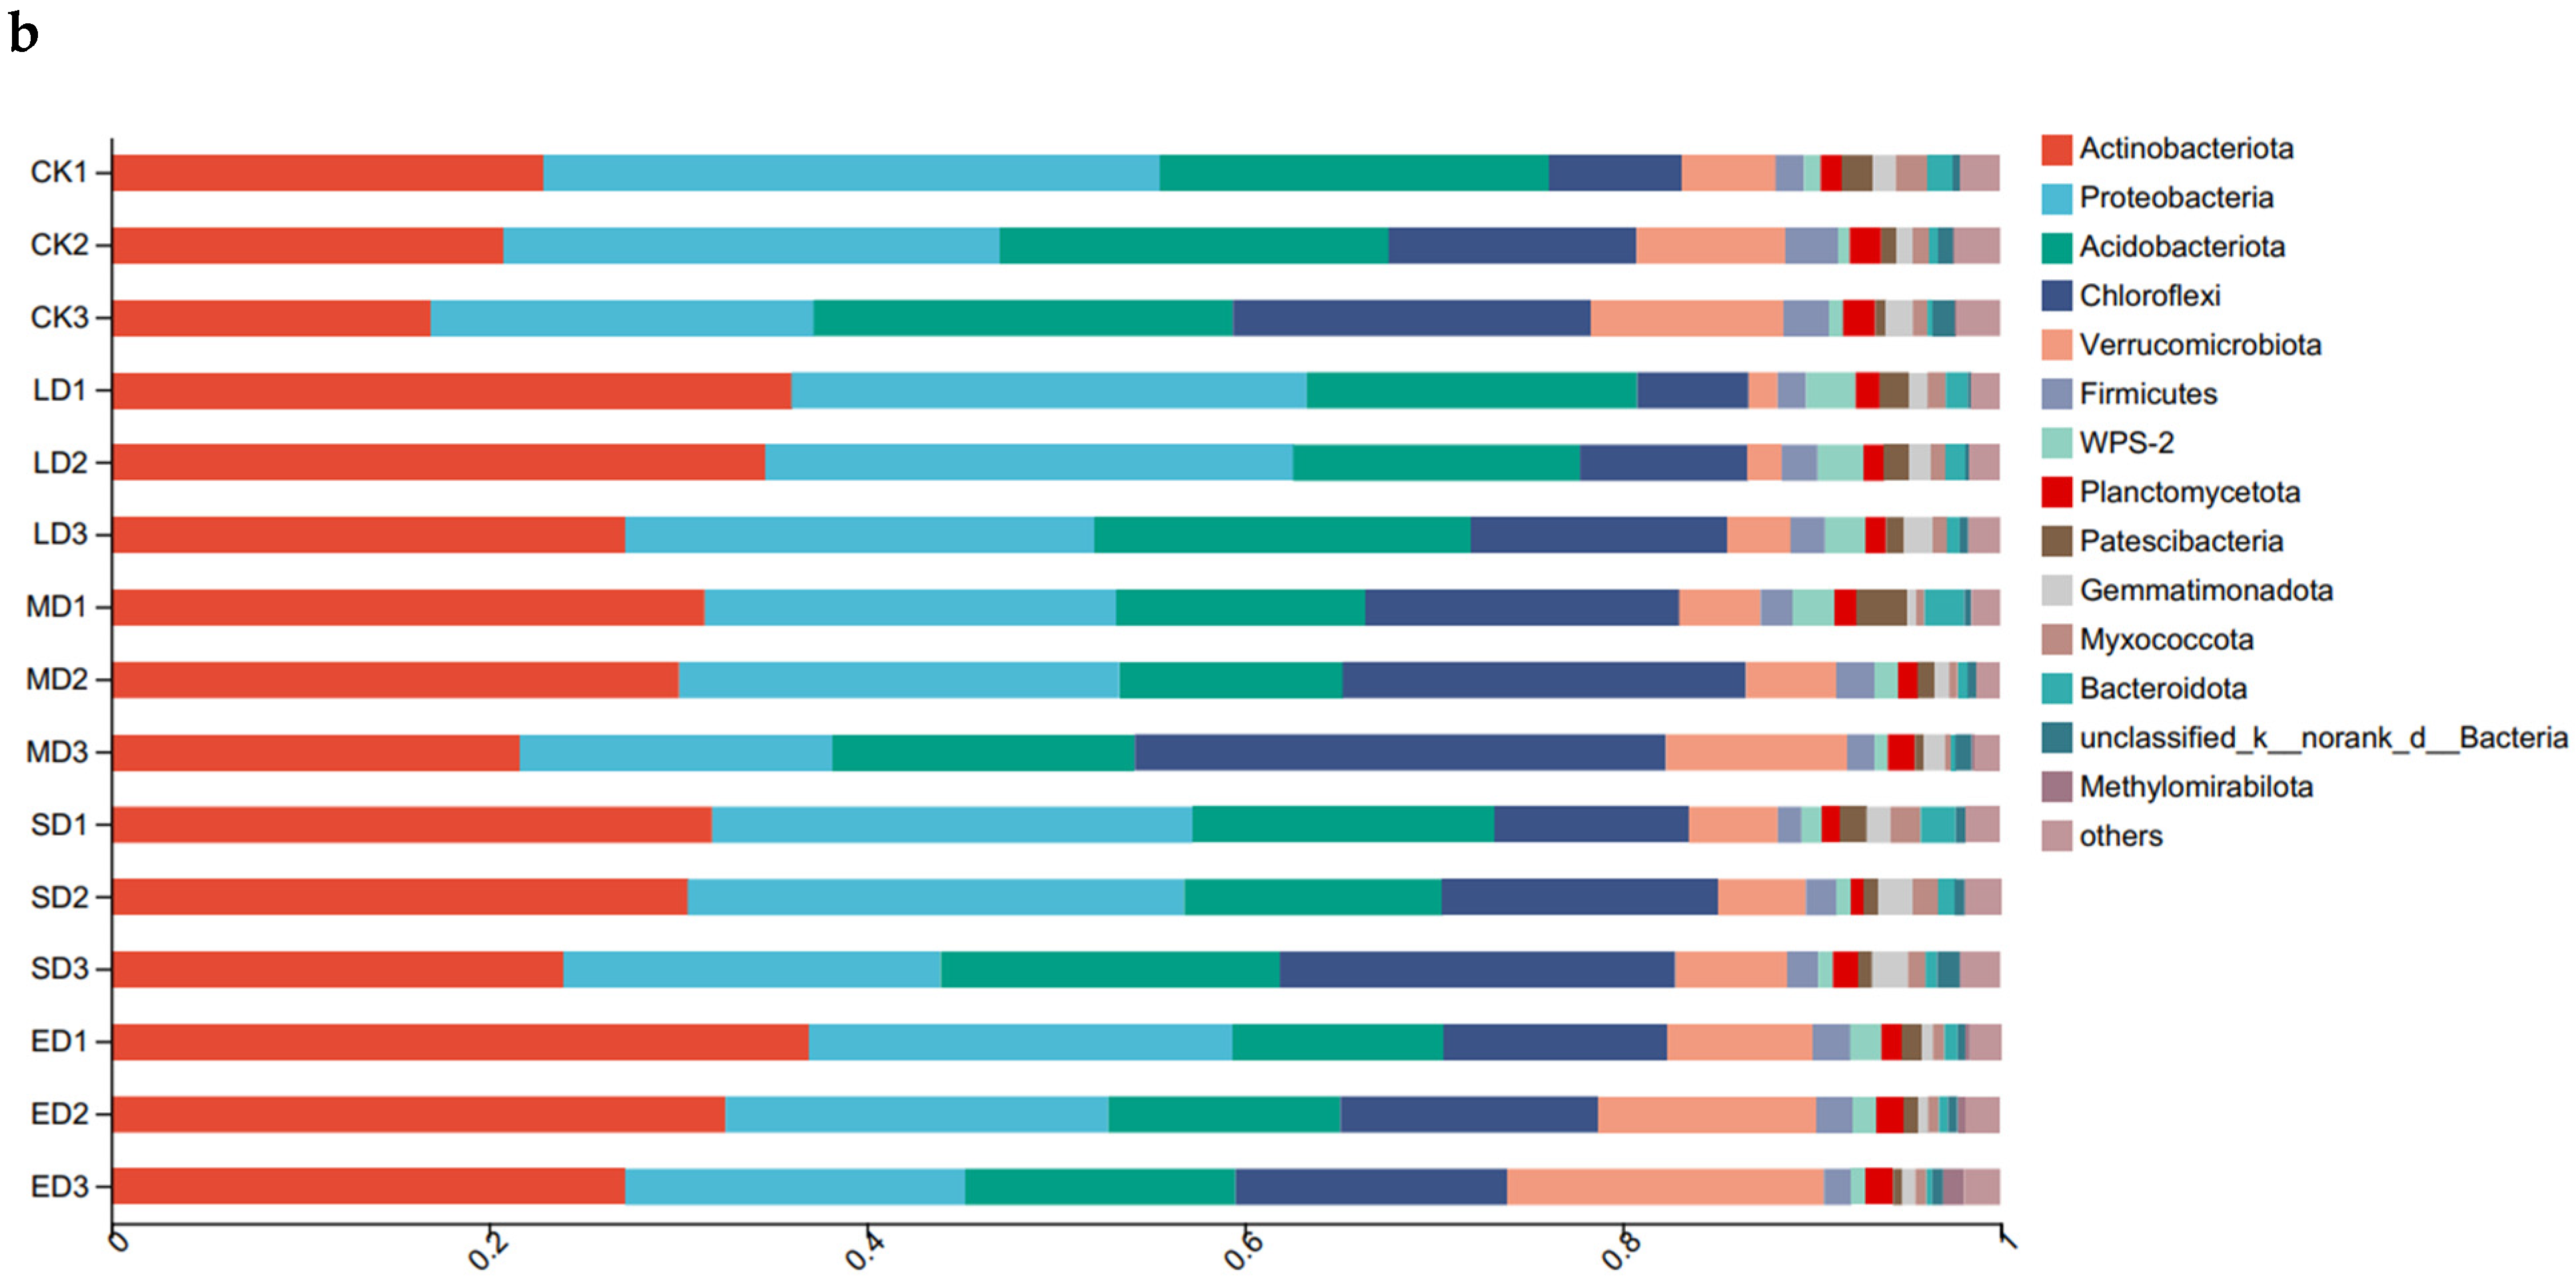
FUNGuild was used to obtain the functional classification of fungi in the samples and the abundance information of each functional classification in different trampling disturbances. As shown in Figure 3a, as trampling intensity increased, there was a clear decrease in the relative abundance of Ectomycorrhizal in the soil. Specifically, the relative abundance of Ectomycorrhizal in the severe disturbance (SD) and extreme disturbance (ED) treatment groups decreased several times in comparison to the CK treatment group. Moreover, the Ectomycorrhizal-Orchid Mycorrhizal-Root Associated Biotroph was only detected in the CK control group.
As trampling intensity increases, there is a notable increase in the relative abundances of Endophyte-Litter saprotroph, Soil saprotroph, Undefined Saprotroph, Plant Pathogen, Animal Pathogen, and Animal Pathogen-Plant Pathogen-Undefined Saprotroph, with the highest abundance observed in the extreme disturbance (ED) treatment group. The relative abundances of Ectomycorrhizal-Undefined Saprotroph, Plant Pathogen-Wood Saprotroph, Fungal Parasite-Undefined Saprotroph, and Soil Saprotroph were found to be highest in the severe disturbance (SD) treatment group. Specifically, the relative abundance of Animal Pathogen clearly increased in the medium disturbance (MD), severe disturbance (SD), and extreme disturbance (ED) treatment groups when compared to the CK control group. In the extreme disturbance (ED) treatment group, the relative abundance of Plant Pathogen was significantly higher than that in other treatment groups, and Wood Saprotroph was higher in the light disturbance (LD) and medium disturbance (MD) treatment groups when compared to other groups.
As shown in Figure 3b, COG functional annotation of OTU is carried out to obtain annotation information of OTU at COG functional level and abundance information of each function in different samples. The species and abundance of bacterial function showed little change in all trampling treatment groups.
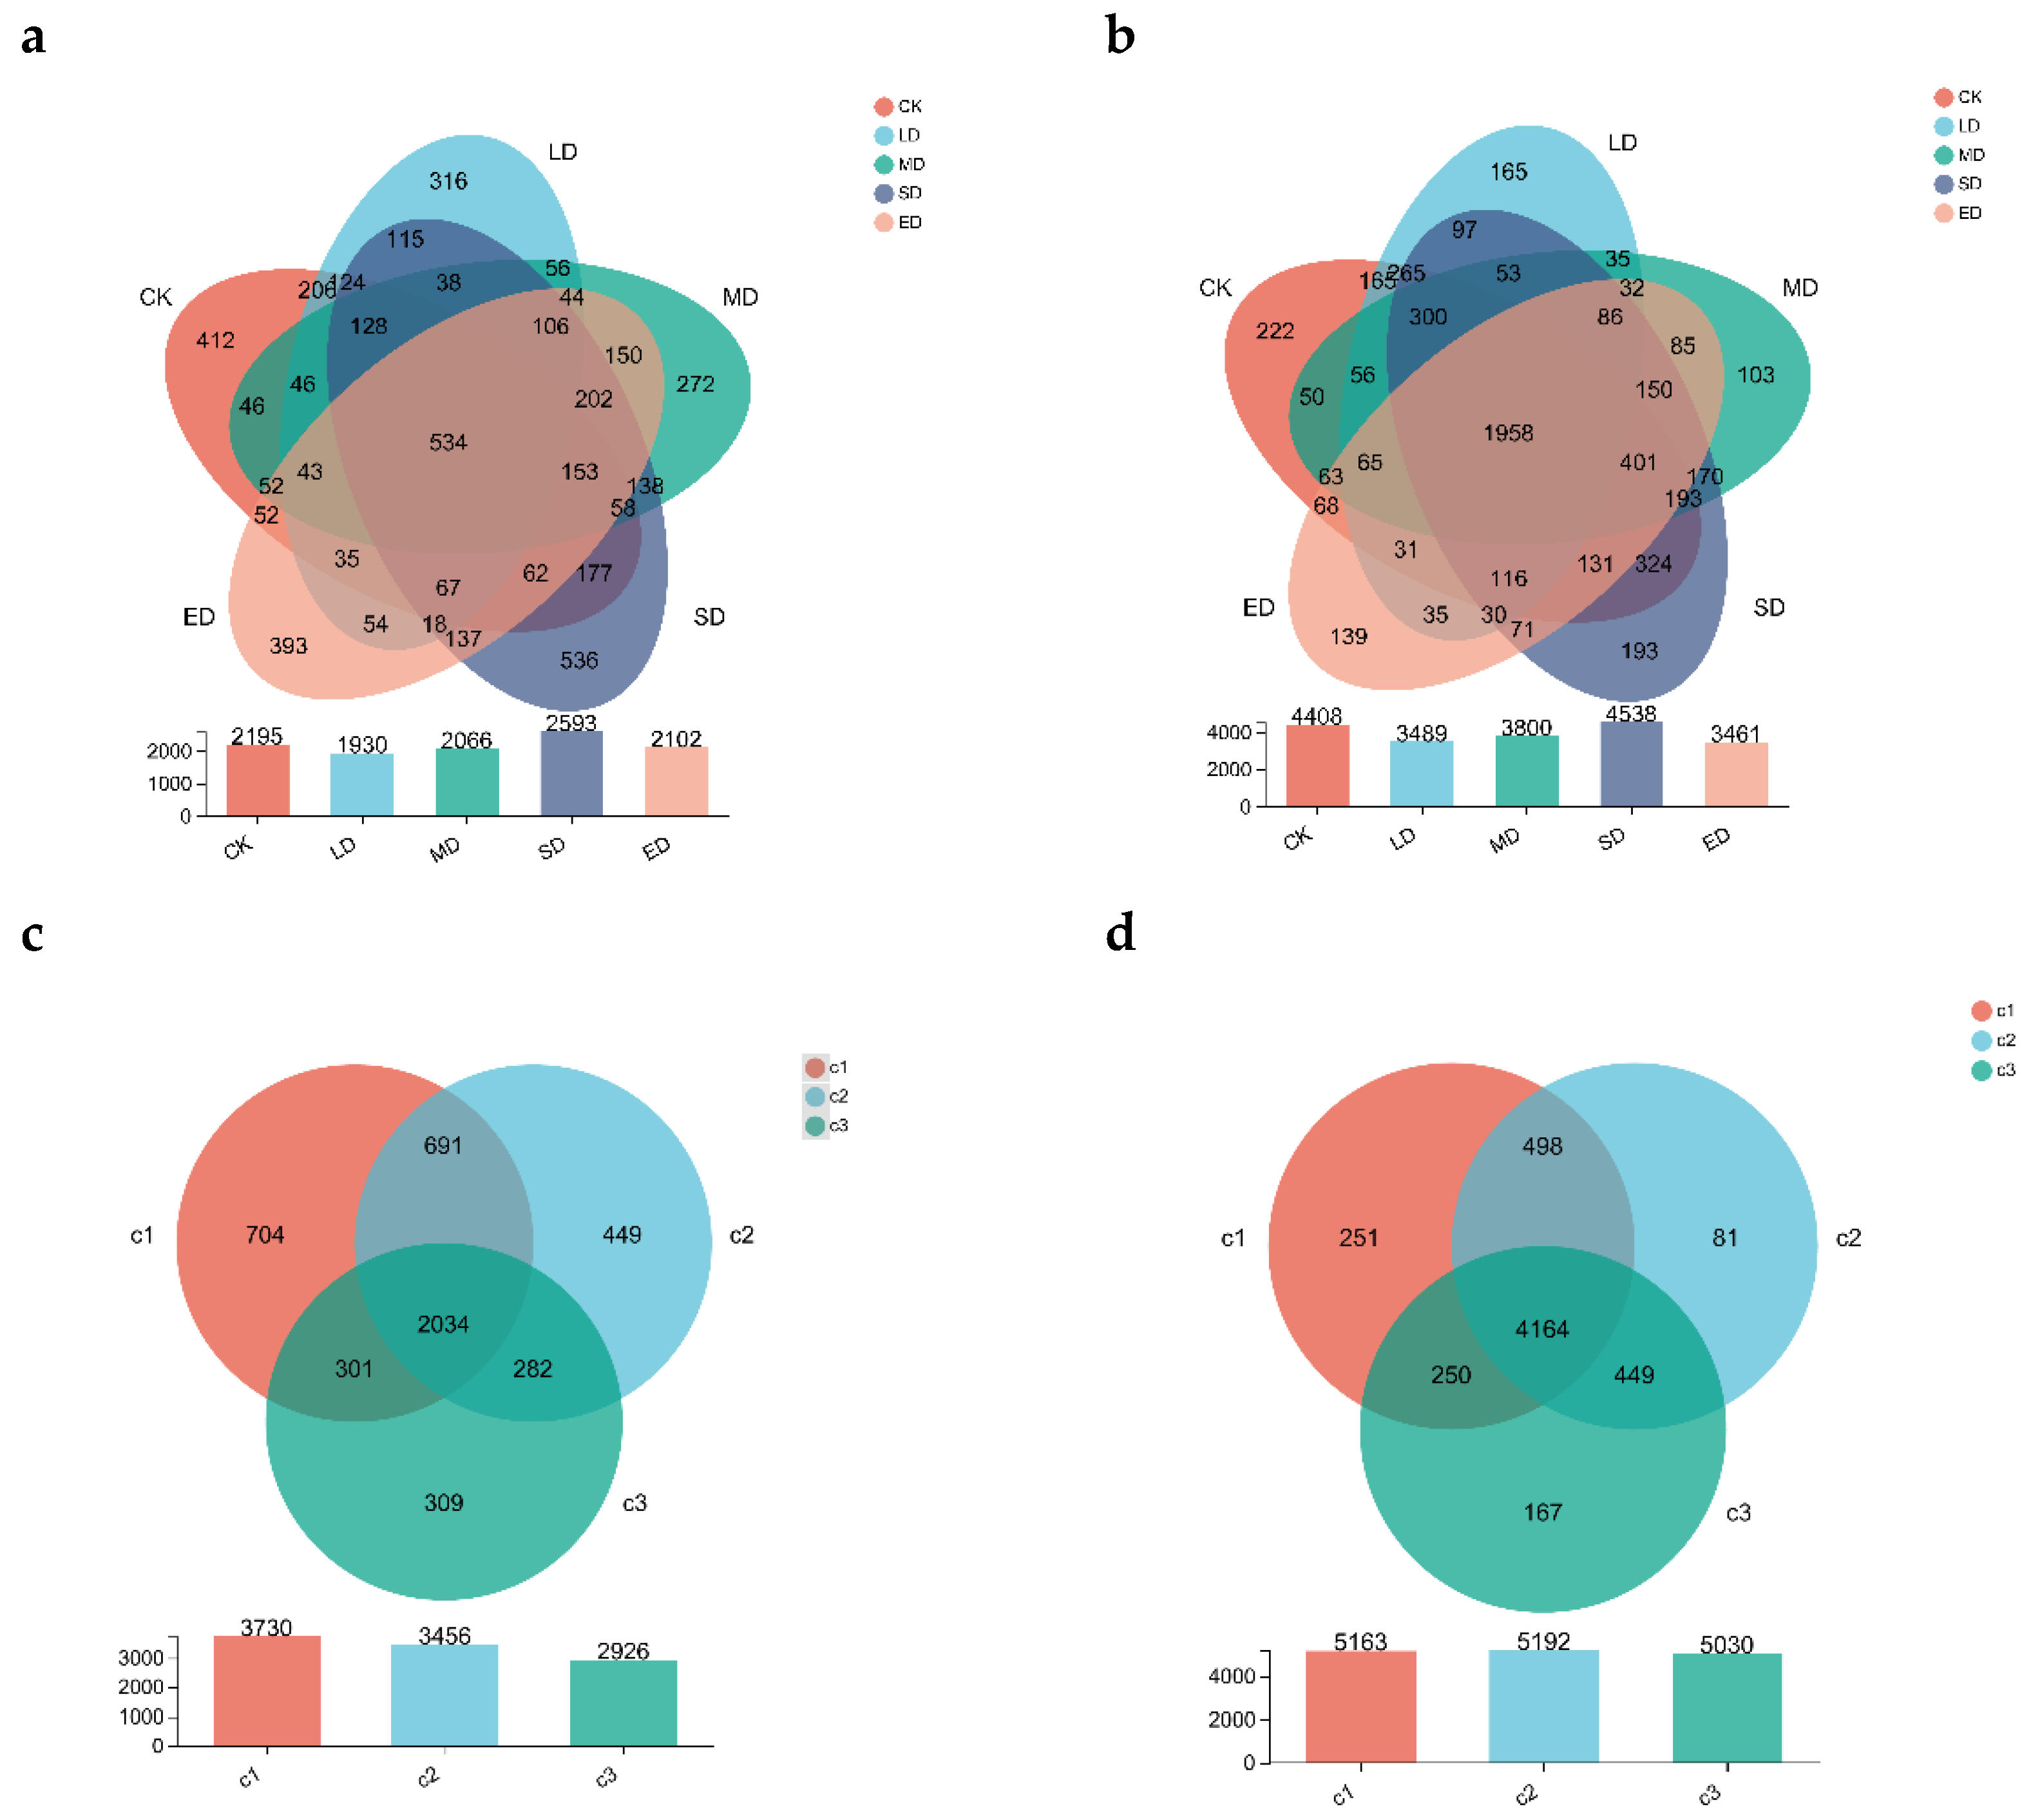
A Venn diagram (Figure 4) was used to visually illustrate the similarities and variations in the composition of OTUs in different trampling intensities based on overlapping and non-overlapping regions. As shown in Figure 4a, the number of fungal OTUs in the CK, LD, MD, SD, and ED soil were 2195, 1930, 2066, 2593, and 2102, respectively, with severe disturbance (SD) exhibiting the highest number. The number of OTUs in the five regions was 412, 316, 272, 536, and 393, respectively, with severe disturbance (SD) again having the highest number, totaling 534 across all five regions. Figure 4c indicates that the number of fungal OTUs in the 0–10 cm, 10–20 cm, and 20–30 cm soil depths were 3730, 3456, and 2926, respectively, with the highest number in the 0–10 cm soil depth. The number of unique fungal OTUs was 704, 449, and 309, respectively, with the highest being 2034 in the 0–10 cm soil layer.
In Figure 4b, the number of bacterial OTUs in the CK, LD, MD, SD, and ED soil were 4408, 3489, 3800, 4538, and 3461, respectively, with the highest in severe disturbance (SD). The specific bacterial OTUs were 222, 165, 103, 193, and 139, respectively, with the highest being observed in CK, followed by severe disturbance (SD). Furthermore, Figure 4d illustrates that the number of bacterial OTUs in the 0–10 cm, 10–20 cm, and 20–30 cm soil depths were 5163, 5192, and 5030, respectively. The specific bacterial OTUs were 251, 81, and 167, respectively. The severe disturbance (SD) treatment group exhibited the highest number of OTUs for both fungi and bacteria. In all treatment groups, the 0–10 cm soil layer had the highest number of OTUs.
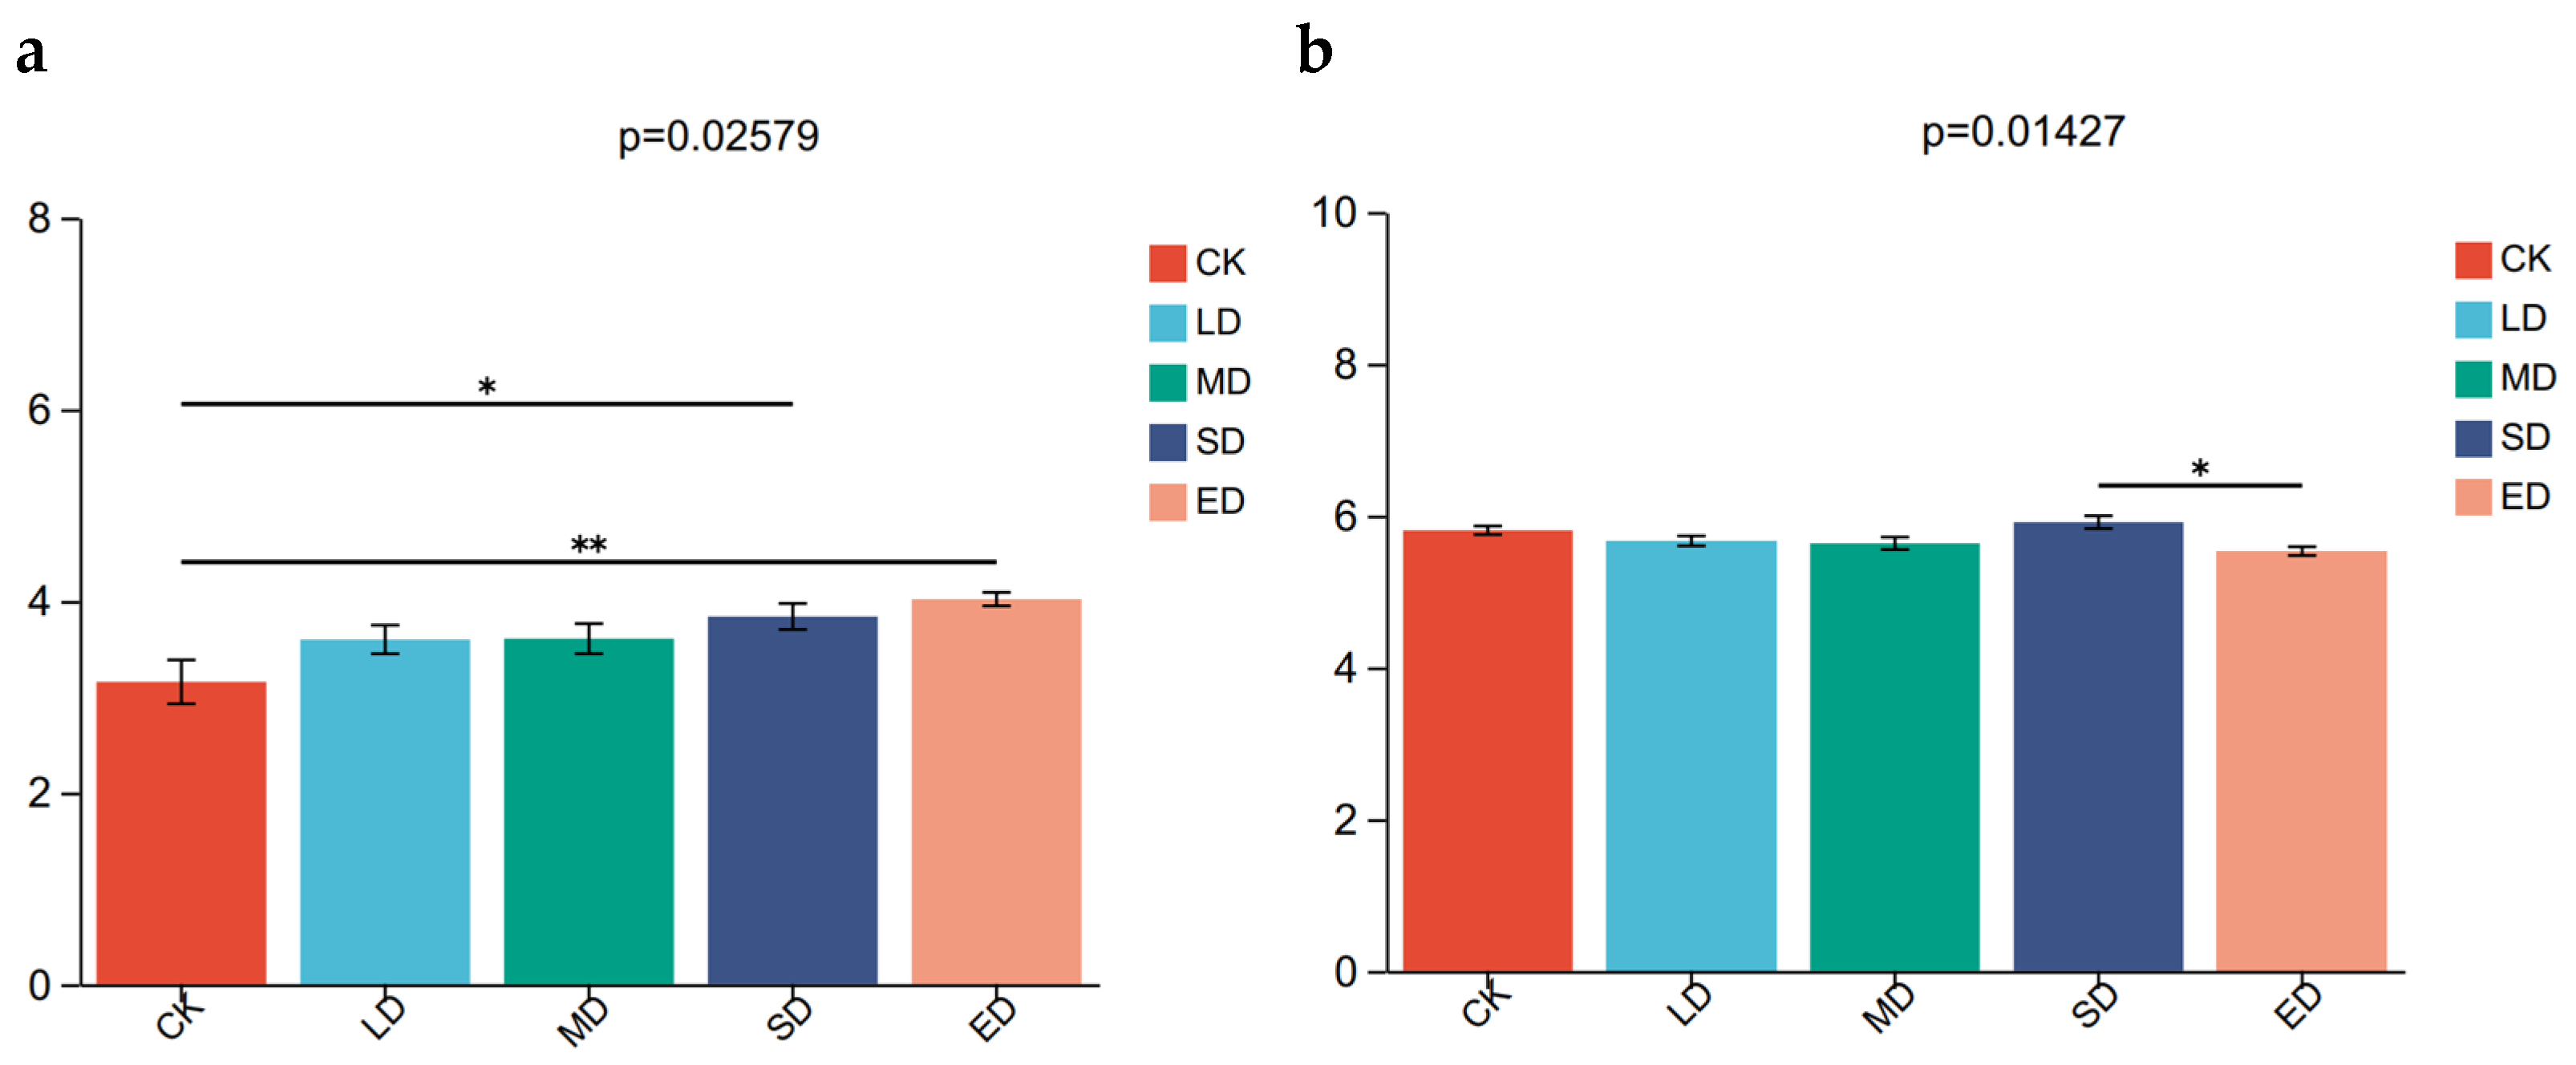
Alpha diversity is a measure of the microbial community’s richness and diversity. In this study, four different estimators were used to evaluate the alpha diversity of microbial communities in different stampede intensity areas. According to Figure 5, the results showed that alpha diversity increased with the increase of stampede intensity. The Shannon index of OTU level fungi indicating a significant higher diversity in extreme disturbance (ED) than in CK. As is shown in Table 2, the Simpson index was lowest in extreme disturbance (ED) compared to other treatment groups, indicating less dominance of a single species. The Chao estimator suggested that the number of unique species in the microbial community was highest in the severe disturbance (SD) treatment group. These findings suggest that trampling disturbance has not significantly impact on the alpha diversity of microbial communities.
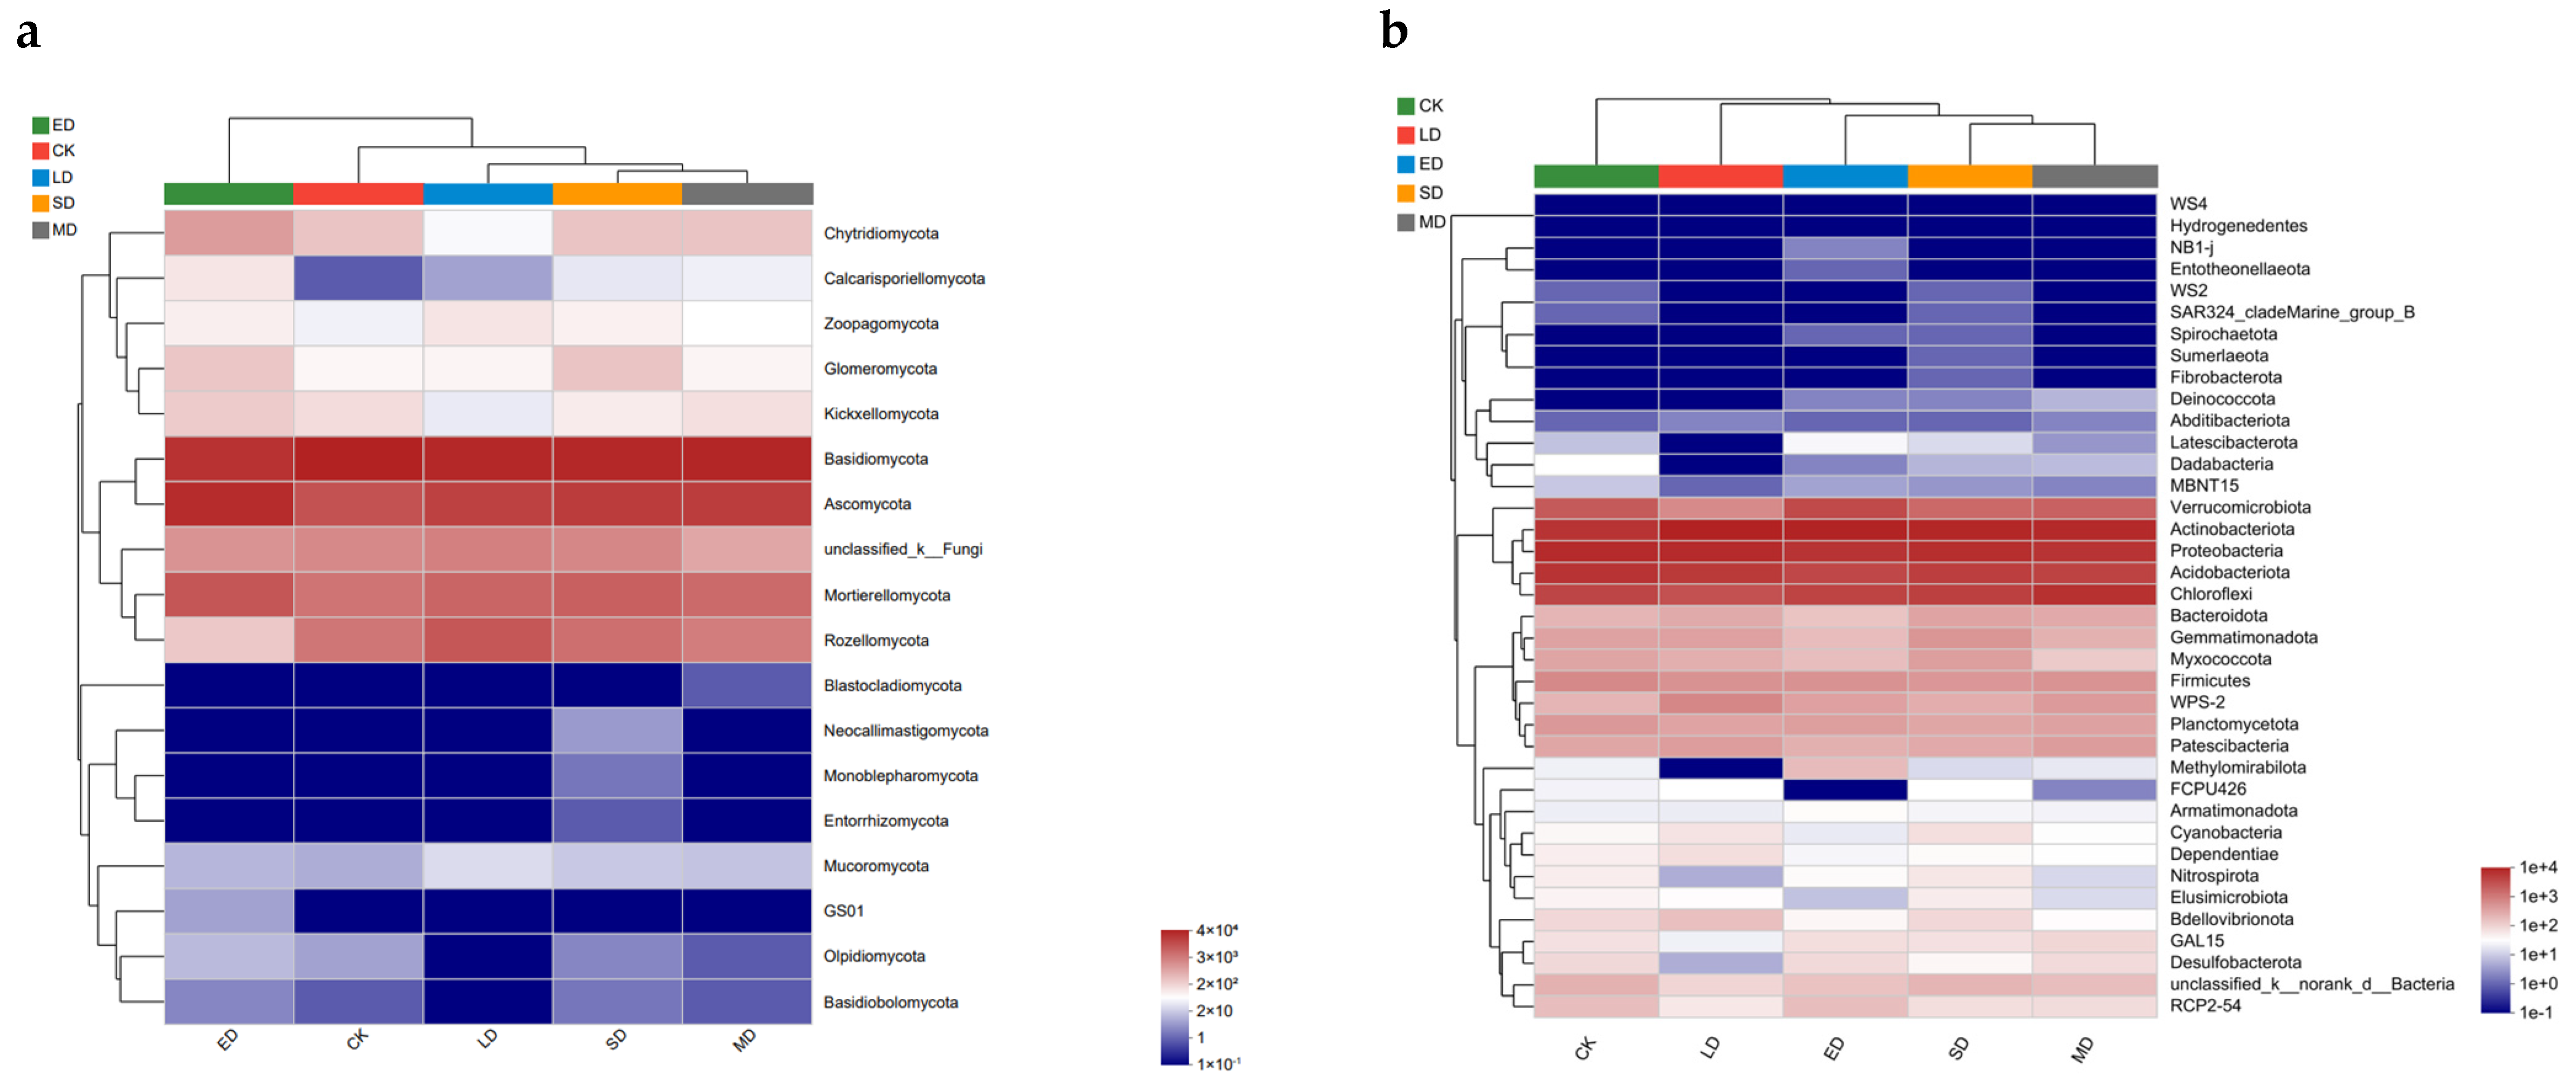
Heatmaps are usually clustered according to the similarity of abundance between samples, and the similarity and difference of community composition at the phylum level can be seen. Based on the provided Figure 6a, it is evident that, at the phylum level, the soil in the extreme disturbance (ED) exhibited the most significant (p < 0.05) variation in fungal species and abundance compared to other trampling treatments. A gradual change in fungal abundance and diversity was observed with an increase in trampling disturbance; however, a qualitative shift was detected after surpassing a certain threshold, which was observed when trampling disturbance reached extreme disturbance (ED). Sample clustering analysis revealed a far clustering relationship between extreme disturbance (ED) and CK as well as other treatment groups. Additionally, as illustrated in Figure 6b, at the phylum level, the sample clustering analysis demonstrated a far clustering relationship between each trampling treatment group and CK, indicating that each level of trampling can induce changes in bacterial species and abundance in soil, with a high degree of similarity between trampling levels.
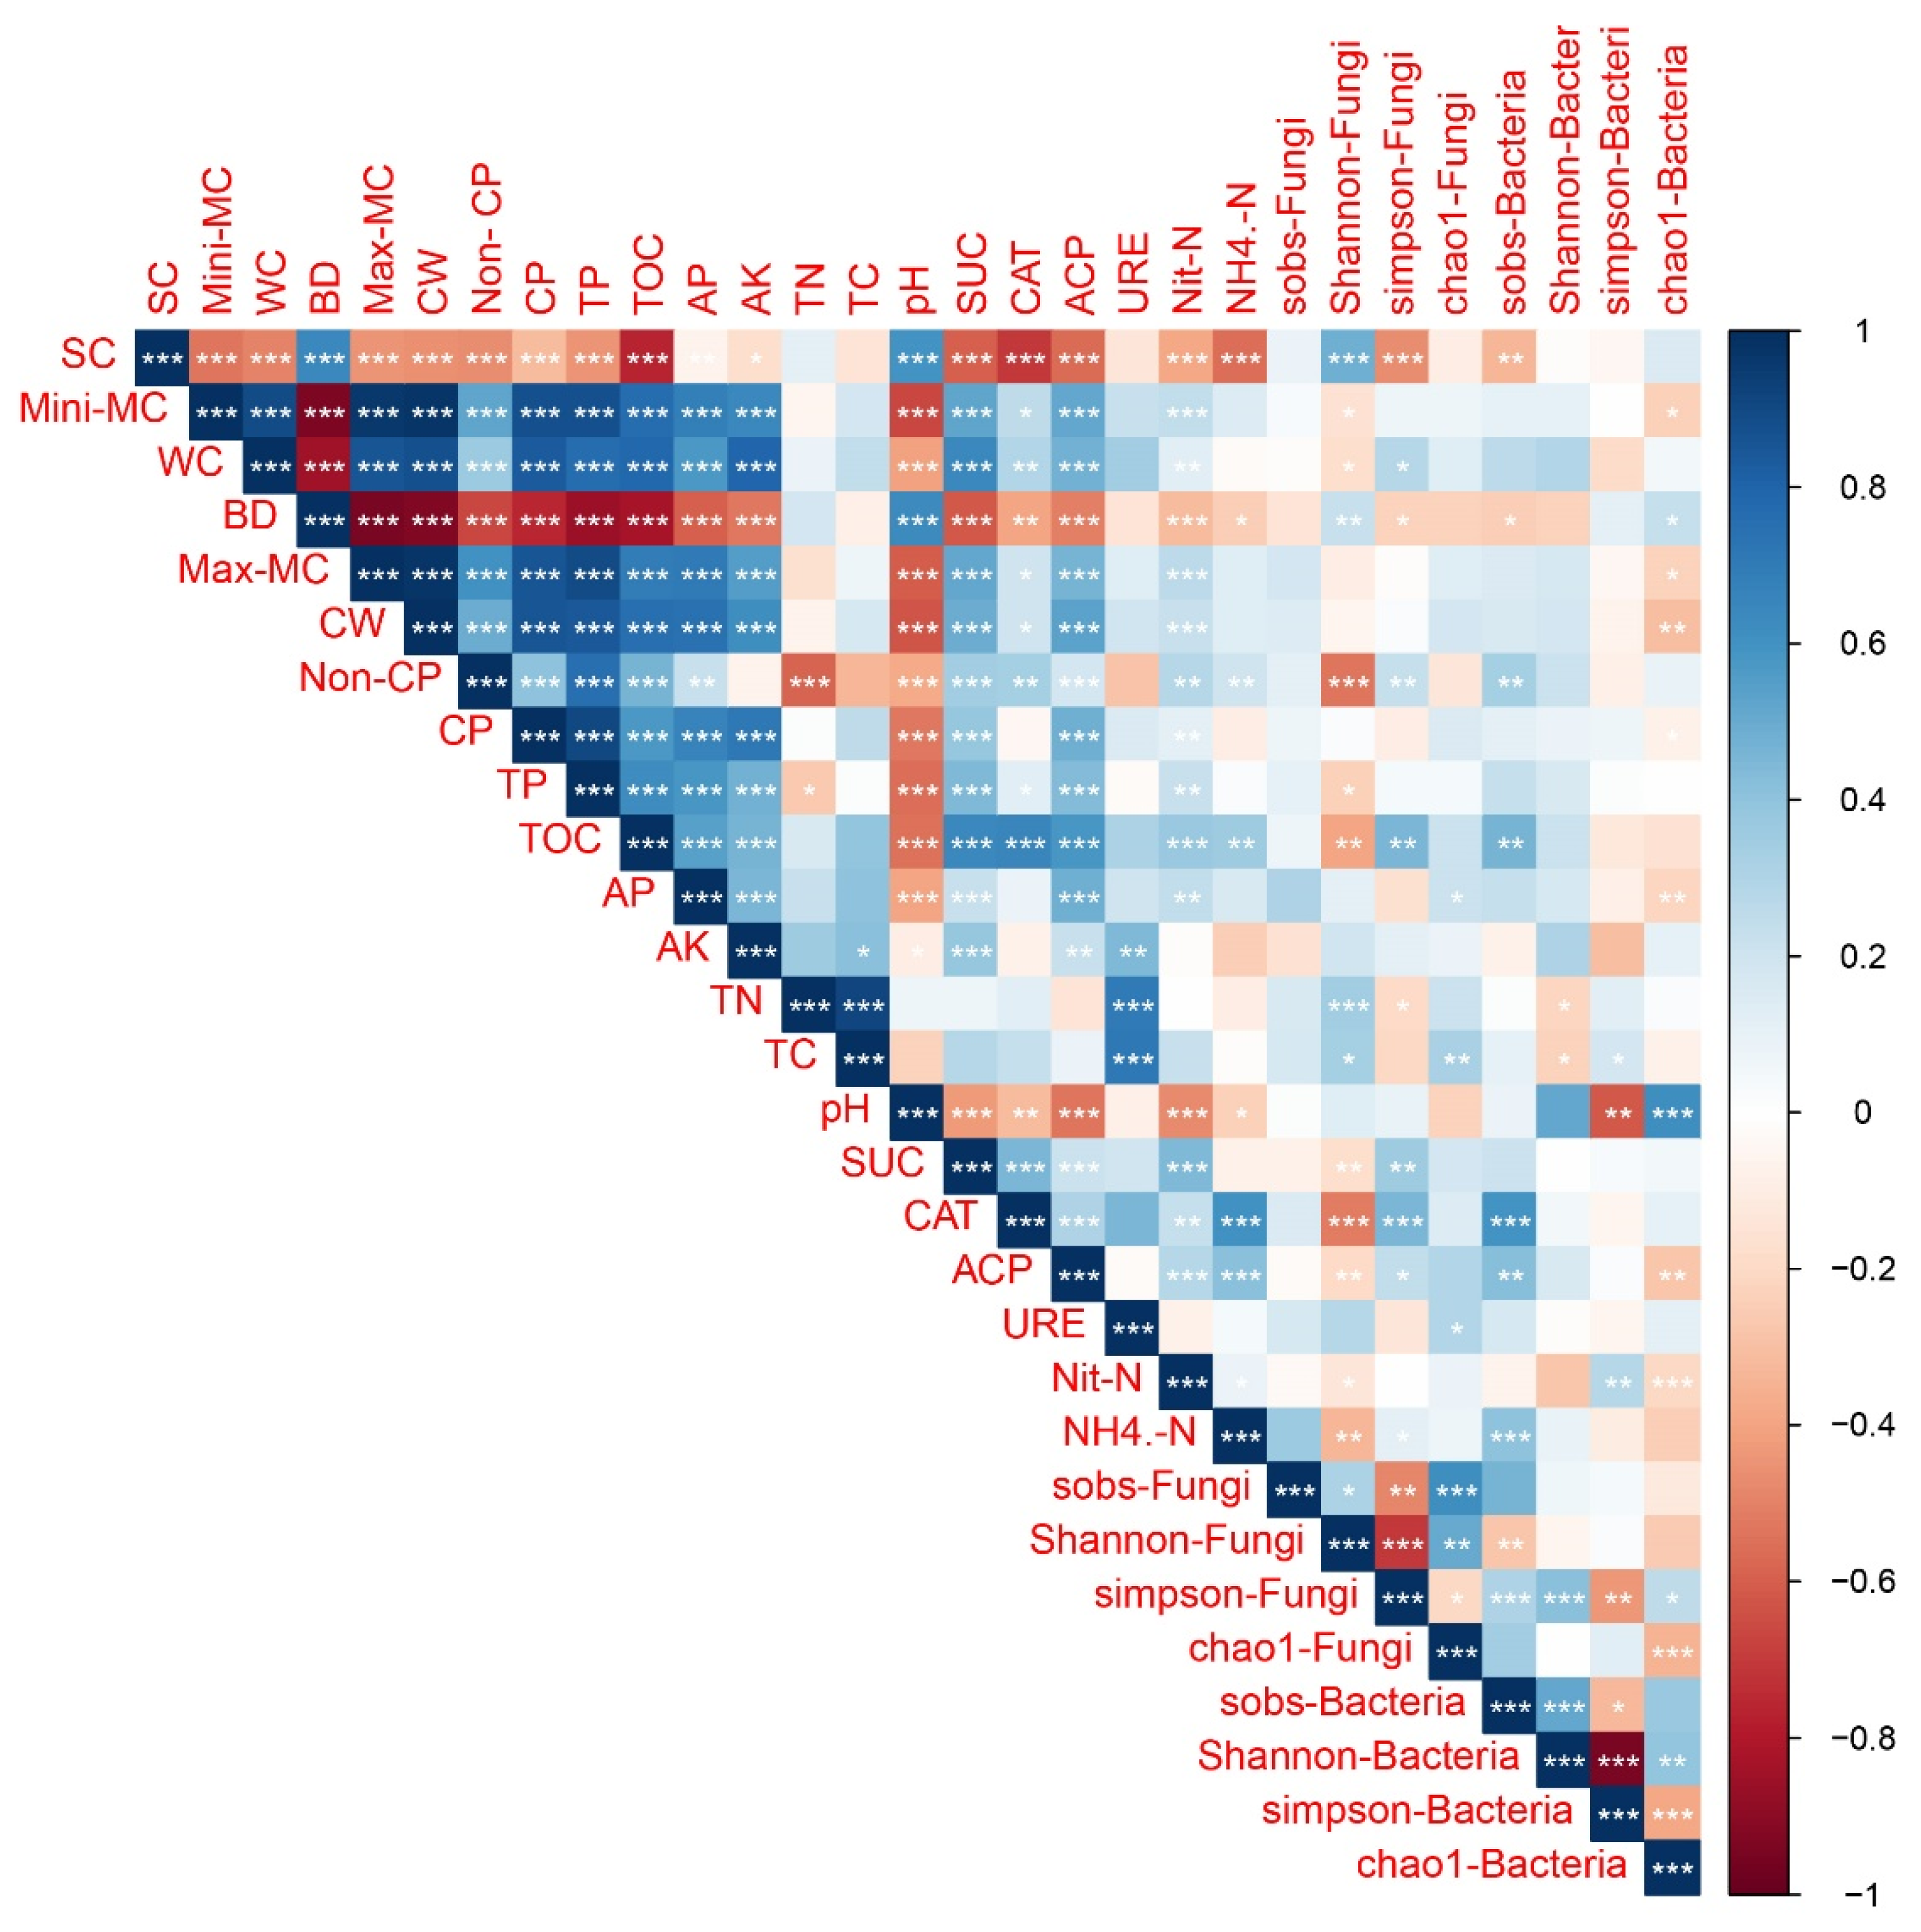
The relationship between soil physicochemical properties and soil biological activity can be inferred from Figure 7. The Simpson-Fungi index showed significant positive correlations with non-capillary (Non-CP), organic carbon (TOC), and catalase activity (CAT), while a significant negative correlation was observed with soil compaction (SC). For the Sobs-Bacteria index, significant positive associations were found with non-capillary (Non-CP), organic carbon (TOC), catalase activity (CAT), acid phosphatase activity (ACP), and ammonium nitrogen (NH4+-N), while a significant negative correlation was observed with soil compaction (SC). The Chao1-Bacteria index was significantly positively correlated with pH and negatively correlated with capillary water (CW), available phosphorous (AP), acid phosphatase activity (ACP), and ammonium nitrogen (NH4+-N).
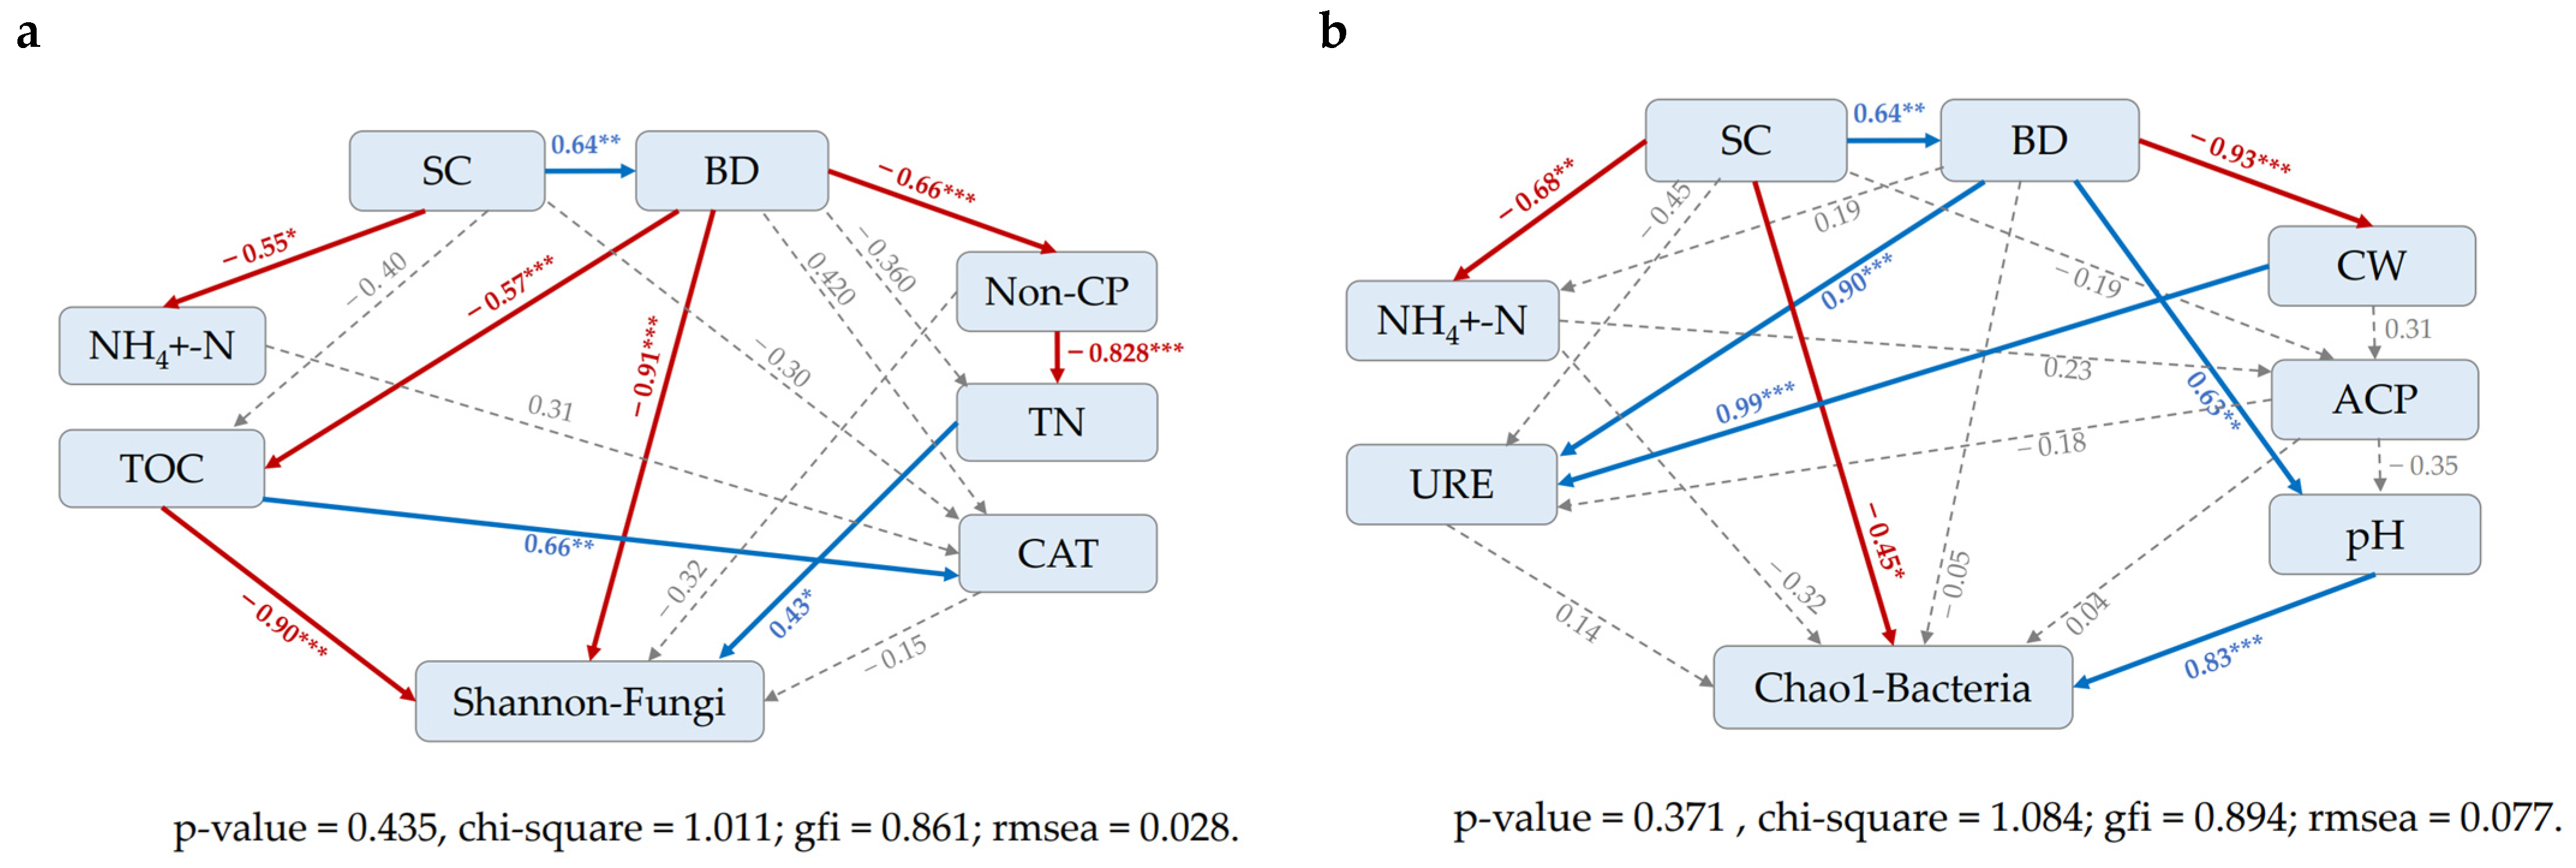
Both models had a small chi-square (χ2) value and a small root-mean-square error of approximation (RMSEA < 0.08), and thus had reasonable fit indices, meeting the application conditions of the models. The SEM model showed that soil properties, including bulk density and organic carbon, had direct and significantly negative effects on soil fungal diversity under trampling disturbance (Figure 8a and Table 3), with coefficients of −0.91, −0.902, respectively. Total nitrogen had a significant positive effect, with a coefficient of 0.431. Based on the results presented in Figure 8b and Table 4, the impact of trampling on soil bacterial abundance was investigated through structural equation model (SEM), which revealed both direct and indirect effects. The direct effects of trampling on soil pH (0.828) and soil compaction (−0.448) were found to be stronger than its effects on total porosity (0.626), which in turn had a greater indirect effect on bulk density (0.459). The indirect effect of trampling on bulk density was predominantly mediated by total porosity (−0.79). Overall, the largest influences on soil bacterial abundance were found to be from soil pH and bulk density, with a total effect of 0.407.
4. Discussion
This study highlights that trampling disturbance can have both positive and negative effects on soil ecosystems, and that these effects are dependent on the intensity of the disturbance as well as other factors, such as soil depth. Further research is necessary to fully comprehend the complex interactions between trampling, soil structure and function, and nutrient cycling.
4.1. Trampling Effects on Soil Structure and Nutrients
Our study reveals that an increase in trampling intensity can result in an improvement in bulk density [30] while exhibiting an inverse correlation with soil porosity and water holding capacity. The observed effects of trampling on soil structure and function vary with depth, which may have implications for nutrient cycling. Soil represents a heterogeneous matrix consisting of particles and pores with various sizes, while organic matter is typically unevenly distributed. Changes in soil porosity usually alter the balance between water and air, with reduced pore sizes limiting the transfer of particulate organics or gaseous nutrient forms, ultimately affecting the chemical ratios of organisms and microbial function [31,32]. Many studies have demonstrated that extreme and long-term trampling has a negative impact on vegetation and reduces soil coverage, leading to an increased exposure of the soil surface [33,34]. Trampling also reduces the water holding capacity of soil, with urban forest parks being particularly vulnerable to trampling-induced compaction, leading to altered pore distribution and soil structure. These changes result in altered bulk density, water holding capacity, and permeability of urban forest soil. However, trampling disturbance can also promote nutrient return, as moderate trampling has been shown to stimulate litter-soil mixing and increase the availability of nutrient elements such as organic matter [35,36], and promotion of microbial activity in various ecosystems can enhance litter decomposition [37]. Previous research has demonstrated that moderate trampling can enhance the mixing of litter and soil, augment nutrient elements including organic matter, and accelerate litter decomposition via the promotion of microbial activity across various ecosystems [33,38].
4.2. Trampling Effects on Microbial Community Structure
Mycorrhiza fungi in forest ecosystems play a vital role in assisting plants in both accessing more nutrients and water and enhancing their stress resistance [39,40]; these fungi also provide essential soil nutrients [41]. Moreover, ectomycorrhizal fungi can restore degraded soils by altering the composition of the root-associated microbial community [42,43,44]. Specifically, our study revealed that intense trampling compaction led to a decline in the relative abundance of ectomycorrhizal fungi. Moreover, our study found that both high and low intensities of trampling can lead to the disappearance of orchid ectomycorrhizal fungi in soil, highlighting the negative impact of trampling on plant-microbial interactions. Based on previous research, it is known that ectomycorrhizal fungi are unable to directly utilize organic nutrients present in the soil. Instead, they typically require the presence of high-nutrient and high-quality litter, and ecosystems dominated by ectomycorrhizal fungi generally contain a high proportion of easily decomposable humus [45,46]. The decrease in relative abundance of ectomycorrhizal fungi may be attributed to soil compaction caused by trampling and a decrease in available nutrients in the soil.
Interestingly, our study found that the MD and SD treatment groups exhibited higher levels of plant and wood saprophytes, and the relative abundance of leaf saprophytes, soil saprophytes and other saprophytes was notably higher in the extreme disturbance treatment group. Saprophytes, such as leaf and soil saprophytes, were found to display robust tolerance towards trampling compaction, and they are critical to the dynamics and resilience of ecosystems [47]. This may be due to the ability of certain saprotroph to decompose nutrient elements in poor soils, allowing for more efficient use of soil nutrients [48]. As a result, nutrient availability in poor forest soils may be more sensitive to inputs of litter [49]. Saprophytes may provide greater ecological flexibility and adaptability in certain environments and may play a key role in ecosystem resilience and stability, particularly in nutrient-poor and disturbed environments [50].
However, given that most fungi are heterotrophic, the loss of nutrients such as organic matter resulting from trampling could indirectly impact the number of fungi in soil. Overall, our findings suggest that trampling and compaction can have complex and sometimes contradictory effects on soil microbial community structure, with potential implications for plant-microbial interactions and soil ecosystem stability.
4.3. Trampling Effects on Plant Growth and Pathogen Invasion
Trampling-induced soil compaction can lead to reduced soil moisture content, a decrease in nutrient availability, and altered microbial community structure, which can all affect plant growth and development. Results showed that extreme trampling (ED) significantly affected the content of various soil parameters, such as TN, NH4+-N, CAT, MBC, and MBN, compared to the control group (CK); this is consistent with the results of microbial diversity and richness. Furthermore, trampling and compaction were found to increase the relative abundance of animal and plant pathogens, potentially weakening the soil’s ability to resist pathogen invasion, increasing the probability of plant and soil infection, and leading to soil ecosystem instability [43]. Our findings on the increased abundance of animal and plant pathogens under trampling conditions further support this notion. The study also highlights the complex and nuanced effects of trampling on microbial communities in soil. While trampling can increase the diversity of saprophytic fungi and the activity of soil, excessive trampling can inhibit the trend of increasing species abundance and richness. The number of bacterial OTUs varied greatly under different trampling conditions, but the species and abundance of bacterial functions remained stable, indicating the redundancy of bacterial functions in soil. Moreover, the impact of trampling on exogenous mycorrhizal species depended on the trampling intensity, with moderate trampling increasing the proportion of saprophytic and parasitic bacteria and heavy compaction trampling decreasing it.
Trampling-induced changes in soil structure led to changes in microbial community, and ultimately plant growth and pathogen invasion [35,51,52]. The direction and magnitude of trampling effects on forest vegetation and soil systems are highly variable and depend on numerous factors, such as trampling intensity, duration of disturbance, and soil characteristics [53,54]. Therefore, further research is needed to comprehensively understand the non-biological and biological processes of trampling disturbance in forest vegetation and soil systems.
5. Conclusions
In general, both high and low intensity trampling had effects on soil nutrient elements and microbial structure. We evaluated the direct and indirect effects. With the increase of trampling intensity, soil bulk density increases and porosity decreases, which makes soil have lower water-holding capacity. The changes of soil structure affect the changes of nutrient composition and microbial biomass, disturb the nutrient cycle, and create a prerequisite for the change of microbial community structure diversity. Moderate trampling may promote soil microbial function and increase the relative abundance and classification. The effect of trampling disturbance on soil fungi was greater than that on bacteria. The changes of soil microbial function and classification were related to trampling intensity and soil physical and chemical properties. Sustained high intensity trampling may make it difficult for the soil to recover, but if the soil has capacity to restrict the trampling effects to the more superficial layers, it will be possible for the soil to eventually be similar to its original condition. Therefore, in the process of monitoring, managing, and improving the forest park environment, we can start from the above aspects, which are crucial for the forest park to maintain its ecological function and diversity.
Author Contributions
Conceptualization, Q.L. and J.Z.; methodology, J.Z. and X.L.; software, H.N.; validation, X.L. and L.D.; formal analysis, X.L.; investigation, L.D. and L.X.; resources, L.D.; data curation, W.L.; writing—original draft preparation, X.S.; writing—review and editing, Q.L.; visualization, Q.L.; supervision, X.L.; project administration, J.Z.; funding acquisition, J.Z. All authors have read and agreed to the published version of the manuscript.
Funding
This research was funded by Innovation and Promotion of Forestry Science and Technology Program of Jiangsu Province grant number (LYKJ[2021]30); Nanjing Construction System Scientific Research Project (ks2005); Scientific Research Project of Baishanzu National Park grant number (2021ZDLY01); Jiangsu University Advantage Discipline Construction Project (PAPD).
Data Availability Statement
Not applicable.
Conflicts of Interest
The authors declare no conflict of interest.
References
- Tyrväinen, L.; Pauleit, S.; Seeland, K.; de Vries, S. Benefits and uses of urban forests and trees. In Urban Forests and Trees; Konijnendijk, K., Nilsson, T., Randrup, J., Schipperijn, Eds.; Springer: Berlin/Heidelberg, Germany, 2005; pp. 81–114. [Google Scholar] [CrossRef]
- Kenney, W.A.; van Wassenaer, P.J.; Satel, A.L. Criteria and Indicators for Strategic Urban Forest Planning and Management. Arboric. Urban For. 2011, 37, 108–117. [Google Scholar] [CrossRef]
- Bräuniger, C.; Knapp, S.; Kühn, I.; Klotz, S. Testing taxonomic and landscape surrogates for biodiversity in an urban setting. Landsc. Urban Plan. 2010, 97, 283–295. [Google Scholar] [CrossRef]
- Falkowski, P.G.; Fenchel, T.; Delong, E.F. The microbial engines that drive earth’s biogeochemical cycles. Science 2008, 320, 1034–1039. [Google Scholar] [CrossRef] [Green Version]
- Jia, G.M.; Cao, J.; Wang, C.; Wang, G. Microbial biomass and nutrients in soil at the different stages of secondary forest succession in Ziwulin, northwest China. For. Ecol. Manag. 2005, 217, 117–125. [Google Scholar] [CrossRef]
- Fierer, N. Embracing the unknown: Disentangling the complexities of the soil microbiome. Nat. Rev. Microbiol. 2017, 15, 579–590. [Google Scholar] [CrossRef] [PubMed]
- Ballantyne, M.; Pickering, C.M. The impacts of trail infrastructure on vegetation and soils: Current literature and future directions. J. Environ. Manag. 2015, 164, 53–64. [Google Scholar] [CrossRef] [PubMed] [Green Version]
- Nie, S.A.; Fang, Y.; Li, S. Preventing urban soil loss in China. Science 2021, 373, 1209. [Google Scholar] [CrossRef] [PubMed]
- Edmondson, J.L.; Davies, Z.G.; McCormack, S.A.; Gaston, K.J.; Leake, J.R. Are soils in urban ecosystems compacted? A citywide analysis. Biol. Lett. 2011, 7, 771–774. [Google Scholar] [CrossRef]
- Pandey, B.K.; Huang, G.; Bhosale, R.; Hartman, S.; Sturrock, C.J.; Jose, L.; Martin, O.C.; Karady, M.; Voesenek, L.A.; Ljung, K.; et al. Plant roots sense soil compaction through restricted ethylene diffusion. Science 2021, 371, 276–280. [Google Scholar] [CrossRef]
- Mooney, S.J.; Nipattasuk, M. Quantification of the effects of soil compaction on water flow using dye tracers and image analysis. Soil Use Manag. 2003, 19, 356–363. [Google Scholar] [CrossRef]
- Serrano, J.; Marques, J.; Shahidian, S.; Carreira, E.; Marques da Silva, J.; Paixão, L.; Paniagua, L.L.; Moral, F.; Ferraz de Oliveira, I.; Sales-Baptista, E. Sensing and Mapping the Effects of Cow Trampling on the Soil Compaction of the Montado Mediterranean Ecosystem. Sensors 2023, 23, 888. [Google Scholar] [CrossRef] [PubMed]
- Kikoti, I.A.; Mligo, C. The impact of livestock grazing on soil characteristics in Mount Kilimanjaro, Tanzania. J. Geosci. Environ. Prot. 2015, 3, 114–127. [Google Scholar] [CrossRef] [Green Version]
- Olden, A.; Raatikainen, K.J.; Tervonen, K.; Halme, P. Grazing and soil pH are biodiversity drivers of vascular plants and bryophytes in boreal wood-pastures. Agric. Ecosyst. Environ. 2016, 222, 171–184. [Google Scholar] [CrossRef]
- Tervonen, K.; Oldén, A.; Taskinen, S.; Halme, P. The effects of grazing history, soil properties and stand structure on the communities of saprotrophic fungi in wood-pastures. Fungal Ecol. 2022, 60, 101163. [Google Scholar] [CrossRef]
- Chai, J.; Yu, X.; Xu, C.; Xiao, H.; Zhang, J.; Yang, H.; Pan, T. Effects of yak and Tibetan sheep trampling on soil properties in the northeastern Qinghai-Tibetan Plateau. Appl. Soil Ecol. 2019, 144, 147–154. [Google Scholar] [CrossRef]
- Liu, L.; Zhao, G.; An, Z.; Mu, X.; Jiao, J.; An, S.; Tian, P. Effect of grazing intensity on alpine meadow soil quality in the eastern Qinghai-Tibet Plateau, China. Ecol. Indic. 2022, 141, 109111. [Google Scholar] [CrossRef]
- You, Y.; Ren, J.; Wu, J.; Ma, Z.; Gu, Y.; Wang, Y.; Wang, Z.; Bowatte, S.; Zhou, Q.; Hou, F. Forage taste agents modifying yak grazing decrease soil microbial diversity in alpine meadow. Appl. Soil Ecol. 2021, 168, 104160. [Google Scholar] [CrossRef]
- Sherman, C.; Unc, A.; Doniger, T.; Ehrlich, R.; Steinberger, Y. The effect of human trampling activity on a soil microbial community at the Oulanka Natural Reserve, Finland. Appl. Soil Ecol. 2019, 135, 104–112. [Google Scholar] [CrossRef]
- Alfaro, F.D.; Manzano, M.; Abades, S.; Trefault, N.; De la Iglesia, R.; Gaxiola, A.; Marquet, P.A.; Gutierrez, J.R.; Meserve, P.L.; Kelt, D.A.; et al. Exclusion of small mammals and lagomorphs invasion interact with human-trampling to drive changes in topsoil microbial community structure and function in semiarid Chile. Soil Biol. Biochem. 2018, 124, 1–10. [Google Scholar] [CrossRef]
- Li, Z.; Siemann, E.; Deng, B.; Wang, S.; Gao, Y.; Liu, X.; Zhang, X.; Guo, X.; Zhang, L. Soil microbial community responses to soil chemistry modifications in alpine meadows following human trampling. Catena 2020, 194, 104717. [Google Scholar] [CrossRef]
- Li, J.; Cooper, J.M.; Li, Y.; Yang, X.; Zhao, B. Soil microbial community structure and function are significantly affected by long-term organic and mineral fertilization regimes in the North China Plain. Appl. Soil Ecol. 2015, 96, 75–87. [Google Scholar] [CrossRef]
- Cui, Y.; Fang, L.; Deng, L.; Guo, X.; Han, F.; Ju, W.; Wang, X.; Chen, H.; Tan, W.; Zhang, X. Patterns of soil microbial nutrient limitations and their roles in the variation of soil organic carbon across a precipitation gradient in an arid and semi-arid region. Sci. Total Environ. 2019, 658, 1440–1451. [Google Scholar] [CrossRef] [PubMed]
- Sparks, D.L.; Page, A.L.; Helmke, P.A.; Loeppert, R.H.; Soltanpour, P.N.; Tabatabai, M.A.; Johnston, C.T.; Sumner, M.E. Methods of Soil Analysis, Part 3: Chemical Methods; Soil Science Society of America, Inc., American Society of Agronomy, Inc.: Madison, WI, USA, 1996. [Google Scholar]
- Bao, S.D. Soil Chemical Anlysis of Agriculture; Chinese Agriculture Press: Beijing, China, 2000. [Google Scholar]
- Allen, S.E.; Grimshaw, H.M.; Parkinson, J.A.; Quarmby, C. Chemical Analysis of Ecological Materials; John Wiley & Sons: New York, NY, USA, 1974. [Google Scholar]
- Wu, J.J.R.G.; Joergensen, R.G.; Pommerening, B.; Chaussod, R.; Brookes, P.C. Measurement of soil microbial biomass C by fumigation-extraction—An automated procedure. Soil Biol. Biochem. 1990, 22, 1167–1169. [Google Scholar] [CrossRef]
- Xu, N.; Tan, G.; Wang, H.; Gai, X. Effect of biochar additions to soil on nitrogen leaching, microbial biomass and bacterial community structure. Eur. J. Soil Biol. 2016, 74, 1–8. [Google Scholar] [CrossRef]
- Adams, R.I.; Miletto, M.; Taylor, J.W.; Bruns, T.D. Dispersal in microbes: Fungi in indoor air are dominated by outdoor air and show dispersal limitation at short distances. ISME J. 2013, 7, 1262–1273. [Google Scholar] [CrossRef] [Green Version]
- Shang, Q.; Liu, Y.; Li, Q. Effects of Tourism Trampling on Soil Nitrogen Mineralization in Quercus variabilis Blume Forests Varies with Altitudes in the Climate Transition Zone. Forests 2022, 13, 1467. [Google Scholar] [CrossRef]
- Korkanç, S.Y. Impacts of recreational human trampling on selected soil and vegetation properties of Aladag Natural Park, Turkey. Catena 2014, 113, 219–225. [Google Scholar] [CrossRef]
- Wei, Y.; Zhang, Y.; Wilson, G.W.; Guo, Y.; Bi, Y.; Xiong, X.; Liu, N. Transformation of litter carbon to stable soil organic matter is facilitated by ungulate trampling. Geoderma 2021, 385, 114828. [Google Scholar] [CrossRef]
- Tecon, R.; Or, D. Biophysical processes supporting the diversity of microbial life in soil. FEMS Microbiol. Rev. 2017, 41, 599–623. [Google Scholar] [CrossRef] [Green Version]
- Postma, J.; van Veen, J.A. Habitable pore space and survival ofRhizobium leguminosarum biovartrifolii introduced into soil. Microb. Ecol. 1990, 19, 149–161. [Google Scholar] [CrossRef] [PubMed]
- Kissling, M.; Hegetschweiler, K.T.; Rusterholz, H.P.; Baur, B. Short-term and long-term effects of human trampling on above-ground vegetation, soil density, soil organic matter and soil microbial processes in suburban beech forests. Appl. Soil Ecol. 2009, 42, 303–314. [Google Scholar] [CrossRef]
- Ludvíková, V.; Pavlů, V.V.; Gaisler, J.; Hejcman, M.; Pavlů, L. Long term defoliation by cattle grazing with and without trampling differently affects soil penetration resistance and plant species composition in Agrostis capillaris grassland. Agric. Ecosyst. Environ. 2014, 197, 204–211. [Google Scholar] [CrossRef]
- Suzuki, L.E.A.S.; Reinert, D.J.; Secco, D.; Fenner, P.T.; Reichert, J.M. Soil Structure under Forest and Pasture Land-Uses Affecting Compressive Behavior and Air Permeability in a Subtropical Soil. Soil Syst. 2022, 6, 98. [Google Scholar] [CrossRef]
- Ma, L.; Yuan, F.; Liang, H.; Rong, Y. The effects of grazing management strategies on the vegetation, diet quality, intake and performance of free grazing sheep. Livest. Sci. 2014, 161, 185–192. [Google Scholar] [CrossRef]
- Hartmann, M.; Niklaus, P.A.; Zimmermann, S.; Schmutz, S.; Kremer, J.; Abarenkov, K.; Lüscher, P.; Widmer, F.; Frey, B. Resistance and resilience of the forest soil microbiome to logging-associated compaction. ISME J. 2014, 8, 226–244. [Google Scholar] [CrossRef] [PubMed]
- Wang, Y.; He, X.; Yu, F. Non-host plants: Are they mycorrhizal networks players? Plant Divers. 2022, 44, 127–134. [Google Scholar] [CrossRef]
- Kuyper, T.W.; Suz, L.M. Do Ectomycorrhizal Trees Select Ectomycorrhizal Fungi That Enhance Phosphorus Uptake under Nitrogen Enrichment? Forests 2023, 14, 467. [Google Scholar] [CrossRef]
- Rinta-Kanto, J.M.; Timonen, S. Spatial variations in bacterial and archaeal abundance and community composition in boreal forest pine mycorrhizospheres. Eur. J. Soil Biol. 2020, 97, 103168. [Google Scholar] [CrossRef]
- Mendes, R.; Garbeva, P.; Raaijmakers, J.M. The rhizosphere microbiome: Significance of plant beneficial, plant pathogenic, and human pathogenic microorganisms. FEMS Microbiol. Rev. 2013, 37, 634–663. [Google Scholar] [CrossRef] [Green Version]
- Hayat, R.; Ali, S.; Amara, U.; Khalid, R.; Ahmed, I. Soil beneficial bacteria and their role in plant growth promotion: A review. Ann. Microbiol. 2010, 60, 579–598. [Google Scholar] [CrossRef]
- Bradford, M.A.; Keiser, A.D.; Davies, C.A.; Mersmann, C.A.; Strickland, M.S. Empirical evidence that soil carbon formation from plant inputs is positively related to microbial growth. Biogeochemistry 2013, 113, 271–281. [Google Scholar] [CrossRef]
- Soudzilovskaia, N.A.; van der Heijden, M.G.A.; Cornelissen, J.H.C.; Makarov, M.I.; Onipchenko, V.G.; Maslov, M.N.; Akhmetzhanova, A.A.; van Bodegom, P.M. Quantitative assessment of the differential impacts of arbuscular and ectomycorrhiza on soil carbon cycling. New Phytol. 2015, 208, 280–293. [Google Scholar] [CrossRef] [PubMed]
- Rodriguez, R.J.; Redman, R.S. Fungal Life-Styles and Ecosystem Dynamics: Biological Aspects of Plant Pathogens, Plant Endophytes and Saprophytes. Adv. Bot. Res. 1997, 24, 169–193. [Google Scholar] [CrossRef]
- Song, L.; Gong, J.; Li, X.; Ding, Y.; Shi, J.; Zhang, Z.; Zhang, W.; Li, Y.; Zhang, S.; Dong, J. Plant phosphorus demand stimulates rhizosphere phosphorus transition by root exudates and mycorrhizal fungi under different grazing intensities. Geoderma 2022, 423, 115964. [Google Scholar] [CrossRef]
- Wang, L.; Deng, D.; Feng, Q.; Xu, Z.; Pan, H.; Li, H. Changes in litter input exert divergent effects on the soil microbial community and function in stands of different densities. Sci. Total Environ. 2022, 845, 157297. [Google Scholar] [CrossRef]
- Miyauchi, S.; Kiss, E.; Kuo, A.; Drula, E.; Kohler, A.; Sánchez-García, M.; Morin, E.; Andreopoulos, B.; Barry, K.W.; Bonito, G.; et al. Large-scale genome sequencing of mycorrhizal fungi provides insights into the early evolution of symbiotic traits. Nat. Commun. 2020, 11, 5125. [Google Scholar] [CrossRef]
- Bollmann-Giolai, A.; Malone, J.G.; Arora, S. Diversity, detection and exploitation: Linking soil fungi and plant disease. Curr. Opin. Microbiol. 2022, 70, 102199. [Google Scholar] [CrossRef]
- Hiltbrunner, D.; Schulze, S.; Hagedorn, F.; Schmidt, M.W.; Zimmmermann, S. Cattle trampling alters soil properties and changes soil microbial communities in a Swiss sub-alpine pasture. Geoderma 2012, 170, 369–377. [Google Scholar] [CrossRef]
- Drewry, J.J.; Cameron, K.C.; Buchan, G.D. Pasture yield and soil physical property responses to soil compaction from treading and grazing—A review. Soil Res. 2008, 46, 237–256. [Google Scholar] [CrossRef]
- Heggenes, J.; Odland, A.; Chevalier, T.; Ahlberg, J.; Berg, A.; Larsson, H.; Bjerketvedt, D.K. Bjerketvedt. Herbivore grazing-or trampling? Trampling effects by a large ungulate in cold high-latitude ecosystems. Ecol. Evol. 2017, 7, 6423–6431. [Google Scholar] [CrossRef] [PubMed]
Figure 1.
Impact trends of MBC (a) and MBN (b) under different trampling disturbances and soil depths. CK, LD, MD, SD and ED denote control, light disturbance, medium disturbance, severe disturbance and extreme disturbance, respectively. Different soil depths are represented by 0–10 cm, 10–20 cm, and 20–30 cm. Different letters represent significant difference between the effects of different trampling disturbances in the same soil depths.

Figure 2.
Relative abundance of soil fungi and bacteria at phylum level under different trampling disturbances: (a) fungi; (b) bacteria. CK, LD, MD, SD and ED denote control, light disturbance, medium disturbance, severe disturbance and extreme disturbance, respectively. Each group consists of six bar graphs representing different trampling disturbances at corresponding soil depths. Specifically, CK1, LD1, MD1, SD1, and ED1 correspond to the depth of 0–10 cm, CK2, LD2, MD2, SD2, and ED2 corresponds to the depth of 10–20 cm, and CK3, LD3, MD3, SD3, and ED3 correspond to the depth of 20–30 cm.


Figure 3.
Functional groups inferred by FUNGuild classification of fungi (a), bacterial COG function classification (b) under different trampling disturbances. CK, LD, MD, SD and ED denote control, light disturbance, medium disturbance, severe disturbance and extreme disturbance, respectively.
Figure 3.
Functional groups inferred by FUNGuild classification of fungi (a), bacterial COG function classification (b) under different trampling disturbances. CK, LD, MD, SD and ED denote control, light disturbance, medium disturbance, severe disturbance and extreme disturbance, respectively.

Figure 4.
Soil microbes OTUs numbers, (a) fungi under different trampling disturbances, (b) bacteria under different trampling disturbances, (c) fungi in different soil layers, (d) bacteria in different soil layers. CK, LD, MD, SD, and ED denote control, light disturbance, medium disturbance, severe disturbance, and extreme disturbance, respectively. C1, C2, and C3 represent three different soil depths: 0–10 cm, 10–20 cm, and 20–30 cm, respectively.

Figure 5.
Kruskal–Wallis H test for Shannon index of OTU level fungi (a), Kruskal–Wallis H test for Shannon index bacteria (b) under different trampling disturbances. * significant difference at p < 0.05; ** significant difference at p < 0.01. CK, LD, MD, SD, and ED denote control, light disturbance, medium disturbance, severe disturbance, and extreme disturbance, respectively.

Figure 6.
Heatmap of community at different trampling disturbances at phylum level, (a) fungal relative abundance, (b) bacterial relative abundance. CK, LD, MD, SD, and ED denote control, light disturbance, medium disturbance, severe disturbance, and extreme disturbance, respectively.
Figure 6.
Heatmap of community at different trampling disturbances at phylum level, (a) fungal relative abundance, (b) bacterial relative abundance. CK, LD, MD, SD, and ED denote control, light disturbance, medium disturbance, severe disturbance, and extreme disturbance, respectively.

Figure 7.
Pearson’s correlation coefficients between physicochemical properties and biological activity of soil. Significant correlations are marked in blue (positive) and red (negative). *** Significant difference at p < 0.001; ** significant difference at p < 0.01; * significant difference at p < 0.05. SC: Soil compaction; Mini-MC: Minimum moisture content; WC: Water content; BD: Bulk density; Max-MC: Maximum moisture content; CW: Capillary water; Non-CP: Non-capillary porosity; CP: Capillary porosity; TP: Total porosity; TOC: Organic carbon; AP: Available phosphorous; AK: Available K; TN: Total nitrogen; TC: Total carbon; pH; UC: Sucrase activity; CAT: Catalase activity; ACP: Acid phosphatase activity; URE: Urease activity; Nit-N: Nitrate nitrogen; NH4+-N: Ammonium nitrogen; Sobs-Fungi; Shannon-Fungi; Simpson-Fungi; Chao1-Fungi; Sobs-Bacteria; Shannon-Bacteria; Simpson-Bacteria; Chao1-Bacteria.

Figure 8.
The standardization of total, direct and indirect effects of soil indexes on microorganisms under the influence of trampling was studied based on structural equation model (SEM), Shannon-Fungi (a), Chao1-Bacteria (b). *** Significant difference at p < 0.001; ** significant difference at p < 0.01; * significant difference at p < 0.05. The red and blue arrows represent significant negative and positive effects, respectively, while the gray dashed arrow represents no significant effect. The numbers next to the arrows are standardized path coefficients. SC: Soil compaction, BD: bulk density, Non-CP: Non-capillary porosity, NH4+-N: Ammonium nitrogen, TOC: Organic carbon, TN: total nitrogen, CAT: Catalase activity. CW: Capillary water, URE: Urease activity, ACP: Acid phosphatase activity, pH.


Table 1.
Classifications of the intensity of human trampling. CK, LD, MD, SD, and ED denote control, light disturbance, medium disturbance, severe disturbance, and extreme disturbance, respectively.
Table 1.
Classifications of the intensity of human trampling. CK, LD, MD, SD, and ED denote control, light disturbance, medium disturbance, severe disturbance, and extreme disturbance, respectively.
| Trampling Intensity | Human Activity | Average Height (cm) | Gleason Index | Simpson Index | Shannon-Wiener Index | Vegetation Coverage | Soil Compaction (Pa) | Average Traffic/Day |
|---|---|---|---|---|---|---|---|---|
| CK | No | 15.233 | 0.43 | 0.203 | 0.349 | 80% ± 10 | 2895 ± 100 | 0 |
| LD | Light disturbance | 13.647 | 0.71 | 0.504 | 0.884 | 60% ± 5 | 3983 ± 100 | 107 ± 20 |
| MD | Moderate disturbance | 18.944 | 0.68 | 0.494 | 0.860 | 40% ± 5 | 4000 ± 200 | 787 ± 20 |
| SD | Severe disturbance | 8.422 | 0.28 | 0.176 | 0.286 | 20% ± 5 | 5116 ± 200 | 1721 ± 50 |
| ED | Extreme disturbance | 7.644 | 0.20 | 0.061 | 0.106 | 5% ± 5 | 6003 ± 200 | 3277 ± 100 |
Table 2.
Inter-group t-test results for different microbial diversity indices affected by different trampling disturbances. CK, LD, MD, SD, and ED denote control, light disturbance, medium disturbance, severe disturbance, and extreme disturbance, respectively. (Mean ± SD: mean value ± standard deviation).
| Estimators | CK | LD | MD | SD | ED |
|---|---|---|---|---|---|
| Shannon | 3.155 ± 0.686 | 3.597 ± 0.448 | 3.606 ± 0.472 | 3.834 ± 0.407 | 4.019 ± 0.212 |
| Simpson | 0.172 ± 0.114 | 0.070 ± 0.040 | 0.090 ± 0.040 | 0.074 ± 0.03 | 0.055 ± 0.016 |
| Chao | 709.64 ± 231.13 | 817.01 ± 175.2 | 687.87 ± 242.07 | 879.76 ± 321.32 | 728.25 ± 117.52 |
| Coverage | 0.998 ± 0.001 | 0.998 ± 0.001 | 0.999 ± 0.001 | 0.998 ± 0.001 | 0.999 ± 0.001 |
Table 3.
The standardization of total, direct and indirect effects of soil indexes on microorganisms (Fungi) under the influence of trampling was studied based on structural equation model (SEM). SC: Soil compaction, BD: Bulk density, Non-CP: Non-capillary porosity, NH4+-N: Ammonium nitrogen, TOC: Organic carbon, TN: total nitrogen, CAT: Catalase activity.
| SC | BD | Non-CP | NH4+-N | TOC | TN | CAT | |
|---|---|---|---|---|---|---|---|
| Total Effects | 0.401 | −0.111 | −0.677 | −0.046 | −0.998 | 0.431 | −0.146 |
| Direct Effects | / | −0.911 | −0.320 | / | −0.902 | 0.431 | −0.146 |
| Indirect Effects | 0.401 | 0.800 | −0.357 | −0.046 | −0.096 | / | / |
Table 4.
The standardization of total, direct and indirect effects of soil indexes on microorganisms under the influence of trampling was studied based on structural equation model (SEM). SC: Soil compaction, BD: Bulk density, NH4+-N: Ammonium nitrogen, ACP: Acid phosphatase activity, CW: Capillary water, pH, URE: Urease activity.
| SC | BD | NH4+-N | ACP | CW | pH | URE | |
|---|---|---|---|---|---|---|---|
| Total Effects | −0.030 | 0.407 | −0.323 | −0.008 | 0.137 | 0.829 | 0.140 |
| Direct Effects | −0.448 | −0.053 | −0.321 | 0.041 | / | 0.828 | 0.140 |
| Indirect Effects | 0.418 | 0.459 | −0.002 | 0.137 | 0.137 | 0.001 | / |
Disclaimer/Publisher’s Note: The statements, opinions and data contained in all publications are solely those of the individual author(s) and contributor(s) and not of MDPI and/or the editor(s). MDPI and/or the editor(s) disclaim responsibility for any injury to people or property resulting from any ideas, methods, instructions or products referred to in the content. |
© 2023 by the authors. Licensee MDPI, Basel, Switzerland. This article is an open access article distributed under the terms and conditions of the Creative Commons Attribution (CC BY) license (https://creativecommons.org/licenses/by/4.0/).
Share and Cite
MDPI and ACS Style
Liu, Q.; Li, W.; Nie, H.; Sun, X.; Dong, L.; Xiang, L.; Zhang, J.; Liu, X. The Effect of Human Trampling Activity on a Soil Microbial Community at the Urban Forest Park. Forests 2023, 14, 692. https://doi.org/10.3390/f14040692
AMA Style
Liu Q, Li W, Nie H, Sun X, Dong L, Xiang L, Zhang J, Liu X. The Effect of Human Trampling Activity on a Soil Microbial Community at the Urban Forest Park. Forests. 2023; 14(4):692. https://doi.org/10.3390/f14040692
Chicago/Turabian StyleLiu, Qianqian, Wensui Li, Hui Nie, Xiaorui Sun, Lina Dong, Liu Xiang, Jinchi Zhang, and Xin Liu. 2023. "The Effect of Human Trampling Activity on a Soil Microbial Community at the Urban Forest Park" Forests 14, no. 4: 692. https://doi.org/10.3390/f14040692
Note that from the first issue of 2016, this journal uses article numbers instead of page numbers. See further details here.