Article

A 195-Year Growing Season Relative Humidity Reconstruction Using Tree-Ring Cellulose δ13C in the Upper Tarim River Basin, NW China

1
State Key Laboratory of Loess and Quaternary Geology, Institute of Earth Environment, Chinese Academy of Sciences, Xi’an 710061, China
2
University of Chinese Academy of Sciences, Beijing 100049, China
3
Center for Excellence in Quaternary Science and Global Change, Chinese Academy of Sciences, Xi’an 710061, China
4
Qingdao National Laboratory for Marine Science and Technology, Qingdao 266237, China
5
School of Human Settlements and Civil Engineering, Xi’an Jiaotong University, Xi’an 710049, China
6
China-Pakistan Joint Research Center on Earth Sciences, Chinese Academy of Sciences-Higher Education Commission, Islamabad 45320, Pakistan
7
Xi’an Institute for Innovative Earth Environment Research, Xi’an 710061, China
8
School of Geography Sciences and Touristy, Xinjiang Normal University, Urumqi 830054, China
9
Key Laboratory of Tree-Ring Physical and Chemical Research of China Meteorological Administration, Xinjiang Laboratory of Tree Ring Ecology, Institute of Desert Meteorology, China Meteorological Administration, Urumqi 830002, China
*
Author to whom correspondence should be addressed.
Forests 2023, 14(4), 682; https://doi.org/10.3390/f14040682
Submission received: 15 February 2023 / Revised: 19 March 2023 / Accepted: 24 March 2023 / Published: 26 March 2023

Abstract

:
Reconstruction of relative humidity changes in the upper Tarim River using carbon isotopic tree-ring chronology bridges the gap in historical observations on the Tarim River Basin in Arid Central Asia. Populus euphratica Olivier (P. euphratica), growing in the Tarim River Basin of Xinjiang, is an excellent record of past climate change. Based on precise dating, we analysed alpha-cellulose stable carbon isotopes in four cores of P. euphratica taken from the Alaer region of the upper Tarim River Basin. The four stable carbon isotope series records were corrected by the “pin method” and then combined into a carbon isotopic discrimination (Δ13C) series by the “numerical mix method”. The discrimination (Δ13C) series were clearly correlated with the mean relative humidity (RHAS) in April–September of the growing season (n = 60, r = −0.78, p < 0.001), and according to the climate response analysis, we designed a simple regression equation to reconstruct the mean relative humidity (RHAS) in April–September from 1824 to 2018 on the Alaer region. The reconstructed sequence showed mainly dry periods in the last 195 years, 1857–1866 and 1899–1907, while primarily wet periods from 1985 to 2016. Due to increased global warming and human activities, the climate shifted from “warm–dry” to “warm–wet” in the mid-to-late 1980s, when there were signs of a shift from “warm–wet” to “warm–dry” in the 2010s, with an increasing trend towards aridity. The RHAS series of Alaer compares well to other hydroclimate series’ surrounding the research area, and the spatial correlation analysis indicates that the reconstructed series has good regional representativeness. On an interdecadal scale, the revamped RHAS series is positively correlated with the Atlantic Multidecadal Oscillation (AMO) and negatively correlated with the North Atlantic Oscillation (NAO), reflecting the influence of westerly circulation on regional wet and dry variability. At the same time, the RHAS may also be influenced by The Pacific Decadal Oscillation (PDO).

1. Introduction

Arid Central Asia is located in the innermost central part of Eurasia and consists of Central Asian countries and Northwest China. With its complex geography, sparse vegetation, and low soil moisture content, the region is a crucial component of the global environmental system and significantly impacts regional and international climate and environment. Its climate, ecology, and environmental issues have been a scientific hotspot of concern for scientists and governments at home and abroad. The strength and trajectory of the westerly circulation are probably the main controlling factors for moisture in the arid regions of Central Asia [1,2,3]. In the last hundred years, Arid Central Asia has experienced a distinct heating trend and the most significant dry warming in the monsoon margins, with geographical variability in climate change [4]. Climate change affects the global and regional water cycle. It significantly impacts each region’s wet and dry conditions, with significant social, economic, and environmental implications, hence the widespread interest in damp and dry climate conditions [5]. With real dating, high resolution, large replicates, and repeatability [6,7], tree-ring chronology approaches have become widely used in different regions worldwide and have yielded remarkable results. Many researchers have used tree-ring chronology to explore Arid Central Asia’s historical hydrology and climate change. In Arid Central Asia, tree chronology researchers have reconstructed precipitation [8,9,10], PDSI [11,12], SPEI [13,14], relative humidity [15], vegetation index [16], temperature [17], etc. All of those contributions are crucial in helping to understand past climate change and predict future trends.
The Tarim River Basin is well known as part of the Arid Zone of Central Asia, a highly arid area in China. [18]. Its climate is synchronized on a regular basis with the overall Xinjiang and global climate variations. However, it also has its patterns [19]. Populus euphratica, an endangered species, grows on diving or river irrigation in the Tarim River area of Xinjiang, where it is resistant against wind and sand and maintains a fragile ecological balance [20]. Its maximum age of up to 300 years makes it a valuable material for researching past climate and environmental change. Several studies have been undertaken in this area in the last few years, showing that tree-ring records can broadly reflect ecological and environmental change information such as runoff [21], groundwater [22,23], water supply response [24,25,26], water use efficiency [27], and P. euphratica status [28]. The impact of ecological water transfer projects is weaker at the upstream end of the Tarim River Basin than at the downstream end of the Tarim River Basin [29]. P. euphratica growth relies mainly on groundwater, and tree-ring width is not sensitive to temperature and precipitation, so alternative tree-ring parameters need to be considered for past climate change studies. Tree-ring stable isotopes, an essential branch of tree chronology, have gained merit with advances in analytical techniques and clarification of the mechanisms of climate influence on isotope fractionation [30,31,32]. Dendrocyclic stable carbon isotopes (δ13C) were used to reconstruct past temperatures [33,34,35], precipitation [36,37,38], relative humidity [39,40], runoff [41], and intrinsic water-use efficiency [42,43,44]. Stable isotope climate studies of P. euphratica in the Tarim River Basin can fill the gap of proxy information on tree-ring climate in the desert and plain areas.
The relative humidity is amongst the most critical elements of water vapour circulation and energy balance in the atmosphere. The study of changes in relative humidity is essential for a more transparent comprehension of past climate change. However, the instrumental climate record is minimal; before the 1950s, longer-term climate change studies were limited in the Tarim River Area. To establish a more thorough insight into the climatic characteristics of the Tarim River basin, we have chosen P. euphratica, the most dominant broad-leaved tree species in the Tarim River Basin area, as our subject of study. Correlations among tree-ring Δ13C chronology and climate were established based on precise dating following dendrochronological methodologies. The growing season relative humidity in the Alaer region over the past 195 years was reconstructed from April to September. In this investigation, the purpose was to develop an improved comprehension of the patterns and mechanisms driving changes in relative humidity variation in the Aaler region. The findings of this work improved time-scale data on the relative humidity in the Tarim River Basin and provided data to support regional climate change with theoretical and applied implications.

2. Materials and Methods

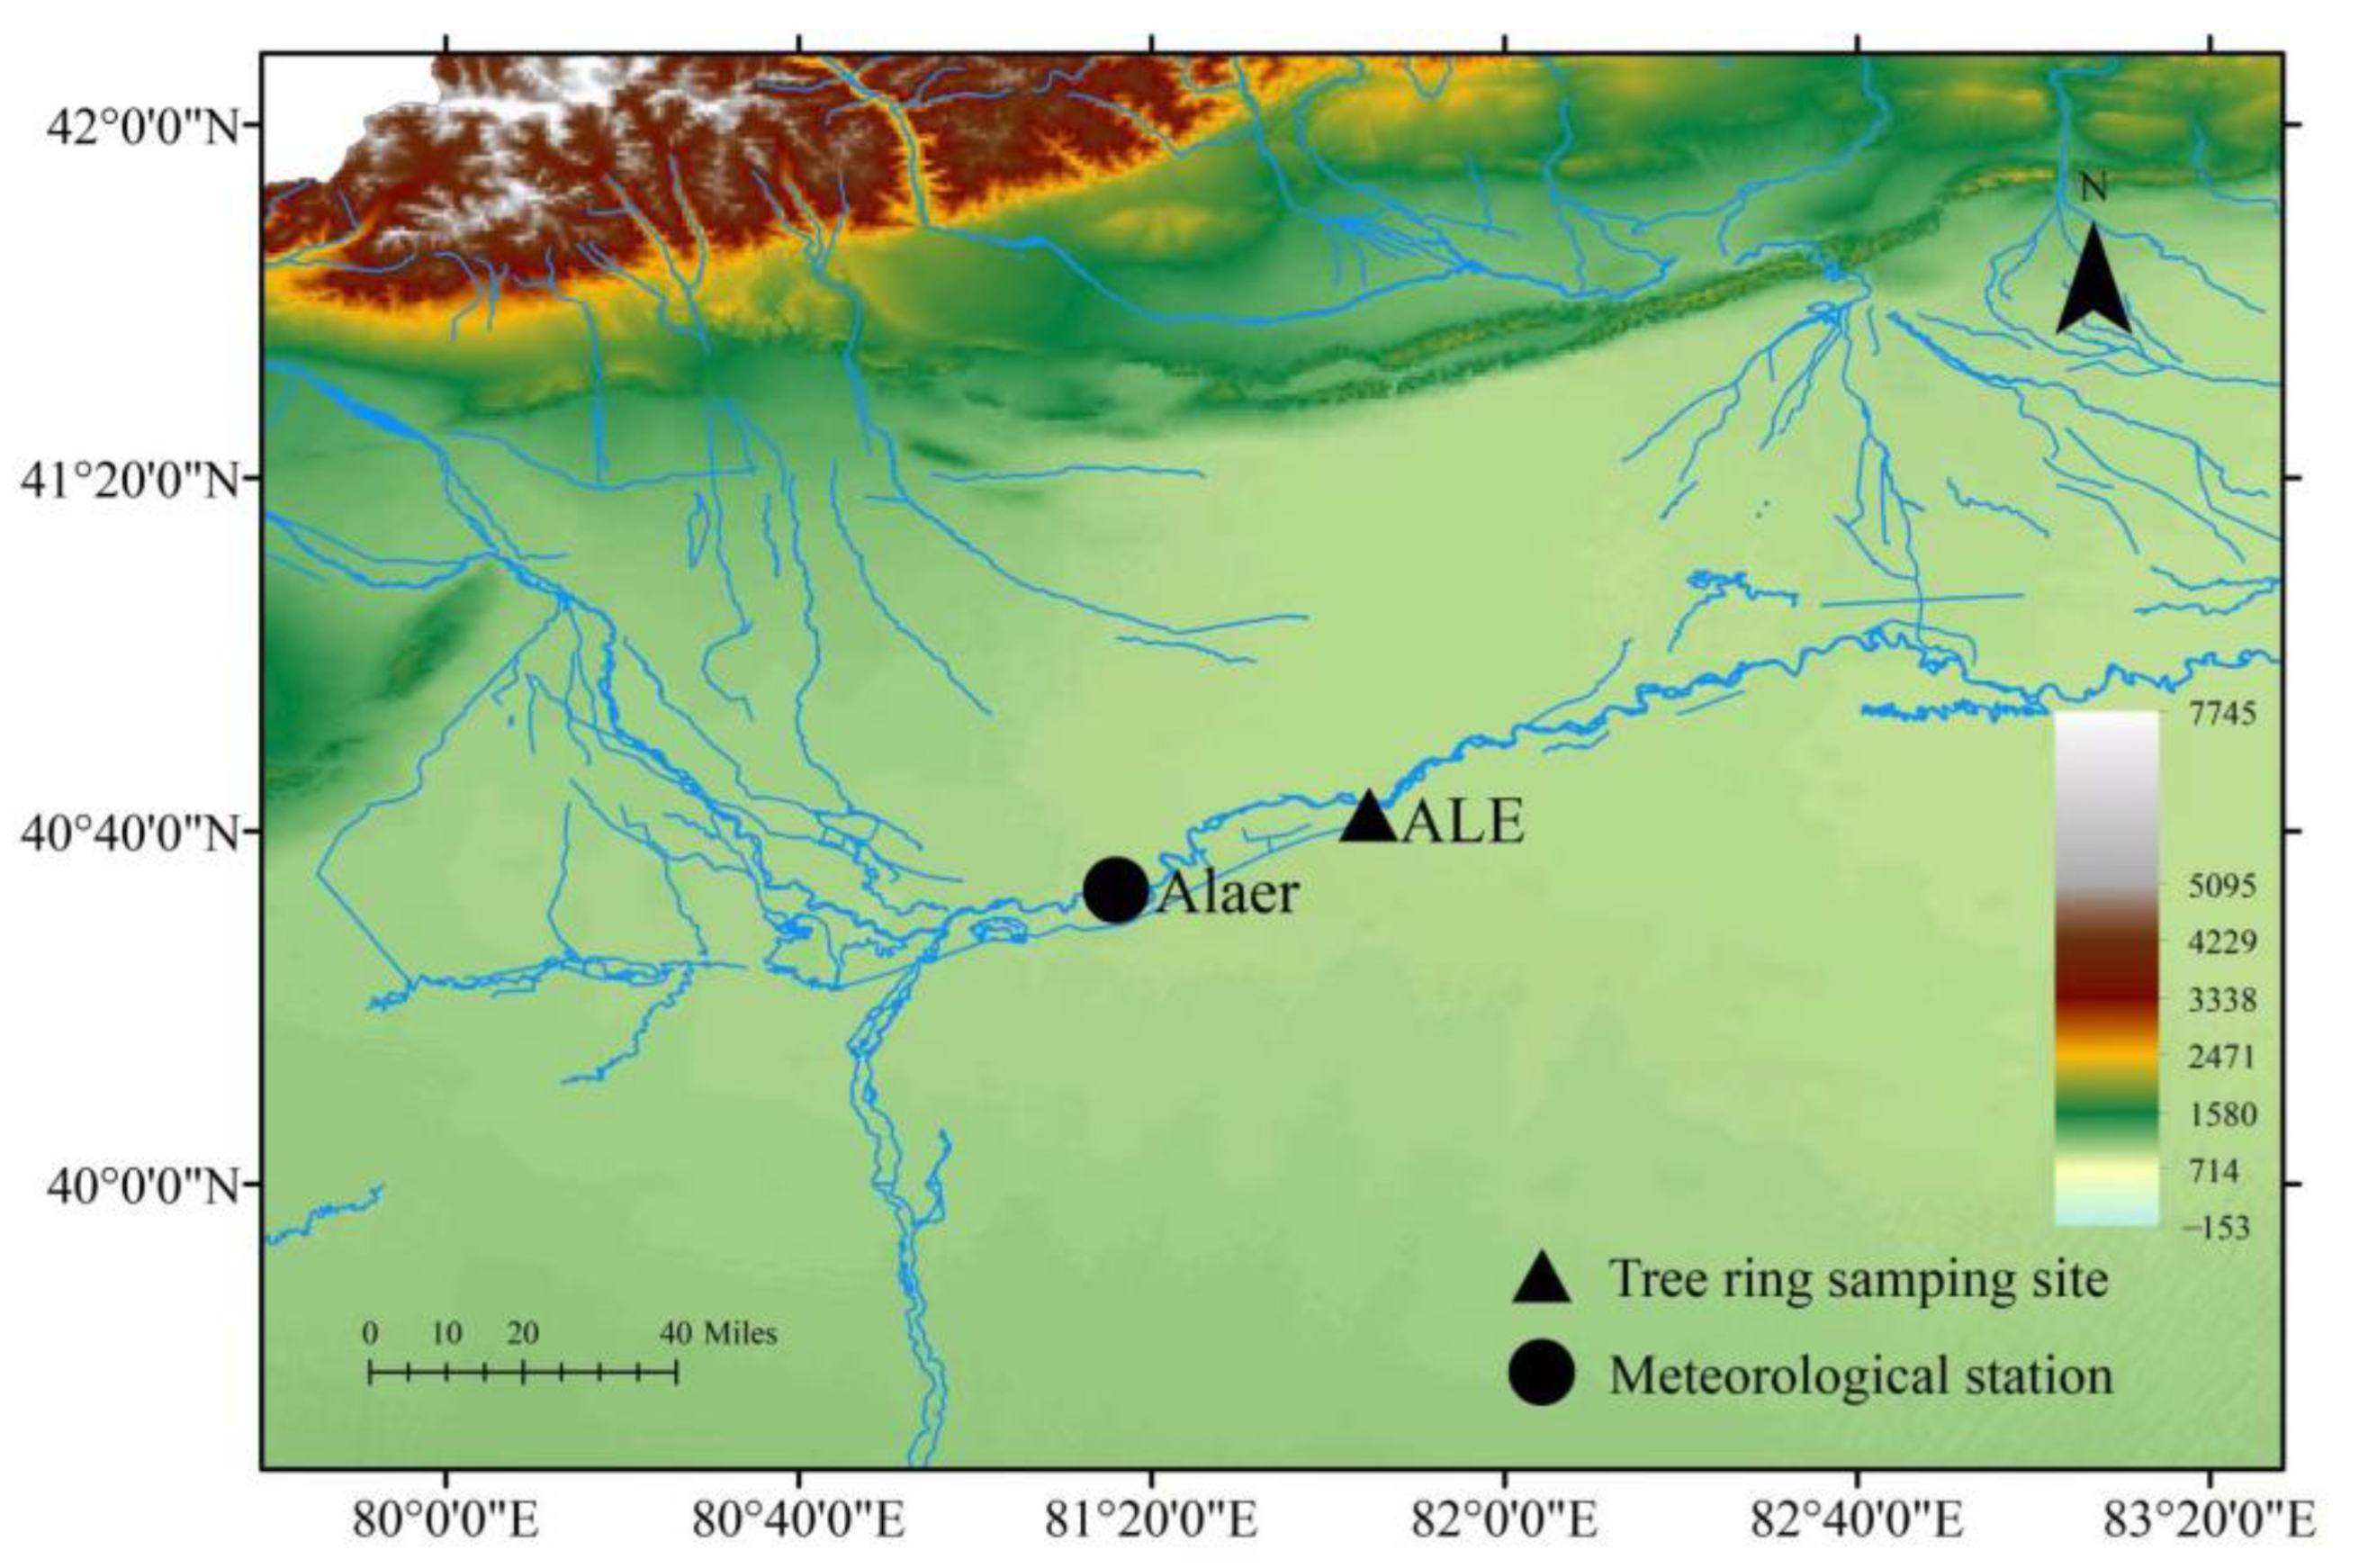
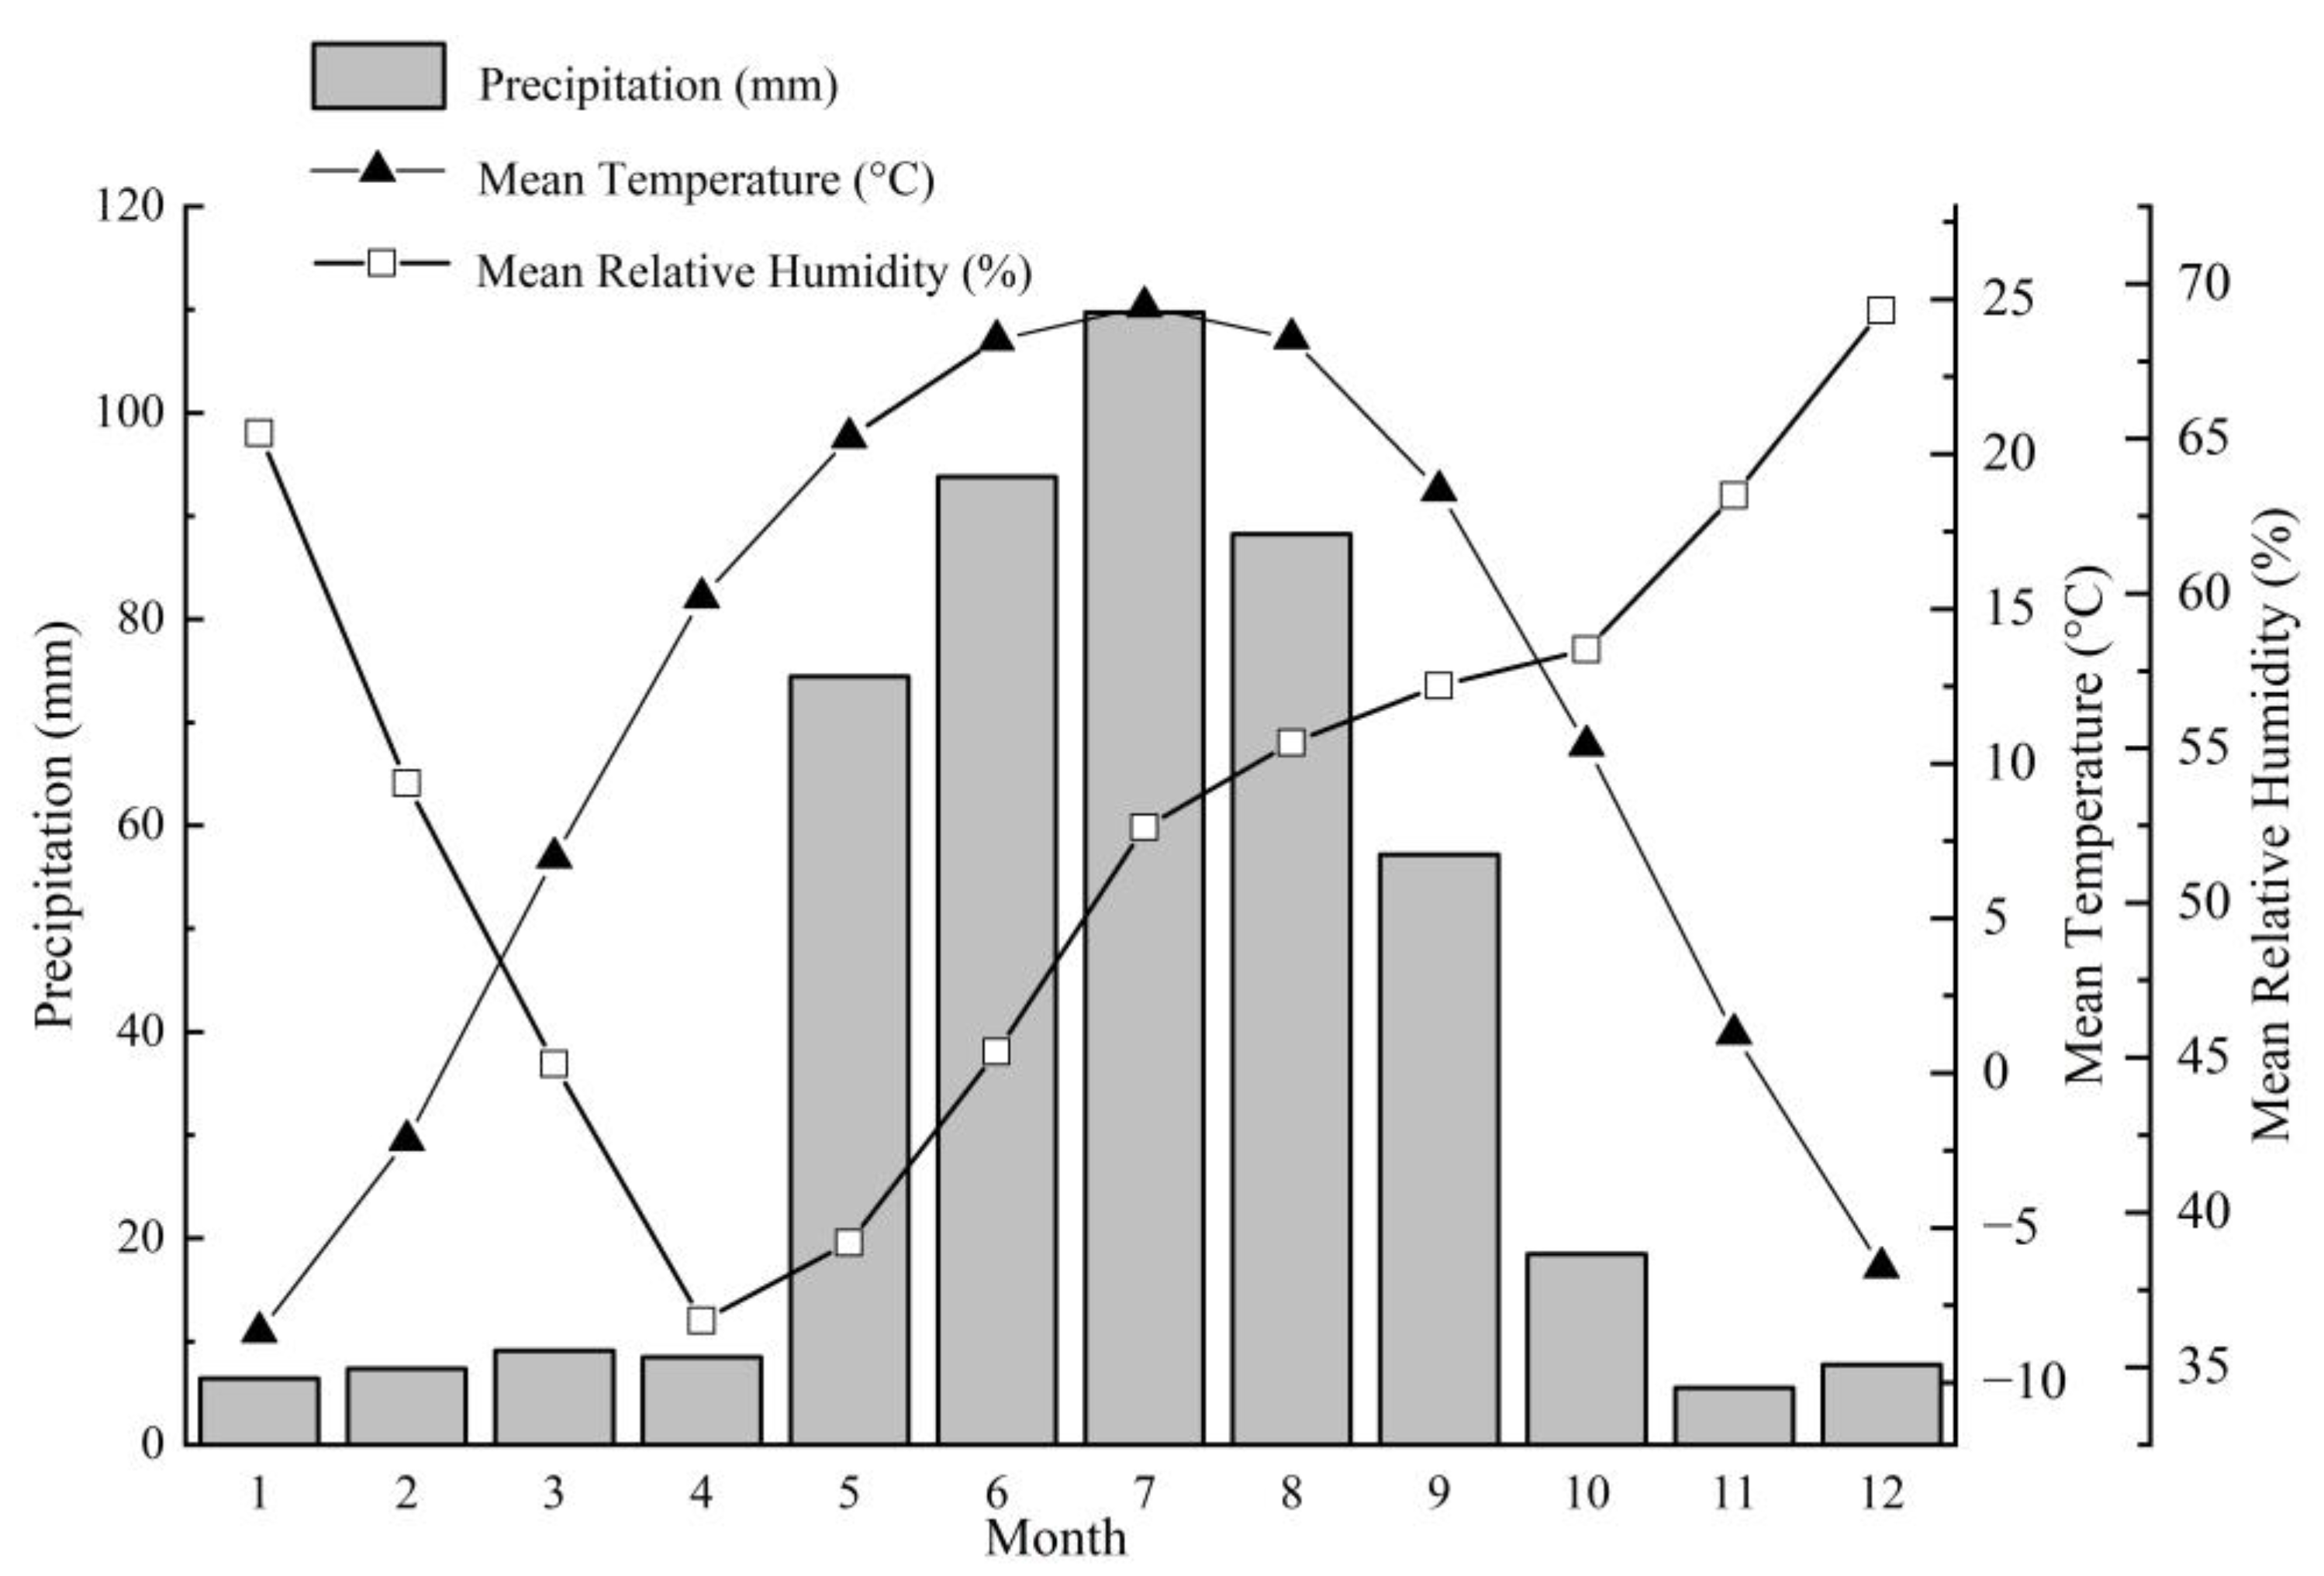
2.1. Study Area and Sampling Site

The sampling site is located at the northern edge of the Taklamakan Desert, in the upper reaches of the Tarim River on the Alaer region (80°30′−81°58′E; 40°22′−40°57′ N) at an altitude of 1012 m (Figure 1). The Tarim River is the primary irrigation supply in this region, and glaciers and snow mainly recharge its water. The vegetation is dominated by scrub, meadows, and desert riparian forests, with P. euphratica as the main tree. The soil is mainly brown desert soil and saline soil. Samples were taken from 25 live trees based on the International Tree Ring Data Bank sampling criteria. Two cores were taken from each tree in two directions by using a 5-mm incremental borer. This set is named ALE.

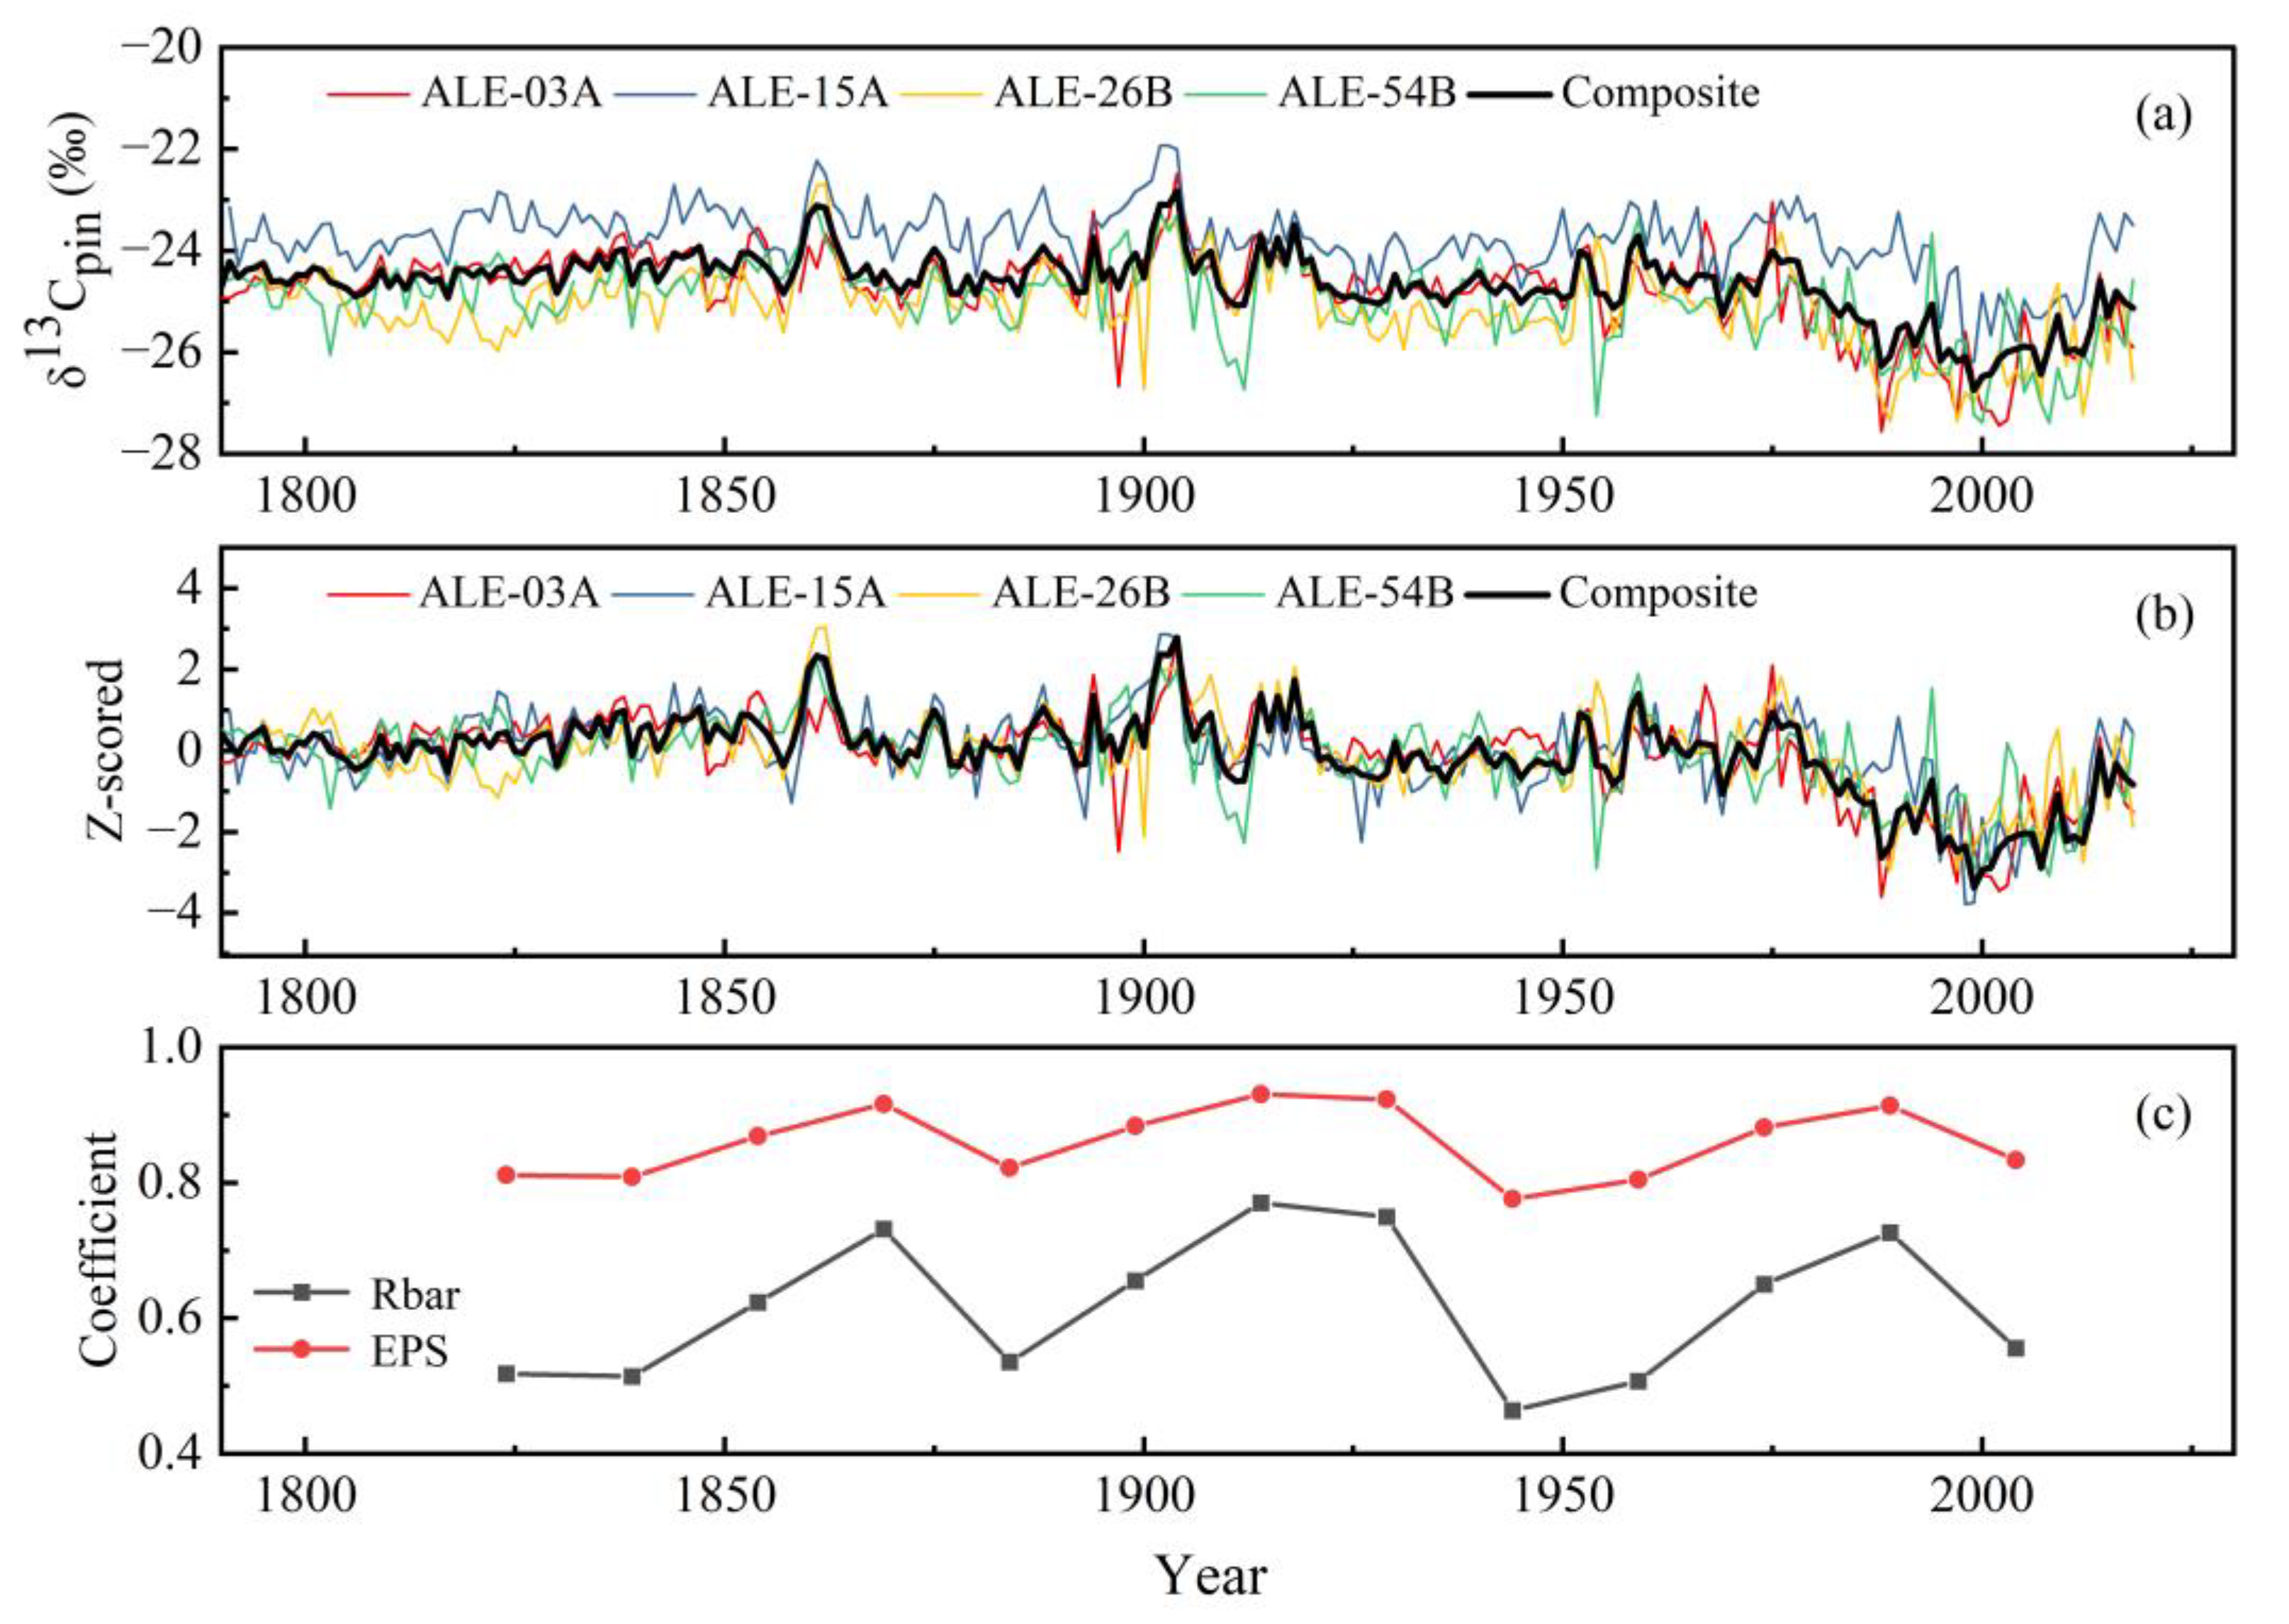
2.2. Tree-Ring Stable Carbon Isotopes Chronology Development

The LINTAB measuring table was used to determine the width of each annual ring, and the COFFCHA program for qualitative control of chronology was used [45]. We eliminated individual samples with too many singularities and poor correlation with the primary sequence. We concluded by using the ARSTAN program [46] to produce a chronology of tree-ring widths. After comparing all cores, four cores, named ALE-03A (1787–2018), ALE-15A (1791–2018), ALE-26B (1795–2018), and ALE-54B (1787–2018), with comparatively well-defined tree-ring boundaries were selected for research. In the absence of carbon pollution, a thin, sharp knife was used to separate each annual ring under the microscope. To obviate the “juvenile trend”, the first 20 years were excluded from the isotopic data in further analyses [47]. A modified Jayme–Wise method was applied to extract alpha-cellulose [31,48]. Specific procedures are detailed below: (1) Samples were each exposed three times to a mixture of toluene and ethanol (2:1) in a constant temperature water bath at 60 °C for 1 h. (2) The sample was exposed to a mixture of solutions (NaClO2 and acetic acid) in a constant temperature water bath at 80 °C for 1 h on three occasions. (3) The 17.5% NaOH solution was added in three portions, and the reaction samples were put in a constant temperature water bath at a temperature of 80 °C for 45 min. Following three iterations, the distilled water cleaning procedure was performed up to the point where the solution achieved a neutral pH. The alpha-cellulose was then homogenized and freeze-dried.
About 110–140 µg of homogenized alpha-cellulose was packaged into a tin capsule to be measured. The δ13C values were determined with a Delta V Advantage isotope ratio mass spectrometer connected to a FLASH 2000 Elemental Analyser (EA). Carbon isotope ratios were presented as deviations of δ13C relative to Pee Dee Belemnite (PDB) [49]. One standard cellulose sample (IAEA CH3) was interpolated in every eight samples. The δ13C values of tree rings were obtained as shown: δ13C = (Rsample/Rstandard – 1) × 1000‰ (R represents the 13C/12C ratio, and Rsample and Rstandard are the R values of the sample and the standard sample, respectively). The analysis of the carbon isotope measurements has an accuracy of less than ±0.2‰.

2.3. Meteorological Data and Statistical Methods

The meteorological station, approximately 50 km from the sampling site, is the Alaer Station (40°33′ N, 81°16′ N) at an altitude of 1012 m. The annual total precipitation at the Alaer Station during 1959–2018 (Figure 2) was 505.67 mm, with rainfall mainly concentrated in the months of June to August. The average annual temperature was 10.79 °C, with the hottest month being July (24.80 °C) and the coldest month being January (−8.28 °C). The annual mean relative humidity was 53.29%. The driest month was April, with a relative humidity of 36.48%, while the wettest month was December, with a relative humidity of 69.04%. The above meteorological data was collected through the China Meteorological Service Center (http://data.cma.cn/, accessed on 9 April 2021). The Palmer drought severity index (PDSI) grid point data with 0.5° × 0.5° (38°45′–41°15′ N, 81°15′–83°45′ E) was retrieved with the KNMI Climate Explorer (https://climexp.knmi.nl/, accessed on 9 April 2021).
The Effective Number of Degree of Freedom (EDOF) of the sample is calculated by the following equation [50] EDOF = N ∗ (1 − r1 ∗ r2)/(1 + r1 ∗ r2), where N represents the length of the time series, and r1 and r2 are lag-one autocorrelation coefficients of each independent series. The mean inter-series correlations (Rbar) and the expressed population signal (EPS) were found for 30-year windows based on a 15-year lag from 1787 to2018 [51]. Generally, an EPS greater than or equal to 0.80 produces a sufficiently strong signal for the selected sample core [52]. The Pearson coefficient of correlation (r) was used to study the relationship between tree-ring δ13C series and, for the study area, various climatic factors (precipitation, relative humidity, temperature, and PDSI). The δ13C “pin” correction method for adjusting tree-ring δ13C series to changes in atmospheric CO2 values following industrialization takes into account both the Seuss effect and the physiological response of trees to rising atmospheric CO2 concentrations [53]. In addition, the “pin” correction was done using Matlab code [53]. We referred to the pin-corrected chronology as δ13Cpin. After correcting the tree-ring δ13C series of each core, we obtained four tree-ring δ13Cpin series and finally synthesised an entire tree-ring Δ13C series using the “numerical mix method” [40]. The reliability of the reconstruction is verified using bootstrap and bootstrap methods [54]. The statistical parameters used in the validation work were the correlation coefficient (r), explained variance (R2), explained variance after adjusting for degrees of freedom (R2adj), estimated standard error (SE), F-value, p-value and Durbin–Watson value. Further, the reconstructed series were benchmarked against other paleoclimate series’ surrounding the area under study. A spatial correlation study between reconstructions and sea surface temperatures (HadSST 4.0.0.0 dataset) was conducted with the KNMI Climate Explorer (https://climexp.knmi.nl/, accessed on 9 April 2021). Finally, we calculated the correlations between our reconstructions and the Atlantic Multiperiod Oscillation (AMO), the North Atlantic Oscillation (NAO) and the Pacific Decadal Oscillation (PDO) (https://climexp.knmi.nl/, accessed on 9 April 2021). To highlight changes on decadal time scales and longer-term fluctuations, a 10-year low-pass filter or 11-year moving average was used in the data analysis.

3. Results

3.1. Characteristics of Tree-Ring δ13C Time Series

Table 1 displays the statistical characteristics of the tree-ring δ13Cpin series and Δ13C series in Alaer. The correlation coefficients were 0.86, 0.78, 0.84, and 0.83, respectively, between the individual δ13Cpin series and the composite series (ALE_com). The individual δ13Cpin series are remarkably well correlated with each other (Figure 3a and Table 1). The combined series may represent the Δ13C variation in local tree rings. The average value of the mixed series is −24.60‰, the minimum value is −26.75‰, the maximum value is −22.83‰ and the standard deviation is 0.64‰. Statistical characteristics for all series are given in Table 2. The values of EPS larger than 0.80–0.85 generally capture the conventional signal of the region [51]. Rbar (0.43–0.77) and EPS (0.75–0.93) are presented in Figure 3c. We found that the periods for which the Δ13C chronology is most reliable are 1824 to 2018.

3.2. Climatic Responses

Figure 4 shows that the tree-ring Δ13C series is correlated positively to temperature and negatively to precipitation, PDSI, and mean relative humidity, with an insignificant correlation to precipitation. The composite tree-ring Δ13C series correlated highest (r = −0.80, p < 0.0001) with the mean relative humidity from March to October from 1959 to 2018. According to previous studies, the growing season of P. euphratica in the Alaer region, Tarim River Basin, is from April to September [55], and the mean relative humidity from April to September of the growing season is at r = −0.78 (p < 0.001).
We carried out a partial correlation analysis among tree-ring Δ13C and observed climatic factors. The data indicate that (Table 3) the correlation coefficients for RHAS and tree-ring Δ13C remained the highest when the April–September mean temperature and precipitation were fixed as variables, respectively. After RHAS was selected, the correlation of tree-ring Δ13C with mean April–September temperature and precipitation in the preceding period was not high. These results suggest that in the growing season, RHAS is predominant in controlling tree-ring δ13C differentiation in the Alaer region.

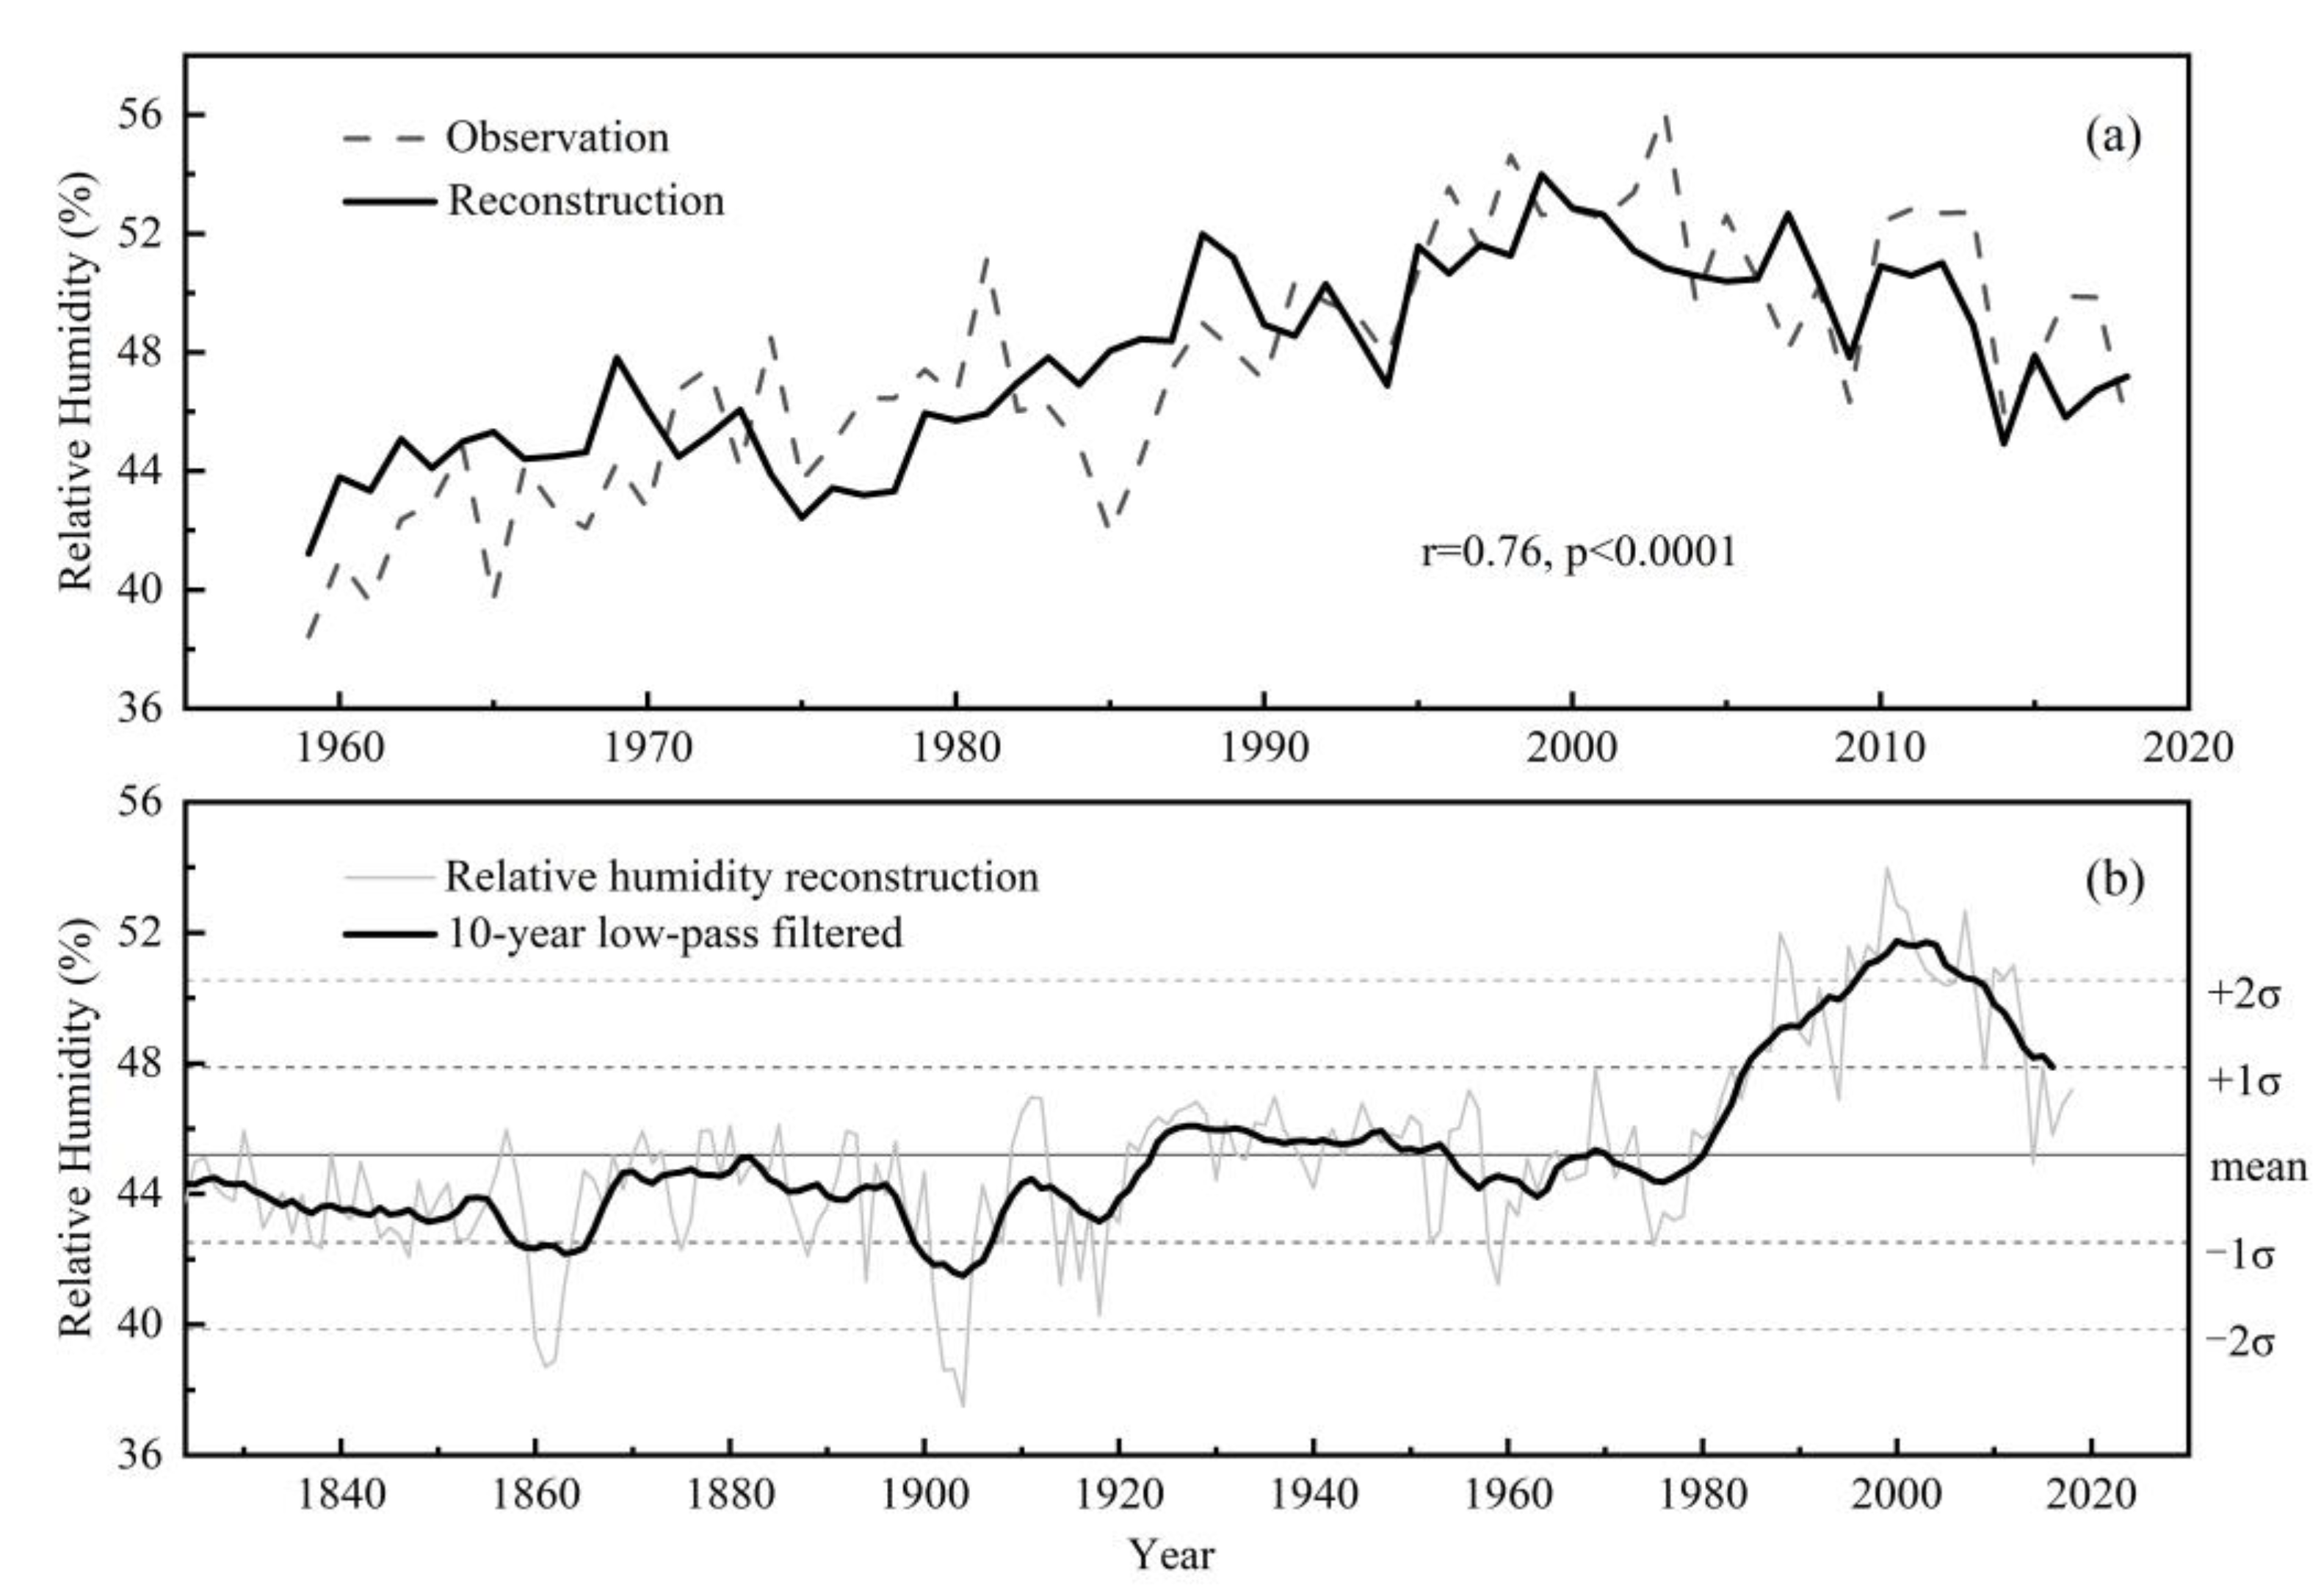
3.3. Growing Season Relative Humidity Reconstruction and Verification

According to the above analyses, RHAS on the Alaer region was reconstructed from the transfer functions below:
RHAS = −58.6908 − 4.2131 × Δ13C
  • (n = 60, r = −0.78, R2 = 0.6, R2adj = 0.6, F = 86.48, p < 0.0001, D/W = 1.34)
where r is the correlation coefficient between RHAS and tree-ring Δ13C, R2 is the explained variance, and R2adj is the explained variance after adjusting for the degrees of freedom. The D/W value [56] tests the first-order autocorrelation in the reconstruction series. The D/W values between 0.66 and 1.38 when n = 60 represent the absence of first-order autocorrelation. Table 4 displays Bootstrap and Jackknife methods to examine Equation (1). All of the parameters of the statistics in the validation are closely analogous to those in the calibration, indicating that the reconstruction equations are reliable and suitable for relative humidity reconstruction. Figure 5a shows that the observed RHAS is in good accordance with the reconstructed series from 1959 to 2018. The results verify that our reconstructed RHAS traces the observed sequence. The change in RHAS in the Alaer area from 1824 to 2018 was reconstructed according to Equation (1) (Figure 5b).

4. Discussion

4.1. Climatic Response of δ13C

Tree-ring δ13C is derived from atmospheric CO2 and enters the plant body through photosynthesis, and its fractionation is primarily controlled as a function of stomatal conductance and photosynthetic rate [57]. Generally, stomatal conductance can be limited mainly by humidity conditions, such as relative humidity and soil moisture, while the photosynthetic rate is primarily influenced by temperature and radiation intensity. [31]. Therefore, the dominant controlling factors vary under different climatic conditions. Photosynthetic use efficiency is dominant in areas not subject to water stress. Liu et al. [37] reconstructed the summer temperature (TJA) using a tree-ring stable carbon isotope in Helan Mountains. Liu et al. [58] reconstructed the May–July temperatures (TMJJ) from stable carbon isotopes in the Southern Wutai region for the past century. Due to moisture stress, stomatal conductance was the predominant influence, and tree-ring δ13C was better linked to atmospheric humidity and precipitation. Hemming et al. [59] discovered that high-frequency variations in tree-ring δ13C values in oaks and pines were negatively related to the average relative humidity from June to September (RHJS). In studying the relationship of the stable carbon isotope content of different components in tree rings in response to precipitation, Ma Limin et al. [60] observed that δ13C values were negative in relation to the overall precipitation from February to July (PFJ).
In dry and semi-arid environments where drought stress and changes in photosynthetic rate due to temperature are severely constrained by stomatal conductance [30], which largely depends on atmospheric relative humidity. Therefore, the temperature is hardly the main restricting force in controlling δ13C of tree rings in the region, while relative humidity, and PDSI, which contain the temperature signal, are the key limiting factors. The photosynthetic rate of internal leaf CO2 concentration mainly influences the positive correlation between δ13C and April–September temperature (Figure 4). P. euphratica is a stomatal-limiting plant [61], and its δ13C values negatively correlated to water-related proxies such as precipitation, relative humidity, and PDSI. They restrict stomatal conductance and thus severely constrain photosynthetic rates. The above analysis showed that relative humidity during the growing period influences the growth of trees, and that relative humidity is the main controlling factor for δ13C values of P. euphratica in the Alaer region.

4.2. Characteristics of Changes in Reconstructed Relative Humidity

Over the reconstruction period from 1824 to 2018, the average RHAS stands at 45.19% with a standard deviation ± 1σ of 2.67%. We used the definition of a highly wet year as >mean + 1σ and an extremely dry year as <mean − 1σ. As a result, drought and wet years account for 12.00% and 10.22% of the last 195 years, respectively. We used a 10-year low-pass filter on the interdecadal scale and found that the dry periods were concentrated in 1857–1866 and 1899–1907, and the wet periods in 1985–2016. Our reconstruction captures severe drought events. The years 1899–1907 in our reconstructed sequence were significant drought periods. A global El Niño-induced drought occurred around 1900, leading to widespread drought and famine in northern China [62]. Because Alaer is located on the secondary terrace of the Tarim River Alluvial Plain, it was initially a wilderness that was rarely inhabited, and it was only in 1958 when the First Agricultural Division began cultivating the area [63]. There are few historical records of this region. In the middle to late 1980s, the climate shifted from “warm and arid” to “warm and humid” [64,65]. Floods and droughts were recorded in the context of instrumental measurements; for example, in 1986 (RH = 48.45%) when the Alaer rainstorm affected the farmland and caused economic losses of more than eight million CNY [66] the reconstructed sequence also appropriately reflected this year as a wet year. In 2009 (RH = 47.83%), the Tarim River Basin experienced a once-in-60-year drought [67]. In 2014, Alaer suffered the worst drought in the last 15 years (http://www.gov.cn/xinwen/2014-06/30/content_2710042.htm, accessed on 15 May 2022), which was more painful than the 2009 drought. The relative humidity (RH = 44.92%) was lower than the average of the reconstruction history (RH = 45.19%). There are signs of a change from “warm–wet” to “warm–dry” in the 2010s, with an increasing trend towards aridity.

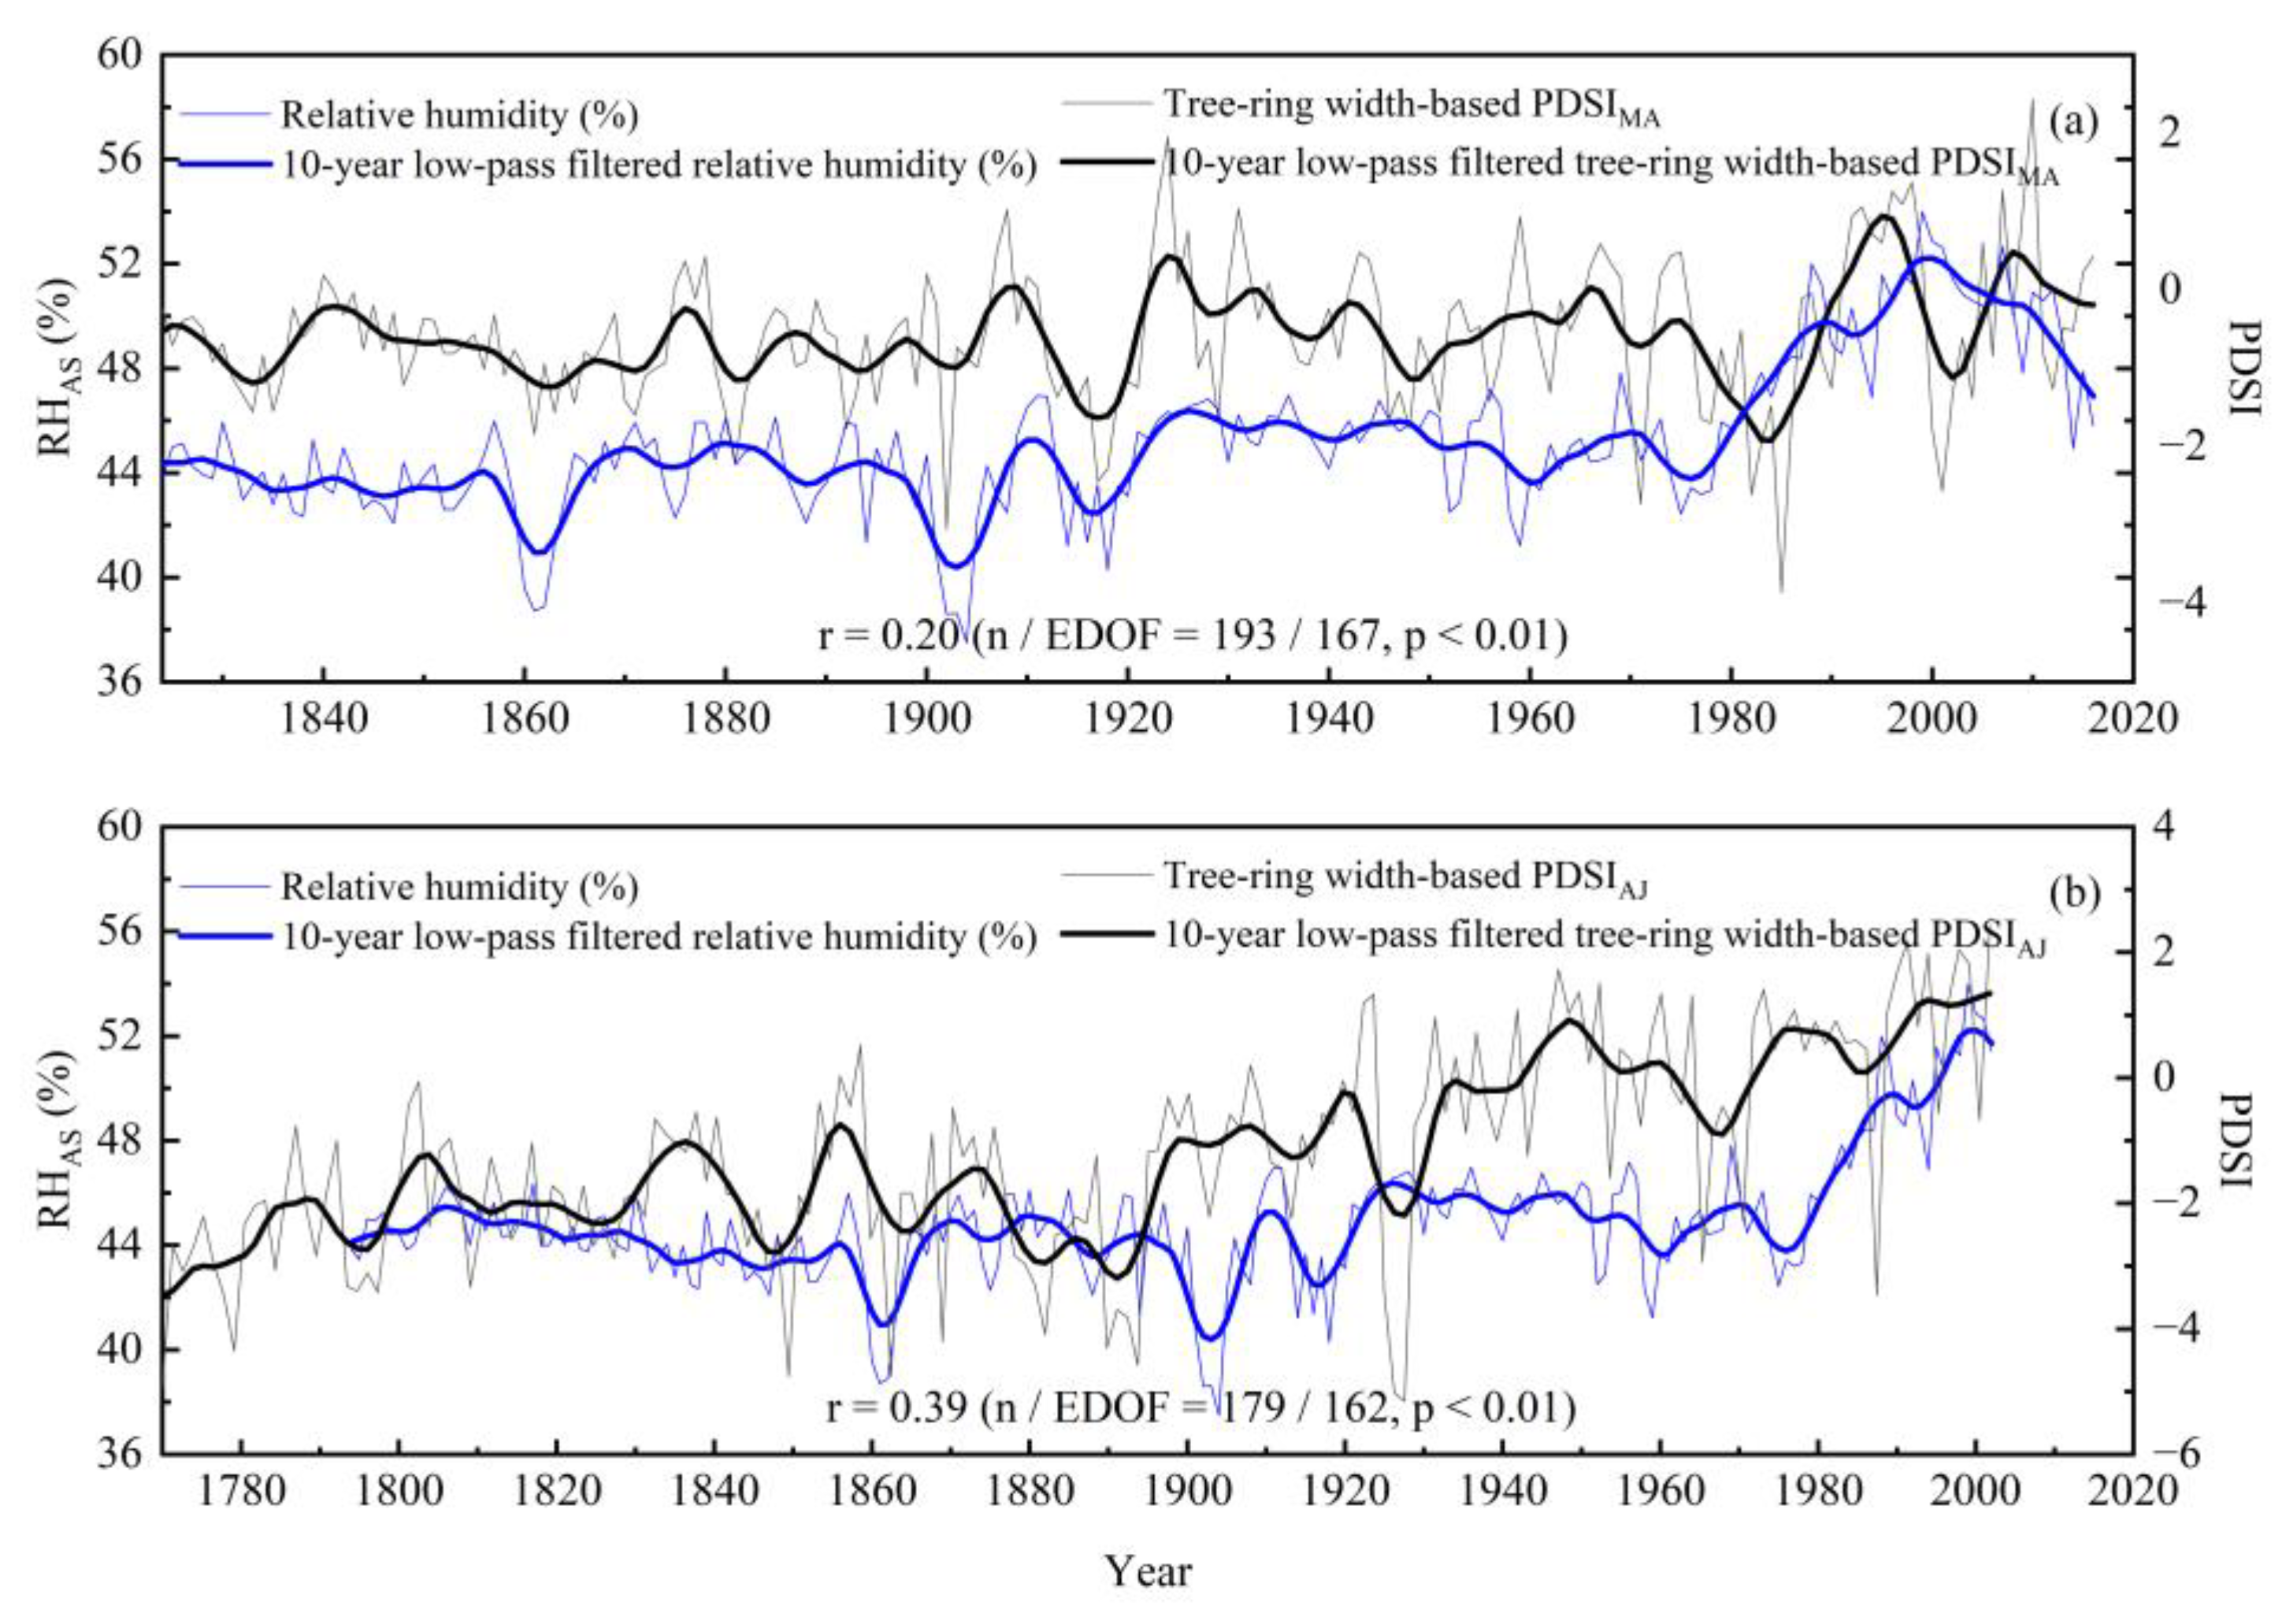
4.3. Comparisons with Other Paleoclimatic Reconstructions

Numerous climate reconstruction series and other high-quality paleoclimate change series already exist around the study area, providing excellent conditions for validating our reconstructed series and gaining a more detailed view of the history of climate change in the region. For example, a comparative study of reconstructed RHAS series and tree-ring width-based March–August PDSI reconstruction on the Hindu Kush around Central Asia over the period 1824–2016 [68] (Figure 6a). The series are clearly positively correlated, r = 0.20 (n = 193, p < 0.01), with the correlation coefficient increasing following 10-year low-pass filtering, with r = 0.40. Moreover, the reconstructed RHAS correlates markedly to the reconstructed climate series, the April–June PDSI based on tree-ring width in the Central Tian Shan during the period 1824–2002 [69] (Figure 6b), with a correlation coefficient of r = 0.39 (n = 179, p < 0.01), which increased following 10-year low-pass filtering, with r = 0.64. We suggest that there is a clear correlation between the reconstructed RHAS series of the Alaer region and other hydroclimatic series’ located around arid Central Asia. We also note that these reconstructed series show the same upward trend after about 1980, the “warming and wetting” trend, a finding consistent with previous studies [64,65]. The cause of the “warming and wetting” has been suggested to be enhanced moisture transport from high latitudes, the tropical Indian Ocean, the Arabian Sea, and local areas under the joint impact of the combined high and low latitude circulation systems [70,71]. The unique mountain basin structure in the Tarim River basin is characterised as an internal moisture circulation mechanism driven by valley winds. Since the 1960s and 1970s, the increase in actual evaporation from the plain oasis areas due to the expanding irrigated areas of the basin and the warming-induced glacial melting are also likely to have contributed to the warm season moisture gain in the Tarim River area [72].

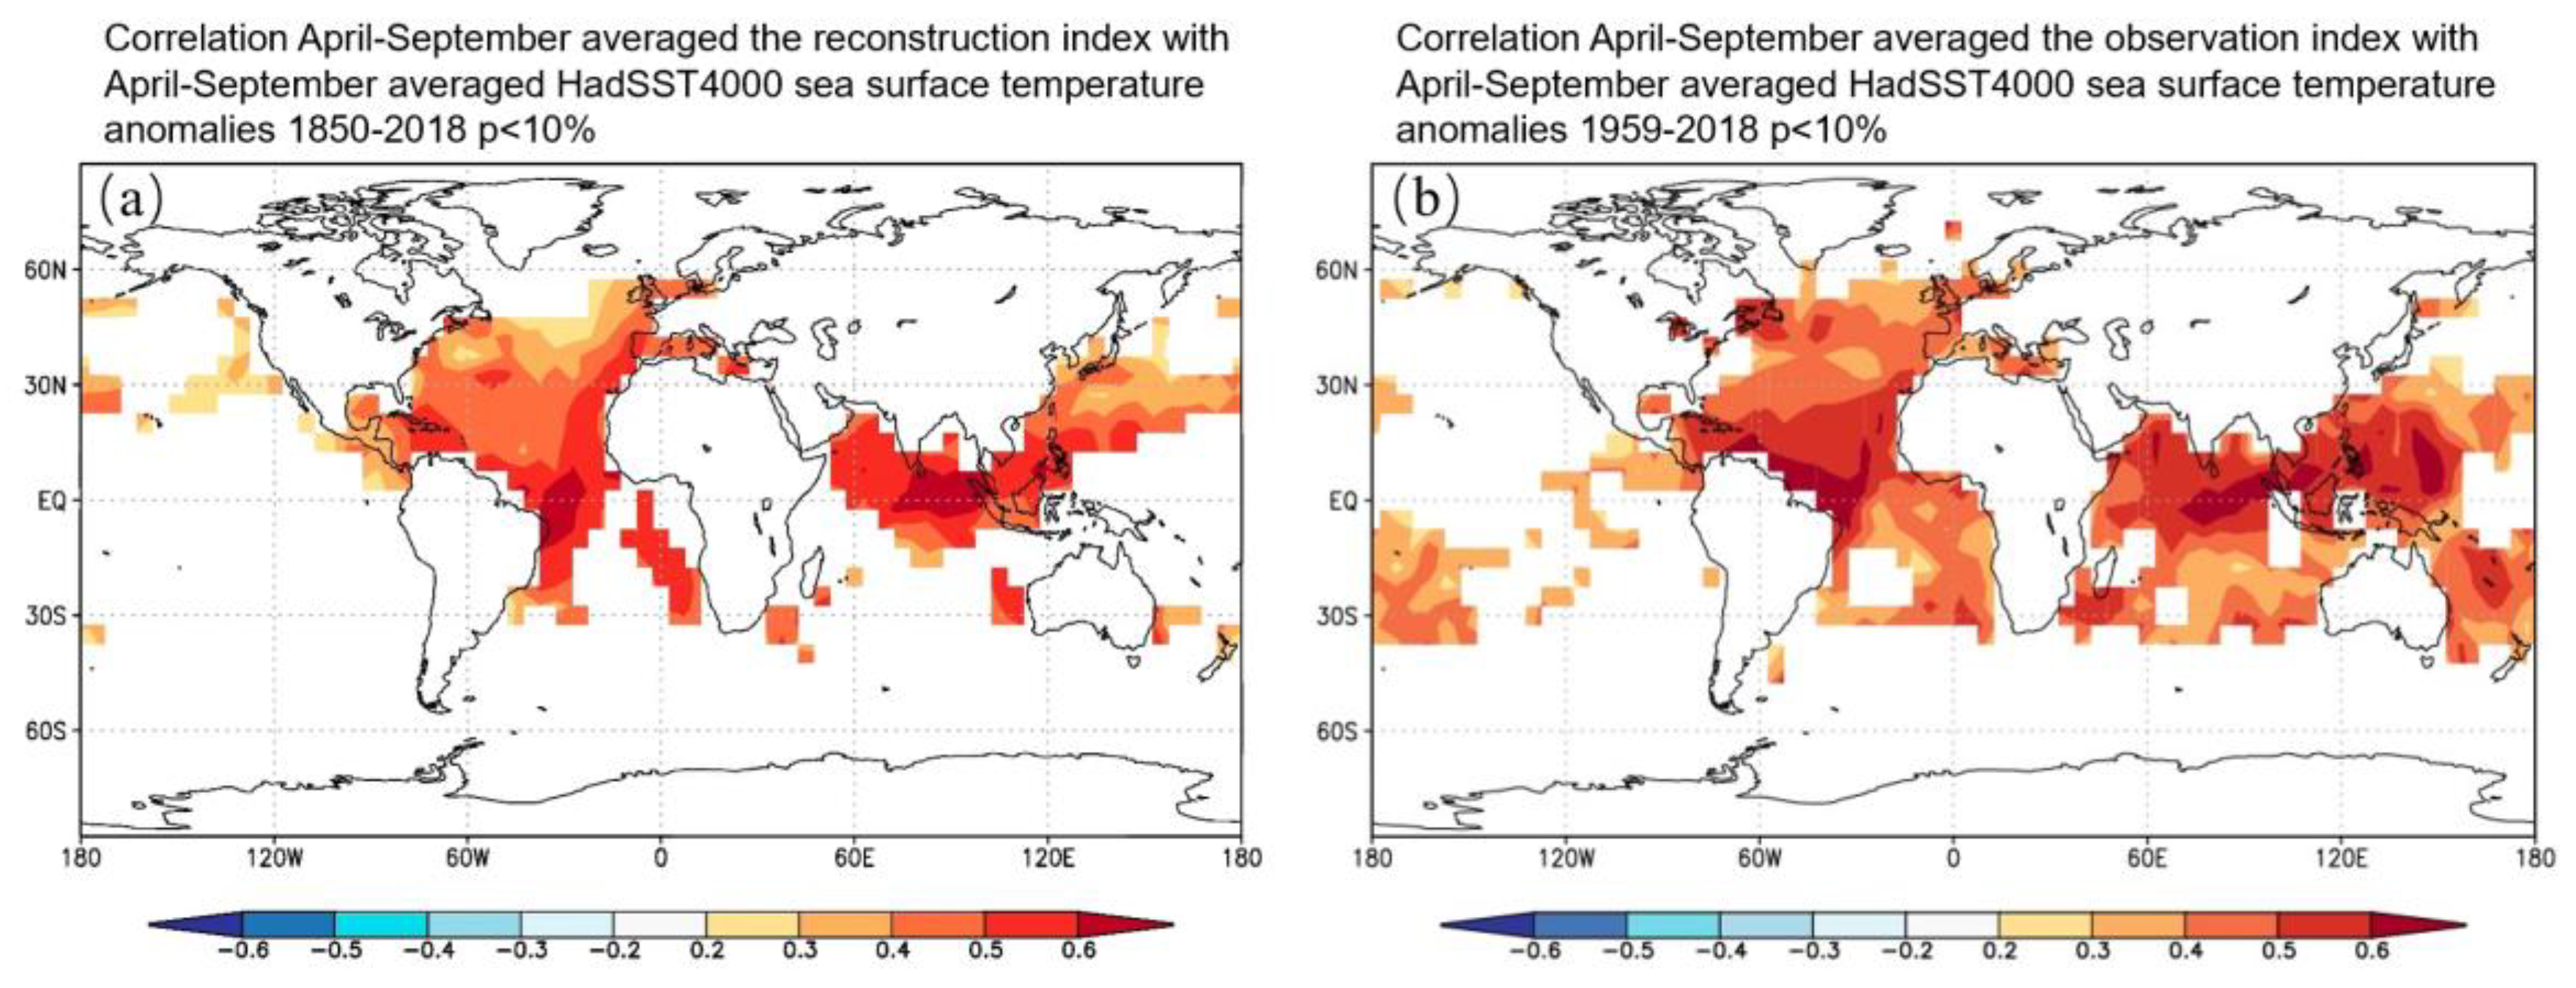
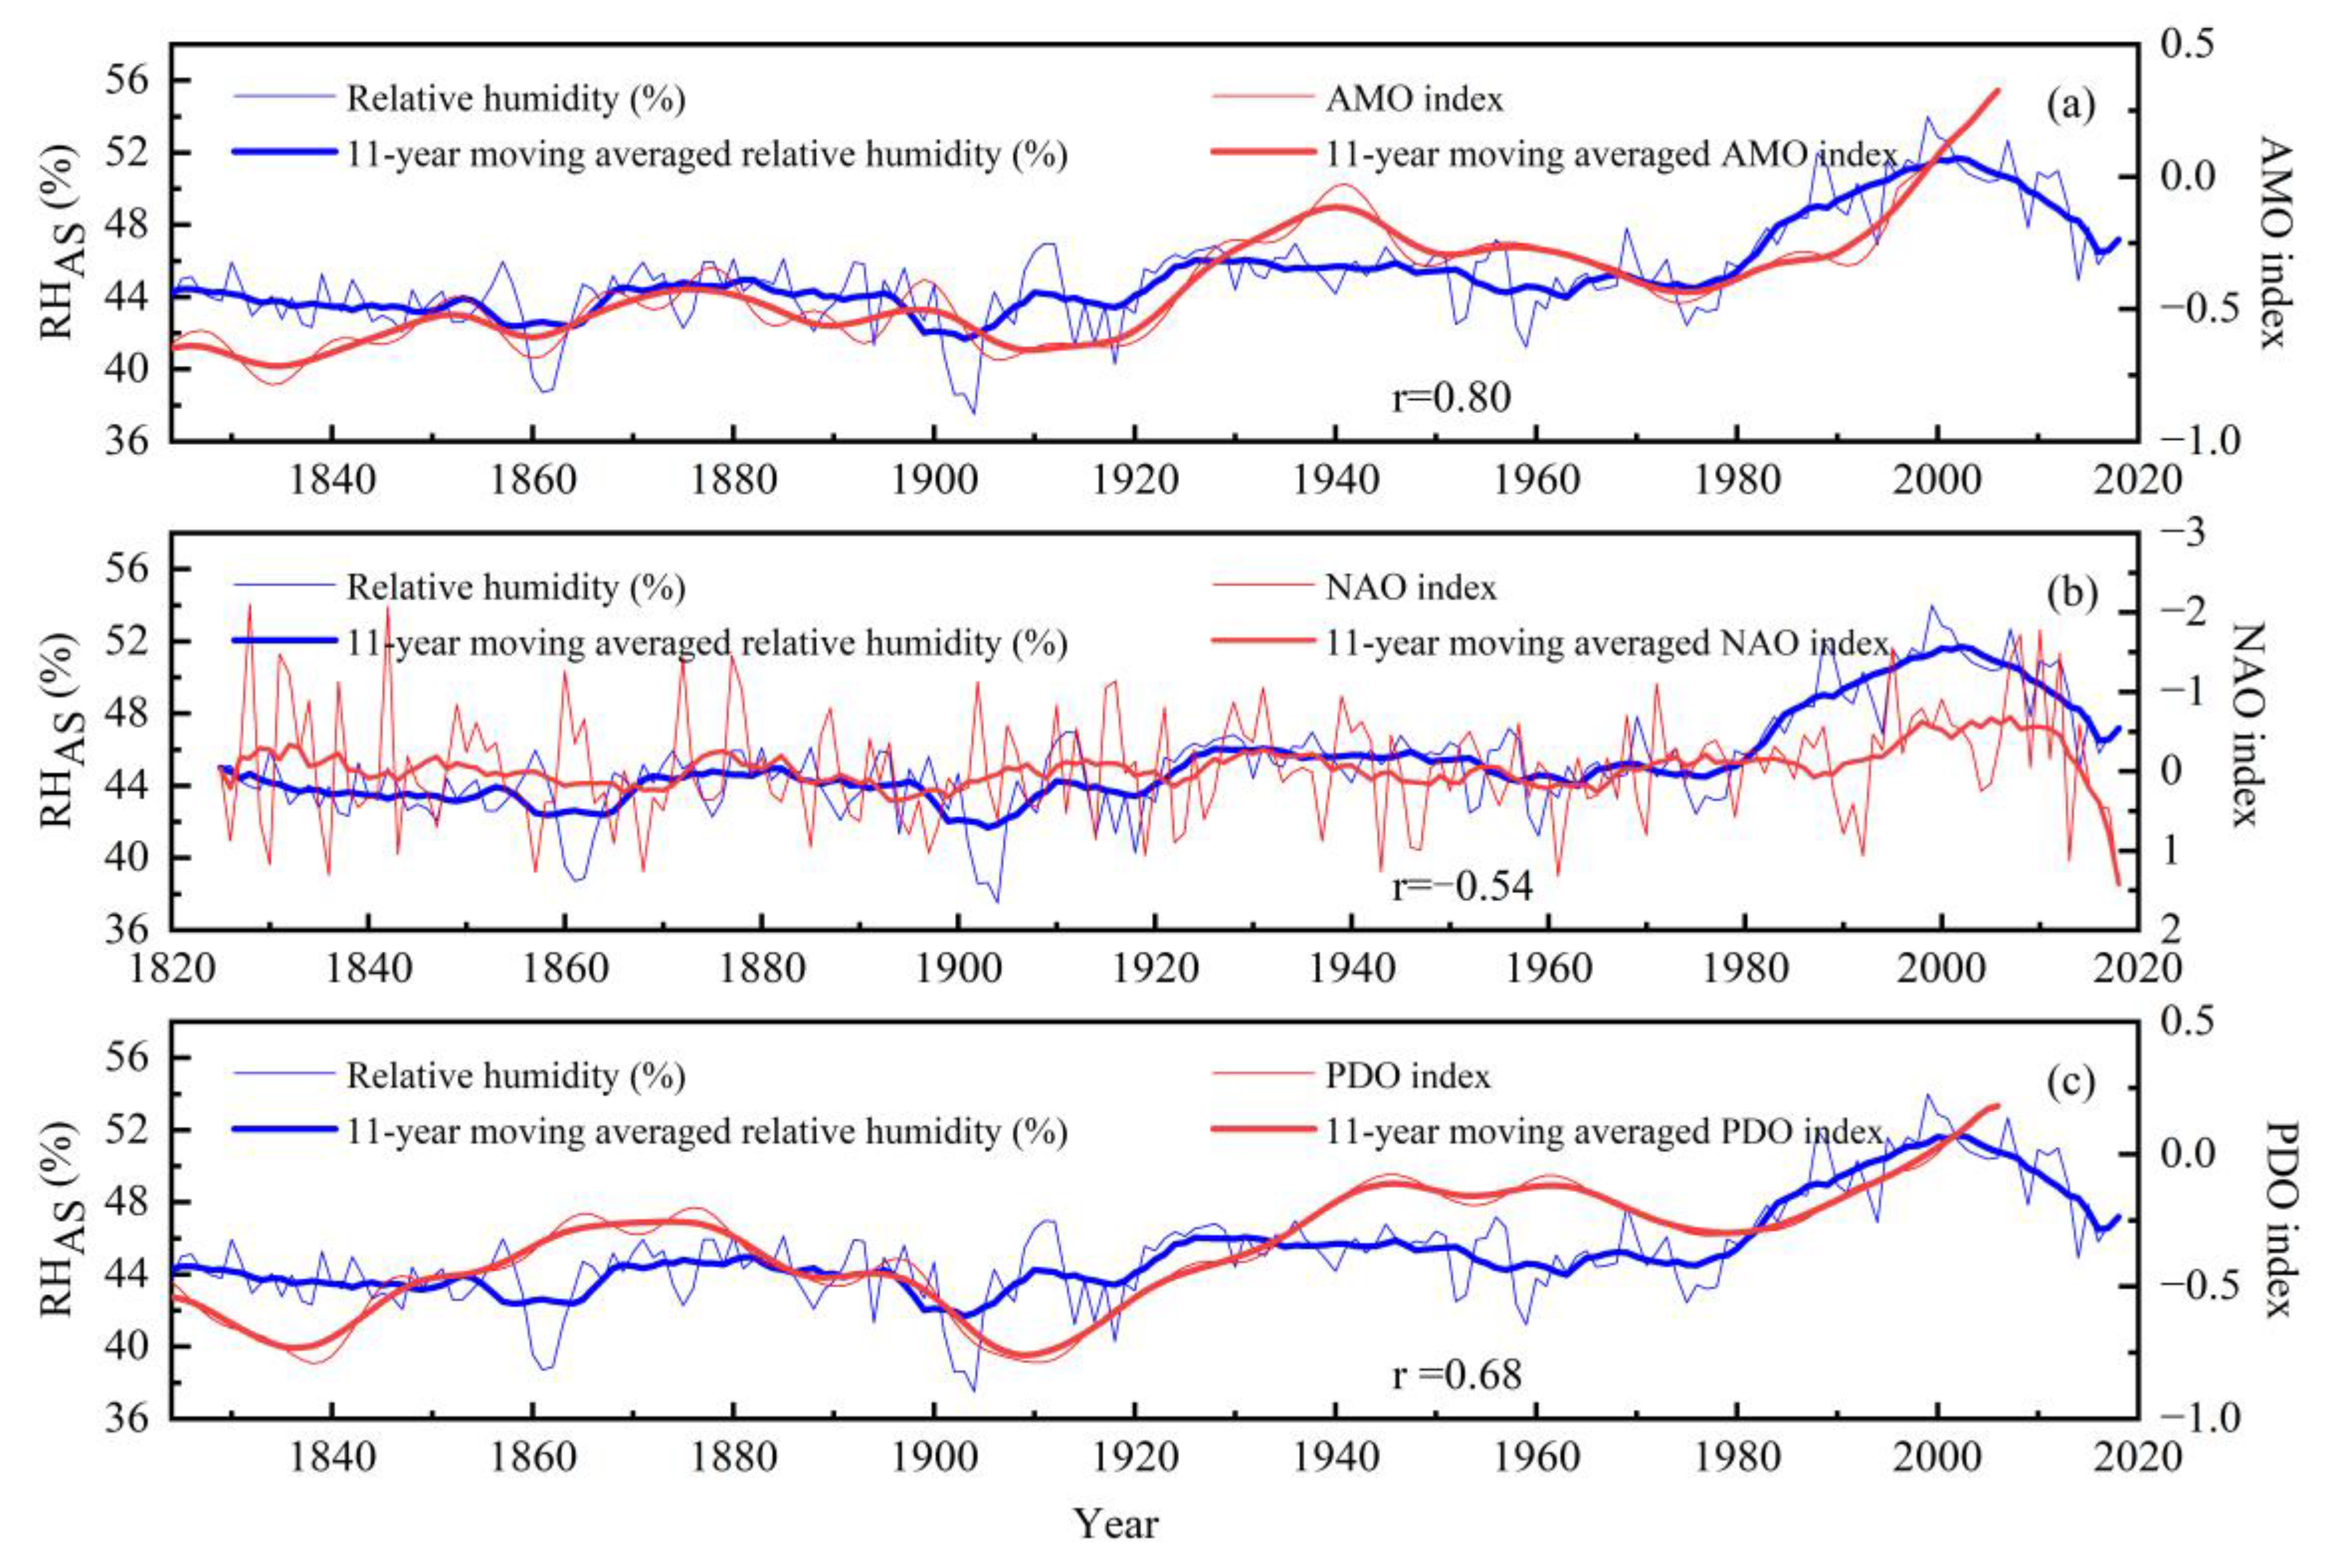
4.4. Possible Factors Affecting Relative Humidity Change

Figure 7 shows a positive spatial relationship between RHAS reconstructions and sea surface temperature (SST) over 1959–2018 in the Atlantic, Indian, and Western Pacific Oceans. These dependencies point to the possibility that the moisture conditions in the areas we study may have a direct relationship with the large-scale ocean–land circulating systems.
We found meaningful correlation coefficients between the AMO index [73], NAO [74], and PDO index [75], which we reconstructed as 0.66 (p < 0.01, n = 183 for 1824–2006), −0.15 (p < 0.05, n = 194 for 1825–2018), and 0.54 (p < 0.01, n = 183 for 1824–2006), and the correlation coefficient increases following an 11-year moving average, with r = 0.80, −0.54, and 0.68, respectively (Figure 8). The Atlantic Multidecadal Oscillation (AMO) is a quasi-cyclical warming and cooling variation in sea surface temperature occurring at the basin scale in the North Atlantic region [73]. Earlier tree-ring investigations showed that AMO has a widespread association with the climate in different parts of the world, for instance, floods [76] and droughts [77] in North America, and precipitation in Europe [78]. In the other areas far from the Atlantic Ocean, such as in the Western Tien Shan [11], the Qinghai-Tibet Plateau [79,80,81,82], and the Daxinganling [83,84], AMO may be a key driver influencing regional climate. The primary mechanism of influence is that AMO causes atmospheric circulation anomalies through the heating/cooling effect of the upper mid-troposphere, which in turn affects climate change [85]. We clarified this relationship by correlating the reconstructed series with the AMO index, which suggests that the positive and negative AMO phases map onto the relatively wet and relatively dry periods, respectively, in the Upper Tarim River basin. NAO is another well-known important factor influencing climate change, and its relationship with temperature [86], precipitation [87], and runoff [88,89,90] have been studied by many scholars. It has been suggested that the NAO reflects the strength of the mid-latitude westerly circulation, and its variability significantly correlates with climate elements such as temperature and precipitation [91]. Therefore, the reconstructed RHAS series were compared with the NAO index [74], and a marked correlation was found between the RHAS and the NAO index. The mechanism of influence is that moisture in the Tarim River Area comes largely from westerly wind circulation carrying water vapour. The AMO and NAO indices are global atmospheric pressure fields that record westerly circulation intensities. The effect of the westerly circulation on the regional wet and dry variability is reflected. When the westerly circulation is strong, the region is arid; conversely, when it is weak, the area is damp.
The Asia-India-Pacific convergence zone affects short-term climate anomalies in China [92]. Yang, Lianmei et al. [93] found that moisture of the Indian Ocean is conveyed northward to Xinjiang with the westerly winds, thus affecting the early summer precipitation in Xinjiang. Bothe et al. [2] suggest that water vapour has been transported into the Tarim River basin from the Indian Ocean. Meanwhile, southeastern monsoon moisture primarily affects eastern China from the Pacific Ocean, and only when the easterly flow is strong can it enter the Tarim River Region and contribute to precipitation in southern Xinjiang [94]. The RHAS series correlates well with the PDO index [75]. At the same time, the enhanced and westerly shift of the East Asian Pacific teleconnection along the East Asian coast has facilitated an increase in summer precipitation in Xinjiang [70]. It has been suggested that global warming and PDO may soon help to reduce the severity of drought in Xinjiang, Northwest China, and Tibet [95]. Wu et al. [96] found that the local climate of the Tarim River Region correlated highly to the local moisture cycle and that the warming and humidification trends in the western Tien Shan do not persist for long due to the reduced annual mean moisture input from the west and northwest to the Tarim Basin, which is blocked by the “U-shaped” topography. The reconstructed RHAS series shows signs of a switch from “warm–wet” to “warm–dry” in the 2010s, with an increasing trend towards aridity. The causes of aridification since the 21st century are complex, and available studies suggest that the AMO and ENSO are closely related to the aridification in Xinjiang [97]. In addition, the strength of the westerly circulation is nonlinearly modified by perturbations such as ENSO, NAO, and the East Asian monsoon, which affect moisture conveyance in the Tarim River Region [98]. Mechanisms driving wet and dry changes are complex, and further research in this region is needed to gain insight into climate change.

5. Conclusions

The April–September mean relative humidity from 1824 was reconstructed using tree-ring stable carbon isotope variations of P. euphratica. in the Alaer region, the upper Tarim River Basin, northwestern China. Our reconstructed RHAS series closely matches other high-resolution paleoclimate reconstructions surrounding our study area. The reconstruction RHAS series indicates a predominantly “warm–dry” climate over the last 195 years. We also observe that since the 1980s, there has been a trend towards increasing humidity in Northwest China. There are indications of a shift in the direction from “warm–wet” to “warm–dry” with growing drought in the 2010s. Moreover, the reconstructed RHAS series is positively related to AMO and negatively associated with NAO, reflecting the impact of westerly circulation on regional wet and dry variability and the possible influence of PDO on relative humidity. Together, these factors influence the changes in relative humidity in the upper Tarim River Basin, Northwest China.

Author Contributions

Conceptualisation, methodology, software, and writing–original draft, Y.Y.; supervision, project administration, and funding acquisition, Y.L.; supervision, methodology, and editing, Q.L. and M.R.; chart drawing, and data curation, Q.C.; investigation, and data curation, C.S.; addition of the financing, H.S. and T.L.; investigation, M.Y. and T.Z. All authors have read and agreed to the published version of the manuscript.

Funding

The study was financially supported by grants from the National Natural Science Foundation of China (U1803245), the second Tibetan Plateau Scientific Expedition and Research Program (STEP, 2019QZKK0101), the Strategic Priority Research Program of the Chinese Academy of Sciences (XDB40010300, XDA23070202), the State Key Laboratory of Loess and Quaternary Geology, Institute of Earth Environment, CAS (SKLLQG2049), and the China Desert Meteorological Science Research Foundation (SQJ2022012).

Data Availability Statement

Meteorological data are contained within the article, and all data sources are mentioned.

Acknowledgments

We gratefully acknowledge Congxi Fang for his software support. We also express our gratitude to Linlin Cui, Pei Li, Yifan Ma, Youping Chen, and Quan Zhang for their help in sample collection.

Conflicts of Interest

The authors declare no conflict of interest.

References

  1. Shi, Z.; Zhou, P.; Li, X.; Cheng, H.; Sha, Y.; Xie, X.; Liu, H.; Wu, J.; Liu, X. Distinct Holocene precipitation trends over arid Central Asia and linkages to westerlies and Asian monsoon. Quat. Sci. Rev. 2021, 266, 107055. [Google Scholar] [CrossRef]
  2. Bothe, O.; Fraedrich, K.; Zhu, X. Precipitation climate of Central Asia and the large-scale atmospheric circulation. Theor. Appl. Climatol. 2012, 108, 345–354. [Google Scholar] [CrossRef]
  3. Chen, F.H.; Chen, J.H.; Holmes, J.; Boomer, I.; Austin, P.; Gates, J.B.; Wang, N.L.; Brooks, S.J.; Zhang, J.W. Moisture changes over the last millennium in arid central Asia: A review, synthesis and comparison with monsoon region. Quat. Sci. Rev. 2010, 29, 1055–1068. [Google Scholar] [CrossRef]
  4. Wang, J.; Chen, F.; Jin, L.; Bai, H. Characteristics of the dry/wet trend over arid central Asia over the past 100 years. Clim. Res. 2010, 41, 51–59. [Google Scholar] [CrossRef] [Green Version]
  5. IPCC. Climate Change 2021: The Physical Science Basis; Cambridge University Press: Cambridge, UK, 2021; in press. [Google Scholar]
  6. Liu, Y.; Song, H.; An, Z.; Sun, C.; Zeng, X. Recent anthropogenic curtailing of Yellow River runoff and sediment load is unprecedented over the past 500 y. Proc. Natl. Acad. Sci. USA 2020, 117, 201922349. [Google Scholar]
  7. Cook, E.R.; Anchukaitis, K.J.; Buckley, B.M.; D’Arrigo, R.D.; Jacoby, G.C.; Wright, W.E. Asian monsoon failure and megadrought during the last millennium. Science 2010, 328, 486–489. [Google Scholar] [CrossRef] [PubMed] [Green Version]
  8. Zhang, T.; Zhang, R.; Yuan, Y.; Gao, Y.; Wei, W.; Diushen, M.; He, Q.; Shang, H.; Wang, J. Reconstructed precipitation on a centennial timescale from tree rings in the western Tien Shan Mountains, Central Asia. Quat. Int. 2015, 358, 58–67. [Google Scholar] [CrossRef]
  9. Opała-Owczarek, M.; Niedźwiedź, T. Last 1100 yr of precipitation variability in western central Asia as revealed by tree-ring data from the Pamir-Alay. Quat. Res. 2019, 91, 81–95. [Google Scholar] [CrossRef] [Green Version]
  10. Chen, F.; Yuan, Y.J.; Wei, W.S.; Zhang, T.W.; Shang, H.M.; Zhang, R. Precipitation reconstruction for the southern Altay Mountains (China) from tree rings of Siberian spruce reveals recent wetting trend. Dendrochronologia 2014, 32, 266–272. [Google Scholar] [CrossRef]
  11. Chen, F.; Yuan, Y.J.; Chen, F.H.; Wei, W.S.; Yu, S.L.; Chen, X.J.; Fan, Z.A.; Zhang, R.B.; Zhang, T.W.; Shang, H.M. A 426-year drought history for Western Tian Shan, Central Asia, inferred from tree rings and linkages to the North Atlantic and Indo–West Pacific Oceans. Holocene 2013, 23, 1095–1104. [Google Scholar] [CrossRef]
  12. Wang, T.; Bao, A.; Xu, W.; Yu, R.; Zhang, Q.; Jiang, L.; Nzabarinda, V. Tree-ring-based assessments of drought variability during the past 400 years in the Tianshan mountains, arid Central Asia. Ecol. Indic. 2021, 126, 107702. [Google Scholar] [CrossRef]
  13. Xu, G.; Liu, X.; Trouet, V.; Treydte, K.; Wu, G.; Chen, T.; Sun, W.; An, W.; Wang, W.; Zeng, X. Regional drought shifts (1710–2010) in East Central Asia and linkages with atmospheric circulation recorded in tree-ring δ18O. Clim. Dyn. 2019, 52, 713–727. [Google Scholar] [CrossRef] [Green Version]
  14. Jiang, P.; Liu, H.; Wu, X.; Wang, H. Tree-ring-based SPEI reconstruction in central Tianshan Mountains of China since A.D. 1820 and links to westerly circulation. Int. J. Climatol. 2016, 37, 2863–2872. [Google Scholar] [CrossRef]
  15. Li, T.; Liu, Y.; Li, Q.; Song, H.; Cai, Q.; Sun, C.; Cui, L. Impact of the North Atlantic and the Indian Ocean on the summer hydroclimate over East Central Asia: A case study in the central Tianshan Mountains. Glob. Planet. Change 2022, 216, 103924. [Google Scholar] [CrossRef]
  16. Zhang, T.; Zhang, R.; Lu, B.; Mambetov, B.T.; Kelgenbayev, N.; Dosmanbetov, D.; Maisupova, B.; Chen, F.; Yu, S.; Shang, H. tree-ring chronologies development and vegetation index reconstruction for the Alatau Mountains, Central Asia. Geochronometria 2018, 45, 107–118. [Google Scholar] [CrossRef] [Green Version]
  17. Zhang, R.; Qin, L.; Shang, H.; Yu, S.; Gou, X.; Mambetov, B.T.; Bolatov, K.; Zheng, W.; Ainur, U.; Bolatova, A. Climatic change in southern Kazakhstan since 1850 C.E. inferred from tree rings. Int. J. Biometeorol. 2020, 64, 841–851. [Google Scholar] [CrossRef]
  18. Chen, Y.; Yang, Q.; Luo, Y.; Shen, Y.; Pan, X.; Li, L.; Li, Z. Ponder on the issues of water resources in the arid region of northwest China. Arid Land Geogr. 2012, 35, 1–9. [Google Scholar]
  19. Chen, Y.N.; Xu, C.C.; Hao, X.M.; Li, W.H.; Chen, Y.P.; Zhu, C.G.; Ye, Z.X. Fifty-year climate change and its effect on annual runoff in the Tarim River Basin, China. Quat. Int. 2009, 208, 53–61. [Google Scholar]
  20. Sun, J.Y.; Liu, Y.; Cai, Q.F.; Park, W.K.; Li, B.S.; Shi, J.F.; Yi, L.; Song, H.M.; Li, Q. Climatic and hydrological change of Ejin, Inner Mongolia, China during the past 233 years recorded in tree rings of Populus euphratica. Quat. Sci. 2006, 26, 799–807. (In Chinese) [Google Scholar]
  21. Zhang, T.W.; Shang, H.M.; Fan, Y.T.; Yu, S.L.; Zhang, R.B.; Qin, L.; Jiang, S.X. A 475-year tree-ring-width record of streamflow for the Qingshui River originating in the southern slope of the central Tianshan Mountains, China. Geogr. Ann. A 2020, 102, 247–266. [Google Scholar] [CrossRef]
  22. Zhou, H.H.; Chen, Y.N.; Hao, X.M.; Zhao, Y.; Fang, G.H.; Yang, Y.H. Tree rings: A key ecological indicator for reconstruction of groundwater depth in the lower Tarim River, Northwest China. Ecohydrology 2019, 12, e2142. [Google Scholar] [CrossRef]
  23. Zhou, H.; Li, W.; Sun, H. Reconstruction of groundwater depth using tree-rings of Populus euphratica in the Lower Tarim River. Sci. Silvae Sin. 2018, 54, 11–16. [Google Scholar]
  24. Zhao, S.; Wei, Q.; Xu, H.; Guo, H.; Wang, X.; Zhao, X. Response of the tree-ring to ecological environment change of the Tarim River. J. Desert Res. 2017, 37, 594–600. [Google Scholar]
  25. Deng, X.Y.; Xu, H.L.; Ye, M.; Li, B.L.; Fu, J.Y.; Yang, Z.F. Impact of long-term zero-flow and ecological water conveyance on the radial increment of Populus euphratica in the lower reaches of the Tarim River, Xinjiang, China. Reg. Environ. Change 2015, 15, 13–23. [Google Scholar] [CrossRef]
  26. Yu, P.J.; Xu, H.L.; Ye, M.; Liu, S.W.; Gong, J.J.; An, H.Y.; Fu, J.Y. Effects of ecological water conveyance on the ring increments of Populus euphratica in the lower reaches of Tarim River. J. For. Res. 2012, 17, 413–420. [Google Scholar] [CrossRef]
  27. Lang, P.; Ahlborn, J.; Schaefer, P.; Wommelsdorf, T.; Jeschke, M.; Zhang, X.M.; Thomas, F.M. Growth and water use of Populus euphratica trees and stands with different water supply along the Tarim River, NW China. For. Ecol. Manag. 2016, 380, 139–148. [Google Scholar] [CrossRef]
  28. Lang, P.; Jeschke, M.; Wommelsdorf, T.; Backes, T.; Lv, C.Y.; Zhang, X.M.; Thomas, F.M. Wood harvest by pollarding exerts long-term effects on Populus euphratica stands in riparian forests at the Tarim River, NW China. For. Ecol. Manag. 2015, 353, 87–96. [Google Scholar] [CrossRef]
  29. Li, H.; Feng, J.; Bai, L.; Zhang, J. Populus euphratica phenology and its response to climate change in the Upper Tarim River Basin, NW China. Forests 2021, 12, 1315. [Google Scholar] [CrossRef]
  30. McCarroll, D.; Pawellek, F. Stable carbon isotope ratios of Pinus sylvestris from northern Finland and the potential for extracting a climate signal from long Fennoscandian chronologies. Holocene 2001, 11, 517–526. [Google Scholar] [CrossRef]
  31. McCarroll, D.; Loader, N.J. Stable isotopes in tree rings. Quat. Sci. Rev. 2004, 23, 771–801. [Google Scholar] [CrossRef]
  32. Bale, R.J.; Robertson, I.; Salzer, M.W.; Loader, N.J.; Leavitt, S.W.; Gagen, M.; Harlan, T.P.; McCarroll, D. An annually resolved bristlecone pine carbon isotope chronology for the last millennium. Quat. Res. 2011, 76, 22–29. [Google Scholar] [CrossRef]
  33. Young, G.H.F.; Bale, R.J.; Loader, N.J.; McCarroll, D.; Nayling, N.; Vousden, N. Central England temperature since AD 1850: The potential of stable carbon isotopes in British oak trees to reconstruct past summer temperatures. J. Quat. Sci. 2012, 27, 606–614. [Google Scholar] [CrossRef]
  34. Wang, W.Z.; Liu, X.H.; Shao, X.M.; Leavitt, S.; Xu, G.B.; An, W.L.; Qin, D.H. A 200 year temperature record from tree ring δ13C at the Qaidam Basin of the Tibetan Plateau after identifying the optimum method to correct for changing atmospheric CO2 and δ13C. J. Geophys. Res.-Biogeosci. 2011, 116, 1–12. [Google Scholar] [CrossRef]
  35. Liu, Y.; Wang, Y.; Li, Q.; Song, H.; Linderholm, H.W.; Leavitt, S.W.; Wang, R.; An, Z. Tree-ring stable carbon isotope-based May-July temperature reconstruction over Nanwutai, China, for the past century and its record of 20th-century warming. Quat. Sci. Rev. 2014, 93, 67–76. [Google Scholar] [CrossRef]
  36. Schubert, B.A.; Timmermann, A. Reconstruction of seasonal precipitation in Hawai’i using high-resolution carbon isotope measurements across tree rings. Chem. Geol. 2015, 417, 273–278. [Google Scholar] [CrossRef] [Green Version]
  37. Liu, Y.; Ma, L.M.; Leavitt, S.W.; Cai, Q.F.; Liu, W.G. A preliminary seasonal precipitation reconstruction from tree-ring stable carbon isotopes at Mt. Helan, China, since AD 1804. Glob. Planet. Change 2004, 41, 229–239. [Google Scholar] [CrossRef]
  38. Liu, Y.; Wu, Z.D.; Leavitt, S.W.; Hughes, M.K. Stable carbon isotope in tree rings from Huangling, China and climatic variation. Sci. China Ser. D-Earth Sci. 1996, 39, 152–161. [Google Scholar]
  39. Xu, G.; Wu, G.; Liu, X.; Chen, T.; Wang, B.; Hudson, A.; Trouet, V. Age-Related Climate Response of Tree-Ring δ13C and δ18O From Spruce in Northwestern China, with Implications for Relative Humidity Reconstructions. J. Geophys. Res.-Biogeosci. 2020, 125, e2019JG005513. [Google Scholar] [CrossRef]
  40. Liu, Y.; Ta, W.Y.; Li, Q.; Song, H.M.; Sun, C.F.; Cai, Q.F.; Liu, H.; Wang, L.; Hu, S.L.; Sun, J.Y.; et al. Tree-ring stable carbon isotope-based April-June relative humidity reconstruction since AD 1648 in Mt. Tianmu, China. Clim. Dyn. 2018, 50, 1733–1745. [Google Scholar] [CrossRef]
  41. Fan, Y.T.; Shang, H.M.; Wu, Y.; Li, Q. Tree-ring width and carbon isotope chronologies track temperature, humidity, and baseflow in the Tianshan Mountains, Central Asia. Forests 2020, 11, 1308. [Google Scholar] [CrossRef]
  42. Marchand, W.; Girardin, M.P.; Hartmann, H.; Depardieu, C.; Isabel, N.; Gauthier, S.; Boucher, E.; Bergeron, Y. Strong overestimation of water-use efficiency responses to rising CO2 in tree-ring studies. Glob. Change Biol. 2020, 26, 4538–4558. [Google Scholar] [CrossRef] [PubMed]
  43. Rahman, M.; Islam, M.; Gebrekirstos, A.; Brauning, A. Disentangling the effects of atmospheric CO2 and climate on intrinsic water-use efficiency in South Asian tropical moist forest trees. Tree Physiol. 2020, 40, 904–916. [Google Scholar] [CrossRef] [PubMed]
  44. Liu, X.H.; Wang, W.Z.; Xu, G.B.; Zeng, X.M.; Wu, G.J.; Zhang, X.W.; Qin, D.H. Tree growth and intrinsic water-use efficiency of inland riparian forests in northwestern China: Evaluation via δ13C and δ18O analysis of tree rings. Tree Physiol. 2014, 34, 966–980. [Google Scholar] [CrossRef] [PubMed] [Green Version]
  45. Holmes, R.L. Computer-assisted quality control in tree-ring dating and measurement. Tree-Ring Bull. 1983, 43, 69–78. [Google Scholar]
  46. Cook, E.R. A Time Series Analysis Approach to Tree Ring Standardisation; University of Arizona: Tucson, AZ, USA, 1985. [Google Scholar]
  47. Esper, J.; Frank, D.C.; Battipaglia, G.; Büntgen, U.; Holert, C.; Treydte, K.; Siegwolf, R.; Saurer, M. Low-frequency noise in δ13C and δ18O tree ring data: A case study of Pinus uncinata in the Spanish Pyrenees. Glob. Biogeochem. Cycles 2010, 24, GB4018. [Google Scholar] [CrossRef] [Green Version]
  48. Leavitt, S.W.; Long, A. Sampling Strategy for Stable Carbon Isotope Analysis of Tree Rings in Pine. Nature 1984, 311, 145–147. [Google Scholar] [CrossRef]
  49. Coplen, T.B. Discontinuance of SMOW and PDB. Nature 1995, 375, 285. [Google Scholar] [CrossRef]
  50. Bretherton, C.S.; Widmann, M.; Dymnikov, V.P.; Wallace, J.M.; Bladé, I. The effective number of spatial degrees of freedom of a time-varying field. J. Clim. 1999, 12, 1990–2009. [Google Scholar] [CrossRef]
  51. Wigley, T.M.; Briffa, K.R.; Jones, P.D. On the average value of correlated time series, with applications in dendroclimatology and hydrometeorology. J. Appl. Meteorol. Clim. 1984, 23, 201–213. [Google Scholar] [CrossRef]
  52. Leavitt, S.W. Tree-ring C-H-O isotope variability and sampling. Sci. Total Environ. 2010, 408, 5244–5253. [Google Scholar] [CrossRef]
  53. McCarroll, D.; Gagen, M.H.; Loader, N.J.; Robertson, I.; Anchukaitis, K.J.; Los, S.; Young, G.H.F.; Jalkanen, R.; Kirchhefer, A.; Waterhouse, J.S. Correction of tree ring stable carbon isotope chronologies for changes in the carbon dioxide content of the atmosphere. Geochim. Cosmochim. Acta 2009, 73, 1539–1547. [Google Scholar] [CrossRef]
  54. Efron, B. Bootstrap Methods: Another Look at the Jackknife. Ann. Stat. 1979, 7, 1–26. [Google Scholar]
  55. Tu, W.X. The Impact of River Runoff on Radial Growth of Populus euphratica in the Tarim River. Master’s Thesis, Xinjiang Normal University, Urumqi, China, 2014. (In Chinese). [Google Scholar]
  56. Durbin, J.; Watson, G.S. Testing for serial correlation in least squares regression.III. Biometrika 1971, 58, 1–19. [Google Scholar] [CrossRef]
  57. Farquhar, G.; O’Leary, M.; Berry, J. On the relationship between carbon isotope discrimination and the intercellular carbon dioxide concentration in Leaves. Funct. Plant Biol. 1982, 9, 121–137. [Google Scholar] [CrossRef]
  58. Liu, Y.; Wang, R.Y.; Leavitt, S.W.; Song, H.M.; Linderholm, H.W.; Li, Q.; An, Z.S. Individual and pooled tree-ring stable-carbon isotope series in Chinese pine from the Nan Wutai region, China: Common signal and climate relationships. Chem. Geol. 2012, 330, 17–26. [Google Scholar] [CrossRef]
  59. Hemming, D.L.; Switsur, V.R.; Waterhouse, J.S.; Heaton, T.; Ca Rter, A. Climate variation and the stable carbon isotope composition of tree ring cellulose: An intercomparison of Quercus robur, Fagus sylvatica and Pinus silvestris. Tellus 2010, 50, 25–33. [Google Scholar] [CrossRef] [Green Version]
  60. Ma, L.M.; Liu, Y.; Zhao, J.F.; An, Z.S. Response of stable-carbon isotope composition of different tree-ring compounds to climatic change. Acta Ecol. Sin. 2003, 23, 2607–2613. (In Chinese) [Google Scholar]
  61. Cao, S.K.; Feng, Q.; Si, J.H.; Cang, Z.Q.; Chen, K.L.; Cao, G.C. Relationships of photosynthesis and transpiration of Populus euphratica with their affecting factors. J. Arid Land Resour. Environ. 2012, 26, 155–159. (In Chinese) [Google Scholar]
  62. Dong, A.X.; Li, Y.H.; Zhang, Y. Characteristics and formation of natural factors of extreme drought in China around 1900. Plateau Meteorol. 2015, 34, 771–776. (In Chinese) [Google Scholar]
  63. The Fourteenth Division of the Xinjiang Production and Construction Corps History Compilation Committee. The Local Chronicles of the Fourteenth Division of Xinjiang Production and Construction Corps; Xinjiang People’s Publishing House: Urumqi, China, 2000; p. 20. (In Chinese) [Google Scholar]
  64. Shi, Y.F.; Shen, Y.P.; Hu, R.J. Preliminary study on signal, impact and foreground of climatic shift from Warm-Dry to Warm-Humid in Northwest China. J. Glaciol. Geocryol. 2012, 24, 219–226. (In Chinese) [Google Scholar]
  65. Shi, Y.F.; Shen, Y.P.; Li, D.L.; Zhang, G.W.; Ding, Y.J.; Hu, R.J.; Kang, E.S. Discussion on the present climate change from Warm-dry to Warm-wet in Northwest China. Quat. Sci. 2003, 23, 152–164. (In Chinese) [Google Scholar]
  66. Liu, X. History of the Xinjiang Disaster; Xinjiang People’s Publishing House: Urumqi, China, 1999; pp. 205–214. (In Chinese) [Google Scholar]
  67. Tan, X.W.; Xue, L.Q. Risk Assessment of Drought Warning and Disaster Effects in Tarim Basin; Southeast University Press: Nanjing, China, 2013; pp. 1–2. (In Chinese) [Google Scholar]
  68. Ahmad, S.; Zhu, L.; Yasmeen, S.; Zhang, Y.; Wang, X. A 424-year tree-ring based PDSI reconstruction of Cedrus deodara D. Don from Chitral Hindukush Range of Pakistan: Linkages to the ocean oscillations. Clim. Past 2020, 16, 783–798. [Google Scholar] [CrossRef]
  69. Li, J.; Gou, X.; Cook, E.R.; Chen, F. Tree-ring based drought reconstruction for the central Tien Shan area in northwest China. Geophys. Res. Lett. 2006, 33, 359–377. [Google Scholar] [CrossRef] [Green Version]
  70. Chen, H.P.; Sun, J.Q.; Fan, K. Possible mechanism for the interdecadal change of Xinjiang summer precipitation. Chin. J. Geophys. 2012, 55, 1844–1851. (In Chinese) [Google Scholar] [CrossRef]
  71. Zhao, Y.; Zhang, H. Impacts of SST warming in tropical Indian Ocean on CMIP5 model-projected summer rainfall changes over Central Asia. Clim. Dyn. 2016, 46, 3223–3238. [Google Scholar] [CrossRef] [Green Version]
  72. Tao, H.; Mao, W.Y.; Huang, J.L.; Zhai, J.Q. Drought and wetness variability in the Tarim River basin and possible associations with large-scale circulation. Adv. Water Sci. 2014, 25, 45–52. (In Chinese) [Google Scholar]
  73. Kerr, R.A. A North Atlantic Climate Pacemaker for the Centuries. Science 2000, 288, 1984–1985. [Google Scholar] [CrossRef] [Green Version]
  74. Jones, P.D.; Jónsson, T.; Wheeler, D. Extension to the North Atlantic Oscillation using early instrumental pressure observations from Gibraltar and south-west Iceland. Int. J. Climatol. J. R. Meteorol. Soc. 1997, 17, 1433–1450. [Google Scholar] [CrossRef]
  75. Mantua, N.J.; Hare, S.R. The Pacific Decadal Oscillation. J. Oceanogr. 2002, 58, 35–44. [Google Scholar] [CrossRef]
  76. Valdes-Manzanilla, A. Historical floods in Tabasco and Chiapas during sixteenth-twentieth centuries. Nat. Hazards 2016, 80, 1563–1577. [Google Scholar] [CrossRef]
  77. Maxwell, J.T.; Harley, G.L. Increased tree-ring network density reveals more precise estimations of sub-regional hydroclimate variability and climate dynamics in the Midwest, USA. Clim. Dyn. 2017, 49, 1479–1493. [Google Scholar] [CrossRef]
  78. Li, F.; Orsolini, Y.J.; Wang, H.; Gao, Y.; He, S. Modulation of the Aleutian–Icelandic low seesaw and its surface impacts by the Atlantic multidecadal oscillation. Adv. Atmos. Sci. 2018, 35, 95–105. [Google Scholar] [CrossRef] [Green Version]
  79. Li, J.X.; Li, J.B.; Li, T.; Au, T.F. 351-year tree ring reconstruction of the Gongga Mountains winter minimum temperature and its relationship with the Atlantic Multidecadal Oscillation. Clim. Change 2021, 165, 49. [Google Scholar] [CrossRef]
  80. Li, T.; Li, J.B. A 564-year annual minimum temperature reconstruction for the east central Tibetan Plateau from tree rings. Glob. Planet. Change 2017, 157, 165–173. [Google Scholar] [CrossRef]
  81. Liang, H.X.; Lyu, L.X.; Wahab, M. A 382-year reconstruction of August mean minimum temperature from tree-ring maximum latewood density on the southeastern Tibetan Plateau, China. Dendrochronologia 2016, 37, 1–8. [Google Scholar] [CrossRef]
  82. Wang, J.L.; Yang, B.; Qin, C.; Kang, S.Y.; He, M.H.; Wang, Z.Y. Tree-ring inferred annual mean temperature variations on the southeastern Tibetan Plateau during the last millennium and their relationships with the Atlantic Multidecadal Oscillation. Clim. Dyn. 2014, 43, 627–640. [Google Scholar] [CrossRef]
  83. Liu, R.; Liu, Y.; Li, Q.; Song, H.; Li, X.; Sun, C.; Cai, Q.; Song, Y. Seasonal Palmer drought severity index reconstruction using tree-ring widths from multiple sites over the central-western Da Hinggan Mountains, China since 1825 AD. Clim. Dyn. 2019, 53, 3661–3674. [Google Scholar] [CrossRef]
  84. Wang, X.C.; Brown, P.M.; Zhang, Y.N.; Song, L.P. Imprint of the Atlantic Multidecadal Oscillation on tree-ring widths in Northeastern Asia since 1568. PLoS ONE 2011, 6, e22740. [Google Scholar] [CrossRef]
  85. O’Reilly, C.; Woollings, T.; Zanna, L. The dynamical influence of the Atlantic Multidecadal Oscillation on continental climate. In Proceedings of the Egu General Assembly Conference, Vienna, Austria, 23–28 April 2017. [Google Scholar]
  86. D’Arrigo, R.; Anchukaitis, K.J.; Buckley, B.; Cook, E.; Wilson, R. Regional climatic and North Atlantic Oscillation signatures in West Virginia red cedar over the past millennium. Glob. Planet. Change 2012, 84–85, 8–13. [Google Scholar] [CrossRef]
  87. Laanelaid, A.; Helama, S.; Kull, A.; Timonen, M.; Jaagus, J. Common growth signal and spatial synchrony of the chronologies of tree-rings from pines in the Baltic Sea region over the last nine centuries. Dendrochronologia 2012, 30, 147–155. [Google Scholar] [CrossRef]
  88. Ling, H.B.; Deng, X.Y.; Long, A.H.; Gao, H.F. The multi-time-scale correlations for drought-flood index to runoff and North Atlantic Oscillation in the headstreams of Tarim River, Xinjiang, China. Hydrol. Res. 2017, 48, 253–264. [Google Scholar] [CrossRef] [Green Version]
  89. Ling, H.; Xu, H.; Wei, S.; Zhang, Q. Regional climate change and its effects on the runoff of Manas River, Xinjiang, China. Environ. Earth Sci. 2011, 64, 2203–2213. [Google Scholar] [CrossRef]
  90. Hongjun, L.I.; Zhihong, J.; Qing, Y. Association of North Atlantic Oscillations with Aksu River run off in China. J. Geogr. Sci. 2009, 19, 12–24. [Google Scholar]
  91. Thompson, D.W.; Wallace, J.M. The Arctic Oscillation signature in the wintertime geopotential height and temperature fields. Geophys. Res. Lett. 1998, 25, 1297–1300. [Google Scholar] [CrossRef] [Green Version]
  92. Wu, G.X.; Li, J.P.; Zhou, T.J.; Lu, R.Y.; Yu, Y.Q.; Zhu, J.; MU, M.; Duan, A.M.; Ren, R.C.; Ding, Y.H.; et al. The key region affecting the short-term climate variations in China: The joining area of Asia and the Indian-Pacific Ocean. Adv. Earth Sci. 2006, 21, 1109–1118. (In Chinese) [Google Scholar]
  93. Yang, M.L.; Li, X.; Zhang, G.Y. Some advances and problems in some advances and problems in the study of heavy rain in Xinjiang. Clim. Environ. Res. 2011, 16, 188–198. (In Chinese) [Google Scholar]
  94. Liu, R.; Yang, Q. Calculation and analysis of water vapor transportation and its net come in Xinjiang. J. Desert Res. 2010, 30, 1221–1228. (In Chinese) [Google Scholar]
  95. Apurv, T.; Xu, Y.P.; Wang, Z.; Cai, X.M. Multidecadal Changes in Meteorological Drought Severity and Their Drivers in Mainland China. J. Geophys. Res.-Atmos. 2019, 124, 12937–12952. [Google Scholar] [CrossRef]
  96. Wu, Y.P.; Shen, Y.P.; Li, B.L. Possible physical mechanism of water vapor transport over Tarim River Basin. Ecol. Complex. 2012, 9, 63–70. [Google Scholar] [CrossRef]
  97. Yao, J.Q.; Tuoliewubieke, D.; Chen, J.; Huo, W.; Hu, W.F. Identification of Drought Events and Correlations with Large-Scale Ocean-Atmospheric Patterns of Variability: A Case Study in Xinjiang, China. Atmosphere 2019, 10, 94. [Google Scholar] [CrossRef] [Green Version]
  98. Wu, P.Y. The Impact of Climate Change on Atmospheric Water Cycle over the Tarim River Basin and Its Mechanism. Ph.D. Thesis, Lanzhou University, Lanzhou, China, 2011. (In Chinese). [Google Scholar]
Figure 1. Map of the sampling (Alaer, ALE) site and nearby meteorological station in Alaer, Xinjiang, China.
Forests 14 00682 g001
Figure 2. Distribution of temperature, precipitation, and relative humidity as monthly averages for meteorological stations in Alaer from 1959 to 2018.
Forests 14 00682 g002
Figure 3. The δ13Cpin series in Alaer. (a) The δ13Cpin data of the four cores. (b) The master δ13Cpin series produced by averaging the four z-scored individual series. (c) The mean inter-series correlation (Rbar) and the running EPS were calculated using 30-year windows and a lag time of 15 years.
Forests 14 00682 g003
Figure 4. Correlation of tree-ring Δ13C series with climatic factors for 1959–2018.
Forests 14 00682 g004
Figure 5. Relative humidity reconstruction on Alaer, Xinjiang, China. (a) A comparison of observed and reconstructed series of RHAS during the period 1959–2018. (b) Tree-ring reconstruction of the relative humidity drawn annually from 1824 to 2018 (thin line) and a low-pass filter with a 10-year loess filter for each calendar year (bold line).
Forests 14 00682 g005
Figure 6. The comparisons between the reconstructed RHAS series (blue line) and (a) a tree-ring width-based PDSIMA reconstruction of the Hindu Kush mountains, Pakistan (black line) [68]. (b) A tree-ring width-based PDSIAJ reconstruction on the central Tien Shan mountains (black line) [69].
Forests 14 00682 g006
Figure 7. Spatial correlations between (a) reconstructed RHAS and April–September HadSST, and (b) observed RHAS and HadSST from 1959 to 2018.
Forests 14 00682 g007
Figure 8. Comparisons between the reconstructed RHAS series on Alaer (blue line) and the AMO, NAO, and PDO series’ (red lines). (a) Comparisons of RHAS reconstruction and the reconstructed annual AMO [73]. (b) Comparisons of RHAS reconstruction and April–September averaged NAO [74]. (c) Comparisons of RHAS reconstruction and the reconstructed annual PDO [75].
Forests 14 00682 g008
Table 1. Correlation statistics between the individual tree-ring δ13Cpin series of Alaer (r, N/EDOF).
ALE-03AALE-15AALE-26BALE-54B
ALE-15A0.55, 247/217
ALE-26B0.67, 243/2140.56, 244/178
ALE-54B0.61, 249/2450.55, 246/2380.53, 242/192
ALE_com0.86, 251/2280.78, 248/1960.84, 244/1940.83, 250/244
Note: All p < 0.001.
Table 2. Statistical characteristics of the individual tree-ring δ13Cpin series of Alaer.
Statistical ParametersALE-03AALE-15AALE-26BALE-54BALE_com
Minimum (‰)−27.56−26.2−27.36−27.39−26.75
Maximum (‰)−22.49−21.93−22.69−22.84−22.83
Mean (‰)−24.71−23.78−25.07−24.90−24.60
Standard deviation (‰)0.790.640.780.810.64
Variance0.630.410.610.650.41
Skewness−1.06−0.66−0.24−0.65−0.63
Kurtosis2.122.110.800.741.58
AR1−0.16−0.4−0.39−0.04−0.29
Table 3. Partial correlation analysis between the tree-ring Δ13C chronology in Alaer and climatic factors from April to September (1959–2018).
Controlled VariableΔ13C vs. Mean TASΔ13C vs. Mean PASΔ13C vs. Mean RHAS
mean TAS 0.150.76 *
PAS−0.09 0.77 *
RHAS0.18−0.25
Note. Mean TAS and mean RHAS are the mean April–September temperature and RH, respectively. PAS is the total precipitation from April to September. * Significant at the 99% confidence level.
Table 4. Verification results from Bootstrap and Jackknife methods.
Statistical ItemsJackknifeBootstrap (100 Iterations)
Mean (Range)Mean (Range)
r−0.78 (−0.79–0.76)−0.77 (−0.89–0.65)
R20.6 (0.57–0.63)0.61 (0.4–0.77)
R2adj0.6 (0.57–0.62)0.6 (0.39–0.77)
SE2.59 (2.5–2.61)2.52 (2.1–2.97)
F85.05 (75.15–93.96)93.29 (38.16–193.43)
p1 × 10−12 (1 × 10⁻¹³–6 × 10⁻¹²)1 × 10⁻⁹ (6 × 10⁻²⁰–7 × 10⁻⁸)
D/W1.34 (1.21–1.41)1.97 (1.2–2.49)
Disclaimer/Publisher’s Note: The statements, opinions and data contained in all publications are solely those of the individual author(s) and contributor(s) and not of MDPI and/or the editor(s). MDPI and/or the editor(s) disclaim responsibility for any injury to people or property resulting from any ideas, methods, instructions or products referred to in the content.

