Article

Analysis of Spectral Separability for Detecting Burned Areas Using Landsat-8 OLI/TIRS Images under Different Biomes in Brazil and Portugal

by
Admilson da Penha Pacheco
1,
Juarez Antonio da Silva Junior
1,
Antonio Miguel Ruiz-Armenteros
2,3,4,*,
Renato Filipe Faria Henriques
5 and
Ivaneide de Oliveira Santos
5
1
Center for Technology and Geosciences, Department of Cartographic and Surveying Engineering, Federal University of Pernambuco, Av. Prof. Moraes Rego, 1235, Cidade Universitária, Recife 50670-901, Brazil
2
Department of Cartographic, Geodetic and Photogrammetry Engineering, University of Jaén, Campus Las Lagunillas s/n, 23071 Jaén, Spain
3
Microgeodesia Jaén Research Group (PAIDI RNM-282), University of Jaén, Campus Las Lagunillas s/n, 23071 Jaén, Spain
4
Center for Advanced Studies on Earth Sciences, Energy and Environment CEACTEMA, University of Jaén, Campus Las Lagunillas, s/n, 23071 Jaén, Spain
5
Department of Earth Sciences, Institute of Earth Sciences (ICT), University of Minho (UMinho), Campus de Gualtar, 4710-057 Braga, Portugal
*
Author to whom correspondence should be addressed.
Forests 2023, 14(4), 663; https://doi.org/10.3390/f14040663
Submission received: 18 February 2023 / Revised: 20 March 2023 / Accepted: 21 March 2023 / Published: 23 March 2023
(This article belongs to the Special Issue Forest Fires Prediction and Detection)

Abstract

:
Fire is one of the natural agents with the greatest impact on the terrestrial ecosystem and plays an important ecological role in a large part of the terrestrial surface. Remote sensing is an important technique applied in mapping and monitoring changes in forest landscapes affected by fires. This study presents a spectral separability analysis for the detection of burned areas using Landsat-8 OLI/TIRS images in the context of fires that occurred in different biomes of Brazil (dry ecosystem) and Portugal (temperate forest). The research is based on a fusion of spectral indices and automatic classification algorithms scientifically proven to be effective with as little human interaction as possible. The separability index (M) and the Reed–Xiaoli automatic anomaly detection classifier (RXD) allowed the evaluation of the spectral separability and the thematic accuracy of the burned areas for the different spectral indices tested (Burn Area Index (BAI), Normalized Burn Ratio (NBR), Mid-Infrared Burn Index (MIRBI), Normalized Burn Ratio 2 (NBR2), Normalized Burned Index (NBI), and Normalized Burn Ratio Thermal (NBRT)). The analysis parameters were based on spatial dispersion with validation data, commission error (CE), omission error (OE), and the Sørensen–Dice coefficient (DC). The results indicated that the indices based exclusively on the SWIR1 and SWIR2 bands showed a high degree of separability and were more suitable for detecting burned areas, although it was observed that the characteristics of the soil affected the performance of the indices. The classification method based on bitemporal anomalous changes using the RXD anomaly proved to be effective in increasing the burned area in terms of temporal alteration and performing unsupervised detection without relying on the ground truth. On the other hand, the main limitations of RXD were observed in non-abrupt changes, which is very common in fires with low spectral signal, especially in the context of using Landsat-8 images with a 16-day revisit period. The results obtained in this work were able to provide critical information for fire mapping algorithms and for an accurate post-fire spatial estimation in dry ecosystems and temperate forests. The study presents a new comparative approach to classify burned areas in dry ecosystems and temperate forests with the least possible human interference, thus helping investigations when there is little available data on fires in addition to favoring a reduction in fieldwork and gross errors in the classification of burned areas.

1. Introduction

Forests are affected by a large range of disturbances, many of which are caused by climate change and human activity [1]. Fires can have a wide range of impacts, including reduced soil fertility, altered water supplies, increased biodiversity loss, and a negative impact on carbon sequestration [2]. A better understanding of fire regimes and forest regeneration processes under a variety of environmental and climatic factors supports sustainable forest management and the development of forest resilience [3]. A wide range of static and dynamic factors, comprising land cover (vegetation), weather variables, and human activities, influence the burned area [4,5]. Accurate and updated knowledge of fire-affected areas is critical for a better understanding of the aspects that affect their activities, as well as their implications for biogeochemical cycles, climate, and air quality, and also for fire management [6]. Forest fire severity assessment is useful for identifying the development and change in various ecological processes as well as the mechanisms responsible for forest vegetation succession after forest fires [3,7,8]. Quantitative evaluation can also be used to estimate the loss in biomass resulting from a forest fire and can provide a reference for the study of vegetation recovery and the global carbon balance [9].
In the last decades, the use of remote sensing has allowed unprecedented advances in mapping fire dynamics, mainly to locate the occurrence of fire in time and space, and to quantify the total extent of the burned area [10]. To manage the phases of the dynamics of a fire and, therefore, to determine the level of risk and understand the behavior of the fire and its effects on the recovery of the vegetation, images from different remote sensing satellites are used [11]. Since the mid-1980s, remote sensing has been used to address forest fire prevention, management, and monitoring [3], in particular, for the assessment of pre-fire conditions, active fire characteristics, and post-fire ecosystem responses [3,12]. For the first two phases, many algorithms and strategies have been designed [3,11,12,13]. Contributory challenges to mapping, monitoring, and quantifying forest degradation include the complexity of the concept of degradation, limitations in the spatial and temporal resolution of remote sensing sensors, and the inherent complexity of detecting degradation caused by different disturbance processes and forest uses [14]. According to Kurbanov et al. [15] several articles published in the literature present a comprehensive approach to studies on remote sensing methods and data used to estimate the burned forest area, the severity of the burning, the post-fire effects, and the patterns of forest recovery at global, regional, and/or location level. Other articles focus on the geographic distribution, types of remote sensing sensors, ecological zoning, tree species, spectral indices, and precision metrics used in the studies. In addition to discussing key trends, Kurbanov et al. identify potential opportunities for future research using the new generation of remote sensing systems, cloud classification and execution techniques, and emerging process platforms for regional and large-scale applications in the field of study [15]. For example, Chicas and Nielsen [16] presented a review that provides information on the main research topics in wildfire susceptibility modeling research, the main input factors used in models to map wildfire susceptibility, the main researchers, the areas where this type of research has been implemented, technology, and models used. Bot and Borges [17] presented a review of recent applications of machine learning methods for forest fire management decision support. The emphasis is on providing a summary of these applications with a classification according to case study type, machine learning method, case study location, and performance metrics [17]. Pinto et al. [18], for example, developed a deep learning methodology based on daily sequences of multispectral images as a promising and flexible technique that can be applied to observations with various spatial and spectral resolutions. The results obtained are a strong indication of the advantage of deep learning approaches for the problem of mapping and dating burned areas and provide several avenues for future research [18]. Importantly, autonomous early detection of forest fires from unmanned aerial vehicle (UAV)-based visual data using different deep learning algorithms has attracted significant interest in recent years [19]. Bo et al. [20], for example, apply Salient Object Detection (SOD) to Burned Area Segmentation (BAS), the first time this has been done, and propose an efficient Burned Area Segmentation Network (BASNet) to improve the performance of UAV high-resolution image segmentation.
Multispectral analysis has been shown to be useful for detecting risk areas in large forest fires [6,21,22], particularly Landsat data [23,24,25]. The increasing growth in the availability of Landsat data opens up new possibilities for fire research that requires better quality information regarding biomass burning, improving coarser spatial resolution data sets of active fire from satellites [26]. Because of its broad spatial coverage and open data policy, the efficiency of Landsat-8 OLI in recognizing burned scars has indeed been thoroughly investigated [23,25]. Landsat-8/OLI active fire images, due to their great quality, might become part of new earth observation systems providing improved spatial and temporal surveillance of forest fires at large scales [26].
The mixture of complex images and very similar spectral signatures in multispectral bands can result in many false-positive errors when detecting burned areas after forest fires using multi-temporal data, which hinders the accurate delimitation of fired areas [27]. After a fire, the spectral behavior of vegetation changes due to fuel consumption, the presence of ash, reduced vegetation transpiration, and increased surface temperature [28].
In the last decades, several studies were carried out with the objective of mapping, assessing, and estimating the burned area through comparisons between spectral indices based on satellite data [21,29,30]. Many spectral indices have been designed to detect burned areas following a fire and, in particular, to discriminate between various degrees of burned surfaces [31]. Other indices were developed as a result of the investigation of new spectral bands, including mainly the Burned Area Index (BAI) [32], Normalized Burn Ratio (NBR) [33], Normalized Burned Index (NBI) [34], Mid-Infrared Burn Index (MIRBI) [35], Normalized Burn Ratio 2 (NBR2) [33], and Normalized Burn Ratio Thermal (NBRT) [36].
Remote sensing data are used for mapping burned areas based on the changes caused by the fire and, basically, involve the use of different spectral indices, digital image processing, and machine learning techniques. Distinctly identified forest classes are needed to assess classifiers and obtain thematic accuracy [37]. A spectral index that presents good separability is one whose values between the burned areas and the different targets are presented with great distinction [38]. According to these authors, equal values can confuse automatic classifiers, causing mapping errors. Many authors have reported the feasibility of spectral indices to show different degrees of fire severity. The ability of remote sensing spectral indices to reflect different degrees of fire severity has been repeatedly demonstrated, for example, in studies by Pereira et al., Santos et al., Teodoro et al. and Vlassova et al. [39,40,41,42], among others.
New support for the classification of burned areas has been derived using decision tree classification techniques, which integrate fire information with reflectance data [6,39,42]. Using supervised and unsupervised classification techniques, many algorithms have been developed to map burned areas [43,44]. Among the techniques used for supervised or unsupervised image classification, we can find the decision tree, which is commonly used through pixel information or thresholds in spectral indices [9,27,44]. In particular, a considerable advance has been made for contextual algorithms, which are used to refine the classification results of burned areas [23,43].
Supervised classification methods are frequently used to map forest areas affected by fire [45]. These methods are based on the selection of a training data set used to perform the classification. This constraint is not necessary for unsupervised classification methods. These methods are based on the analysis of the spectral values of the image pixels and cluster them into groups based on their values [10,39,45,46]. Likewise, due to their ease of use and data management, they offer a great advantage for end-users not specialized in software or image processing, such as those dedicated to planning, disaster prevention, or security work. Despite these advantages, unsupervised classification methods applied to burned area classification are typically limited to ISO-DATA, K-means, and the Reed–Xiaoli detector (RXD) anomaly [47,48].
RXD, proposed by Reed and Yu, extracts distinct spectral signatures from the surroundings of the burned area without the need for prior information. The separability index is used to estimate the effectiveness of individual bands and spectral indices to discriminate between burned and unburned land [49,50]. The separability index M proposed by Kaufman and Remer [51] allows for analyzing the degree of discrimination between vegetation and fire, for example. Burned areas can be considered anomalies since fires are inconsistent spatial and temporal events [49].
This work aims to present a spectral separability analysis for the detection of burned areas using Landsat-8 OLI/TIRS images, in the context of fires occurring in different biomes of Brazil (dry ecosystem) and Portugal (temperate forest). The separability index (M) and the Reed–Xiaoli automatic anomaly detection classifier (RXD) are used to evaluate the spectral separability and the thematic accuracy of the burned areas for the different spectral indices tested (Burn Area Index (BAI), Normalized Burn Ratio (NBR), Mid-Infrared Burn Index (MIRBI), Normalized Burn Ratio 2 (NBR2), Normalized Burned Index (NBI), and Normalized Burn Ratio Thermal (NBRT)).

2. Materials and Methods
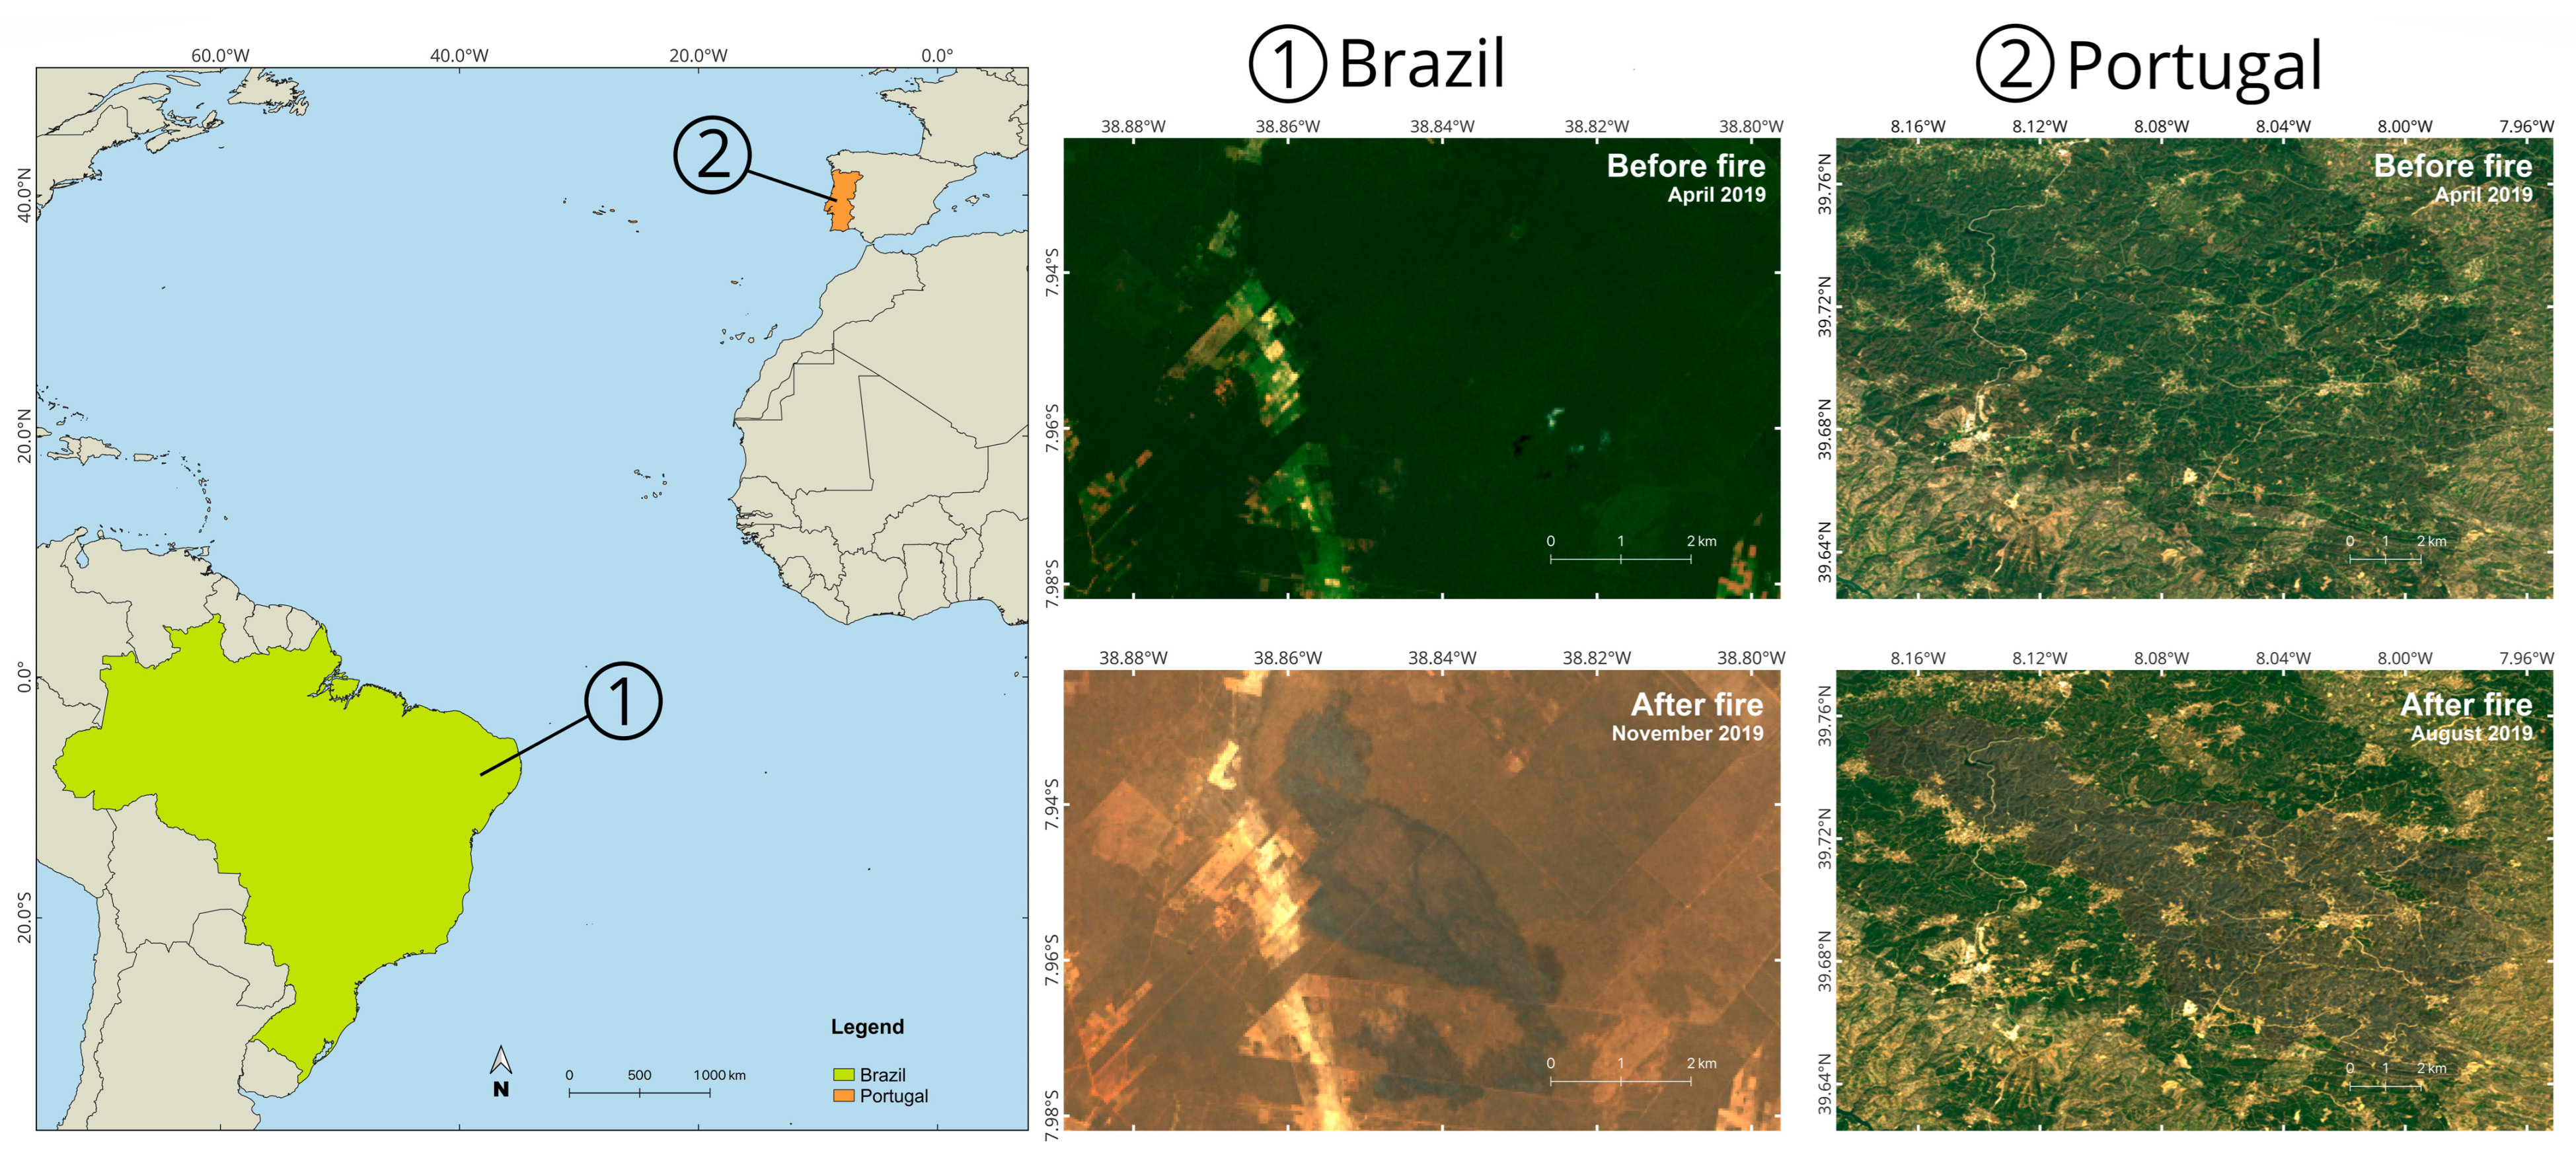
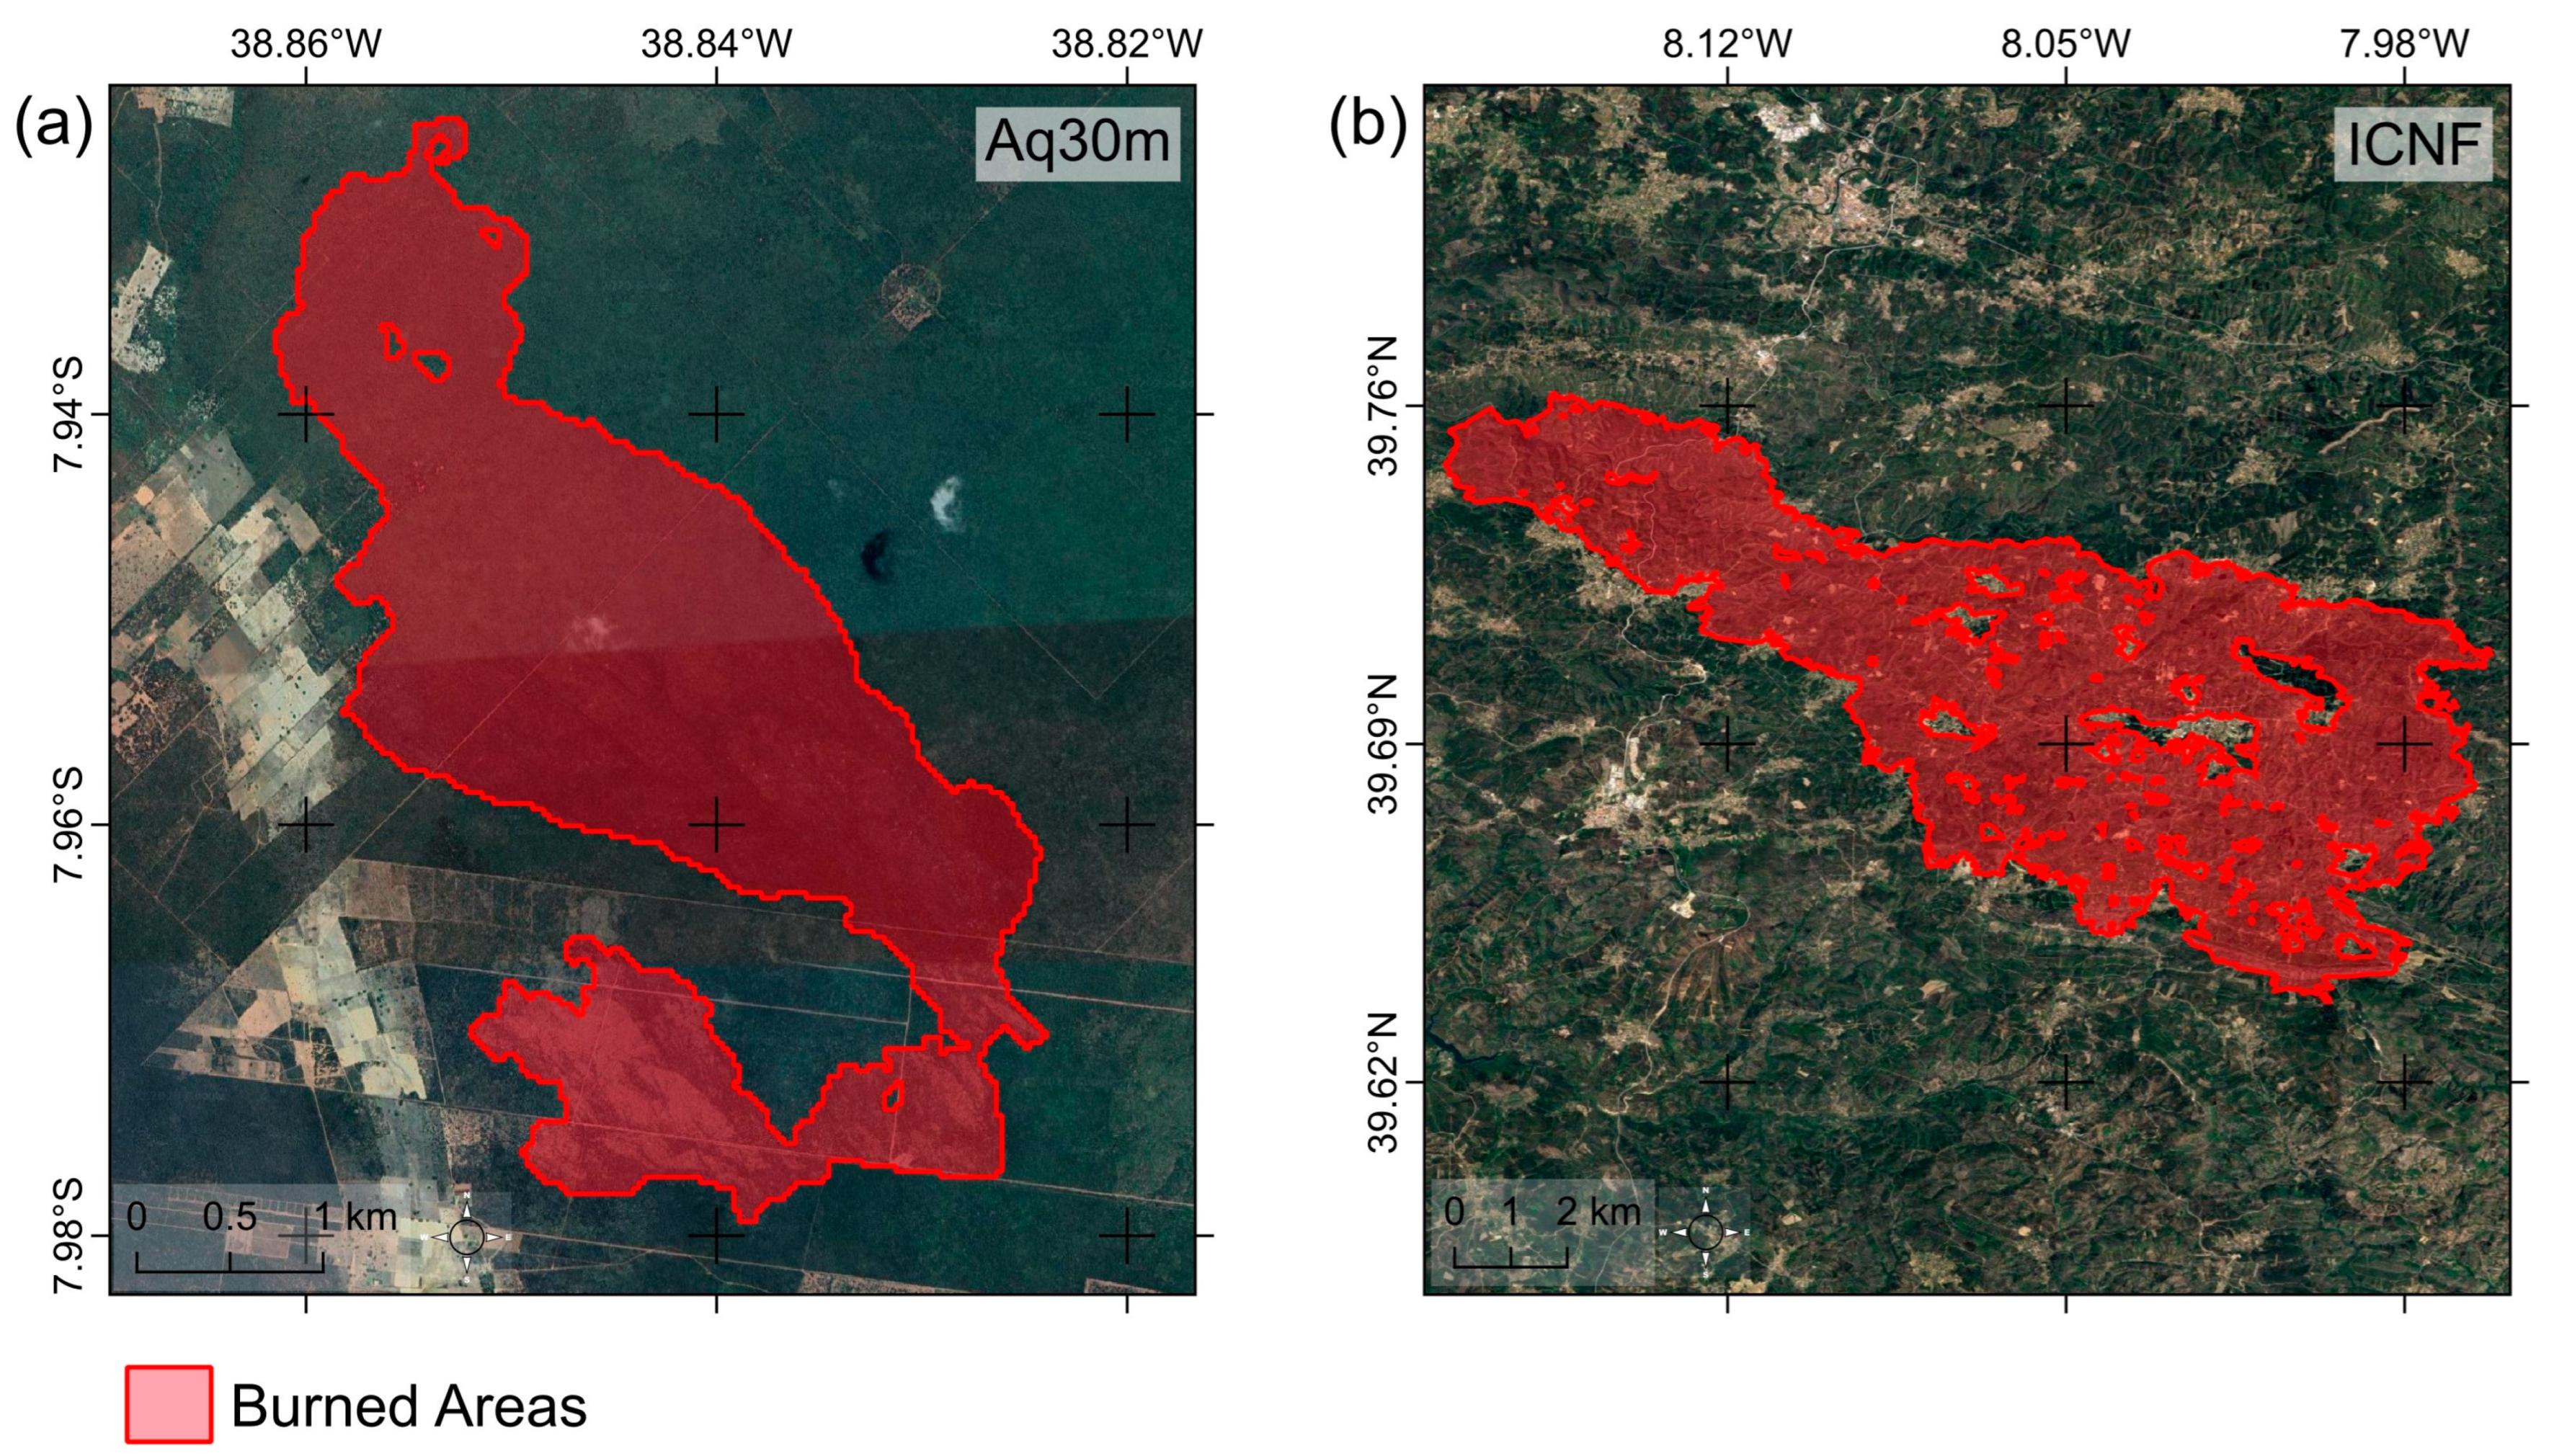
2.1. Study Area

The study sites cover two forest fires that occurred in north-eastern Brazil and central Portugal (Figure 1).
In Brazil, a fire on 30 September 2019 affected an area of 10.6 km2 located in the semi-arid municipality of São José do Belmonte, centered at geographic coordinates 7°59′4″ S and 38°52′58″ W (WGS84) in the northern sector of the state of Pernambuco. The municipality of São José do Belmonte is located in the domains of the hydrographic basin of the Pajeú River. The characteristic vegetation of the mesoregion of the semi-arid state of Pernambuco, specifically the municipality of São José do Belmonte, is the Caatinga biome. This set of ecosystems occurs endemically in Brazil. The native plant species are specimens of the hyperxerophilous Caatinga, of a drier character, with an abundance of cactaceous and smaller plants, as well as stretches of deciduous forest. According to the Brazilian Ministry of the Environment [52], the coverage area of this biome corresponds to about 10% of the Brazilian territory. The Caatinga vegetation has as its main characteristic the adaptation to periods of drought. The vegetative extract of the Caatinga is formed, especially, by shrub and herbaceous species. It has a semi-arid climate, a very dry type with low air humidity, as well as thermal amplitude, and is considered a dry ecosystem [52,53]. This biome has a high level of degradation from human and natural activities, being extremely affected by fires caused predominantly by human activities. The partial or total removal of vegetation in Caatinga areas results in a reduction in the production stock of plant biomass and a reduction in soil cover in the semi-arid region, factors that lead to an increase in the degradation of the biome [52].
The study area of Portugal is located at 39°48′26″ N and 8°5′22″ W (WGS84). A fire on 20 June 2019 covered 93.4 km2 in the districts of Santarém and Castelo Branco (central Portugal). In the central region of Portugal, maritime pine vegetation predominates. The microclimate is characterized by long summers and very limited rainfall. High temperatures reduce the moisture content of forest fuels, making the region prone to large fires, especially if combined with strong winds [54]. Portugal is characterized by having a mild Mediterranean climate with climatic variability, including droughts and desertification in the south [55]. Nunes et al. [56] analyzed 506 fires occurring in Portugal in 1991, concluding that the large fires (greater than 1500 ha) are produced mainly in posts of Pinus Pinaster, Eucalyptus Globulus Labill, a mixture of eucalyptus/pine trees, and later by bushes. However, because these plants are seeders that respond to the fire by dispersing seeds quickly, post-fire regrowth in central Portugal will be highly dependent on the destruction of seeds existing on the surface of the ground during the fire [57].

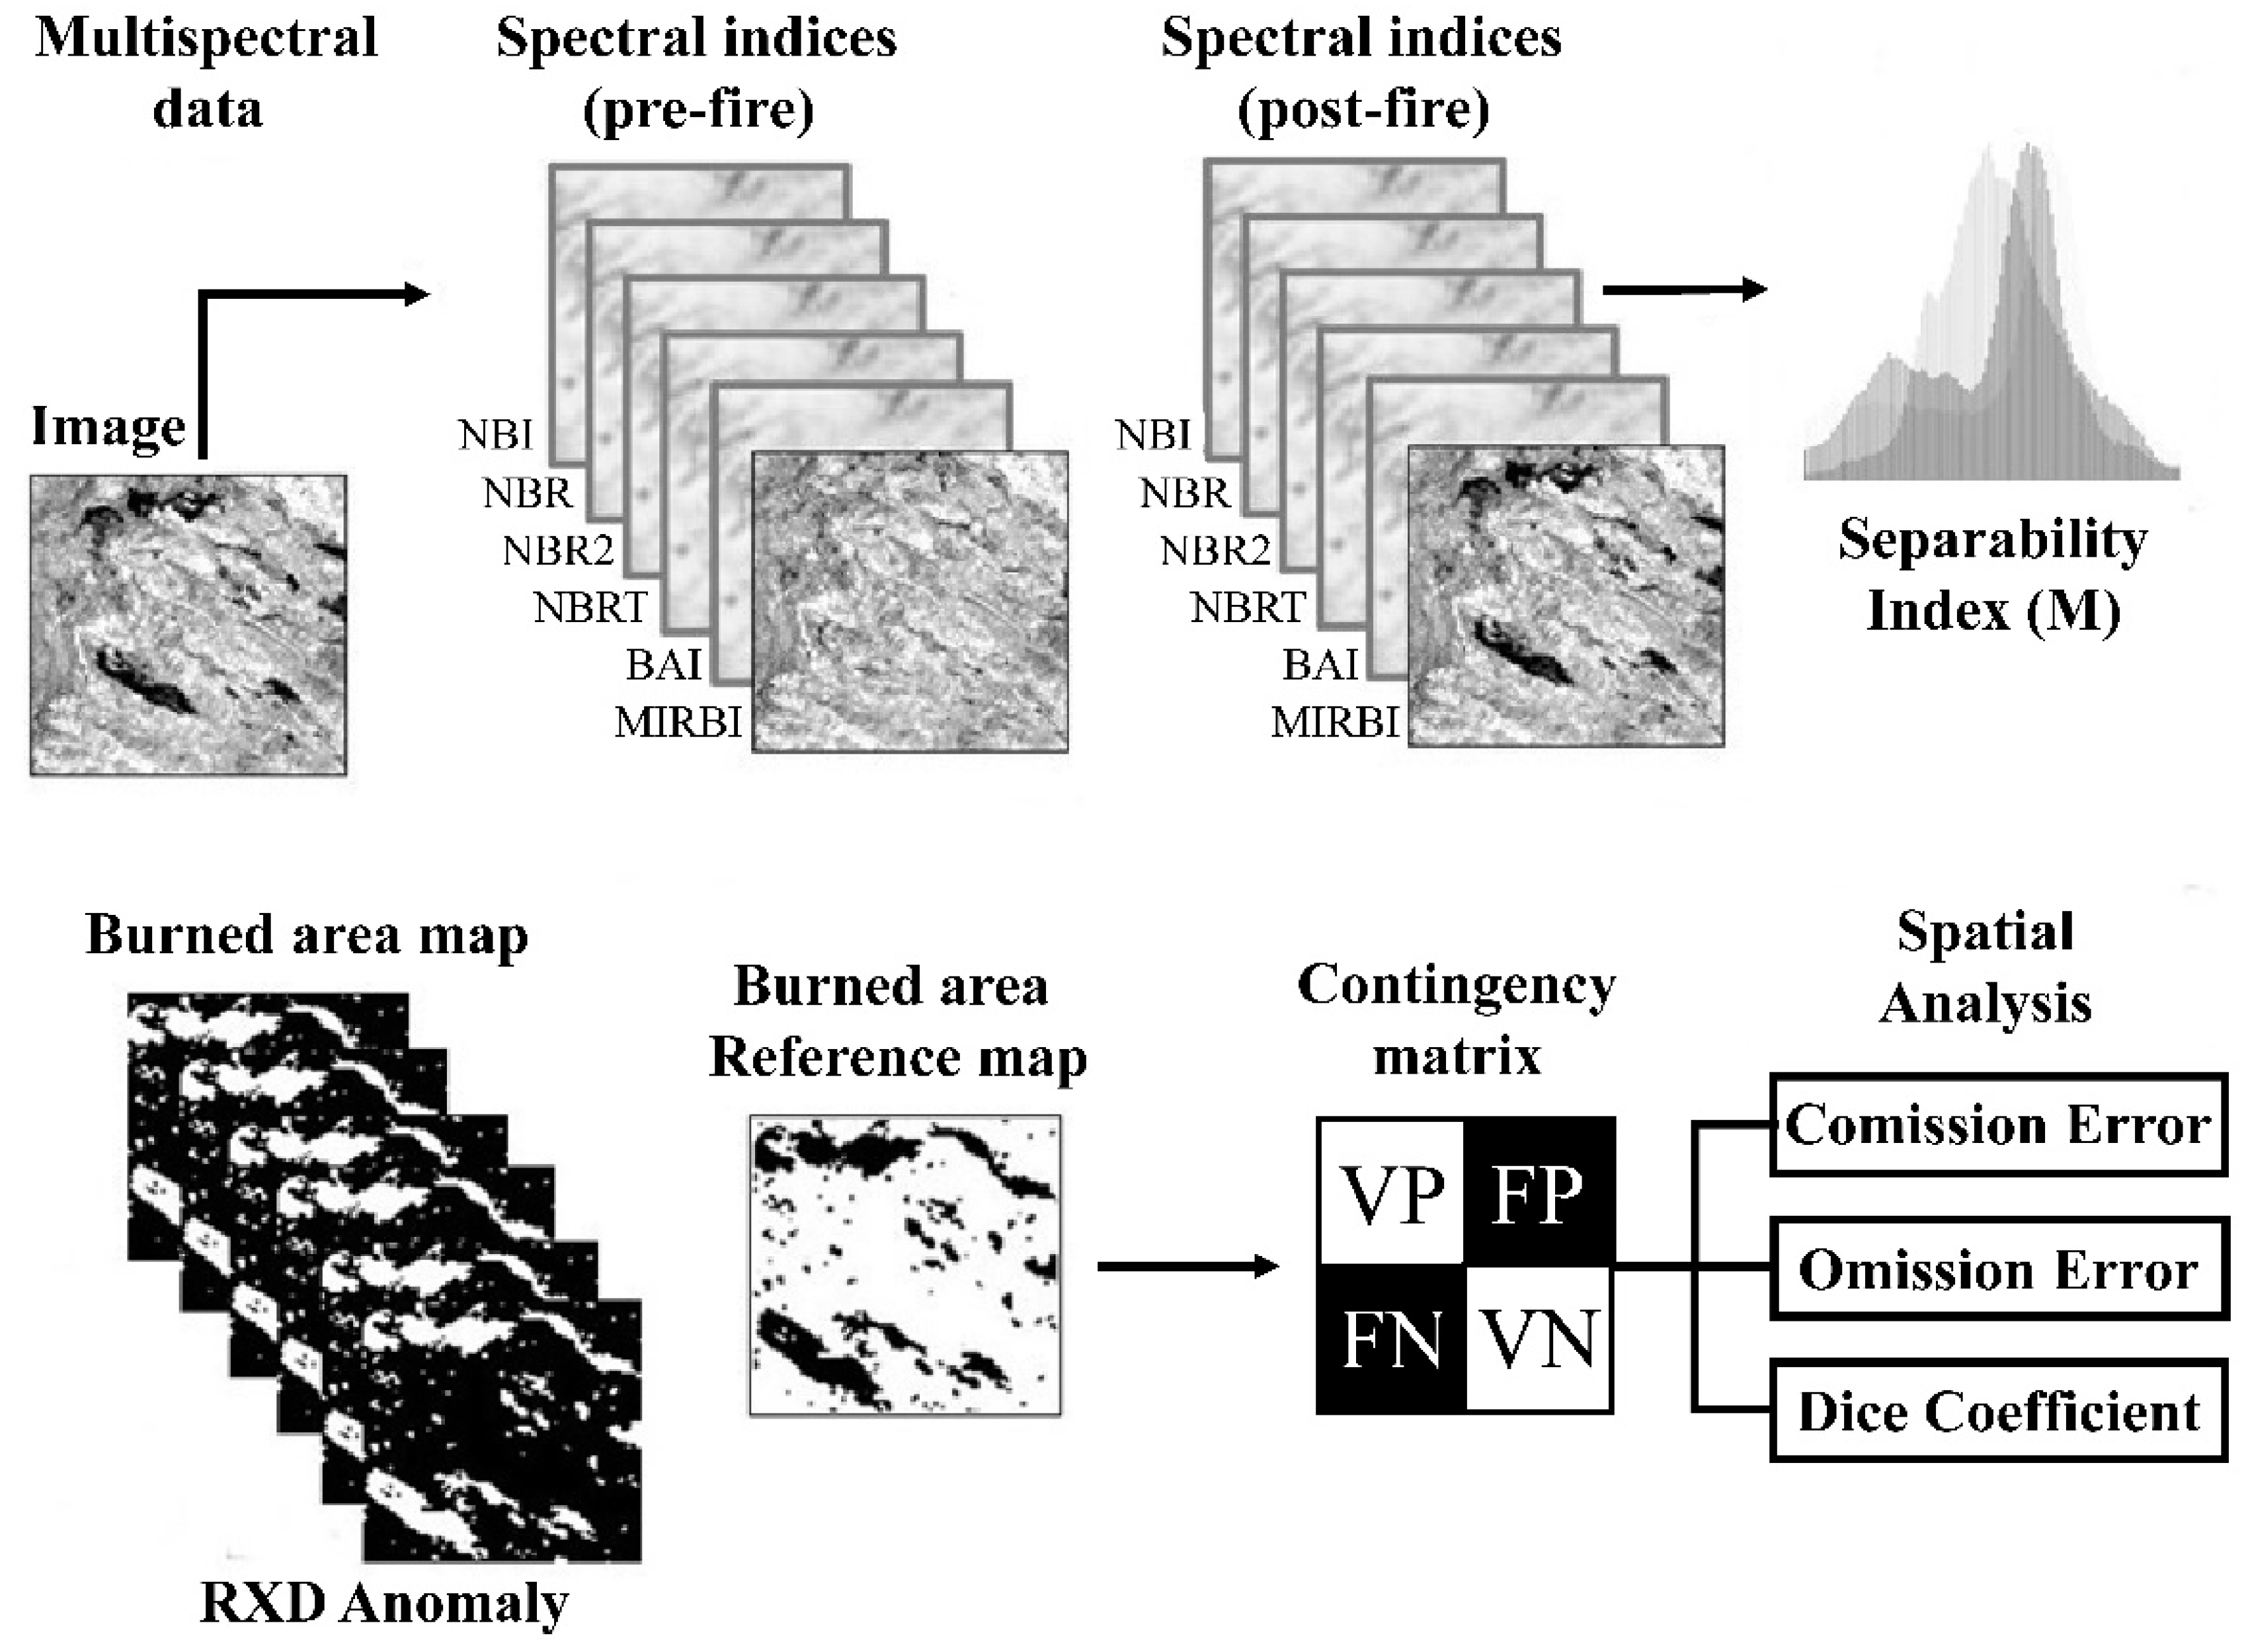
2.2. Methodology Flowchart

Figure 2 presents the methodological data processing steps for the determination and classification of the burned areas of the studied fires, which are described in the following subsections.

2.3. Data and Pre-Processing

The Landsat series stands out for its collection of images, which favors the multi-temporal analysis of forest dynamics and post-fire effects [32,58].
Landsat-8 was launched by NASA in 2013 including onboard the Operational Land Imager (OLI) and Thermal Infrared Sensor (TIRS) with a 16–day temporal resolution [59]. According to USGS [59], the OLI sensor features a four-mirror telescope and a 12-bit quantization. It can capture data for a variety of spectrums, including the VIS, NIR, and SWIR bands, as well as a panchromatic band of 0.4–2.5 μm. TIRS, on the other hand, collects images in the 10–12.5 μm spectrum in the thermal area. Landsat-8 OLI TIRS has a spatial resolution of 30 m for each band, except TIRS and panchromatic bands. For panchromatic bands, the resolution is 15 m. The TIRS sensor provides two bands: 10 (10.6–11.19 µm) and 11 (11.5–12.51 µm) with a resolution of 100 m [59].
Calibration studies of the TIRS bands of Landsat 8 mounting the band 10 TIRS showed better performance than Band 11 TIRS [60]. They found an overestimation of approximately 1.37 K for band 10 while band 11 presented an underestimation of up to –3 K. The calibration parameters for TIRS satellite data are still unstable, especially for TIRS Band 11 [60]. According to this evidence, the TIRS 10 band was chosen for our study.
Two scenes from Landsat-8 OLI and TIRS sensors were used for each study area (before and after the fire), being the orbit/point and dates of the images summarized in Table 1. The selected bands were Band 2 Blue (0.450–0.51 µm); Band 3 Green (0.53–0.59 µm); Band 4 Red (0.64–0.67 µm); Band 5 Near-Infrared (0.85–0.88 µm); Band 6 SWIR 1 (1.57–1.65 µm); Band 7 SWIR 2 (2.11–2.29 µm); and Band 10 TIRS 1 (10.6–11.19 µm) [59].
The images were made available by the Earth Explorer site (https://earthexplorer.usgs.gov/, accessed on 20 January 2023) with Level 2 processing, which consists of radiometrically calibrated and georeferenced data within the prescribed tolerances: Collection 2 Level-2 Science Products (L2SP) [59]. L2SP includes products based on surface reflectance and surface temperature scenes. Landsat scenes with the highest quality data available are placed at Level 2 and are considered suitable for time series analysis. Level 2 includes Level 2 Precision and Terrain Correction (L2TP) data that have well-characterized radiometry and are calibrated between different Landsat instruments. Landsat Level-2 scientific products are generated from the Collection 2 Level 1 input that meets the solar zenith angle <76 degrees constraint and includes the auxiliary data inputs necessary to generate a scientifically viable product. Landsat 8 Operational Land Imager (OLI) surface reflectance products are generated using the Land Surface Reflectance Code (LaSRC) algorithm (version 1.5.0). This algorithm corrects for the temporal, spatial, and spectral dispersion and absorption effects of atmospheric gases, aerosols, and water vapor, necessary to reliably characterize the Earth’s land surface [59]. Landsat Level 2 surface reflectance requires an input of auxiliary atmospheric data from external USGS data sources. The USGS retrieves data from the data source and extracts specific parameters for Landsat Collection 2 Level 2 processing [59].

2.4. Spectral Indices

After pre-processing the Landsat-8 images, the spectral indices BAI, NBR, MIRBI, NBR2, NBI, and NBRT were computed based on the reflectance values of the spectral bands of the OLI and TIRS sensors, according to Table 2. The spectral characteristics of the objects of interest directly affect the reflectance values and, consequently, the performance of the spectral indices.
The BAI index, proposed by Chuvieco et al. [32], uses the reflectance values in the red and NIR part of the spectrum to identify the areas of the land affected by the fire. It emphasizes the coal signal in post-fire images.
The NBR index was initially developed for use with Landsat TM and ETM+ bands 4 and 7 but can be used with any multispectral sensor that has NIR bands between 0.76 and 0.9 µm and SWIR between 2.08 and 2.35 µm. It was proposed by Key and Benson [33]. The NIR and Longer SWIR (LSWIR) spectral regions are used instead of the red region as used by NDVI [23]. The water content in plants or soils absorbs a significant amount of radiation in the LSWIR band. After a fire, scorching, drying, or dry soil exposure increases LSWIR reflection, lowering the NBR index [33,61].
Trigg and Flasse [34] developed the MIRBI index for shrub-savannah vegetation, where NIR wavelengths are less efficient because of the senescent condition of the plant during the fire event. The index was created in the Shorter SWIR (SSWIR)/LSWIR spectral space, and its performance in savannah ecosystems was shown to be fairly stable over time [10].
García and Caselles [62] and later Key and Benson [33] devised the NBR2 index. It alters NBR to emphasize water sensitivity in plants, which might be valuable in post-fire recovery research. Roteta et al. [63] and Storey et al. [64] are two recent implementations of this index.
The NBI index, as proposed by Alleaume et al. [35], is computed considering how the radiometric values change between the pre- and post-fire events. Initially designed for MODIS bands. This index considers the response from the heterogeneous surface covered by burned, unburned, and partially burned vegetation, ash, and bare soil [35].
An improvement of the NBR index was proposed by Holden et al. [36] who included a thermal band in the computation for better separability between burned and unburned surfaces, deriving the NBRT index. This index was designed for Landsat TM and ETM+ bands 4, 7, and 6. It will work, however, with any multispectral sensor that has bands in the following ranges: 0.76 to 0.9 µm (NIR), 2.0 8 to 2.35 µm (SWIR), and 10.4 to 12.5 µm (Thermal) [36].

2.5. Separability Analysis

In this study, separability was used to quantify the ability of statistical separation between pre- and post-fire pixels. The separability M index proposed by Kaufman and Remer [51] allows us to analyze the degree of discrimination between classes (in this case, vegetation and fire). The M index is a statistical test that calculates the difference between the averages of the reflectance values of the pixels of the two categories, normalized by the sum of the standard deviations [51]. The M index is an estimator of the signal/noise ratio, that is, it consists of the absolute difference between the mean values of the two classes (associated with their variability) and the sum of the standard deviations that represent the noise [65]. M values can range from 0 to 2. Values lower than 1 indicate that the two classes do not show spectral differences from each other and, therefore, are not distinguishable (low separability) while values larger than 1 indicate that the spectral responses of the two classes are different and, therefore, the classes can be unambiguously identified (high separability) [38,40,65].
The separability index (M) has great potential in remote sensing, being useful in analyzing the discrimination of classes of interest. It is calculated according to Equation (1) considering the mean values of the spectral band considered from the burned and unburned areas, respectively, and the corresponding standard deviations [51]:
M = m ( q ) m ( n q ) a ( q ) + a ( n q )
where m(q) and a(q), and m(nq) and a(nq) are, respectively, the mean and standard deviation of the values corresponding to the burned (q) and unburned (nq) class of pixels for each index [51].
The higher the separability index M, the better the discrimination. M values greater than one indicate good separability while values less than one represent a large degree of histogram overlap between the burned and unburned classes [50].

2.6. Unsupervised Anomaly Change Classification Reed–Xiaoli Detector (RXD)

An anomaly classifier aims to evaluate the spectral separability and thematic accuracy of the burned area for the different spectral indices.
According to Reed and Yu [48], the RXD algorithm detects the spectral or color differences between a region to be tested and its neighboring pixels or the entire data set. In this way, it extracts targets that are spectrally distinct from the image background. The results of RXD analysis are unambiguous and have proven to be very effective in detecting subtle spectral features [48].
The RXD detector makes it possible to distinguish changes in the image that have an anomalous behavior, such as burned areas, from generalized changes, such as seasonal effects, which extend over large areas of the image and occur periodically [66].
The RXD algorithm generates automatic classifications of burned areas obtained by spectral indices. It was proposed by Reed and Yu [48] to extract signatures that are unique from the surroundings without the requirement for a priori knowledge. These anomalies are detected as outliers due to (i) spectral signatures that differ from adjacent pixels and (ii) a low likelihood of occurrence [49]. As a result, RXD differentiates burned areas from the rest of the image as they are identified as anomalous changes from other generalized changes such as seasonal trends which occur on a regular basis and span large parts of the image [61]. The Mahalanobis distance between a given pixel and the average of surrounding pixels is calculated by RXD using the covariance matrix [67]. As a result, the anomalous change score (AC) for any pixel x is computed using Equation (2) [48]:
AC ( x ) = ( x μ ) C 1 ( x μ )
where x′ is a vector constructed using the different bands of the pixel x, μ represents the stable areas of each band computed averaging the values of the background pixels, and C is the covariance matrix of the spectral index images.

2.7. Validation

For the validation of spatial data in the study area of Brazil, the mapping product developed by the Forest Fires Monitoring Program of the National Institute for Space Research (INPE) was used as a reference. This product is available free of charge at http://queimadas.dgi.inpe.br/queimadas/aq30m/ (accessed on 20 January 2023) [68]. It uses images from the Landsat series with 30 m of spatial resolution. The data are available in vector format and operationally and automatically estimate the burned surface, generating digital maps, temporal comparisons, and support products for the management and assessment of the impact of fire use on vegetation. In this way, it is possible to obtain a regular detection and quantification of the burned area through satellite images of the extent of burned vegetation in the country.
The validation product utilized as a reference for the study area in Portugal was the 2019 Annual Burned Areas Atlas from the National Institute for Nature Conservation and Forests (ICNF) of Portugal (http://www.icnf.pt/, accessed on 20 January 2023) [69]. The data are available in a shapefile ESRI format. It consists of a collection of burned areas represented by polygons accompanied with information about the date and duration of the fire, the area, and the probable causes that provoked it, as polygon attributes. The global map of all the fires in the Portuguese territory is composed of geospatial files generated by semi-automatic classifications using 10 m resolution Sentinel-2 data [69].

2.8. Classification Assessment
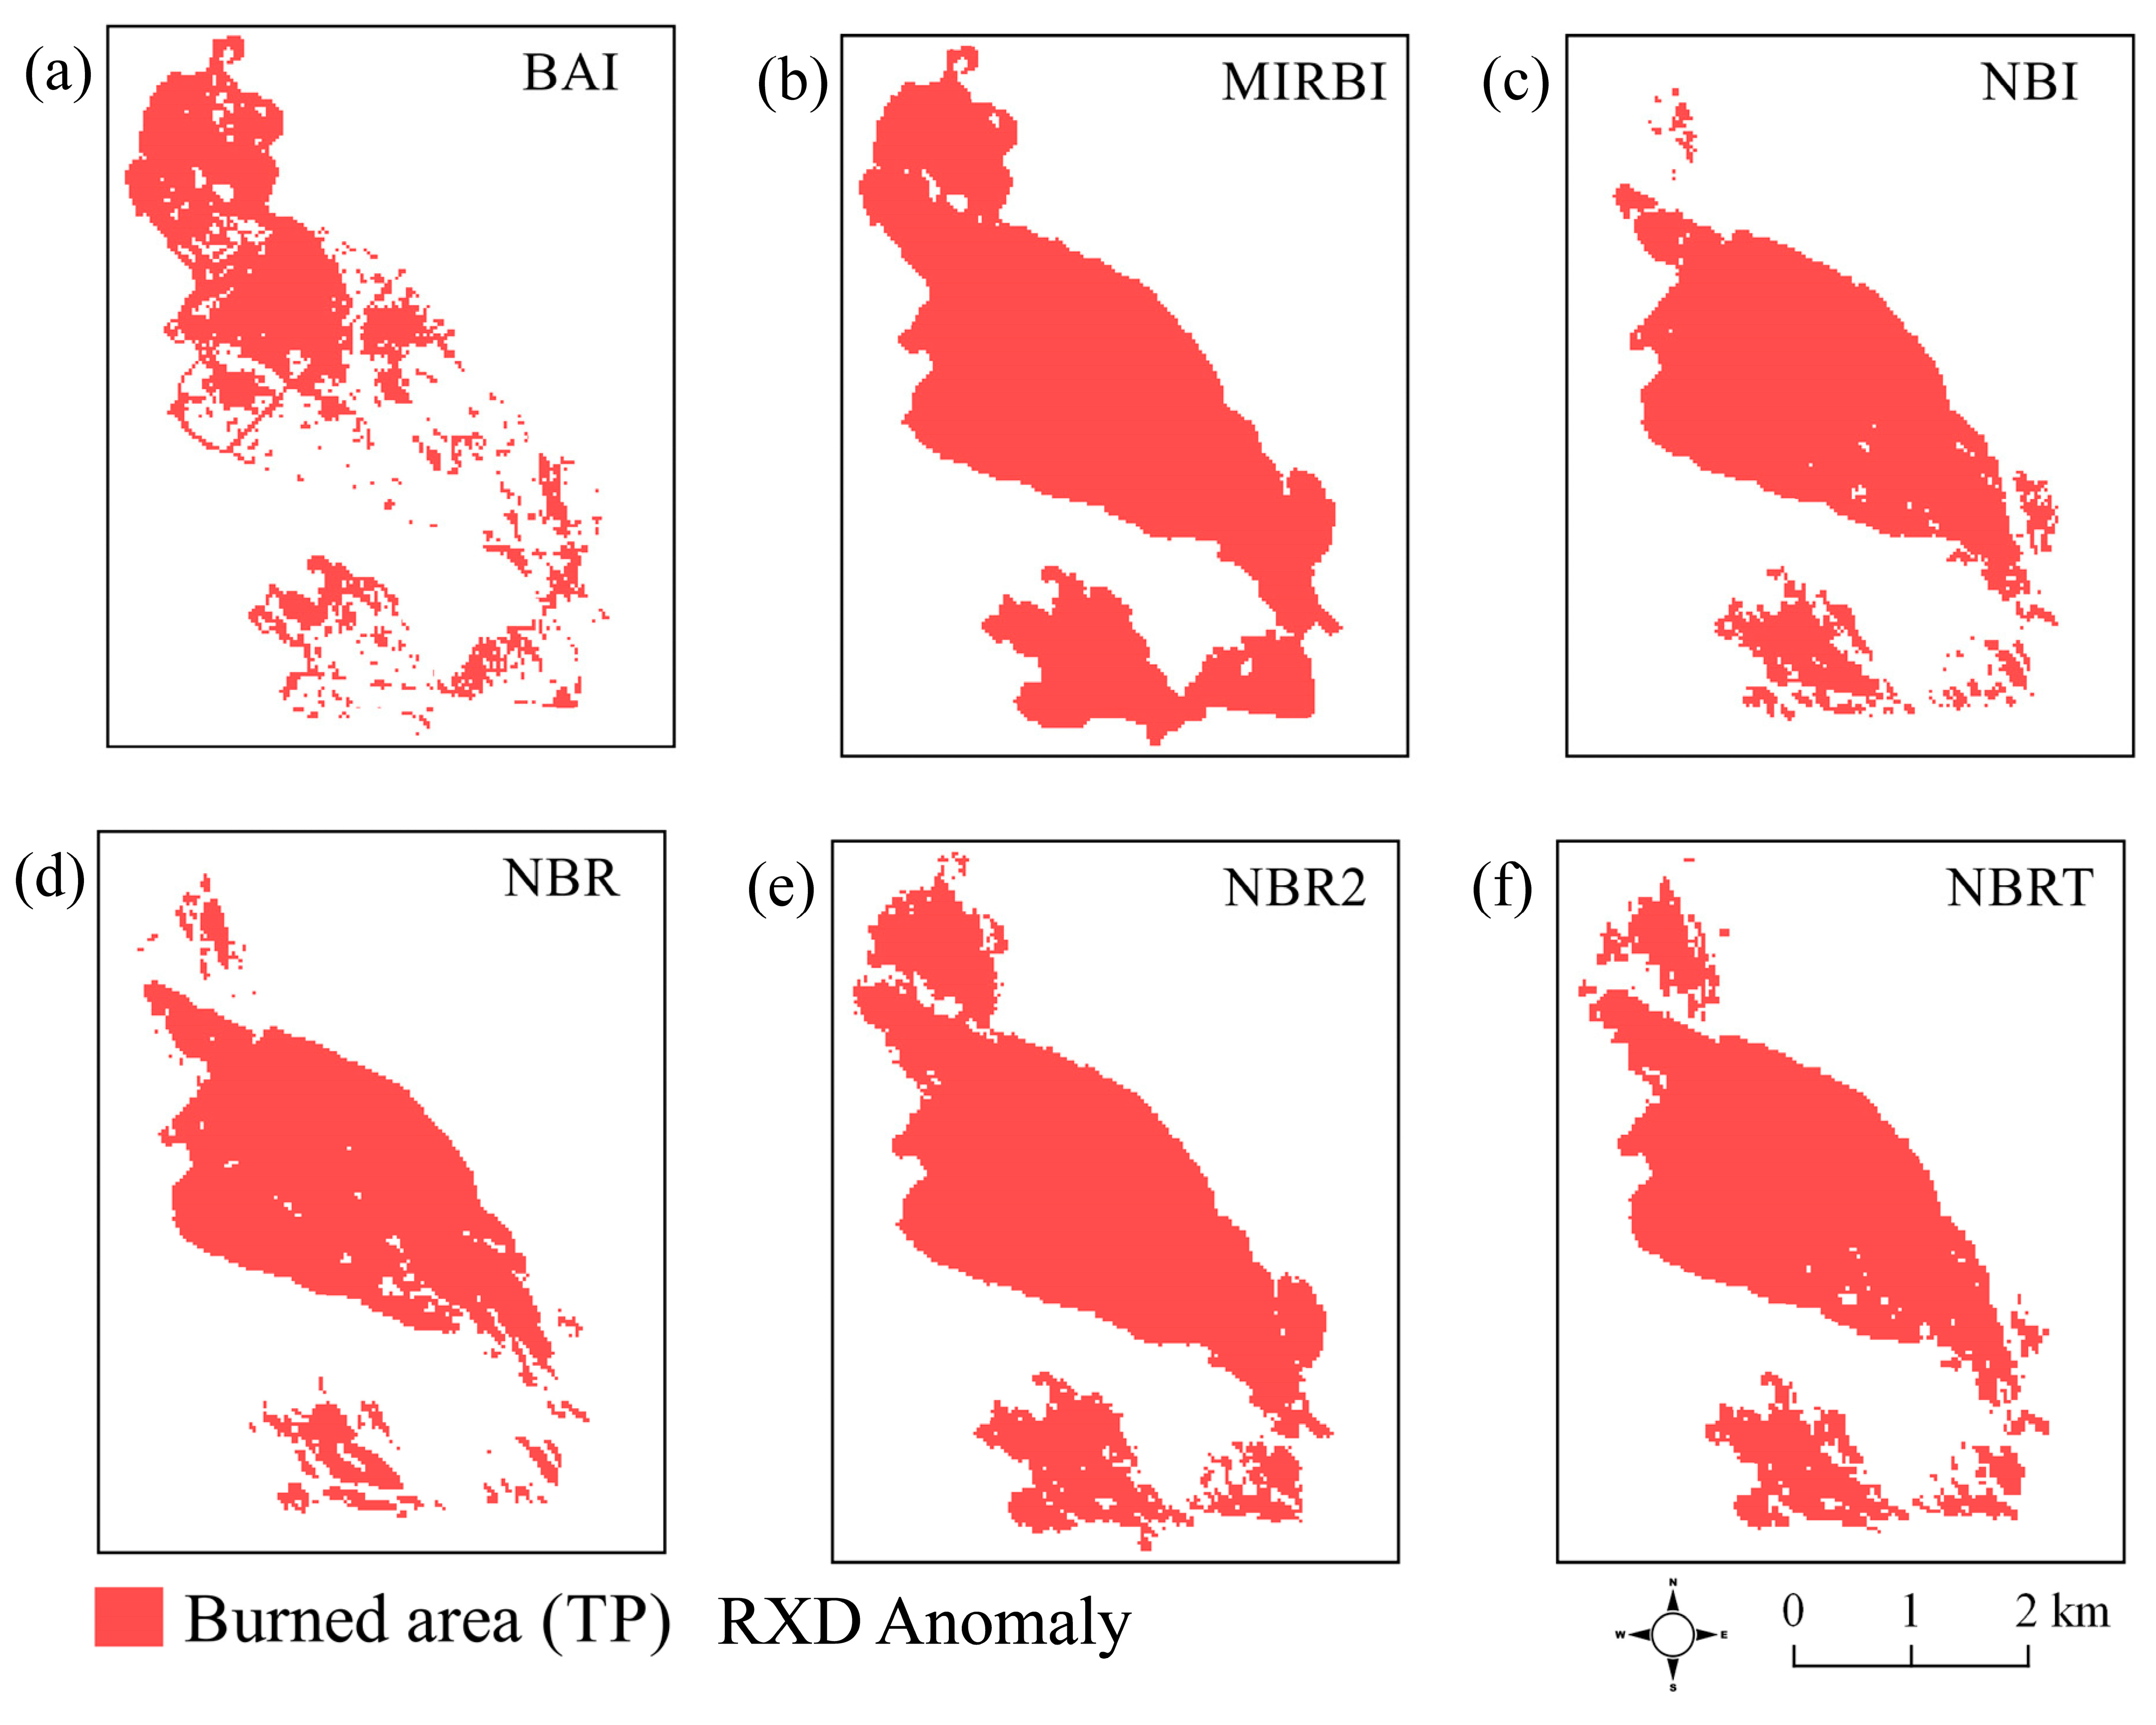
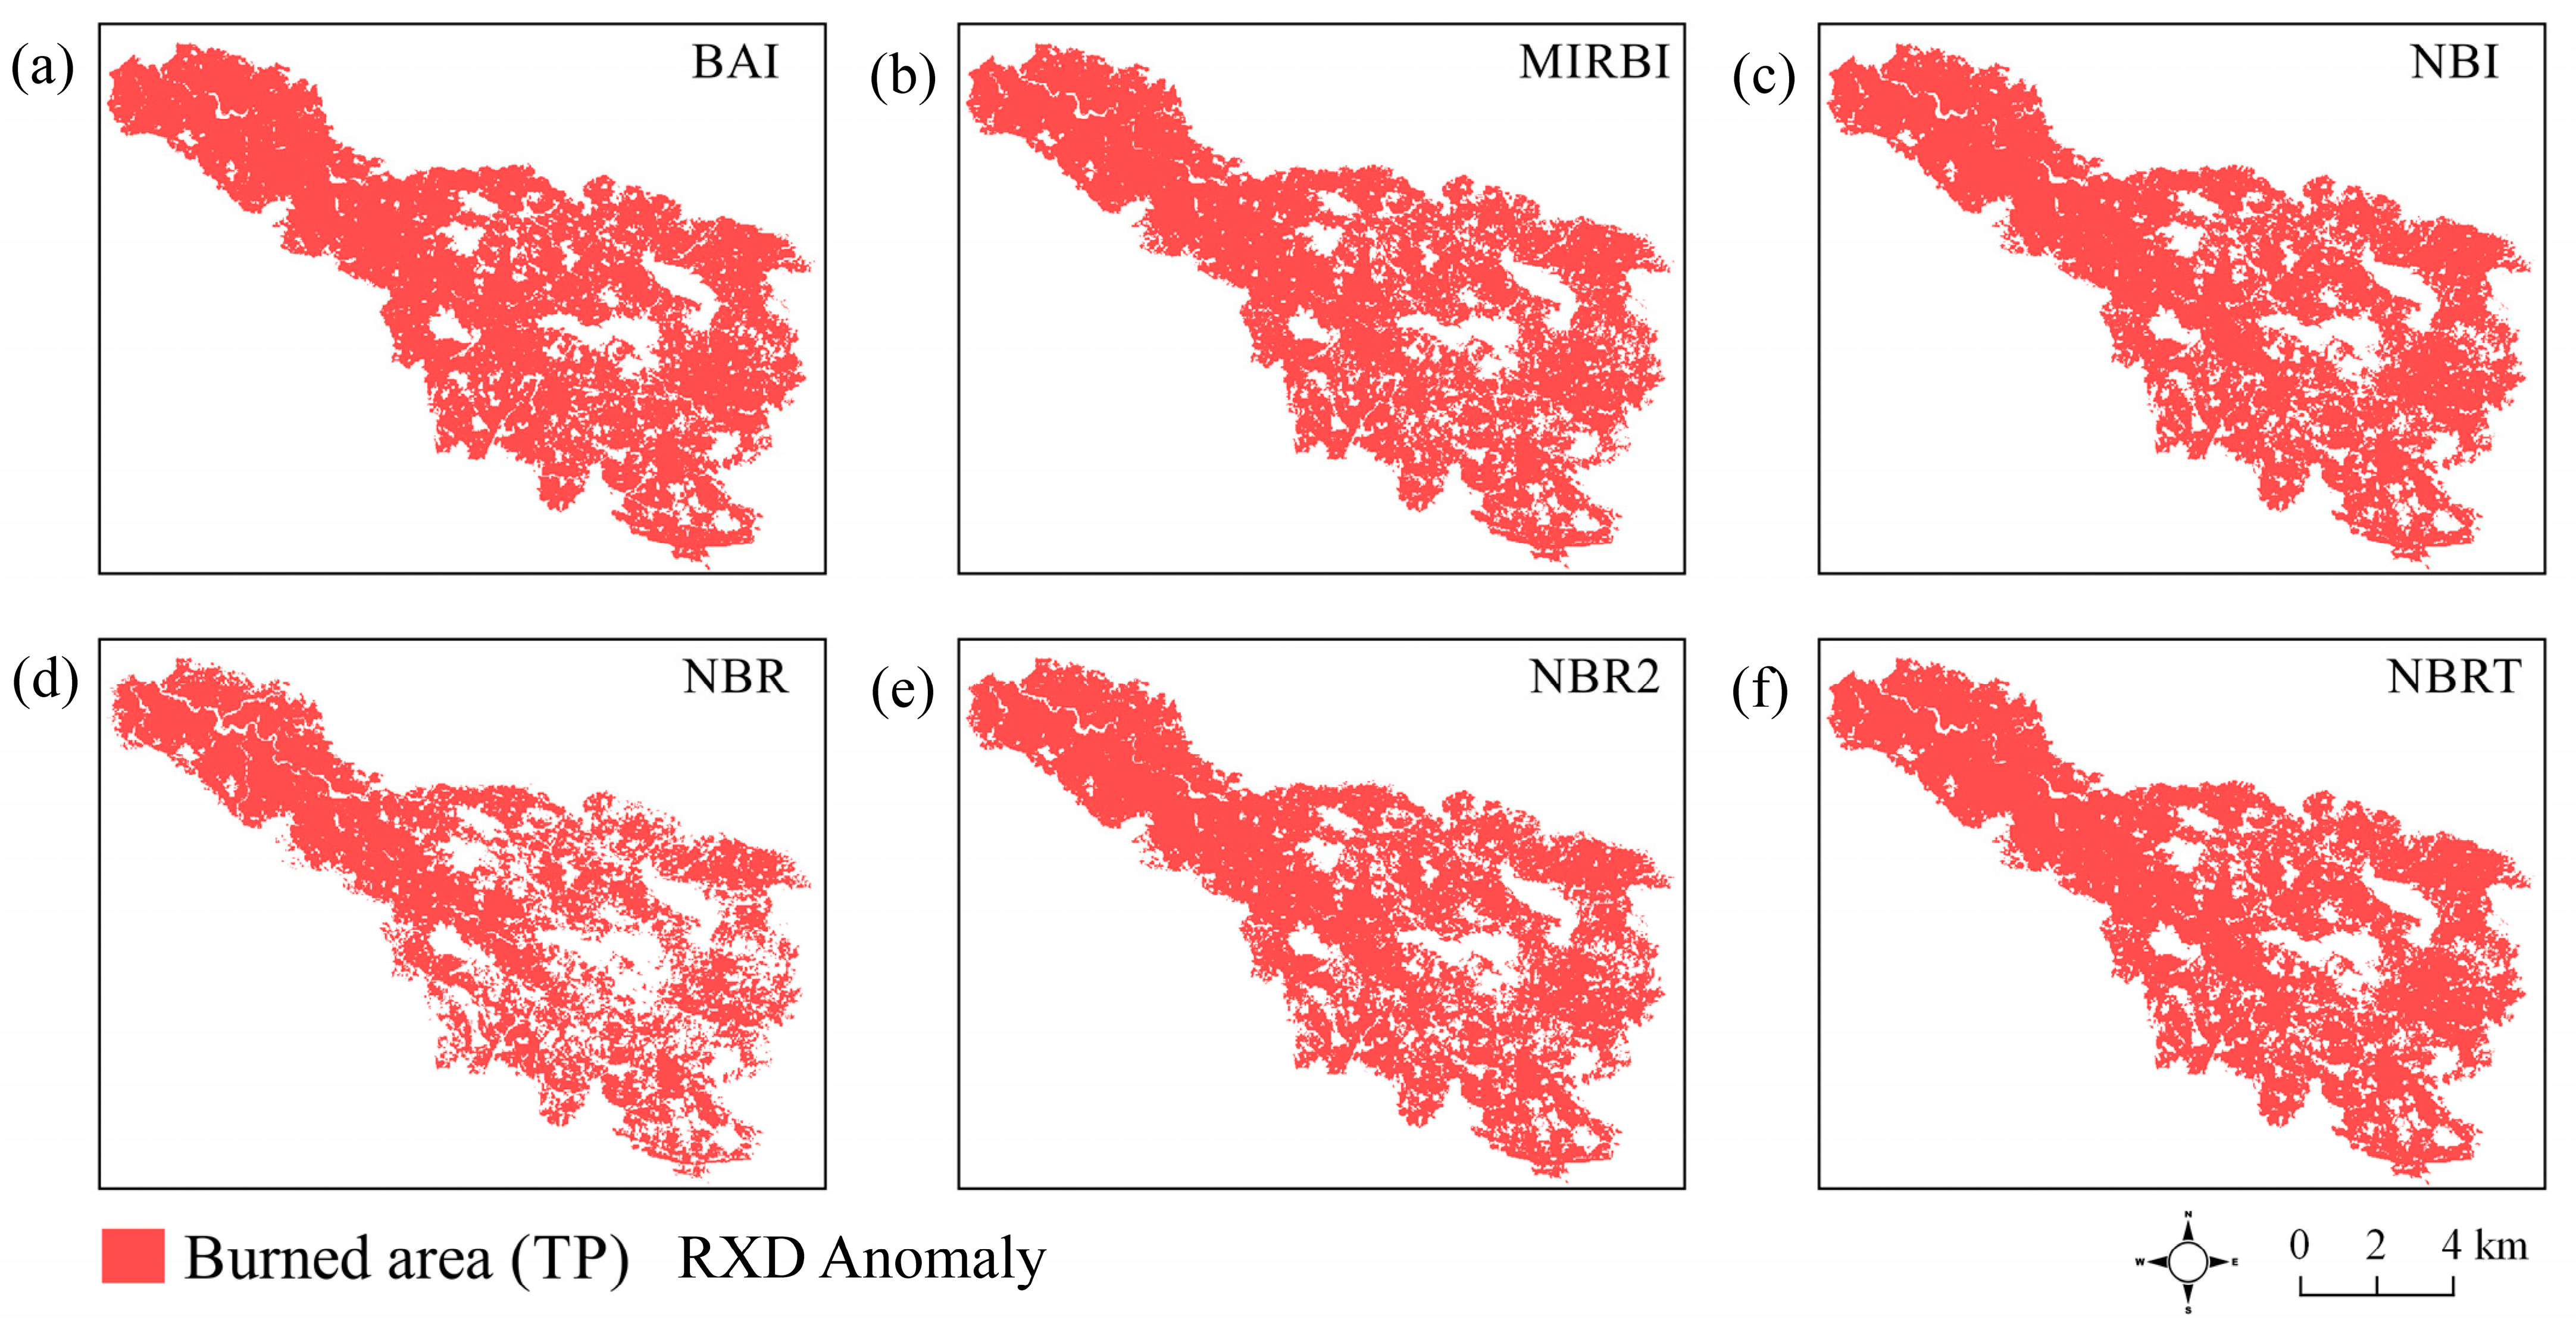
The quality of a specific remote sensing-derived thematic product is generally determined by comparisons with other remote sensing-derived maps. The quality indicators are derived from the confusion matrix between the reference product and the burned/unburned classified areas shown in Table 3 [70]. In this matrix, a is the number of pixels classified as burned in the reference map and in the classified product; b is the number of pixels classified as unburned in the reference map and as burned in the classified product; c is the number of pixels classified as burned in the reference map and as unburned in the classified product, and d is the number of pixels classified as unburned in the reference map and in the classified product.
In this work, the assessment metric used is the Sørensen–Dice coefficient (DC) [71,72]. The DC coefficient is a statistic used to compare the similarity between two samples, in this case, the classification results of the burned pixels and the reference map. It is calculated according to Equation (3), as:
DC = 2 2 + OE 1 OE + CE 1 CE
By counting the pixels classified as burned or unburned in a certain classification, the overall omission error (OE) and commission error (CE) measurements can be calculated. However, it is necessary to assess the accuracy of each validation scar for a more accurate analysis. OE reflects the proportion of burn scars not correctly classified by the classifier. On the other hand, the CE is the error produced when a pixel is assigned to a certain class, actually belonging to some other. DC is an estimate of accuracy and ranges from 0 to 1, where values close to or equal to 1 represent the proportion of overlapping pixels labeled as burned in the reference map that was really classified as burned while values close to or equal to 0 correspond to no overlap in the present category [71,72].

3. Results

Table 4 shows the M index values between the images before and after the fire for the different spectral indices used in this study. The analysis performed with the shortest possible time interval brings more efficient results in data separability according to Pereira et al. [38], as a smaller interval is ideal to avoid the dispersion of the spectral signal of the fire.
According to Table 4, in general, the spectral indices that use the shortwave infrared bands (NBR, NBRT, NBI, MIRBI, and NBR2) presented high separability (M > 1.5). The BAI index presented a separability polarity between the study sites, while the MIRBI presented the best performance of the set. The NBR, NBRT, NBR2, and NBI indices showed high separability and no significant variations between each other (1.5 to 1.78) and between study sites.
The separability values shown in Table 4 help in the analysis of the automatic classifiers, which can predict or identify mapping errors, such as those represented in Figure 3 and Figure 4, which show the spatial distribution of the true positive (TP) pixels (where true burned areas were detected) by the unsupervised classification method RXD anomaly in relation to the reference data (Table 5). The reference areas for the fires in Brazil and Portugal are 8.88 and 93.45 km2, respectively (Figure 5).
In the case of the fire in Brazil (Figure 3), the NBR index showed the lowest performance in the delimitation of the studied polygon. The low distribution of compact pixels of this index was responsible for about 3.61 km2 not classified as “burned area”, corresponding to 40% of the percentage difference in relation to the reference map. The BAI, NBI, and NBRT indices showed a disparity of −3, −3.01, and −2.17 km2, respectively. The indices based exclusively on the shortwave infrared bands (NBR2 and MIRBI) were responsible for the best spatial estimates of the burned area, where they presented percentage differences of 9% and 1%, respectively. The MIRBI index showed the best performance among the indices, with a disparity of −0.09 km2, while the NBR2 diverged by −0.73 km2 in relation to the reference perimeter.
In the case of the fire in Portugal (Figure 4), the NBI index had the lowest detection capacity with about 34.5 km2 (37%) of the burned area without its correct attribution. Similar behavior was found in the NBR index, with a percentage difference of 21.1% in relation to the reference map, being the NBR2 with 14.3%. The non-normalized indices (BAI, MIRBI, and NBRT) showed more consistent results, mainly the BAI with a percentage difference of 9.3%, with 12 and 12.7% for MIRBI and NBRT respectively.

Algorithm Accuracy

Table 6 shows the OE and CE percentages and DC for the burned areas generated by the spectral indices in relation to the reference data. Confusion matrices formed by pixels belonging to the same burned area class by all indices were used to compute the metrics.
In the case of the Brazil fire, CE had the lowest estimates in relation to OE, reaching values below 12% for all indices. The highest estimate of CE was found for the NBR index, corresponding to approximately 1.1 km2 erroneously classified as “unburned areas”. For the NBR2 index, which presented the lowest CE estimate, the CE was around 0.009 km2. Overall, the CE spatializations did not show significant variations in correspondence to the high separability estimates shown in Table 1, although the MIRBI index, even with its high separability, occupied together with NBI the third position of CE, which overestimated about 0.36 km2 of burned area. On the other hand, OE presented higher values in relation to CE with variations between 7 and 56%, with emphasis on the BAI and NBR2 indices. The BAI index showed about 4.97 km2 of area wrongly classified as “unburned”, resulting in the highest estimate of OE in the series (56%). In the OE estimates (42%), the NBR2 index classified 3.73 km2 without the correct attribution of the burned area presence class. The MIRBI index presented the lowest estimate of OE by a slight amount, with a value below 7 %, thus showing a low underestimation and a high performance in spatial fire detection, followed by the NBRT index with an estimate of 11%. In general, it is possible to observe that the OE values found for all the indices are directly proportional to the separability ranking summarized in Table 1. The highest accuracy of burning area detection was found for the MIRBI and NBRT indices, presenting values of DC > 90%. The BAI index presented the lowest performance in the classification, with an estimate of 59% of accuracy, corresponding to the high values found for OE and the second place for CE. The NBR, NBR2, and NBI indices showed significant precision (DC > 70%).
For the accuracy analysis of the results in the Portugal fire, it is possible to observe high accuracy (DC > 96%) for all indices in Table 6, with emphasis on MIRBI. However, significant values of CE were found, ranging between 10 and 37% for all the indices. The NBR and NBR2 indices had the highest CE values, with 3.29 and 2.84 km2 being incorrectly classified as burned areas, respectively. The MIRBI and NBI indices presented the same values (14%), followed by the NBRT (17%). The lowest CE estimate was found for the BAI index, with inconsistencies in the classification of around 0.89 km2.
OE values were low compared to CE, that is, there was a greater distribution of burned area pixels consistent with the reference data. The highest OE values were found for the NBR and NBR2 indices (6%), with 0.53 km2 being classified as “unburned area”, when in fact it belonged to the burned area class. As with the CE, the BAI and MIRBI indices presented the lowest estimates of OE, with 0.27 and 0.18 km2 of the classified area without their correct attribution in relation to the reference data, respectively. In general, compared to Brazil, the burned area data in Portugal were more accurate; however, they presented more overestimated data in all indices.

4. Discussion

This study provides an assessment of the effectiveness of the BAI, NBR, MIRBI, NBR2, NBI, and NBRT spectral indices to discriminate burned areas across a Landsat-8 satellite scene in two different ecosystems. It supports findings from previous studies that spectral indices solely based on NIR, SWIR, and TIR bands provide high discrimination of burned areas in a variety of ecosystems, including, for example, boreal forest [73,74], Amazonia [8,75,76], Cerrado [38,46,77,78], and semiarid [79]. However, this study also reinforces the fact that the behavior of the indices can vary between different ecosystems. For example, the MIRBI index showed a residual bias in the results of Brazil while the BAI index showed better performance in Portugal. This suggests that functionally different forest types have different spectral responses and, therefore, the same index may not have the same performance in detecting the burned area.

4.1. Behavior of Spectral Indices in the Two Areas of Study

The results found in Mpakairi et al. [21] agree with the high performance of BAI in Portugal. These authors revealed that forest ecosystems require spectral indices of burned areas that can explain soil reflectance. Thus, the BAI index, which uses the red band, could detect the soil reflectance, and thanks to NIR and red bands, the vegetation loss. In Mediterranean ecosystems, where most of the burning leaves are behind coal residues, the BAI index has been especially applied in fire studies. In Brazil, the BAI index showed a low yield, making it impossible to identify the burned area (Figure 3). This may be related to the studies by Smith et al. [80]. These authors argued that the use of BAI in savanna ecosystems, characterized by low albedo surfaces (plowed soil), may overestimate burned areas. In another study, Pereira et al. [38] also did not find good results using the BAI index in the discrimination of fires in the Brazilian Cerrado, which can be explained by the differences in characteristics between the Cerrado vegetation and the vegetation of countries located in the Mediterranean region of Europe, where the study by Chuvieco et al. [32] was developed.
MIRBI was the best index to distinguish between pixels of burned and unburned areas in the two study sites, presenting high separability (Table 4) and precision (above 97%) and low estimates of OE and CE. This result agrees with Liu et al. [27], who reported that the reflectance values in SWIR1 and SWIR2 bands present in MIRBI show distinct differences between the characteristics and the soil state, which provided a greater possibility of discrimination and the variation in the degree of severity of the fires. From the selected indices, only NBR2 and MIRBI considered the influence of SWIR1 and SWIR2 bands, which was probably the reason for the better performance of these indices.
The NBR index, which is widely used for burning area mapping, performed moderately at both study sites. Lu et al. [81] explained that in semi-arid vegetation, the reflectance in the NIR and SWIR bands does not show significant distinctions in the dry season. As a result, the capacity of NBR to detect the burned region and its severity is likely reduced. Furthermore, because most spectral changes in the NIR and SWIR regions occur practically parallel to the NBR isolines, NBR has been observed to have a limited capacity to describe the severity of burning quickly after a fire develops [76]. In this study, this statement was intensified since the Landsat-8 images used were acquired 47 days after the fire in Portugal and approximately 42 days in Brazil. The low performance of NBR was most likely due to this fact.
The NBI index also presented a moderate result in both study sites, in agreement with those obtained by Veraverbeke et al., Schepers et al. and Pereira et al. [38,50,82]. According to Schepers et al. [50], indices that use VIS wavelengths may have very low performance in distinguishing between burned areas in some ecosystems, as this range does not present a significant sensitivity in post-fire vegetation in remote sensing images. In classification analyses, a likely explanation for the inconsistencies presented by the NBI is that in the VIS range, water-rich landscapes and peat soil types are sparse forests that are shown practically dark in the images. It can be confused with burned areas for the different spectral bands, especially in the blue [50]. However, even so, in Brazil, the NBI stood out from the BAI and presented values similar to the NBR and NBRT.
The NBRT index presented itself with almost the highest detection accuracy in Portugal and practically the third position in Brazil, proving to be advantageous when compared to the reference data. According to Holden et al. and Harris et al. [36,83], the spectral variability in the NIR and SWIR range of ash and coal increases in degraded ground cover (due to post-fire vegetation removal), complementary to surface thermal data, and is able to provide level-sensitive NBRT values of burning severity. It is important to note that due to the temporal dynamics and the characteristics of the environment after the fire, the advantage of adding the TIR range for evaluating the burned area will strongly depend on the post-fire acquisition time and the seasonal variation in meteorological conditions [84,85,86]. For that reason, it is important to note that the revisit time for Landsat-8 is 16 days in addition to noting the necessity of acquiring cloud-free images [83].

4.2. Influence of Spatial and Temporal Resolution

The high OE values obtained in the assessments carried out in Brazil are mainly due to the small undetected areas. Very small patches are often lost and contaminated by spectral mixing. However, compared to the total burned area, they represent a small portion, not interfering, or only in small part, with the overall accuracy. Another factor for the presence of the high OE might be the inadequacy of the indices in mapping burned areas of minor severity, found in the southern part of the study area. The low signal from the minor burned area, intensified by the interval of days from imaging to the start of burning, results in spectral indices with more unwanted noise, causing interference in the automatic classification algorithms.
The validation data used in the study area in Brazil were generated by Landsat-8 images and on the same date as the post-fire images, reducing the presence of OE and consequently increasing the degree of spatial detection of burned areas. For the case of Portugal, the validation data provided by ICNF were based on Sentinel-2 images (10 m) and were acquired on different dates than the Landsat-8 images. This may have directly influenced the results found, mainly in CE. Sentinel-2 temporal resolution is 5 days and Landsat-8 16 days. Thus, an early classification of the burned area obtained by Sentinel-2 makes the Landsat-8 classification more backward and overestimated. However, the greater spatial detail of the burned area provided by the ICNF data (100 m2/pixel) was able to slightly increase the classification accuracy, which was not possible with the same efficiency in Brazil.
Differences in separability performance between forest fires were observed by Lasaponara [87], who states that these observations may be due to the different types of land cover affected by the fire. The results obtained in this study indicate that different types of vegetation within the burn scar cause differences in separability performance. There are divergences in the application of different spectral indices in burned areas. According to Pereira et al. [38,39], these divergences can occur due to the period of time between the occurrence of fires and the acquisition of the images and also considering the differences between each biome, both in relation to their edaphoclimatic characteristics and their post-fire reaction time.
Overall, the omission errors found are mainly due to small areas missed by the RXD anomaly; very small patches are often missed and contaminated by spectral mixing, although these events represent a small proportion of the total burned area and may not interfere with overall accuracy. Another factor in omission errors may be related to the inadequacy of the indices in mapping low-severity burned areas, which can result in unwanted noise and the identification of inadequate thresholds in the automatic classification algorithms although this work was not intended to precisely identify different fire severities. Liu et al. [88] and Seydi et al. [89] highlighted that it is important to understand the different types of land cover or land uses in the study area during fire events, which can help to reduce the misclassification of the burned area. Chen et al. [90] emphasized that supervised and unsupervised classification methods lack the integration of human knowledge based on specialists in the classification process since they can contribute to the identification and better classification, for example, of low-severity fires, enhancing the accuracy of classification of the burned area.
The results of this study corroborate the findings of Tran et al. [73], which indicate that the index performance is similar in forest types with similar functional characteristics (structure and regeneration strategy of dominant canopy species).

5. Conclusions

This work presented a comparative approach to classifying spectral indices and burned areas in dry ecosystems and temperate forests. The BAI, NBR, MIRBI, NBR2, NBI, and NBRT spectral indices made it possible to discriminate burned areas in Brazil and Portugal from Landsat-8 satellite images, corroborating previous studies to discriminate burned areas in different ecosystems, such as boreal forest, Amazonia, Cerrado, and semiarid.
The BAI index presented a separability polarity between the study sites, while the MIRBI presented the best performance of the set. The NBR, NBRT, NBR2, and NBI indices showed high separability and no significant variations between each other (1.5 to 1.78) and between study sites.
The results of the study indicated that the indices based exclusively on the SWIR1 and SWIR2 bands showed a high degree of separability and were more suitable for detecting burned areas, although it was observed that the location affects the performance of the indices.
The indices provided by the Landsat-8 multitemporal data help forest management in the spatial monitoring of the studied fire scars, adapting to the different linked biomes.
This study also indicates that the behavior of the indices may vary between different ecosystems, suggesting that functionally different forest types have different spectral responses. Therefore, the same index may not have the same performance in detecting the burned area. Landsat-8 OLI and TIRS sensors with medium spatial resolution allowed more detailed spatial and spectral monitoring of fires, making it possible to reduce temporal incompatibilities with the validation data used in this study.
The classification method based on bitemporal anomalous changes (RXD anomaly) proved to be effective in increasing the burned area in terms of temporal alteration and performing unsupervised detection without depending on the ground truth. It was applicable in different environmental systems through remote sensing images without the need for a priori information and fixed thresholds, in addition to representing a tool to link spectral indices and spatial dynamics. On the other hand, the main limitations of RXD were observed in non-abrupt changes, which is very common in fires with low spectral signals, especially in the context of using Landsat-8 images with a 16-day revisit time.
The results obtained in this study were able to provide critical information for fire mapping algorithms and for an accurate post-fire spatial estimation in temperate forests and dry ecosystems.
The study presents a new comparative approach to classifying burned areas in dry ecosystems and temperate forests with the least possible human interference, assisting investigations when little data on fires is available, in addition to favoring the reduction in gross errors in the classification of burned areas and the reduction in fieldwork.

Author Contributions

Conceptualization, A.d.P.P., J.A.d.S.J., A.M.R.-A., I.d.O.S. and R.F.F.H.; Data curation, A.d.P.P., J.A.d.S.J., A.M.R.-A., I.d.O.S. and R.F.F.H.; Formal analysis, A.d.P.P., J.A.d.S.J., A.M.R.-A., I.d.O.S. and R.F.F.H.; Investigation, A.d.P.P., J.A.d.S.J., A.M.R.-A., I.d.O.S. and R.F.F.H.; Methodology, A.d.P.P., J.A.d.S.J., A.M.R.-A., I.d.O.S. and R.F.F.H.; Supervision, A.d.P.P., J.A.d.S.J., A.M.R.-A., I.d.O.S. and R.F.F.H.; Validation, A.d.P.P., J.A.d.S.J., A.M.R.-A., I.d.O.S. and R.F.F.H.; Writing–original draft, A.d.P.P., J.A.d.S.J., A.M.R.-A., I.d.O.S. and R.F.F.H.; Writing–review & editing, A.d.P.P., J.A.d.S.J., A.M.R.-A., I.d.O.S. and R.F.F.H. All authors have read and agreed to the published version of the manuscript.

Funding

The article processing charge (APC) was funded by the University of Jaén through the Center for Advanced Studies on Earth Sciences, Energy and Environment CEACTEMA and the University of Minho.

Data Availability Statement

Data supporting the findings of this study are available in the public domain. Landsat-8 data (https://earthexplorer.usgs.gov/, accessed on 20 April 2020). BDQueimadas vector data (https://queimadas.dgi.inpe.br/queimadas/aq30m/, accessed on 20 April 2020). ICNF burned areas vector data (https://www.icnf.pt/florestas/gfr/gfrgestaoinformacao/dfciinformacaocartgrafica, accessed on 20 April 2020).

Acknowledgments

Research was supported by the project “Applied Remote Sensing in the Study of Hot Spots in Forests in Brazil and the Iberian Peninsula” from the Department of Cartographic Engineering and Surveying (DECart) of the Federal University of Pernambuco (UFPE/Brazil), by POIUJA-2023/2024 and CEACTEMA from University of Jaén (Spain), and RNM-282 research group from the Junta de Andalucía (Spain). This work was also supported by national funding awarded by FCT—Foundation for Science and Technology, I.P., projects UIDB/04683/2020 and UIDP/04683/2020.

Conflicts of Interest

The authors declare no conflict of interest.

References

  1. Food and Agriculture Organization (FAO). Global Forest Resources Assessment—Main Report; FAO Forestry Paper 163; FAO: Rome, Italy, 2010; Available online: http://www.fao.org/3/a-al625e.pdf (accessed on 20 January 2023).
  2. Aponte, C.; De Groot, W.J.; Wotton, B.M. Forest fires and climate change: Causes, consequences and management options. Int. J. Wildland Fire 2016, 25, i–ii. [Google Scholar] [CrossRef]
  3. Chu, T.; Guo, X. Remote Sensing Techniques in Monitoring Post-Fire Effects and Patterns of Forest Recovery in Boreal Forest Regions: A Review. Remote Sens. 2014, 6, 470–520. [Google Scholar] [CrossRef] [Green Version]
  4. Fernández-Manso, A.; Fernández-Manso, O.; Quintano, C. SENTINEL-2 red-edge spectral indices suitability for discriminating burn severity. Int. J. Appl. Earth Obs. Geoinf. 2016, 50, 170–175. [Google Scholar] [CrossRef]
  5. Fernandes, P.M.; Monteiro-Henriques, T.; Giomar, N.; Loureiro, C.; Barros, A.M.G. Bottom-up variables govern large-fire size in Portugal. Ecosystems 2016, 19, 1362–1375. [Google Scholar] [CrossRef]
  6. Chuvieco, E.; Mouillot, F.; Van der Werf, G.R.; Miguel, J.; Tanasse, M.; Koutsias, N.; García, M.; Yebra, M.; Padilla, M.; Gitas, I.; et al. Historical background and current developments for mapping burned area from satellite Earth observation. Remote Sens. Environ. 2019, 225, 45–64. [Google Scholar] [CrossRef]
  7. Han, A.; Qing, S.; Bao, Y.; Na, L.; Bao, Y.; Liu, X.; Zhang, J.; Wang, C. Short-Term Effects of Fire Severity on Vegetation Based on Sentinel-2 Satellite Data. Sustainability 2021, 13, 432. [Google Scholar] [CrossRef]
  8. Huang, H.; Roy, D.P.; Boschetti, L.; Zhang, H.K.; Yan, L.; Kumar, S.S.; Gomez-Dans, J.; Li, J. Separability Analysis of Sentinel-2A Multi-Spectral Instrument (MSI) Data for Burned Area Discrimination. Remote Sens. 2016, 8, 873. [Google Scholar] [CrossRef] [Green Version]
  9. Lei, C.L. Estimating Burned Severity with Multiple Methods in Da Hinggan Mountains. Ph.D. Thesis, Northeast Forestry University, Harbin, China, 2012. (In Chinese). [Google Scholar]
  10. da Penha, P.A.; da Silva, J.A., Jr.; Ruiz-Armenteros, A.M.; Henriques, R.F.F. Assessment of k-Nearest Neighbor and Random Forest Classifiers for Mapping Forest Fire Areas in Central Portugal Using Landsat-8, Sentinel-2, and Terra Imagery. Remote Sens. 2021, 13, 1345. [Google Scholar] [CrossRef]
  11. Lizundia-Loiola, J.; Otón, G.; Ramo, R.; Chuvieco, E. A spatio-temporal active-fire clustering approach for global burned area mapping at 250 m from MODIS data. Remote Sens. Environ. 2020, 236, 111493. [Google Scholar] [CrossRef]
  12. Mulder, V.; De Bruin, S.; Schaepman, M.; Mayr, T. The use of remote sensing in soil and terrain mapping—A review. Geoderma 2012, 122, 66–74. [Google Scholar] [CrossRef]
  13. Llorens, R.; Sobrino, J.A.; Cristina Fernández, C.; Fernández-Alonso, J.M.; José, J.V. A methodology to estimate forest fires burned areas and burn severity degrees using Sentinel-2 data. Application to the October 2017 fires in the Iberian Peninsula. Int. J. Appl. Earth Obs. Geoinf. 2021, 95, 102243. [Google Scholar] [CrossRef]
  14. Gao, Y.; Skutsch, M.; Paneque-Gálvez, J.; Ghilardi, A. Remote sensing of forest degradation: A review. Environ. Res. Lett. 2020, 15, 103001. [Google Scholar] [CrossRef]
  15. Kurbanov, E.; Vorobev, O.; Lezhnin, S.; Sha, J.; Wang, J.; Li, X.; Cole, J.; Dergunov, D.; Wang, Y. Remote Sensing of Forest Burnt Area, Burn Severity, and Post-Fire Recovery: A Review. Remote Sens. 2022, 14, 4714. [Google Scholar] [CrossRef]
  16. Chicas, S.D.; Nielsen, J.Ø. Who are the actors and what are the factors that are used in models to map forest fire susceptibility? A systematic review. Nat. Hazards 2022, 114, 2417–2434. [Google Scholar] [CrossRef]
  17. Bot, K.; Borges, J.G. A Systematic Review of Applications of Machine Learning Techniques for Wildfire Management Decision Support. Inventions 2022, 7, 15. [Google Scholar] [CrossRef]
  18. Pinto, M.M.; Libonati, R.; Trigo, R.M.; Trigo, I.F.; DaCamara, C.C. A deep learning approach for mapping and dating burned areas using temporal sequences of satellite images. ISPRS J. Photogramm. Remote Sens. 2020, 160, 260–274. [Google Scholar] [CrossRef]
  19. Bouguettayaa, A.; Zarzour, H.; Taberkit, A.M.; Kechidaa, A. A review on early wildfire detection from unmanned aerial vehicles using deep learning-based computer vision algorithms. Signal Process. 2022, 190, 108309. [Google Scholar] [CrossRef]
  20. Bo, W.; Liu, J.; Fan, X.; Tjahjadi, T.; Ye, Q.; Fu, L. BASNet: Burned Area Segmentation Network for Real-Time Detection of Damage Maps in Remote Sensing Images. IEEE Trans. Geosci. Remote Sens. 2022, 60, 1–13. [Google Scholar] [CrossRef]
  21. Mpakairi, K.S.; Ndaimani, H.; Kavhu, B. Exploring the utility of Sentinel-2 MSI derived spectral indices in mapping burned areas in different land-cover types. Sci. Afr. 2020, 10, e00565. [Google Scholar] [CrossRef]
  22. Sobrino, J.A.; Llorens, R.; Fernández, C.; Fernández-Alonso, J.M.; Veja, J.A. Relationship between soil burn severity in forest fires measured in situ and through spectral indices of remote detection. Forests 2019, 10, 457. [Google Scholar] [CrossRef] [Green Version]
  23. Bastarrika, A.; Alvarado, M.; Artano, K.; Martinez, P.M.; Mesanza, A.; Torre, L.; Ramo, R.; Chuvieco, E. A tool for supervised burned area mapping using Landsat data. Remote Sens. 2014, 6, 12360–12380. [Google Scholar] [CrossRef] [Green Version]
  24. Rozario, P.F.; Madurapperuma, B.D.; Wang, Y. Remote Sensing Approach to Detect Burn Severity Risk Zones in Palo Verde National Park, Costa Rica. Remote Sens. 2018, 10, 1427. [Google Scholar] [CrossRef] [Green Version]
  25. Mallinis, G.; Mitsopoulos, I.; Chrysafi, I. Evaluating and comparing Sentinel 2A and landsat-8 operational land imager (OLI) spectral indices for estimating fire severity in a Mediterranean pine ecosystem of Greece. GISci. Remote Sens. 2018, 55, 1–18. [Google Scholar] [CrossRef]
  26. Schroeder, W.; Oliva, P.; Giglio, L.; Quayle, B.; Lorenz, E.; Morelli, F. Active fire detection using Landsat-8/OLI data. Remote Sens. Environ. 2016, 185, 210–220. [Google Scholar] [CrossRef] [Green Version]
  27. Liu, S.; Yongjie, Z.; Dalponte, M.; Xiaohua Tong, X. A novel fire index-based burned area change detection approach using Landsat-8 OLI data. Eur. J. Remote Sens. 2020, 53, 104–112. [Google Scholar] [CrossRef] [Green Version]
  28. Lanorte, A.; Danese, M.; Lasaponara, R.; Murgante, B. Multiscale mapping of burn area and severity using multisensor satellite data and spatial autocorrelation analysis. Int. J. Appl. Earth Obs. Geoinf. 2013, 20, 42–51. [Google Scholar] [CrossRef]
  29. Parks, S.; Dillon, G.; Miller, C.A. New Metric for Quantifying Burn Severity: The Relativized Burn Ratio. Remote Sens. 2014, 6, 1827–1844. [Google Scholar] [CrossRef] [Green Version]
  30. Stroppiana, D.; Bordogna, G.; Carrara, P.; Boschetti, M.; Boschetti, L.; Brivio, P. A method for extracting burned areas from Landsat TM/ETM+ images by soft aggregation of multiple Spectral Indices and a region growing algorithm. ISPRS J. Photogramm. Remote Sens. 2012, 69, 88–102. [Google Scholar] [CrossRef]
  31. French, N.H.; Kasischke, E.S.; Hall, R.J.; Murphy, K.A.; Verbyla, D.L.; Hoy, E.E.; Allen, J.L. Using Landsat data to assess fire and burn severity in the North American boreal forest region: An overview and summary of results. Int. J. Wildland Fire 2008, 17, 443–462. [Google Scholar] [CrossRef]
  32. Chuvieco, E.; Martin, M.P.; Palacios, A. Assessment of different spectral indices in the red-near-infrared spectral domain for burned land discrimination. Int. J. Remote Sens. 2002, 23, 5103–5110. [Google Scholar] [CrossRef]
  33. Key, C.H.; Benson, N.C. The Normalized Burn Ratio (NBR): A Landsat TM Radiometric Measure of Burn Severity. US Geological Survey Northern Rocky Mountain Science Center. U.S. Department of the Interior, U.S. Geological Survey, Northern Rocky Mountain Science Center; 2003. Available online: https://www.frames.gov/catalog/5860 (accessed on 20 January 2023).
  34. Trigg, S.; Flasse, S. An evaluation of different bi-spectral spaces for discriminating burned shrub-savannah. Int. J. Remote Sens. 2001, 22, 2641–2647. [Google Scholar] [CrossRef]
  35. Alleaume, S.; Hély, C.; Le Roux, J.; Korontzi, S.; Swap, R.J.; Shugart, H.H.; Justice, C.O. Using MODIS to evaluate heterogeneity of biomass burning in southern African savannahs: A case study in Etosha. Int. J. Remote Sens. 2005, 26, 4219–4237. [Google Scholar] [CrossRef]
  36. Holden, Z.; Smith, A.; Morgan, P.; Rollins, M.G.; Gessler, P.E. Evaluation of Novel Thermally Enhanced Spectral Indices for Mapping Fire Perimeters and Comparisons with Fire Atlas Data. Int. J. Remote Sens. 2005, 26, 4801–4808. [Google Scholar] [CrossRef]
  37. Kleinn, C.; Corrales, L.; Morales, D. Forest area in Costa Rica: A comparative study of tropical forest cover estimates over time. Environ. Monit. Assess. 2002, 73, 17–40. [Google Scholar] [CrossRef]
  38. Pereira, A.A.; Teixeira, F.R.; LibonatI, R.; Melchiori, E.A.; Carvalho, L.M.T. Avaliação de índices espectrais para identificação de áreas queimadas no cerrado utilizando dados Landsat TM. Rev. Bras. Cartogr. 2016, 68, 1665–1680. Available online: https://seer.ufu.br/index.php/revistabrasileiracartografia/article/view/44386 (accessed on 20 January 2023). [CrossRef]
  39. Pereira, A.A.; Pereira, J.M.C.; Libonati, R.; Oom, D.; Setzer, A.W.; Morelli, F.; Machado-Silva, F.; De Carvalho, L.M.T. Burned Area Mapping in the Brazilian Savanna Using a One-Class Support Vector Machine Trained by Active Fires. Remote Sens. 2017, 9, 1161. [Google Scholar] [CrossRef] [Green Version]
  40. Santos, S.M.; Bento-Gonçalves, A.; Franca-Rocha, W.; Batista, G. Assessment of Burned Forest Area Severity and Postfire Regrowth in Chapada Diamantina National Park (Bahia, Brazil) Using dNBR and RdNBR Spectral Indices. Geosciences 2020, 10, 106. [Google Scholar] [CrossRef] [Green Version]
  41. Teodoro, A.; Amaral, A. A Statistical and Spatial Analysis of Portuguese Forest Fires in Summer 2016 Considering Landsat 8 and Sentinel 2A Data. Environments 2019, 6, 36. [Google Scholar] [CrossRef] [Green Version]
  42. Vlassova, L.; Pérez-Cabello, F.; Mimbrero, M.; Liovería, R.; García-Martín, A. Analysis of the Relationship between Land Surface Temperature and Wildfire Severity in a Series of Landsa50t Images. Remote Sens. 2014, 6, 6136–6162. [Google Scholar] [CrossRef] [Green Version]
  43. Chuvieco, E.; Congalton, R.G. Mapping and inventory of forest fires from digital processing of tm data. Geocarto Int. 2008, 3, 41–53. [Google Scholar] [CrossRef]
  44. Loboda, T.V.; Hoy, E.E.; Giglio, L.; Kasischke, E.S. Mapping burned area in Alaska using MODIS data: A data limita-tions-driven modification to the regional burned area algorithm. Int. J. Wildland Fire 2011, 20, 487–496. [Google Scholar] [CrossRef]
  45. Liu, J.G.; Mason, P.J. Essential Image Processing and GIS for Remote Sensing; John Wiley & Sons: Hoboken, NJ, USA, 2013; ISBN 9780470510322. [Google Scholar]
  46. Sedano, F.; Kempeneers, P.; Miguel, J.S.; Strobl, P.; Vogt, P. Towards a pan-European burnt scar mapping methodology based on single date medium resolution optical remote sensing data. Int. J. Appl. Earth Obs. Geoinf. 2013, 20, 52–59. [Google Scholar] [CrossRef]
  47. Fox, Y.; Malkinson, L.; Maselli, F.; Andrieu, J.; Bottai, L.; Wittenberg, L. POSTFIRE: A model to map forest fire burn scar and estimate runoff and soil erosion risks. Remote Sens. Appl. Soc. Environ. 2016, 4, 83–91. [Google Scholar] [CrossRef]
  48. Reed, I.S.; Yu, X. Adaptive multhäusleiple-band CFAR detection of an optical pattern with unknown spectral distribution. IEEE Trans. Acoust. Speech Signal Process. 1990, 38, 1760–1770. [Google Scholar] [CrossRef]
  49. Belenguer-Plomer, M.; Mihai, A.; Tanase, M.A.; Fernández-Carrillo, A.; Chuvieco, E. Burned area detection and mapping using Sentinel-1 backscatter coefficient and thermal anomalies. Remote Sens. Environ. 2019, 233, 111345. [Google Scholar] [CrossRef]
  50. Schepers, L.; Haest, B.; Veraverbeke, S.; Spanhove, T.; Vanden Borre, J.; Goossens, R. Burned Area Detection and Burn Severity Assessment of a Heathland Fire in Belgium Using Airborne Imaging Spectroscopy (APEX). Remote Sens. 2014, 6, 1803–1826. [Google Scholar] [CrossRef] [Green Version]
  51. Kaufman, Y.J.; Remer, L. Remote sensing of vegetation in the mid-IR: The 3.75 μm channels. IEEE Geosci. Remote Sens. Lett. 1994, 32, 672–683. [Google Scholar] [CrossRef]
  52. MMA—Ministério do Meio Ambiente (Brasil). 2016. Available online: http://www.mma.gov/ (accessed on 20 January 2023).
  53. Costa, T.C.C.; Oliveira, M.A.J.; Accioly, L.J.O.; Silva, F.H.B.B. Análise da Degradação da Caatinga No Núcleo de Deserificação do Seridó (RN/PB). Rev. Bras. Eng. Agrícola E Ambient. 2009, 13, 961–974. Available online: https://ainfo.cnptia.embrapa.br/digital/bitstream/item/202072/1/Analise-da-degradacao-2009.pdf (accessed on 20 January 2023). [CrossRef] [Green Version]
  54. Vilar, L.; Camia, A.; San-Miguel-Ayanz, J. A comparison of remote sensing products and forest fire statistics for improving fire information in Mediterranean Europe. Eur. J. Remote Sens. 2015, 48, 345–364. [Google Scholar] [CrossRef] [Green Version]
  55. Miranda, P.; Coelho, F.; Tomé, A.R.; Valente, M.A.; Carvalho, A.; Pires, C.; Pires, H.O.; Pires, V.C.; Ramalho, C. 20th century Portuguese climate and climate scenarios. In Climate Change in Portugal: Scenarios, Impacts and Adaptation Measures (SIAM Project); Santos, F.D., Forbes, K., Moita, R., Eds.; Gradiva: New York, NY, USA, 2002; pp. 23–83. [Google Scholar]
  56. Nunes, M.C.S.; Vasconcelos, M.J.; Pereira, J.M.C.; Dasgupta, N.; Alldredge, R.J.; Rego, F.C. Land cover type and fire in Portugal: Do fires burn land cover selectively? Landsc. Ecol. 2005, 20, 661–673. [Google Scholar] [CrossRef]
  57. Calvo, L.; Santalla, S.; Valbuena, L.; Marcos, E.; Tarrega, R.; Luis-Calabuig, E. Post-fire natural regeneration of a Pinus pinaster forest in NW Spain. Plant Ecol. 2008, 197, 81–90. [Google Scholar] [CrossRef]
  58. Hansen, M.C.; Potapov, P.V.; Moore, R.; Hancher, M.; Turubanova, S.A.; Tyukavina, A.; Kommareddy, A. High-resolution global maps of 21stcentury forest cover change. Science 2013, 342, 850–853. [Google Scholar] [CrossRef] [PubMed] [Green Version]
  59. USGS. Landsat 8 Data Users Handbook. Department of the Interior, U.S. Geological Survey. 2019. Available online: https://www.usgs.gov/landsat-missions/landsat-8-data-users-handbook (accessed on 20 January 2023).
  60. Xu, H.; Shao-lin, H. A Comparative Study on the Calibration Accuracy of Landsat 8 Thermal Infrared Sensor Data. Spectrosc. Spectr. Anal. 2016, 36, 1941–1948. [Google Scholar]
  61. Pleniou, M.; Koutsias, N. Sensitivity of spectral reflectance values to different burn and vegetation ratios: A multi-scale approach applied in a fire affected area. ISPRS J. Photogramm. Remote Sens. 2013, 79, 199–210. [Google Scholar] [CrossRef]
  62. García, L.M.; Caselles, V. Mapping Burns and Natural Reforestation using Thematic Mapper Data. Geocarto Int. 1991, 6, 31–37. [Google Scholar] [CrossRef]
  63. Roteta, E.; Bastarrika, A.; Padilla, M.; Stormc, T.; Chuvieco, E. Development of a Sentinel-2 burned area algorithm: Generation of a small fire database for sub-Saharan Africa. Remote Sens. Environ. 2019, 222, 1–17. [Google Scholar] [CrossRef]
  64. Storey, E.A.; Stow, D.A.; O’Leary, J.F. Assessing postfire recovery of chamise chaparral using multi-temporal spectral vegetation index trajectories derived from Landsat imagery. Remote Sens. Environ. 2016, 183, 53–64. [Google Scholar] [CrossRef] [Green Version]
  65. Rodrigues, J.A.; Libonati, R.; de Faria Peres, L.F.L.; Setzer, A. Mapeamento de Áreas Queimadas em Unidades de Conservação da Região Serrana do Rio de Janeiro Utilizando o Satélite Landsat-8 Durante a Seca de 2014. Anuário Inst. Geocienc. UFRJ 2018, 41, 318–332. [Google Scholar] [CrossRef]
  66. Theiler, J.; Perkins, S. Proposed framework for anomalous change detection. In ICML Workshop on Machine Learning Algorithms for Surveillance and Event Detection; Los Alamos National Laboratory: Los Alamos, NM, USA, 2006; pp. 7–14. Available online: https://public.lanl.gov/jt/Papers/anomchange-icml.pdf (accessed on 20 January 2023).
  67. Dabbiru, L.; Aanstoos, J.V.; Mahrooghy, M.; Li, W.; Shanker, A.; Younan, N.H. Levee anomaly detection using polarimetric synthetic aperture radar data. In Proceedings of the IEEE International Geoscience and Remote Sensing Symposium (IGARSS) 2012, Munich, Germany, 22–27 July 2012; IEEE: New York, NY, USA, 2012; pp. 5113–5116. [Google Scholar] [CrossRef]
  68. INPE. Instituto Nacional De Pesquisas Espaciais. Available online: https://queimadas.dgi.inpe.br/queimadas/aq30m/ (accessed on 20 January 2023).
  69. ICNF. Defesa da Floresta Contra Incêndios. Instituto da Conservação da Natureza e das Florestas, Lisboa. 2019. Available online: https://www.icnf.pt/ (accessed on 20 January 2023).
  70. Story, M.; Congalton, R.G. Remote Sensing Brief Accuracy Assessment: A User’s Perspective. Photogramm. Eng. Remote Sens. 1986, 52, 397–399. Available online: http://www.asprs.org/wp-content/uploads/pers/1986journal/mar/1986_mar_397-399.pdf (accessed on 20 January 2023).
  71. Sørensen, T. Um Método de Estabelecer Grupos de Igual Amplitude em Sociologia Vegetal com Base na Similaridade de Espécies e sua Aplicação a Análises da Vegetação em Áreas Comuns Dinamarquesas. Biol. Skr. K. Dan. Vidensk. Selskab. 1948, 5, 1–34. Available online: https://www.royalacademy.dk/Publications/High/295_S%C3%B8rensen,%20Thorvald.pdf (accessed on 20 January 2023).
  72. Dice, L.R. Measures of the Amount of Ecologic Association between Species. Ecology 1945, 26, 297–302. [Google Scholar] [CrossRef]
  73. Tran, B.N.; Tanase, M.A.; Bennett, L.T.; Aponte, C. Evaluation of Spectral Indices for Assessing Fire Severity in Australian Temperate Forests. Remote Sens. 2018, 10, 1680. [Google Scholar] [CrossRef] [Green Version]
  74. Parisien, M.A.; Barber, Q.E.; Hirsch, K.G.; Stockdale, C.A.; Erni, S.; Wang, X.; Arseneault, D.; Parks, S.A. Fire deficit increases wildfire risk for many communities in the Canadian boreal forest. Nat. Commun. 2020, 11, 2121. [Google Scholar] [CrossRef] [PubMed]
  75. Penha, T.V.; Körting, T.S.; Fonseca, L.M.G.; Silva, C.H.L., Jr.; Pletsch, M.A.J.S.; Anderson, L.O.; Morelli, F. Detecção de Áreas Queimadas na Amazônia Brasileira usando Índices Espectrais e GEOBIA. Rev. Bras. Cartogr. 2020, 72, 253–269. [Google Scholar] [CrossRef]
  76. Roy, D.P.; Jin, Y.; Lewis, P.E.; Justice, C.O. Prototyping a global algorithm for systematic fire-affected area mapping using MODIS time series data. Remote Sens. Environ. 2005, 97, 137–162. [Google Scholar] [CrossRef]
  77. Campagnolo, M.; Libonati, R.; Pereira, J.M.C.; Rodrigues, J.A. A comprehensive characterization of MODIS daily burned area mapping accuracy across fire sizes in tropical savannas. Remote Sens. Environ. 2021, 252, 112115. [Google Scholar] [CrossRef]
  78. Libonati, R.; DaCamara, C.C.; Setzer, A.W.; Morelli, F.; Melchiori, A.E. An Algorithm for Burned Area Detection in the Brazilian Cerrado Using 4 µm MODIS Imagery. Remote Sens. 2015, 7, 15782–15803. [Google Scholar] [CrossRef] [Green Version]
  79. Silva, J., Jr.; Pacheco, A. Avaliação de incêndio em ambiente de Caatinga a partir de imagens Landsat-8, índice de vegetação realçado e análise por componentes principais. Cienc. Florestal. 2021, 31, 417–439. [Google Scholar] [CrossRef]
  80. Smith, A.M.; Wooster, M.J.; Drake, N.A.; Dipotso, F.M.; Falkowski, M.J.; Hudak, A.T. Testing the potential of multi-spectral remote sensing for retrospectively estimating fire severity in African Savannahs. Remote Sens. Environ. 2005, 97, 92–115. [Google Scholar] [CrossRef] [Green Version]
  81. Lu, B.; He, Y.; Tong, A. Evaluation of spectral indices for estimating burn severity in semiarid grasslands. Int. J. Wildland Fire 2016, 25, 147–157. [Google Scholar] [CrossRef]
  82. Veraverbeke, S.; Harris, S.; Hook, S. Evaluating spectral indices for burned area discrimination using MODIS/ASTER (MASTER) airborne simulator data. Remote Sens. Environ. 2011, 115, 2702–2709. [Google Scholar] [CrossRef]
  83. Harris, S.; Veraverbeke, S.; Hook, S. Evaluating Spectral Indices for Assessing Fire Severity in Chaparral Ecosystems (Southern California) Using MODIS/ASTER (MASTER) Airborne Simulator Data. Remote Sens. 2011, 3, 2403–2419. [Google Scholar] [CrossRef] [Green Version]
  84. Chuvieco, E.; Lizundia-Loiola, J.; Pettinari, M.L.; Ramo, R.; Padilla, M.; Tansey, K.; Mouillot, F.; Laurent, P.; Storm, T.; Heil, A.; et al. Generation and analysis of a new global burned area product based on MODIS 250 m reflectance bands and thermal anomalies. Earth Syst. Sci. Data 2018, 10, 2015–2031. [Google Scholar] [CrossRef] [Green Version]
  85. Häusler, M.; Nunes, J.P.; Soares, P.P.; Sánchez, J.M.; Silva, J.M.N.; Warneke, T.; Keizer, J.J.; Pereira, J.M.C. Assessment of the indirect impact of wildfire (severity) on actual evapotranspiration in eucalyptus forest based on the surface energy balance estimated from remote-sensing techniques. Int. J. Remote Sens. 2018, 39, 6499–6524. [Google Scholar] [CrossRef]
  86. Ran, M.; Wu, J.; Zhao, F.; Cook, B.D.; Hanavan, R.P.; Serbin, S.P. Measuring short-term post-fire forest recovery across a burn severity gradient in a mixed pine-oak forest using multi-sensor remote sensing techniques. Remote Sens. Environ. 2018, 210, 282–296. [Google Scholar] [CrossRef]
  87. Lasaponara, R. Estimating Spectral Separability of Satellite Derived Parameters for Burned Areas Mapping in the Calabria Region by Using SPOT-Vegetation Data. Ecol. Model. 2006, 196, 265–270. [Google Scholar] [CrossRef]
  88. Liu, J.; Freudenberger, D.; Lim, S. Mapping Burned Areas and Land-Uses in Kangaroo Island Using an Object-Based Image Classification Framework and Landsat 8 Imagery from Google Earth Engine. Geomat. Nat. Hazards Risk 2022, 13, 1867–1897. [Google Scholar] [CrossRef]
  89. Seydi, S.T.; Akhoondzadeh, M.; Amani, M.; Mahdavi, S. Wildfire Damage Assessment over Australia Using Sentinel-2 Imagery and MODIS Land Cover Product within the Google Earth Engine Cloud Platform. Remote Sens. 2021, 13, 220. [Google Scholar] [CrossRef]
  90. Chen, W.; Moriya, K.; Sakai, T.; Koyama, L.; Cao, C.X. Mapping a Burned Forest Area from Landsat TM Data by Multiple Methods. Geomat. Nat. Hazards Risk 2014, 7, 384–402. [Google Scholar] [CrossRef] [Green Version]
Figure 1. Location of study areas in Brazil and Portugal as well as pre- and post-fire images.
Forests 14 00663 g001
Figure 2. Flowchart of the burned area detection process.
Forests 14 00663 g002
Figure 3. Spatial distribution of true positive (TP) pixels (where true burned areas were detected) for the study case of Brazil. Classification method: unsupervised RXD Anomaly. (a) BAI. (b) MIRBI. (c) NBI. (d) NBR. (e) NBR2. (f) NBRT.
Forests 14 00663 g003
Figure 4. Spatial distribution of true positive (TP) pixels for the study area of Portugal. Classification method: unsupervised RXD Anomaly. (a) BAI. (b) MIRBI. (c) NBI. (d) NBR. (e) NBR2. (f) NBRT.
Forests 14 00663 g004
Figure 5. Burned area in relation to the reference maps of Brazil (a) and Portugal (b).
Forests 14 00663 g005
Table 1. Landsat-8 images over Brazil and Portugal used in this study.
CountryOrbit/PointImage DateTime Interval in Relation to the Fire (Days)
Brazil (Fire on 30 September 2019)216/6613 April 2019 (before)170 (before)
16 November 2019 (after)47 (after)
Portugal (Fire on 20 June 2019)203/337 April 2019 (before)74 (before)
1 August 2019 (after)42 (after)
Table 2. Analyzed Spectral indices.
IndexIdentificationFormulaReference
Burn Area IndexBAI 1 / [ ( 0.1 R ) 2 + ( 0.06 N I R ) 2 + 7 ] Chuvieco et al. [43]
Normalized Burn RatioNBR ( N I R S W I R 2 ) / ( N I R + S W I R 2 ) Key and Benson [44]
Mid-Infrared Burn IndexMIRBI ( 10 · S W I R 2 ) ( 9.8 · S W I R 1 ) + 2 Trigg and Flasse [45]
Normalized Burn Ratio 2NBR2 ( S W I R 1 S W I R 2 ) / ( S W I R 1 + S W I R 2 ) Key and Benson [44]
Normalized Burned IndexNBI ( S W I R 2 B L U E ) / ( S W I R + B L U E ) Alleaume et al. [46]
Normalized Burn Ratio ThermalNBRT ( N I R S W I R 2 · T I R ) / ( N I R + S W I R 2 · T I R ) Holden et al. [33]
Table 3. Confusion matrix.
Reference Map (True Class)
BurnedUnburnedTotal
Classified Product (BA)Burnedaba + b
Unburnedcdc + d
Totala + cb + da + b + c + d
Table 4. Separability M index calculated for each spectral index.
Spectral IndexBrazilPortugal
BAI0.972
NBR1.621.6
MIRBI22
NBR21.51.71
NBI1.71.78
NBRT1.831.74
Table 5. Burned area (S) according to each spectral index. The reference areas for the fires in Brazil and Portugal are 8.88 and 93.45 km2, respectively.
Spectral IndexBrazil
S [km2]
Portugal
S [km2]
Brazil
∆S [km2]
Portugal
∆S [km2]
BAI5.8884.80−3−8.75
NBR5.2773.80−3.61−19.75
MIRBI8.7982.30−0.09−11.25
NBR28.1580.21−0.73−13.34
NBI5.8759.05−3.01−34.5
NBRT6.7181.70−2.17−11.85
Table 6. Metrics for evaluating the detected burned area by the spectral indices with respect to reference data for Brazil and Portugal.
Spectral IndexBrazilPortugal
OE (%)CE (%)DCOE (%)CE (%)DC
BAI56100.593100.98
NBR35120.796370.97
MIRBI740.982140.99
NBR2420.10.746320.97
NBI2640.854140.98
NBRT1130.944170.98
Disclaimer/Publisher’s Note: The statements, opinions and data contained in all publications are solely those of the individual author(s) and contributor(s) and not of MDPI and/or the editor(s). MDPI and/or the editor(s) disclaim responsibility for any injury to people or property resulting from any ideas, methods, instructions or products referred to in the content.

