Article

Estimation of Biomass and Carbon Sequestration Potential of Dalbergia latifolia Roxb. and Melia composita Willd. Plantations in the Tarai Region (India)

1
Department of Botany, D.S.B. Campus, Kumaun University, Nainital 263002, Uttarakhand, India
2
Department of Forestry and Environmental Science, D.S.B. Campus, Kumaun University, Nainital 263002, Uttarakhand, India
3
Conservation Ecology Lab, Department of Botany, Baba Ghulam Shah Badshah University, Rajouri 185234, Jammu and Kashmir, India
4
Plant Physiology and Biochemistry Laboratory, Department of Botany, School of Biosciences and Biotechnology, Baba Ghulam Shah Badshah University, Rajouri 185234, Jammu and Kashmir, India
5
Centre for Biodiversity Studies, Baba Ghulam Shah Badshah University, Rajouri 185234, Jammu and Kashmir, India
6
Department of Biology, College of Science, King Khalid University, Abha 61413, Saudi Arabia
7
Department of Clinical Pharmacy, King Khalid University, Abha 61413, Saudi Arabia
*
Author to whom correspondence should be addressed.
Forests 2023, 14(3), 646; https://doi.org/10.3390/f14030646
Submission received: 14 December 2022 / Revised: 24 February 2023 / Accepted: 19 March 2023 / Published: 21 March 2023
(This article belongs to the Special Issue Biomass Estimation and Carbon Stocks in Forest Ecosystems—Volume II)

Abstract

:
This study was carried out in the Tarai region of Uttarakhand, India to estimate the carbon stock and sequestration potential of Dalbergia latifolia and Melia composita plantations of different ages (4 and 6 years old). A total of 14 regression equations using one variable, dbh (diameter at breast height), were primarily selected for both of the tree species component-wise. Tree density was 880 and 960 individuals ha−1 in D. latifolia and M. composita monoplantations, respectively. These equations were statistically significant (p < 0.01, p < 0.05) at 95% confidence interval. The total biomass of trees, shrubs, and herbs at the different-aged plantations varied from 68.86 to 145.14 Mg ha−1, 1.29 to 2.41 Mg ha−1, and 1.14 to 3.68 Mg ha−1, respectively. Among the studied plantations, the maximum total biomass of 145.14 Mg ha−1 was recorded at the M. composita plantation (7 years old), resulting in the maximum carbon stock of 68.94 Mg C ha−1. Total NPP ranged from 5.6 Mg ha−1yr−1 to 16.01 Mg ha−1yr−1 for both plantations of different ages. The carbon sequestration in the M. composita 7-year-old plantation was 7.6 Mg Cha−1yr−1. Quantified carbon sequestration among different tree components must be considered for tree-level inventories for carbon trading schemes when determining the long-term carbon pools under the Paris agreement.

1. Introduction

Global climate change poses a threat to the welfare of human beings and other living organisms by affecting biodiversity, productivity, and health [1]. Carbon dioxide (CO2) is one of the most important contributors to global climate change, as per the world’s scientific community. The earth’s climate is affected by 20% of CO2 emissions, which will continue to affect us for thousands of years from now [2]. The Intergovernmental Panel on Climate Change (IPCC) projects that CO2 from industry, including direct and indirect emissions and process emissions, will increase from 13 GtCO2/yr in 2010 to 20–24 GtCO2/yr in 2050 [3]. One of the most complex and expensive tasks is removing this carbon from the atmosphere. However, controlling the present level of atmospheric CO2 through REDD+ activities is the most viable and feasible strategy recommended by scientists and policy makers [4,5], and tree plantations (trees outside the forest) can efficiently meet the objectives of this strategy [6]. Tree plantations are being raised throughout the globe at an increasing rate, accounting for 5% of global forest cover, and may provide up to 35% of worldwide round wood [7]. Despite increasing demand, India has maintained about 64 million hectares of forest cover over the past decade [8]. The significance of the conservation of plantations in lowering logging pressure on wild forests, sequestering carbon, and rehabilitating damaged lands is also becoming more widely recognized. Products produced from plantations can contribute to forest conservation by reducing the pressure on natural forest deforestation. Thus, the promotion of sustainable forest management can maintain high carbon stock mitigation and adaptation. The great majority of plantations globally are monocultures, with only a few tree species in frequent use [9]. In India and other tropical countries, tree plantations are frequently established from a very limited number of ‘classic’, highly productive plantation species [10,11,12,13]. However, a tree plantation on barren land and grassland and cropland results in a considerable amount of above- and below-ground biomass, carbon sequestration [14], and a carbon budget [15]. However, there are significant differences in the carbon sequestration rate and storage potential of different plantations [16]. In India, tree plantations increased by about 15,400 km2 per year between 1995 and 2005 and have the second-largest growing area in the world [17].
Dalbergia latifolia (Fabaceae) is an economically crucial timber-producing tree as it provides high-quality wood. It occupies evergreen or deciduous forests with deep, well-drained, and moist soils [18] at altitudes up to 600 m above sea level in Java (Indonesia) and higher in India. Apart from its uses in furniture, plywood, veneer, and carved wood products, it is globally known for its use in the guitar industry [19].
Melia composita Willd., synonyms: M. dubia Cav. (Meliaceae), is an extensively used plantation species due to its straight boles, fast growing capacity [20], self-pruning, and adaptability to various edaphic and climatic conditions [21]. It natively occurs in the humid tropical forests of peninsular and northeastern India, as well as in Sri Lanka, Malaysia, Indonesia, the Philippines, Australia, and Ghana [22]. It is a highly demanding deciduous tree species owing to the suitability of its wood for the paper, plywood, and engineered wood industries [23,24]. Very few studies on biomass and the growth of M. composita have been carried out so far [25]. M. composita and D. latifolia were recently introduced in the Tarai region of Uttarakhand, India.
Tree biomass estimation is essential and can be measured via two approaches, direct or indirect [26]. Biomass is a critical parameter that provides an accurate picture of forests and plantations in terms of organic matter accumulation and production. Regression equations are a non-destructive way of estimating biomass. Tree allometry is a quantitative correlation between easy-to-measure tree characteristics and more-difficult-to-measure tree parameters. The regression equation is a basic measuring technique for estimating stem volume or the amount of tree carbon sequestered and stored in woody vegetation in order to support the implementation of policies and mechanisms designed to mitigate climate change, to calculate the costs and benefits associated with forest carbon projects, and to improve bioenergy systems and sustainable forest management [27]. Regression equations for some plantation species in the Tarai region have already been prepared by Bargali et al. [28] for Eucalyptus hybrid, Lodhiyal et al. [29] for Poplar plantation, Jha [30] for Tectona grandis, and Lodhiyal et al. [31] for Dalbergia sisso. The present study was focused on developing generalized regression equations based on one variable (dbh) for assessing the biomass and carbon sequestration potential of two economically promising tree species, viz., M. composita and D. latifolia. However, regression equations for these two species are lacking.
Against this backdrop, the present study was carried out in the Tarai region of Uttarakhand, India with the following objectives: (1) to develop regression equations for M. composita and D. latifolia in the Tarai region and (2) to estimate the carbon stock and sequestration potential of these plantations. It was hypothesized that these plantation species will have a higher carbon sequestration potential than the other indigenous and exotic species being promoted in the area.

2. Materials and Methods
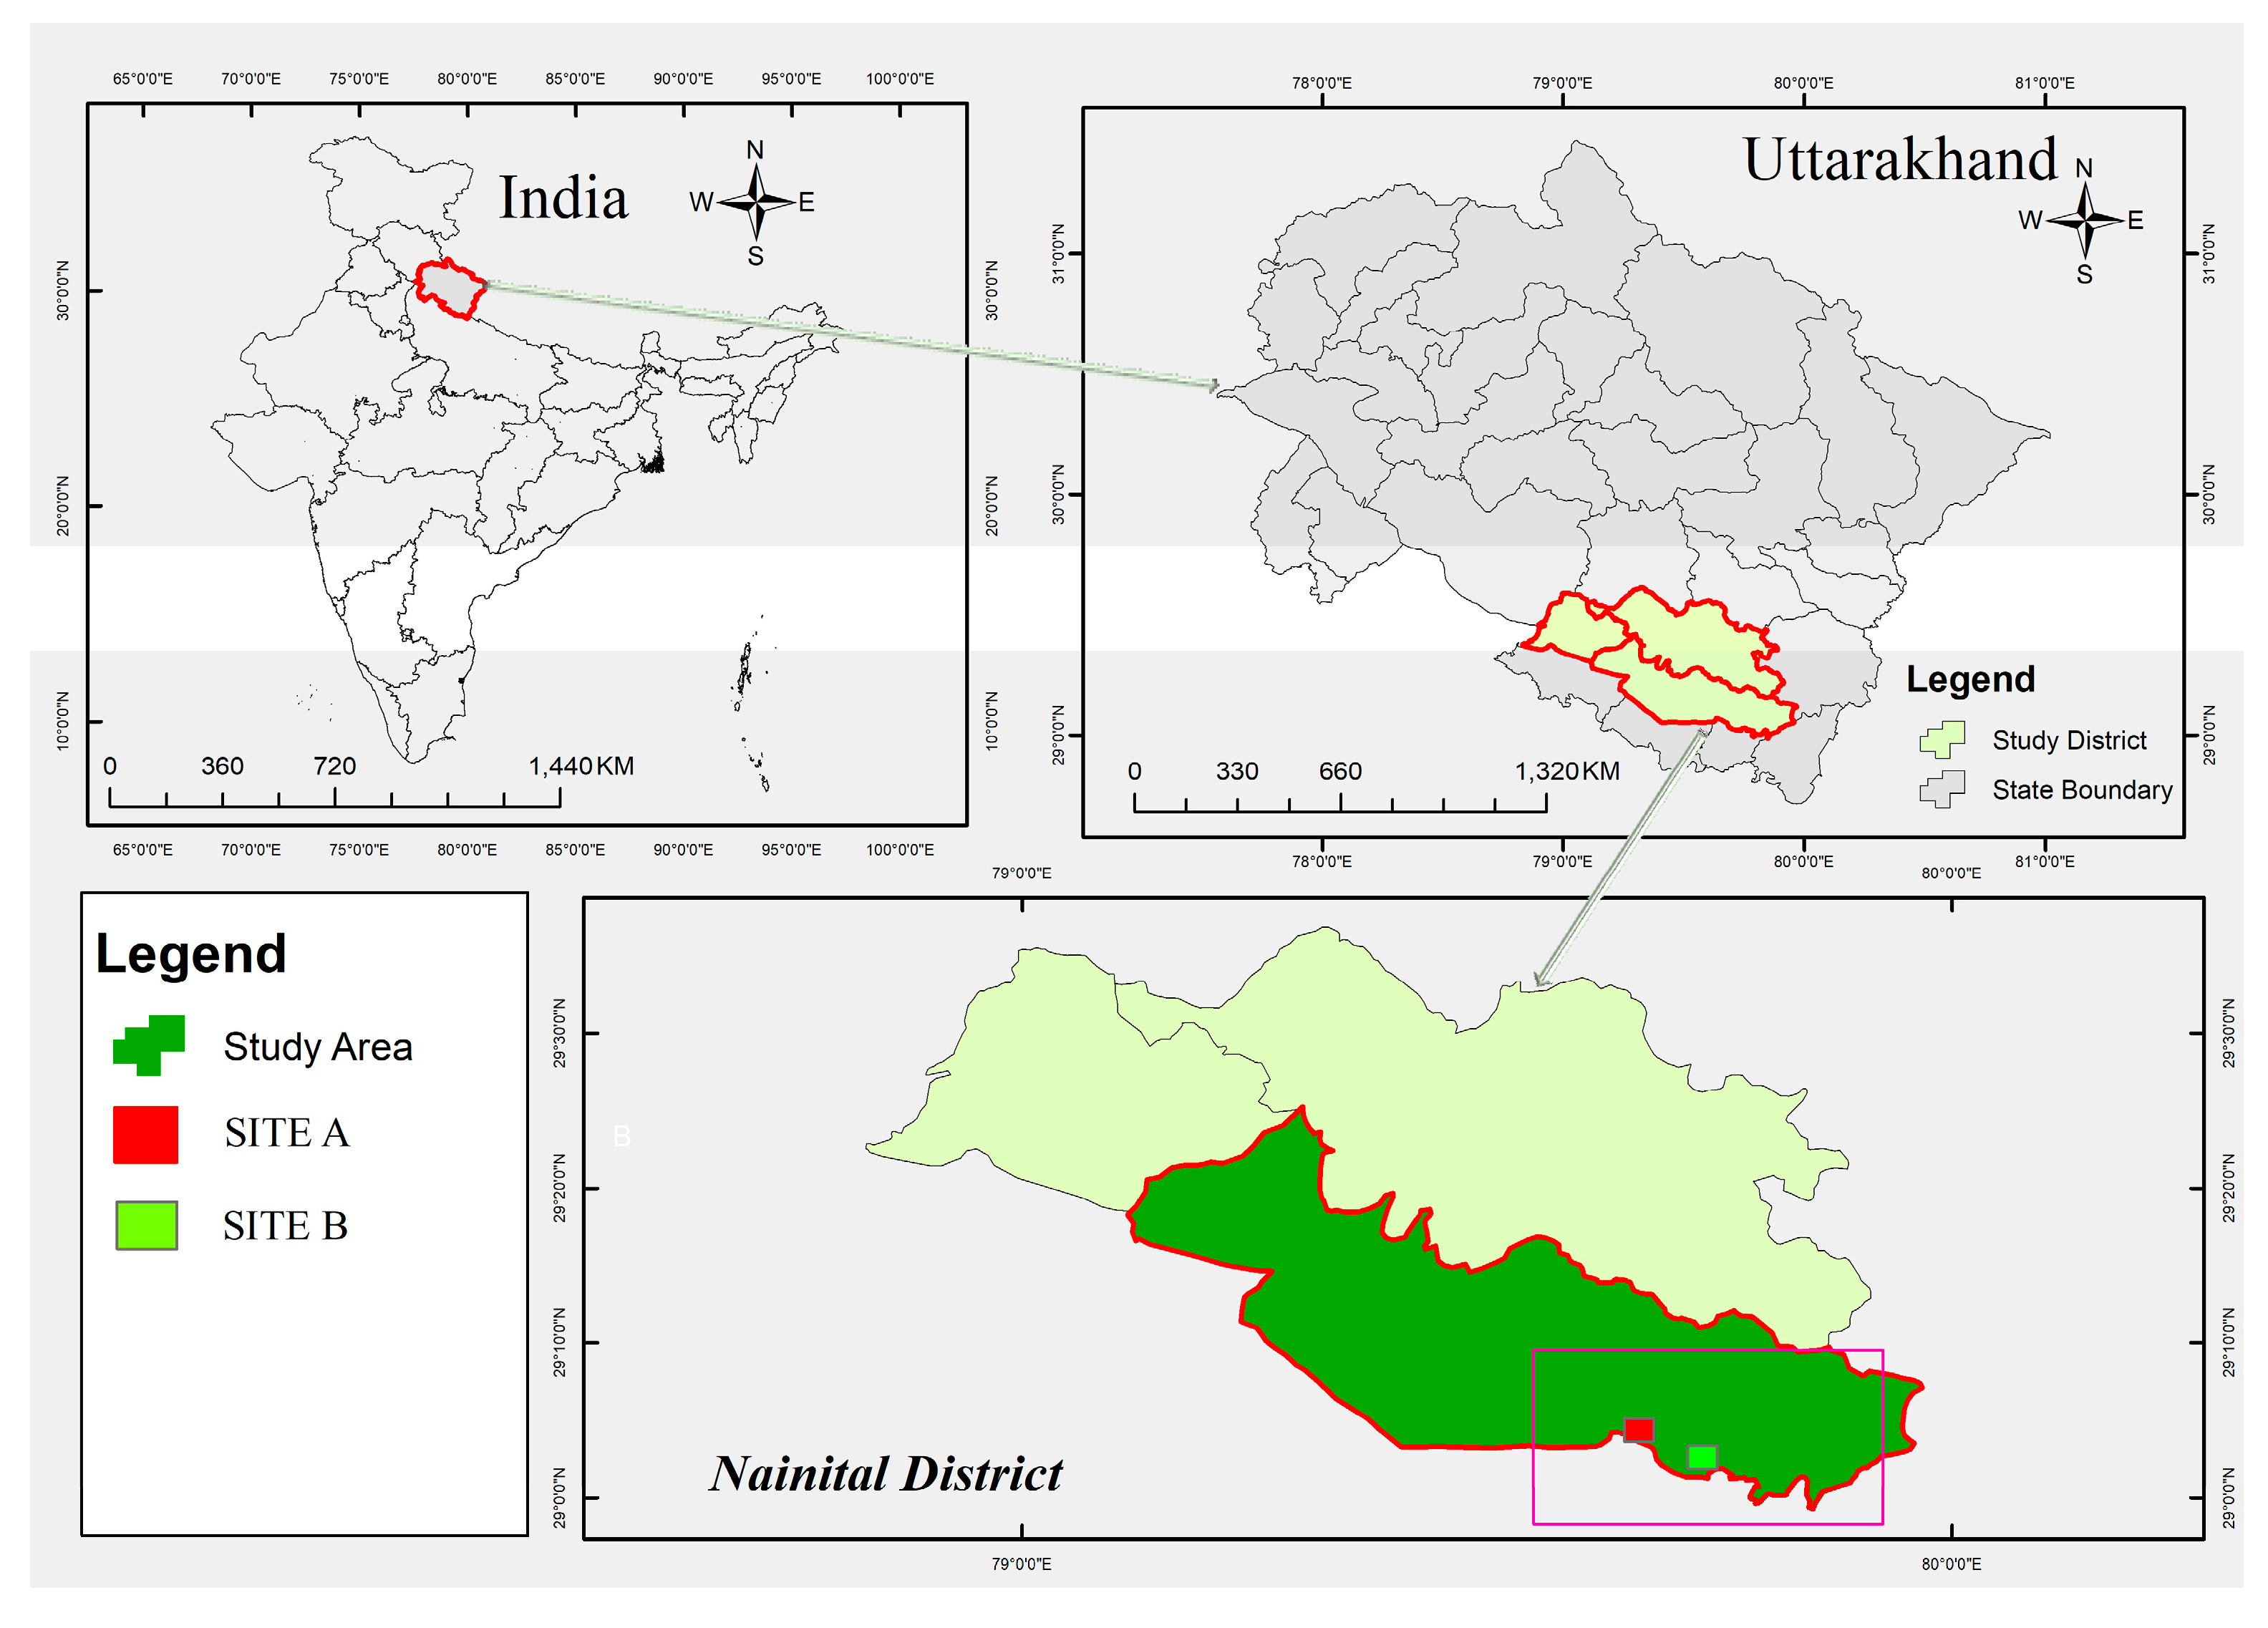
2.1. Study Area

The study area is situated at the outer Shiwalik range in the Central Himalayas, India at the confluence of the Indo-Gangetic plains and includes diverse forest types such as dense, moist, semi-evergreen, and evergreen forests. The study was carried out over four years between 2016 and 2019. Four-year-old monoculture plantations of M. composita and D. latifolia were selected in 2016 with the help of the Uttarakhand State Forest Department and visited again in the consecutive years of 2017, 2018, and 2019. The plantations at the selected sites for each tree species were planted in 2012 by Uttarakhand State Forest Department. The study area lies between N29°08′59.33″ latitude and E079° 22′24.56″ longitude and is situated at about 244 m above mean sea level in the Tarai region. The map of the study area shows the distribution of sampling sites (Figure 1). The metrological data (temperature and rainfall) for the study area were procured from the Department of Agrometeorology, GBPUAT, Pantnagar. The climate of this region is monsoonal and subtropical. Total precipitation was 1250.3–1746.3 mm, and the maximum temperature was recorded at 16.7–37.7 °C during the study. The soil composition of the study area is sandy soil. The Tarai region comprises underground streams and is composed of comparatively finer alluvium. The land of this region gets marshy, so it is suitable for agriculture and covered by forests. The study area has typical subtropical forest vegetation, with a few dominant tree and shrub species such as Dalbergia sissoo, Eucalyptus hybrid, Albizia procera, Bombax ceiba, Albizia lebbeck, Toona ciliata, Terminalia alata, Terminalia chebula, Butea monosperma, Trewia nudiflora, Haldina cordifolia, Ficus religiosa, Ficus racemosa, Mallotus philippensis, Holoptelea integrifolia, Colebrookia oppositifolia, Murraya koenigii, Lantana camara, Zizyphus jujuba, Crotalaria juncea, Themeda arundinacea, Chrysopogon fulvus, and Pogostemon benghalensis.

2.2. Methods

2.2.1. Physicochemical Analysis of Soil

The soil samples were collected from two depths up to 30 cm, i.e., 0–15 cm and 15–30 cm, with three replicates in each plantation area. Soil samples were packed in labeled plastic zipper bags and transported to the laboratory for further analysis. The collected soil samples were dried in an oven at 45 °C for 24 h, and we passed oven-dried soil through different sieves to obtain soil texture [32]. The pH of the soil was measured using a digital pH meter. We determined water holding capacity and bulk density according to the method proposed by Misra [33]. The rapid titration method of Walkley and Black was adopted to estimate the organic carbon content (%) [34]. Soil phosphorus was determined by the extraction method [35]. The potassium was measured with a flame photometer (extracted by the neutral standard ammonium acetate method) [36], and the nitrogen was estimated by the Kjeldahl digestion method [37].

2.2.2. Phytosociological Analysis

Phytosociological analysis of the vegetation in each plantation site was carried out following Curtis and McIntosh [38] by randomly placing ten quadrats of 10 m × 10 m for trees, 5 m × 5 m for shrubs, and 1 m × 1 m for herbs. In all the sampled forest stands, tree diameter was measured using a tree caliper at 1.37 m height. Furthermore, we analyzed the data following Curtis and McIntosh [38].

2.2.3. Development of Regression Equations

Regression equations were developed for the tree components (bole, branch, twigs, and leaf (above ground) and stump root, lateral roots, and fine roots (below ground)) species-wise for 4- and 6-year-old plantations. For this, different diameter classes of <10 cm, 10–20 cm, 20–30 cm, 30–40 cm, and 40–50 cm were designed for two selected tree species at different ages (4- and 6-year-old stands). We selected and marked ten individuals from each diameter class for each species aged 4 and 6 years old. The destructive or harvest technique was adopted to estimate the component biomass of both of the selected tree species [31,39]. A total of 25 trees were harvested, with 5 individuals from each diameter class. The total height was measured directly after the tree individuals were felled on the ground as it was more convenient and less erroneous than the standing condition. The tree roots were harvested to a depth of 1 m throughout the soil. Fine roots were sorted in the laboratory after soil samples were collected [40] from the monolith. The DBH was determined using a tree caliper, while the total height was determined using a linear tape. Furthermore, the harvested trees were separated into different components, viz., bole, branches, twigs, and foliage for the above-ground and stump root, lateral roots, and fine roots for the below-ground parts. The fresh weights of all components for each species were recorded in the field using a heavy weighing machine, and the five cross-sectional samples from each tree component were taken and transferred to the laboratory and dried in the oven at 60°C until they obtained the constant weight to determine oven-dry weights. We tried to prepare the equations using X 2 H   (H is the height of the tree, and X is the diameter at the breast height); however, this did not improve the significance level of the equation. Hence, height was avoided. Furthermore, the data were subjected to the regression model as Y = a + bX, where Y is the dry weight of the component (kg), X is the DBH (diameter at the breast height) above ground (cm, per tree), a is the intercept, and b is the slope coefficient. Regression coefficient r2 was used as the indicator of goodness of fit.

2.2.4. Tree Biomass Accumulation

The developed regression equations were then applied to the mean DBH of each tree stand in different selected aged plantations (4, 5, 6, and 7 years old) to calculate the biomass of each tree component. In the first year, DBH was measured, and total tree biomass was quantified by multiplying the resulting mean biomass (B1) by the tree density for each diameter class which were then summed for each species [41]. DBH was measured again in the second year and then applied to the regression model to calculate the change in biomass accumulation (for each component) (B2). The net change in biomass (∆B = B2−B1) was the annual biomass accumulation [42].

2.2.5. Understory Vegetation Biomass

Shrub and herb biomass were analyzed through harvesting by placing five 5 m × 5 m and 1 m × 1 m quadrats per plantation. Understory vegetation was harvested at the peak time and then separated into the shoot, foliage, and root for shrubs and above- and below-ground parts for herbs. Further, they were oven-dried at 60 °C in the laboratory and weighed after 72 h [33].
The sum of the biomass of trees, shrubs, herbs, and litter yielded the total biomass for the site.

2.2.6. Forest Floor Biomass and Litter Inputs

Forest floor biomass was collected by placing ten1 m×1 m quadrats with five replicates in each stand. The biomass (live and dead) was collected free from contamination and brought to the laboratory, then oven-dried at 60 °C to the constant weight [33]. For quantifying leaf litter production, we then fixed the litter traps (each 50 × 50 × 15 cm in size) on the forest floor at each plantation site. The litter traps were fitted with fine mesh nylon sheets to provide free drainage of water during rainfall. Litter from each trap was collected in polythene bags at a one-month interval and separated into (a) leaf, (b) miscellaneous, and (c) wood litter. The collections were oven-dried at 60 °C to constant weight and weighed [31].

2.2.7. Carbon Accumulation and Sequestration

Carbon stock reserves are 47% of the dry weight in each component [43]. The carbon stock values were calculated by multiplying biomass by the default carbon factor for different tree components in the first year (C1) and second year (C2) and were used to estimate the carbon sequestration rate for each tree species. The net change in carbon stock (∆C = C2 − C1) was obtained as the carbon sequestration rate [44].

2.2.8. Statistical Analysis

All the collected data were compiled and processed for statistical treatment using statistical software. The replicates were analyzed for the mean and standard error by ANOVA using SPSS version 23 software to check the significance level.

3. Results

3.1. Stand Structure and Physicochemical Characteristics of Soil

The forest growth parameters tree density, herb density, and shrub density in both plantation forests are given in Table 1. The stand density of M. composita was 960 trees ha−1 and of D. latifolia was 880 trees ha−1. The soil bulk density (gm cm−3) was the maximum in the M. composita stand (1.40) at 15–30 cm depth, while porosity was found to be highest in the D. latifolia stand, viz., 49.53% at 0–15 cm depth (Figure 2). The M. composita plantation had the maximum moisture content percentage, viz., 13.65% at 16–30 cm depth, and the D. latifolia plantation had the minimum percentage, viz., 9.42% at 0–15 cm depth. In contrast, the pH value was recorded as the maximum for D. latifolia at 15–30 cm depth. The mean OC was 1.26%, which was the maximum in M. composita at a depth of 0–15 cm. Furthermore, the available nutrients N and K at 313.6 kg ha−1 and 159.66 kg ha−1, respectively, were the highest for the D. latifolia stand at 0–15 cm depth, while phosphorus was the maximum in M. composita (18.54 kg ha−1) at 0–15 cm depth (Figure 2). Analysis of variance indicated a significant difference between the samples collected in different plantations (p < 0.05).

3.2. Regression Equation Relationship

A total of 14 regression equations were primarily selected for both the tree species using one variable (DBH) based on the goodness-of-fit statistics. Regression coefficients (r2) of each regression equation were highly significant, which means that biomass can be well explained by the DBH of each component (Table 2). DBH was the independent variable. The r2 values of the biomass equations for 4-year-old M. composita bole, branch, twigs, leaves, stump root, lateral roots, and fine roots were 0.92, 0.99, 0.98, 0.93, 0.91, 0.98, and 0.87, respectively. In addition, a similar kind of correlation coefficient (r2) trend was found in the 6-year-old plantation. Based on the result analysis of r2 in4-year-old D. latifolia, the regression equations for bole, branch, twigs, leaves, stump root, lateral roots, and fine roots were 0.98, 0.93, 0.97, 0.94, 0.98, 0.98, and 0.83, respectively. We found similar r2 values except for leaves (0.84) (Table 2). All the developed regression equations were statistically significant at 95% confidence interval with p < 0.01.
The regression equations, variables, and parameters relating the biomass of the different tree components to DBH are presented in Table 2. As is evident from the p-values, the relationship between biomass and DBH was highly satisfactory. Biomass was not estimated using the X 2 H method (H is the height of the tree) because the resulting r2 values were not significantly improved by adding H compared with those obtained using DBH (X); therefore, the regression model Y = a + b X was used for estimating the stand biomass.

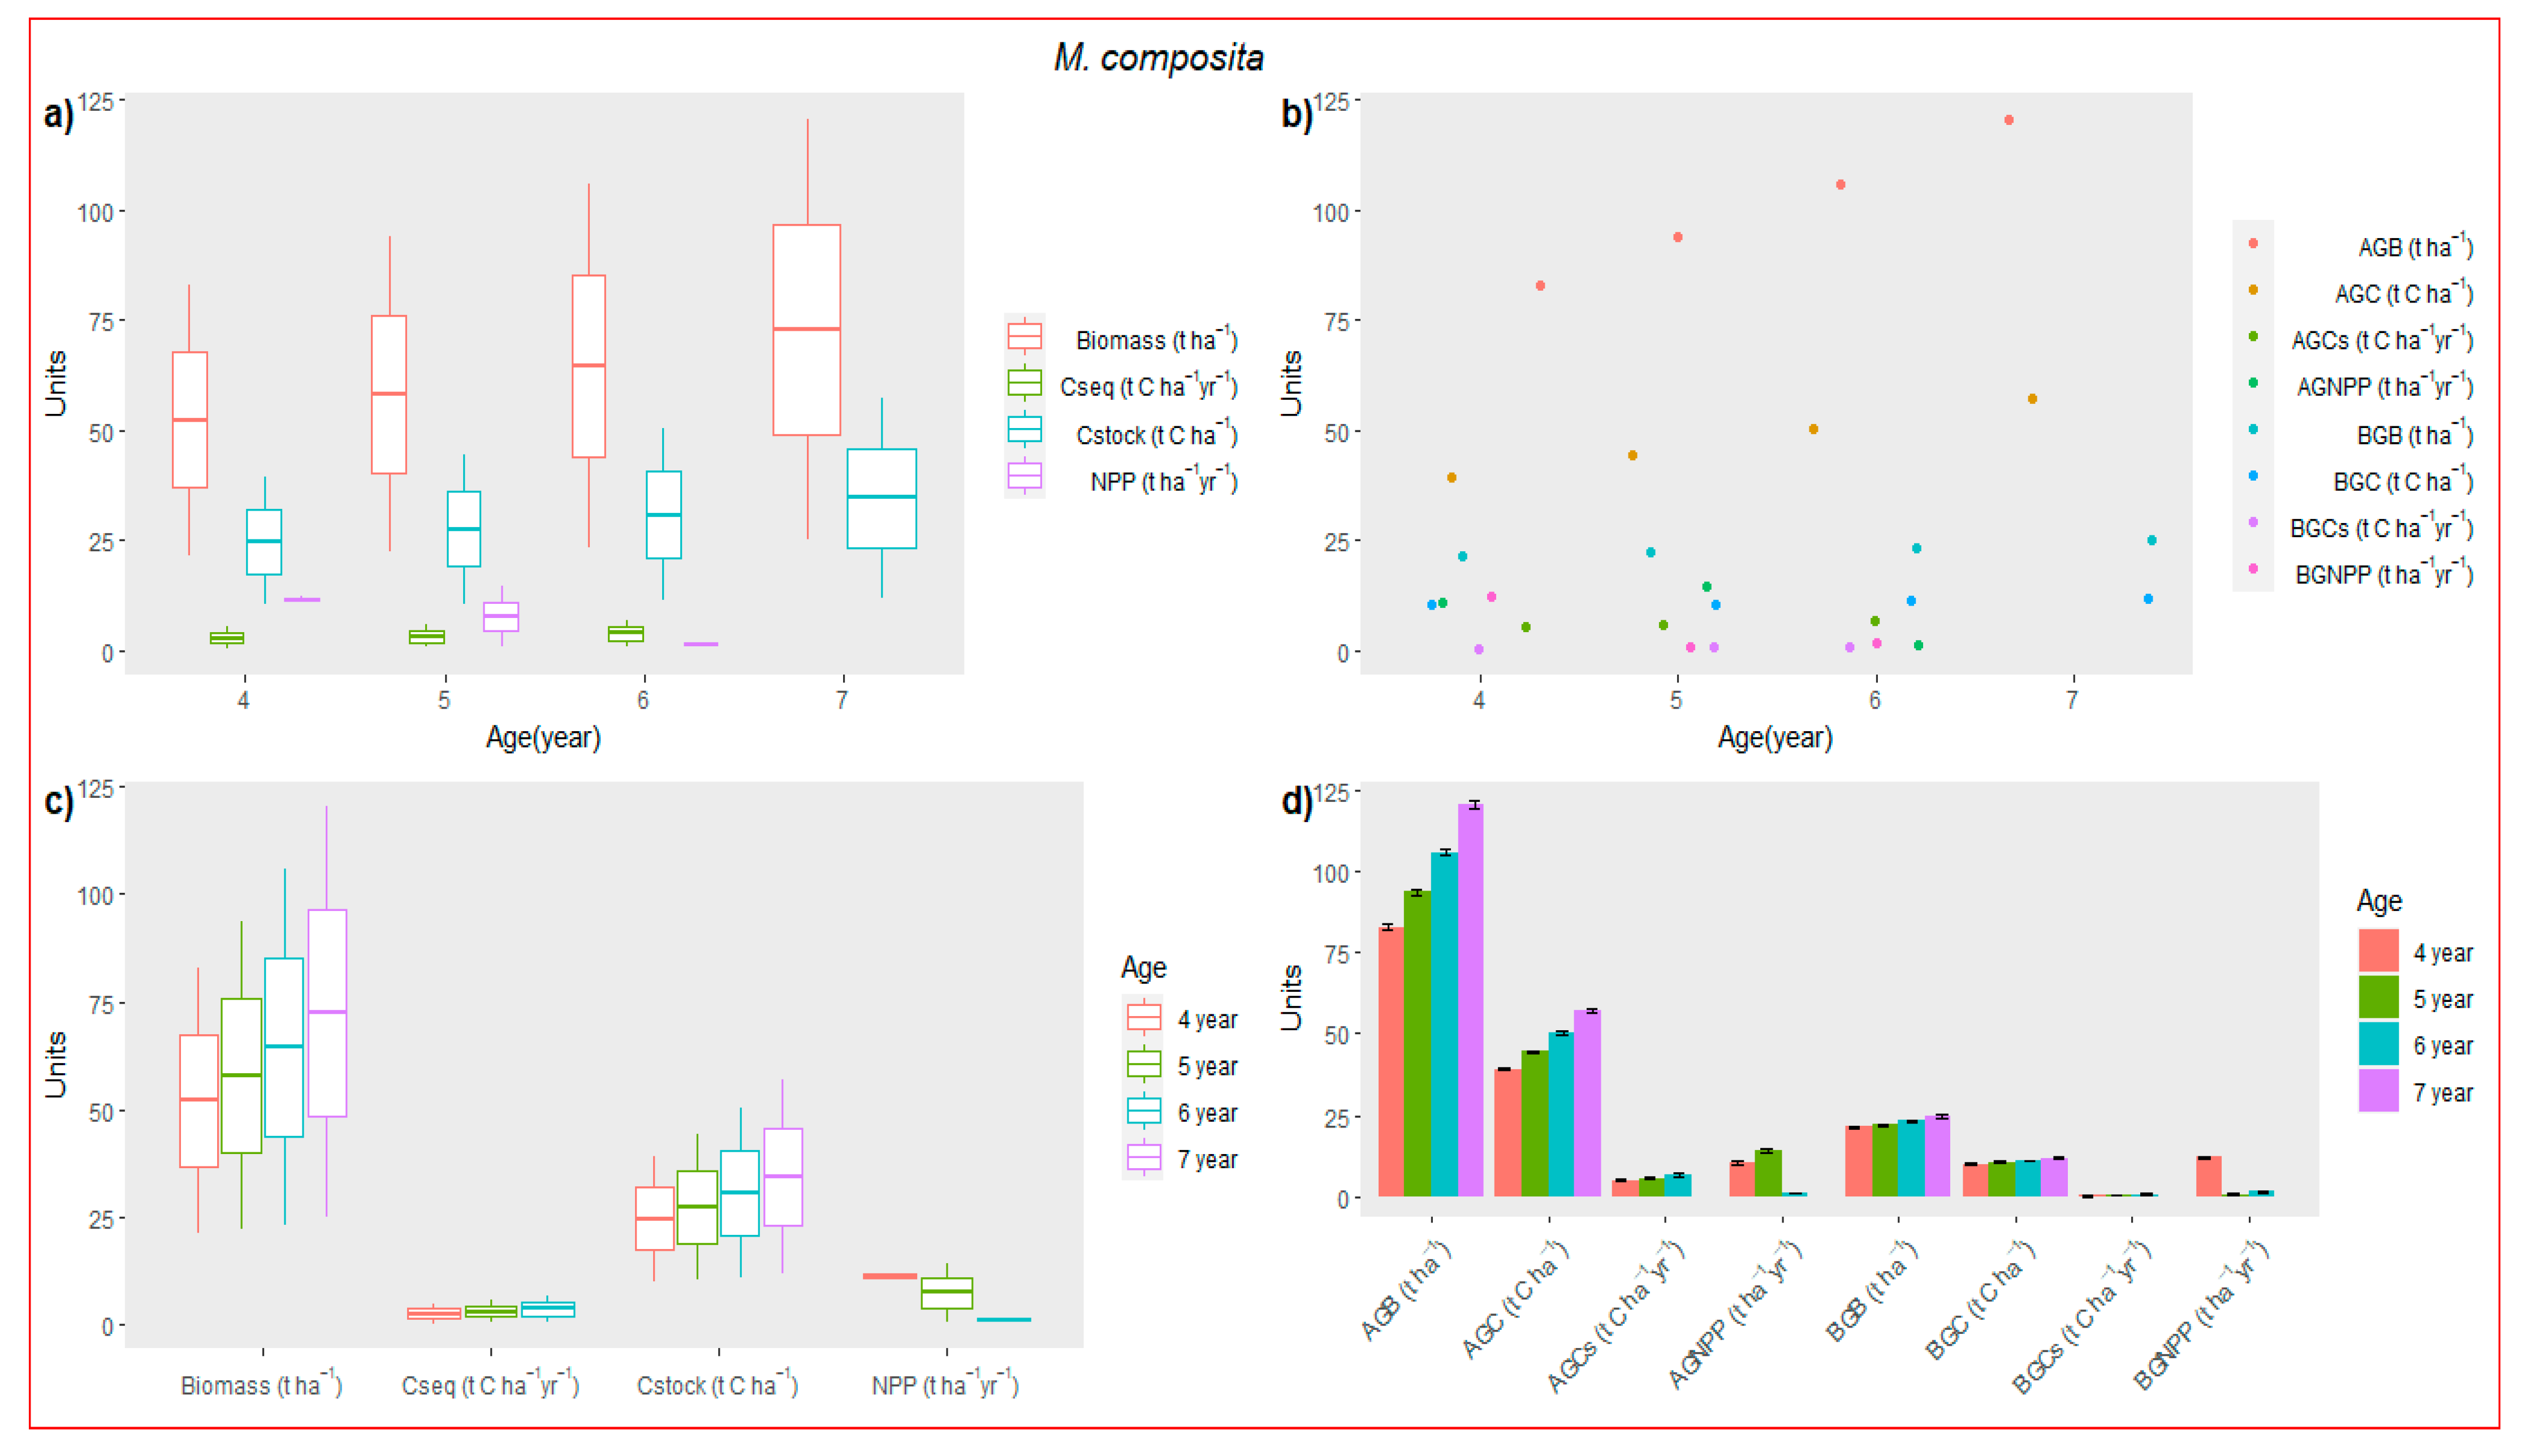
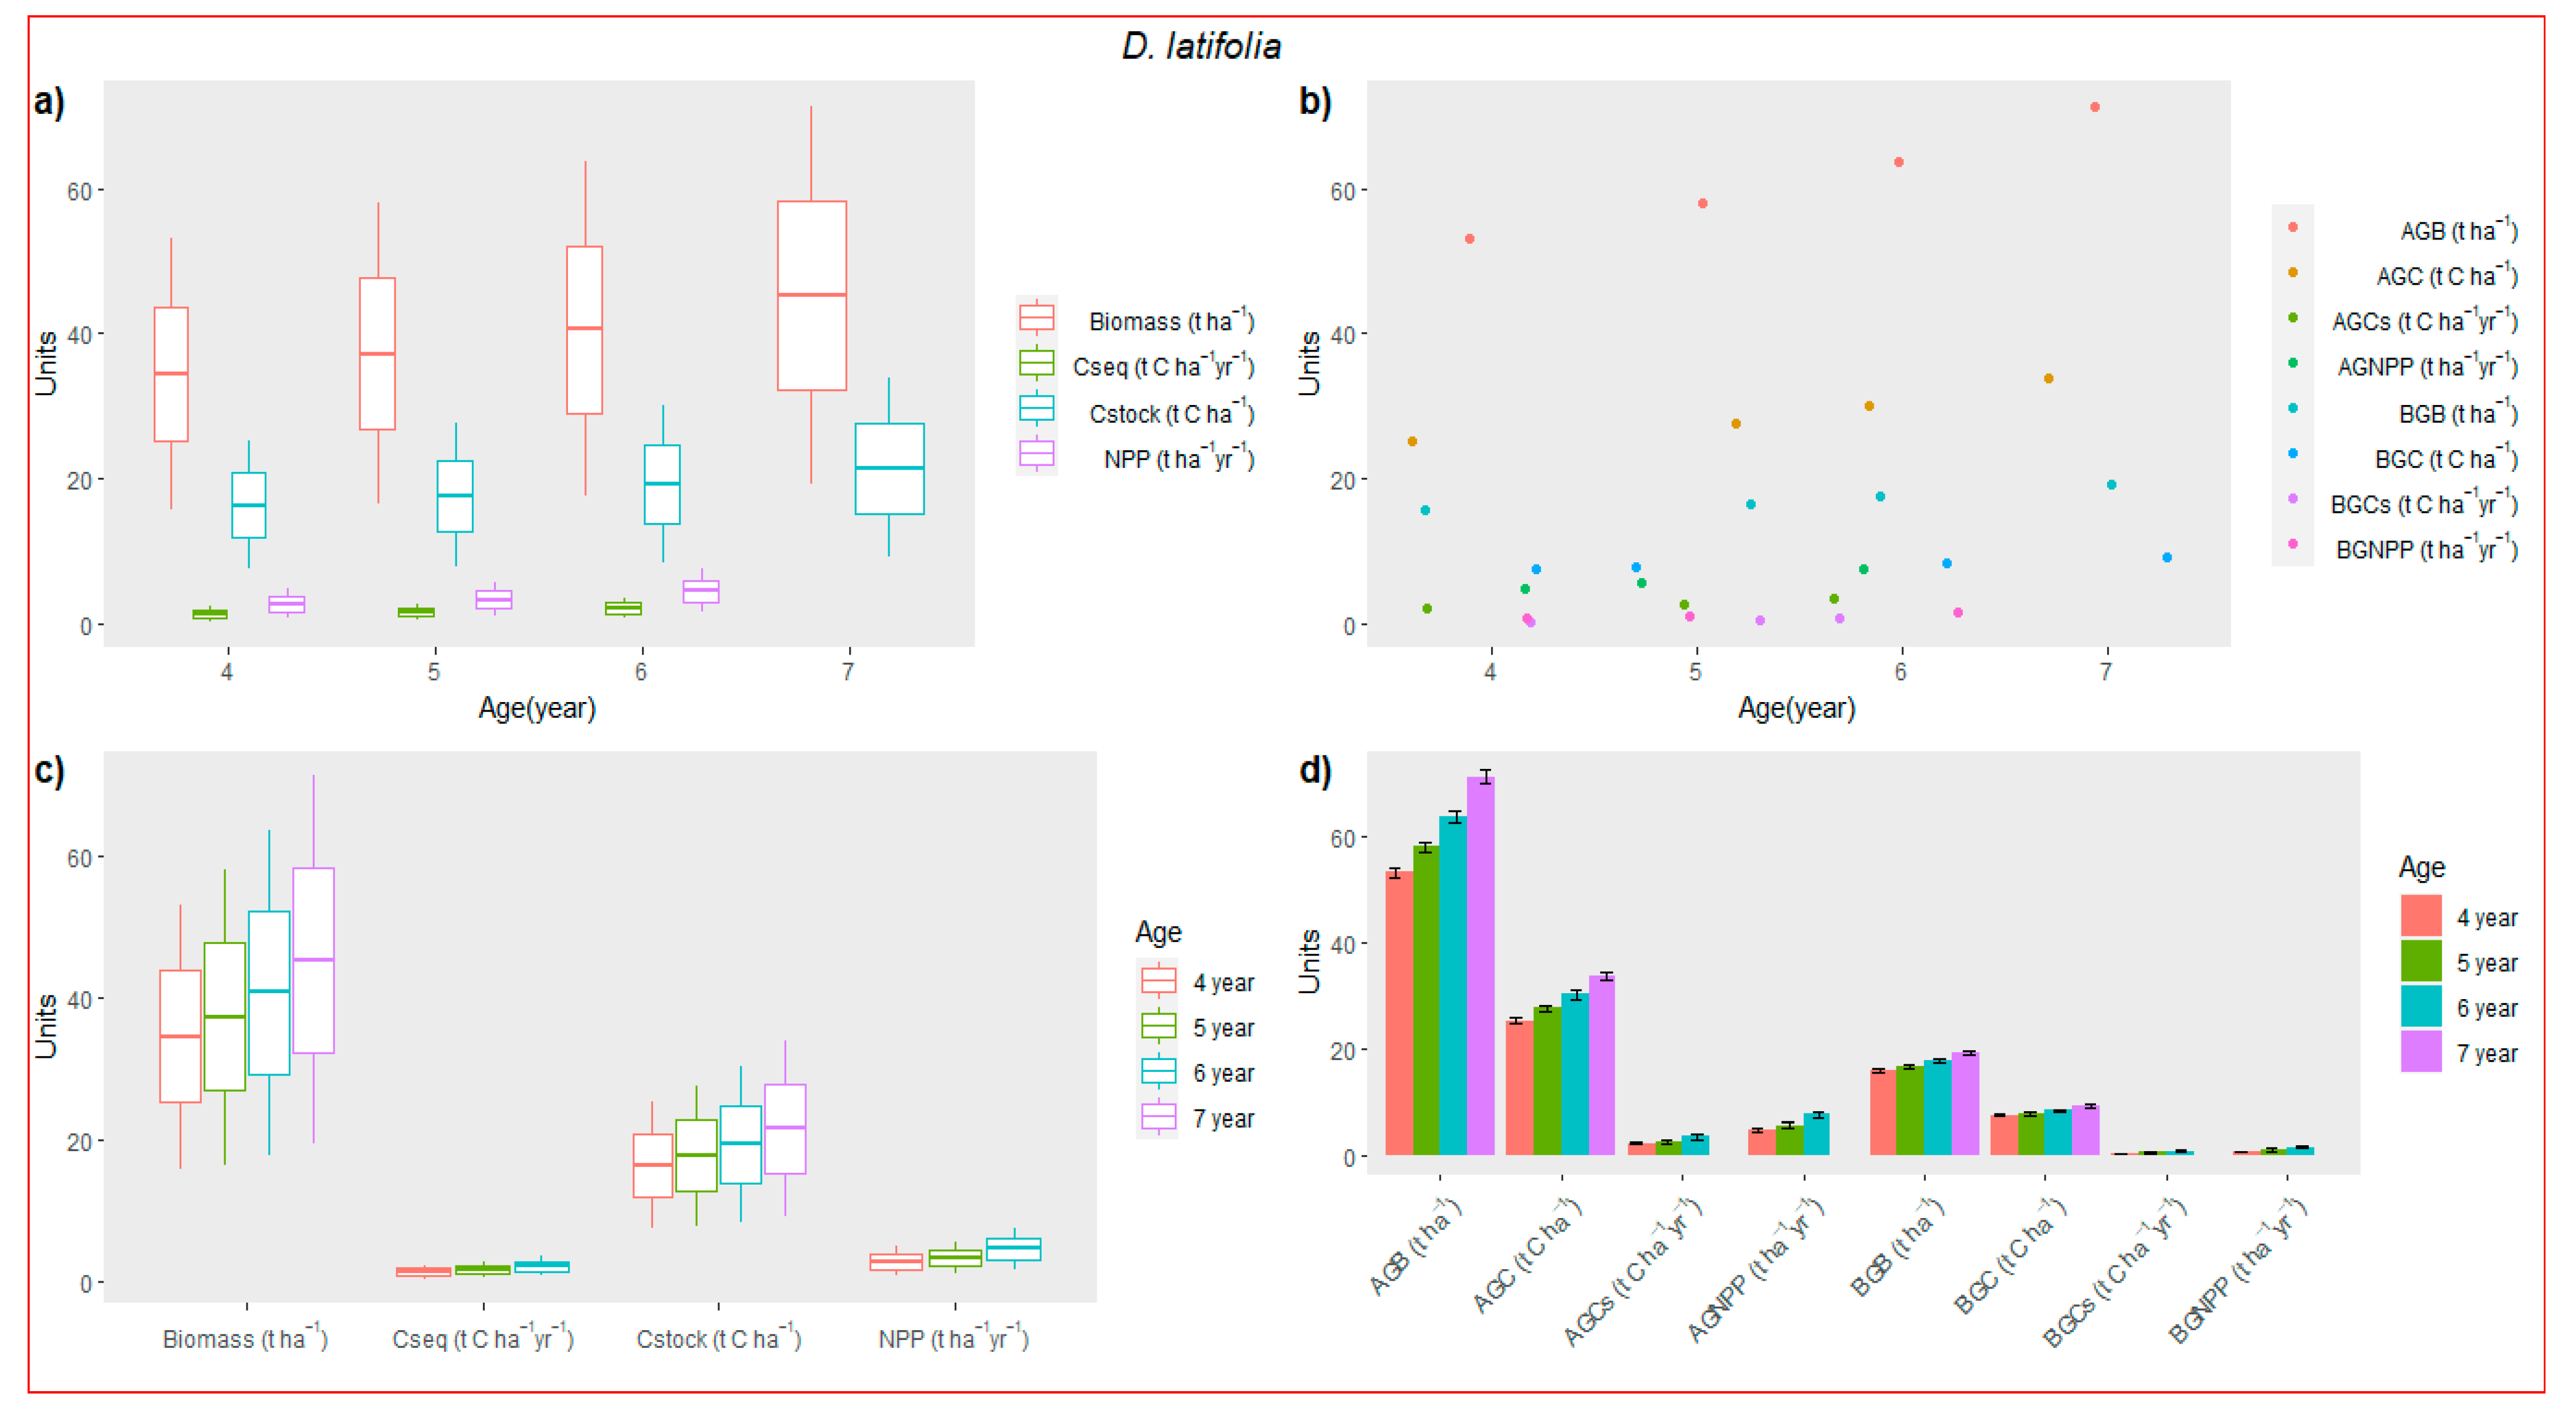
3.3. Biomass Accumulation

Among the studied plantations, the maximum total biomass (145.14 Mg ha−1) was recorded at the M. composita plantation (7 years old) (Table 3). Of this, the trees had 91.24 Mg ha−1, 16.01 Mg ha−1, 5.42 Mg ha−1, 7.53 Mg ha−1, 15.57 Mg ha−1, 7.91 Mg ha−1, and 1.47 Mg ha−1 mean biomass for bole, branches, twigs, foliage, stump root, lateral roots, and fine roots, respectively. The percent contribution of bole was relatively higher (56.3%–62.9%) than the other components across all species and ages. The maximum mean total tree biomass of D. latifolia was 90.43 Mg ha−1 for the 7-year-old stand. The mean total tree biomass of D. latifolia for the 4-year-old plantation was 68.86 Mg ha−1, 74.46 Mg ha−1 for the 5-year-old plantation, and 81.24 Mg ha−1 for the 6-year-old stand. The percent distribution of AGB ranged from 77.1 to 78.7% and BGB from 5.7% to 6.9% (Table 3). The maximum biomass of shrubs and herbs for D. latifolia was 2.08 and 3.68 Mg ha−1, respectively, in the 7-year-old plantation (Table 4). Similarly, the maximum shrub and herb biomass for M. composita was 2.41 Mg ha−1 in the 7-year-old and 2.46 Mg ha−1 in the 7-year-old plantation (Table 5).

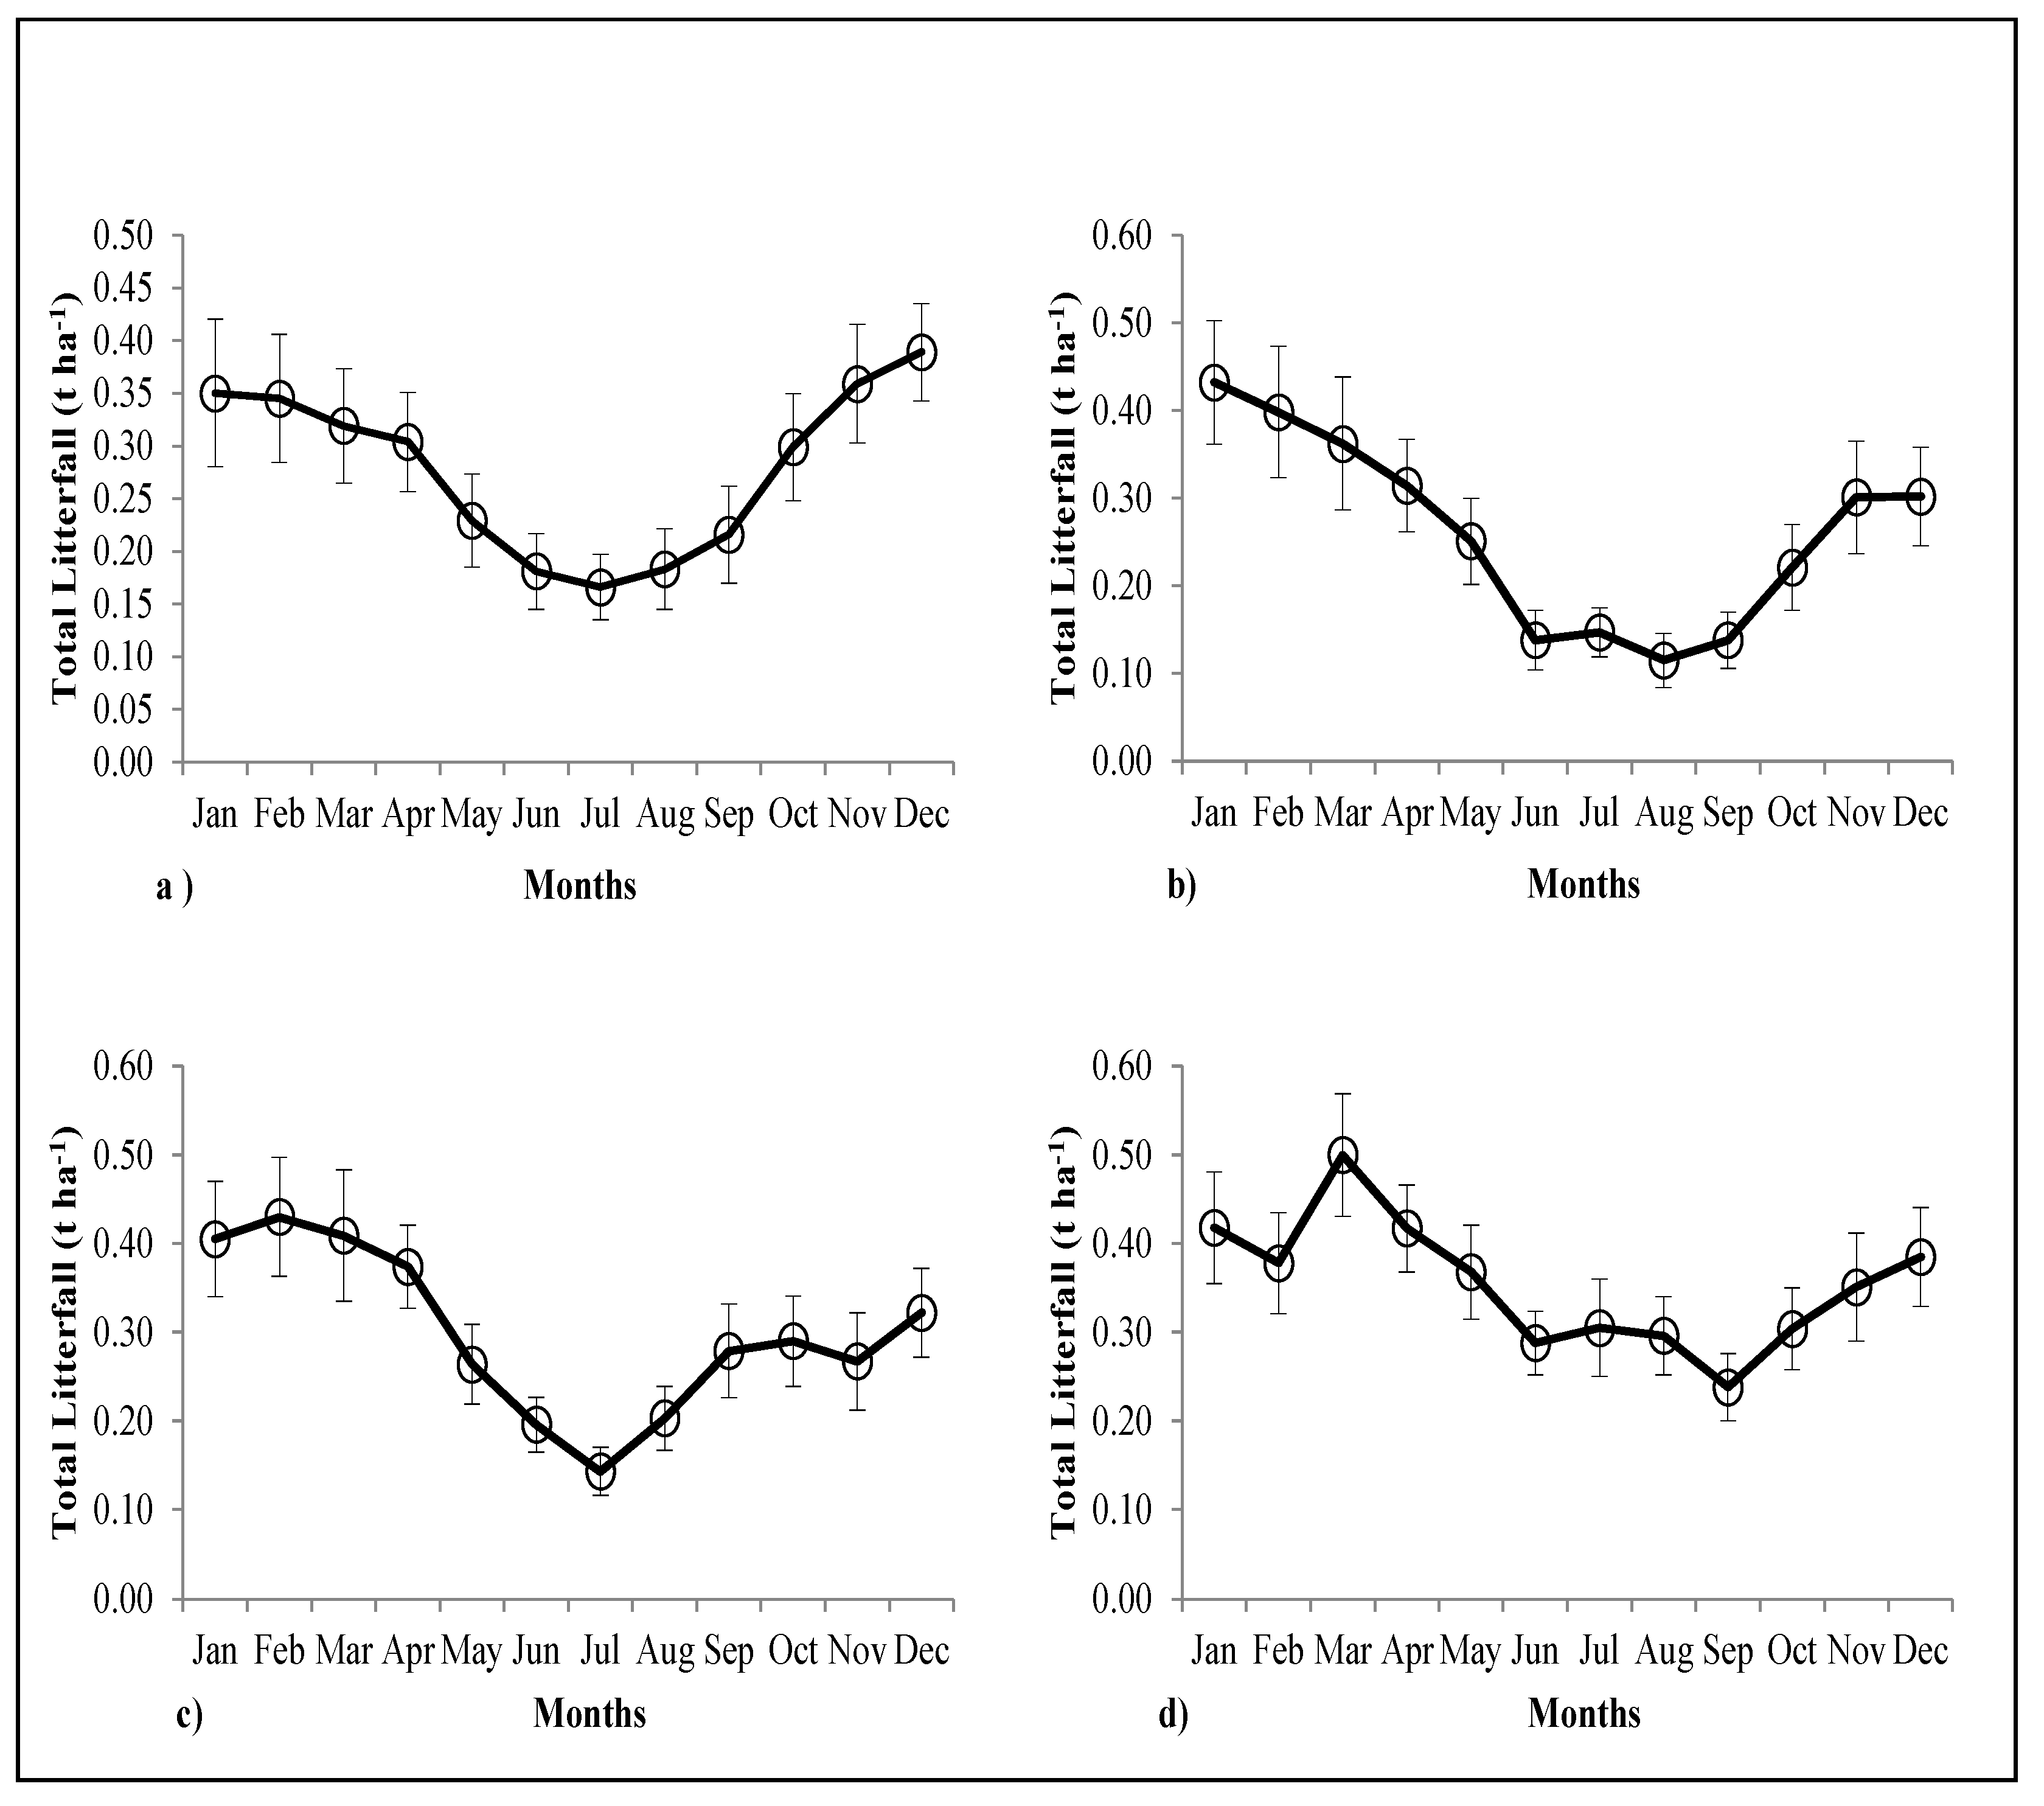
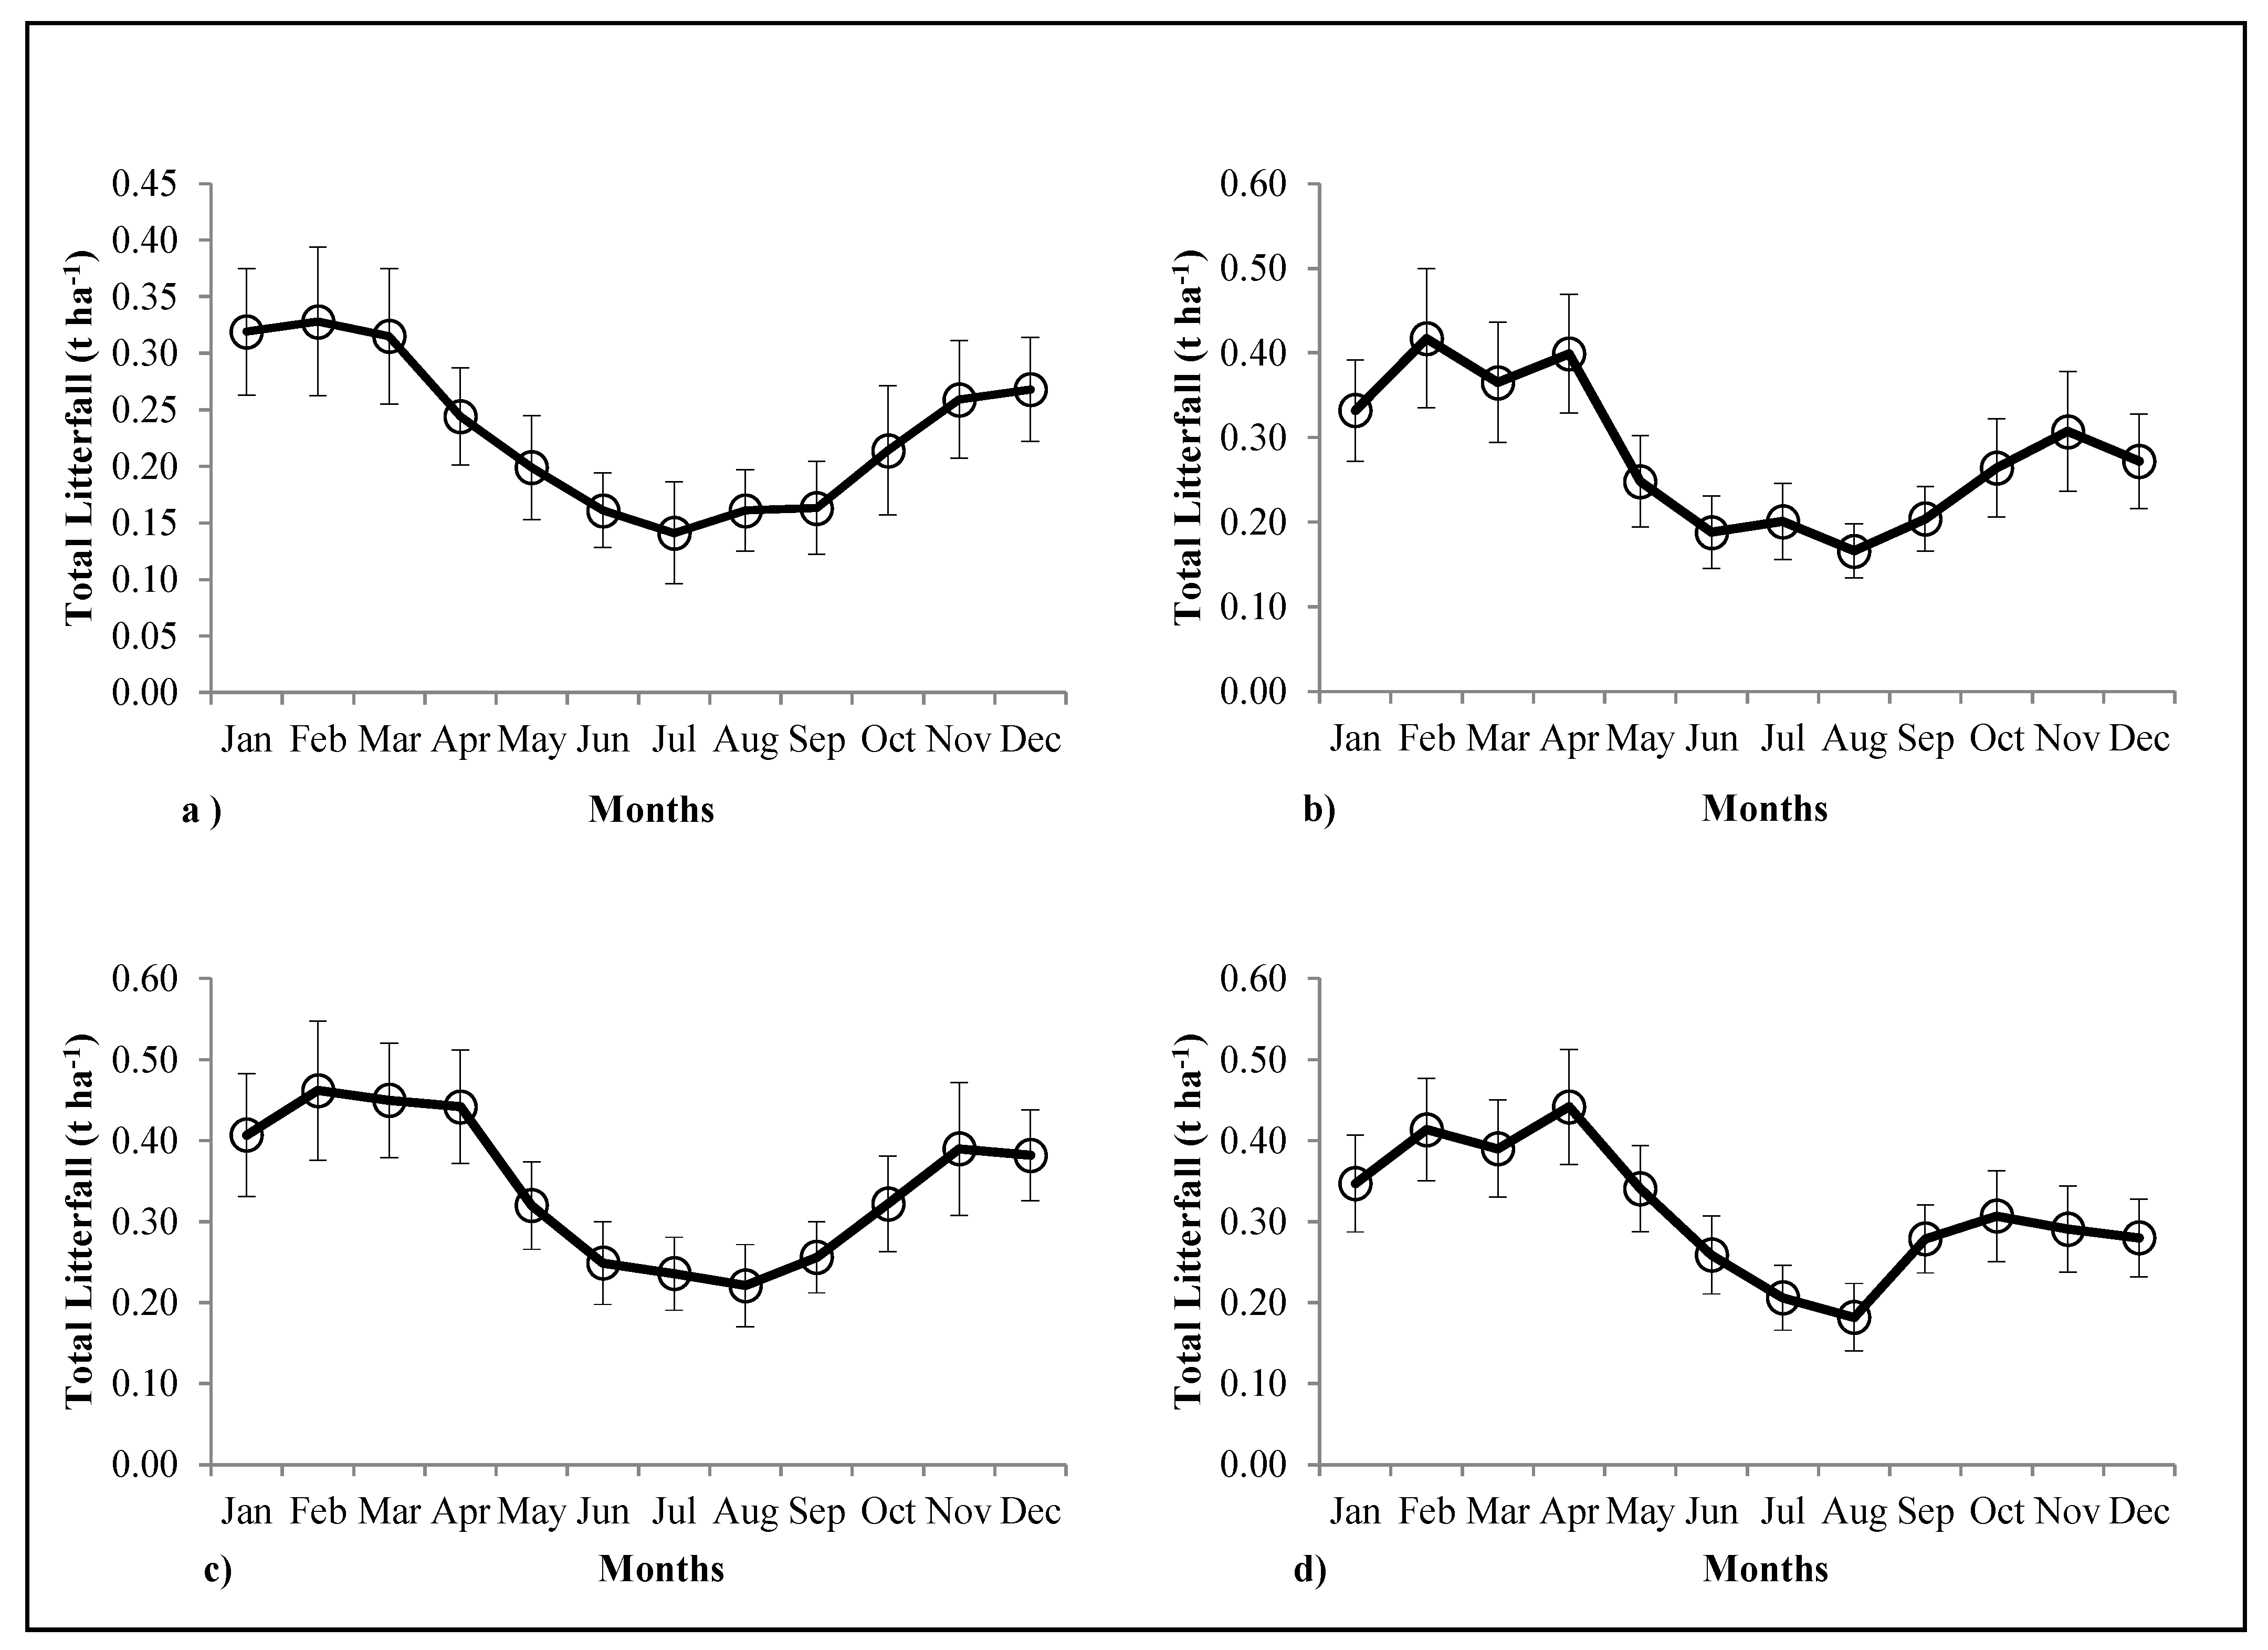
3.4. Forest Floor Biomass and Litter Inputs

The standing crop litter layer varied considerably across all the months at different age classes in all the plantations. In addition, marked changes in the relative proportions of different litter categories (leaf, miscellaneous, and wood litter) were also evident in all four plantations. The total annual litter input of different-aged plantations of the D. latifolia plantation varied from 3.12 to 4.25 Mg ha−1. The minimum total annual litterfall was 3.12 Mg ha−1 in the 5-year-old plantation, and the maximum was recorded for the 7-year-old plantations (4.25 Mg ha−1) (Figure 3). The maximum contribution of leaf litter to the total litter production in the 7-year-old plantation was 1.58 Mg ha−1. Similarly, the percent contribution by leaf litter was 35.7% (Table 6).
The total annual litterfall production of the different-aged plantations for the M. composita plantation ranged from 2.77 to 4.14 Mg ha−1 (Figure 4). The minimum total annual litterfall was 2.77 Mg ha−1 in the 4-year-old plantation, and the maximum was recorded for the 6-year-old plantations (4.14 Mg ha−1) (Figure 4). The maximum contribution of leaf litter to the total litter production in the 7-year-old plantation was 1.54 Mg ha−1. Similarly, the percent contribution by leaf litter was 39.6% (Table 7).

3.5. Carbon Accumulation and Sequestration (Cseq)

The highest C stock was 68.94 in 7-year-old M. composita with the highest contribution of bole of 43.34 Mg C ha−1. The percent distribution of bole, branches, twigs, foliage, stump root, lateral roots, and fine roots was 62.9%, 11.0%, 3.7%, 5.2%, 10.7%, 5.4%, and 1.0%, respectively. The mean total carbon stock ranged from 32.71 to 42.95 Mg ha−1 in the D. latifolia plantation, and the maximum contributed by the 7-year-old stand was 42.95 Mg ha−1 (Table 8). Of the total, bole, branches, twigs, foliage, stump root, lateral roots, and fine roots contributed 52.4%, 11.5%, 6.7%, 8.1%, 12.9%, 7.2%, and 1.2%, respectively. The total carbon sequestration rate of both the plantations of different ages was in the following order: M. composita 6-year-old stand (7.6 Mg C ha−1yr−1) ˃ M. composita 5-year-old stand (6.35 Mg C ha−1yr−1) ˃ M. composita 4-year-old stand (5.46 Mg C ha−1yr−1) ˃ D. latifolia 6-year-old stand (4.33 Mg C ha−1yr−1) ˃ D. latifolia 5-year-old stand (3.22 Mg C ha−1yr−1) ˃ D. latifolia 4-year-old stand (2.66 Mg C ha−1yr−1) (Table 9)

4. Discussion

In the current scenario, the timber demand in India is exceptionally high. In addition, it is crucial to ensure that the species with good-quality timber and fast-growing capacity are cultivated under the management of the Forest Department and experts in the agricultural industry center. M. composita and D. latifolia have been widely cultivated by Uttarakhand and Uttar Pradesh State Forest Department, India due to their ecological and economic viability. Simple regression equations are essential to estimate biomass and carbon stock for commercial species. Therefore, these equations for calculating the above- and below-ground biomass of the selected species were developed. M. composita and D. latifolia are emerging species that also contribute to preventing temperatures from rising and to the mitigation of climate change impacts.
The regression equations developed in the present study bridge a critical gap in the assessment of biomass and carbon sequestration for the plantations of M. composita and D. latifolia. However, as no regression equations were available for the selected species, a comparison of their biomass was not possible. Significant correlation coefficients (r2) were found in the resulting regression equations for above- and below-ground tree biomass as a function of the tree diameter. This pattern was different from the pattern produced when using H as the variable. Consequently, growth in H seemed to be retarded and likely had a less significant impact on biomass estimation. The correlation coefficient of these equations is close to that of the equations developed by Bargali et al. [28] (r2 = 0.94); Lodhiyal et al. [29] (r2 = 0.92); and Lodhiyal et al. [31] (r2 = 0.94). The findings demonstrate that these equations correctly predicted the linear relationship between the variables. The variability of the uncorrected data rises with increasing diameter in most linear regression equations that link biomass with DBH. Some researchers estimated above-ground tree biomass (AGB) using tree height, DBH, and tree density as independent variables, but diameter-based equations showed the best regression relationship for estimating AGB and DBH tree biomass in various forests [45]. The regression equations developed in this study can be used to determine AGB and BGB and the carbon sequestration potential of D. latifolia and M. composita accurately. This study will be particularly useful for reforestation projects in a similar geographical zone. In this context, Preece et. al. [46] revealed that the accurate equations of carbon storage during reforestation are needed for assessing potential carbon sequestration under different scenarios of land use systems, especially for economically significant species. Thus, they could be a viable option for biomass estimation by a non-destructive method for each tree component.
Soil quality is a complete reflection of the soil’s physical and chemical characteristics and plays a key role in the pivotal processes of forest ecosystems, such as carbon storage and biomass production. As one of the chemical properties, pH ranged from 6.13 to 7.62 in the present study, and as per Dawit et al. [47], acidic soils limit the available P. A higher percentage of OC was observed (0.64%) for the samples collected from the D. latifolia plantation at 0–15 cm depth. Furthermore, the impact of different tree species on soil characteristics and fertility might vary considerably. The findings of this study agree with earlier studies that land use type can significantly affect soil OC content [48]. Phosphorus, potassium, and nitrogen are the three essential macronutrients found in soil that help plants function and thrive. In both the forests, the mean available soil nitrogen (313.6 kg ha−1) and available phosphorus (18.54 kg ha−1) contents were higher at the 0–15 cm depth of the D. latifolia and M. composita, respectively. However, this is in line with the results of Muche et al. [49], who reported marked variations in soil nitrogen with land use type. Singh and Singh [50] recorded the percentages of organic matter and nitrogen in the subtropical zone of Kumaun Himalaya, which varied from 1.5 to 3.0% and 0.1 to 0.3%, respectively. According to Tisdale et al. [51], approximately 50% of phosphorus is present in organic form, and humus found in organic matter forms complexes with Al and Fe, protecting phosphorus fixation. A. catechu, M. azedarach, and D. sissoo had a phosphorus content of 26.6, 24.4, and 28.3 kg ha−1, respectively. Chauhan et al. [52] found higher values than the present findings. The available potassium content in the soil ranged from 146.15 kg ha−1 to 159.60 kg ha−1 at both depths. The highest available potassium (159.60 kg ha−1) content was at the initial depth of M. composita (Figure 2). Because of the liberation of potassium through litterfall decomposition and the solubilization of insoluble potassium content found in soil due to organic decay, potassium content was higher at the 0–15 depth in the studied plantations. The higher potassium concentrations in the plantations might be attributed to tree litter decomposition or the presence of grasses in each region. Swamy et al. [53] and Singh and Sharma [54] agree with our findings.
Climate is a major determinant of litter production. The annual total litter production ranged between 2.77 and 4.25 Mg ha−1yr−1 for all species. The minimum and maximum total litter was found in the D. latifolia 7-year-old plantation and M. composita 4-year-old plantation, respectively. As this is a deciduous forest, 100% leaf fall occurs each year. Consequently, the leaf fall is staggered in time, encompassing about 8 months of the annual cycle, but 74–83% of leaves fall during the winter season. However, Brown and Lugo [44] reported 69–86% leaf and fruit litter production for tropical forests. In Central Himalayan forests, leaf litterfall accounted for 72–86% of total litterfall [55]. Litter production canvary depending on the tree species, growth pattern, age, density, and canopy factors.
The productivity, carbon stock, and carbon sequestration of the tree species were evaluated using biomass analysis. Biomass-related research has gained traction in recent years as worldwide knowledge of the carbon credit system has grown [56]. The biomass estimation using DBH as an independent variable showed a higher r2 value than using H, which supports the previous studies carried out by Basuki et al. [57] and Basuki et al. [58]. Some researchers have suggested tree diameter, which is simple to measure, as the best parameter for determining the biomass of each tree component [57,59]. In the present study, the total biomass ranged from 68.86 t ha−1 to 145.14 Mg ha−1 for both species across different ages (4 to 7 years old). The maximum biomass was recorded in M. composita stand 145.14 Mg ha−1 in the 7-year-old plantation. Generally, most of the biomass is found in the trunk; therefore, the AGB increased with the DBH of the tree [57]. The above-ground (AGB) and below-ground biomass (BGB) were 82.8% and 17.1%, respectively, which is similar to the above-ground biomass recorded by Lodhiyal [29] for a 5–8-year-old Poplar plantation (67.4–134.3 Mg ha−1). Similarly, the biomass of the Eucalyptus plantation was lower, at 54.4 Mg ha−1 [28], than the present results for M. composita. However, the minimum biomass was recorded in the D. latifolia 4-year-old plantation, which was 68.86 Mg ha−1. The assessment of biomass production in different tree-based systems of the Central Himalayan Tarai region by Kanime et al. [60] found the highest above- and below-ground biomass in a D. sissoo Roxb. plantation, at 35.77 Mg ha−1 and 7.62 Mg ha−1, respectively, compared with E. tereticornis Sm. (9.55 and 0.97 Mg ha−1) and Populus deltoides Bart. ex Marsh. (22.81 and 5.85 Mg ha−1). This difference may be due tothe forest type, soil structure, and geographical conditions. In the present study, the increase in DBH decreases the foliage biomass, which is in line with the results for Phillyrea latifolia L. in the Mediterranean, the foliage of which contributes 15% of the AGB [61], and for Calophyllum inophyllum L. in Java, Indonesia [58].The present study found the herbaceous biomass ranging from 1.14 (D. latifolia 4-year-old plantation) to 3.68 Mg ha−1 (M. composita 7-year-old plantation). However, Lodhiyal et al. [31] found that the herbaceous species productivity ranged from 2.4 (15-year-old stand) to 2.8 Mg ha−1 (5-year-old stand).
Estimating the carbon sequestration capability of forest ecosystems is a critical task that may aid in the development of sustainable natural resource management strategies. The dynamics of the living biomass are the primary drivers of changes in forest ecosystem C pools. Accordingly, some authors have assessed the carbon storage potential of Indian forests, primarily through planting [62,63,64]. Using the Land Use and Carbon Sequestration (LUCS) model, Bhadwal and Singh [65] calculated that India’s existing farm forestry will hold 7 pg of carbon between 2000 and 2050. Moreover, Lal and Singh [8] figured that carbon sequestration and storage potential would be in the range of 1.1 and 2.7 Pg C, considering current indicators of biomass productivity for natural forest cover (1.1 Mg ha−1yr−1) and plantations (3.2 Mgha−1yr−1) before 2020 and 2045 (cumulative absorption of carbon from the atmosphere), respectively. The total carbon storage potential in a forest ecosystem increases with the age of the stand. The total C stock determined for a Tectona grandis 5-year-old plantation was 15.8 Mg ha−1 by Jha [30], which was lower than the present study (Table 10).
The findings of our study showed that the carbon stock ranged from 32.71 (D. latifolia 4-year-old stand) to 68.94 Mg C ha−1 (M. composita 7-year-old stand), and the sequestration rate (2.66–7.6 t Cha−1yr−1) was higher than the results of Kanime et al. [60] (0.43–2.75 Mg C ha−1yr−1) in the different tree-based systems of Tarai belt, Uttarakhand (Table 10). The present study revealed that the content of the forest floor was higher than the record by Singh et al. [66] for a 5-year-old mixed plantation (D. sissoo, A. catechu and A. lebbeck) (1.52 Mg ha−1). Still, it found a similar range to that by Rana et al. [67] (2.4–5.6 Mg ha−1) from the Central Himalayan region. A comparative analysis of mean total above-ground biomass, below-ground biomass, above-ground NPP, below-ground NPP, above-ground carbon stock, below-ground carbon stock, above-ground carbon sequestration rate, and below-ground carbon sequestration rate is shown in Figure 5 and Figure 6.
Table 10. Comparisons of carbon stock and carbon sequestration of different plantations in India.
LocationSpeciesAge (Years)Density (Ind. ha−1)Carbon Stock (t Cha−1)C Seq.
(t Cha−1yr−1)
Reference
IndiaTeak forest4349012.6112.80Karmacharya and Singh [68]
IndiaPoplar9400558Kaul et al. [69]
IndiaEucalyptus92000416Kaul et al. [69]
IndiaMixed plantation (D. sissoo, A. catechu and A. lebbeck)513220.110.12Singh et al. [66]
IndiaDry tropical---2.4Chaturvedi et al. [70]
IndiaP. deltoides850028.672.75Kanime et al. [60]
IndiaE. tereticornis1012010.520.84
IndiaD. sissoo10166643.392.73
India
India
Teak
Teak
5
11
-
-
15.8
35.4
6.96
5.46
Jha [30]
IndiaTeak plantation--230.16 Singh et al. [71]
IndiaAreca catechu-132036.48 Dabi et al. [72]
IndiaM. composita4–796049.54–68.945.46–7.60Present study
IndiaD. latifolia4–788032.71–42.952.66–4.33Present study

5. Conclusions

The aim of this study was to develop regression equations for quantifying the AGB and BGB in D. latifolia and M. composita plantations across the ages of 4 and 6 years old by combining the DBH explanatory variable. The selected regression equations qualified the goodness of fit with statistical significance at 95% of the confidence interval for biomass prediction. The regression coefficients must have significant values in order for the prediction to be accurate. Our study suggests using carbon value as a tempting economic motive to encourage forest conservation. Including increases in above- and below-ground carbon would add significantly to the potential total carbon budget. To support the REDD+ policy, these equations would be used in forest restoration and conservation projects to estimate the carbon stock. These projects could include opportunities for economic development and watershed services, as well as increased supplies of forest products. Future studies should also consider climate change effects on future plantations’ carbon sequestration for better achievement of the global carbon neutrality goals. As the plantations of these species have relatively high carbon sequestration potential, their plantations can be up-scaled to meet the C reduction targets of the countries. Thus, the plantations should be encouraged to sustain carbon sequestration potential in future afforestation projects and replantation region characteristics. The findings of this study illuminate the value of new emerging plantation tree species not only as commercial plantations but also in mitigating the impacts of climate change at a local level.

Author Contributions

Conceptualization, N.C. and A.T.; methodology, N.C., L.M.T. and A.T.; software, N.C.; validation, A.T. and L.M.T.; formal analysis, N.C., L.M.T. and A.T.; investigation, N.C.; resources, N.C., L.M.T. and A.T.; data curation, A.T. and N.C.; writing–original draft preparation, N.C.; writing—review and editing, N.C., L.M.T., A.T., Z.A.W., M.A., S.P., S.S. and A.S.; visualization, A.T. and S.P.; supervision, L.M.T. and A.T.; funding acquisition, S.S. All authors have read and agreed to the published version of the manuscript.

Funding

The authors extend their appreciation to the Deanship of Scientific Research at King Khalid University for funding this work through the Small Groups Project under grant number R.G.P.1/360/43.

Data Availability Statement

Not applicable.

Acknowledgments

The authors extend their appreciation to the Deanship of Scientific Research at King Khalid University for funding this work through the Small Groups Project under grant number R.G.P.1/360/43. The authors thank the Uttarakhand Forest Department for access to their sites and infrastructure, and we thank the employees of the forest department for their field assistance. The authors also thank the Head, Department of Botany, D.S.B. Campus, Kumaun University, Nainital for providing the necessary lab facility.

Conflicts of Interest

The authors declare that they have no known competing financial interests or personal relationships that could have appeared to influence the work reported in this paper.

References

  1. Goulder, L.; Pizer, W. The Economics of Climate Change; Discussion Paper RFF DP 06-06; Resources for the Future: Washington, DC, USA, 2006. [Google Scholar]
  2. Archer, D.; Brovkin, V. The millennial atmospheric lifetime of anthropogenic CO2. Clim. Chang. 2008, 90, 283–297. [Google Scholar] [CrossRef] [Green Version]
  3. IPCC. Climate Change. Synthesis Report. Contribution of Working Groups I, II and III to the Fifth Assessment Report of the Intergovernmental Panel on Climate Change; Core Writing Team, Pachauri, R.K., Meyer, L.A., Eds.; IPCC: Geneva, Switzerland, 2014; p. 151. [Google Scholar]
  4. Pandey, S.S.; Maraseni, T.N.; Cockfield, G. Carbon stock dynamics in different vegetation dominated community forests under REDD+: A case from Nepal. For. Ecol. Manag. 2014, 327, 40–47. [Google Scholar] [CrossRef]
  5. Yadav, R.P.; Bisht, J.K.; Bhatt, J.C. Biomass, carbon stock under different production systems in the mid hills of Indian Himalaya. Trop Ecol. 2017, 58, 15–21. [Google Scholar]
  6. Lewis, S.L.; Lopez-Gonzalez1, G.; Sonke, B.; Affum-Baffoe, K.; Baker, T.R.; Ojo, L.O.; Phillips, O.L. Increasing carbon storage in intact African tropical forests. Nat. Letter. 2009, 457, 1003–1006. [Google Scholar] [CrossRef]
  7. FAO. The State of Food Insecurity in the World; Food and Agriculture Organization of the United Nations: Rome Italy, 2001. [Google Scholar]
  8. Lal, M.; Singh, R. Carbon sequestration potential of Indian forests. Environ. Monit Assess. 2000, 60, 315–327. [Google Scholar] [CrossRef]
  9. Kelty, M.J. The role of species mixtures in plantation forestry. For. Ecol. Manag. 2006, 233, 195–204. [Google Scholar] [CrossRef]
  10. Lamb, D.; Erskine, P.D.; Parrotta, J.A. Restoration of degraded tropical forest landscapes. Science 2005, 310, 1628–1632, Green Version. [Google Scholar] [CrossRef] [PubMed] [Green Version]
  11. FAO. Global Forest Resources Assessment 2010-Main Report; FAO Forestry Paper 163; FAO: Rome, Italy, 2010; 340p. [Google Scholar]
  12. Amazonas, N.T.; Forrester, D.I.; Silva, C.C.; Almeida, D.R.A.; Rodrigues, R.R.; Brancalion, P.H.S. High diversity mixed plantations of Eucalyptus and native trees: An interface between production and restoration for the tropics. For. Ecol. Manag. 2018, 417, 247–256. [Google Scholar] [CrossRef]
  13. Liu, C.L.C.; Kuchma, O.; Krutovsky, K.V. Mixed-species versus monocultures in plantation forestry: Development, benefits, ecosystem services and perspectives for the future. Glob. Ecol. Conserv. 2018, 15, e00419. [Google Scholar] [CrossRef]
  14. Deng, L.; Han, Q.S.; Zhang, C.; Tang, Z.S.; Shangguan, Z.P. Above-ground and below-ground ecosystem biomass accumulation and carbon sequestration with Caragana korshinskii Kom plantation development. Land Degrad. Dev. 2017, 28, 906–917. [Google Scholar] [CrossRef]
  15. Zheng, D.; Rademacher, J.; Chen, J.; Crow, T.; Bresee, M.; Le Moine, J.; Ryu, S.R. Estimating Aboveground Biomass Using Landsat 7 ETM+ Data across a Managed Landscape in Northern Wisconsin, USA. Remote Sens. Environ. 2004, 93, 402–411. [Google Scholar] [CrossRef]
  16. Negi, J.D.S.; Chauhan, P.S. Greenhouse gases mitigation potential by Sal (Shorea robusta Gaertn. f.) forest in Doon Valley. Indian For. 2002, 128, 771–778. [Google Scholar]
  17. ITTO. Encouraging Industrial Forest Plantations in the Tropics; International Tropical Timber Organization: Yokohama, Japan, 2009. [Google Scholar]
  18. Krishnamurthy, Y.L.; Prakasha, H.M.; Nanda, A.; Krishnappa, M.; Dattaraja, H.S.; Suresh, H.S. Vegetation structure and floristic composition of a tropical dry deciduous forest in bhadra wildlife sanctuary, Karnataka, India. Trop. Ecol. 2010, 51, 235–246. [Google Scholar]
  19. Arunkumar, A.N.; Warrier, R.R.; Kher, M.M.; Teixeira da Silva, J.A. Indian rosewood (Dalbergia latifolia Roxb.): Biology, utilisation, and conservation practices. Trees 2022, 36, 883–898. [Google Scholar] [CrossRef]
  20. Röll, A.; Ramesha, M.N.; Link, R.M.; Hertel, D.; Schuldt, B.; Patil, S.L.; Hölscher, D. Water Availability Controls the Biomass Increment of Melia dubia in South India. Forests 2021, 12, 1675. [Google Scholar] [CrossRef]
  21. Sharma, S.K.; Shukla, S.R.; Sujatha, M.; Shashikala, S.; Kumar, P. Assessment of certain wood quality parameters of selected genotypes of Melia dubia Cav. grown in a seedling seed orchard. J. Indian Acad. Wood Sci. 2012, 9, 165–169. [Google Scholar] [CrossRef]
  22. Thakur, N.S.; Mohanty, S.; Gunaga, R.P.; Gajbhiye, N.A. Melia dubia Cav. spatial geometries influence the growth, yield and essential oil principles content of Cymbopogon flexuosus (Nees Ex Steud.) W. Watson. Agrofor. Syst. 2020, 94, 985–995. [Google Scholar] [CrossRef]
  23. Parthiban, K.T.; Bharathi, A.K.; Seenivasan, R.; Kamala, K.; Rao, M.G. Integrating Melia dubia in Agroforestry farms as an alternate pulpwood species. Asia-Pac. Agrofor. Newsl. 2009, 34, 3–4. [Google Scholar]
  24. Sinha, S.K.; Chaudhari, P.A.; Thakur, N.S.; Jha, S.K.; Patel, D.P.; Dhaka, R.K. Melia dubia Cav. wood properties vary with age and influence the pulp and paper quality. Int. Wood Prod. J. 2019, 10, 139–148. [Google Scholar] [CrossRef]
  25. Kirankumar, G.K.; Patil, H.Y. Growth and productivity of Melia dubia under different plant density. J. Farm Sci. 2017, 30, 70–73. [Google Scholar]
  26. Henry, M.; Besnard, A.; Asante, W.A. Wood density, phytomass variations within and among trees, and allometric equations in a tropical rainforest of Africa. For. Ecol. Manag. 2010, 260, 1375–1388. [Google Scholar] [CrossRef]
  27. Cifuentes Jara, M.; Henry, M.; Réjou-Méchain, M.; Wayson, C.; Zapata-Cuartas, M.; Piotto, D.; Alice Guier, F.; Castañeda Lombis, H.; Castellanos López, E.; Cuenca Lara, R.; et al. Guidelines for documenting and reporting tree allometric equations. Ann. For. Sci. 2015, 72, 763–768. [Google Scholar] [CrossRef] [Green Version]
  28. Bargali, S.S.; Singh, S.P.; Singh, R.P. Structure and function of an age series of Eucalypts plantations in Central Himalaya. I. Dry matter dynamics. Ann. Bot. 1992, 69, 405–411. [Google Scholar] [CrossRef]
  29. Lodhiyal, L.S.; Singh, R.P.; Singh, S.P. Structure and function of an age series of poplar plantations in Central Himalaya. I. Dry matter dynamics. Ann. Bot. 1995, 76, 191–199. [Google Scholar] [CrossRef]
  30. Jha, K.K. Carbon storage and sequestration rate assessment and allometric model development in young Teak plantations of tropical moist deciduous forest. India. J. For. Res. 2015, 26, 589–604. [Google Scholar] [CrossRef]
  31. Lodhiyal, N.; Lodhiyal, L.S.; Pangtey, Y.P.S. Structure and function of Shisham forests in Central Himalaya, India: Dry matter dynamics. Ann. Bot. 2002, 89, 41–54. [Google Scholar] [CrossRef] [PubMed] [Green Version]
  32. Piper, C.S. Soil and Plant Analysis; Hans Publisher: Bombay, India, 1966. [Google Scholar]
  33. Misra, R. Ecology Work Book; Oxford and IBH Publishing Co.: Calcutta, India, 1968. [Google Scholar]
  34. Nelson, D.W.; Sommers, L.E. Total carbon, organic carbon, and organic matter. In Methods of Soil Analysis. Part 3. Chemical Methods; Black, C.A., Ed.; Soil Science of America and American Society of Agronomy: Madison, WI, USA, 1996; pp. 961–1010. [Google Scholar]
  35. Olsen, S.R.; Sommers, L.E. Phosphorus. In Methods of Soil Analysis Part 2 Chemical and Microbiological Properties; Page, A.L., Ed.; American Society of Agronomy, Soil Science Society of America: Madison, WI, USA, 1982; pp. 403–430. [Google Scholar]
  36. Morwin, H.D.; Peach, P.M. Exchangeability of soil potassium in and, silt and clay fractions as influenced by the nature of complementary exchangeable cations. Proc. Natl. Acad. Sci. USA 1951, 15, 125–128. [Google Scholar] [CrossRef] [Green Version]
  37. Bremner, J.M. Nitrogen-total. In Methods of Soil Analysis, Part 3-Chemical Methods; Sparks, D.L., Ed.; American Society of Agronomy, Soil Science Society of America: Madison, WI, USA, 1996; pp. 1085–1121. [Google Scholar]
  38. Curtis, J.T.; McIntosh, R.P. The Interrelations of Certain Analytic and Synthetic Phytosociological Characters. Ecology 1950, 31, 434–455. [Google Scholar] [CrossRef]
  39. Chave, J.; Andalo, C.; Brown, S.; Cairns, M.A.; Chambers, J.Q.; Eamus, D.; Fromard, F.; Higuchi, N.; Kira, T.; Lescure, J.P.; et al. Tree allometry and improved estimation of carbon stocks and balance in tropical forests. Oecologia 2005, 145, 87–99. [Google Scholar] [CrossRef]
  40. Picard, N.; Saint-André, L.; Henry, M. Manual for Building Tree Volume and Biomass Allometric Equations: From Field Measurement to Prediction; Food and Agricultural Organization of the United Nations: Rome, Italy, 2012. [Google Scholar]
  41. Rawat, Y.S.; Singh, J.S. Structure and function of oak forests in Central Himalaya. I. Dry matter dynamics. Ann. Bot. 1988, 62, 397–411. [Google Scholar] [CrossRef]
  42. MacDicken, K.G. A Guide to Mountain Carbon Storage in Forestry and Agroforestry Projects; Winrock International Institute for Agricultural Development, Forest Carbon Monitoring Programme: Arlington, VA, USA, 1997. [Google Scholar]
  43. IPCC. IPCC Guidelines for National Greenhouse Gas Inventories; Prepared by the National Greenhouse Gas Inventories Programme; IGES: Hayama, Japan, 2006. [Google Scholar]
  44. Brown, S.; Lugo, A.E. The storage and production of organic matter in tropical forests and their role in global carbon cycle. Biotropica 1982, 14, 161–187. [Google Scholar] [CrossRef]
  45. Brown, S. Estimating Biomass and Biomass Change of Tropical Forests: A Primer; FAO Forestry paper 134; Food and Agriculture Organization: Rome, Italy, 1997; 55p. [Google Scholar]
  46. Preece, N.D.; van Oosterzee, P.; Unda, G.C.H.; Lawes, M.J. National Carbon Model Not Sensitive to Species, Families and Site Characteristics in a Young Tropical Reforestation Project. For. Ecol. Manag. 2017, 392, 115–124. [Google Scholar] [CrossRef]
  47. Dawit, S.; Fritzsche, F.; Tekalign, M.; Lehmann, J.; Zech, W. Phosphorus forms and Dynamics as influenced by land use changes in the sub-humid Ethiopian highlands. Geoderma. 2002, 105, 21–48. [Google Scholar]
  48. Li, Y.F.; Zhang, J.J.; Chang, S.X.; Jiang, P.K.; Zhou, G.M.; Shen, Z.M.; Wu, J.S.; Lin, L.; Wang, Z.S.; Shen, M.C. Converting native shrub forests to Chinese chestnut plantations and subsequent intensive management affected soil C and N pools. For. Ecol. Mgt. 2014, 312, 161–169. [Google Scholar] [CrossRef]
  49. Muche, M.; Kokeb, A.; Molla, E. Assessing the physicochemical properties of soil under different land use types. J. Environ. Anal. Toxicol. 2015, 5, 309. [Google Scholar]
  50. Singh, J.S.; Singh, S.P. Forest vegetation of the Himalaya. Bot. Rev. 1987, 53, 80–192. [Google Scholar] [CrossRef]
  51. Tisdale, S.L.; Nelson, W.L.; Beaton, J.D.; Havlin, J.L. Soil Fertility and Fertilizers; Macmillan: New York, NY, USA, 1993; pp. 176–229. [Google Scholar]
  52. Chauhan, S.K.; Singh, S.; Sharma, S.; Vashist, B.B.; Sharma, R.; Saralch, H.S. Soil health (physical, chemical and biological) status under short rotation tree plantations on riverain soils. J. Pharmacogn. Phytochem. 2018, 7, 1599–1605. [Google Scholar]
  53. Swamy, S.L.; Mishra, A.; Puri, S. Comparison of growth, biomass and nutrient distribution in five promising clones of Populus deltoides under an agri-silviculture system. Bioresource Tech. 2006, 97, 57–68. [Google Scholar] [CrossRef]
  54. Singh, B.; Sharma, K.N. Tree growth and nutrient status of soil in a poplar (Populus deltoids Bartr.) based agroforestry system in Punjab, India. Agrofor. Syst. 2007, 70, 113–124. [Google Scholar] [CrossRef]
  55. Mehra, M.S.; Singh, J.S. Pattern of wood litterfall in five forest located along an altitudinal gradient in Central Himalayan forests. Vegetatio 1985, 63, 3–11. [Google Scholar] [CrossRef]
  56. Kale, M.; Singh, S.; Roy, P.S.; Deosthali, V.; Ghole, V.S. Biomass equations of dominant species of dry deciduous forest in Shivpuri district, Madhya Pradesh. Curr.Sci. 2004, 87, 683–687. [Google Scholar]
  57. Basuki, T.M.; van Laake, P.E.; Skidmore, A.K.; Hussin, Y.A. Allometric equations for estimating the above-ground biomass in tropical lowland Dipterocarp forests. For. Ecol. & Manag. 2009, 257, 1684–1694. [Google Scholar]
  58. Basuki, T.M.; Leksono, B.; Baral, H.; Andini, S.; Wahyuni, N.S.; Artati, Y.; Choi, E.; Shin, S.; Kim, R.; Yang, A.-R.; et al. Allometric Equations for the Biomass Estimation of Calophyllum inophyllum L. in Java, Indonesia. Forests 2022, 13, 1057. [Google Scholar] [CrossRef]
  59. Lima, A.J.N.; Suwa, R.; de Mello Ribeiro, G.H.P.; Kajimoto, T.; dos Santos, J.; da Silva, R.P.; de Souza, C.A.S.; de Barros, P.C.; Noguchi, H.; Ishizuka, M. Allometric Models for Estimating Above- and Below-Ground Biomass in Amazonian Forests at São Gabriel da Cachoeira in the Upper Rio Negro, Brazil. For. Ecol. Manag. 2012, 277, 163–172. [Google Scholar] [CrossRef]
  60. Kanime, N.; Kaushal, R.; Tewari, S.K.; Raverkar, K.P.; Chaturvedi, S.; Chaturvedi, O.P. Biomass production and carbon sequestration in different tree-based systems of Central Himalayan Tarai region. For. Trees Livelihoods. 2013, 22, 38–50. [Google Scholar] [CrossRef]
  61. Marziliano, P.A.; Lafortezza, R.; Medicamento, U.; Lorusso, L.; Giannico, V.; Colangelo, G.; Sanesi, G. Estimating Belowground Biomass and Root/Shoot Ratio of Phillyrea Latifolia L. in the Mediterranean Forest Landscapes. Ann. For. Sci. 2015, 72, 585–593. [Google Scholar] [CrossRef] [Green Version]
  62. Manhas, R.K.; Negi, J.D.S.; Kumar, R.; Chauhan, P.S. Temporal assessment of growing stock, biomass and carbon stock of Indian forests. Clim. Chang. 2006, 74, 191–221. [Google Scholar] [CrossRef]
  63. Hooda, N.; Gera, M.; Andrasko, K.; Sathaye, J.A.; Gupta, M.K.; Vasistha, H.B.; Chandran, M.; Rassaily, S.S. Community and farm forestry climate mitigation projects: Case studies from Uttaranchal, India. Mitig. Adapt. Strateg. Glob. Chang. 2007, 12, 1099–1130. [Google Scholar] [CrossRef]
  64. Baishya, R.; Barik, S.K.; Upadhaya, K. Distribution Pattern of Aboveground Biomass in Natural and Plantation Forests of Humid Tropics in Northeast India. Trop. Ecol. 2009, 50, 295–304. [Google Scholar]
  65. Bhadwal, S.; Singh, R. Carbon sequestration estimates for forestry options under different land-use scenarios in India. Curr. Sci. 2002, 83, 1380–1386. [Google Scholar]
  66. Singh, V.; Tewari, A.; Kushwaha, S.P.S.; Dadhwal, V.K. Formulating allometric equations for estimating biomass and carbon stock in small diameter trees. For. Ecol. Manag. 2011, 261, 1945–1949. [Google Scholar] [CrossRef]
  67. Rana, B.S.; Singh, S.P.; Singh, R.P. Biomass and net primary productivity in Central Himalayan Forest along an altitudinal gradient. For. Ecol. Manag. 1989, 27, 199–218. [Google Scholar] [CrossRef]
  68. Karmacharya, S.B.; Singh, K.P. Biomass and net productivity of teak plantation in dry tropical region of India. For. Ecol. Manag. 1992, 55, 233–247. [Google Scholar] [CrossRef]
  69. Kaul, M.; Mohren, G.M.J.; Dadhwal, V.K. Carbon storage and sequestration potential of selected tree species in India. Mitig. Adapt. Strateg. Glob. Chang. 2010, 15, 489–510. [Google Scholar] [CrossRef] [Green Version]
  70. Chaturvedi, R.K.; Raghubanshi, A.S.; Singh, J.S. Carbon density and accumulation in woody species of tropical dry forest in India. For. Ecol. Manag. 2011, 262, 1576–1588. [Google Scholar] [CrossRef]
  71. Singh, A.K.; Sahu, C.; Sahu, S.K. Carbon sequestration potential of a teak plantation forest in the Eastern Ghats of India. J. Environ. Biol. 2020, 41, 770–775. [Google Scholar] [CrossRef]
  72. Dabi, H.; Bordoloi, R.; Das, B.; Paul, A.; Tripathi, O.P.; Mishra, B.P. Biomass, carbon stock and soil physicochemical properties in plantation of East Siang district, Arunachal Pradesh, India. Environ. Chal. 2021, 4, 100191. [Google Scholar] [CrossRef]
Figure 1. The location map of the study area shows the sampling sites ((A): D. latifolia plantation; (B): M. composita plantation).
Forests 14 00646 g001
Figure 2. Chemical properties of soil: (a) soil pH, (b) organic carbon, (c) available nitrogen, (d) available potassium, (e) available phosphorus. Dl: D. latifolia; Mc: M. composita.
Forests 14 00646 g002
Figure 3. Total litterfall (Mg ha−1) of D. latifolia plantation of different ages: (a) 4 years old; (b) 5 years old; (c) 6 years old; (d) 7 years old.
Forests 14 00646 g003
Figure 4. Total litterfall (Mg ha−1) of M. composita plantation of different ages: (a) 4 years old; (b) 5 years old; (c) 6 years old; (d) 7 years old.
Forests 14 00646 g004
Figure 5. Relationship between tree stand characteristics and age of the stand (M. composita).
Forests 14 00646 g005
Figure 6. Relationship between tree stand characteristics and age of the stand (D. latifolia).
Forests 14 00646 g006
Table 1. Stand structure of D. latifoila and M. composita plantations.
Plantations
ParameterD. latifoliaM. composita
Altitude (m)242242
Tree density (trees ha−1)880960
Herb density (ind m−2)45.9132.87
Shrub density (ind ha−1)32403740
Mean change dbh (4–5 years old)(cm)3.13.2
Mean change dbh (6–7 years old)(cm)2.83.8
Table 2. Regression equation relationship between the biomass of the tree components (y, kg tree−1) and diameter at breast height (X, cm) for plantations of D. latifolia and M. composita in 4- and 6-year-old plantations. All regression equations had good fit (p < 0.01).
Plantations/Tree Componenta (Intercept)b (Slope)r2
D. latifolia4 Years
Bole−0.82491.52560.985
Branch−0.56320.89670.932
Twigs−0.03560.58450.971
Foliage−0.05480.64950.939
Stump root−0.24510.82160.978
Lateral roots−0.06280.63710.979
Fine roots−0.00250.04160.827
6 Years
Bole−2.32261.94360.993
Branch−0.70660.93750.968
Twigs−0.05130.65010.918
Foliage−0.08070.70310.836
Stump root−0.61950.98490.990
Lateral roots−0.12510.72150.996
Fine roots−0.00840.12930.876
M. composita4 Years
Bole−3.36412.49060.916
Branch−0.22930.91540.986
Twigs−0.03710.52430.978
Foliage−0.06760.75270.931
Stump root−0.38190.95730.911
Lateral roots0.07270.60100.987
Fine roots−0.00260.03020.874
6 Years
Bole−4.85612.72840.901
Branch−1.08621.13330.989
Twigs−0.04390.59080.964
Foliage−0.08380.77220.887
Stump root−0.97041.18680.936
Lateral roots−0.32320.79580.960
Fine roots−0.00480.22810.858
Table 3. Component-wise mean ± SE biomass (Mg ha−1) of plantations. The values in parentheses indicate the percent distribution.
Species/ComponentsBiomass (Mg ha−1)
D. latifolia4 Years5 Years6 Years7 YearsMean Change
Bole32.36 ± 12.34
(47.0)
36.54 ± 10.45
(49.1)
41.2 ± 14.57
(50.7)
47.38 ± 11.73
(52.4)
39.37
(49.8)
Branches8.77 ± 1.92
(12.7)
9.18 ± 1.83
(12.3)
9.72 ± 2.72
(12.0)
10.43 ± 2.97
(11.5)
9.52
(12.1)
Twigs5.41 ± 1.47
(7.9)
5.54 ± 0.97
(7.4)
5.75 ± 0.86
(7.1)
6.07 ± 1.08
(6.7)
5.69
(7.3)
Foliage6.55 ± 1.79
(9.5)
6.72 ± 1.68
(9.0)
6.93 ± 2.08
(8.5)
7.28 ± 1.09
(8.1)
6.87
(8.8)
Stump root9.65 ± 0.80
(14.0)
10.1 ± 3.20
(13.6)
10.74 ± 2.65
(13.2)
11.62 ± 4.25
(12.9)
10.53
(13.4)
Lateral roots5.24 ± 1.61
(7.6)
5.48 ± 1.73
(7.4)
5.94 ± 0.91
(7.3)
6.55 ± 2.86
(7.2)
5.80
(7.4)
Fine roots0.88 ± 0.15
(1.3)
0.9 ± 0.56
(1.2)
0.96 ± 0.34
(1.2)
1.1 ± 0.57
(1.2)
0.96
(1.2)
Total68.86 ± 20.0874.46 ± 20.4281.24 ± 24.1390.43 ± 24.5578.75
M. composita4 Years5 Years6 Years7 YearsMean Change
Bole58.66 ± 18.45
(56.3)
68.43 ± 13.63
(59.1)
78.8 ± 10.72
(61.0)
91.24 ±12.77
(62.9)
74.28
(59.8)
Branches13.13 ± 2.12
(12.6)
13.86 ± 4.19
(12.0)
14.86 ± 2.28
(11.5)
16.01 ± 3.31
(11.0)
14.46
(11.8)
Twigs4.74 ± 0.59
(4.6)
4.81 ± 0.66
(4.2)
5.12 ± 0.96
(4.0)
5.42 ± 1.79
(3.7)
5.02
(4.1)
Foliage6.34 ± 2.78
(6.1)
6.51 ± 2.07
(5.6)
6.97 ± 1.87
(5.4)
7.53 ± 1.10
(5.2)
6.84
(5.6)
Stump root13.02 ± 2.15
(12.5)
13.56 ± 3.20
(11.7)
14.42 ± 2.21
(11.2)
15.57 ± 4.35
(10.7)
14.14
(11.5)
Lateral roots7.04 ± 2.06
(6.8)
7.23 ± 1.78
(6.2)
7.55 ± 1.09
(5.9)
7.9 ± 1.11
(5.4)
7.43
(6.1)
Fine roots1.356 ± 0.24
(1.3)
1.381 ± 0.46
(1.2)
1.422 ± 0.37
(1.1)
1.473 ± 0.65
(1.01)
1.41
(1.2)
Total104.28 ± 28.69115.78 ± 25.99129.14 ± 19.50145.14 ± 25.08123.59
Table 4. Biomass (Mg ha−1) of vegetation of D. latifolia plantation of different ages: (a) 4 years old; (b) 5 years old; (c) 6 years old; (d) 7 years old.
Age (Years)
4567
Tree68.86 ± 8.0874.46 ± 8.4281.24 ± 9.6390.43 ± 10.95
Shrub1.41 ± 0.131.29 ± 0.221.32 ± 0.462.08 ± 0.67
Herb2.36 ± 0.413.05 ± 0.832.67 ± 0.863.68 ± 0.84
Litter3.33 ± 0.633.11± 1.013.58 ± 1.534.25 ± 1.65
Table 5. Biomass (Mg ha−1) of vegetation in M. composita plantation of different ages: (a) 4 years old; (b) 5 years old; (c) 6 years old; (d) 7 years old.
Age (Years)
4567
Tree104.28 ± 15.39115.78 ± 14.59129.14 ± 18.20145.14 ± 19.57
Shrub1.44 ± 0.212.02 ± 0.321.85 ± 0.372.41 ± 0.23
Herb2.08 ± 0.941.14 ± 0.132.46 ± 0.781.83 ± 0.17
Litter2.77 ± 0.673.38 ± 1.284.13 ± 1.383.72 ± 0.98
Table 6. Component-wise total litterfall (Mg ha−1) mean ± SE of D. latifolia plantation of different ages: (a) 4 years old; (b) 5 years old; (c) 6 years old; (d) 7 years old. Value in parenthesis is the percent distribution.
Age (Years)
D. latifolia4567
Leaf1.19 ± 0.17
(35.7)
1.22 ± 0.19
(39.1)
1.36 ± 0.18
(38)
1.58 ± 0.20
(36.9)
Miscellaneous1.28 ± 0.16
(38.4)
1.12 ± 0.17
(35.9)
1.38 ± 0.17
(38.5)
1.61 ± 0.17
(37.6)
Wood0.86 ± 0.13
(25.8)
0.78 ± 0.13
(25.0)
0.84 ± 0.13
(23.5)
1.09 ± 0.14
(25.5)
Table 7. Component-wise total litterfall (Mg ha−1) mean ± SE of M. composita plantation of different ages: (a) 4 years old; (b) 5 years old; (c) 6 years old; (d) 7 years old. Value in parenthesis is the percent distribution.
Age (Years)
M. composita4567
Leaf1.09 ± 0.185
(39.4)
1.2 ± 0.194
(35.7)
1.54 ± 0.219
(39.6)
1.4 ± 0.196
(35.1)
Miscellaneous0.9 ± 0.164
(32.5)
1.19 ± 0.204
(35.4)
1.45 ± 0.207
(37.3)
1.3 ± 0.174
(32.6)
Wood0.78 ± 0.127
(28.2)
0.97 ± 0.148
(28.9)
0.9 ± 0.126
(23.1)
1.29 ± 0.141
(32.3)
Table 8. Component-wise mean ± SE carbon stock (Mg C ha−1) in all the plantations.
Species/ComponentsCarbon Stock (Mg C ha−1)
D. latifolia4 Years5 Years6 Years7 Years
Bole15.37 ±1.21
(46.99)
17.36 ±1.34
(49.07)
19.57 ±1.28
(50.71)
22.51 ±1.30
(52.39)
Branches4.17 ±0.1
(12.74)
4.36 ±0.13
(12.33)
4.62 ±0.17
(11.96)
4.95 ±0.28
(11.53)
Twigs2.57 ±0.15
(7.86)
2.63 ±0.1
(7.44)
2.73 ±0.15
(7.08)
2.88 ±0.11
(6.71)
Foliage3.11 ±0.18
(9.51)
3.19 ±0.16
(9.02)
3.29 ±0.32
(8.53)
3.46 ±0.33
(8.05)
Stump root4.58 ±0.18
(14.01)
4.8 ±0.18
(13.56)
5.1 ±0.12
(13.22)
5.52 ±0.40
(12.85)
Lateral roots2.49 ±0.29
(7.61)
2.6 ±0.23
(7.36)
2.82 ±0.28
(7.31)
3.11 ±0.30
(7.24)
Fine roots0.42 ± 0.04
(1.28)
0.43 ±0.03
(1.21)
0.46 ±0.04
(1.18)
0.52 ±0.06
(1.22)
Total32.71 ± 2.1535.37 ± 2.2838.59 ± 2.3542.95 ± 2.77
M. composita4 Years5 Years6 Years7 Years
Bole27.86 ±1.21
(56.25)
32.5 ±1.32
(59.1)
37.43 ±1.35
(61.02)
43.34 ±1.44
(62.86)
Branches6.24 ±0.27
(12.59)
6.58 ±0.30
(11.97)
7.06 ±0.37
(11.51)
7.6 ±0.40
(11.03)
Twigs2.25 ±0.12
(4.55)
2.28 ±0.13
(4.15)
2.43 ±0.21
(3.96)
2.57 ±0.23
(3.73)
Foliage3.01 ±0.10
(6.08)
3.09 ±0.14
(5.62)
3.31 ±0.16
(5.4)
3.58 ±0.18
(5.19)
Stump root6.18 ±0.14
(12.48)
6.44 ±0.18
(11.71)
6.85 ±0.14
(11.17)
7.4 ±0.15
(10.73)
Lateral roots3.34 ±0.18
(6.75)
3.43 ±0.19
(6.24)
3.59 ±0.18
(5.85)
3.75 ±0.24
(5.44)
Fine roots0.64 ±0.05
(1.3)
0.66 ±0.04
(1.19)
0.68 ±0.02
(1.1)
0.7 ±0.03
(1.01)
Total49.54 ± 2.0755 ± 2.2961.34 ± 2.4368.94 ± 2.67
Table 9. Component-wise mean ± SE carbon sequestration (Mg C ha−1 yr−1) in both the plantations.
Tree ComponentsCarbon Sequestration (Mg C ha−1 yr−1)
D. latifoliaM. composita
4 Years5 Years6 Years4 Years5 Years6 Years
Bole1.99 ± 0.212.21 ± 0.282.93 ± 0.374.64 ± 0.454.93 ± 0.635.91 ± 0.72
Branches0.2 ± 0.150.25 ± 0.170.33 ± 0.190.35 ± 0.220.48 ± 0.290.55 ± 0.28
Twigs0.06 ± 0.030.1 ± 0.040.15 ± 0.050.03 ± 0.090.15 ± 0.060.14 ± 0.06
Foliage0.08 ± 0.020.1 ± 0.050.16 ± 0.040.08 ± 0.080.22 ± 0.070.27 ± 0.07
Stump root0.21 ± 0.090.31 ± 0.10.418 ± 0.120.26 ± 0.150.41 ± 0.200.55 ± 0.21
Lateral roots0.11 ± 0.030.22 ± 0.070.28 ± 0.170.09 ± 0.060.15 ± 0.080.17 ± 0.09
Fine roots0.01 ± 0.010.03 ± 0.020.06 ± 0.020.01 ± 0.040.02 ± 0.060.02 ± 0.07
Total2.66 ± 0.543.22 ± 0.734.33 ± 0.865.46 ± 0.526.35 ± 0.847.6 ± 0.81
Disclaimer/Publisher’s Note: The statements, opinions and data contained in all publications are solely those of the individual author(s) and contributor(s) and not of MDPI and/or the editor(s). MDPI and/or the editor(s) disclaim responsibility for any injury to people or property resulting from any ideas, methods, instructions or products referred to in the content.

