Article

Paleo Distribution and Habitat Risks under Climate Change of Helleborus thibetanus

1
Zhejiang Academy of Agricultural Sciences, Zhejiang Institute of Landscape Plants and Flowers, Hangzhou 310000, China
2
College of Landscape Architecture, Beijing Forestry University, Beijing Key Laboratory of Ornamental Plants Germplasm Innovation and Molecular Breeding, National Engineering Research Center for Floriculture, Beijing 100083, China
*
Author to whom correspondence should be addressed.
Forests 2023, 14(3), 630; https://doi.org/10.3390/f14030630
Submission received: 8 February 2023 / Revised: 12 March 2023 / Accepted: 15 March 2023 / Published: 20 March 2023
(This article belongs to the Special Issue Modeling Forest Response to Climate Change)

Abstract

:
As an endemic species and the only Helleborus species in China, Helleborus thibetanus is highly valued in medicinal and ornamental applications, and basic research is needed for its further resource conservation and utilization. Considering the interesting disjunct distribution of the genus Helleborus, we focus on the distribution pattern of H. thibetanus in this research. Based on species distribution models using three different algorithms (MaxEnt, RF, and FDA), we constructed a robust ensemble model and predicted potential distributions under different scenarios: current situation, paleo periods since the Last Glacial Maximum, and simulations of climate change in the 2070s. The habitat suitability of H. thibetanus across geography and scenarios was further analyzed by calculating regional areas and centroids. The results showed that H. thibetanus is currently distributed in southern Shaanxi and northern Sichuan, while central and southern Sichuan used to be suitable 14 thousand years ago but gradually became unsuitable, which may reflect the population decrease in Sichuan and the population expansion in Shaanxi over the last 14 thousand years. Our results showed that current populations are under limited extinction pressure in the soft climate change scenario (ssp126), but most populations in Shaanxi are under extinction pressure in the hardy situation scenario (ssp585). Fortunately, northern Sichuan is predicted to be relatively stable under climate change (both ssp126 and ssp585), and regions in western Sichuan and eastern Qinghai are predicted to become newly suitable for H. thibetanus. These findings should be helpful for the further conservation and utilization of H. thibetanus and also help us understand the history of the conjunct distribution pattern of the Helleborus genus.

1. Introduction

Belonging to Ranunculaceae, Helleborus comprises about 22 species in Eurasia [1]. However, all species are located in Europe, except a single species (H. thibetanus) found in Asia [1]. This disjunct and uneven diversity pattern suggests a complex evolutionary history of Helleborus, which may connect to historical climate change, geological events, and dispersal limitations. This evolution is ongoing [2]. Questions may arise, including why a single species is left in Asia and what historical process explains its current distribution pattern. Such questions are valuable in revealing the full evolutionary history of Helleborus and other genera with disjunct distribution patterns. This history suggests that H. thibetanus holds great value in basic scientific research [2]. Meanwhile, H. thibetanus has a long tradition in ethnomedicinal and ethnoveterinary applications [3]. Modern pharmacological studies have suggested that they possess antitumor, antibacterial, immune-regulation, and cytotoxic properties, and many components have been disclosed [4,5]. In addition to its extensive medicinal usage throughout history, H. thibetanus is widely used in the ornamental industry, given its complex flower structure and long fluorescence [6,7]. The frequent and disordered introduction of natural germplasms due to their value in medical and ornamental applications, along with other pressures such as habitat fragmentation and global climate change, is creating extinction pressure on H. thibetanus [7,8]. Therefore, it is important to perform distribution modeling on H. thibetanus to better understand its distribution patterns and its evolutionary history, as well as to aid in conservation efforts.
Current species distribution patterns can depend on a variety of factors, including environmental influences, historical influences, and competition between species [2]. Among them, climate factors often play important roles, as they can affect the growth, development, and survival of plants in a variety of ways. Warmer temperatures often lead to increased growth rates, while colder temperatures can lead to decreased growth rates or the death of the plant [9]. In most cases, plants remain in balance with local climate conditions. However, extreme temperatures and changes in weather patterns due to climate change can lead to increased stress on plants, resulting in decreased growth and susceptibility to disease [10]. To respond to dramatic changes in climate, plants can shift their distributions to follow changing environments, shift their physiology to adapt to changing conditions while remaining in place, remain in isolated pockets of the unchanged environment (climate refugia), or, more often, become extinct [11]. Considering dramatic climate fluctuations in the Quaternary, the current distribution pattern of the Helleborus species should result from a series of events, including range shifts and species extinction [11]. Resolving the Quaternary biogeographic history of Helleborus is important for fundamental ecological and evolutionary science, and it is also crucial for addressing applied scientific questions about species’ responses to contemporary climate change.
Species distribution models (SDMs) are often used to understand environmental relationships and predict species distributions in both environmental and geographic spaces. SDMs are an important tool for conservation planners, ecologists, and natural resource managers [12]. SDM methods span from purely correlative methods (i.e., statistical assessments of relationships between species presence and a set of environmental variables) to purely process-based methods (i.e., explicit ecological relationships between environmental conditions and organism performance) [12]. Considering the limitation of demanding parameterization in process-based approaches, correlation-based SDMs have been widely applied because of their simplicity and the accessibility of software such as Maxent [13]. Meanwhile, different methods may have their own strengths and weaknesses. Ensemble modeling is reported to produce a more accurate and reliable prediction by combining the results of multiple individual models [14]. One of the most popular platforms for ensemble modeling is BIOMOD [15]. With the rapid development of Species Distribution Modeling (SDM) theory and technology, BIOMOD has become a powerful tool in several applications, particularly in ecology and conservation biology [12]. One of the main functions of SDM is to help us understand the niche of specific species. By modeling the relationships between species distribution and environmental variables, SDM can provide insights into the fundamental niche of a species or the set of environmental conditions under which it can persist [16]. Understanding the niche of a species can be crucial for conservation efforts, particularly in managing and restoring degraded habitats or identifying potential areas for reintroduction [16]. Another function of SDM is to identify suitable habitats for wildlife and assist in conservation efforts [12]. By projecting potential distribution across regions and periods, SDM can identify areas where species may be at risk of habitat loss or fragmentation [7]. This information can be used to prioritize areas for conservation and restoration efforts, as well as to inform land-use planning and decision-making [17]. Meanwhile, the utilization of SDM can facilitate the identification of regions that have undergone less pressure in the face of both past and present climatic changes, referred to as refugia [11,18]. The reconstruction of glacial refugial history has greatly contributed to our comprehension of the mechanisms underlying species’ responses to environmental changes, which can, in turn, provide valuable insights into their evolutionary capacity [19]. Furthermore, predictions of future refugia under conditions of climate change hold significant implications for wildlife conservation and reintroduction efforts [18,20].
The purpose of this study is to predict the distribution dynamics of H. thibetanus from the Last Glacial Maximum to the near future under climate change, which is helpful for its conservation and utilization. To achieve this objective, (1) we conducted a systematic review of occurrences of H. thibetanus and constructed an ensemble species model based on three different algorithms. (2) We detected the proximal climatic variables that affected the distribution of H. thibetanus and explored their optimal limits. (3) We explored the climatically suitable habitats under current climate conditions and projected the paleo-distribution of H. thibetanus after the Last Glacial Maximum. (4) We predicted the future potential distribution of H. thibetanus under different climate change scenarios and evaluated the extinction risks among current distribution regions.

2. Materials and Methods

2.1. Occurrence Data and Distribution Range

A total of 302 specimen records of H. thibetanus were collected from 3 Chinese specimen platforms of plants, including the Chinese Virtual Herbarium (www.cvh.ac.cn, accessed on 31 July 2022), the Chinese Teaching Specimens Platform (http://mnh.scu.edu.cn/, accessed on 31 July 2022), and the China Nature Reserve Specimen Resources (www.papc.cn, accessed on 31 July 2022). Records without images or with uncertain locality were filtered, and then each record was identified manually to filter for those with possible taxonomy mistakes [1]. A total of 104 clean records were generated. Considering the possible bias caused by spatial autocorrelation [21,22], we thinned our occurrence records using the thin function of R package spThin [23], which generated a thinned dataset through a randomization algorithm and ensured distances among all records were above a minimum distance (10 km in this research). Finally, a total of 66 occurrences records were subjected to further analysis.
A distribution range was generated to sample pseudoabsence or background records. Firstly, the mean pairwise geographical distance of 66 thinned occurrences records was calculated by sp packages [24] in R. Then, buffers of each thinned occurrence record with a radium of the mean distance were generated and merged by raster package [25], which was treated as the current possible distribution range of H. thibetanus.

2.2. Environmental Data and Correlation Analysis

Considering our object of tracing dynamic distribution history and estimating future distribution loss risks under climatic change, a total of 19 bioclimatic data [26] (Table 1) were initially selected and downloaded from the Chelsa Climatic Database, Version 2, accessed on 31 July 2022 (the download path is listed in Supplementary File S1). Data from the period of 1981~2010 was used to construct species distribution models, in which most specimens were recorded. To estimate the risks under climate change, 2 shared socioeconomic pathways (ssp) scenarios (ssp126 and ssp585) from CMIP6 (https://esgf-node.llnl.gov/projects/cmip6/, accessed on 31 July 2022) were selected, which represent two contrasting scenarios of future greenhouse gas emissions, with ssp126 assuming a rapid and sustained reduction in emissions and ssp585 assuming a continued increase in emissions throughout the 21st century [27]. Specifically, datasets of 3 global climatic models (GFDL-ESM4, PSL-CM6A-LR, and MRI-ESM2-0, the download path is listed in Supplementary File S1) in the period of 2071~2100 under each scenario were downloaded to balance the possible bias generated by global climatic models. To trace historical distribution dynamics, modeled bioclimatic data of 6 historical periods (BC22K, BC18K, BC14K, BC10K, BC6K, and BC2K), ranging from 22 thousand years before the current period (BC22K) to 2 thousand years before the current period (BC2K), were also downloaded from the Chelsa Climatic Database (https://chelsa-climate.org/chelsa-trace21k/, accessed on 31 July 2022) [28]. All of the climatic data above are downloaded with a resolution of 30 arcsecs.
The function vifstep of R package usdm [29] was applied to reduce the multicollinearity between bioclimatic variables, in which the maximum number of observations within the training area was set to 10,000, and the thresholds of the correlation coefficients and vif were set to 0.8 and 5. Consequently, 6 bioclimatic variables (Table 1) were selected for further analysis.

2.3. Species Distribution Model Tuning and Construction

We applied 3 different algorithms to the following modeling, including maximum entropy (MaxEnt) [13], random forests (RF) [30], and flexible discriminant analysis (FDA) [31]. All were implemented in the R package of biomod2 (v4.2.3) [15]. The 70 thinned occurrence records and 6 bioclimatic variables obtained above were subject to tuning and constructing species distribution models. The best parameters of each algorithm were tuned through the function of BIOMOD_Tuning, which ran numerous models with different parameters and evaluated each with True Skill Statistics (TSS). In the process of model construction, 3 sets of pseudoabsence records were sampled from the distribution range, and 10 duplicate models were constructed for each data set and each algorithm; that is to say, we generated 90 single models total. In every single model, 70 percent of the input data were used to calibrate the model, while the remaining 30 percent was used to evaluate the model. Other model parameters were set according to the result of model tuning [12,32]. To balance the possible bias produced by a single run or algorithm, we only maintained models with a TSS value above 0.8 and then ensembled left models through the weight of the TSS value with the prob.mean.weight option [32]. The importance of each bioclimatic variable in modeling was calculated based on the ensembled model through the bm_VariablesImportance function in BIOMOD2 with a replicate time of 30 and summarized by mean value and standard deviation value, and then scaled to ensure the sum of the mean values is 1. The responsive curve of the proximal bioclimatic variables was plotted through the bm_plotresponcse function based on the training data [33] and the MaxEnt algorithm.

2.4. Potential Distribution Prediction and Geographical Analysis

The potential distribution under different scenarios of H. thibethanus was projected using the ensembled model through the BIOMOD_Forecasting function in the Biomod2 package. Firstly, we predicted the current potential distribution of H. thibetanus with the bioclimatic training data. For an exploratory analysis of the historical distribution dynamic of H. thibethanus, we projected its potential distribution in 6 historical periods (BC22K, BC18K, BC14K, BC10K, BC6K, and BC2K). Finally, projections under future scenarios were made for the purpose of evaluating its habitat risk under climate change.
Values below the threshold maximizing the TSS were masked by NA in each prediction result, and then a fitness map under each scenario was plotted. To further compare geographical changes of potential distributions under different scenarios, continuous probability maps were transformed into binary maps through a threshold that maximized the TSS. Regional areas and distribution centroids were then calculated with the help of the SDMTools package [34]. All of the figures in this research were plotted using QGIS (www.qgis.org, version 2.6.2) and the ggplot2 package [35].

3. Results

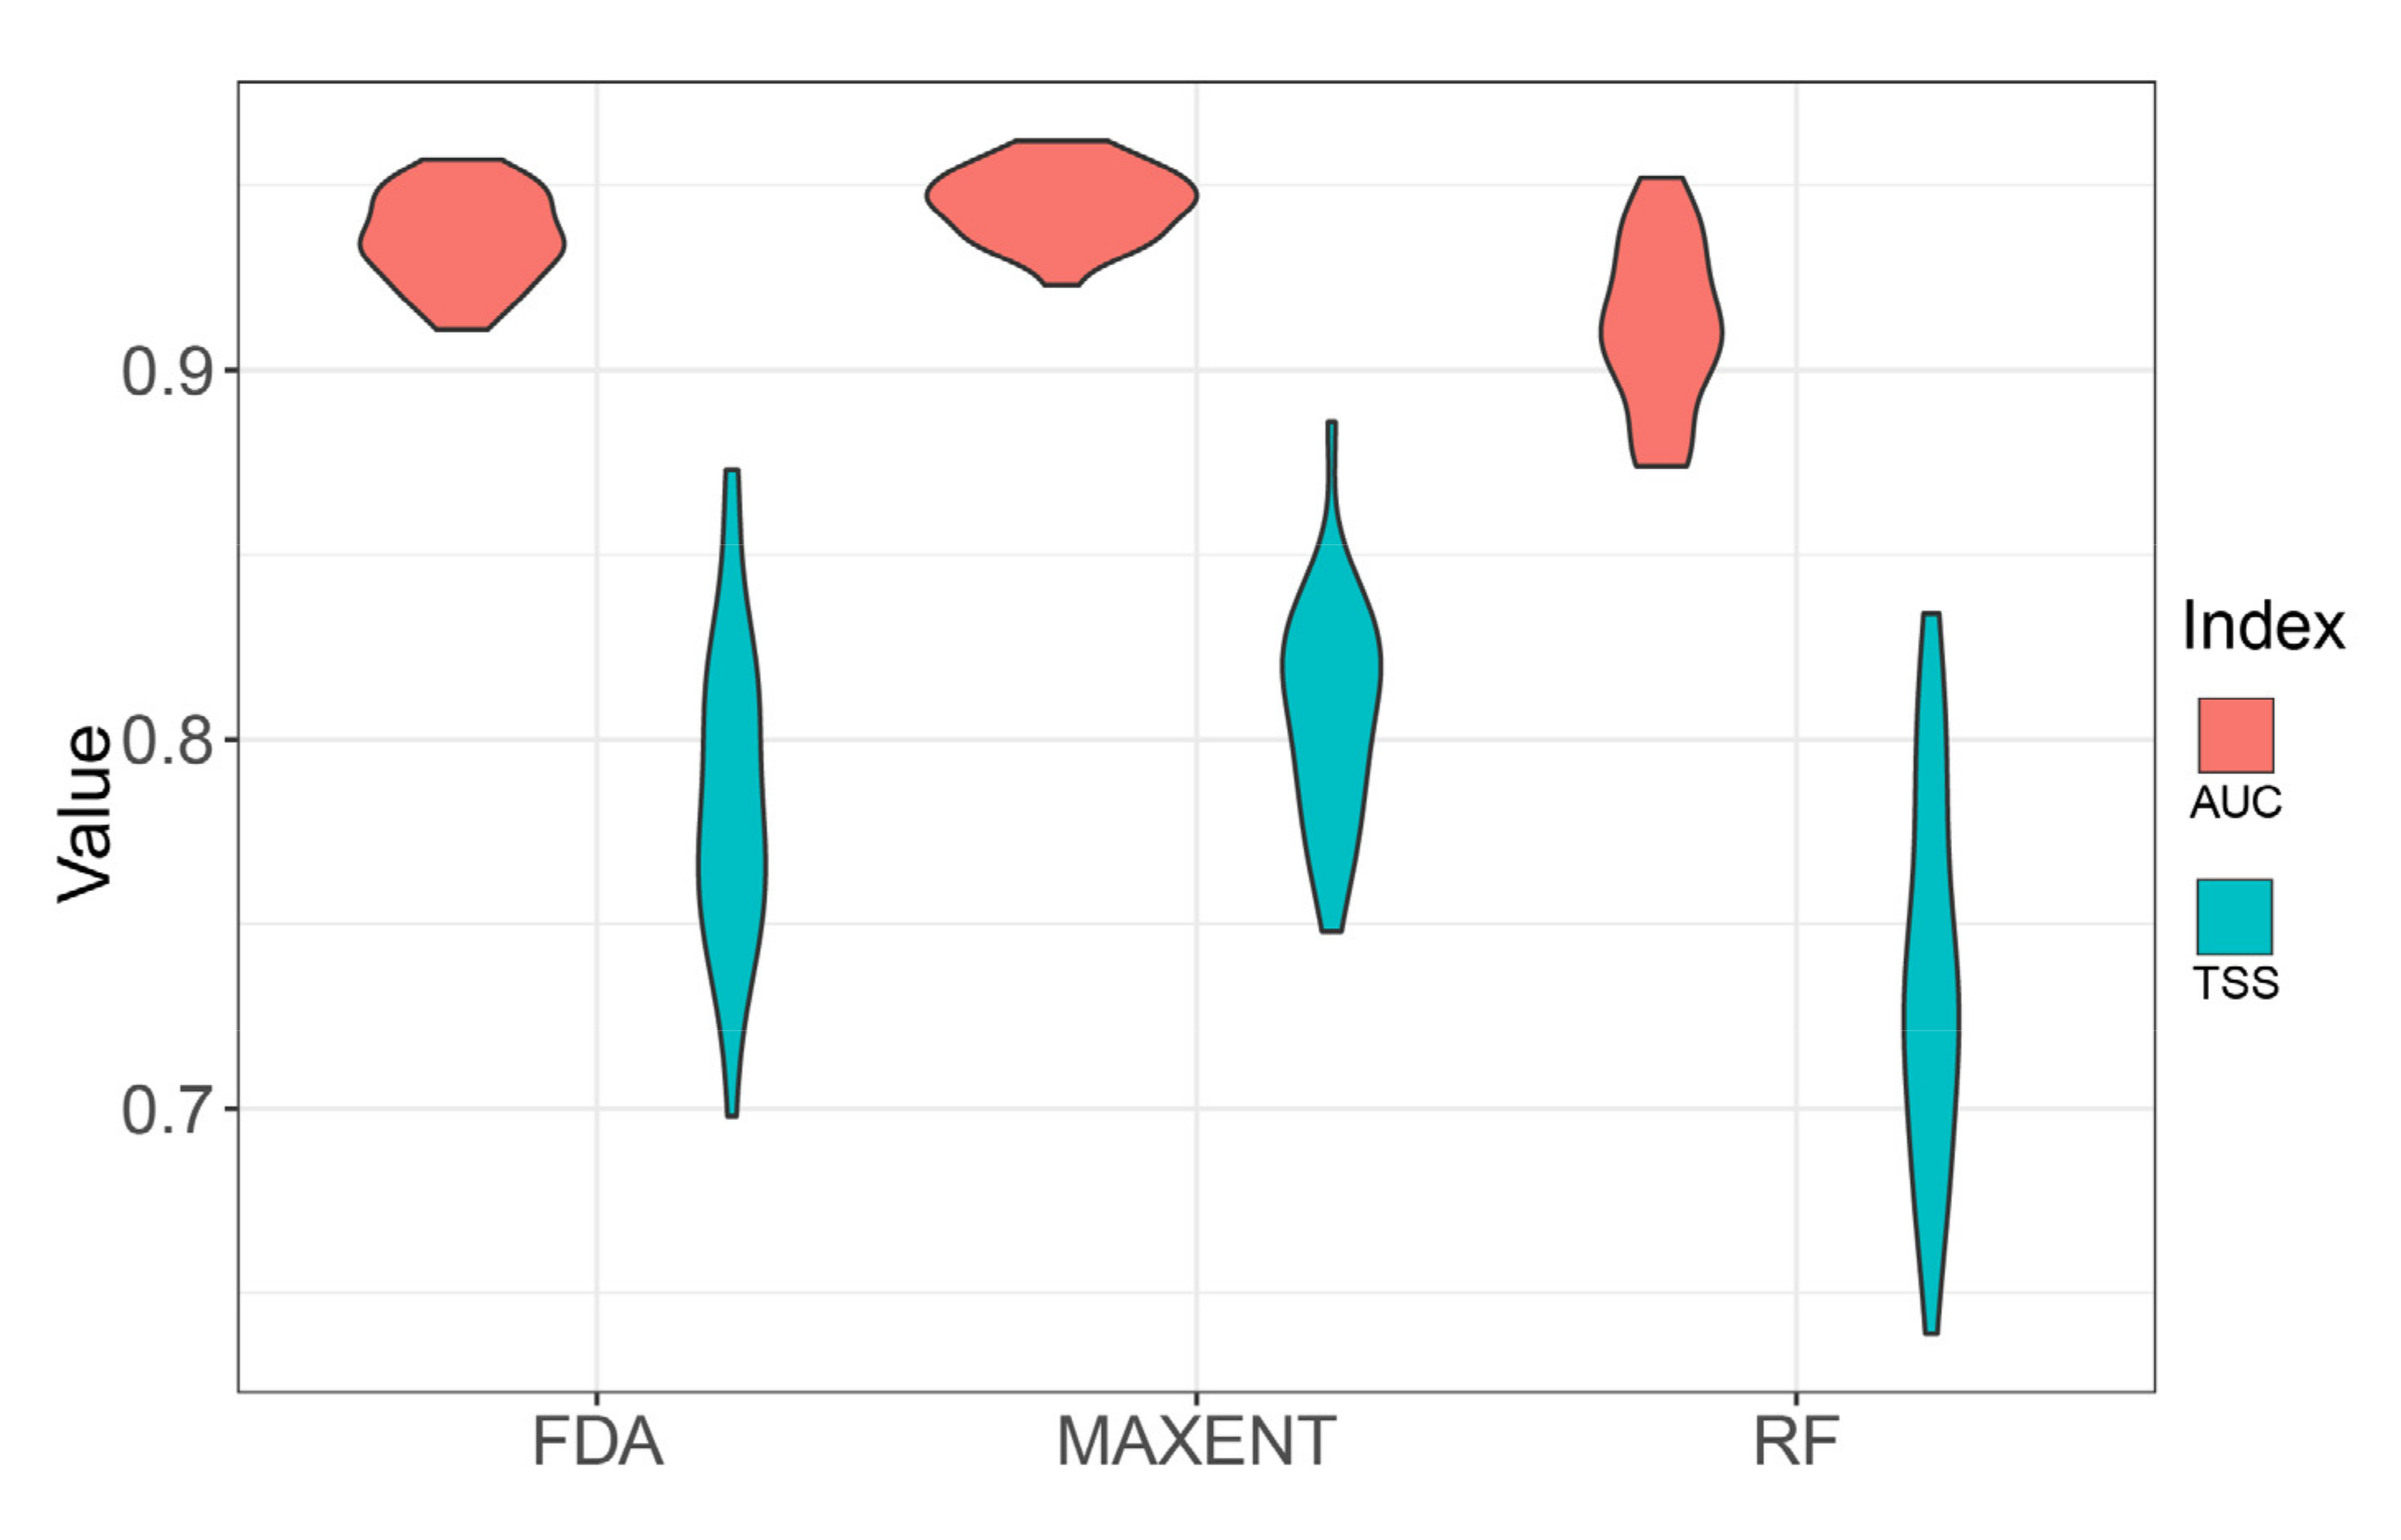
3.1. Single Model Accuracy and Ensembled Models

Single model accuracy based on AUC and TSS is illustrated in Figure 1, which refers to MaxEnt obtaining the highest mean AUC (0.944) and TSS (0.810). Most single models were shown to be high quality, which indicates that the model’s prediction effect was excellent and that the prediction results had high accuracy and reliability. To further ensure high accuracy and reliability, we only maintained single models with TSS > 0.8 and ensembled them for further prediction analysis.

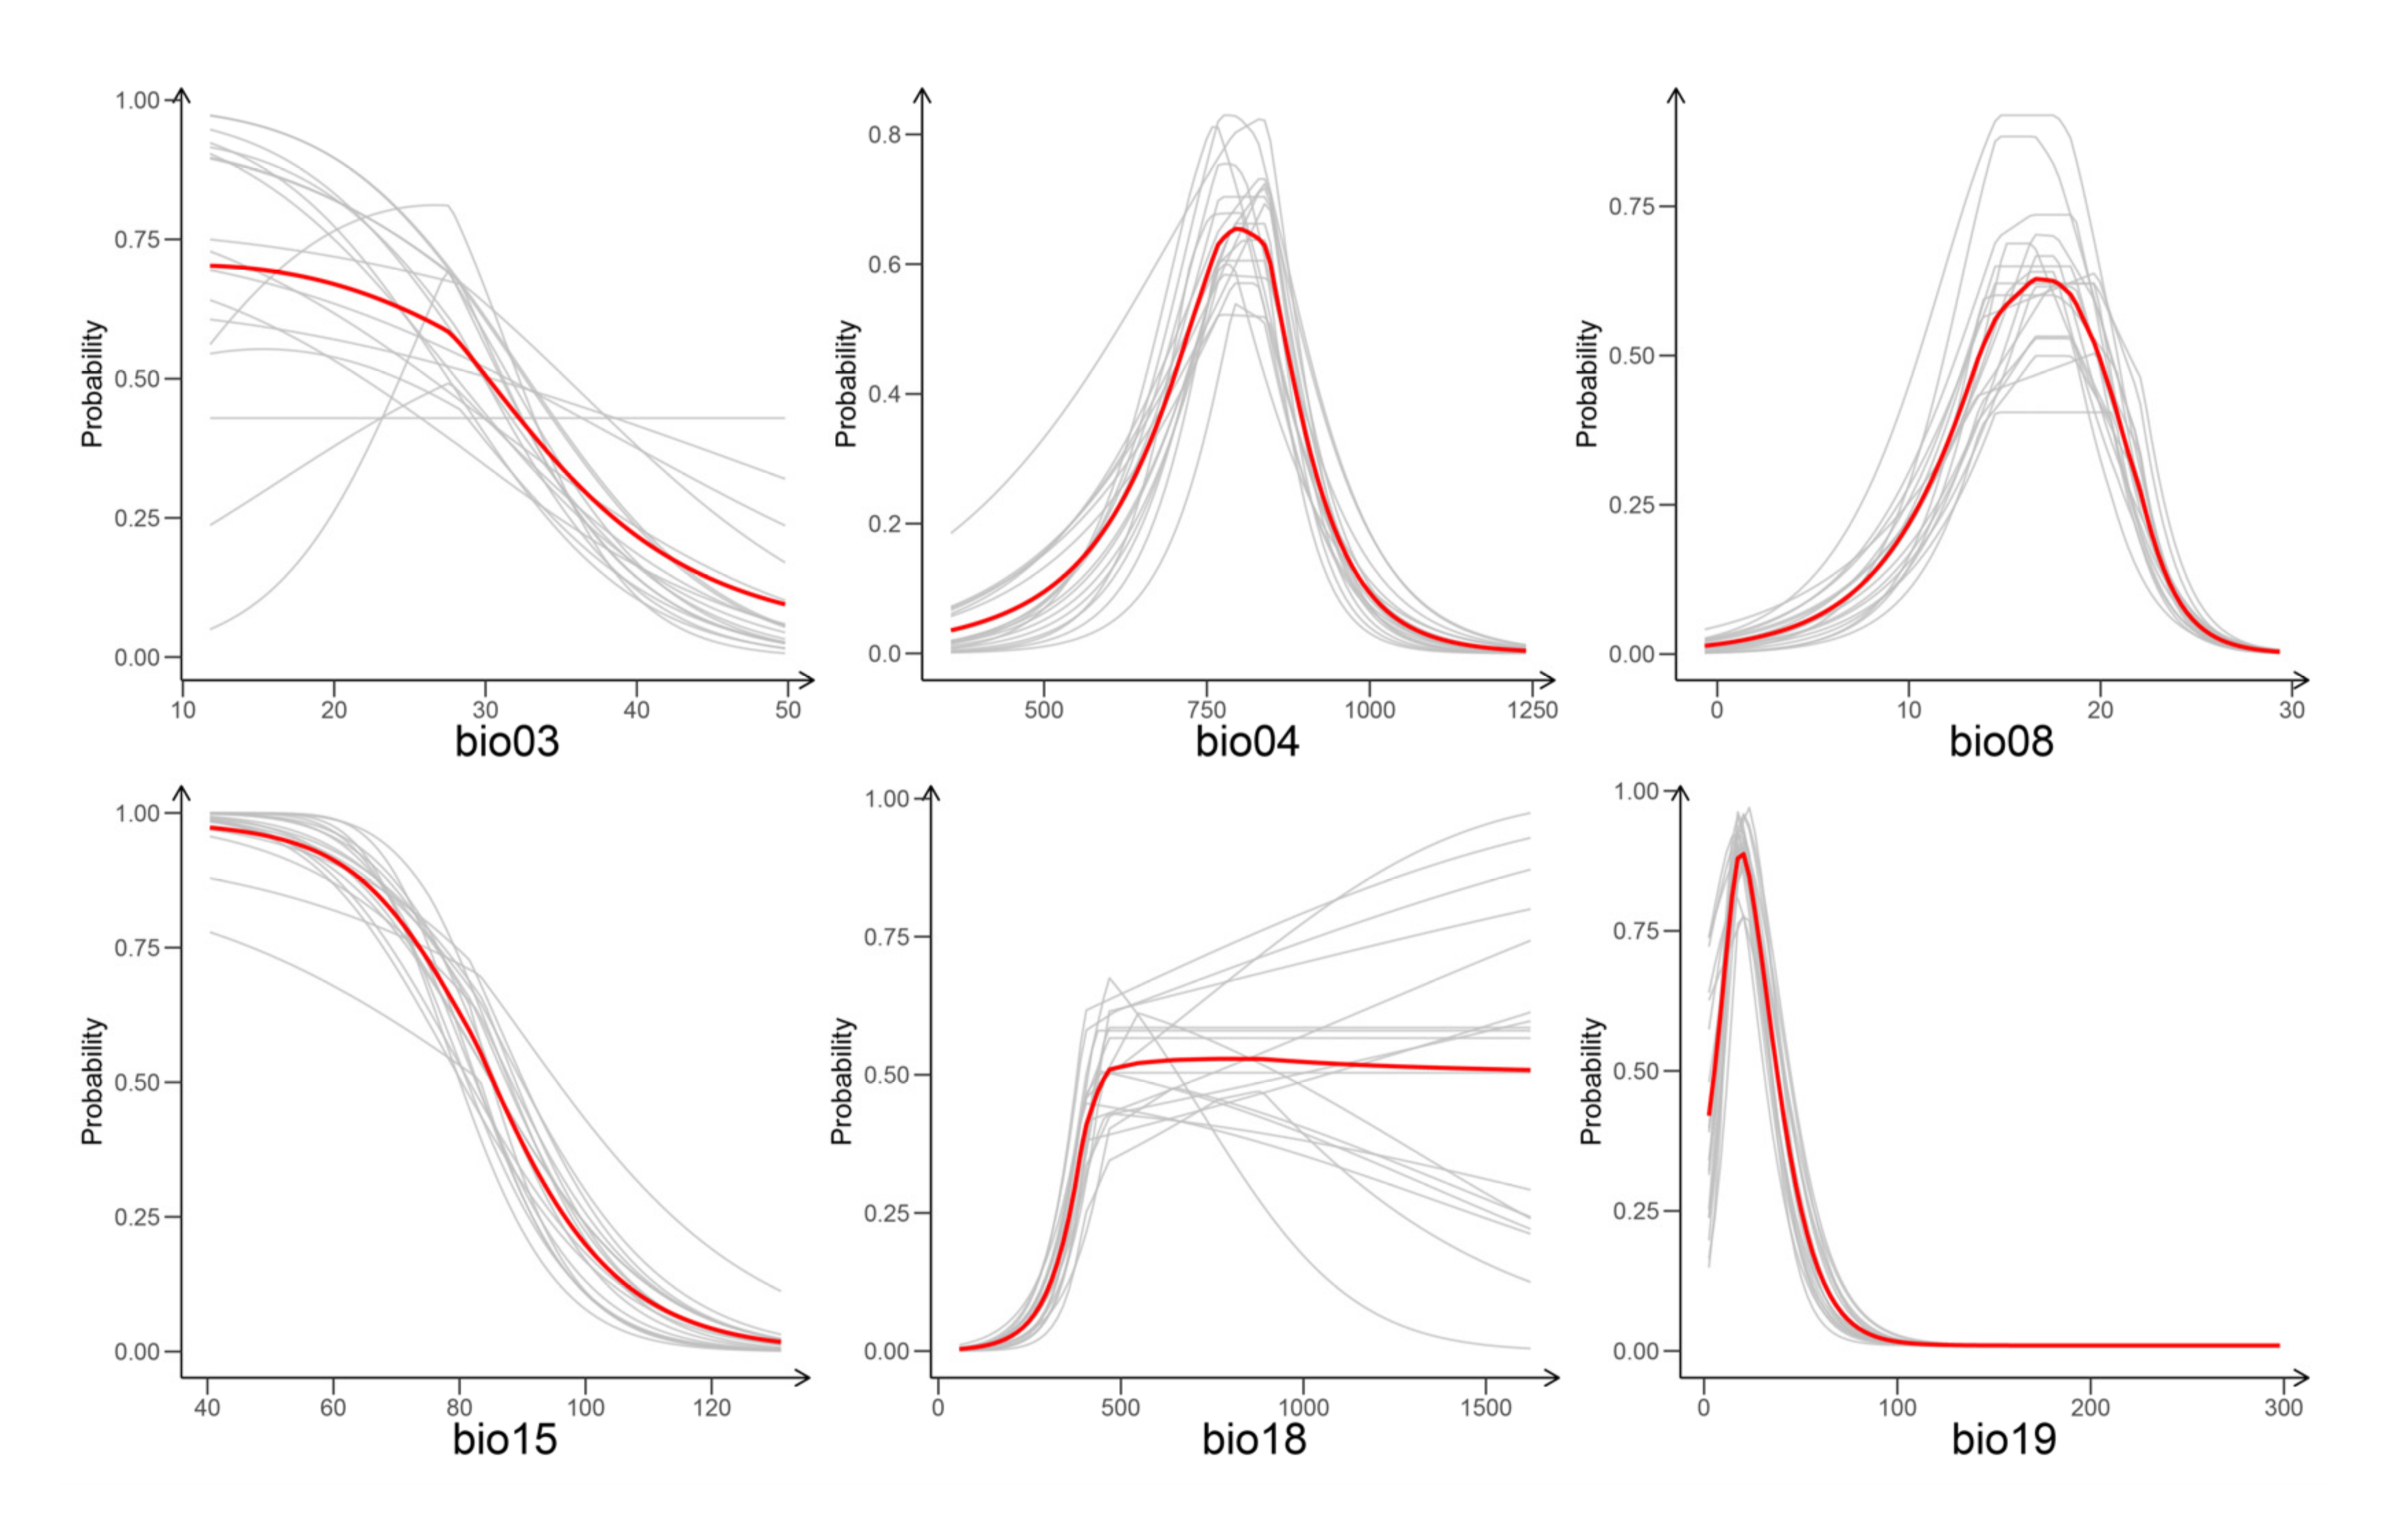
3.2. Climatic Niche and Proximal Variables

The importance values of the six modeled climatic variables are listed in Table 1. As the table shows, three bioclimatic variables (bio19, bio08, bio04, and bio18) contributed the most to the prediction model. Bio19 had the highest importance (33.09%) in the prediction model, while bio03 had the least importance (2.20%) in the prediction model.
The bioclimatic niche of H. thibetanus can be described using a suitable range of multiple climatic variables, which can be displayed using the model’s response curve. As Figure 2 shows, most proximal bioclimatic variables (bio19, bio08, and bio04) are single-peak curves. Specifically, the most suitable range (distribution probability above 0.5) of bio19 (precipitation of the coldest quarter) is between 5.48 and 35.32 mm, and the peak at 20.40 mm. The most suitable range of bio08 (mean temperature of the wettest quarter) is between 13.59 and 19.96 °C, and the peak at 16.62 °C. The most suitable range of bio04 (temperature seasonality) is between 7.23 and 8.65 °C, while the peak is 7.94 °C. The response curve of bio18 (precipitation of warmest quarter) is not a peaked curve, which reached a distribution probability of 0.5 at 452.70 mm, followed by a maximum probability of 0.53 at 768.70 mm, and then remained stable as precipitation rose.

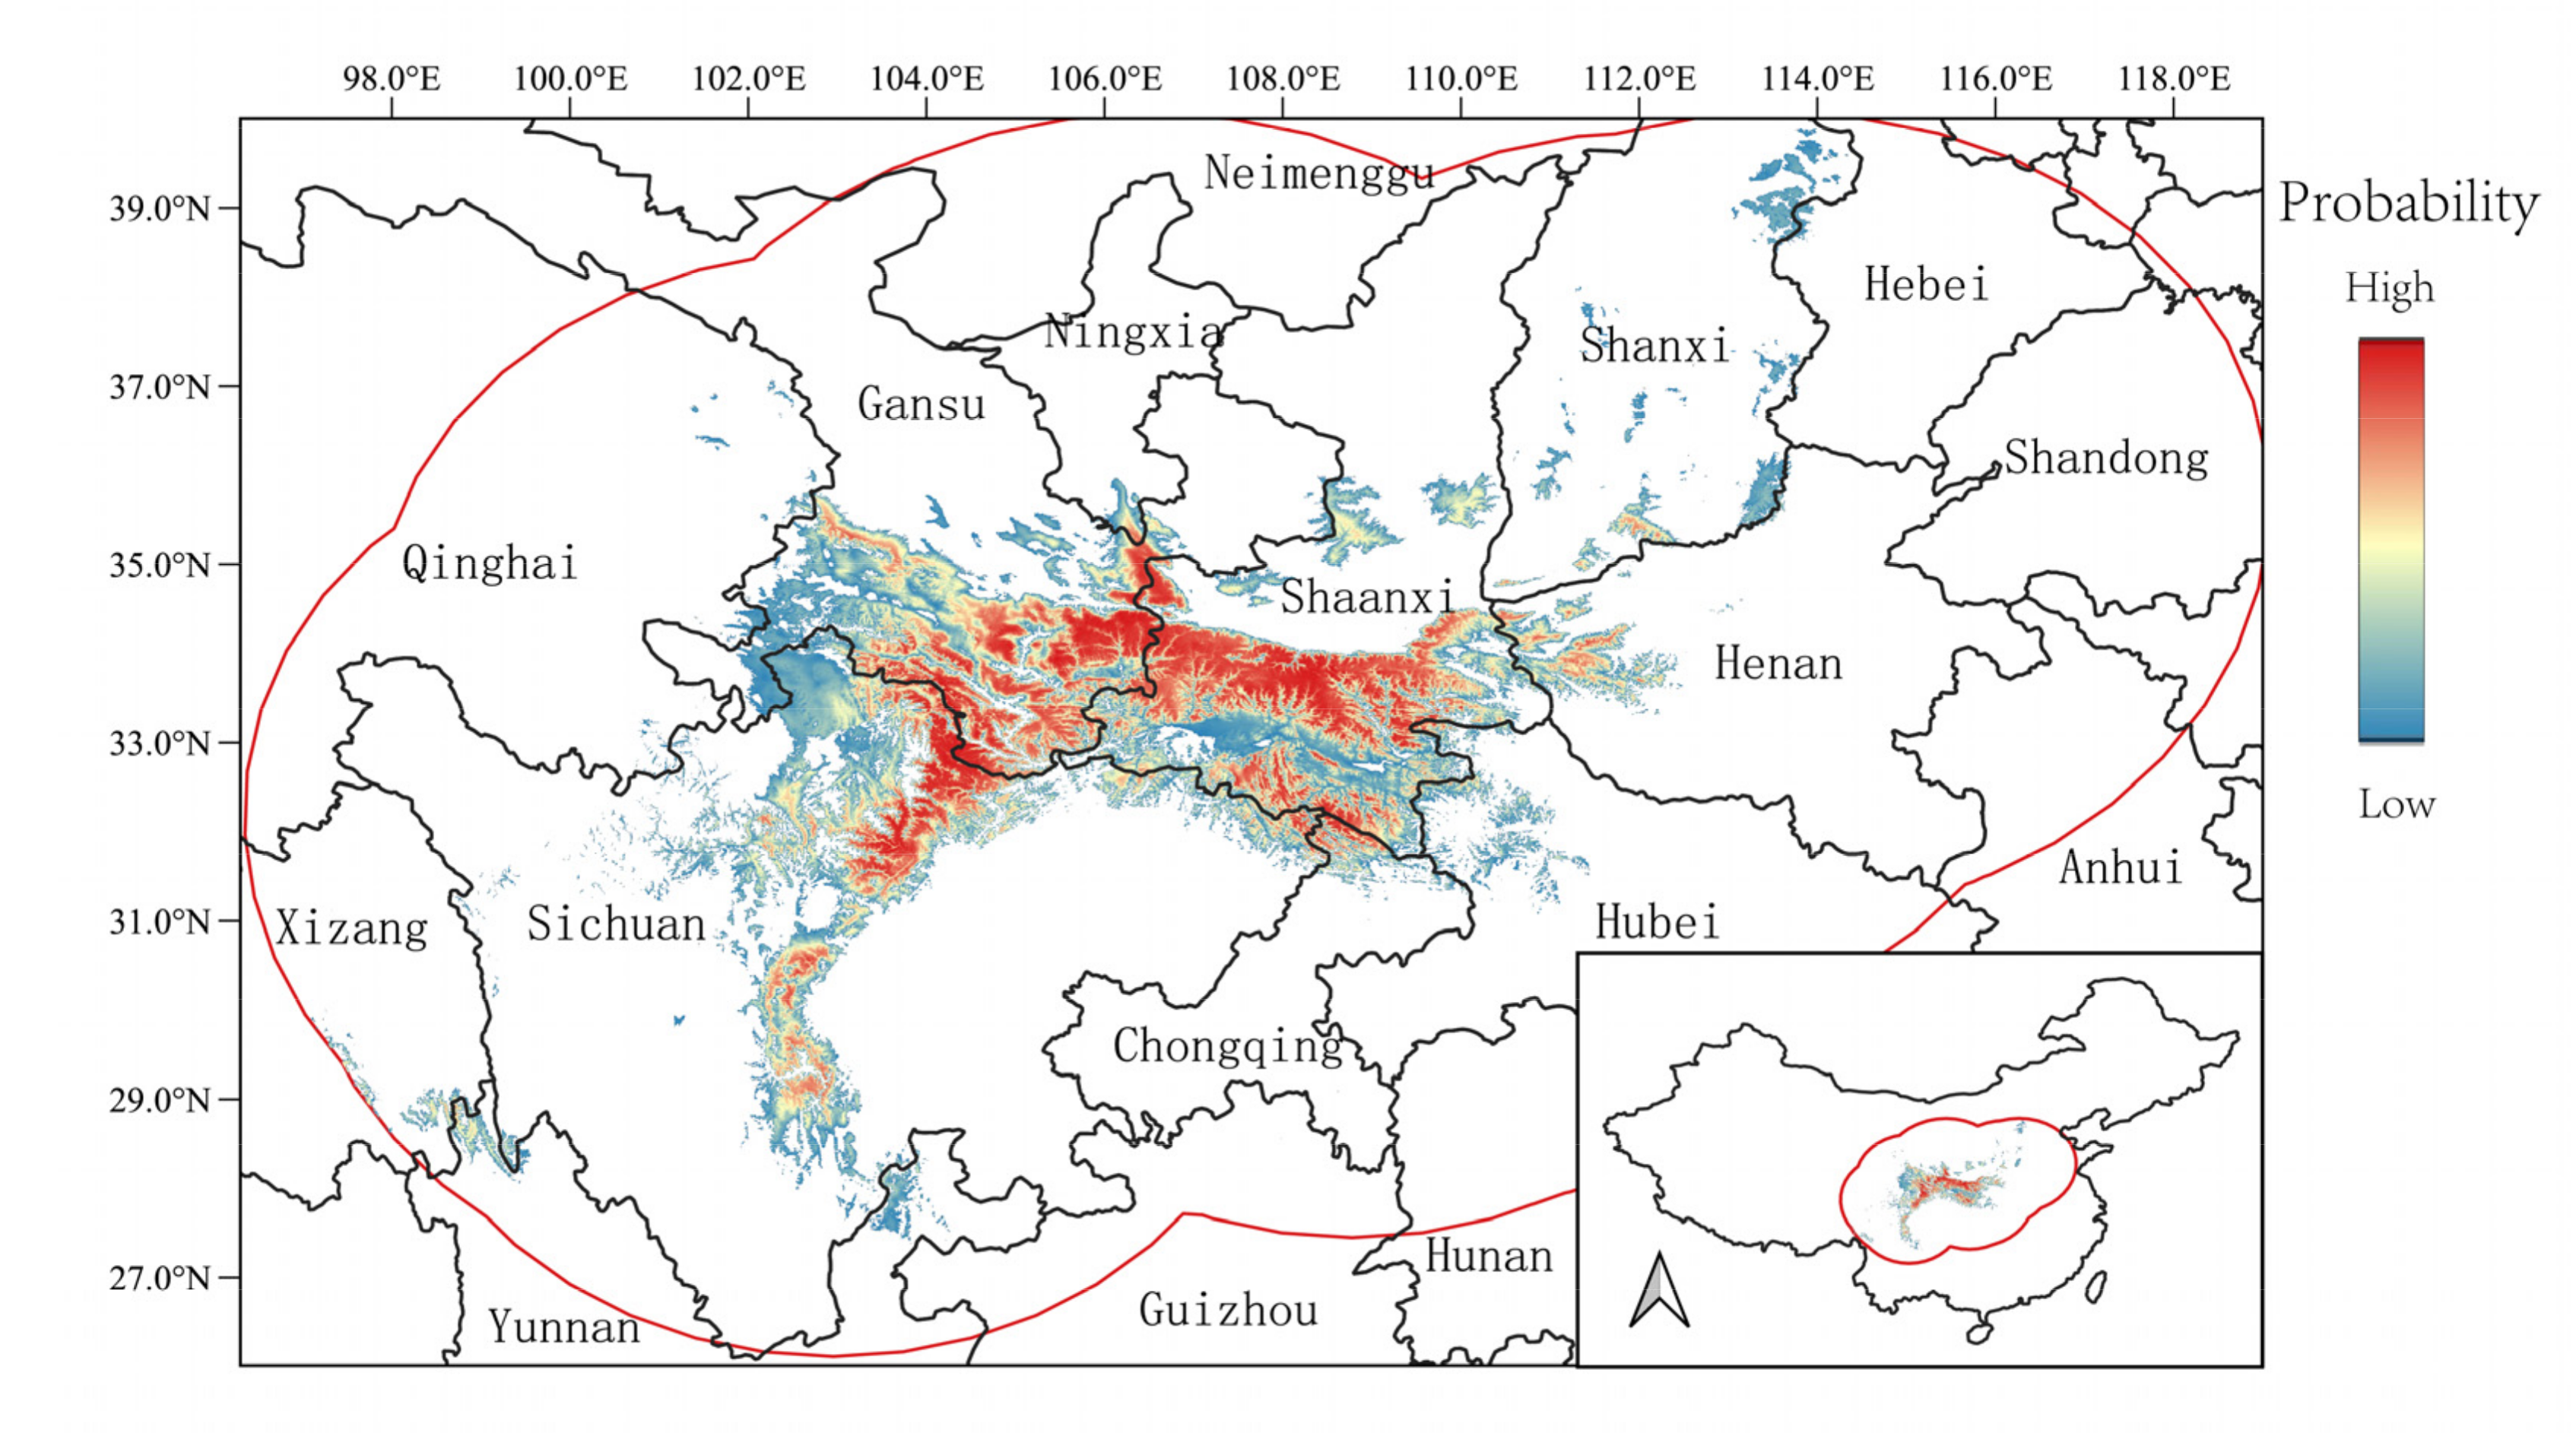
3.3. Current Potential Distribution of H. thibetanus

The current potential distribution of H. thibetanus was predicted using ensembled species distribution models. As Figure 3 shows, H. thibetanus is mainly located in three provinces (Shaanxi, Gansu, and Sichuan), although fragments can be found in some provinces (Xizang, Shanxi, Hubei, and Henan) that are also predicted to be suitable. The most highly suitable regions (which have higher prediction values) are located in Southern Gansu, Southern Shaanxi, and Northern Sichuan, corresponding to the Qinling mountains, Daba mountains, and northern Hengduan mountains.
According to the binary results, the total area of the current potential distribution of H. thibetanus is 287,556 km2. Sichuan had the largest area (85,678 km2) of suitable habitats for H. thibetanus, followed by Shaanxi (84,828 km2) and Gansu (72,488 km2). These three provinces accounted for a cumulative 84.5% of all suitable regions.

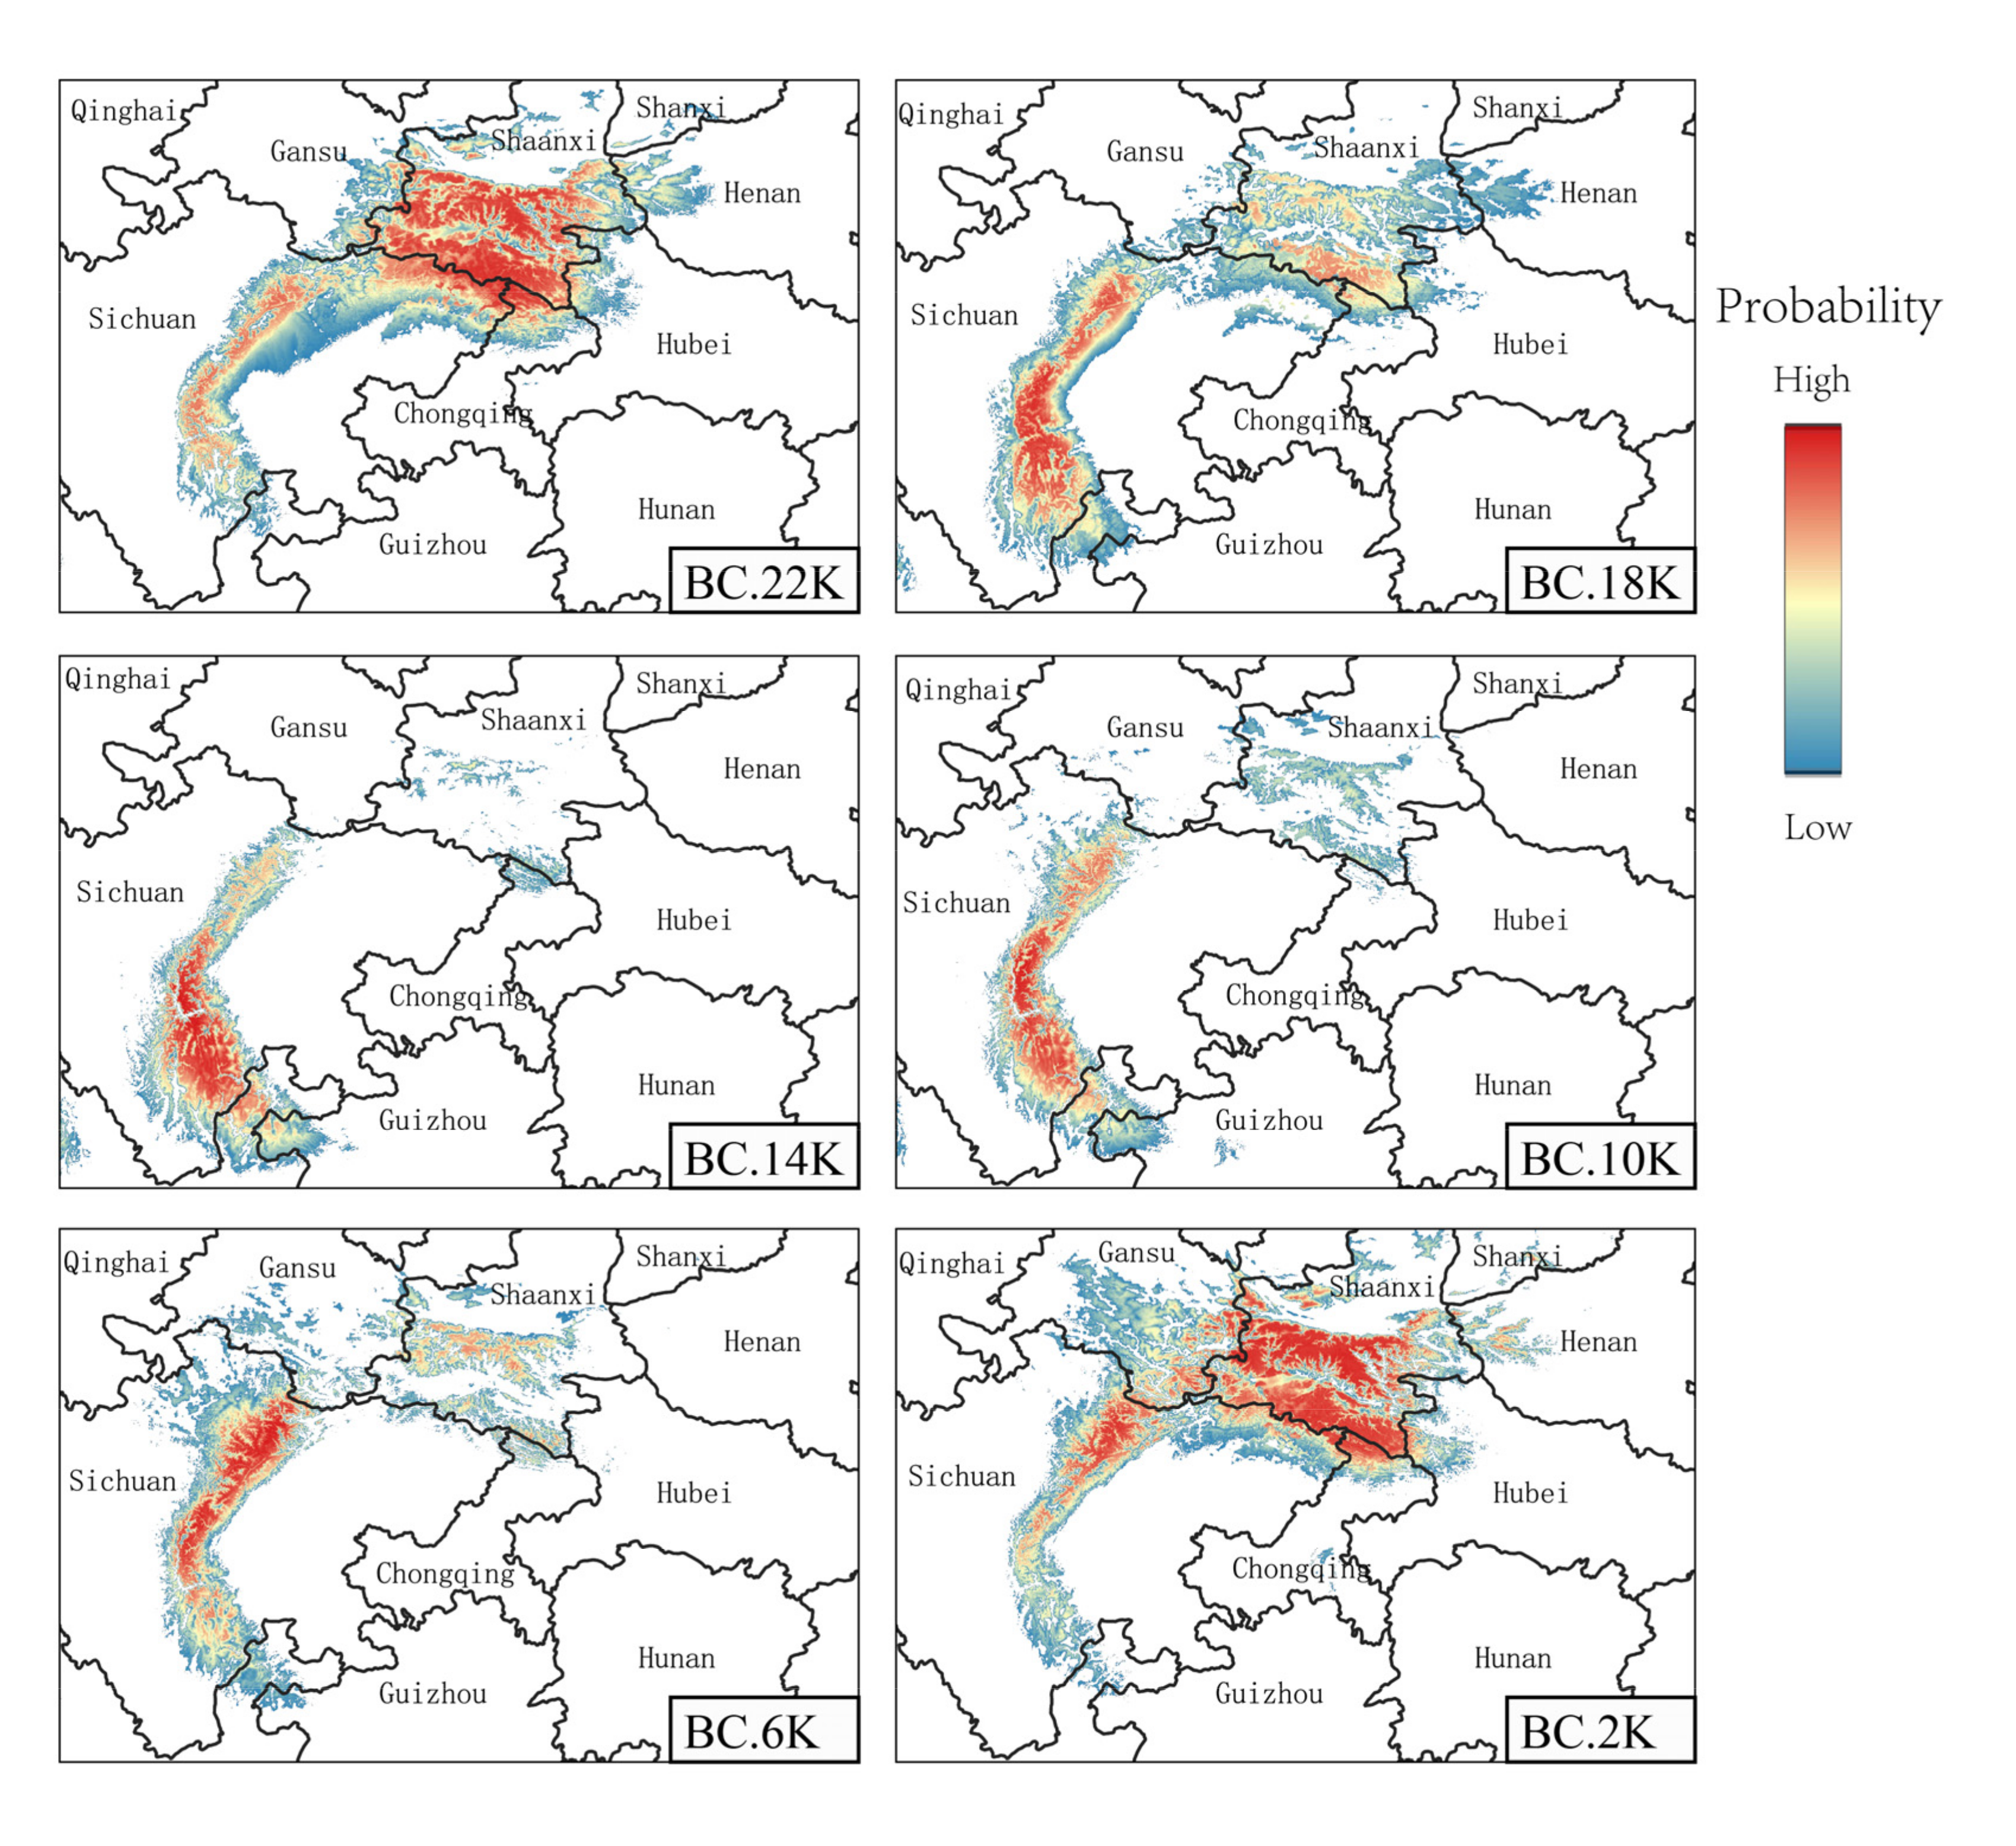
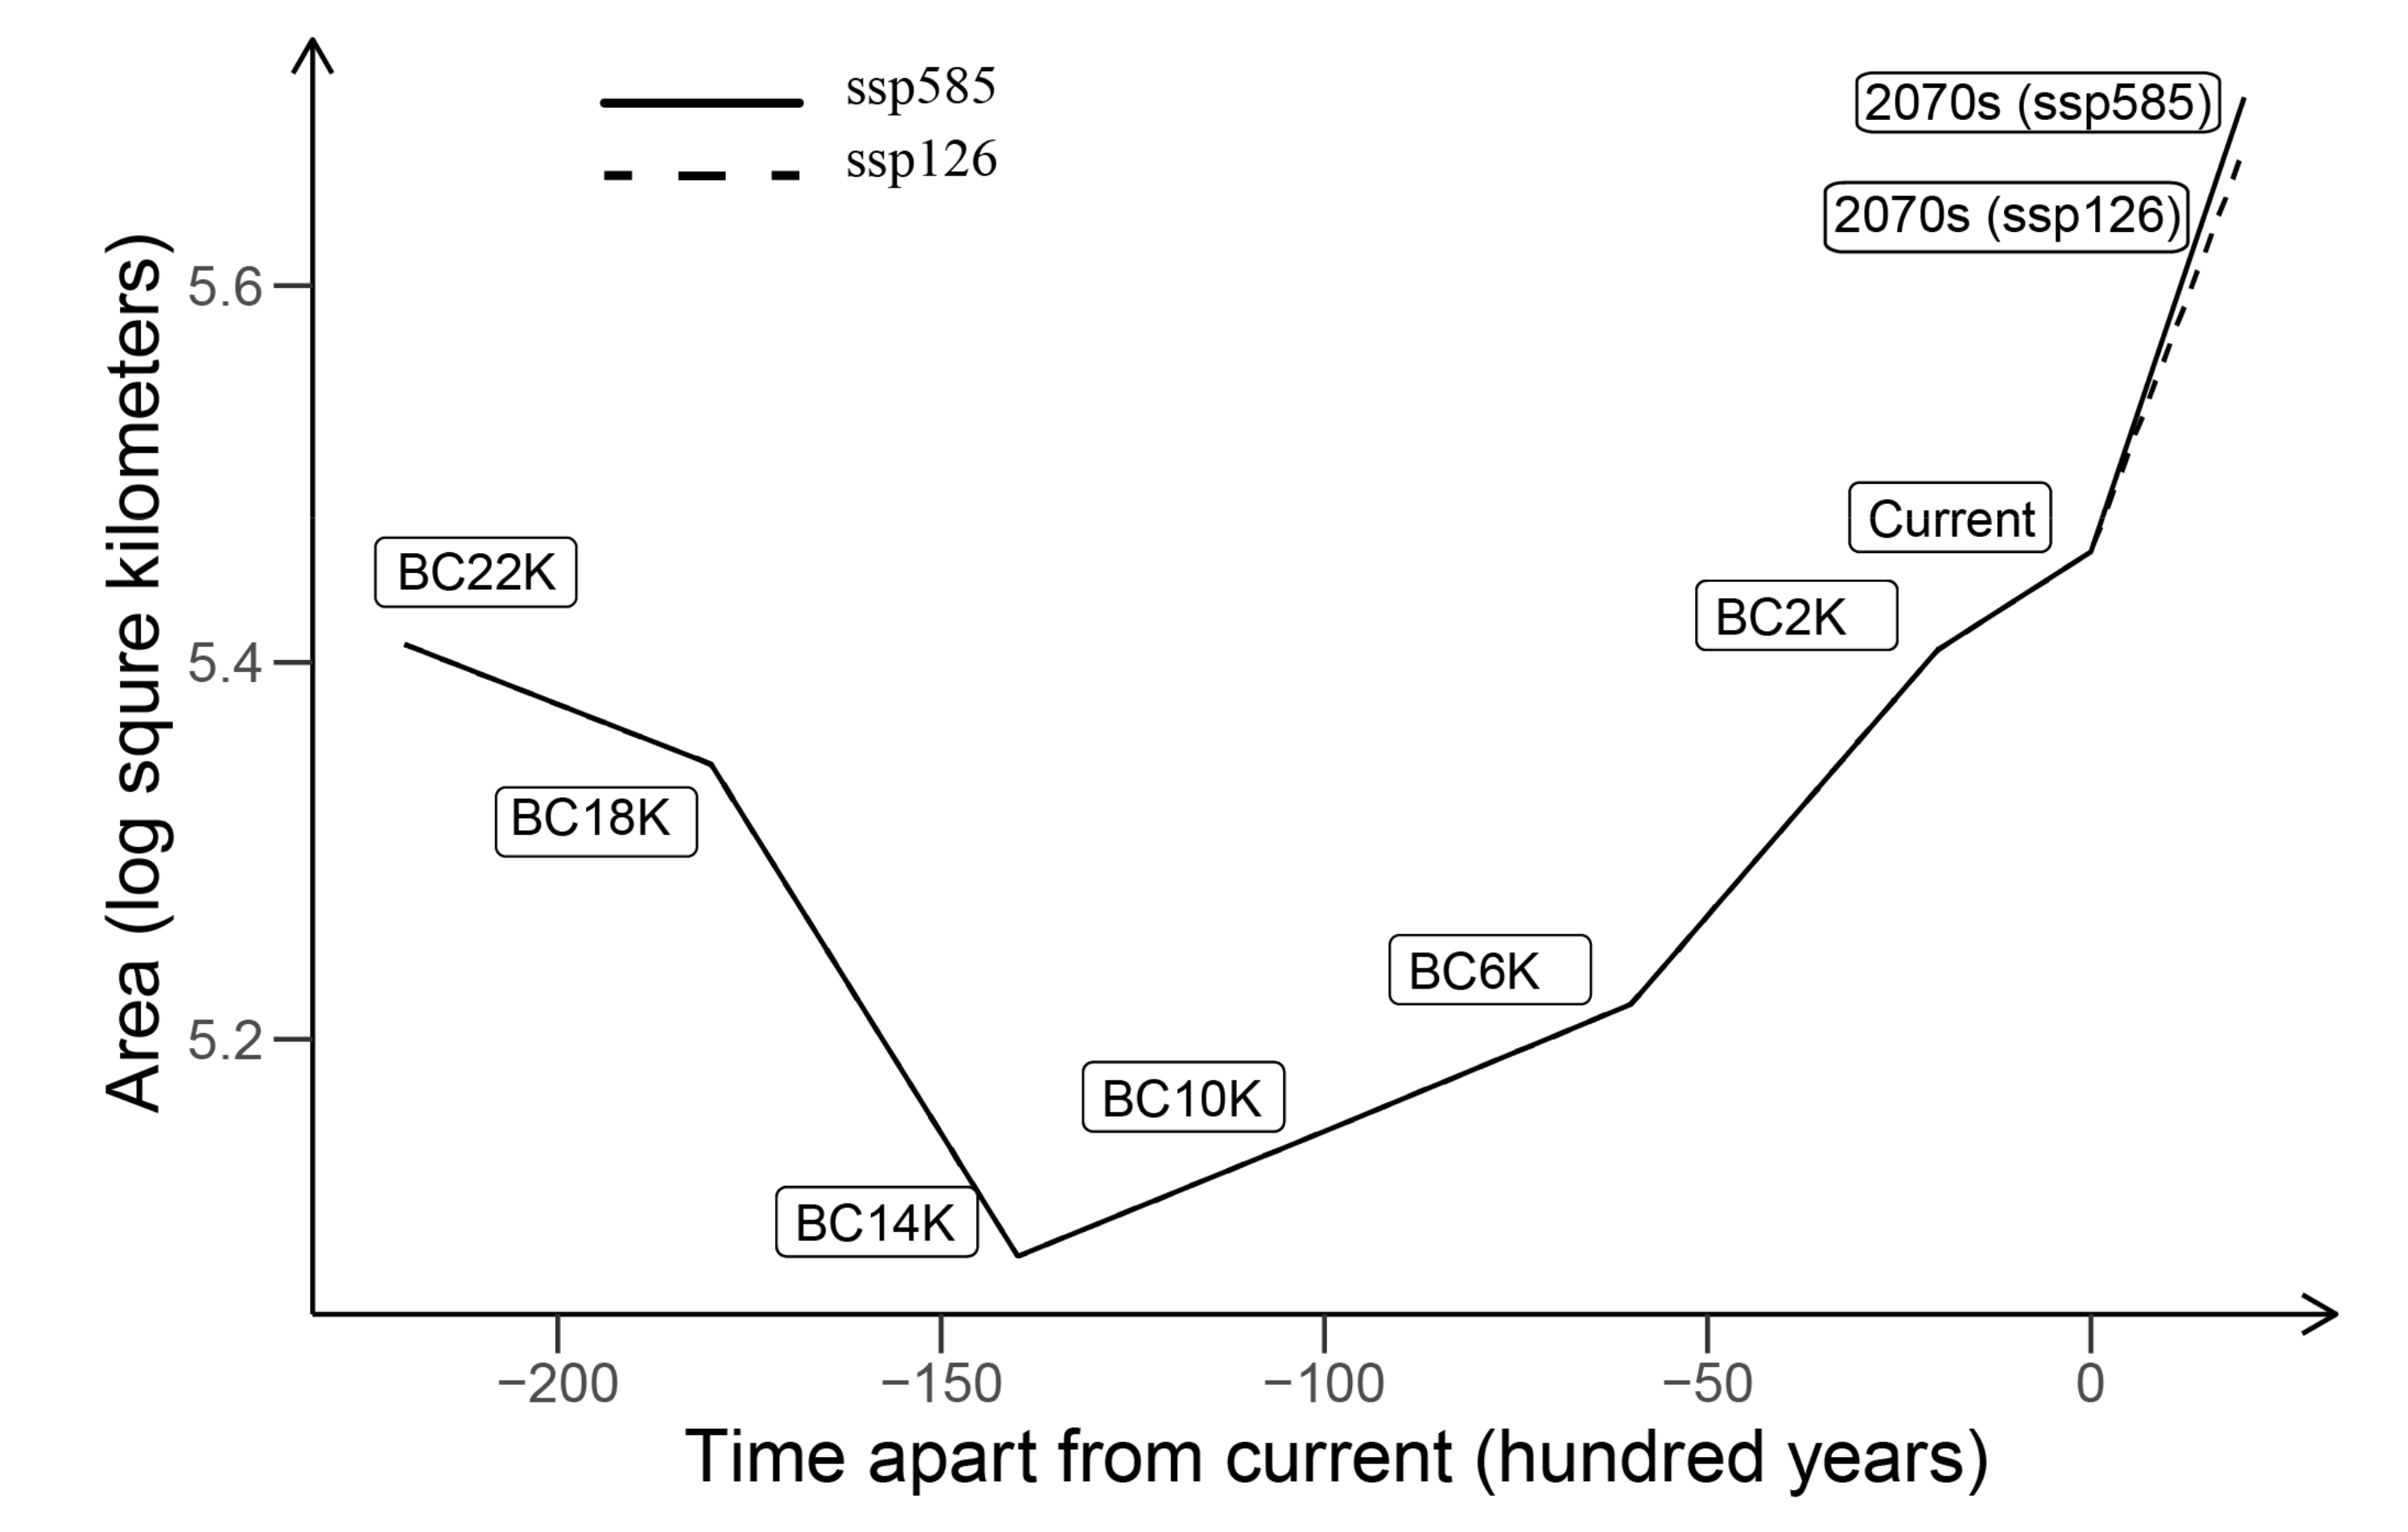
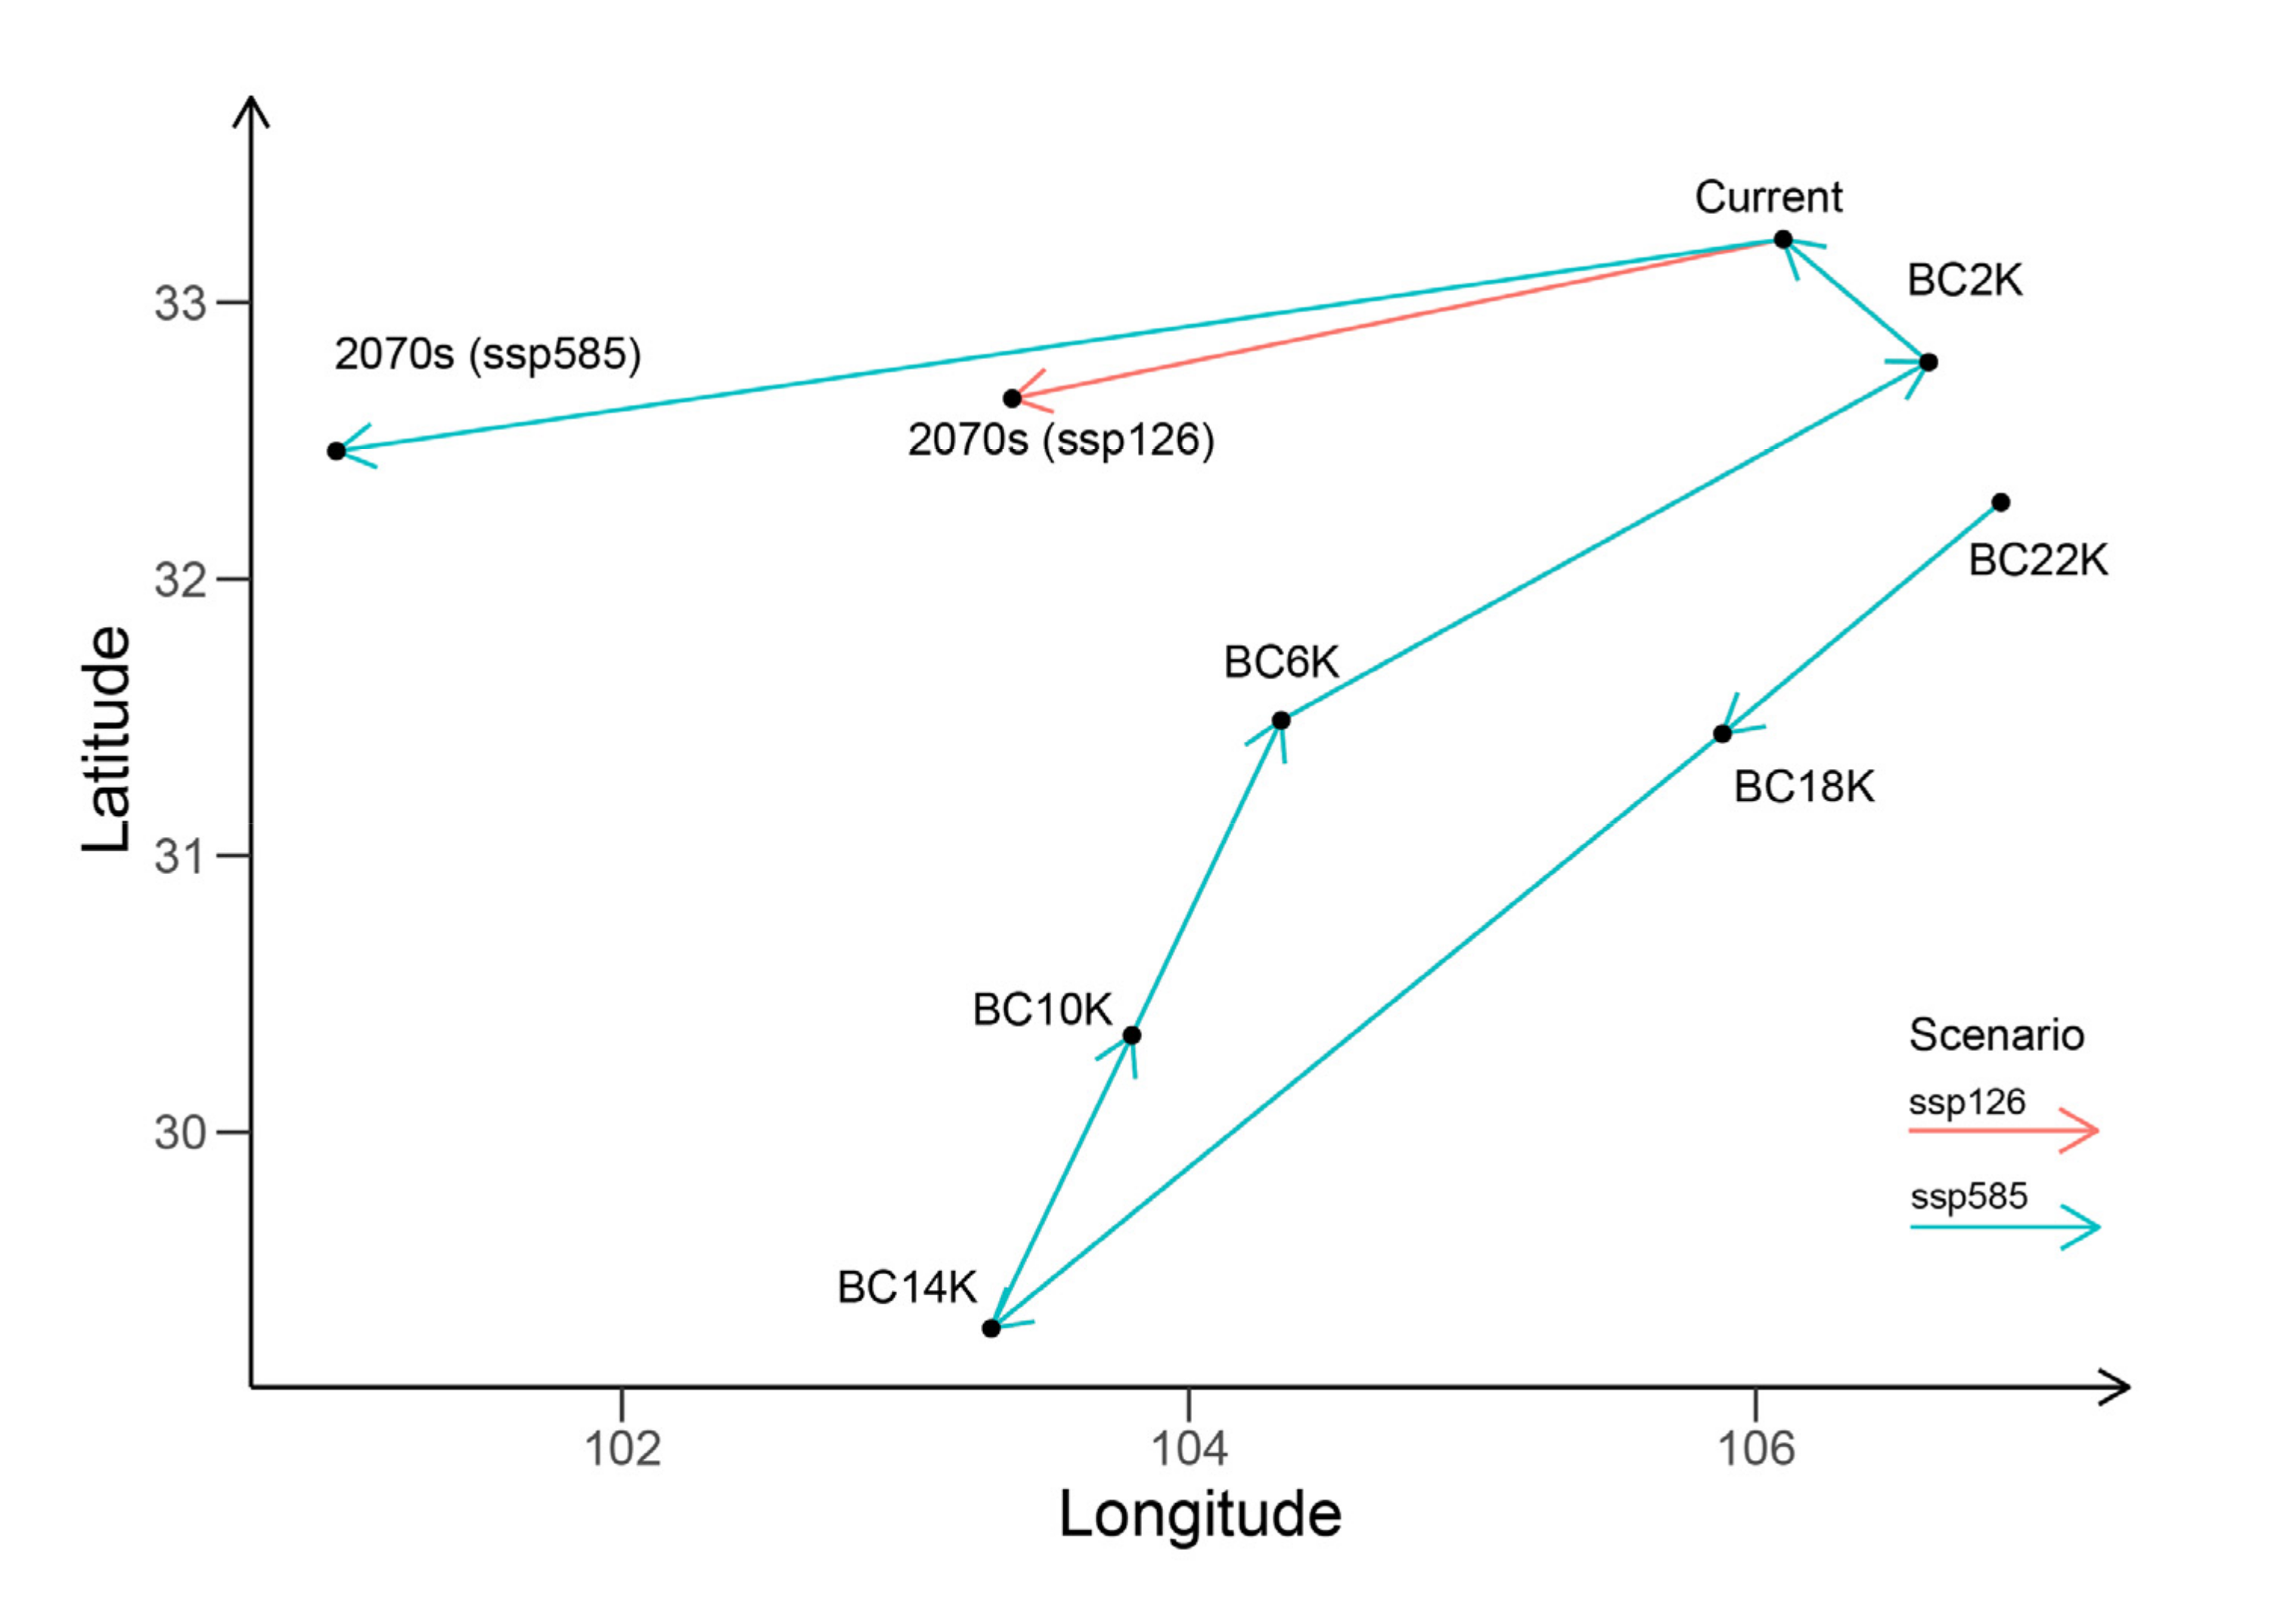
3.4. Paleo Potential Distribution and Historical Dynamics

The paleo potential distribution of H. thibetanus (Figure 4) was predicted based on paleo bioclimatic data. It predicted a wider potential distribution of H. thibetanus in the period BC22K (22 thousand years before the current year) than the current scenario, which covers most regions in southern Shaanxi and northern Sichuan and extends to the southern Hengduan mountains. Four thousand years later, the predicted potential distribution in BC18K is mainly located in southern Sichuan, and most current potential regions in Shaanxi were predicted to have low suitability. This trend persisted at least until BC10K, and it was predicted that nearly all current potential regions in Shaanxi were unsuitable for H. thibetanus between BC14K and BC10K. In the next 10 thousand years, the suitability of Sichuan would decrease, while the suitability of Shaanxi and Gansu would increase, resulting in the current potential distribution pattern of H. thibetanus.
The areas of the three types of suitable regions and the centroid of potential distribution were calculated. As shown in Figure 5, the area of the suitable regions in BC22K is 256,836 km2, and the following area dynamics can be divided into two periods. In the period of BC22K~BC14K, the area decreases until it reaches 121,549 km2. In the period of BC14K~today, the area increases. The spatial dynamics of the paleo potential distribution are shown by the movement of the centroid (Figure 6). As the results show, the centroid in BC22K and BC2K was near the current centroid, while two significant movements occurred between BC22K and BC2K. The centroid moves southeastwards between BC22K and BC14K and then northeastern between BC14K and BC2K. The most southern centroid (with a latitude value of 29.29 degrees) is found in BC14K, while the most western centroid (with a longitude value of 103.30 degrees) is also found in BC14K.

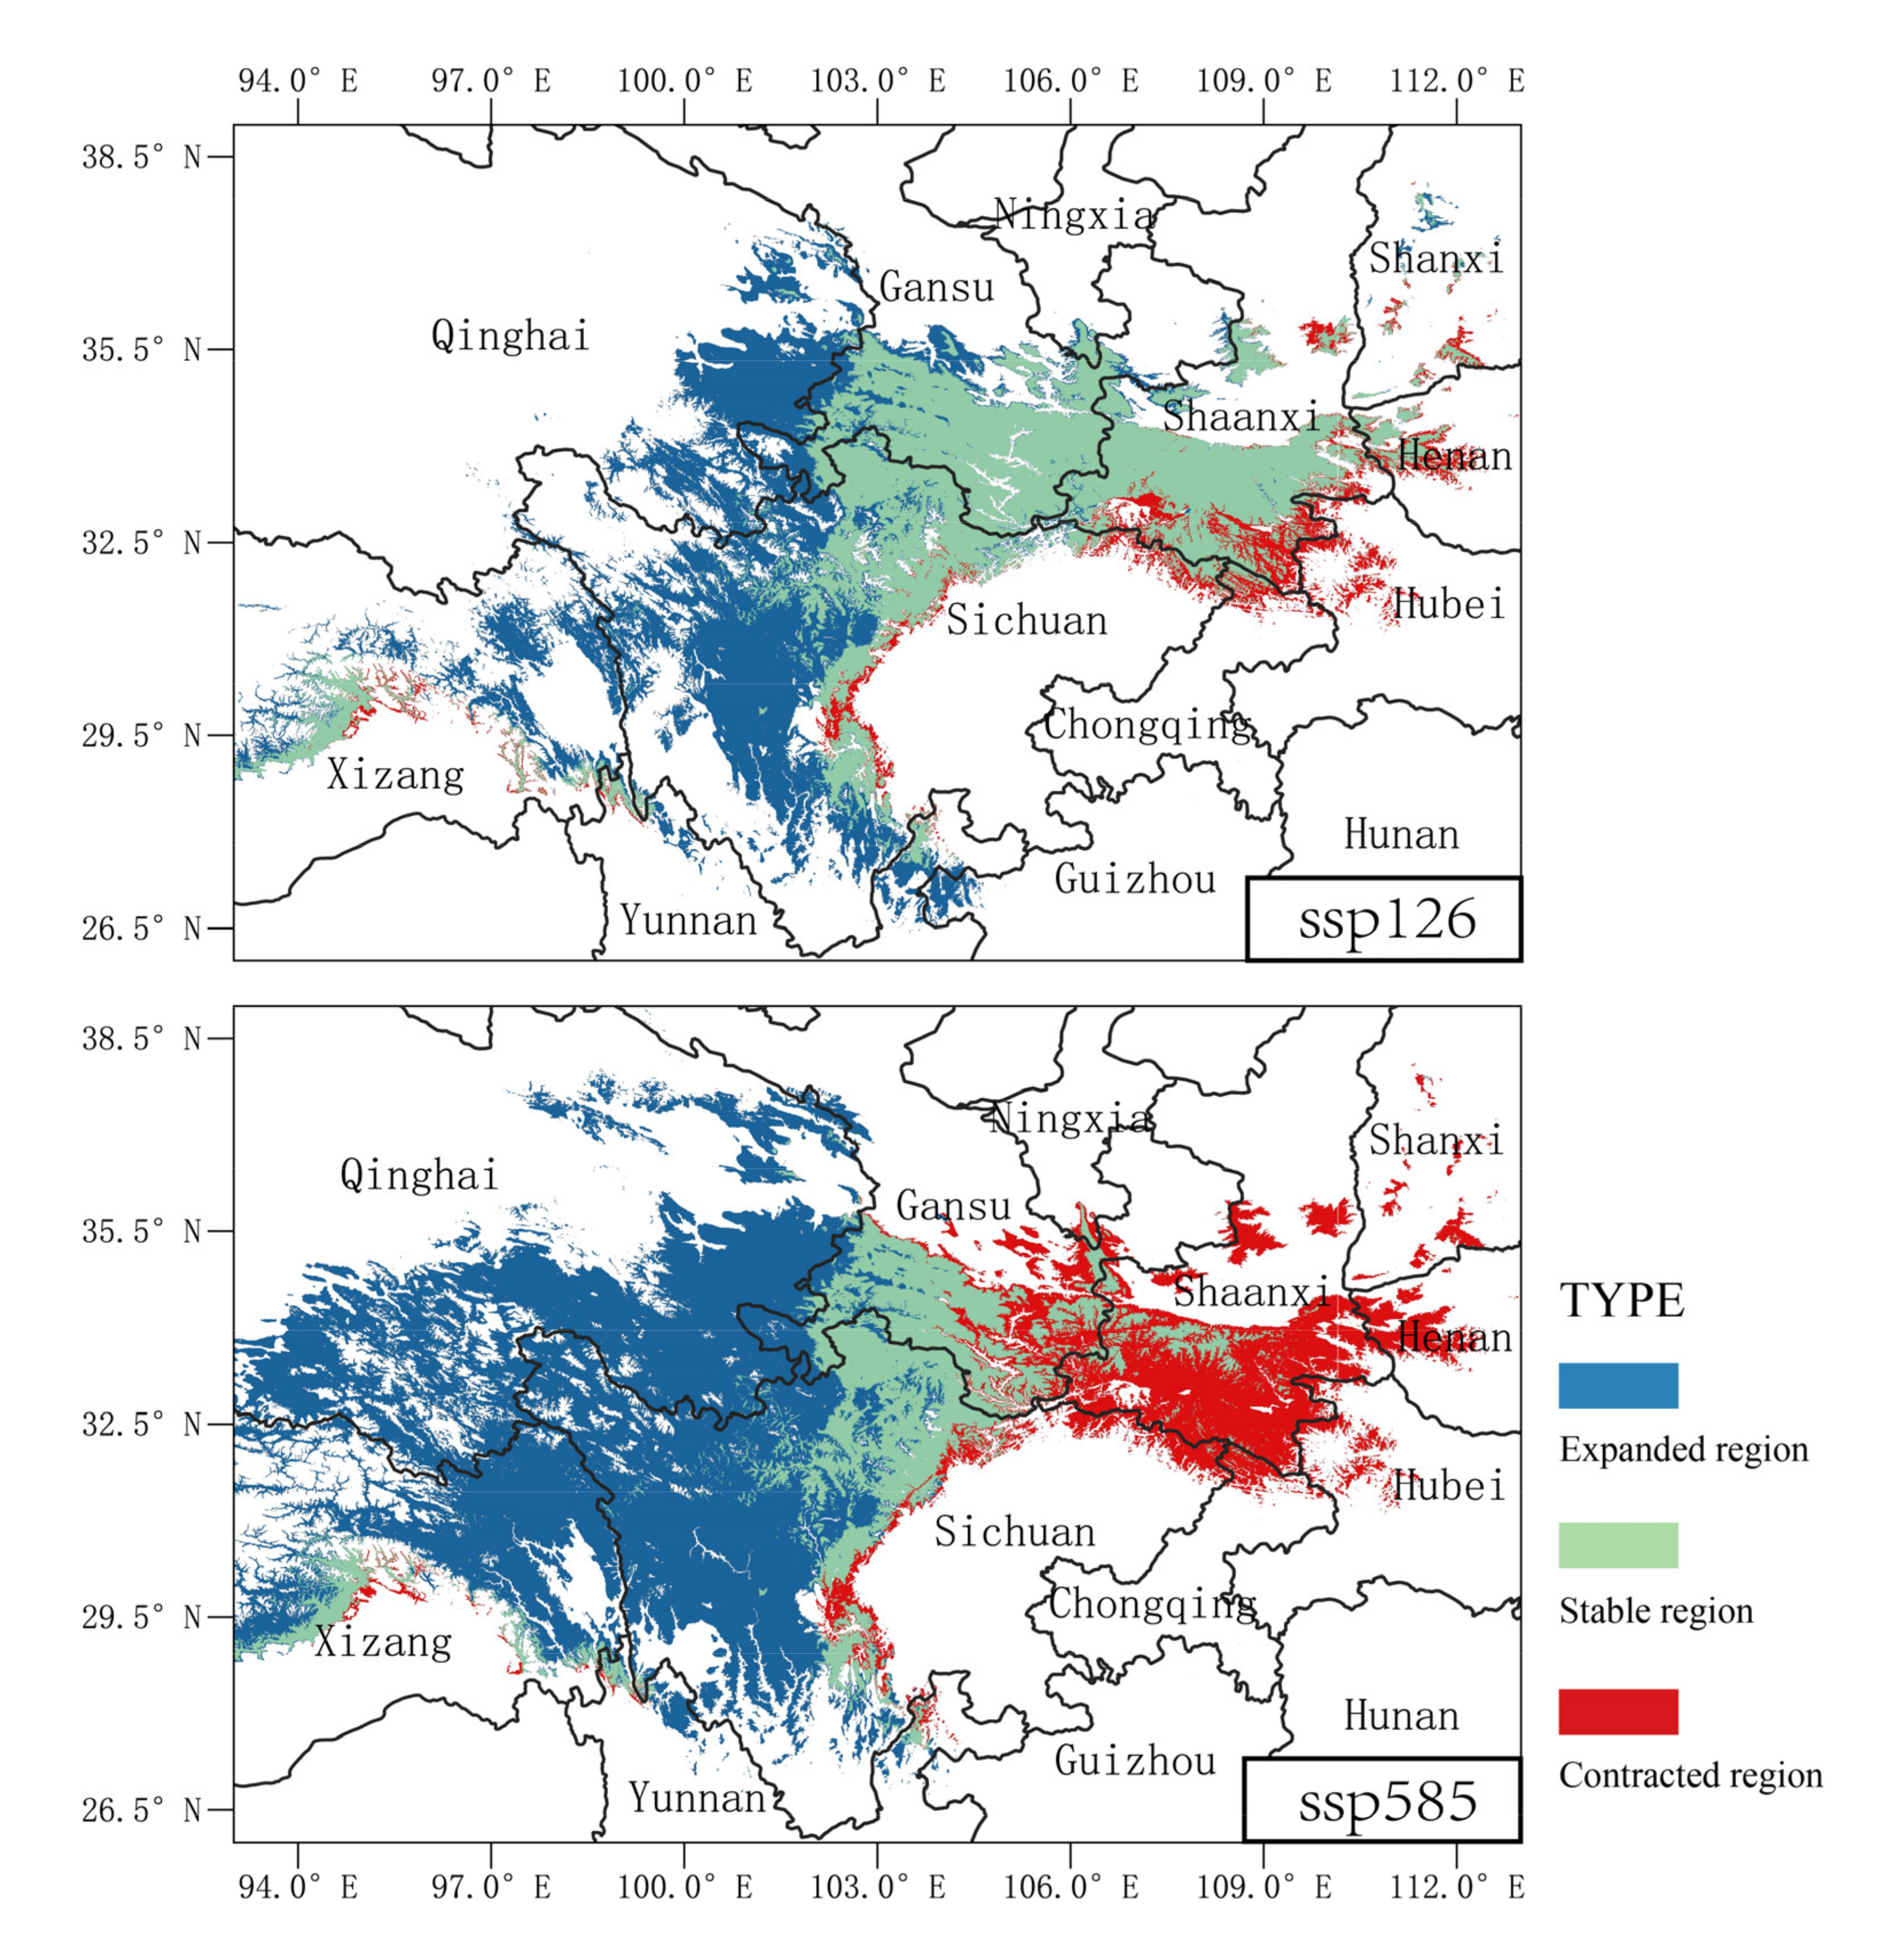
3.5. Future Potential Distribution and Ranges under Risks

Two climate change scenarios were selected to predict the future potential distribution of H. thibetanus and evaluate the risks of habitats disappearing. As Figure 7 shows, a weaker suitable region change is found in the moderate climate change scenario (ssp126), H. thibetanus is predicted to lose a limited number of regions in eastern and southern Shaanxi and also some fragments in southern Sichuan. On the other hand, H. thibetanus is predicted to expand its current distribution westwards and cover wide regions in eastern Qinghai and western Sichuan. A greater suitable region change is predicted in the high climate change scenario (ssp585). H. thibetanus is predicted to lose nearly all suitable regions in Shaanxi in ssp585, but gain new suitable regions in eastern Qinghai and western Sichuan. Overall, the area of the suitable region is predicted to increase in both scenarios (by 63.6 in ssp126 and 74.2% in ssp585) (Figure 5). The centroids of suitable regions in both scenarios are predicted to move westwards (Figure 6) while they reach a longitude value of 103.4 in ssp126 and 101.0 in ssp585.

4. Discussion

4.1. Climatic Niche and Proximal Variables

As a temperate perennial plant, H. thibetanus is reported to prefer cold, semi-shady and humid environments [6]. To describe the climatic niche of H. thibetanus quantitatively, six bioclimatic variables were selected and modeled. Given the high quality index (AUC and TSS) value and the consistency between a predicted potential distribution and experienced knowledge, the species distribution model of H. thibetanus is proved to be accurate and robust. According to the species distribution model, the total contribution rate related to temperature (bio03 and bio04) is 17.26%, the rate related to precipitation (bio15) is 11.56%, and the rate related to both temperature and precipitation (bio08, bio18, and bio19) is 71.18%. Herein, temperature contributes more compared to precipitation, although both variables are important for delimitating the distribution of H. thibetanus. Temperature is a key factor that influences plants’ growth, development, and reproduction [36]. It is reported that H. thibetanus has strong adaptability to low temperatures and can flower in snowy weather [1,6]. However, H. thibetanus seems to have limited adaptability to hot temperatures, especially when accompanied by a wet environment (bio08). The optimal limit was 13.59~19.96 °C. Another important temperate restriction is temperature seasonality, which corresponds to demands in the process of seed dormancy and germination of H. thibetanus [1,6]. The optimal limit of temperature seasonality is 7.23~8.65 °C, which reflects a moderate temperature change and a limited dormancy in H. thibetanus seeds. Precipitation is another important factor for plant life, which is also correlated with many environmental factors influencing the physiological and biochemical processes of plants. For example, soil moisture is the main factor affecting the plant assimilation rate and root breath [36]. As a perennial plant that is dormant during the winter, H. thibetanus requires low precipitation in the winter, which reflects a low optimal limit of precipitation in the coldest quarter of 5.48~35.32 mm. On the other hand, H. thibetanus has grassy leaves and requires high air moisture during its growth periods [1], which reflects a high optimal limit of precipitation in the warmest quarter above 452 mm. Although both precipitation variables are important in delimitating the distribution of H. thibetanus, low precipitation during dormancy periods (33.09%) is more important than high precipitation during growth periods (14.68%). Overall, our research indicates that the species distribution model is powerful for helping us understand the niche of research objects. Besides bioclimatic variables, other environmental variables (including soil characteristics, land cover, and biological variables) [12,32] may also influence the distribution of H. thibetanus; thus, further research that considers more environmental variables may provide a more comprehensive understanding of the niche of H. thibetanus. Meanwhile, the current distribution pattern of H. thibetanus may not fully be conducted by the species niche. Geographical events and anthropogenic disturbances may also play significant roles, and species distribution models concerning these parameters will produce more details.

4.2. The Current Distribution Range and Climate Refugia

Global climate has fluctuated greatly during the past three million years, leading to the recent major ice ages [10,19]. An inescapable consequence for most living organisms is the great changes in their distribution, which are expressed differently in different zones and among different taxon [19]. To understand species’ biogeographic histories, we modeled the potential distribution of H. thibetanus from the period of the Last Glacial Maximum to the current period, and the distribution area and centroids were compared in this research. The results show that current distribution regions of H. thibetanus are also suitable in the period of LGM, reflecting a wide paleodistribution. In the following 22 thousand years, climate fluctuations resulted in a round-trip movement of the distribution centroids of H. thibetanus. In particular, the distribution area in Shaanxi decreases and then increases, while the area in Sichuan increases and decreases. The extreme situation occurred near the maximum of the Bølling-Allerød warming (BC 14K), in which nearly all suitable regions in Shaanxi disappeared, while the area of the suitable region in Sichuan reached a peak. Being a slow migrator, another Helleborus species (H. niger) is proven to survive the LGM in local refugia [8]. In our research, it is hard to prove that the current distribution area in Shaanxi is the result of postglacial translation and colonization from Sichuan, as complex terrain in the Qingling mountains may also provide local climate refugia for H. thibetanus to survive. On the other hand, current population dynamics seem clear, as the results reflect. The population located in Sichuan contracted over the last 14 thousand years, which is consistent with the fact that limited accessions of wild H. thibetanus were recorded in central and southern Sichuan, and most southern accession (a latitude of 30.6°) located in the Dengchi valley of Baoxing was recorded in 1954 (PE00428129). Meanwhile, populations in Shaanxi grew, which is consistent with the growing specimen records in Shaanxi and Gansu in recent years. Resolving biogeographic history is important for the fundamental ecological and evolutionary science of H. thibetanus, but a single method is limited to addressing a full story; thus, more methods (including phylogeographic and demographic methods) are needed in further research [11].

4.3. Habitat Risks under Climate Change

It has been shown that global climate change has led to a continuous rise in global temperature, precipitation mode (time and space), and precipitation intensity, which is threatening the habitats of plants and animals [22,37,38]. So far, according to our predictions, H. thibetanus revealed a wide area (287,556 km2) of current potential distribution, which is much higher than the threshold (20,000 km2) of the vulnerable (VU) conservation status. This indicates that H. thibetanus has a relatively low risk of extinction in the near future when neglecting climatic change influences. To identify the habitat changes of H. thibetanus as the global climate changes, potential distributions in two different scenarios were modeled in this research. All of the changes can be divided into three catalogs: expanded, stable, and contracted. Stable habitats refer to standing suitable regions in climate change for H. thibetanus and could be considered basic preserved stations; such regions include the highlands of southern Shaanxi and most regions of northern Sichuan in both scenarios. Contracted habitats refer to threatened regions of the current distribution of H. thibetanus. In ssp126, contracted habitats are located in the southern and eastern edges of current distribution regions, but it covers most regions in Shaanxi in ssp585. Thus, preservation actions are needed in all southern and eastern edges of current distribution regions, while continuous monitoring is needed for populations in most of Shaanxi. Specifically, populations in the Daba mountains are under higher climate pressure than those in the Qingling mountains, although both may be extinct in the hardy climate change scenario (ssp585). A similar situation is also reported in another Helleborus species (H. odorus subsp. cyclophyllus), which is projected to lose a significant portion of its current distribution by 2070 [7]. In our research, wide expanded regions are also predicted. Though naturally expanded areas should be restricted given the limited ability of dispersal of H. thibetanus [39], those regions could be optional for ex situ preservation. Such regions are located west of the current distribution and cover regions in northwestern Sichuan and eastern Qinghai. However, considering the limited dispersal ability of H. thibetanus, expanded suitable habitat may not be available for natural populations. In that case, H. thibetanus will lose 18.1% and 53.9% of its current habitat in ssp126 and ssp585, respectively. Overall, global climate change significantly affects the potential distribution of H. thibetanus even in a moderate change scenario, and preservation is urgent. On the other hand, a more comprehensive understanding of habitat risks calls for research on issues including genetic diversity [7], local adaptation [40], and plasticity [41], which will also improve the preservation and utilization of H. thibetanus.

5. Conclusions

As the single Helleborus species in Asia and an endemic species to China, H. thibetanus is in urgent need of further basic research in order to understand its evolution and ecological characteristics. Using three different algorithms, we constructed an ensemble model based on current bioclimatic data and occurrence records. We described the bioclimate niche of H. thibetanus, including properties like moderate temperature and wet precipitation in growth periods and dry precipitation in dormancy periods. Based on the ensembled species distribution model, we projected a map of the current potential distribution of H. thibetanus in high resolution, which displays continuous distribution in northern Sichuan and southern Shaanxi. With the help of paleo-bioclimatic data, we projected the potential distribution of H. thibetanus since the Last Glacial Maximum, and the result shows a round-trip movement of the distribution centroids of H. thibetanus corresponding to the climate fluctuation. Furthermore, we predicted the potential distribution of H. thibetanus in the 2070s under two different climate change scenarios, and the result shows that the current distribution region will be threatened by global climate change, but regions located west of the current distribution are predicted to be suitable for H. thibetanus under climate change. Our results provide an important scientific basis for the conservation, introduction, and utilization of H. thibetanus in China.

Supplementary Materials

The following supporting information can be downloaded at: https://www.mdpi.com/article/10.3390/f14030630/s1, File S1: Download Path of Climatic Data.

Author Contributions

X.S. conceived and designed the experiments; L.M., M.S., and G.M. performed the experiments and analyzed the data; X.S., M.S., and K.Z. wrote the paper. All authors have read and agreed to the published version of the manuscript.

Funding

Research and demonstration of key technologies of new varieties breeding and industrialization of Helleborus under the scientific and technological cooperation plan of “three agriculture and nine parties” in Zhejiang Province(2023SNJF032).

Data Availability Statement

Not applicable.

Conflicts of Interest

None of the authors have any actual or potential conflicts of interest that could inappropriately influence, or be perceived to influence, this work.

References

  1. Li, L.; Michio, T. (Eds.) Flora of China; Missouri Botanical Garden Press: Saint Louis, MO, USA; Science Press: Beijing, China, 2013; Volume 6, p. 148. [Google Scholar]
  2. Song, H.; Ordonez, A.; Svenning, J.; Qian, H.; Yin, X.; Mao, L.; Deng, T.; Zhang, J. Regional disparity in extinction risk: Comparison of disjunct plant genera between eastern Asia and eastern North America. Glob. Change Biol. 2021, 27, 1904–1914. [Google Scholar] [CrossRef] [PubMed]
  3. Balázs, V.L.; Filep, R.; Ambrus, T.; Kocsis, M.; Farkas, Á.; Stranczinger, S.; Papp, N. Ethnobotanical, historical and histological evaluation of Helleborus L. genetic resources used in veterinary and human ethnomedicine. Genet. Resour. Crop Evol. 2020, 67, 781–797. [Google Scholar] [CrossRef] [Green Version]
  4. Song, X.; Li, Y.; Zhang, Z.; Huang, W.; Zhang, H.; Jiang, Y.; Liu, J.; Zhang, D. Two New Spirostanol Glycosides from the Roots and Rhizomes of Helleborus thibetanus Franch. Rec. Nat. Prod. 2023, 17, 318–328. [Google Scholar] [CrossRef]
  5. Li, Y.; Zhang, H.; Liang, X.; Song, B.; Zheng, X.; Wang, R.; Liu, L.; Song, X.; Liu, J. New cytotoxic bufadienolides from the roots and rhizomes of Helleborus thibetanus Franch. Nat. Prod. Res. 2020, 34, 950–957. [Google Scholar] [CrossRef]
  6. Deng, W.; Zhao, L.; Shi, X.; Du, L. Progress in the development of germplasme resource in genus Helleborus. Xiandai Hortic. 2022, 45, 1–3. (In Chinese) [Google Scholar]
  7. Fassou, G.; Kougioumoutzis, K.; Iatrou, G.; Trigas, P.; Papasotiropoulos, V. Genetic Diversity and Range Dynamics of Helleborus odorus subsp. cyclophyllus under Different Climate Change Scenarios. Forests 2020, 11, 620. [Google Scholar] [CrossRef]
  8. Záveská, E.; Kirschner, P.; Frajman, B.; Wessely, J.; Willner, W.; Gattringer, A.; Hülber, K.; Lazić, D.; Dobeš, C.; Schönswetter, P. Evidence for Glacial Refugia of the Forest Understorey Species Helleborus niger (Ranunculaceae) in the Southern as Well as in the Northern Limestone Alps. Front. Plant Sci. 2021, 12, 683043. [Google Scholar] [CrossRef]
  9. Sparey, M.; Cox, P.; Williamson, M.S. Bioclimatic change as a function of global warming from CMIP6 climate projections. Biogeosciences 2023, 20, 451–488. [Google Scholar] [CrossRef]
  10. Hoban, S.; Dawson, A.; Robinson, J.D.; Smith, A.B.; Strand, A.E. Inference of biogeographic history by formally integrating distinct lines of evidence: Genetic, environmental niche and fossil. Ecography 2019, 42, 1991–2011. [Google Scholar] [CrossRef] [Green Version]
  11. Mestre, F.; Barbosa, S.; Garrido-García, J.A.; Pita, R.; Mira, A.; Alves, P.C.; Paupério, J.; Searle, J.B.; Beja, P. Inferring past refugia and range dynamics through the integration of fossil, niche modelling and genomic data. J. Biogeogr. 2022, 49, 2064–2076. [Google Scholar] [CrossRef]
  12. Zurell, D.; Franklin, J.; König, C.; Bouchet, P.J.; Dormann, C.F.; Elith, J.; Fandos, G.; Feng, X.; Guillera-Arroita, G.; Guisan, A.; et al. A standard protocol for reporting species distribution models. Ecography 2020, 43, 1261–1277. [Google Scholar] [CrossRef]
  13. Phillips, S.J.; Anderson, R.P.; Schapire, R.E. Schapire, Maximum entropy modeling of species geographic distributions. Ecol. Model. 2006, 190, 231–259. [Google Scholar] [CrossRef] [Green Version]
  14. Hao, T.; Elith, J.; Guillera-Arroita, G.; Lahoz-Monfort, J.J. A review of evidence about use and performance of species distribution modelling ensembles like BIOMOD. Divers. Distrib. 2019, 25, 839–852. [Google Scholar] [CrossRef]
  15. Thuiller, W.; Lafourcade, B.; Engler, R.; Araújo, M.B. BIOMOD—A platform for ensemble forecasting of species distributions. Ecography 2009, 32, 369–373. [Google Scholar] [CrossRef]
  16. Smith, A.B.; Godsoe, W.; Rodriguez-Sanchez, F.; Wang, H.-H.; Warren, D. Niche Estimation Above and Below the Species Level. Trends Ecol. Evol. 2019, 34, 260–273. [Google Scholar] [CrossRef] [PubMed]
  17. Zhang, X.; Ci, X.; Hu, J.; Bai, Y.; Thornhill, A.H.; Conran, J.G.; Li, J. Riparian areas as a conservation priority under climate change. Sci. Total Environ. 2023, 858, 159879. [Google Scholar] [CrossRef] [PubMed]
  18. Brambilla, M.; Rubolini, D.; Appukuttan, O.; Calvi, G.; Karger, D.N.; Kmecl, P.; Mihelič, T.; Sattler, T.; Seaman, B.; Teufelbauer, N.; et al. Identifying climate refugia for high-elevation Alpine birds under current climate warming predictions. Glob. Change Biol. 2022, 28, 4276–4291. [Google Scholar] [CrossRef]
  19. Roces-Díaz, J.V.; Jiménez-Alfaro, B.; Chytrý, M.; Díaz-Varela, E.R.; Álvarez-Álvarez, P. Glacial refugia and mid-Holocene expansion delineate the current distribution of Castanea sativa in Europe. Palaeogeogr. Palaeoclimatol. Palaeoecol. 2018, 491, 152–160. [Google Scholar] [CrossRef] [Green Version]
  20. Tang, C.Q.; Matsui, T.; Ohashi, H.; Dong, Y.F.; Momohara, A.; Herrando-Moraira, S.; Qian, S.; Yang, Y.; Ohsawa, M.; Luu, H.T.; et al. Identifying long-term stable refugia for relict plant species in East Asia. Nat. Commun. 2018, 9, 4488. [Google Scholar] [CrossRef] [Green Version]
  21. Duan, X.; Li, J.; Wu, S. MaxEnt Modeling to Estimate the Impact of Climate Factors on Distribution of Pinus densiflora. Forests 2022, 13, 402. [Google Scholar] [CrossRef]
  22. Li, Y.; Shao, W.; Huang, S.; Zhang, Y.; Fang, H.; Jiang, J. Prediction of Suitable Habitats for Sapindus delavayi Based on the MaxEnt Model. Forests 2022, 13, 1611. [Google Scholar] [CrossRef]
  23. Aiello-Lammens, M.E.; Boria, R.A.; Radosavljevic, A.; Vilela, B.; Anderson, R.P. spThin: An R package for spatial thinning of species occurrence records for use in ecological niche models. Ecography 2015, 38, 541–545. [Google Scholar] [CrossRef]
  24. Edzer, J.; Roger, S.B. Classes and methods for spatial data in R. R J. 2005, 5, 9–13. [Google Scholar]
  25. Robert, J.H. raster: Geographic Data Analysis and Modeling. R Package Version 2021, 2, 1–49. [Google Scholar]
  26. Karger, D.N.; Conrad, O.; Böhner, J.; Kawohl, T.; Kreft, H.; Soria-Auza, R.W.; Zimmermann, N.E.; Linder, H.P.; Kessler, M. Climatologies at high resolution for the earth’s land surface areas. Sci. Data 2017, 4, 170122. [Google Scholar] [CrossRef] [Green Version]
  27. Castillo, A.E.; Peña, L.S.; Delgado, S.G. Trayectorias Socioeconómicas Compartidas (SSP): Nuevas maneras de comprender el cambio climático y social. Estud. Demográficos Urbanos 2017, 32, 669–693. [Google Scholar] [CrossRef] [Green Version]
  28. Karger, D.N.; Nobis, M.P.; Normand, S.; Graham, C.H.; Zimmermann, N.E. CHELSA-TraCE21k v1.0. Downscaled transient temperature and precipitation data since the last glacial maximum. Clim. Past Discuss. 2021, 1, 1–27. [Google Scholar]
  29. Naimi, B.; Hamm, N.A.; Groen, T.A.; Skidmore, A.K.; Toxopeus, A.G. Where is positional uncertainty a problem for species distribution modelling? Ecography 2014, 37, 191–203. [Google Scholar] [CrossRef]
  30. Breiman, L. Random Forests. Mach. Learn. 2001, 45, 5–32. [Google Scholar] [CrossRef] [Green Version]
  31. Trevor, H.; Robert, T.; Jerome, F. The Elements of Statistical Learning: Data Mining, Inference, and Prediction, 2nd ed.; Springer: Berlin/Heidelberg, Germany, 2016. [Google Scholar]
  32. Sillero, N.; Arenas-Castro, S.; Enriquez-Urzelai, U.; Vale, C.G.; Sousa-Guedes, D.; Martínez-Freiría, F.; Real, R.; Barbosa, A. Want to model a species niche? A step-by-step guideline on correlative ecological niche modelling. Ecol. Model. 2021, 456, 109671. [Google Scholar] [CrossRef]
  33. Elith, J.; Ferrier, S.; Huettmann, F.; Leathwick, J. The evaluation strip: A new and robust method for plotting predicted responses from species distribution models. Ecol. Model. 2005, 186, 280–289. [Google Scholar] [CrossRef]
  34. Van Der Wal, J.; Falconi, L.; Januchowski, S.; Shoo, L.; Storlie, C. SDMTools: Species Distribution Modelling Tools: Tools for processing data associated with species distribution modelling exercises. R Package Version 2014, 1, 1–221. [Google Scholar]
  35. Hadley, W. ggplot2: Elegant Graphics for Data Analysis; Springer: New York, NY, USA, 2016; p. 260. [Google Scholar]
  36. Metzger, M.J.; Bunce, R.G.H.; Jongman, R.H.G.; Sayre, R.; Trabucco, A.; Zomer, R. A high-resolution bioclimate map of the world: A unifying framework for global biodiversity research and monitoring. Glob. Ecol. Biogeogr. 2013, 22, 630–638. [Google Scholar] [CrossRef] [Green Version]
  37. Chen, Y.; Shan, X.; Ovando, D.; Yang, T.; Dai, F.; Jin, X. Predicting current and future global distribution of black rockfish (Sebastes schlegelii) under changing climate. Ecol. Indic. 2021, 128, 107799. [Google Scholar] [CrossRef]
  38. Zhao, G.; Cui, X.; Sun, J.; Li, T.; Wang, Q.; Ye, X.; Fan, B. Analysis of the distribution pattern of Chinese Ziziphus jujuba under climate change based on optimized biomod2 and MaxEnt models. Ecol. Indic. 2021, 132, 108256. [Google Scholar] [CrossRef]
  39. Zhu, Y.; Wang, D.; Codella, S.G. Seed re-dispersal of four myrmecochorous plants by a keystone ant in central China. Ecol. Res. 2017, 32, 387–393. [Google Scholar] [CrossRef]
  40. Chen, Q.; Yin, Y.; Zhao, R.; Yang, Y.; Da Silva, J.A.T.; Yu, X. Incorporating Local Adaptation into Species Distribution Modeling of Paeonia mairei, an Endemic Plant to China. Front. Plant Sci. 2019, 10, 1717–1731. [Google Scholar] [CrossRef]
  41. Benito Garzón, M.; Robson, T.M.; Hampe, A. ΔTraitSDMs: Species distribution models that account for local adaptation and phenotypic plasticity. New Phytol. 2019, 222, 1757–1765. [Google Scholar] [CrossRef]
Figure 1. Model accuracy of single models applying three different algorithms.
Forests 14 00630 g001
Figure 2. Response curves of 6 bioclimatic variables. We choose 18 MaxEnt models (with TSS > 0.8) and the ensemble model based on the 18 individual models to generate variable curves. The curve revealed by each individual model was drawn in grey, while a curve revealed by the ensemble model was drawn in red.
Forests 14 00630 g002
Figure 3. The current potential distribution of H. thibetanus.
Forests 14 00630 g003
Figure 4. Paleo potential distribution of H. thibetanus.
Forests 14 00630 g004
Figure 5. Area of different regions since the Last Glacial Maximum to the 2070s.
Forests 14 00630 g005
Figure 6. Distribution centroids of H. thibetanus from the Last Glacial Maximum to the 2070s.
Forests 14 00630 g006
Figure 7. Changes of the potential distribution of H. thibetanus in the 2070s in two scenarios (ssp126 and ssp585).
Forests 14 00630 g007
Table 1. Bioclimatic variables and importance in modeling.
IDBioclimatic VariablesUnitMean ImportanceStandard Deviation
bio01Mean temperature°C--
bio02Diurnal air temperature range°C--
bio03Isothermality (bio02/bio07 ×100)\2.200.08
bio04Temperature seasonality
(standard deviation ×100)
°C15.060.40
bio05Max temperature of warm month°C--
bio06Min temperature of cold month°C--
bio07Annual temperature range°C--
bio08Mean temperature of wet quarter°C23.410.60
bio09Mean temperature of dry quarter°C--
bio10Mean temperature of warm quarter°C--
bio11Mean temperature of cold quarter°C--
bio12Annual precipitationmm--
bio13Precipitation of wet monthmm--
bio14Precipitation of dry monthmm--
bio15Precipitation seasonality
(coefficient of variation)
\11.560.37
bio16Precipitation of wet quartermm--
bio17Precipitation of dry quartermm--
bio18Precipitation of warm quartermm14.680.46
bio19Precipitation of cold quartermm33.090.62
Disclaimer/Publisher’s Note: The statements, opinions and data contained in all publications are solely those of the individual author(s) and contributor(s) and not of MDPI and/or the editor(s). MDPI and/or the editor(s) disclaim responsibility for any injury to people or property resulting from any ideas, methods, instructions or products referred to in the content.

