Article

The Identification and Expression Analysis of the Liriodendron chinense (Hemsl.) Sarg. SOD Gene Family

1
State Key Laboratory of Tree Genetics and Breeding, Co-Innovation Center for Sustainable Forestry in Southern China, Nanjing Forestry University, Nanjing 210037, China
2
Key Laboratory of Forest Genetics and Biotechnology of Ministry of Education, Nanjing Forestry University, Nanjing 210037, China
3
College of Landscape Architecture, Nanjing Forestry University, Nanjing 210037, China
*
Author to whom correspondence should be addressed.
Forests 2023, 14(3), 628; https://doi.org/10.3390/f14030628
Submission received: 15 February 2023 / Revised: 14 March 2023 / Accepted: 16 March 2023 / Published: 20 March 2023
(This article belongs to the Section Genetics and Molecular Biology)

Abstract

:
Superoxide dismutase (oxide dismutase) is an enzyme synthesized via the expression of SOD-related genes. It is the first line of defense against oxygen free radicals, and it widely exists in the cytoplasm, chloroplasts, and mitochondria. However, the SOD gene family of woody plant Liriodendron chinense has not been studied. To reveal the potential role of SOD genes, we systematically identified and analyzed the SOD gene family of L. chinense, and investigated the transcriptional responses of LcSOD genes to several abiotic stresses, including cold, heat, and drought. A total of eight SOD genes were identified, namely, five Cu/Zn-SODs, two Fe-SODs, and one Mn-SOD, and they were divided into two subgroups according to phylogenetic analysis, gene structure, and conserved motifs. Cis-acting element analysis reveals various hormones and stress respond as cis-acting elements in the promoters of LcSODs. Gene expression analysis shows that most LcSOD genes were in response to abiotic stresses at the transcriptional level. These results help in clarifying the function of LcSOD genes under abiotic stresses, and provide potential targets for the improvement in abiotic stress tolerance in the endangered L. chinense.

1. Introduction

Reactive oxygen species (ROS) are produced in almost all types of cellular metabolism. Under extreme-temperature, drought, salinity, and other stresses, organisms produce a large number of ROS [1]. Excessive ROS affect various cell functions by destroying nucleic acid, protein, and lipid peroxidation, and eventually lead to cell death [2,3]. Abiotic stress is the main limiting factor affecting plant growth and development, and it leads to the accumulation of ROS, which, in turn, leads to oxidative damage [4,5]. However, evolution has equipped plants with a wider range of defenses, including morphological, metabolic, and genetic-level changes to adapt to adverse environmental conditions [6]. Superoxide dismutase (SOD), one of the main antioxidant enzymes, protects cells from toxicity by catalyzing the conversion of ROS into O2 and H2O2, so that ROS reach a state of dynamic equilibrium in the cell [7,8,9].
Superoxide dismutase is synthesized by SOD genes, which can be classified into several categories according to different types of metal cofactors, i.e., Cu/Zn-SOD, Mn-SOD, Fe-SOD, and Ni-SOD [10,11]. Cu/Zn-SODs are commonly found in some prokaryotes, and the cytoplasm and chloroplasts of eukaryotic cells, while Mn-SODs are found in prokaryotes and mitochondria. Fe-SODs are commonly found in prokaryotes, algae, and the chloroplasts of some higher plants, and Ni-SOD is a unique SOD isoform in Streptomyces [12,13]. SOD, as the first line of the antioxidant system, is induced to be expressed when organisms are under stress and plays an important role in protecting cells [14]. For example, drought stress caused the downregulation of SOD genes in Populus [15]. The expression of the SlSOD6 gene was significantly increased in tomatoes in response to drought stress [16].The expression of BjuFSDs in mustard SOD genes was upregulated under cold and salt stresses, but downregulated under heat and drought stresses [17].
Liriodendron chinense (L. chinense) is a precious tree species in China. It is an endangered species of the Magnoliaceae family because of its low natural seed-setting rate due to the different maturation times of the pistil and stamen. By analyzing the Liriodendron genome, we found that Liriodendron is a sister evolutionary clade of dicotyledonous and monocotyledonous plants, which is of great significance for understanding the phylogenetic position and evolution of Magnoliaceae [18]. It is a tall deciduous tree with a height of more than 40 m and a diameter at breast height of more than 1 m. These trees are mainly found south of the Yangtze River Basin, and prefer warm and humid conditions [19]. In order to achieve the good growth of the L. chinense tree species in cold and arid areas, it is necessary to solve its problem of poor stress resistance. Therefore, we studied the regulation effect of SODs on ROS. Then, we could produce resistant plants through transgenic technology to promote L. chinense. Although SOD plays a significant role in the plant response to abiotic stress, its genomewide identification and functional characterization in L. chinensis has not been reported [20].
In this study, the basic physical and chemical properties, gene structure, phylogeny, and expression pattern of L. chinense were analyzed with bioinformatics and quantitative real-time PCR (qRT-PCR). This study provides valuable gene resources for genetic engineering to improve the abiotic stress resistance of L. chinense.

2. Materials and Methods

2.1. Identification and Classification of LcSOD Gene Family

To obtain the potential SOD genes in L. chinense, the hidden horse models of Cu/ZnSOD (PF00080) and Fe-MnSOD (PF00081, PF02777) were used to search the L. chinense genome database using TBtools [21]. Next, the Blastp program was used to retrieve potential SOD genes from the genome of L. chinense on the basis of SOD genes in Arabidopsis, which were downloaded from phytozome v13 (https://phytozome-next.jgi.doe.gov/ (accessed on 20 March 2022)) [22]. The results of the two searches were combined, and CD-search tool (https://www.ncbi.nlm.nih.gov/Structure/bwrpsb/bwrpsb.cgi (accessed on 27 August 2022)) was used to further confirm the candidate SOD genes in L. chinense [23].
The physicochemical properties of SOD protein were predicted using the Protparam online tool (https://web.expasy.org/Protparam/ (accessed on 22 March 2022)) [24]. Plant-mPLoc (http://www.csbio.sjtu.edu.cn/bioinf/plant-multi/ (accessed on 22 March 2022)) and TMHMM Server v. 2.0 (https://services.healthtech.dtu.dk/service.php?tmhmm-2.0 (accessed on 23 March 2022)) were used for the subcellular locations and transmembrane analysis, respectively [25,26].

2.2. Phylogenetic Analysis of LcSOD Genes

In order to reconstruct the phylogenetic tree, 42 SOD protein sequences were identified from five land plant species. The multiple sequence alignment was performed with the default parameters of ClustalW (http://www.clustal.org/clustal2/ (accessed on 28 March 2022)). Then, the maximal clade credibility tree was constructed with BEAST v2.6.6, and Figtree v1.4,3 was lastly used to view and beautify the tree [27,28].

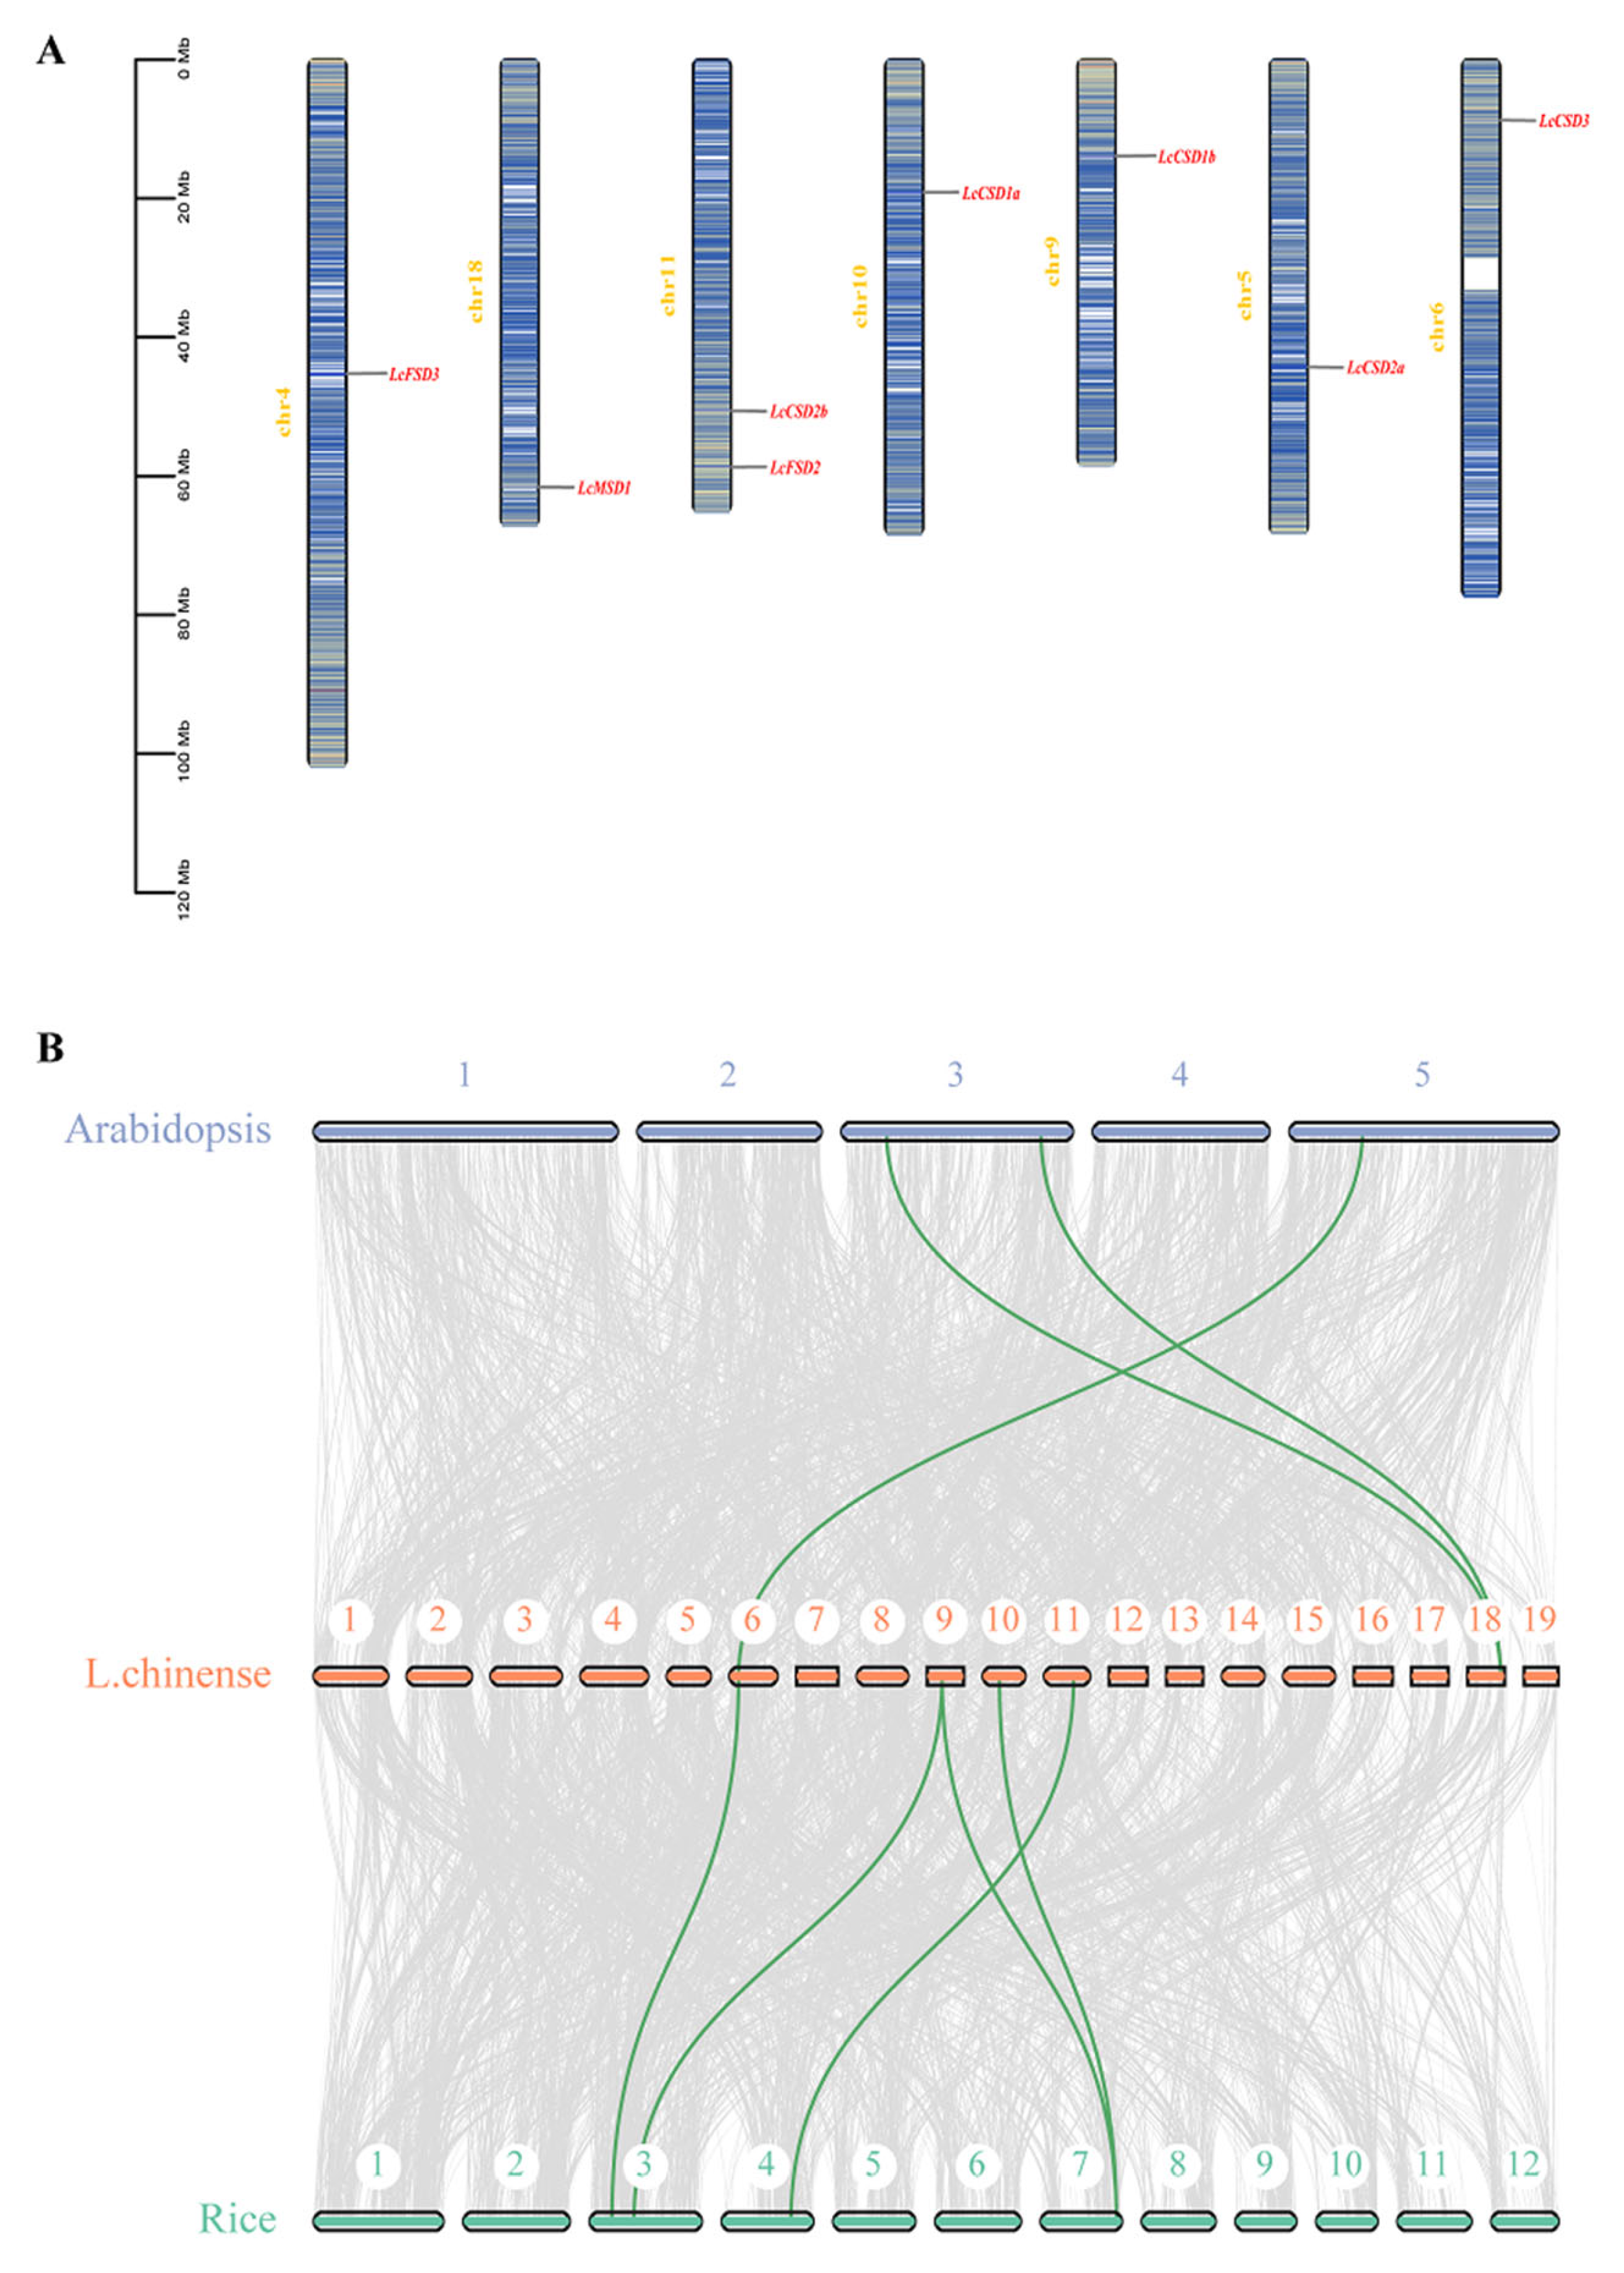
2.3. Motifs, Gene Structure, Chromosomal Location, and Syntenic Analysis

The conserved motifs of LcSOD family members were analyzed using the MEME online tool (https://meme-suite.org/meme/doc/meme.html (accessed on 30 March 2022)) with the motif parameter set to 10 [29]. Gene structure was visualized using the mapping software of TBtools. The positions of LcSODs on the chromosomes were visualized with TBtools in accordance with the genomic annotation file of L. chinense. The syntenic analysis of L. chinense, Arabidopsis, and rice was performed using JCVI software (https://github.com/tanghaibao/jcvi/wiki/MCscan (accessed on 30 March 2022)) [30].

2.4. Cis-Regulatory Element Analysis

The 2000 bp upstream sequence of LcSOD transcription start sites (TSSs) was extracted to search the cis-acting element using the PlantCare website (https://bioinformatics.psb.ugent.be/webtools/plantcare/html/ (accessed on 30 March 2022)), and visualized with Tbtools [31].

2.5. Expression Analysis of LcSOD Genes

To explore the potential functions of SOD genes of L. chinense, their expression patterns were analyzed. Gene expression data from the transcriptomes of different tissues were collected: bud, leaf, bark, phloem, xylem, stigma, stamen, and sepal. In addition, gene expression patterns under various abiotic stresses (heat, cold, and drought) were examined. In order to simulate heat, cold, and drought stresses, 3-month-old tissue culture seedlings were treated with 4 or 40 °C, or 15% PEG 6000 for 1, 3, 6, and 12 h, and 1 and and 3 days (Figure 1). Then, the leaf samples were selected for relative expression analysis. The transcriptome data used in this study were archived and can be found on the NCBI website; cold and heat stress accession number is PRJNA679089 (https://www.ncbi.nlm.nih.gov/bioproject/PRJNA679089/ (accessed on 25 November 2022)), and drought stress accession number is PRJNA679101 (https://www.ncbi.nlm.nih.gov/bioproject/PRJNA679101/ (accessed on 25 November 2022)). Relative expression analysis was performed using kallisto [32,33].

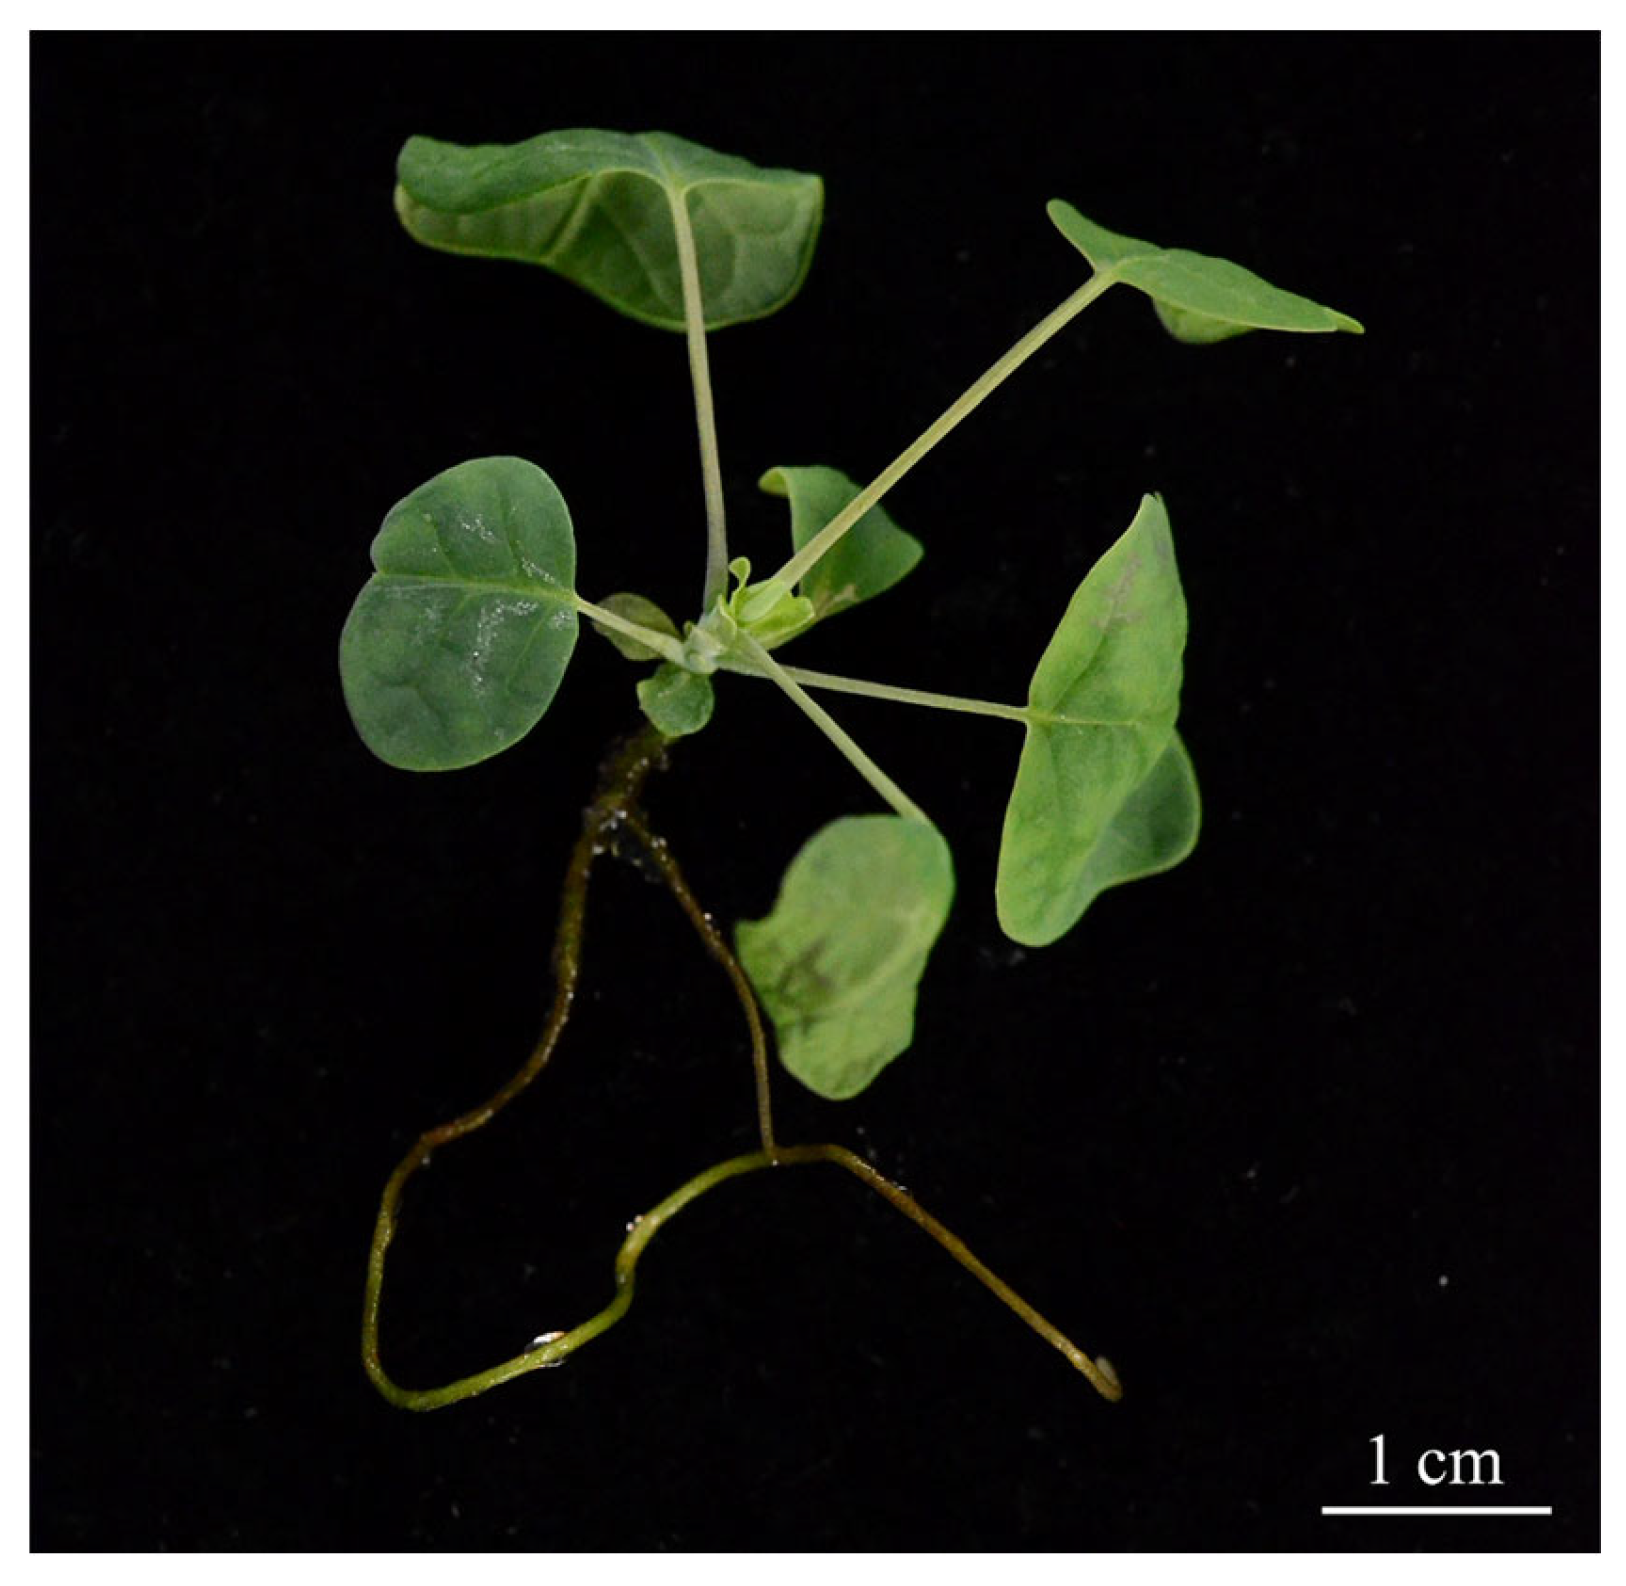
2.6. Plant Material and Cold Treatment

For cold stress simulation, seedlings were treated with 4 or 28 °C (control) for 3, 12, and 48 h. The materials at each time point were collected into liquid nitrogen and then stored at −80 °C for RNA extraction.

2.7. RNA Isolation and qRT-PCR

RNA extraction was performed using the Eastep®Super Total RNA Extraction Kit (Promega, Shanghai, China). Then, the RNA was reverse-transcribed into cDNA using the HiScript® III 1st Strand cDNA Synthesis Kit. Specific primers for qRT-PCR analysis were designed at https://primer3.ut.ee/ (Table 1). The gene expression of 8 LcSOD gene family members was analyzed with qRT-PCR, which was performed using the Roche lightcycler 480 II real-time fluorescent quantitative PCR instrument (Applied Biosystems, American). Three independent technical replicates and three biological replicates were performed for each LcSOD gene. The PCR procedure consisted of an initial denaturation at 95 °C for 15 min, followed by 34 cycles at 95 °C for 10 s, 60 °C for 10 s, and 72 °C for 30 s. The relative expression levels were calculated using the 2–△△Ct method [34]. The 18S RNA and GAPDH were the reference genes. IBM SPSS Statistics 22 and GraphPad Prism 8 were used for one-way ANOVA and histogram representation [35,36].

3. Results

3.1. Identification of SODs in L. chinense

According to the search results of blastp and hmmer, and domain identification, we obtained eight LcSOD genes, which we named LcMSD1, LcFSD2, LcCSD2b, LcCSD1a, LcCSD1b, LcFSD3, LcCSD2a, and LcCSD3 according to their homology with AtSOD.
Then, the LcSOD gene characteristics of amino acid length, molecular weight, aliphatic index, GRAVY values, isoelectric point, subcellular location and transmembrane domain were analyzed (Table 2). The results show that the LcSOD length was between 103 and 309 (aa), the molecular weight (MWs) varied from 1.32 to 3.52 kDa, and the predicted pI was between 4.8 and 6.71. The aliphatic index ranged from 71.68 to 93.63. The GRAVY values were all negative, indicating that the proteins encoded by the LcSOD family were hydrophilic. In addition, most LcSOD proteins are localized in chloroplasts, followed by mitochondria and cytoplasm. These LcSOD proteins also did not have transmembrane domains.

3.2. Phylogenetic Analysis of LcSODs in L. chinense

A phylogenetic tree was constructed using the SOD protein sequences of Liriodendron chinense (8 LcSODs), Arabidopsis thaliana (8 AtSODs), Oryza sativa (8 OsSODs), Amborella trichopoda (7 ArSODs), and Vitis vinifera (11 VvSODs) with the Bayesian method. The 42 sequences were divided into 2 groups, Cu/Zn-SODs and Fe/Mn-SODs, which were consistent with their metal cofactors. Cu/ZnSOD members clustered into one group, while MnSOD and FeSOD members clustered into another group, which was consistent with the clustering results of three types of SODs in other plants (Figure 2).

3.3. Chromosome Distribution and Syntenic Analysis of LcSODs

In terms of the genomic annotation document, we analyzed the relative position of eight LcSODs on the genome. The results verified that the eight genes were evenly distributed on seven different chromosomes, two genes, LcCSD2b and LcFSD2, were located on chromosome 11, and the other genes were located on chromosomes 4–6 and 8–10 (Figure 3A).
We used JCVI software to analyze the syntenic relationship of SOD genes in L. chinense, Arabidopsis and rice, and found that L. chinense and Arabidopsis had three collinear gene pairs, namely, LchMSD1/AT3G10920.1, LchMSD1/AT3G56350.1, and LcCSD3/AT5G18100.1. L. chinense, and rice had five collinear gene pairs: LcCSD1a/LOC_Os07g46990.1, LcCSD1a/LOC_Os07g46990.1, LcCSD2b/LOC_Os04g48410.1, LcCSD1b/LOC_Os07g46990.1, LcCSD1b/LOC_Os03g22810.1, and LcCSD3/LOC_Os03g11960.1 (Figure 3B).

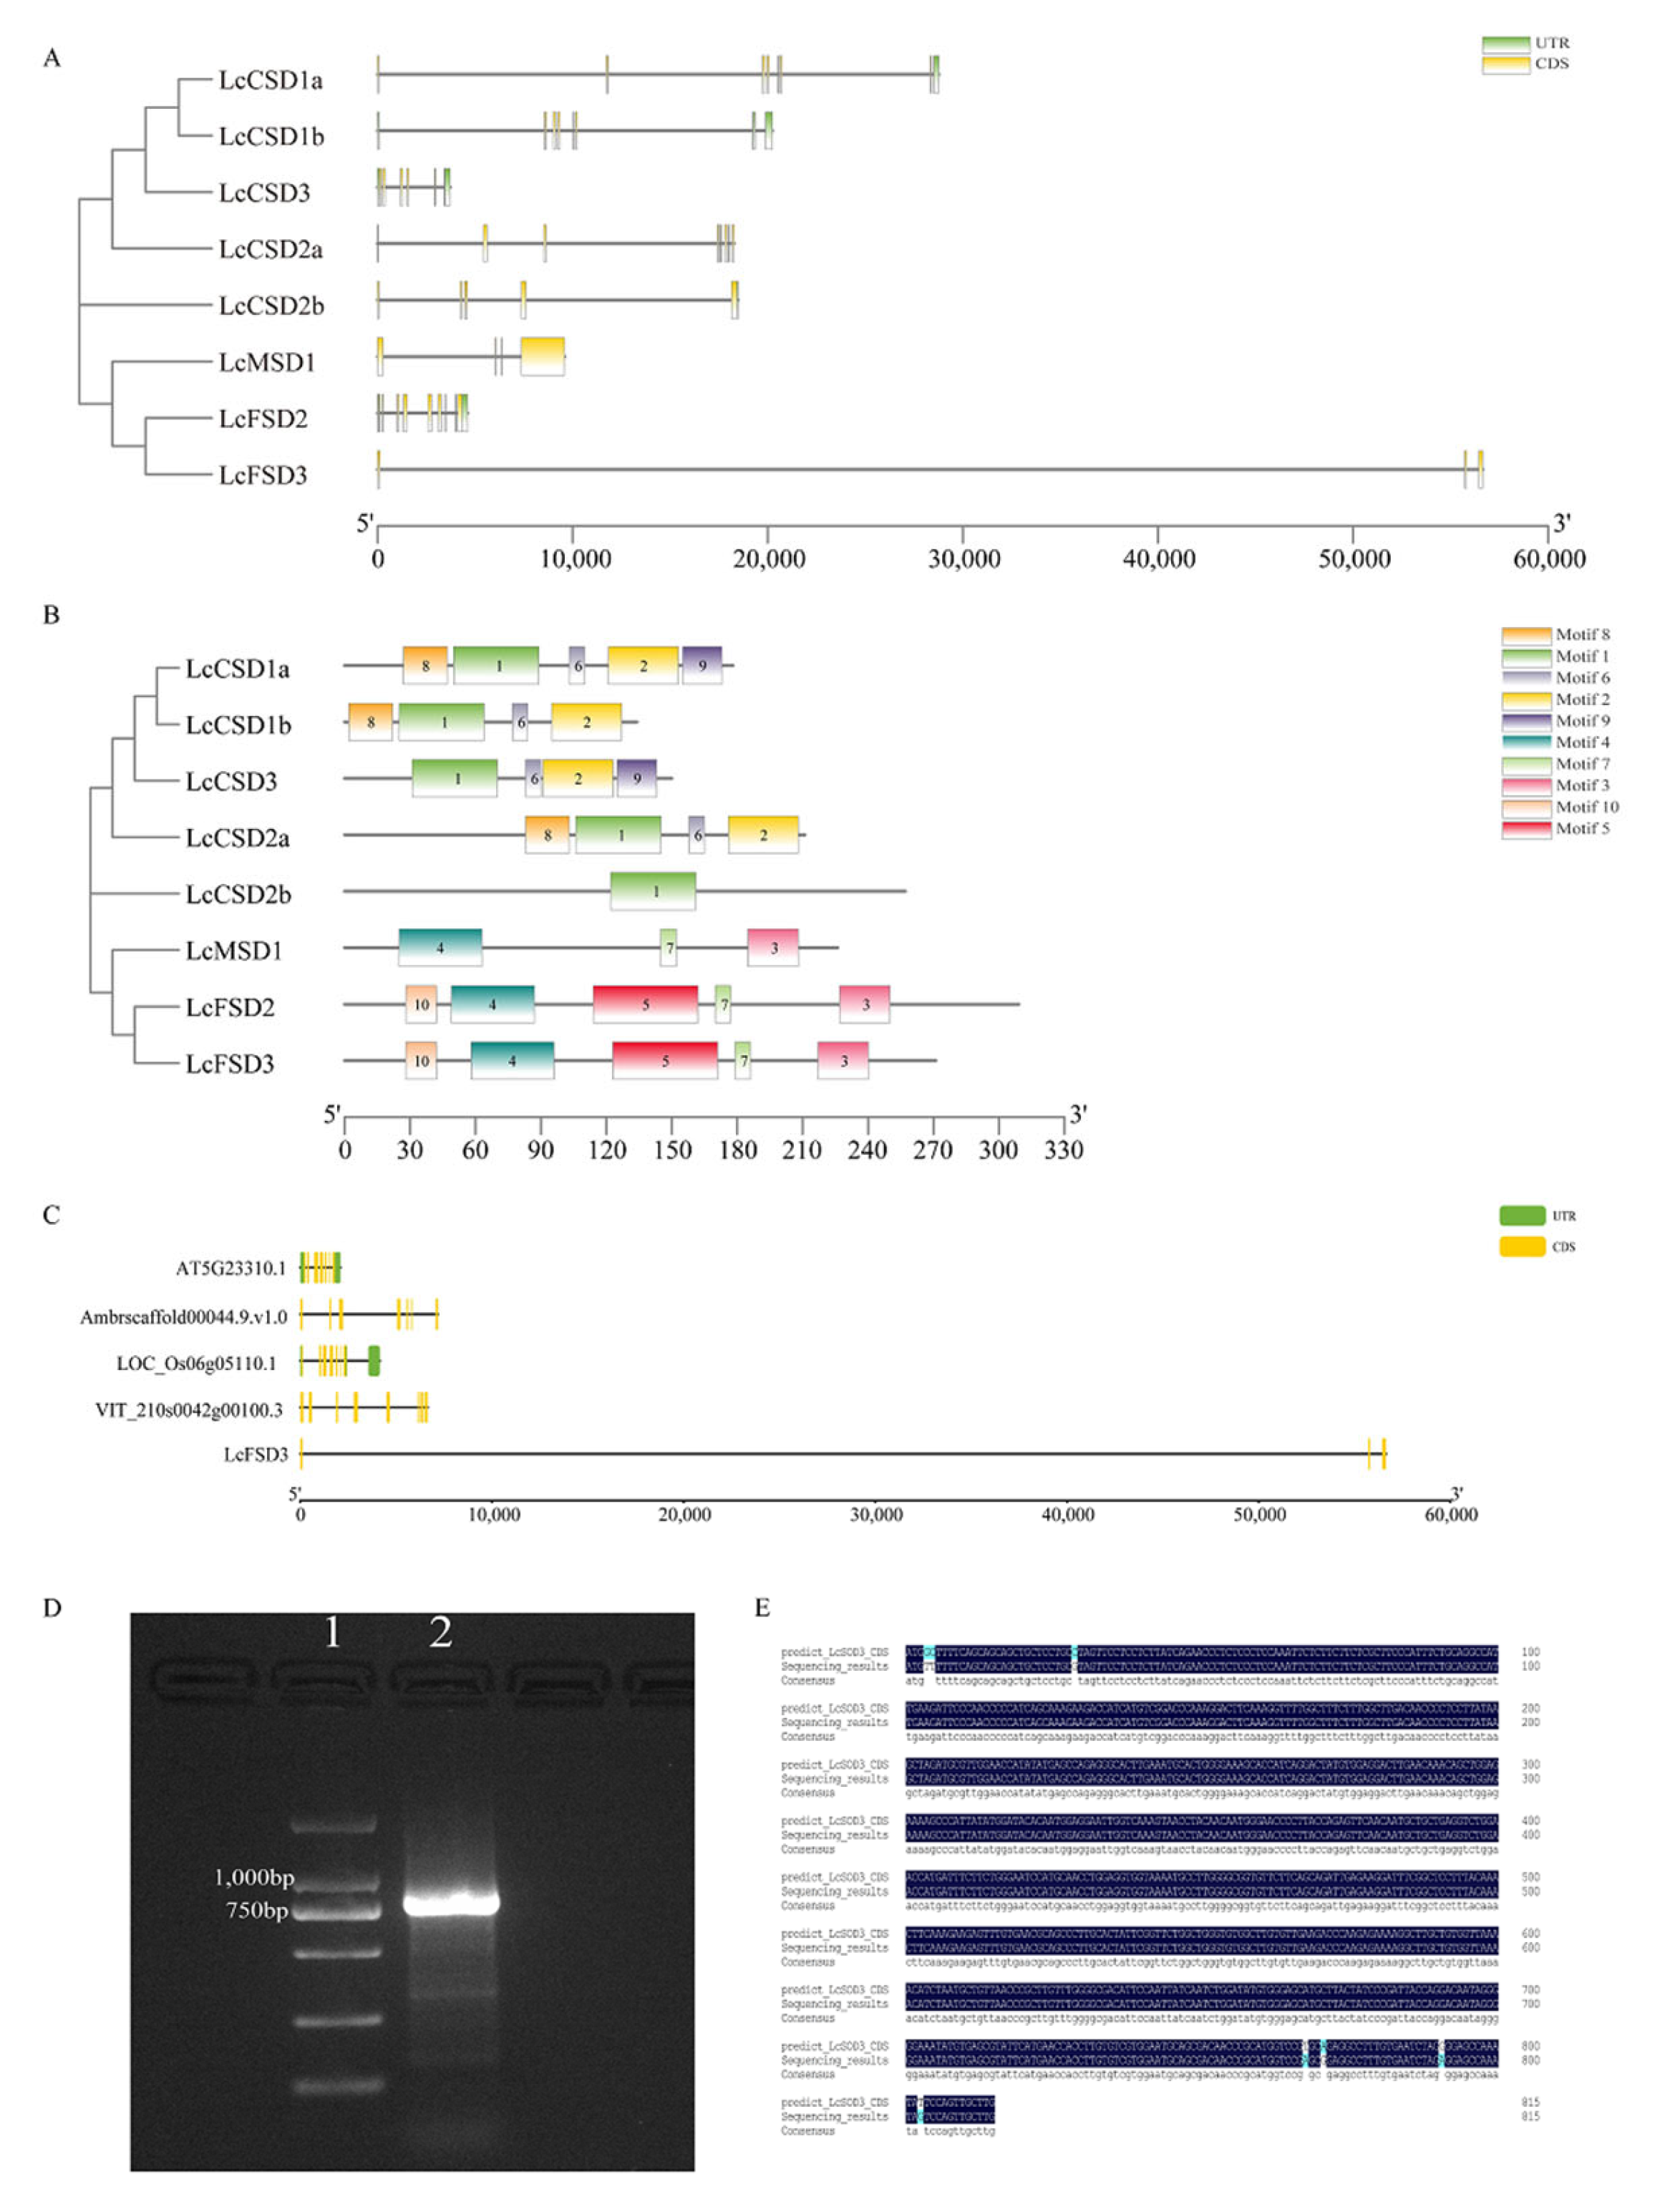
3.4. Analysis of the SOD Family Gene Structure in L. chinense

To further study the information of SOD genes in L. chinense, we analyzed their structure, and the results show that all LcSOD genes contained 2 to 8 introns. Some LcSOD genes contained a large number of introns: LcFSD2 (8 introns), LcCSD1a (7 introns), LcCSD1b (7 introns), LcCSD2a (7 introns), and LcCSD3 (5 introns); the other LcSOD genes had 2 to 3 introns (Figure 4A).
Motif analysis shows that LcSODs contained different motif numbers. Among them, LcCSD2b contained only motif 1; LcCSD1a, LcCSD1b, LcCSD2a, and LcCSD3 contained motifs 1, 2, and 6, indicating that motif 1 was the only conserved domain of Cu/Zn-SOD subfamily members. Besides LcCSD3, the other three proteins all contained motif 8, while LcFSD2 and LcFSD3 all contained motifs 3, 4, 5, 7, and 10. The LcCSD1a, LcCSD1b, and LcCSD2a proteins all contained motif 8, while the LcCSD1a and LcCSD3 proteins both contained motif 9 (Figure 3B).
The comparison of the LcFSD3 gene structure with four other plant species showed that the intron length of LcFSD3 was abnormal. To verify the existence of this abnormality, we designed specific primers on the basis of the predicted CDS, and the results of electrophoresis and sequencing show that LcFSD3 was normal despite the long intron (Figure 4D,E). Some error may have occurred when the genome was assembled.

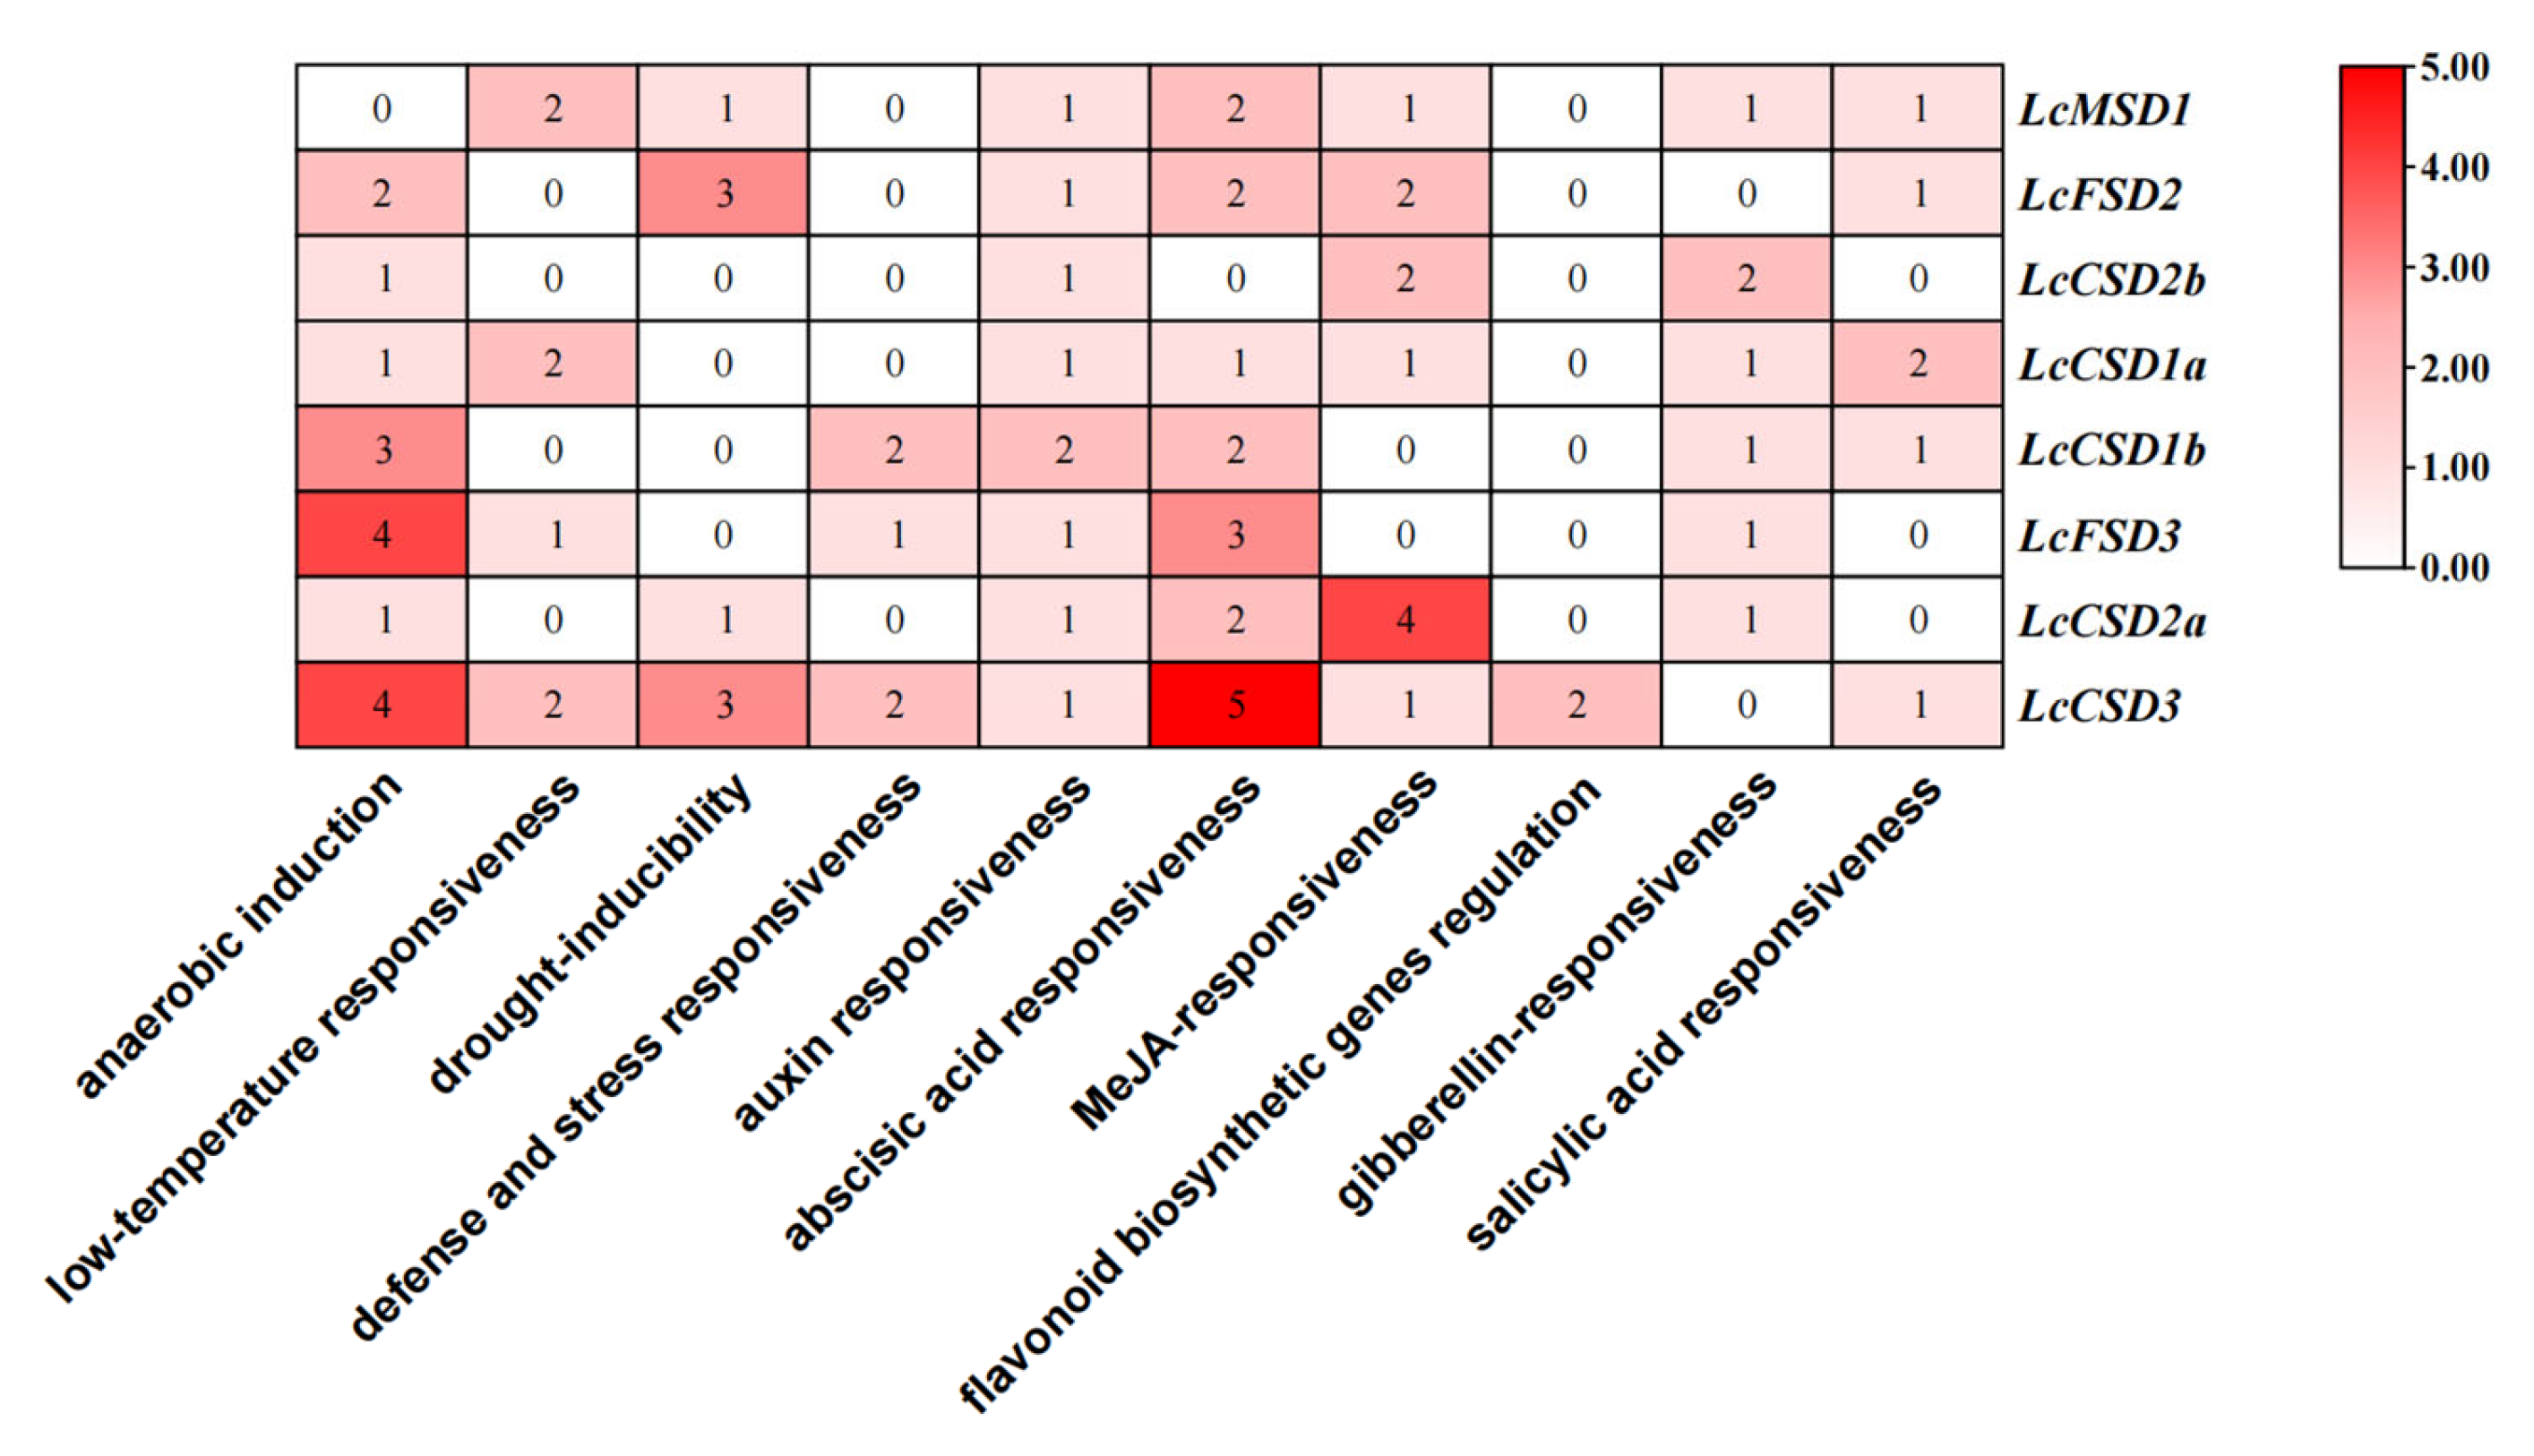
3.5. Cis-Regulatory Element Analysis

In this study, we predicted the 2000 bp upstream cis-elements of eight LcSOD genes, which helped in exploring the potential mechanism of the gene response to multiple stresses. Promoter prediction results show that the cis-regulatory element contained a variety of response elements associated with environmental stress and plant hormone responses: the MYB binding site, the defense and stress response element, the cryogenic response element, the anaerobic induction element, the ABA response element, the MeJA response element, the gibberellin (GA) response element, the salicylic acid (SA) response element, the auxin response element, and the circadian control element.
Among these eight members, seven LcSOD gene promoters contained anaerobic induction elements, three LcSOD gene promoters contained defense and stress response elements, and four LcSOD gene promoters contained low-temperature response elements. We identified seven LcSOD gene promoters containing ABA response elements, six LcSOD gene promoters containing MeJA response elements, five LcSOD gene promoters containing SA response elements, eight LcSOD gene promoters containing auxin response elements. These results suggest that SODs may be regulated by these elements, which may influence the expression of SODs under stress (Figure 5).

3.6. Expression Analysis of LcSOD Genes across Different Tissues and Abiotic Stresses

On the basis of available transcriptome data, we studied the expression patterns of SOD genes in yjr bark, bud, phloem, sepal, stamen, stigma, xylem, and leaves, and found that most LcSOD genes were relatively highly expressed in the leaves, while LcCDS1b peaked in the bark, and LcMSD1 and LcFSD3 peaked in the sepal (Figure 6A). The expression levels of LcCSD1b, 2b, and 1a in bark were higher, while the expression levels of other LcSOD genes were lower. The expression of most LchSOD genes in the xylem and phloem was generally not high.
In addition, we examined the expression patterns of LcSODs under the abiotic stresses of heat, drought, and cold (Figure 6B–D). Under high-temperature stress, LcSOD2b and LcSOD1b responded quickly and peaked at 1 h, while LcSOD3 increased to the peak value at 6 h (Figure 6B). In response to drought stress, most LcSOD genes first increased and then decreased with a peak value at around 3–12 h (Figure 6C). Interestingly, most LcSOD genes showed identical expression patterns in response to cold stress that first decreased and was then restored to the original expression level at 12 h, followed by a marked decrease into the valley (Figure 6D).

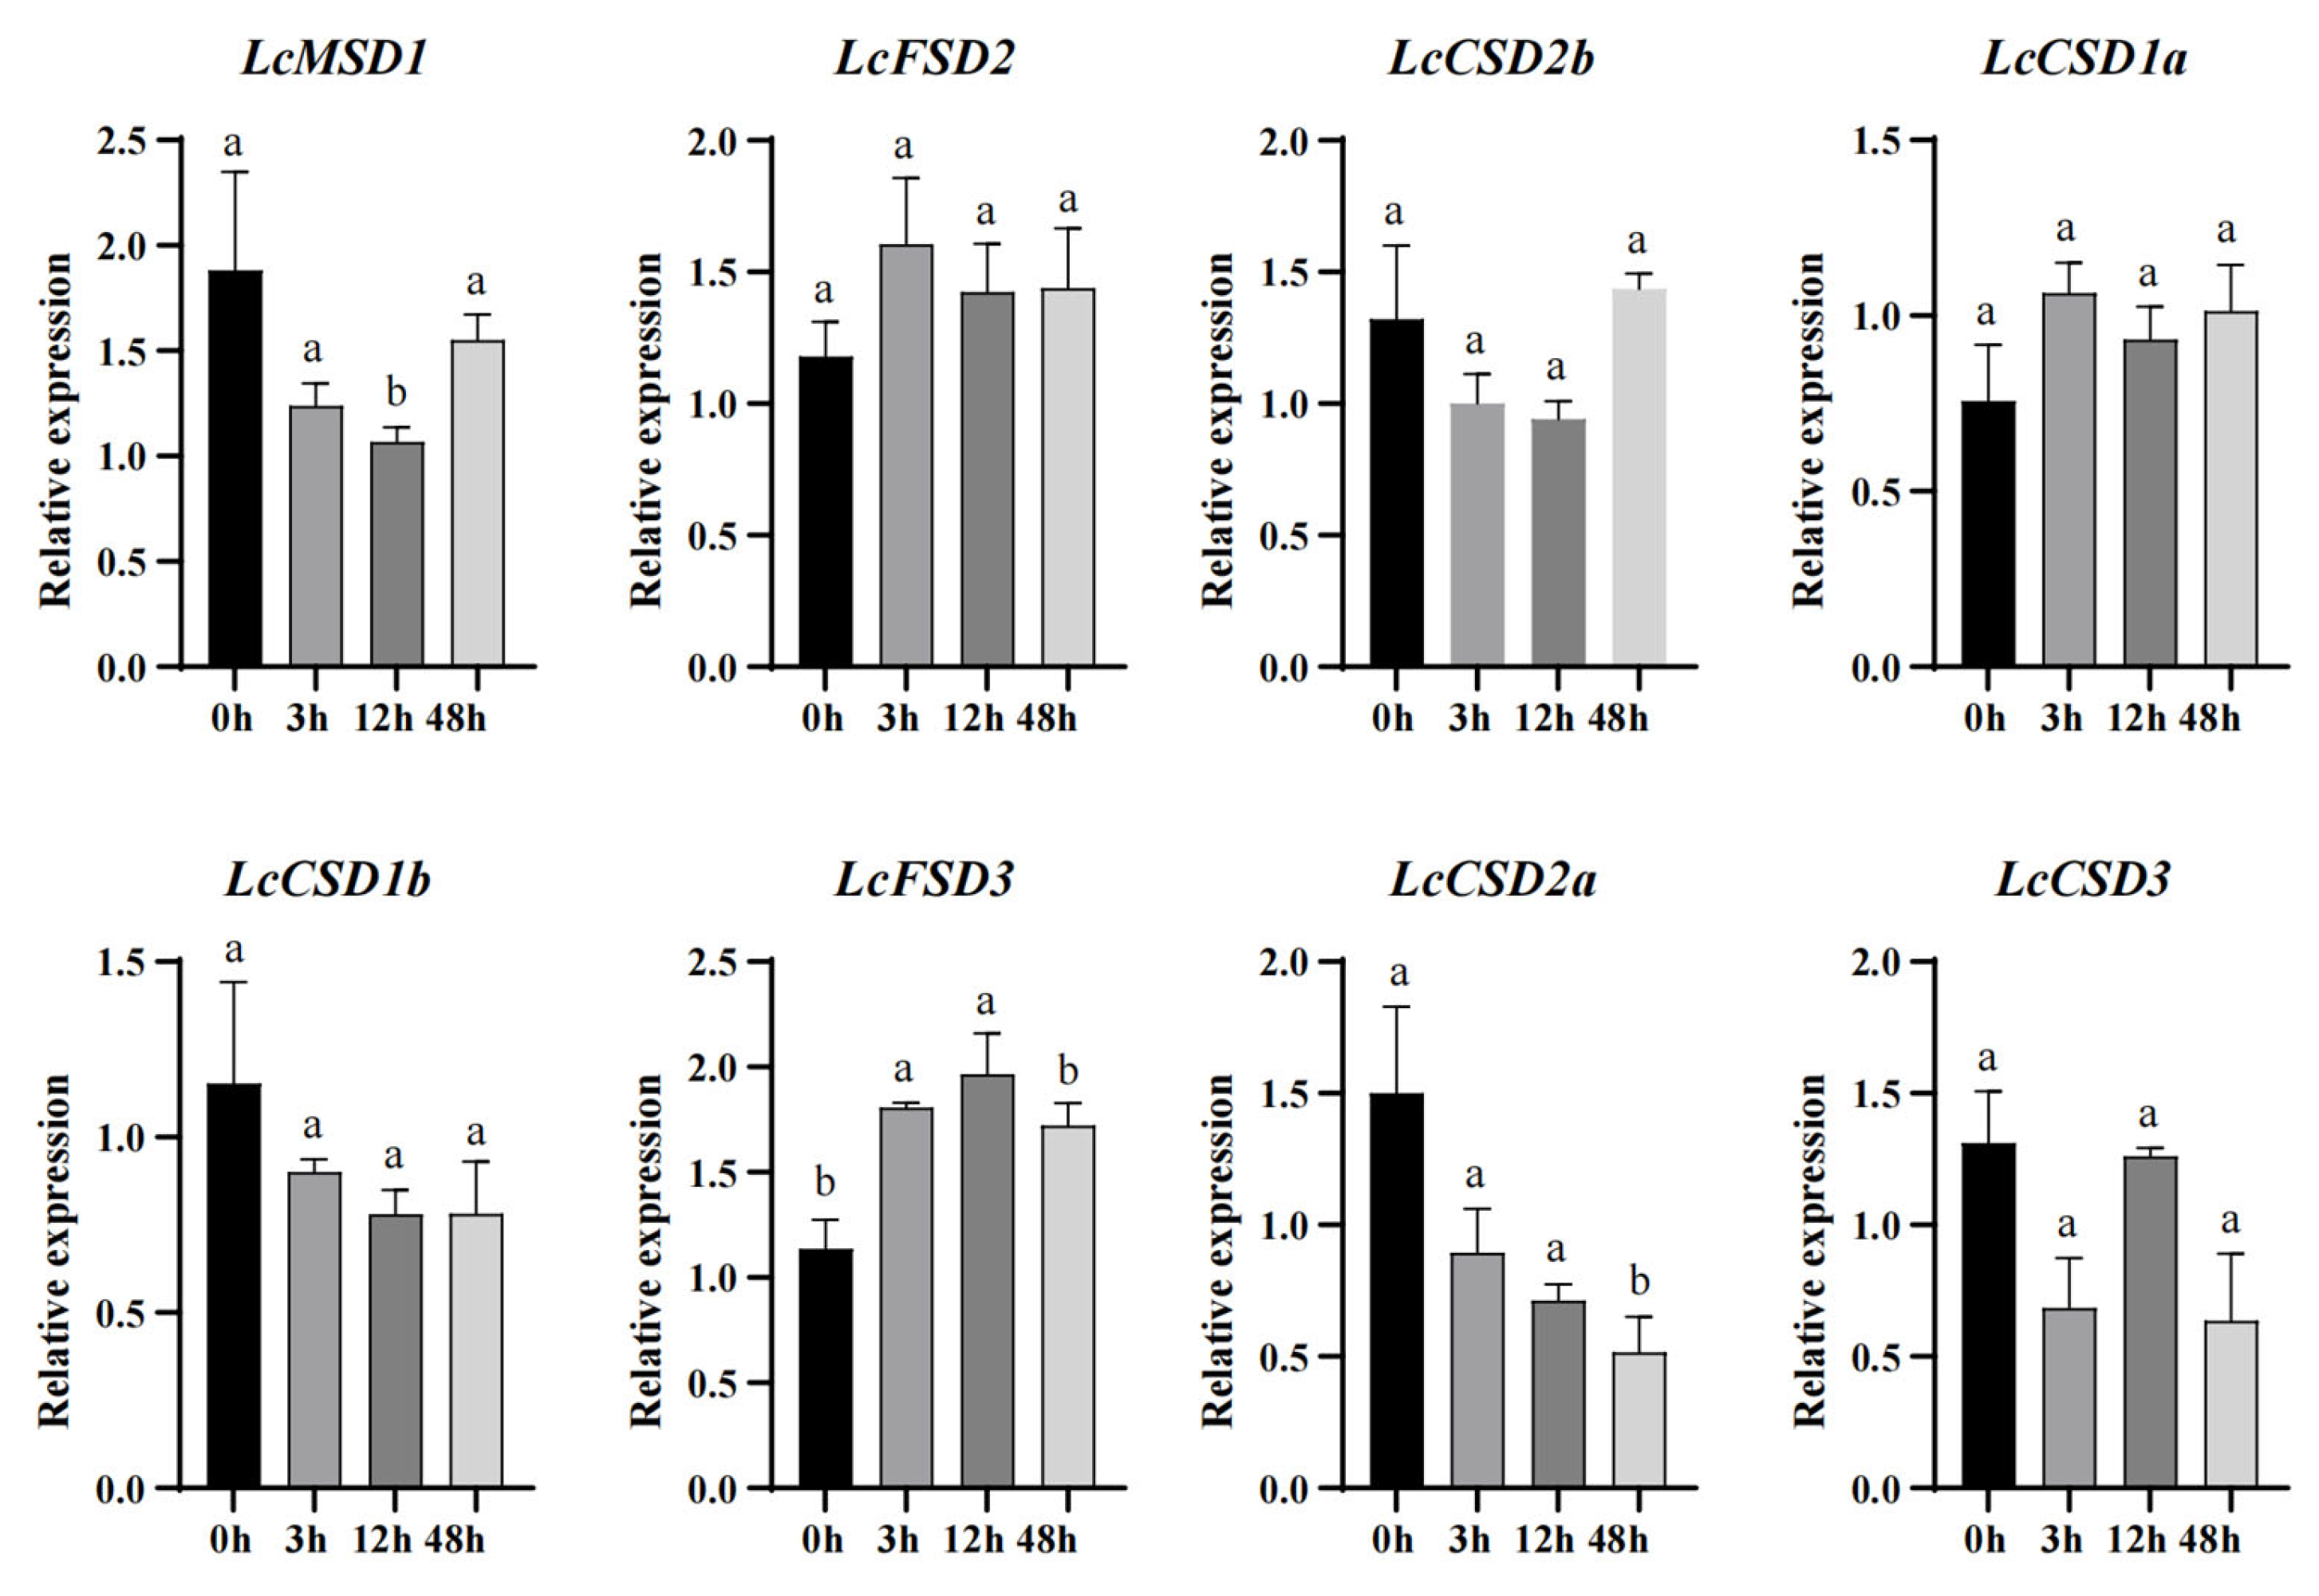
3.7. Expression Analysis of LcSOD Genes under Cold Stress

To further confirm the transcriptional responses of LcSODs to cold stress, we analyzed their expression patterns under cold stress using qRT-PCR experiments. The results show that only three LcSODs were significantly induced by cold stress (Figure 7). Among them, LcMSD1 decreased first into the valley at 12 h, and was then restored at 48 h, and LcCSD2a maintained a downward trend. LcFSD3, on the other hand, increased and then decreased with a peak value at 12 h.

4. Discussion

L. chinense, as a rare and endangered species in China, has high economic, appreciation, and medicinal value. It also has high scientific research value because it is an ancient Cretaceous relict plant. Stress often induces the excessive accumulation of reactive oxygen species (ROS), which leads to oxidative stress and negatively affects L. chinense growth and development. However, plants have formed a self-protective mechanism in the process of evolution to reduce harm caused by adverse environments. SOD is a key antioxidant enzyme that participates in the plant resistance to ROS damage. SOD is an important gene family encoding the SOD protein, which plays an indispensable role in plants in responding to all kinds of environmental stimuli (such as droughts, salt stress, and low and high temperatures) [37]. Enhanced SOD activity in plants can increase the plant resistance to a variety of stresses [38]. The plant SOD gene family was identified genomewide in Arabidopsis, Brassica rapa, barley, grapes, Zea mays, Sorghum bicolor, cotton, cucumber and Salvia miltiorrhiza, indicating a regulating role when plants are subjected to low and high temperatures, droughts, and other environmental stresses [39,40,41,42,43,44,45,46,47].
Genomic size varies considerably between plant species, but the number of SOD genes does not change proportionally with genomic size [48]. Although there are differences in the genome among L. chinense, rice, A.trichopoda, V.vinifera, and Arabidopsis, there is no significant difference in the number of SOD genes. The 8 members identified in the L. chinense genome in this study are distributed on 7 chromosomes, namely, 5 Cu/Zn-SOD members, 2 Fe-SOD members, and 1 Mn-SOD member, which constitute 3 main types of plant SOD genes. The number and proportion of the genes of Cu/Zn-SOD, Fe-SOD, and Mn-SOD are similar in different species. The number of Cu/Zn-SOD and Fe-SOD is greater, but the number of Mn-SOD is smaller. The 9 tomato SISOD genes are distributed on 6 chromosomes: 4 Cu/Zn-SOD members, 4 Fe-SOD members, and 1 Mn-SOD member. In this study, no tandem repeat events were identified in LcSOD genes through collinearity analysis, but tandem repeats from the same chromosome were identified in tomatoes (SlSOD5 and SlSOD8) [16]. The results of the syntenic analysis of SODs among three species show that there were three collinear gene pairs in Arabidopsis and L. chinense, and five collinear gene pairs in L. chinense and rice. According to the analysis of physical and chemical properties, the three different types of LcSOD proteins were predicted to localize in the cytoplasm, chloroplast, and mitochondria, which is consistent with the localization results in tobacco [49].
The analysis of the gene structure shows that the number of the introns of LcSOD was in the range of 2–8. Most of LcSOD genes contained 7–8 introns, and only a few contained 2–3 introns. In addition, the two groups of LcSOD genes contained similar intron–exon structures, which indicates that LcSOD genes were highly conserved during evolution. This is consistent with the similar intron/exon organizational pattern of SOD genes in tomatoes. LcSOD genes were clustered into different clades, each of which possessing similar motifs in regard to the number and sequence. The results show that different LcSOD gene members of the same subfamily were more conserved in evolution, and these genes may have also had similar biological functions. Cu/Zn-SOD contains motif 1, while Fe/Mn-SOD contains motifs 3 and 4. These results are similar to those in A. thaliana and tomatoes, indicating that SOD genes were highly conserved across different plant species during evolution [16,50].
To better understand the phylogenetic relationship of LcSOD, we combined the SOD genes of several species to construct a phylogenetic tree. The results show that the subfamily classification was closely related to the type of the functional domains of the SOD protein. The eight LcSOD genes were homologous with the SOD genes of rice and grapes, suggesting that LcSOD genes might have a similar abiotic stress resistance function as that of rice and grape SOD genes. In addition, six LcSOD proteins were predicted to be localized in chloroplasts, indicating that these LcSOD genes might be involved in scavenging photosynthate-generated ROS, which is similar to the high expression of five SOD genes in watermelon leaves [51]. There are substantially more members in the Cu/Zn-SOD subfamily than those of the Fe-SOD or Mn-SOD subfamily, suggesting that the SOD gene in this subfamily is an indispensable part of plant growth, development, and stress response. In addition, the closest evolutionary distance between A. trichopoda and L. chinense SOD genes indicates the basal evolutionary position of L. chinense in the angiosperm.
Plants under stress need to increase the activity of the SOD enzyme to enhance the ability of scavenging ROS, which is the premise of improving the expression of SOD genes [52]. On this basis, we studied and analyzed the expression patterns of LcSODs in different tissues and under different abiotic stresses, and found that LcSOD genes were especially highly expressed in the leaves, and involved in the response to different abiotic stresses. Almost all LcSOD genes were highly expressed in the leaves, the main photosynthetic organ in plants, suggesting that SOD is a crucial enzyme in scavenging ROS generated from photosynthesis [53]. Expression analysis shows that each LcSOD gene responded to at least one type of abiotic stress (heat, cold, and drought) examined in this study. In addition, according to the analysis of putative LcSOD promoters, LcSOD gene family promoters contain a number of abiotic stress cis-elements that are involved in the low-temperature, drought-response, defense and stress response elements, etc. This could explain why LcSOD showed an obvious response to the four abiotic stresses. Under drought stress, the expression levels of LcCSD1b and 2b were upregulated at 1 h, and LcCSD3 was upregulated at 6 h, while the changes of other genes were not obvious, which was similar to the upregulated expression levels of BjuCSD8 and BjuFSD3d in Brassica juncea under drought stress [17]. Studies have shown that heat stress can lead to the photosuppression of Photosystem II, thus causing ROS to accumulate in cells. Under heat stress, almost all LcSOD genes were upregulated. Therefore, we speculate that LcSOD genes may contribute to ROS clearance and protect cells from damage [54]. However, LcMSD1 was downregulated under cold stress, and MSD was also downregulated in Medicago truncatula, tomatoes, and cotton for a period of time [16,45,53]. In addition, we identified that LcFSD3 may participate in recovery from cold stress by scavenging excessive ROS caused by low-temperature stress in the leaves (Figure 7), thus providing a prospective target gene to enhance cold resistance, particularly in valuable woody plant L. chinense.

5. Conclusions

In this study, the SOD gene family of L. chinense was analyzed with bioinformatics for the first time. A total of 8 LcSOD genes were identified from L. chinense. LcSODs could be divided into two groups according to phylogenetic and structural analyses. Members of the same group had similar structural characteristics. The promoter region of LcSOD genes also identified cis-regulatory elements in response to plant hormone and abiotic stress. In addition, transcriptome data and qRT-PCR analysis showed that LcSOD genes could respond to temperature and drought stresses. These results provide insight for further research on the biological function of single genes of and genetic improvements in L. chinense.

Author Contributions

Conceptualization, Y.C. and L.Z.; methodology, Y.C. and L.Z.; software, Y.C. and L.Z.; validation, Y.C. and H.W.; formal analysis, Y.C. and L.Z.; investigation, Y.C.; resources, Y.C.; data curation, L.L.; writing—original draft preparation, Y.C.; writing—review and editing, L.Z., H.W. and Z.H.; visualization, Y.C.; supervision, J.S.; project administration, J.C.; funding acquisition, J.C. All authors have read and agreed to the published version of the manuscript.

Funding

this research was supported by the National Key R&D Program of China during the 14th Five-year Plan Period (2021YFD2200103), the Youth Foundation of the Natural Science Foundation of Jiangsu Province (grant no. BK20210614), and the Priority Academic Program Development of Jiangsu Higher Education Institutions (PAPD).

Data Availability Statement

All analyzed transcriptome data were published on the NCBI website; cold and heat stress accession number is PRJNA679089, and drought stress accession number is PRJNA679101.

Conflicts of Interest

The authors declare no conflict of interest.

References

  1. Zhang, H.; Guo, C. Cloning, characterization and expression analysis of two superoxide dismutase (SOD) genes in wheat (Triticum aestivum L.). Front. Agric. China 2008, 2, 141–149. [Google Scholar] [CrossRef]
  2. Mhamdi, A.; Van Breusegem, F. Reactive oxygen species in plant development. Development 2018, 145, dev164376. [Google Scholar] [CrossRef] [Green Version]
  3. Gill, S.S.; Peter Singh, L. Generation and scavenging of reactive oxygen species in plants under stress. In Improving Crop Resistance to Abiotic Stress; Wiley Online Library: Hoboken, NJ, USA, 2012; pp. 49–70. [Google Scholar] [CrossRef]
  4. Hasanuzzaman, M.; Bhuyan, M.B. Reactive oxygen species and antioxidant defense in plants under abiotic stress: Revisiting the crucial role of a universal defense regulator. Antioxidants 2020, 9, 681. [Google Scholar] [CrossRef] [PubMed]
  5. Feng, X.; Lai, Z. Genome-wide identification and characterization of the superoxide dismutase gene family in Musa acuminata cv. Tianbaojiao (AAA group). BMC Genom. 2015, 16, 823. [Google Scholar] [CrossRef] [PubMed] [Green Version]
  6. Das, K.; Roychoudhury, A. Reactive oxygen species (ROS) and response of antioxidants as ROS-scavengers during environmental stress in plants. Front. Environ. Sci. 2014, 2, 53. [Google Scholar] [CrossRef] [Green Version]
  7. Gill, S.S.; Anjum, N.A. Superoxide dismutase—Mentor of abiotic stress tolerance in crop plants. Environ. Sci. Pollut. Res. 2015, 22, 10375–10394. [Google Scholar] [CrossRef]
  8. Miao, L.; Clair, D.K.S. Regulation of superoxide dismutase genes: Implications in disease. Free. Radic. Biol. Med. 2009, 47, 344–356. [Google Scholar] [CrossRef] [Green Version]
  9. Wang, M.; Zhao, X. A wheat superoxide dismutase gene TaSOD2 enhances salt resistance through modulating redox homeostasis by promoting NADPH oxidase activity. Plant Mol. Biol. 2016, 91, 115–130. [Google Scholar] [CrossRef]
  10. Zelko, I.N.; Mariani, T.J. Superoxide dismutase multigene family: A comparison of the CuZn-SOD (SOD1), Mn-SOD (SOD2), and EC-SOD (SOD3) gene structures, evolution, and expression. Free. Radic. Biol. Med. 2002, 33, 337–349. [Google Scholar] [CrossRef]
  11. Alscher, R.G.; Erturk, N. Role of superoxide dismutases (SODs) in controlling oxidative stress in plants. J. Exp. Bot. 2002, 53, 1331–1341. [Google Scholar] [CrossRef]
  12. Han, X.M.; Chen, Q.X. Genome-wide analysis of superoxide dismutase genes in Larix kaempferi. Gene 2019, 686, 29–36. [Google Scholar] [CrossRef] [PubMed]
  13. Dupont, C.L.; Neupane, K. Diversity, function and evolution of genes coding for putative Ni-containing superoxide dismutases. Environ. Microbiol. 2008, 10, 1831–1843. [Google Scholar] [CrossRef]
  14. Sen, R.S.; Deng, X.W. The role of superoxide dismutase in combating oxidative stress in higher plants. Bot. Rev. 2000, 66, 89–98. [Google Scholar] [CrossRef]
  15. Molina-Rueda, J.J.; Tsai, C.J. The Populus superoxide dismutase gene family and its responses to drought stress in transgenic poplar overexpressing a pine cytosolic glutamine synthetase (GS1a). PLoS ONE 2013, 8, e56421. [Google Scholar] [CrossRef] [PubMed] [Green Version]
  16. Feng, K.; Yu, J. The SOD gene family in tomato: Identification, phylogenetic relationships, and expression patterns. Front. Plant Sci. 2016, 7, 1279. [Google Scholar] [CrossRef] [PubMed] [Green Version]
  17. Verma, D.; Lakhanpal, N.; Singh, K. Genome-wide identification and characterization of abiotic-stress responsive SOD (superoxide dismutase) gene family in Brassica juncea and B. rapa. BMC Genom. 2019, 20, 227. [Google Scholar] [CrossRef] [Green Version]
  18. Chen, J.; Hao, Z.; Guang, X.; Zhao, C.; Wang, P.; Xue, L.; Zhu, Q.; Yang, L.; Sheng, Y.; Zhou, Y.; et al. Liriodendron genome sheds light on angiosperm phylogeny and species–pair differentiation. Nat. Plants 2019, 5, 18–25. [Google Scholar] [CrossRef] [Green Version]
  19. Cao, Y.; Feng, J. Alterations in Population Distribution of Liriodendron chinense (Hemsl.) Sarg. and Liriodendron tulipifera Linn. Caused by Climate Change. Forests 2022, 13, 488. [Google Scholar] [CrossRef]
  20. Yu, W.; Kong, G.; Chao, J.; Yin, T.; Tian, H.; Ya, H.; He, L.; Zhang, H. Genome-wide identification of the rubber tree superoxide dismutase (SOD) gene family and analysis of its expression under abiotic stress. PeerJ 2022, 10, e14251. [Google Scholar] [CrossRef] [PubMed]
  21. Chen, C.; Chen, H. TBtools: An integrative toolkit developed for interactive analyses of big biological data. Mol. Plant 2020, 13, 1194–1202. [Google Scholar] [CrossRef]
  22. Goodstein, D.M.; Shu, S.; Howson, R.; Neupane, R.; Hayes, R.D.; Fazo, J.; Mitros, T.; Dirks, W.; Hellsten, U.; Putnam, N.; et al. Phytozome: A comparative platform for green plant genomics. Nucleic Acids Res. 2012, 40, D1178–D1186. [Google Scholar] [CrossRef]
  23. Marchler-Bauer, A.; Bryant, S.H. CD-Search: Protein domain annotations on the fly. Nucleic Acids Res. 2004, 32 (Suppl. S2), W327–W331. [Google Scholar] [CrossRef]
  24. Garg, V.K.; Avashthi, H.; Tiwari, A.; Jain, P.A.; Ramkete, P.W.; Kayastha, A.M.; Singh, V.K. MFPPI–multi FASTA ProtParam interface. Bio. Inf. 2016, 12, 74–77. [Google Scholar] [CrossRef]
  25. Chou, K.C.; Shen, H.B. Plant-mPLoc: A top-down strategy to augment the power for predicting plant protein subcellular localization. PLoS ONE 2010, 5, e11335. [Google Scholar] [CrossRef] [Green Version]
  26. Krogh, A.; Larsson, B.; von Heijne, G.; Sonnhammer, E.L. Predicting transmembrane protein topology with a hidden Markov model: Application to complete genomes. J. Mol. Biol. 2001, 305, 567–580. Available online: https://pubmed.ncbi.nlm.nih.gov/11152613/ (accessed on 1 January 2023). [CrossRef] [Green Version]
  27. Larkin, M.A.; Blackshields, G.; Brown, N.P.; Chenna, R.; McGettigan, P.A.; McWilliam, H.; Valentin, F.; Wallace, I.M.; Wilm, A.; Lopez, R.; et al. Clustal W and Clustal X version 2.0. Bioinformatics 2007, 23, 2947–2948. [Google Scholar] [CrossRef] [Green Version]
  28. Bouckaert, R.; Vaughan, T.G.; Barido-Sottani, J.; Duchêne, S.; Fourment, M.; Gavryushkina, A.; Heled, J.; Jones, G.; Kühnert, D.; Maio, N.D.; et al. BEAST 2.5: An advanced software platform for Bayesian evolutionary analysis. PLoS Comput. Biol. 2019, 15, e1006650. [Google Scholar] [CrossRef] [Green Version]
  29. Bailey, T.L.; Boden, M.; Buske, F.A.; Frith, M.; Grant, C.E.; Clementi, L.; Ren, J.; Li, W.W.; Noble, W.S. MEME SUITE: Tools for motif discovery and searching. Nucleic Acids Res. 2009, 37 (Suppl. S2), W202–W208. [Google Scholar] [CrossRef]
  30. Tang, H.; Bowers, J.E.; Wang, X.; Ming, R.; Alam, M.; Paterson, A.H. Synteny and collinearity in plant genomes. Science 2008, 320, 486–488. [Google Scholar] [CrossRef] [Green Version]
  31. Lescot, M.; Déhais, P.; Thijs, G.; Marchal, K.; Moreau, Y.; Van de Peer, Y.; Rouzé, P.; Rombauts, S. PlantCARE, a database of plant cis-acting regulatory elements and a portal to tools for in silico analysis of promoter sequences. Nucleic Acids Res. 2002, 30, 325–327. [Google Scholar] [CrossRef] [PubMed]
  32. Bray, N.L.; Pimentel, H.; Melsted, P.; Pachter, L. Near-optimal probabilistic RNA-seq quantification. Nat. Biotechnol. 2016, 34, 525–527. [Google Scholar] [CrossRef]
  33. Wu, W.; Zhu, S.; Xu, L.; Zhu, L.; Wang, D.; Liu, Y.; Liu, S.; Hao, Z.; Lu, Y.; Yang, L.; et al. Genome-wide identification of the Liriodendron chinense WRKY gene family and its diverse roles in response to multiple abiotic stress. BMC Plant Biol. 2022, 22, 25. [Google Scholar] [CrossRef] [PubMed]
  34. Livak, K.J.; Schmittgen, T.D. Analysis of relative gene expression data using real-time quantitative PCR and the 2−ΔΔCT method. Methods 2001, 25, 402–408. [Google Scholar] [CrossRef] [PubMed]
  35. Field, A. Discovering Statistics Using IBM SPSS Statistics; Sage Publications Ltd.: Thousand Oaks, CA, USA, 2013. [Google Scholar]
  36. Swift, M.L. GraphPad prism, data analysis, and scientific graphing. J. Chem. Inf. Comput. Sci. 1997, 37, 411–412. [Google Scholar] [CrossRef]
  37. Wang, W.; Xia, M.X. Gene expression characteristics and regulation mechanisms of superoxide dismutase and its physiological roles in plants under stress. Biochemistry 2016, 81, 465–480. [Google Scholar] [CrossRef] [PubMed]
  38. Jiang, W.; Yang, L. Genome-wide identification and transcriptional expression analysis of superoxide dismutase (SOD) family in wheat (Triticum aestivum). PeerJ 2019, 7, e8062. [Google Scholar] [CrossRef] [PubMed] [Green Version]
  39. Kliebenstein, D.J.; Monde, R.A. Superoxide dismutase in Arabidopsis: An eclectic enzyme family with disparate regulation and protein localization. Plant Physiol. 1998, 118, 637–650. [Google Scholar] [CrossRef] [Green Version]
  40. Filiz, E.; Tombuloğlu, H. Genome-wide distribution of superoxide dismutase (SOD) gene families in Sorghum bicolor. Turk. J. Biol. 2015, 39, 49–59. [Google Scholar] [CrossRef]
  41. Qureshi, A.M.I.; Sofi, M.U. Insilco identification and characterization of superoxide dismutase gene family in Brassica rapa. Saudi J. Biol. Sci. 2021, 28, 5526–5537. [Google Scholar] [CrossRef]
  42. Aleem, M.; Aleem, S. Characterization of SOD and GPX Gene Families in the Soybeans in Response to Drought and Salinity Stresses. Antioxidants 2022, 11, 460. [Google Scholar] [CrossRef]
  43. Zhang, X.; Zhang, L. Genome-wide identification of the SOD gene family and expression analysis under drought and salt stress in barley. Plant Growth Regul. 2021, 94, 49–60. [Google Scholar] [CrossRef]
  44. Hu, X.; Hao, C. Genome-wide identification, characterization, and expression analysis of the grapevine superoxide dismutase (SOD) family. Int. J. Genom. 2019, 2019, 7350414. [Google Scholar] [CrossRef] [PubMed]
  45. Wang, W.; Zhang, X. Genome-wide characterization and expression analyses of superoxide dismutase (SOD) genes in Gossypium hirsutum. BMC Genom. 2017, 18, 376. [Google Scholar] [CrossRef] [PubMed] [Green Version]
  46. Han, L.; Hua, W. Genome-wide identification and expression analysis of the superoxide dismutase (SOD) gene family in Salvia miltiorrhiza. Gene 2020, 742, 144603. [Google Scholar] [CrossRef]
  47. Zhang, J.; Li, B. Genome-wide characterization and expression profiles of the superoxide dismutase gene family in Gossypium. Int. J. Genom. 2016, 2016, 8740901. [Google Scholar] [CrossRef] [Green Version]
  48. Zhou, Y.; Hu, L. Genome-wide identification and transcriptional expression analysis of cucumber superoxide dismutase (SOD) family in response to various abiotic stresses. Int. J. Genom. 2017, 2017, 7243973. [Google Scholar] [CrossRef] [Green Version]
  49. Huo, C.; He, L. The Superoxide Dismutase Gene Family in Nicotiana tabacum, Genome-Wide Identification, Characterization, Expression Profiling and Functional Analysis in Response to Heavy Metal Stress. Front. Plant Sci. 2022, 13, 904105. [Google Scholar] [CrossRef]
  50. Fink, R.C.; Scandalios, J.G. Molecular evolution and structure–function relationships of the superoxide dismutase gene families in angiosperms and their relationship to other eukaryotic and prokaryotic superoxide dismutases. Arch. Biochem. Biophys. 2002, 399, 19–36. [Google Scholar] [CrossRef]
  51. Zhou, Y.; Ouang, L. Superoxide dismutase family genes in watermelon and their responses to different abiotic stresses. Front. Agric. Sci. Eng. 2021, 8, 645–658. [Google Scholar] [CrossRef]
  52. Bowler, C.; Van Camp, W. Superoxide dismutase in plants. Crit. Rev. Plant Sci. 1994, 13, 199–218. [Google Scholar] [CrossRef]
  53. Song, J.; Zeng, L. In silico identification and expression analysis of superoxide dismutase (SOD) gene family in Medicago truncatula. 3 Biotech 2018, 8, 348. [Google Scholar] [CrossRef] [PubMed]
  54. Lu, T.; Meng, Z.; Zhang, G.; Qi, M.; Sun, Z.; Liu, Y.; Li, T. Sub-high temperature and high light intensity induced irreversible inhibition on photosynthesis system of tomato plant (Solanum lycopersicum L.). Front. Plant Sci. 2017, 8, 365. [Google Scholar] [CrossRef] [PubMed] [Green Version]
Figure 1. Three-month-old tissue culture seedlings. Scale, 1 cm.
Forests 14 00628 g001
Figure 2. Phylogenetic relationships of the SOD family genes from L. chinense (Lc), Arabidopsis thaliana (At), rice (Os), A. trichopoda (Ambr), and V. vinifera (VIT). Fe/Mn-SODs and Cu/Zn-SODs are indicated with pink and purple, respectively, and the LcSOD protein is in red. The size of the green circle represents the posterior value of the phylogenetic tree.
Forests 14 00628 g002
Figure 3. (A) Location of eight SOD genes on the chromosome of L. chinense. Gray lines, positions of each member of the SOD gene family on the chromosome. The orange font on the left of the chromosome is the chromosome number. The color distribution on the chromosome represents the distribution of the gene density on the chromosome. The vertical scale indicates the chromosome size. (B) Syntenic analysis of LcSOD genes among L. chinense, Arabidopsis, and rice. AtSOD, LcSOD, and OsSOD are represented by haze blue, orange, and green, respectively. Grass-green lines connect the genes with their collinear relationship.
Forests 14 00628 g003
Figure 4. (A) Domain distribution of LcSOD genes. Introns and exons are represented by horizontal lines and yellow boxes, respectively. UTRs are indicated by green boxes. (B) Conservative motif distribution of LcSOD genes. The different colors represent different motifs. (C) Structure of FSD3 from L. chinense (Lc), A. thaliana (At), rice (Os), A. trichopoda (Ambr), and V. vinifera (VIT). (D) Cloning results of the LcFSD3 gene. Lane 1 is the 2000 maker and Lane 2 is the amplification products. The amplification products were identified at 750–1000 bp. (E) Sequence comparison between the LcFSD3 reference sequence and Sanger sequencing results. Different colors represent different comparison conditions.
Forests 14 00628 g004
Figure 5. Summary of cis-acting elements’ number and function of SOD genes in L. chinense. Shading represents quantity.
Forests 14 00628 g005
Figure 6. Heat map of the differential expression of LcSOD genes in different tissues and under different abiotic stresses. (A) Heat map of the differential expression of LcSOD genes in different tissues. (B) Heat map of the differential expression of LcSOD genes under heat stress. (C) Heat map of the differential expression of LcSOD genes under drought stress. (D) Heat map of the differential expression of LcSOD genes under cold stress. Darker red in the expression map indicates a higher expression level. CK, untreated control group. Row data were standardized by using log2(x+1). X, relative expression quantity.
Forests 14 00628 g006
Figure 7. Expression profiles of LcSODs under cold stress. Experimental results are expressed in terms of the relative expression quantity. The reference genes were 18S RNA and GAPDH of L. chinense. The results of multiple comparisons are represented by letters.
Forests 14 00628 g007
Table 1. qRT-PCR primers used to quantify LcSOD gene expression.
Gene NameqRT-PCR Primers (5′-3′)
LcMSD1FATCATGAAGCTCCACCACCA
RGTGATTGACATGACCTCCGC
LcFSD2FCATGGGGCTGGAAAATCACC
RGTGCCTTCCCCAGTGATACT
LcFSD3FTCCTGCCTAGTTCCTCCTCT
RAAGTCCTTTGGGTCCGACAT
LcCSD1aFATGCTGGTGATCTCGGGAAT
RTCCGCCCTTTCCAAGATCAT
LcCSD1bFGGAGATGGCCCAACTACAGT
RCCATGTTCTTTCCCAGCAGG
LcCSD2aFTCCAGGGAAGTGCTGATCAA
RCTGCTCCGACGAATATCCCT
LcCSD2bFTCCCATGGATCATCGCCTAC
RGTTGGTCGGGCAGTTGATTT
LcCSD3FAGGCTCTCTTCAGTTCGTCC
RGAATTGCATCCGTTGGTGGT
Table 2. Details of SOD family members in L. chinense.
Gene IDNumber of Amino Acids (aa)Molecular Weight (Da)Aliphatic IndexGRAVY pISubcellular LocalizationTransmembrane Domain
LcCSD2b25727,288.879.3−0.1534.8ChloroplastNO
LcCSD1b13413,299.780.75−0.0965.07ChloroplastNO
LcFSD230935,287.4471.68−0.5595.24
5.41
5.44
ChloroplastNO
LcCSD2a21122,096.9492.42−0.085ChloroplastNO
LcCSD1a17818,166.1678.88−0.166ChloroplastNO
LcMSD122625,121.6493.63−0.3586.55
6.71
MitochondrionNO
LcFSD327131,106.4775.9−0.409MitochondrionNO
LcCSD315015,125.987.2−0.1737.16Chloroplast/CytoplasmNO
Disclaimer/Publisher’s Note: The statements, opinions and data contained in all publications are solely those of the individual author(s) and contributor(s) and not of MDPI and/or the editor(s). MDPI and/or the editor(s) disclaim responsibility for any injury to people or property resulting from any ideas, methods, instructions or products referred to in the content.

