Article

Soil C, N, P, K and Enzymes Stoichiometry of an Endangered Tree Species, Parashorea chinensis of Different Stand Ages Unveiled Soil Nutrient Limitation Factors

1
Guangxi Key Laboratory of Forest Ecology and Conservation, College of Forestry, Guangxi University, Nanning 530004, China
2
Key Laboratory of National Forestry and Grassland Administration on Cultivation of Fast-Growing Timber in Central South China, College of Forestry, Guangxi University, Nanning 530004, China
*
Author to whom correspondence should be addressed.
These authors contributed equally to this work.
Forests 2023, 14(3), 624; https://doi.org/10.3390/f14030624
Submission received: 26 February 2023 / Revised: 15 March 2023 / Accepted: 17 March 2023 / Published: 20 March 2023
(This article belongs to the Special Issue Effects of Disturbances on Forest Soil Biochemistry)

Abstract

:
Parashorea chinensis is an endemic tree species in China and an endangered species of the Dipterocarpaceae family. This study contributes to the understanding of soil fertility management during the relocation and conservation of P. chinensis and the restoration of its natural communities by doing an ecological chemometric investigation of the factors limiting soil nutrients in P. chinensis plantations. To investigate the variation in rhizosphere and non-rhizosphere soil nutrients, microbial biomass, and extracellular enzyme activities, we chose pure plantation stands of 6 ages in the subtropics and calculated stoichiometric ratios. The results show that (1) soil pH is strongly acidic (pH < 4.6) and is less influenced by the stand age, and the soil carbon (C), nitrogen (N), and phosphorus (P) content limit soil microorganisms at all stand ages; (2) the availability of soil N, P, and K elements is an essential factor driving P limitation in the growth of P. chinensis and its soil microbes; (3) stand age has a significant effect on the soil C/N, C/P, N/P, C/K, N/K, and P/K, the stoichiometry of microbial biomass C, N, and P, and the stoichiometry of C, N, and P acquisition enzyme activity. Soil microbial biomass C, N, and P stoichiometry are more sensitive indicators of nutrient limitations than the stoichiometry of enzyme activity and nutrient content; and (4) there was a significant correlation between microbial biomass C, N, and P stoichiometry and soil C/P and N/P, as well as a highly significant (p < 0.01) correlation between the stoichiometry of the enzyme activity and Vector L and Vector A. In conclusion, the plantations of P. chinensis in this study area were established on acidic phosphorus-poor soil, and the ecological stoichiometry of the soil reveals nutrient limitations and its variation with the stand age. P availability plays a key role in the growth of P. chinensis and in improving the rhizosphere microbial community. Therefore, soil effectiveness should be dynamically assessed during the cultivation and relocation conservation of P. chinensis, and a soluble P fertilizer should be supplemental over time in the trees’ root distribution area.

1. Introduction

Parashorea chinensis Wang Hsie is a Dipterocarpaceae species endemic to China, which is important for maintaining the biodiversity and ecological functions of rainforest ecosystems as a mono-dominant species in the canopy [1,2]. However, P. chinensis is endangered within China due to excessive deforestation because of its high economic value, and the Chinese government has listed it as a protected wild plant at the national level [3]. There are currently 13 Dipterocarpaceae species in China, nine of which are under the highest level of protection due to indiscriminate deforestation [4]. Many species of Dipterocarpaceae in Southeast Asian countries are also listed on the red list of threatened species by the International Union for Conservation of Nature (IUCN) [5,6,7,8,9]. Many soil variables have been shown to affect plant fitness but it is unknown what their relative importance is and whether any biogeochemical variable acts as a key factor constraining the persistence of rare species [10]. Southwest China is considered to be the northernmost part of the global distribution of Dipterocarpaceae plants, and climate change, soil nutrient cycling and limiting properties, and soil ecological stoichiometry characteristics in this region may be potential reasons for the long-term endangerment of these tree species [1,2,3,4,5,6,7,8,9,10,11,12,13,14]. It has been suggested that ecological stoichiometry can be used in the research on conservation biology and ecological restoration, and can provide a scientific basis for vegetation restoration in fragile ecosystems and integrated management of degraded soils [10,15,16]. For example, soil nutrient dynamics in tropical forest ecosystem restoration can be monitored through stoichiometry [17]. Synchronous increases in the soil and microbial C:N ratios in reforested karst soils demonstrated an adaptive response by the soil microbial community to changes in substrate resource stoichiometry in Southwest China [18]. Our study attempts to characterize the nutrient limitation of P. chinensis habitat soils through ecological chemometrics. The purpose of this study is to provide scientific guidance for matching endangered tree species with suitable site conditions to accelerate ecological recovery.
Ecological stoichiometry (ES) is an interdisciplinary field that combines the fundamental principles of biology and chemistry [19,20]. Remarkable achievements regarding ES have been achieved, especially in plant research, such as research on individual growth, population dynamics, limiting elements, community succession, and vegetation stability [21]. All organisms are composed of identical building blocks, i.e., the atoms of chemical elements, although these building blocks form remarkably diverse molecules with various functions. During growth and development, organisms assimilate all the building blocks needed to form the adult body [10]. These elements absorbed by organisms are mainly of soil origin, such as carbon (C), nitrogen (N), phosphorus (P), and potassium (K), microelements such as manganese (Mn), iron (Fe), copper (Cu), and zinc (Zn), and non-essential elements such as sodium (Na) and aluminum (Al) [22]. They are not only important parts of soil but they are also the key elements of plant growth, obviously affecting soil microbial dynamics, litter decomposition, food webs, and soil nutrient accumulation and circulation, and their stoichiometric balance is important for the growth and community composition of both trees and soil microbes [23]. For example, C is the structural element of plants [24], N and P are important components that make up proteins and genetic material and are the most critical nutrients limiting plant growth, and K has a very essential role in the photosynthetic and respiratory metabolism of plants [25,26]. The balance between the above elements regulates biological processes in terrestrial ecosystems, influenced by climate change and conservation management [26]. Soil extracellular enzymes are proteins with specific catalytic capacities secreted mainly by soil microorganisms and plant roots [27,28]. They are involved in almost all soil biogeochemical processes [29,30,31]. Soil enzyme activity is a sensitive indicator of subtle changes in the soil environment, which can reflect the metabolic rate and material transformation of soil microorganisms [32]. The stoichiometry of extracellular enzyme activity with soil nutrients and microbial biomass can be used to determine information such as nutrient limitations [33,34,35].
Soil extracellular enzyme activities play a vital role in soil functioning; for example, β-1,4-glucosidase (BG) and sucrase (SU) are involved in soil carbon metabolism and cycling, which influence the decomposition and accumulation of soil organic carbon [16]. Similarly, the urease (UR) enzyme is involved in the N cycle, promoting the decomposition of urea and affecting the soil nitrogen supply [16]. In contrast, the acid phosphatase (ACP) is involved in the P cycle and is produced in response to a lack of available phosphorus, it hydrolyses soil organic phosphorus compounds and reflects the efficacy of organic phosphorus [36]. ACP may also be a key driver of phosphorus cycling in acidic soils [37]. Furthermore, the ratio of soil enzyme activity to nutrient requirements is calculated by calculating the soil enzyme stoichiometric ratios, expressing the relative limits of the element C as vector lengths and the relative limits of N and P as vector angles [38]. Soil microbial entropy (qMB) is the ratio of soil microbial biomass C, N, and P to soil organic carbon, total nitrogen and total phosphorus content, which reflects the amount of microbial biomass that can be supported per unit of soil resource [39]. The qMB can be combined with enzyme stoichiometry to comprehensively analyze the relationship between soil enzymes, nutrients, and microorganisms. Previous studies have shown that both abiotic and biotic factors can influence soil enzyme stoichiometry ratios [40,41]. Although the impact of abiotic and biotic factors on the soil stoichiometry have received attention, the relative contribution from the influence of soil distribution (e.g., rhizosphere and non-rhizosphere regions) and edaphic abiotic and biotic factors on soil stoichiometry are rarely investigated [42].
The findings suggest a global P limitation in terrestrial ecosystems, and the tropical forest is well documented to be more P-limited than other ecosystems because of its highly weathered soils [43]. The nutrient limitation to primary productivity and other biological processes is widespread in terrestrial ecosystems, and N and P are the most common limiting elements, both individually and in combination [44]. The endangered species P. chinensis, which grows in tropical and subtropical regions of China, is also probably influenced by soil limiting factors. Ecological stoichiometry is an effective method for exposing the state of soil nutrient availability and limiting characteristics of plantation stands in this region [26,30,45]. Although C:N:P stoichiometry may be crucial for primary productivity, it is still uncertain at the planting pattern and stand ages. Hence, rather than only focusing on nutritional status, investigations at the species level that take into account microbial factors and stand ages may better reflect the characteristics of an ecosystem and lay the groundwork for increased ecological sustainability. Therefore, we hypothesized that the soils in this study area are not conducive to microbial growth due to the phosphorus limitation, and the stand age may have a significant effect on the soil microbial biomass and enzyme stoichiometry.
Therefore, our study relied on six different stand ages of P. chinensis plantations. Ecological stoichiometry of the nutrients, microbial biomass, and enzymatic activity in rhizosphere and non-rhizosphere soils were analyzed with the objectives of identifying limiting nutrient factors in the soils of the study area, to provide guidance on maintaining soil fertility in plantation stands of Dipterocarpaceae species, and to provide theoretical references on soil matching for the relocation protection of endangered species.

2. Materials and Methods

2.1. Sampling Site

In this study, the chronological sequence of P. chinensis plantations was reconstructed using a space-for-time approach in areas with similar ecological and topographic microclimatic factors. We selected pure stands of P. chinensis plantations at 6 stand ages, planted in 2019, 2018, 2017, 2012, 2011, and 1978 corresponding to the stand ages of 1a, 2a, 3a, 8a, 9a, and 42a respectively, all at a silvicultural density of 1667 stems·ha−1. These stands are located on the outskirts of Nanning City in the southwestern part of the Guangxi Zhuang Autonomous Region, with geographical coordinates ranging from 108°17′4.03″~108°18′57.52″ E, 22°37′21.92″~22°43′41.95″ N, and an altitude of 120–160 m. The area is located south of the subtropical Tropic of Cancer (23°26′ N) and has a humid south subtropical monsoon climate, with low hills and hilly terrain, and the soil types are all dominated by russet loam. The terrestrial vegetation is dominated by typical monsoonal evergreen broad-leaved forests, with an average annual temperature of 21 °C, an average annual rainfall of about 1300 mm, and an average relative humidity of 78%.

2.2. Experimental Design and Soil Sampling

In July 2020, three sample plots were set up at each stand age (18 sample plots in total), each with an area of 400 m2 (20 m × 20 m). In each sample plot, 5 trees of P. chinensis were selected along an S-shaped route, and their root distribution areas were used as collection points for rhizosphere soil samples; meanwhile, 5 open areas away from the roots were selected as collection points for non-rhizosphere soil samples. The rhizosphere soil samples were collected by removing debris such as foliage and gravel and digging out fine roots in the direction of the P. chinensis root extension. The soil adhering to the roots was then collected by shaking and paint brushing as a rhizosphere soil sample [46]. The non-rhizosphere samples were collected by removing only the apoplastic material, exposing the soil surface, and then collecting the soil from 0 to 20 cm vertically downwards in the area without plant roots. The rhizosphere samples or non-rhizosphere samples from the 5 collection points in the same stand were mixed into 1 soil sample and divided into 2 parts, the first of which was air-dried and sieved (pore size 0.15 mm) for the determination of soil physical and chemical properties. The second part was refrigerated in a fresh state at 4 °C and used for the determination of soil microbial biomass and enzyme activity.

2.3. Soil Physicochemical Analyses

The soil pH was measured by a soil:CaCl2 solution (1:2.5, v:v) using a pH meter (PHBJ-260, Lei-ci, Shanghai, China). Soil organic carbon (SOC) was determined by the K2Cr2O7-H2SO4 heating method using a Titrette titrator (WF08, Brand, Wertheim, Germany). Soil organic matter (SOM) was calculated by multiplying SOC with 1.724 (conversion factor), and the total nitrogen (TN) was determined by the sulphuric acid-catalyst digestion method using an AA3 continuous flow analyzer (Auto Analyzer 3, SEAL Analytical, Norderstedt, Germany). Total phosphorus (TP) and total potassium (TK) were determined by the NaOH fusion method using an inductively coupled plasma mass spectrometer (ICP-MS) (model Nexion 350x, Analytik Jena AG, Jena, Germany) [47]. Available phosphorus (AP) was determined using an HCl-H2SO4 leaching and filtration method using an ultraviolet spectrophotometer (UV-1900i, Shimadzu Corporation, Kyoto, Japan). Available potassium (AK) was determined using a flame photometer (FP6410, INESA Analytical Instrument Co., Ltd., Shanghai, China). Furthermore, ammonium nitrogen (NH4+-N, AN) and nitrate nitrogen (NO3-N, NN) were determined by KCl leaching and the filtrate was used as the extraction solution using an AA3 continuous flow analyzer [48]. Stoichiometric ratios of C, N, P, and K were expressed using a concentration ratio, which were SOC/TN, SOC/TP, SOC/TK, TN/TP, TN/TK, and TP/TK, respectively [49].

2.4. Soil Microbial Biomass and Enzyme Activities Assays

Soil microbial biomass carbon and nitrogen (SMBC, SMBN) were determined by chloroform fumigation leaching [50], with 0.5 mol/L K2SO4 in a water to soil ratio of 4:1 using an organic carbon total nitrogen analyzer (Multi N/C 3100-HT 1300, Analytik Jena, Germany) [51], while the concentration of extracted phosphorus was determined colorimetrically by the molybdenum blue method [52]. The SMBC and SMBN were calculated using the following formulae:
SMBC = EC/Kc
SMBN = EN/Kc
where EC and EN are the difference between the SOC and TN in the leachate of fumigated and unfumigated soil samples, respectively. Kc indicates a conversion factor of 0.45.
Soil microbial biomass phosphorus (SMBP) was calculated from the difference in the amount of organic phosphorus measured in fumigated and unfumigated soils (Ept) and the conversion factor (Kp). The formula for calculating SMBP is as follows:
SMBP = Ept/Kp
where Ept is the difference between the fumigated and unfumigated soil; Kp is the conversion factor and takes the value of 0.4 [53].
The soil β-1,4-glucosidase (BG) activity was determined using p-nitrophenyl-β-glucopyranoside (C12H15NO8) as a substrate at 410 nm with a spectrophotometer (UV-VIS, Purkinje General Instrument Co., Beijing, China) [45]. The sucrase activity (SU) was determined by the colorimetric method using sucrose (C12H22O11) as a substrate [54]. The urease activity (UR) was determined by the Sodium phenol hypochlorite colorimetric method using urea (CO(NH2)2) as a substrate; the acid phosphatase activity (ACP) was determined colorimetrically using disodium phenyl phosphate (C6H9Na2O6P) as the substrate [55].

2.5. Data Statistics and Analysis

The soil extracellular enzyme stoichiometry equations were optimized with reference to Sinsabaugh et al. [56] to obtain:
Soil enzyme activity C/N = ln(BG+SU)/ln(UR)
Soil enzyme activity C/P = ln(BG+SU)/ln(ACP)
Soil enzyme activity N/P = ln(UR)/ln(ACP)
Vector analysis of the soil enzyme stoichiometry was used to characterize the limiting factors of soil nutrient cycling. Vector angle (Vector A) and vector length (Vector L) are calculated using the following equations [57]:
Vector A = DEGREES(ATAN2(ln(BG+SU))/ln(ACP); ln(BG+SU)/ln(UR))
Vector L = SQRT((ln(BG+SU)/ln(UR))2 + (ln(BG+SU)/ln(ACP)2)
where Vector A indicates the degree of phosphorus limitation relative to nitrogen, with Vector A > 45° indicating that the microorganism is more limited by phosphorus, and Vector A < 45° indicating that the microorganism is more limited by nitrogen. A larger Vector L indicates that the microorganism is more limited by carbon [38,58].
The microbial quotient carbon (qMBC), nitrogen (qMBN), and phosphorus (qMBP) of the soil are calculated as follows:
qMBC = SMBC/SOC
qMBN = SMBN/TN
qMBP = SMBP/TP
The statistical analysis was performed using the IBM SPSS 24.0 software package (SPSS Inc., Chicago, IL, USA). The Shapiro–Wilk test was used to verify the statistical distribution, and the values of the non-normal distribution were logarithmically converted to 10. A one-way analysis of variance (ANOVA) and least significant difference (LSD) test were performed using SPSS to test the significance of differences among treatments. The results are expressed as the mean ± standard deviation of each treatment, and the significance level was set at p < 0.05 and p < 0.01. Microsoft Excel 2019 software (Microsoft Inc., Redmond, WA, USA) was used to create tables. Correlation analysis (CA) and Redundancy analysis (RDA) was performed using Origin 2023 (OriginLab Inc., Northampton, MA, USA), and a correlation heat map was drawn. CA was used to determine the strength of the possible relationships between different stoichiometric ratios. RDA was used to determine the contribution of soil physicochemical properties and nutrient availability to the soil enzyme stoichiometry under different soil types and stand ages.

3. Results

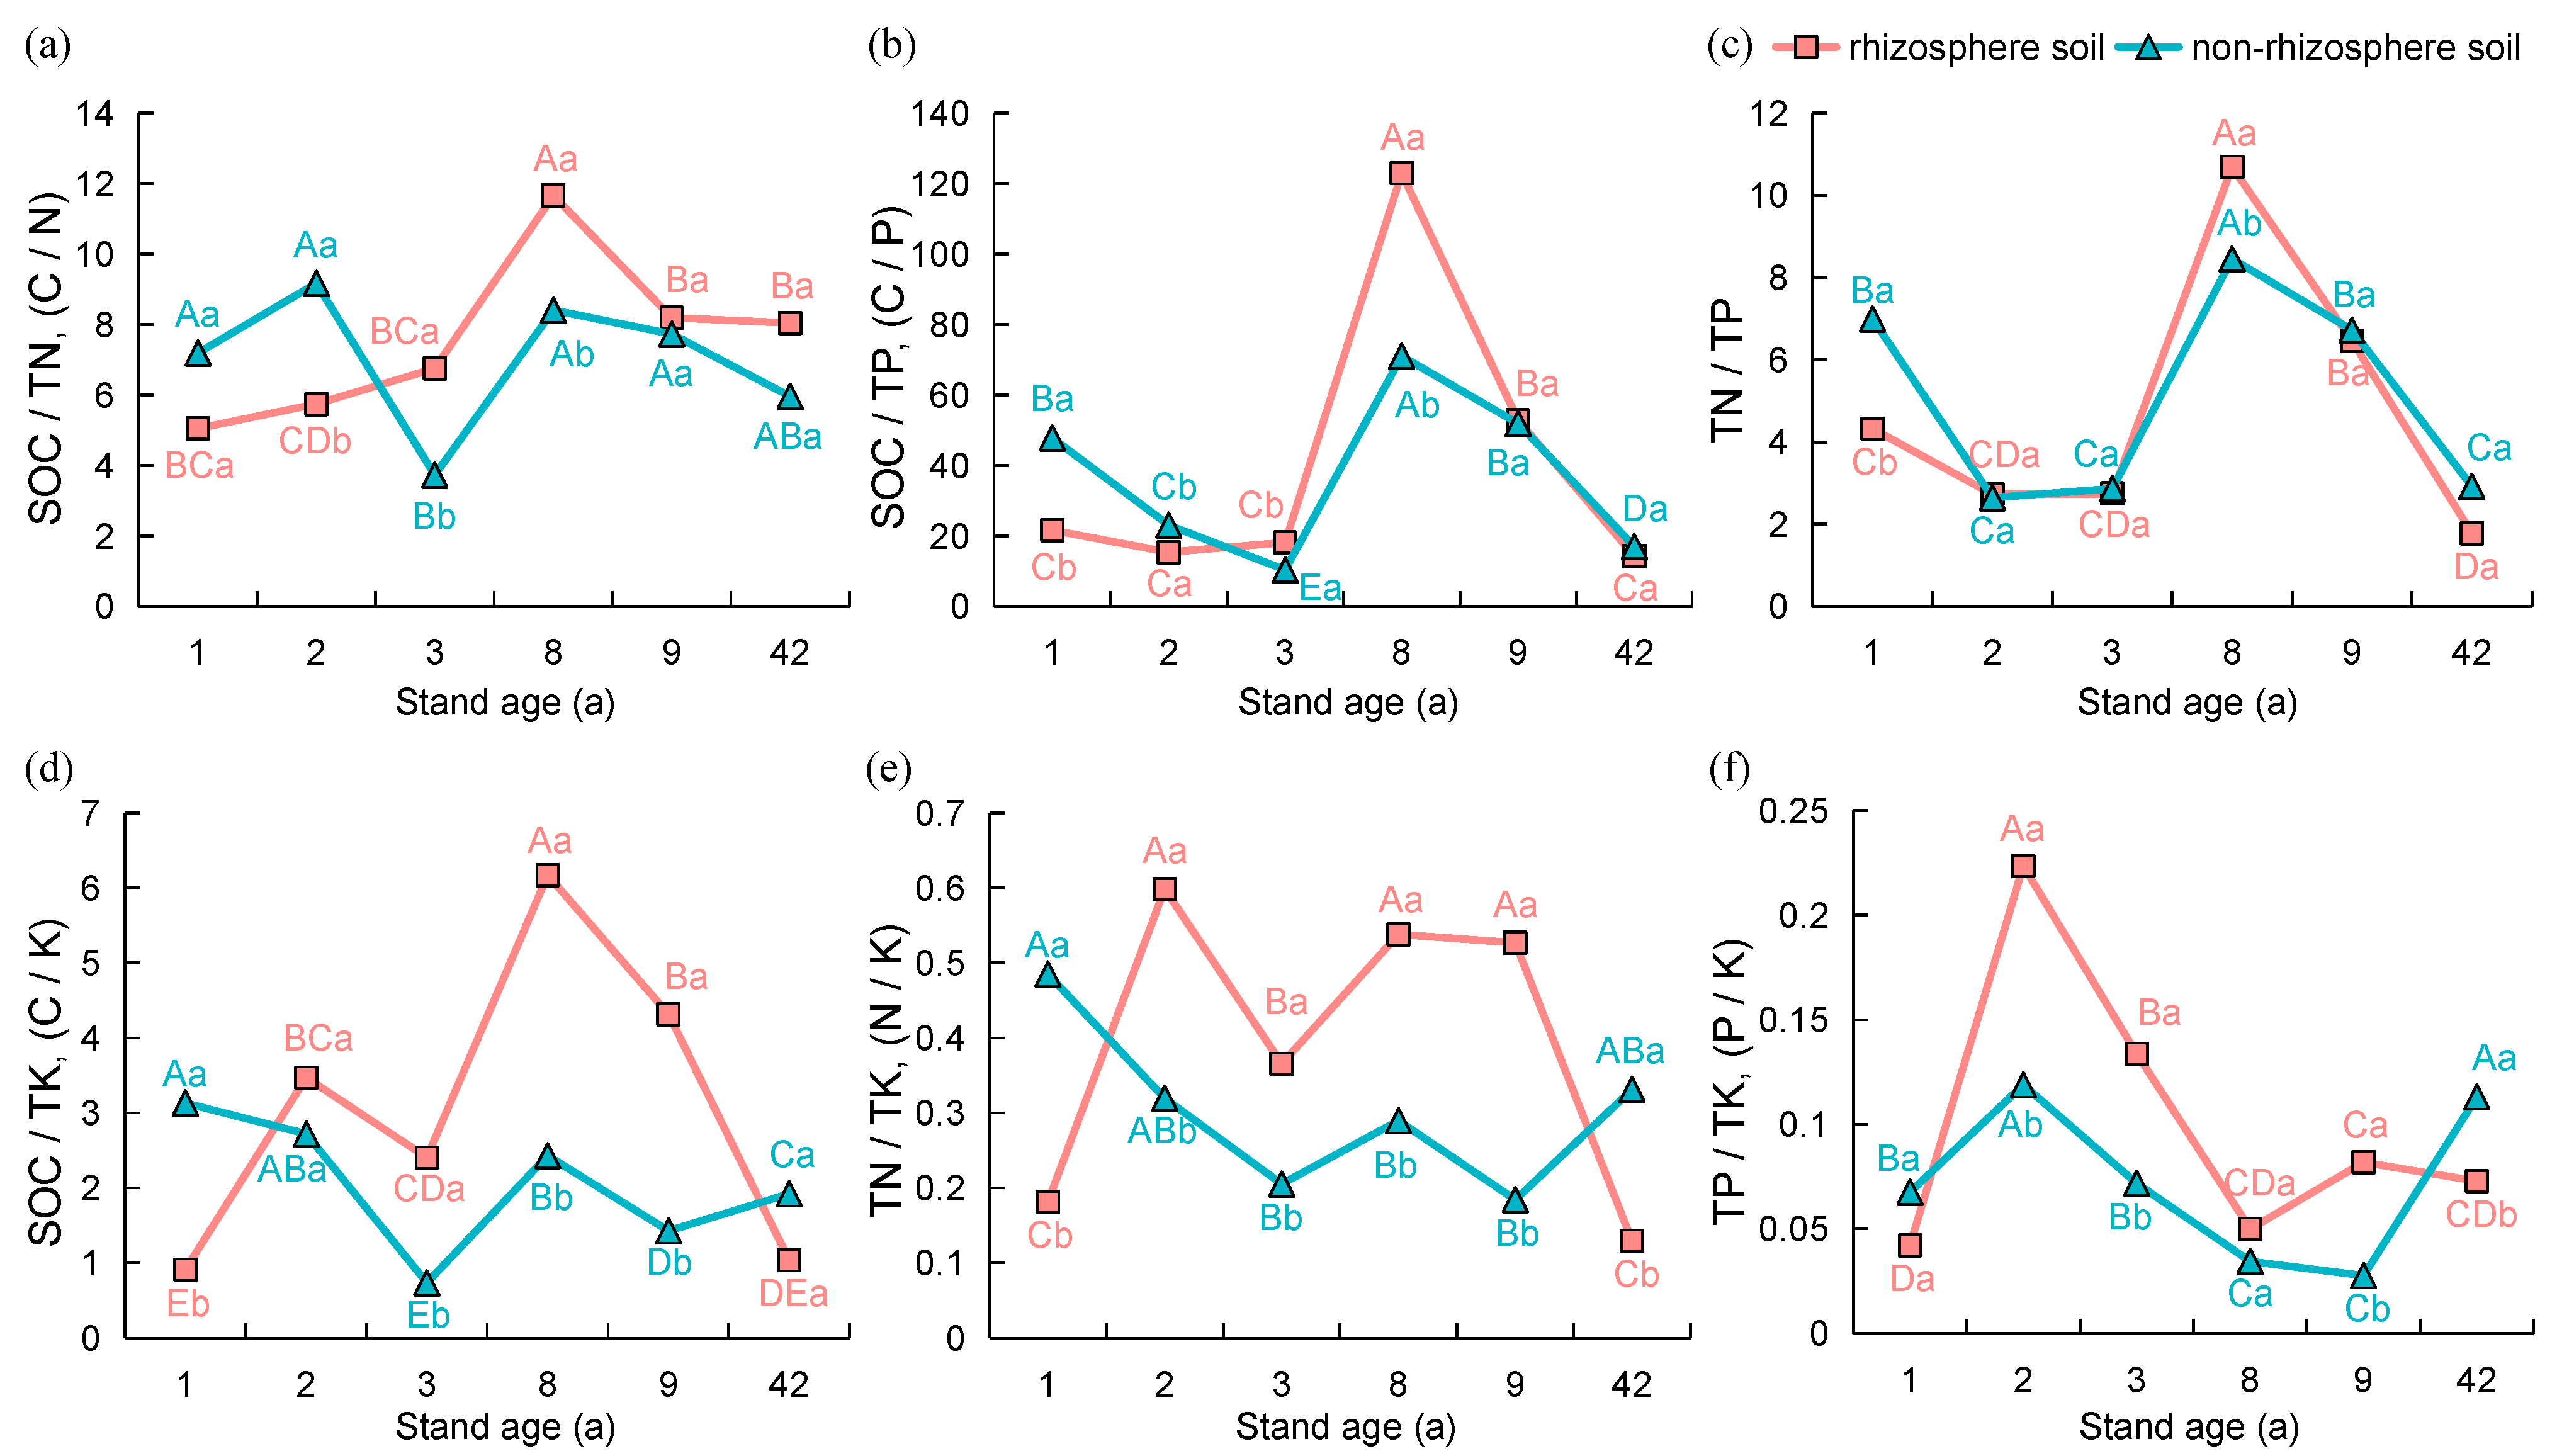
3.1. Physicochemical Properties and Nutrient Stoichiometric Ratios of Rhizosphere and Non-Rhizosphere Soils under Different Age Stands

Rhizosphere and non-rhizosphere soil significantly influenced the physiochemical properties except soil P, and most of the attributes showed the trend as rhizosphere > non-rhizosphere (p < 0.05) (Table 1). However, the total potassium (TK) showed rhizosphere < non-rhizosphere in the first 9 years, and the soil organic matter (SOM) and available potassium (AK) also showed rhizosphere < non-rhizosphere in the first 2 years. The trend of nitrate nitrogen (NN), available phosphorus (AP), and available potassium (AK) in the rhizosphere and TK and AK in the non-rhizosphere showed an overall increasing trend but decreased at 42a. Conversely, the soil pH did not differ significantly between the stand ages.
Soil C/N (SOC/TN), C/P (SOC/TP), N/P (TN/TP), C/K (SOC/TK), N/K (TN/TK), and P/K (TP/TK) showed rhizosphere < non-rhizosphere soil in 1a and 42a stands (except C/N in 42a), but as inter-rhizosphere > non-rhizosphere in 3a, 8a, and 9a stands (Figure 1a–f). The difference between the first 4 ratios (Figure 1a–d) in the rhizosphere and non-rhizosphere was most significant at 8a (p < 0.05). The differences in the latter 2 ratios (Figure 1e,f) were most significant at 2a and these differences decreased as the stand age continued to increase. With an increasing stand age, these 6 nutrient stoichiometric ratios in the rhizosphere soils showed a trend of increasing and then decreasing, with N/K and P/K reaching their highest values in the second year after afforestation; C/K, N/K, and P/K in non-rhizosphere soils all increased in the 42a stands compared to the 9a stands.

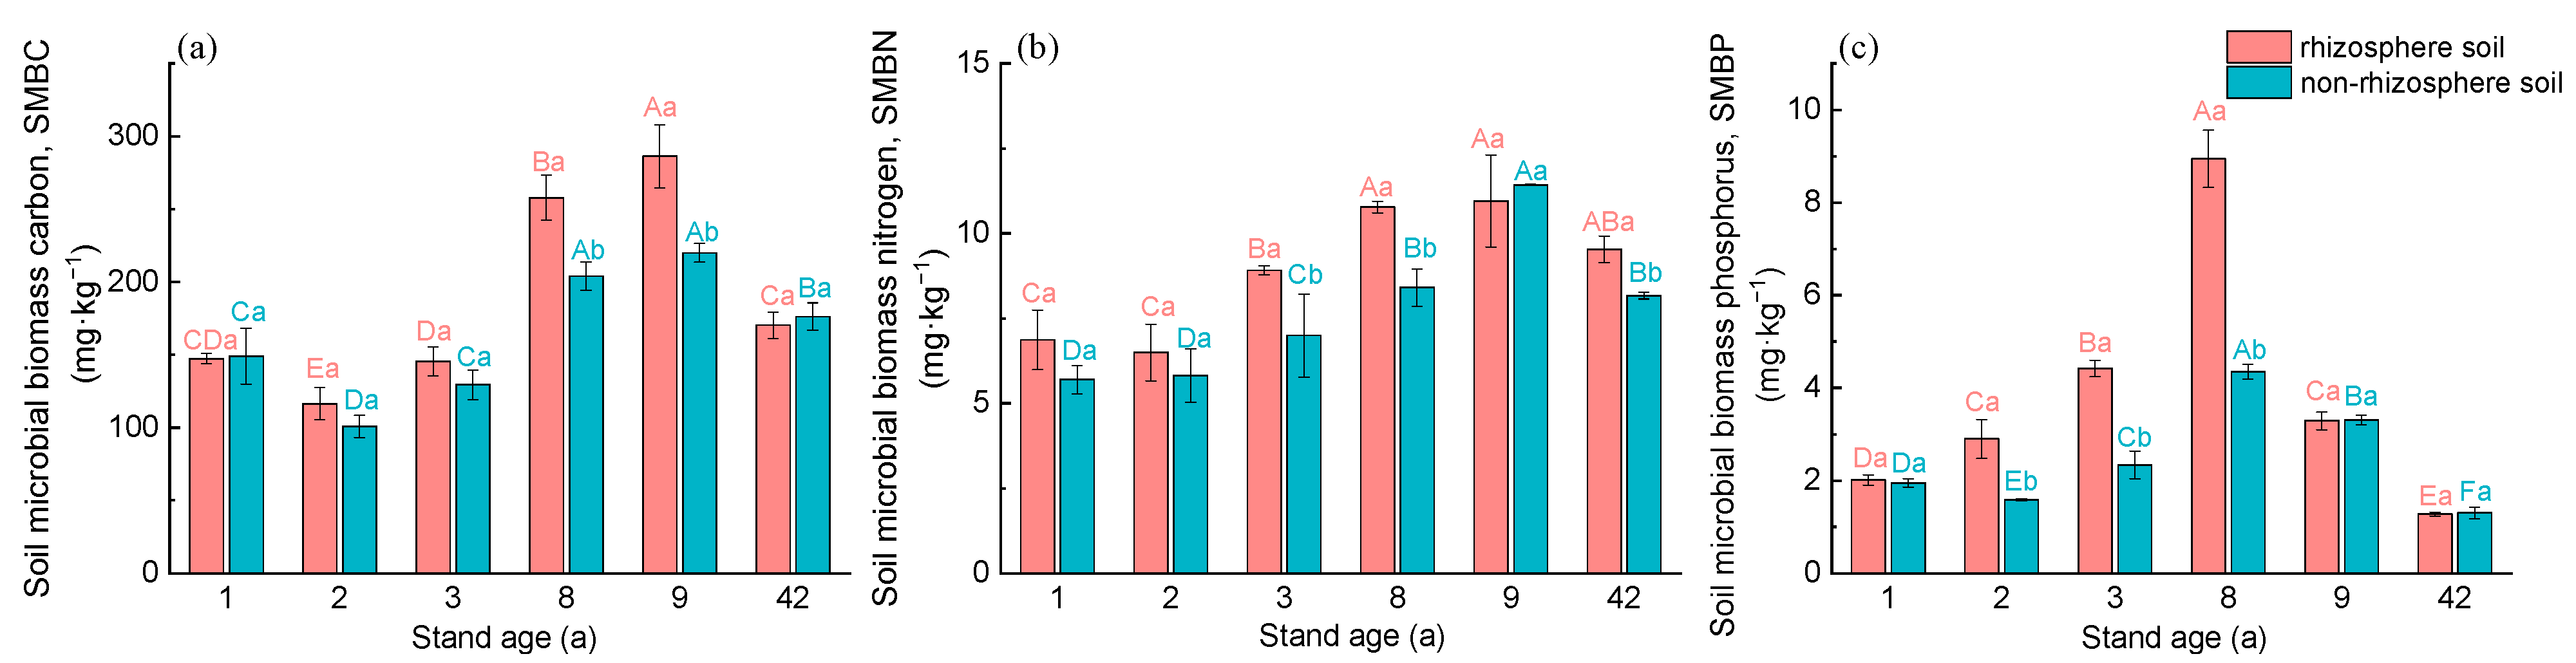
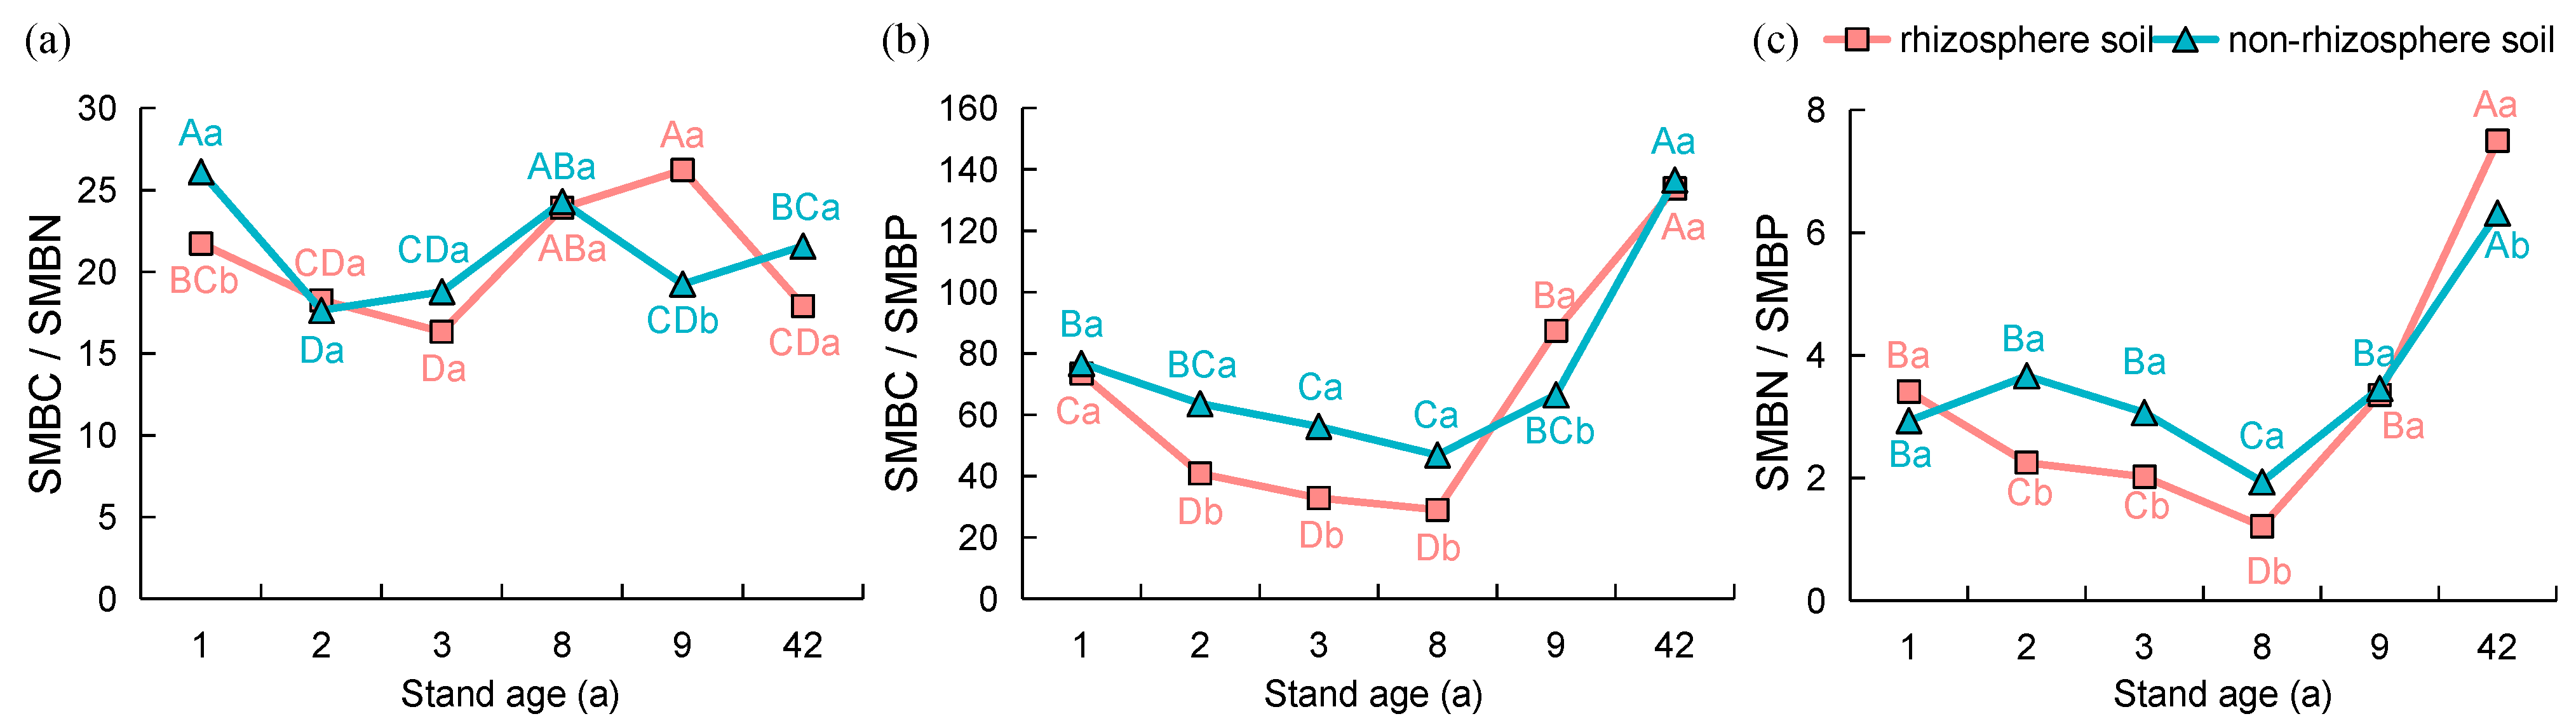
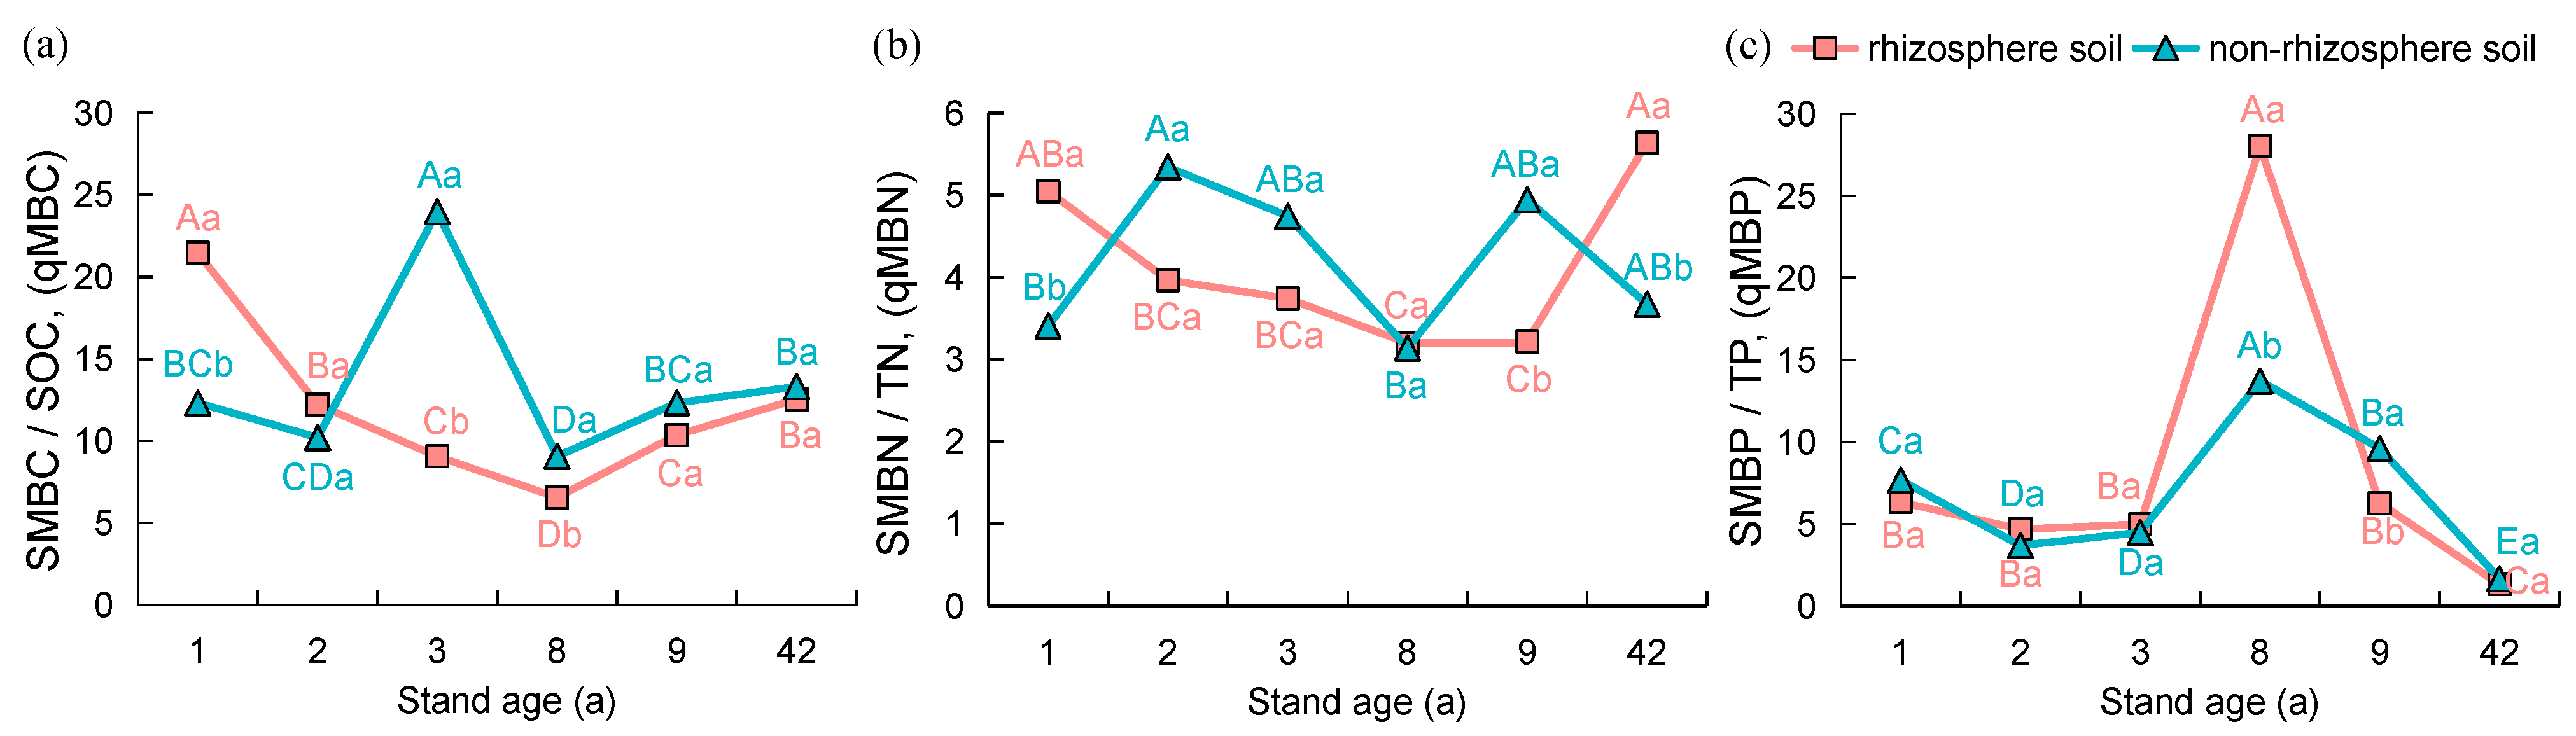
3.2. Microbial Biomass and Stoichiometric Ratios in the Rhizosphere and Non-Rhizosphere Soils under Different Age Stands

Soil microbial biomass C, N, and P (Equations (1)–(3)) showed a trend of rhizosphere > non-rhizosphere in most of the sample sites, and the difference between rhizosphere and non-rhizosphere gradually increased with the increasing stand age in the first 8 years, with the difference reaching significance (p < 0.05) at stand 8a. In terms of age, the SMBC (Figure 2a), SMBN (Figure 2b), and SMBP (Figure 2c) in the rhizosphere showed a trend of increasing and then decreasing, with both the SMBC and SMBN being the lowest at 2a (116.45 and 6.50 mg·kg−1, respectively), reaching a maximum at 9a (286.23 and 10.96 mg·kg−1, respectively) and then beginning to decline. The variation in the SMBP was greater between stand ages, reaching a maximum at 8a (8.94 mg·kg−1) and then declining to a significant minimum at 42a (1.27 mg·kg−1). The SMBC, SMBN, and SMBP in the non-rhizosphere trends with stand age were consistent with rhizosphere.
The mean SMBC/SMBN (Figure 3a) values (mean of all stands) for the rhizosphere and non-rhizosphere soils were 20.73 and 21.27, respectively, with the SMBC/SMBP (Figure 3b) of 66.25 and 74.45, and SMBN/SMBP (Figure 3c) of 3.29 and 3.56, respectively. This showed that the overall ratios of microbial biomass C, N, and P showed rhizosphere < non-rhizosphere. With the increasing stand age, the SMBC/SMBN changed significantly, but the SMBC/SMBP and SMBN/SMBP showed a general tendency that first decreased to a minimum at 8a and then increased to a significant maximum at 42a.

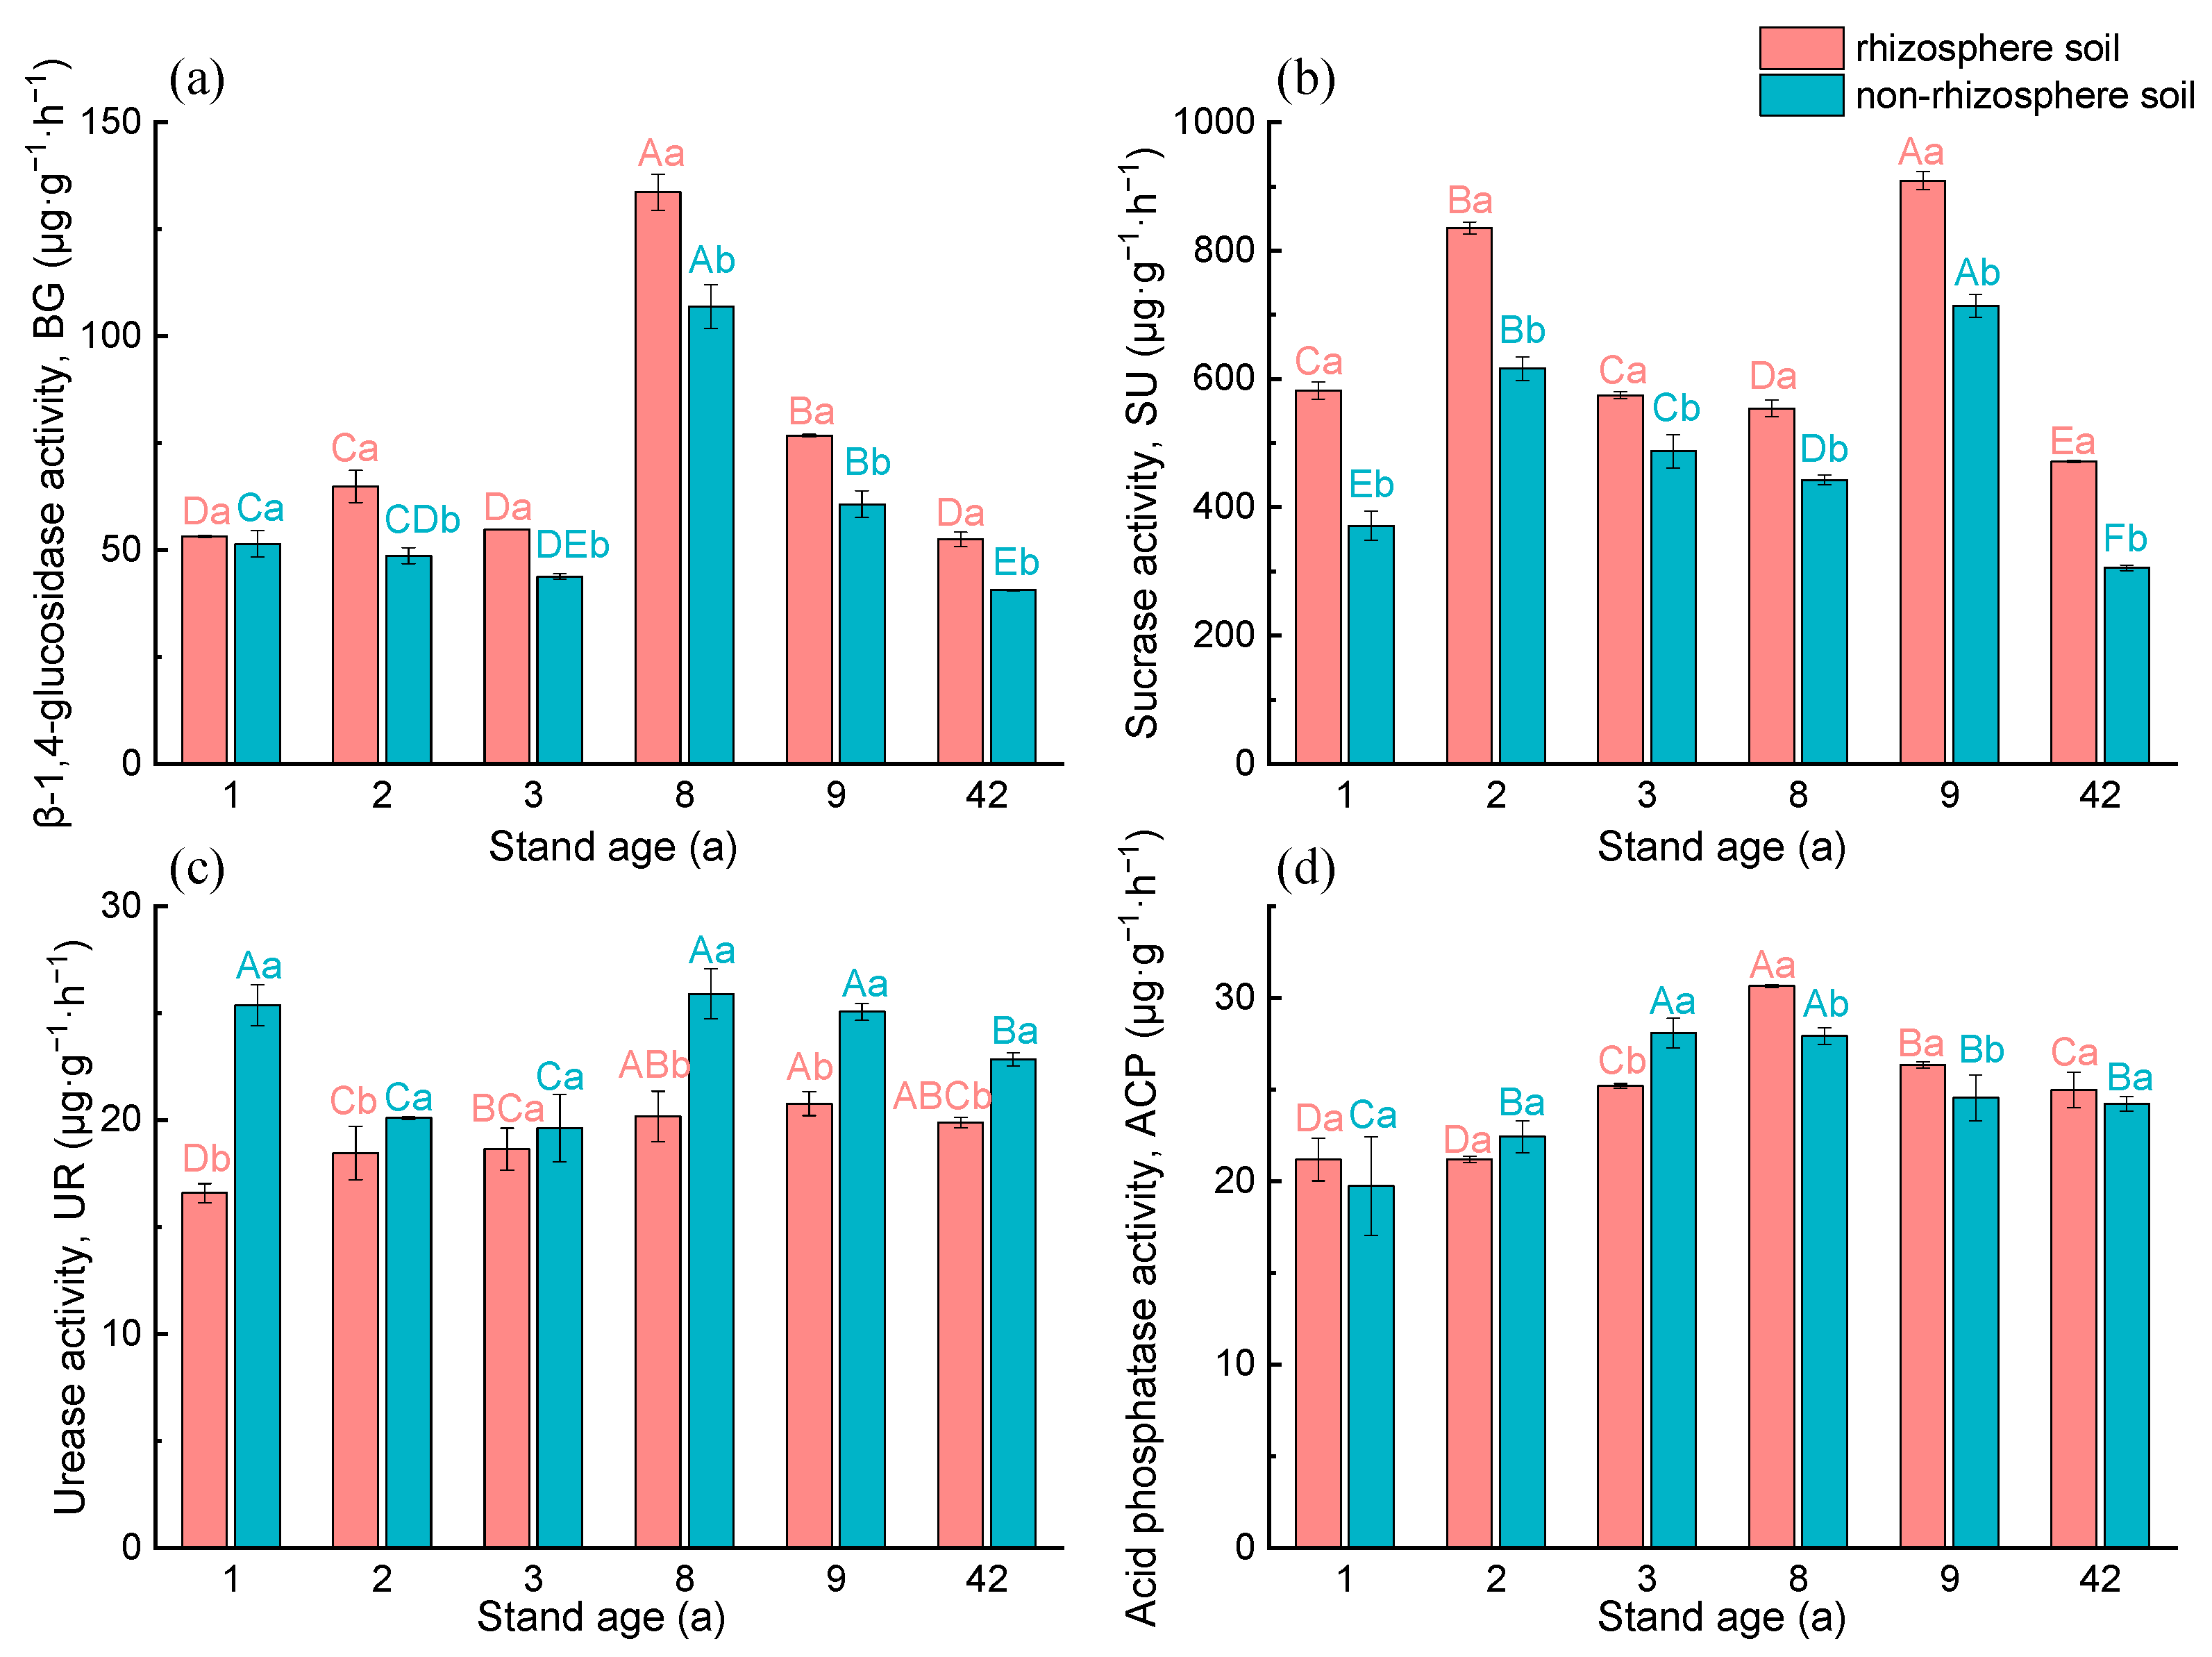
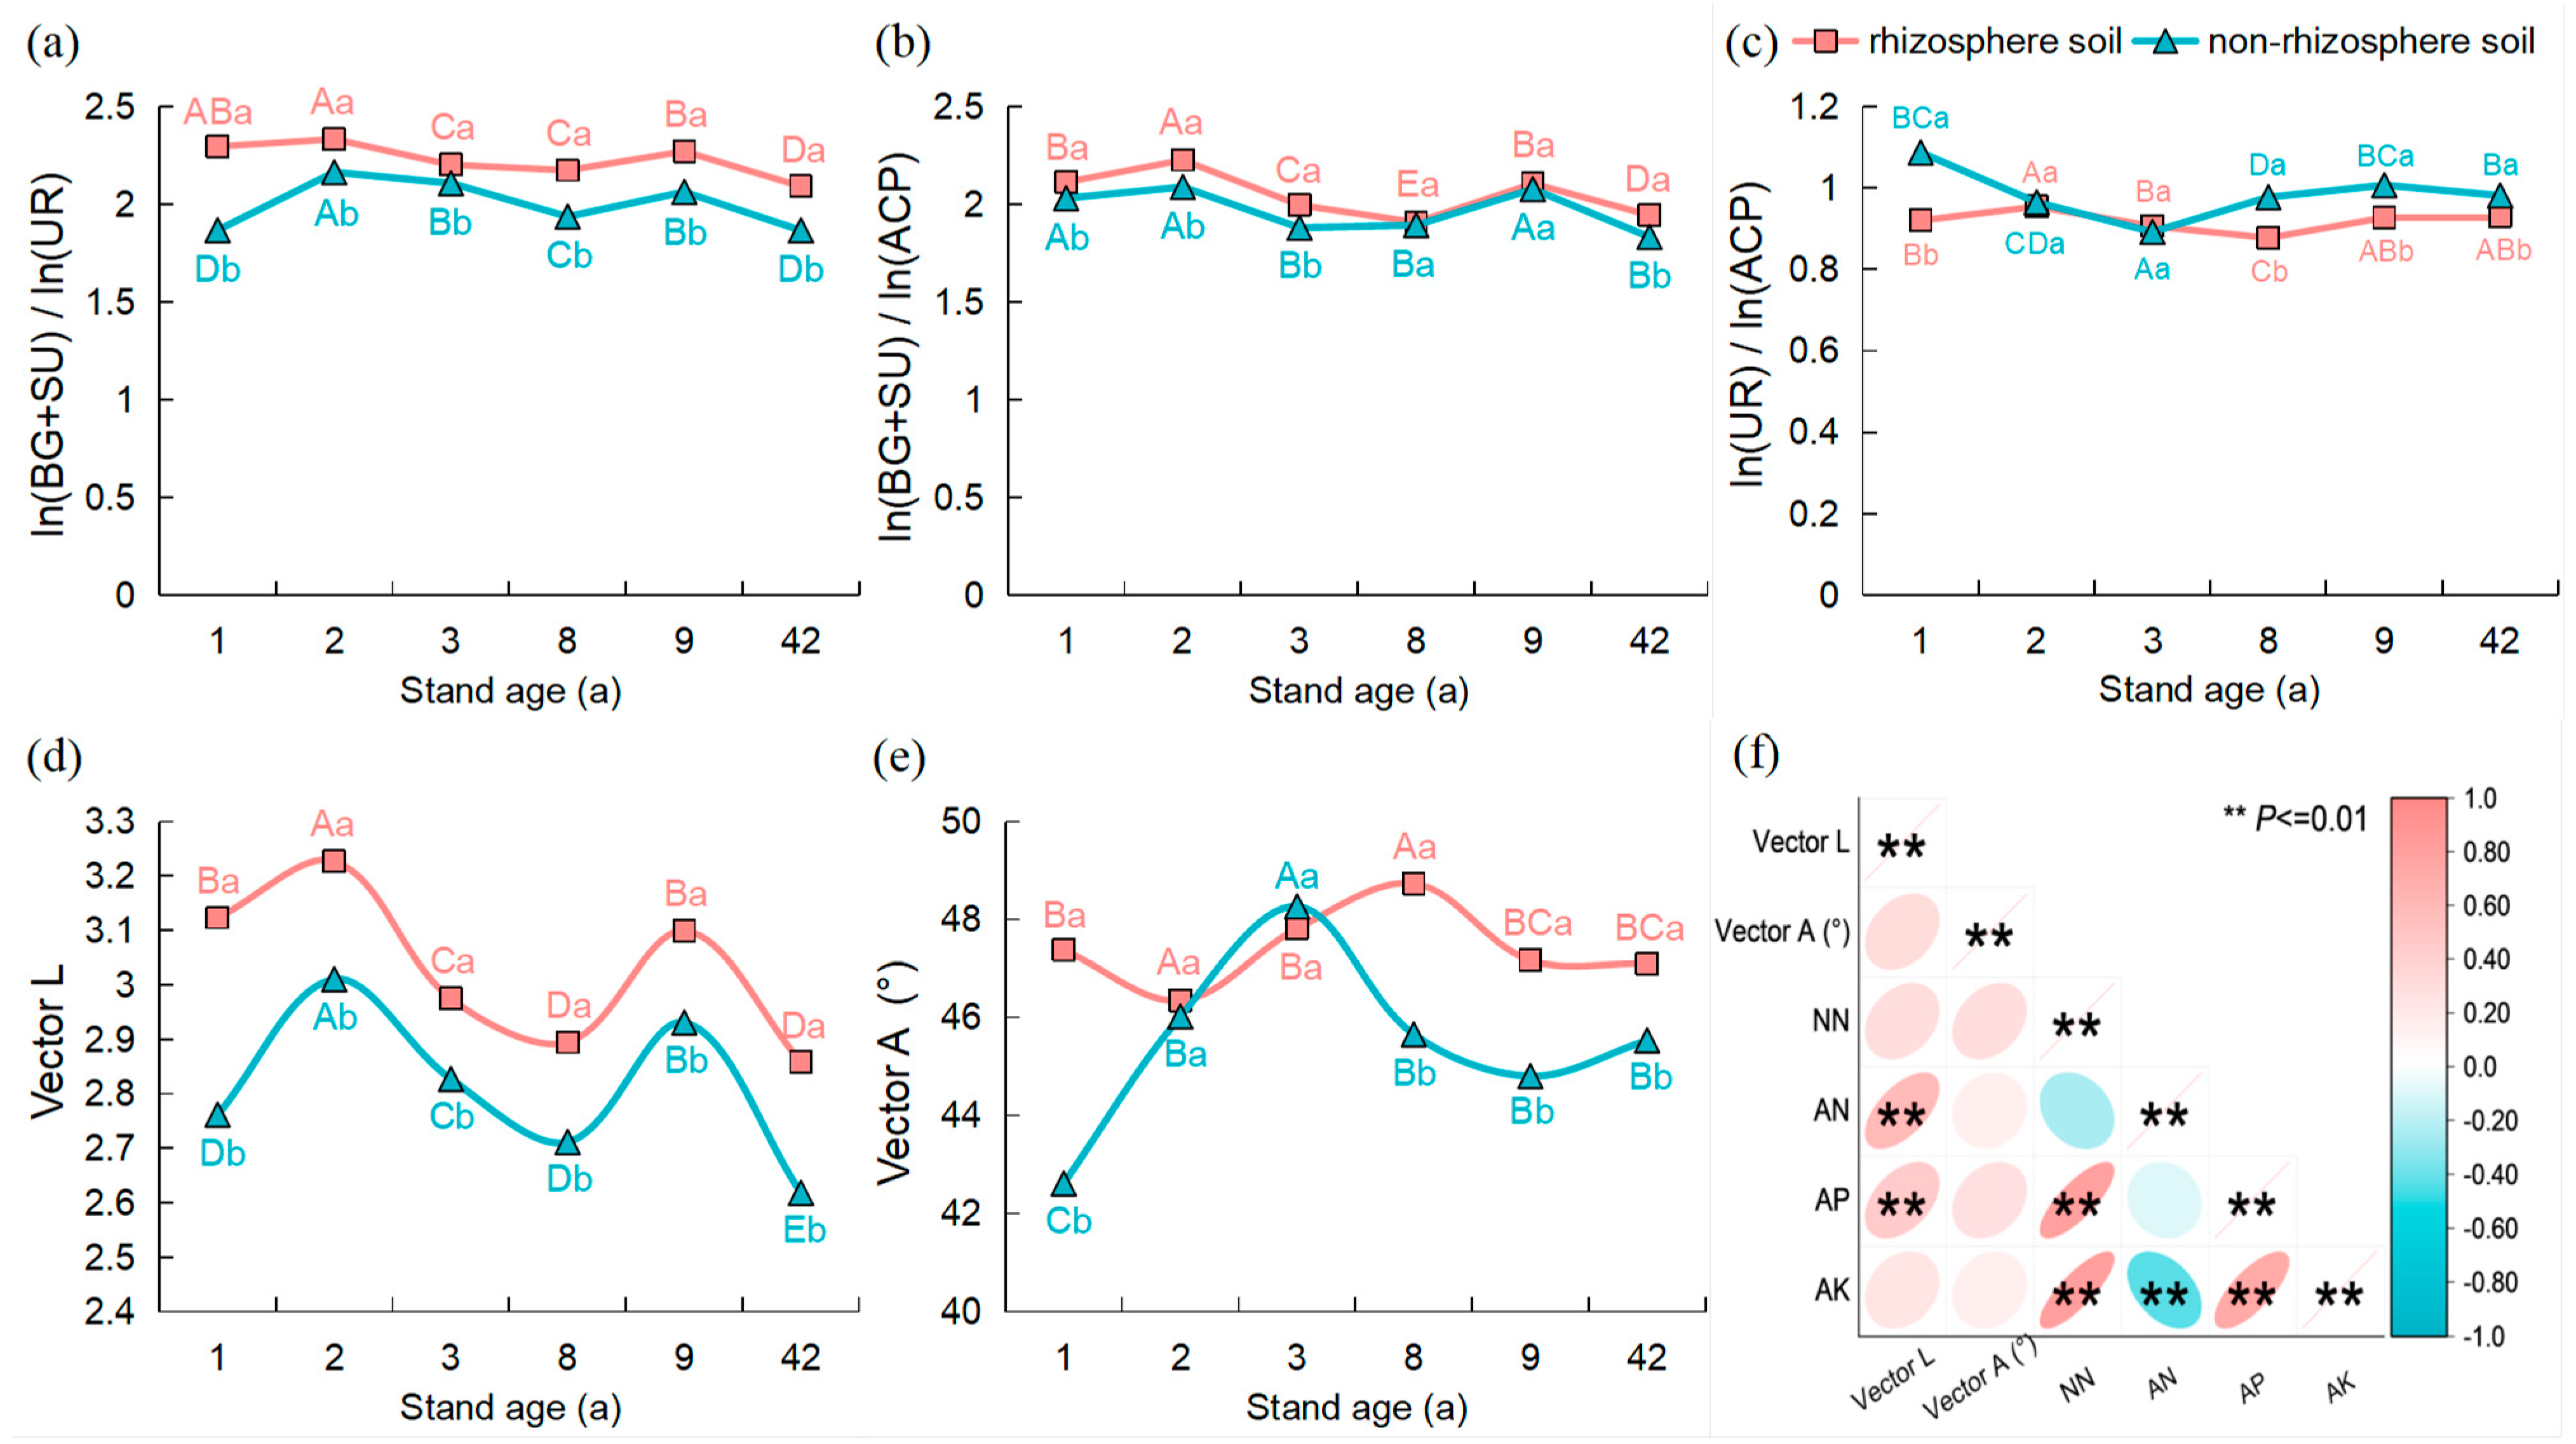
3.3. Enzyme Activity and Enzyme Stoichiometry Ratios in the Rhizosphere and Non-Rhizosphere Soils under Different Age Stands

Soil β-1,4-glucosidase (BG) (Figure 4a) and sucrase (SU) (Figure 4b) were increased in the rhizosphere soils compared to the non-rhizosphere soils (p < 0.05) (except BG in 1a). Comparatively, the urease (UR) (Figure 4c) activity decreased more in the rhizosphere than non-rhizosphere, reaching significant levels except for 3a. Moreover, the trend of acid phosphatase (ACP) (Figure 4d) showed rhizosphere < non-rhizosphere in stands 2a and 3a. Among the age series, BG varied little in the first 3 years, then increased to a maximum value by 8a, after which it decreased with increasing stand age. The SU in both the rhizosphere and non-rhizosphere soils decreased to a minimum at 42a. The UR of rhizosphere showed a slowly increasing trend with increasing stand age, while that of non-rhizosphere showed a decreasing trend in the first 3 years, followed by a rise to a maximum at 8a. The trend of ACP activity in rhizosphere and non-rhizosphere with increasing stand age was consistent, with the lowest (21.18 and 19.74 μg·g·h−1) in the 1a, followed by the highest (30.65 and 28.08 μg·g·h−1) at 8a.
We analyzed the stoichiometry of enzyme activities related to soil C, N, and P (Equations (4)–(6)). The ln(BG+SU)/ln(UR) (Figure 5a) was significantly higher in rhizosphere soils than in non-rhizosphere (p < 0.05), and ln(BG+SU)/ln(ACP) (Figure 5b) also showed rhizosphere > non-rhizosphere. The equation ln(UR)/ln(ACP) (Figure 5c) showed rhizosphere < non-rhizosphere. In terms of the age series, ln(BG+SU)/ln(UR) and ln(BG+SU)/ln(ACP) were significantly highest at 2a and lowest at 42a. Vector L (Figure 5d; Equation (7)) and Vector A (Figure 5e; Equation (8)) were significantly higher in rhizosphere soils than in non-rhizosphere (except for vector A at 2a and 3a). Vector L in the rhizosphere and non-rhizosphere soils showed a consistent and bimodal trend with increasing stand age. Vector A in the rhizosphere and non-rhizosphere soils showed a trend of increasing and then decreasing, with a single-peaked variation. Vector L showed a significant positive correlation with AN and AP (p < 0.01), while there was no significant correlation between Vector A and available N, P, and K (Figure 5f).

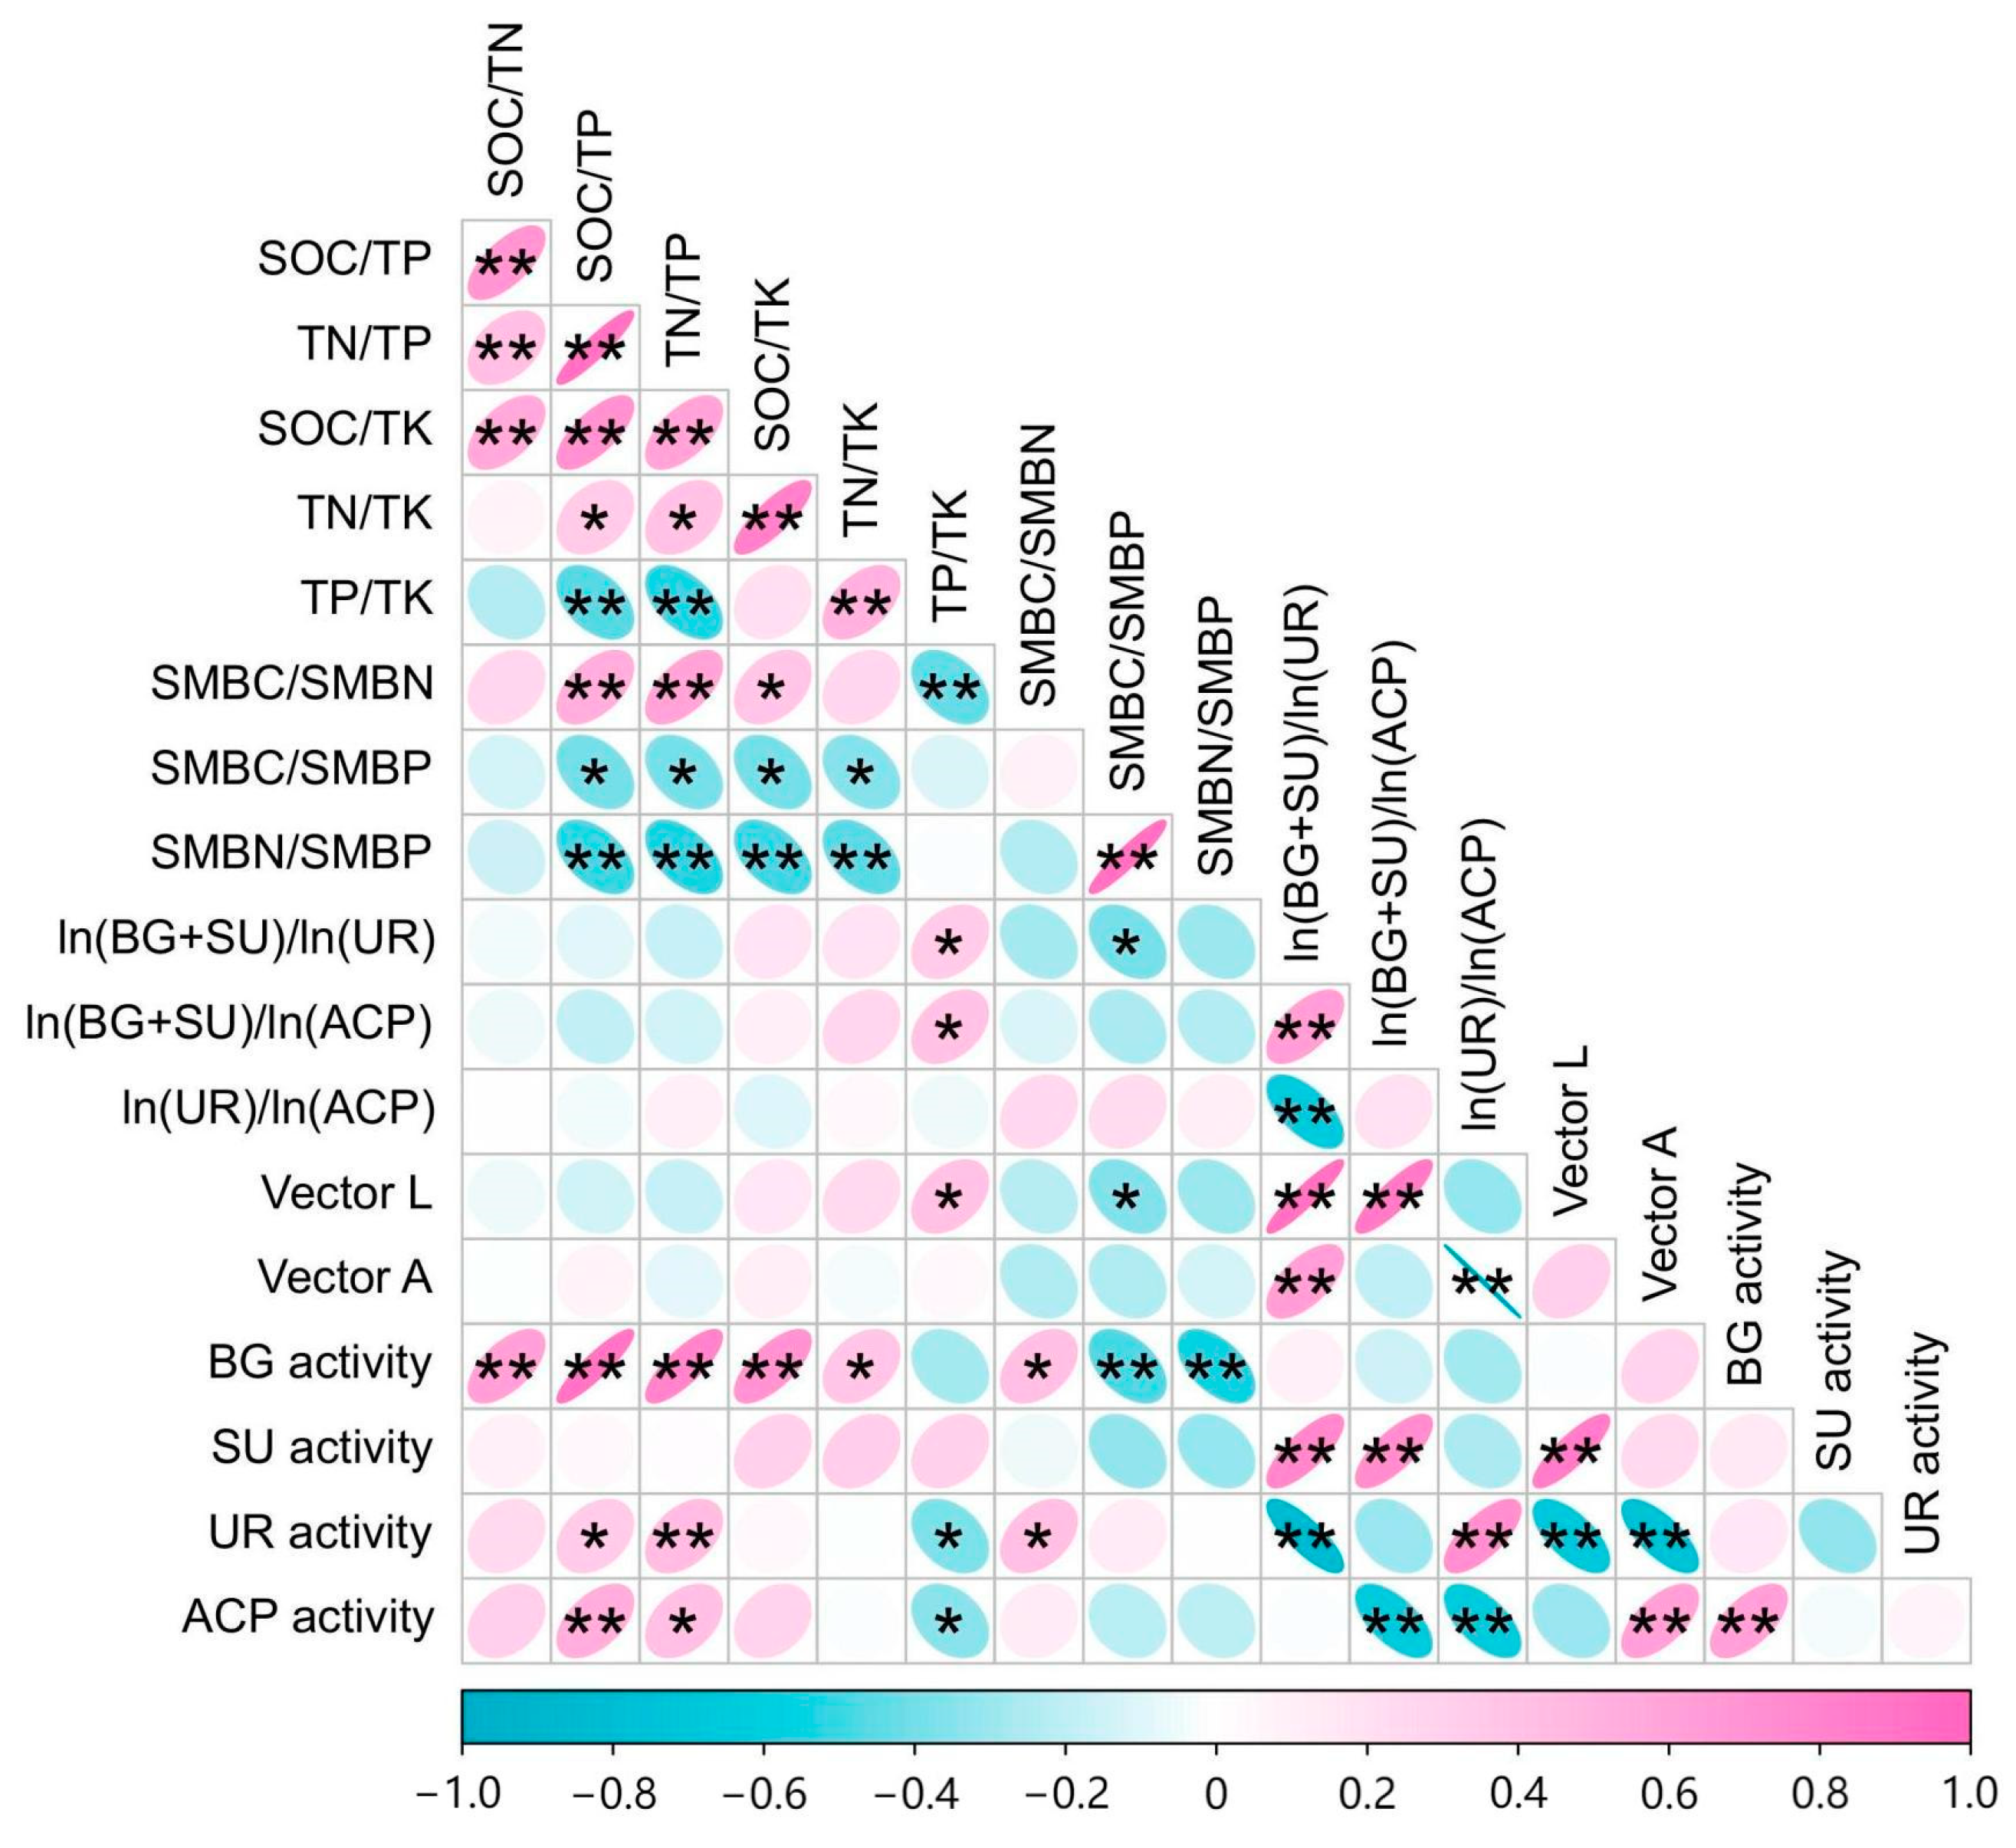
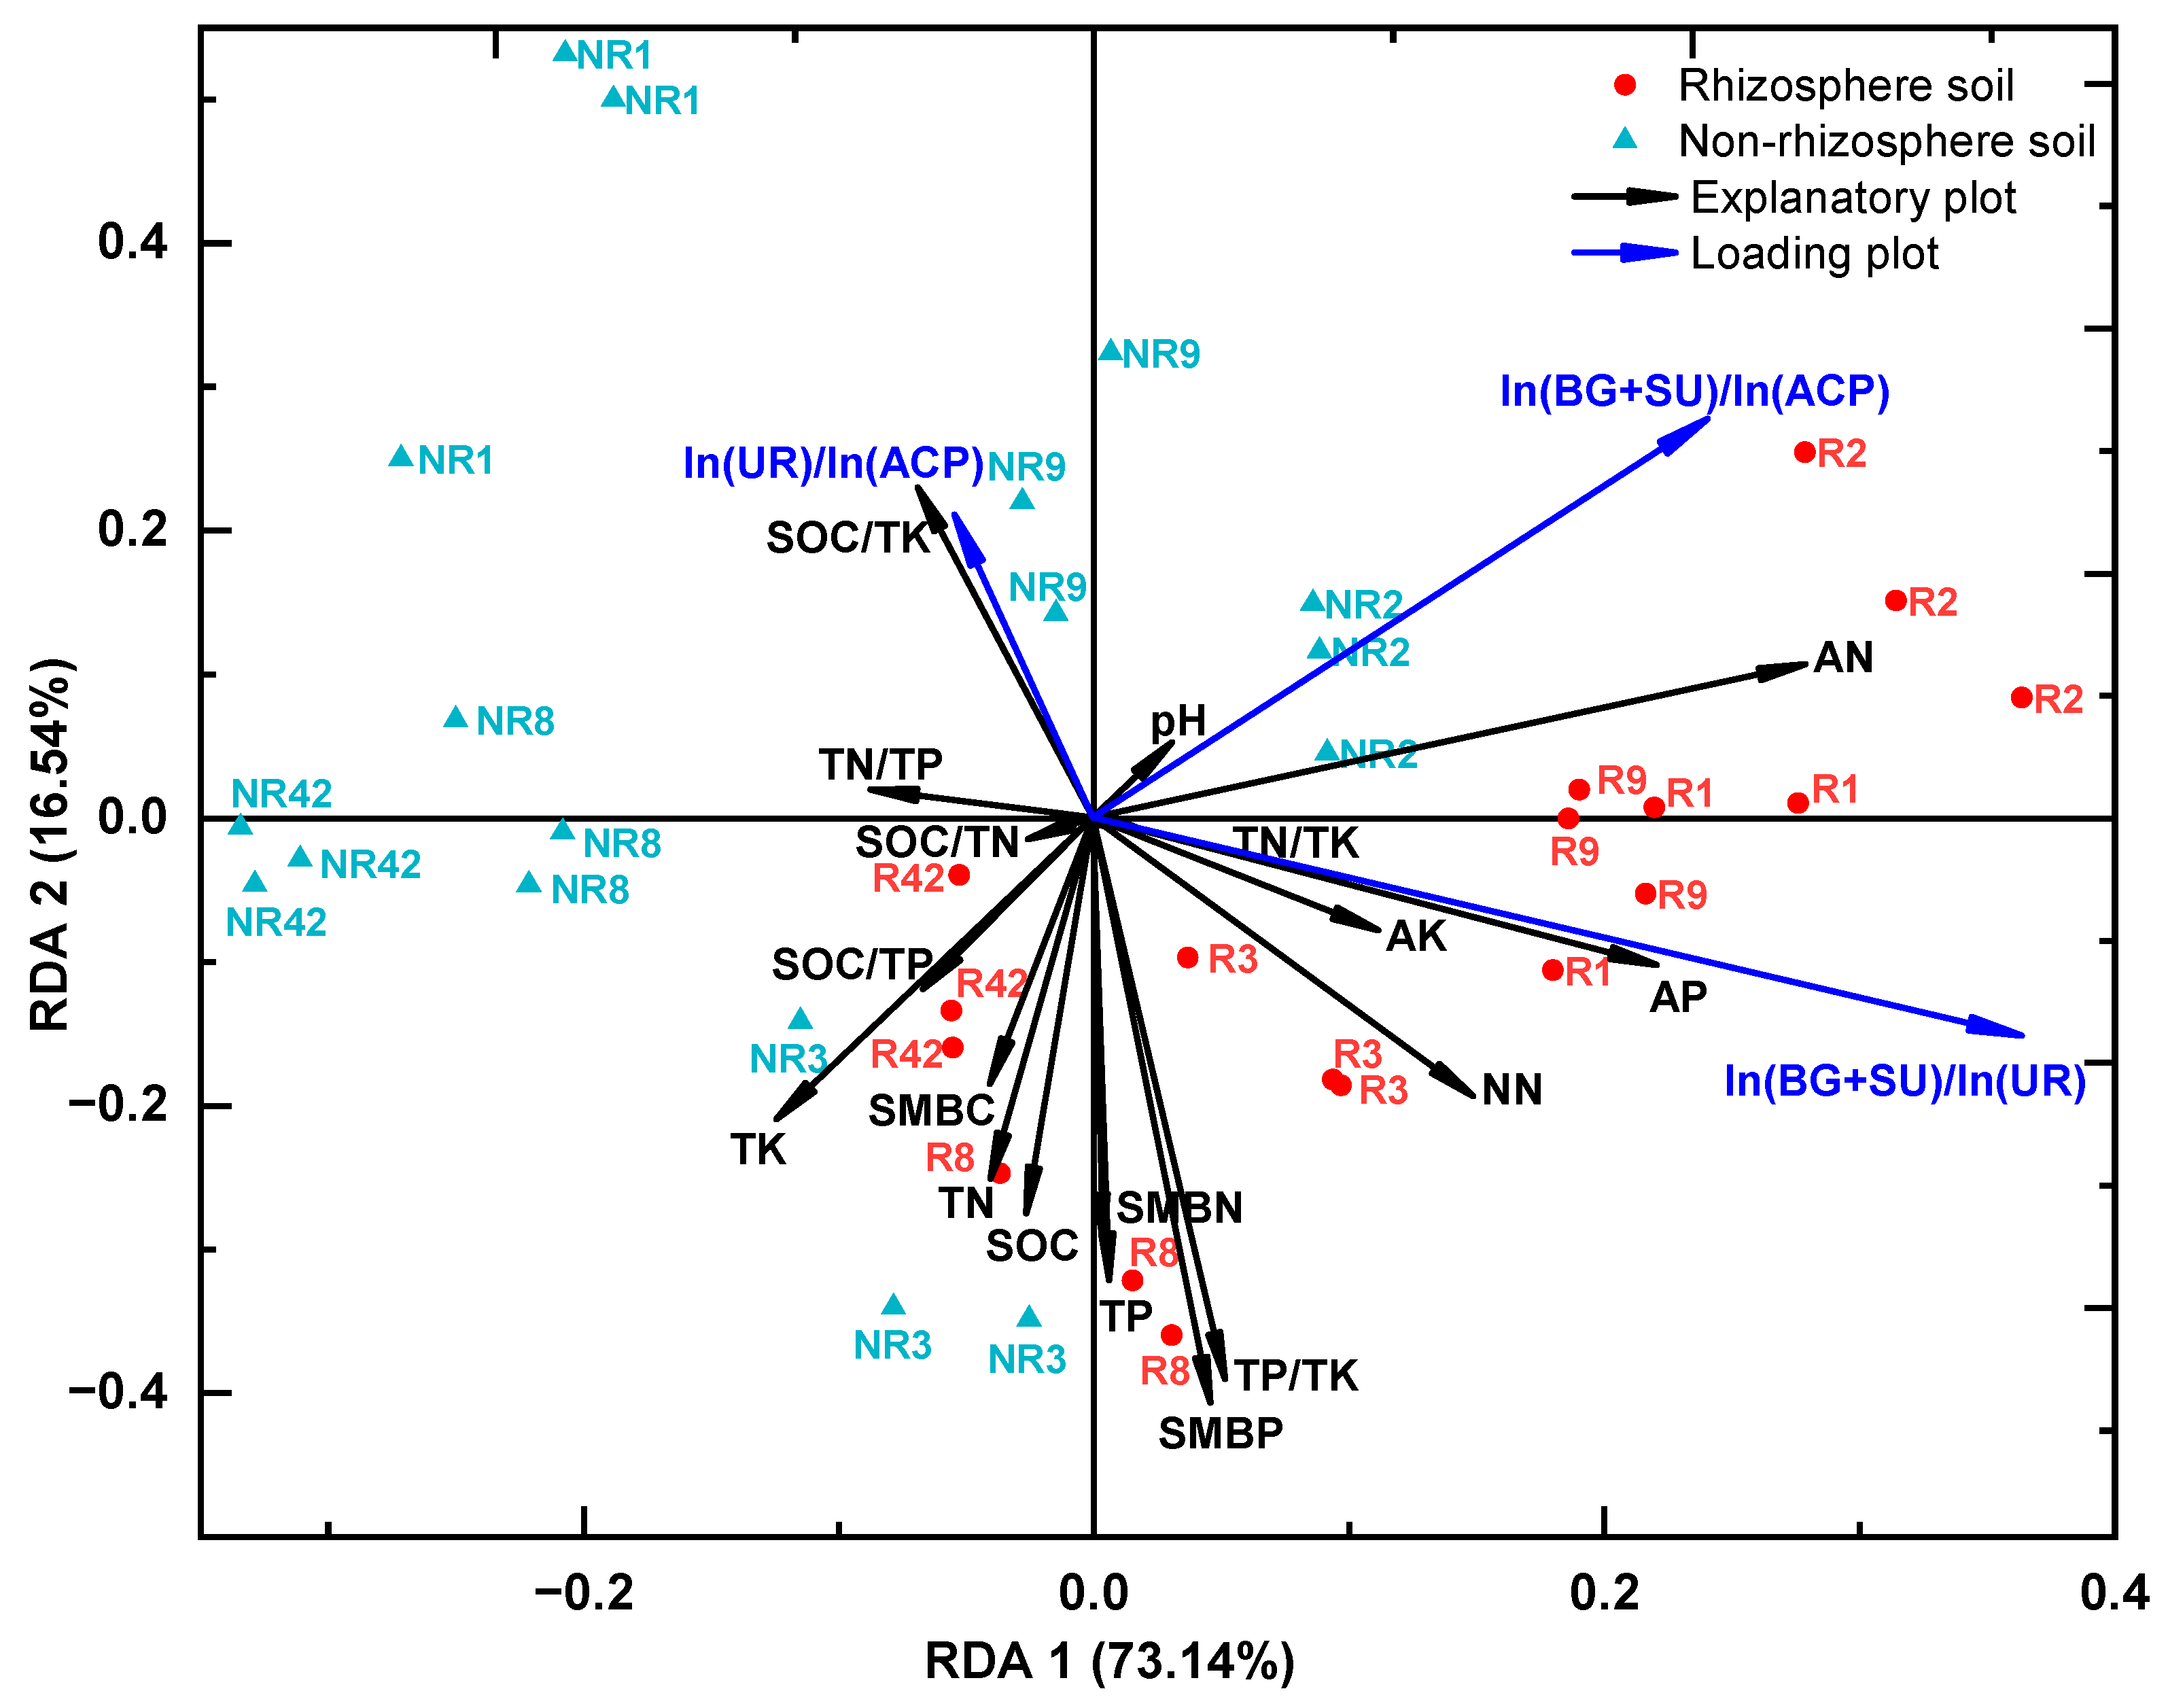
3.4. Relationships between Soil Nutrients, Microbial Biomass, and Enzyme Activity and Their Stoichiometric Ratios in the Rhizosphere and Non-Rhizosphere Soils

The microbial quotient (qMB; Equations (9)–(11)) was obtained by calculating the proportions of soil microbial biomass C, N, and P to soil SOC, TN, and TP. The results showed that the qMBC (Figure 6a) was present in rhizosphere < non-rhizosphere, except for stands 1a and 2a. The qMBN (Figure 6b) was present in rhizosphere < non-rhizosphere in stands 2a, 3a, and 9a, and in rhizosphere > non-rhizosphere in stands 1a and 42a (p < 0.05). The differences in the qMBP (Figure 6c) between rhizosphere and non-rhizosphere were not significant, except for sample plots 8a and 9a. In terms of the age series, qMBC and qMBN in the rhizosphere tended to decrease and then increase, and qMBP tended to increase and then decrease. The qMBC, qMBN, and qMBP in the non-rhizosphere showed an overall trend of increasing and then decreasing.
The results of the correlation analysis (Figure 7) showed that Vector L was highly significantly positively correlated with ln(BG+SU)/ln(ACP), Vector A was highly significantly negatively correlated with ln(UR)/ln(ACP), and both Vector L and Vector A had a highly significant positive correlation with ln(BG+SU)/ln(UR) (p < 0.01). Comparatively, SOC/TN was not significantly correlated with the ratios of microbial biomass C, N, and P. The SOC/TP, TN/TP, SOC/TK, and TN/TK were all significantly positively correlated with SMBC/SMBN (TN/TK was not significant), negatively correlated with SMBC/SMBP and SMBN/SMBP, and positively correlated with BG activity (p < 0.05). Interestingly, TP/TK showed a negative correlation with SMBC/SMBN (p < 0.01), a significant positive correlation with ln(BG+SU)/ln(UR) and ln(BG+SU)/ln(ACP), and a negative correlation with the activity of UR and ACP (p < 0.05). In addition, Vector L showed a positive correlation with SMBC/SMBP (p < 0.05). The BG activity, the enzyme involved in carbon acquisition, was positively correlated with nutrient C, N, and P stoichiometry and negatively correlated with SMBC/SMBP and SMBN/SMBP. The SU activity was significantly positively correlated with ln(BG+SU)/ln(UR), ln(BG+SU)/ln(ACP), and Vector L (p < 0.05). Meanwhile, ln(BG+SU)/ln(UR), Vector L, and Vector A were significantly negatively correlated with UR activity. In addition, the ACP activity was positively correlated with ln(BG+SU)/ln(UR), SMBC/SMBP, and SMBN/SMBP (p < 0.01). Furthermore, a significant positive relationship for the ACP activity was recorded with SOC/TP and BG activity.
The results of the redundancy analysis (Figure 8) showed that the RDA axes 1 and 2 together explained 89.68% of the variance, indicating that the total variance in the response variable (stoichiometric ratio of enzymes) was explained by the vast majority of the explanatory variables (soil C, N, P, K, and their stoichiometry, and microbial biomass C, N, and P) in the RDA model. The explanatory variables for rhizosphere soils (red dots) are mainly distributed on the right side of RDA axis 1 and on the lower side of axis 2. In contrast, those for non-rhizosphere soils (blue triangles) are mainly distributed on the left side of axis 1 and on the upper side of axis 2, indicating a clear difference between the environmental factors of the rhizosphere and non-rhizosphere soils. Available nutrients such as AN, NN, AP, and AK positively contributed more to axis 1. SOC/TK made the largest positive contribution to axis 2, the factors such as SMBP, SMBN, SMBC, TN, TP, TK, and SOC contributed more to axis 2 and had a higher negative correlation with ln(UR)/ln(ACP).

4. Discussion

4.1. Ecological Stoichiometry of Soil Nutrients, Microbial Biomass, and Enzyme Activity in Rhizosphere and Non-Rhizosphere Soils

Ecological stoichiometry can help to understand the relationships between elements involved in soil biogeochemical cycling processes [59], The nutrient cycling of forest ecosystems mainly occurs in the “plant–litter–soil” continuum, roots obtain the nitrogen, phosphorus, potassium, and other elements from the soil, and plants return nutrients into the soil in the form of litter [49]. Thus, exploring the stoichiometric characteristics of C, N, P, and K elements is helpful for understanding the nutrient cycling in plantation ecosystems. As an example, the element concentrations of individual phylogenetic groups within the soil microbial community may vary, but on average, atomic C:N:P ratios in both the soil (186:13:1) and the soil microbial biomass (60:7:1) are well-constrained at the global scale [60]. The average C:N:P ratio for soil nutrients in China was 60:5:1, while in tropical and subtropical areas of China, the ratio was 52:4:1 [61]. In our study, the soil C:N:P in the rhizosphere and non-rhizosphere soils were 41:5:1 and 37:5:1, respectively, and the C:N:P of microbial biomass was 66:3:1 and 74:4:1, respectively. Our previous study also reported that the average soil C:N:P in P. chinensis plantations was 35:2:1 and the microbial biomass C:N was 8:1 [62]. This result implies that the soil nutrients and microbial biomass C:N:P in the study area were low compared to the stoichiometry at the global scale and are closer to the China-wide result for soil nutrients (C:N:P = 60:5:1) and the 52:4:1 exhibited in tropical and subtropical China, which also indicates that the soil stoichiometry varies between regions globally. The mean C:N:P:K values of forest soils within the Maolan National Nature Reserve in Southwest China were 50.0:2.0:0.2:1.0 [26]. In comparison, the mean C:N:P:K values for the rhizosphere and non-rhizosphere soils were 273.0:35.0:7.0:1.0, which appeared to be lower in K relative to the higher C, N, and P contents of our study area. This may be related to the loss of elemental K due to the strong acidic disturbance of the soils in this region.
A global meta-analysis showed that the soil enzyme activity C:N:P was approximately 1:1:1 on a global scale [40]. It also suggested that the average ratio of enzyme C:N:P activity was about 1:1:1 and was restricted to a reasonably narrow range [63]. The ratio of C:N:P acquisition enzyme activity in eastern Chinese tropical rainforest soils is close to 1:1:1 [64]. Our sampling sites are located in the subtropics of Southwestern China. The results showed this ratio to be 1.3:0.9:1.0 and 1.3:1.0:1.0 for rhizosphere and non-rhizosphere soils, respectively, which are close to the global scale result of 1:1:1. This may be related to the fact that the secretion and activity of enzymes related to soil C transformation are higher in this study area. This ratio was 0.68:1.34:1.00 and 0.62:1.19:1.00 for the rhizosphere and non-rhizosphere soils of Pinus sylvestris Linn. plantations in Northwest China, respectively [41]. In contrast, the ratio was 1.00:1.06:1.17 in the soil of Larix olgensis Henry. plantations in Northeastern China [65], and although this result is close to the global-scale study, it is not exactly equal to 1:1:1. The reason for this may be that soil microorganisms secrete more specific enzymes in order to obtain limiting nutrients to meet their metabolic needs, resulting in a deviation in the stoichiometric ratio of soil enzymes from 1:1:1 [40].
It has been shown that Vector A is higher than 45° in both rhizosphere and non-rhizosphere soils in alpine ecosystems, that P limitation is prevalent, and that microbial nutrient limitation is regulated by the soil water content, temperature, and nutrient stoichiometry in the interaction of altitude and sample topography [66]. This is consistent with our findings that Vector A was also above 45° for all rhizosphere and non-rhizosphere soil samples (except for the non-rhizosphere soil at 1a), and that rhizosphere soil was higher than non-rhizosphere (Figure 5e). In P-poor soils in tropical rainforest areas, a higher microbial biomass N:P ratio usually means that the soil is more P-limited. It is well documented that lower P effectiveness strongly limits microbial biomass and its activity [67]. The soils of all the sample plots in our study were strongly acidic and low in phosphorus (Table 1), and the microbial biomass N:P of the rhizosphere soils was slightly less than that of the non-rhizosphere soils (Figure 3c). This suggests that non-rhizosphere soils of P. chinensis plantations are more susceptible to P limitation, possibly because non-rhizosphere soils have lower P-converting enzyme content and activity and fewer root secretions involved in P conversion than rhizosphere microenvironments, P being more difficult to mineralize and release than C and N [26]. This result verifies our first hypothesis that P. chinensis plantation soils are severely P-limited.

4.2. Effect of Stand Age on Soil Nutrients, Microbial Biomass, and Enzyme Activity

Differences in soil conditions due to forest ecosystem succession and increasing stand age can alter nutrient balances and thus regulate different soil enzyme processes. The characteristics of the response of soil extracellular enzymes to this temporal variability are important for understanding the soil enzyme-driven subsurface ecosystem function [68]. In the present study, we found that the soil pH did not change significantly with age. This suggests that the pH in the rhizosphere and non-rhizosphere soil is not sensitive to temporal changes, which may be related to the strong acidity of the soils in the area. TK showed rhizosphere < non-rhizosphere in the first 9 years. The same trend was recorded for SOM and AK in the first 2 years (Table 1). The reason for this might be that at the beginning of the silvicultural period, the root system of P. chinensis at the young stage absorbed more K than other nutrients, resulting in a lower K content in the rhizosphere compared to the non-rhizosphere.
Soil P limitation is common in tropical and subtropical forests in China [69,70,71]. The plantations of Caragana korshinskii Kom. are more suitable for ecological restoration, with soil C, N, P, and K contents increasing significantly with increasing stand age [49]. The soil total P and K contents of the rhizosphere soil of P. chinensis plantations were highest in the 42a stand, which means that K is not strongly restricted when P. chinensis plantations are growing to maturity. However, the NN, AP, and AK contents steadily increased in the first 9 years, and decreased significantly in the 42a stand (Table 1). This indicates that the TP in the rhizosphere regressed and cycled better with age due to the contribution of phosphatase and root secretions. However, the AP, AK, and NN contents are more effective for plant uptake. Thus, AP, AK, and NN decreased, and the decrease in AP content especially predicted that the stand was limited by low P effectiveness. In highly weathered soils of tropical and subtropical China, phoD genes that regulate P cycling in Cunninghamia lanceolata (Lamb.) Hook. plantation soils increase progressively with age, and under P-deficient conditions, microorganisms tend to optimize growth by allocating more resources to obtain bioavailable P [72]. Similarly, we found that the effective nutrients tended to increase in the early stages, as the input of more apoplastic material as the trees grew provided a richer substrate for microbial metabolism and decomposition. Litter constitutes the main pathway for nutrient cycling between the plants and soil, thus it can supplement some of the nutrient deficits [73]. However, it still does not meet the available nutrient requirements of adult P. chinensis, resulting in a significant decline in these nutrient contents in the rhizosphere. This is similar to the findings of Pinus massoniana Lamb. plantations, where the demand for nutrients in trees increases substantially as the age grows [74].
The SMBC, SMBN, and SMBP of P. chinensis plantation showed an increasing and then decreasing trend in the age series, which indicated that by the late silvicultural stage, especially in 42a stands, the microbial population started to decline, suggesting that the growth of P. chinensis appeared overripe and the colonization and activity of soil microorganisms in the stands were reduced (Figure 2). Similar to our findings, near mature (36a) stands of Pinus massoniana plantations significantly improved the enzyme activity but reduced fungal diversity and abundance [75]; likewise, microbial biomass and diversity decreased in subtropical Cunninghamia lanceolata plantations at 35a [76]. The planting duration of Camellia sinensis (L.) O. Ktze. significantly impacts the microbial community structure and its abundance, resulting in a significant decline in the microbial biomass of C starting at 50a [77]. Therefore, it is indicated that soil microbial activity in stands gradually declines over long time scales (decades). This occurs because the metabolic function of soil microbial biomass may be inhibited by low pH or impaired by proton toxicity and higher concentrations of free toxic metals [78]. This toxic effect may be enhanced in acidic soils. The possible explanation for this is that the heavy metals complexed to soluble organic matter will decrease with soil pH, allowing a larger proportion of metal cations to be present in the free state, and these are usually toxic ions to plants, such as aluminum ions.

4.3. Effect of Stand Age on Soil Nutrients, Microbial Biomass, and Extracellular Enzyme Stoichiometry Ratios

The C/N, C/P, and N/P in the rhizosphere and non-rhizosphere soils resulted in an overall upward and then downward trend with increasing age (Figure 1a–c), being significantly (p < 0.05) higher in 8a stands than in other stands, where typically higher C/P and N/P ratios resulted in a deficiency of P relative to C and N [72]. These results indicated that in P. chinensis plantations, the soil was more deficient in P than C and N, but this phenomenon diminishes with age and is alleviated by 42a. Wang et al. [76] reported that with an increasing stand age, soils in Cunninghamia lanceolata plantations gradually shifted from P-limited to N-limited. For the nutrient limitation of soil microorganisms, the stoichiometry of soil microbial biomass was found to be a better indicator than the stoichiometry of nutrients and enzymes [79]. In the present study, SMBC and SMBP were also higher in rhizosphere soils than in non-rhizosphere in the first 8 years, which is consistent with the results of Bi et al. [41], who reported that the SMBC and SMBP were significantly greater in rhizosphere soils than in non-rhizosphere soils at all stand ages of Pinus sylvestris plantations. The SMBC/SMBP and SMBN/SMBP in rhizosphere soils of P. chinensis plantations were lower than in non-rhizosphere with increasing stand age. SMBC/SMBP and SMBN/SMBP showed an increasing trend (Figure 3), which was consistent with the findings of Zhang et al. [80]. They found that the SMBC, SMBN, SMBP, SMBC/SMBN, and SMBC/SMBP in soils of Myrica rubra (Lour.) S. et Zucc plantations showed a significant decrease followed by a slight increase, while SMBN/SMBP showed a continuously increasing trend [65]. In conclusion, we found that soil nutrients C, N, P, K, and the stoichiometry between them were significantly influenced by the number of silvicultural periods, which was consistent with the findings of Li et al. [49]. This also verifies our second hypothesis.
Soil extracellular enzyme activities are susceptible to the external environment, especially temporal changes. The activities of SU, UR, and ACP are driven by a combination of temporal and land use changes in the forest stand [68]. At different stages of development in the stand, the fungal communities of rhizosphere soils exhibit different diversities and compositions, influencing the soil function through enzymatic activity [75]. In this study, the activity of BG and ACP enhanced at 8a with the increasing stand age, after which it began to decline. The activity of SU tended to decrease in the first 8 years, reaching a minimum by 42, whereas a slow increase in the activity of UR was recorded in rhizosphere soils (Figure 4). The activity of ACP in Pinus massoniana plantations was significantly lower in 30a stands than in other stands. The possible reason for this may be that the lower SOC and TN in the middle-aged stands resulted in lower enzyme activity [81]. The ln(BG+SU)/ln(UR) and ln(BG+SU)/ln(ACP) were significantly highest at 2a and lowest at 42a. The ln(UR)/ln(ACP) in the rhizosphere and non-rhizosphere showed the significantly lowest values in the 8a and 3a stands (Figure 5a–c). These results indicate that soils of P. chinensis plantations in stand 42a were limited by a combination of N and P. At the same time, the rhizosphere activity of the N-acquisition enzyme was increasing, suggesting that the rhizosphere was adapting to the N limitation by increasing its enzyme activity [82].

4.4. Correlation of C, N, and P Stoichiometric Ratios between “Nutrient-Microbial Biomass-Enzyme Activity” in Soils

Moorhead et al. [38,58] proposed to quantify the C, N, and P limitation of soil microorganisms using the vector angle (Vector A) and vector length (Vector L) of the enzyme stoichiometry. Vector A > 45° indicated that the microorganism was more restricted by P, and Vector A < 45° indicated that it was more restricted by N. A larger Vector L indicated that the microorganism was more restricted by C. In Pinus massoniana plantations at different growth stages in central subtropical China, soil microorganisms were N-limited, and while the N limitation was moderated with increasing stand age, the microbial demand for P increased, i.e., the microbial growth shifted from N limitation to P limitation [83]. This was consistent with our findings that Vector A was consistently greater than 46° in rhizosphere soil and greater than 45° in non-rhizosphere soil (except for 1a stands where Vector A < 43°) (Figure 5d). This indicated that the non-rhizosphere soils of P. chinensis were N-limited in the first year after afforestation, and then turned into a strong P limitation. However, this P limitation in the non-rhizosphere soil would decrease with the increase in the stand age, while the rhizosphere soil was always limited. We speculated that microorganisms in the rhizosphere soil were more severely limited by C than those in non-rhizosphere soil, but this C limitation would be weakened at 42a (Figure 5e). The soil microbial C limitation in Pinus sylvestris plantations was significantly higher in the rhizosphere than in non-rhizosphere, and the C limitation was enhanced before stand maturity [41], which was consistent with our results. Another study found that in Pinus tabuliformis Carr. natural stands, P limitation gradually decreased and C limitation slightly increased with increasing stand age [33], which, contrary to our results, may have been the result of differences in the soil management practices between natural and planted stands, and may have also been due to differences in the soil-forming parent material, as soil acidification in this study area severely affected microbial decomposition functions [41]. The results of the correlation analysis (Figure 7) showed a positive correlation between the soil K stoichiometry and the activity of C-related extracellular enzymes (BG and SU), suggesting that K was closely interrelated with the decomposition of soil organic matter [84].
Current studies often relate the stoichiometry of soil extracellular enzymes to C/N, C/P, and N/P of the soil to evaluate the nutrient use and demand characteristics of microorganisms, and the metabolic processes of the microbial communities [32]. However, it is unclear whether these indicators are effective at revealing the microbial nutrient limitation consistently and which one of them can better indicate the nutrient limitation [79,85]. For example, it has been shown that there is no significant relationship between the enzyme activity and nutrient stoichiometry in soils, but the enzyme activity C/N is significantly negatively correlated with microbial biomass C/N, and soil enzyme activity C/P is significantly positively correlated with microbial biomass C/P [41]. A significant negative correlation was found between the microbial biomass and enzyme stoichiometry in Cunninghamia lanceolata plantations [76]. Luo et al. [85] found that the stoichiometric ratios of soil nutrients, microbial biomass, and ecological enzymes indicated different nutrient limitation consequences, i.e., the ratios of soil nutrients and enzyme activity indicated that P was the greatest limiting factor, but the ratios of microbial biomass indicated a greater limitation by N. Ultimately, they concluded that microbial biomass stoichiometry may be the most valuable indicator, which is consistent with the view derived from our results. Our study found that the soil nutrient stoichiometry indicated that P. chinensis stands soils were mainly limited by C and N, while the ratios for both the microbial biomass and enzyme activity indicated a greater limitation by P. However, the correlation analysis showed that the microbial biomass stoichiometry was significantly (p < 0.05) correlated with nutrient stoichiometry, while there was little correlation with enzyme activity stoichiometry. Therefore, we suggest that the stoichiometries of soil microbial biomass C, N, and P in P. chinensis plantations are more meaningful indicators of the nutrient limitation.
The results of the redundancy analysis (Figure 8) showed that in the rhizosphere and non-rhizosphere soils of P. chinensis plantations, effective nutrients such as AN, NN, AP, and AK contributed more to the variation in the stoichiometry of soil enzymes. This suggests that there was an important positive influence of the soil nutrient potency on the enzyme stoichiometry. It reaffirmed that nutrient effectiveness is a key factor driving soil P limitation in P. chinensis stands. These findings highlight the important role that available elements play in regulating the soil stoichiometry. This has scientific implications for understanding the stoichiometry of “soil–microbial biomass–enzyme activity” in Dipterocarpaceae stands in subtropical and tropical regions.
However, it should be noted that this study only focused on pure plantation stands in subtropical areas. Therefore, the findings may not be generalizable to other regions or mixed-species stands. Additionally, potential confounding factors, such as temperature, precipitation, or plant community composition, which could affect soil nutrient cycling, were not considered in this study, which only included 6 stand ages, making it unclear how these patterns will change over different years and seasons. Future studies are needed to explore P. chinensis plantations over different time durations, such as year-wise and season-wise, mixed with other species in different climates, to provide a comprehensive understanding of the soil nutrient dynamics in P. chinensis plantations.

5. Conclusions

The results of this study show that the rhizosphere soils of P. chinensis plantations are more severely C- and P-limited than the non-rhizosphere soils. The C-limitation diminished as the stand grew to maturity, but the P limitation was always constant. In the young stands, the soils of the non-rhizosphere were strongly N-limited, and would gradually shift to P limitation due to the time drive. As the soils in this study area were highly acidic, this adversely affected the effectiveness of the soil nutrients and their biochemical cycling. The growth of P. chinensis plantations and the accumulation of soil microbial biomass were both limited by soil phosphorus. Stand age produced significant effects on the soil nutrients C, N, P, and K, soil microbial biomass C, N, and P, and the activity of enzymes associated with soil C, N, and P acquisition and the stoichiometry between them. As the stand age increased, the soil C/N, C/P, and N/P, soil microbial biomass C, N, and P, and the activities of β-1,4-glucosidase and acid phosphatase were decreased, which further reduced the effectiveness of soil C and P. In subtropical P. chinensis plantations, when P. chinensis plantations reached maturity (42a), the C/K, N/K, and P/K were decreasing in rhizosphere soils, but instead increased in non-rhizosphere soils, and K was significantly correlated with soil organic carbon content and extracellular enzyme activities involved in C and N acquisition. The stoichiometry of soil C, N, and P indicated that microorganisms were mainly limited by C and N, while the stoichiometry of microbial biomass and enzyme activity indicated greater P limitation. The correlation analysis ultimately indicated that soil microbial stoichiometry was the most sensitive indicator of the nutrient limitation. The content of available nutrients such as AN, NN, AP, and AK were the key factors driving P limitation.

Author Contributions

Conceptualization, W.L. and M.Y.; methodology, W.L. and X.H.; software, W.L., S.U. and I.A.; validation, W.L. and M.Y.; formal analysis, M.Y.; investigation, W.L. and X.H.; data curation, W.L.; writing—original draft preparation, W.L. and X.H.; writing—review and editing, S.U., I.A. and M.Y. All authors have read and agreed to the published version of the manuscript.

Funding

This research was funded by National Natural Science Foundation of China, 31960307; Guangxi Natural Science Foundation of China, 2018GXNSFAA28110; Innovation Project of Guangxi Graduate Education, YCBZ2022036; and Gui Lin Ke Yan [2022ZC] No.77.

Data Availability Statement

The data that support the findings of this study are available from the corresponding author upon reasonable request.

Acknowledgments

The authors thank all the staff involved in the woodland survey and tree physiology experiments for their technical assistance and the Nanning Arboretum for providing stand information and access to sampling equipment.

Conflicts of Interest

The authors declare no conflict of interest.

References

  1. Das, S.C.; Alam, M.S.; Hossain, M.A. Diversity and structural composition of species in dipterocarp forests: A study from fasiakhali wildlife sanctuary, bangladesh. J. For. Res. 2018, 29, 1241–1249. [Google Scholar] [CrossRef]
  2. Guo, J.H. National class i protected plant Parashorea chinensis and its family. Biol. Teach. 2000, 43, 37–38. [Google Scholar]
  3. Qin, H.N.; Yang, Y.; Dong, S.Y.; He, Q.; Jia, Y.; Zhao, L.N.; Yu, S.X.; Liu, H.Y.; Liu, B. Threatened species list of China’s higher plants. Biodivers. Sci. 2017, 25, 696–744. [Google Scholar] [CrossRef] [Green Version]
  4. Ming, Y. The adjusted “list of national key protected wild plants” was officially announced. Green China 2021, 581, 74–79. [Google Scholar]
  5. Ismail, S.A.; Buser, A.; Shaanker, R.U.; Ravikanth, G.; Ghazoul, J.; Kettle, C.J. Development of polymorphic microsatellite markers for the critically endangered and endemic indian dipterocarp, Vateria indica L. (Dipterocarpaceae). Conserv. Genet. Resour. 2013, 5, 465–467. [Google Scholar] [CrossRef] [Green Version]
  6. Maycock, C.R.; Kettle, C.J.; Khoo, E.; Pereira, J.T.; Sugau, J.B.; Nilus, R.; Ong, R.C.; Amaludin, N.A.; Newman, M.F.; Burslem, D. A revised conservation assessment of dipterocarps in sabah. Biotropica 2012, 44, 649–657. [Google Scholar] [CrossRef] [Green Version]
  7. Nawi, L.; Suratman, M.N.; Siti, Z.M.T. Conservation of the Critically Endangered Tree Species Dipterocarpus Semivestitus in Malaysia; IEEE: Ney York, NY, USA, 2013; pp. 225–228. [Google Scholar]
  8. Tian, Z.Z.; Zeng, P.; Lu, X.Y.; Zhou, T.G.; Han, Y.W.; Peng, Y.M.; Xiao, Y.X.; Zhou, B.T.; Liu, X.; Zhang, Y.T.; et al. Thirteen dipterocarpoideae genomes provide insights into their evolution and borneol biosynthesis. Plant Commun. 2022, 3, 100464. [Google Scholar] [CrossRef] [PubMed]
  9. Zhang, L.; Zhang, H.L.; Chen, Y.K.; Nizamani, M.M.; Zhou, Q.; Su, X.T. Analyses of community stability and inter-specific associations between a plant species with extremely small populations (hopea hainanensis) and its associated species. Front. Ecol. Evol. 2022, 10, 922829. [Google Scholar] [CrossRef]
  10. Filipiak, M.; Filipiak, Z.M. Application of ionomics and ecological stoichiometry in conservation biology: Nutrient demand and supply in a changing environment. Biol. Conserv. 2022, 272, 109622. [Google Scholar] [CrossRef]
  11. Shukla, A.; Mehrotra, R.C.; Guleria, J.S. Emergence and extinction of dipterocarpaceae in western india with reference to climate change: Fossil wood evidences. J. Earth Syst. Sci. 2013, 122, 1373–1386. [Google Scholar] [CrossRef] [Green Version]
  12. Velden, V.D.; Ferry Slik, J.W.; Hu, Y.H.; Lan, G.; Lin, L.; Deng, X.; Poorter, L. Monodominance of Parashorea chinensis on fertile soils in a chinese tropical rain forest. J. Trop. Ecol. 2014, 30, 311–322. [Google Scholar] [CrossRef]
  13. Meng, L.Z.; Zhang, J.L.; Cao, K.F.; Xu, Z.F. Diurnal changes of photosynthetic characteristics and chlorophyll fluorescence in canopy leaves of four diptocarp species under ex-situ conservation. Acta Phytoecol. Sin. 2005, 29, 976–984. [Google Scholar]
  14. Xiao, Y.X.; Liu, G.Y. Dipterocarpaceae plants ex-situ conservation and resources exploitation in Xishuangbanna tropical botanical garden (xtbg). Guihaia 2021, 41, 843–852. [Google Scholar]
  15. Su, L.; Du, H.; Zeng, F.P.; Peng, W.X.; Rizwan, M.; Nunez-Delgado, A.; Zhou, Y.Y.; Song, T.Q.; Wang, H. Soil and fine roots ecological stoichiometry in different vegetation restoration stages in a karst area, southwest China. J. Environ. Manag. 2019, 252, 109694. [Google Scholar] [CrossRef] [PubMed]
  16. Wang, Y.; Zhang, L.M.; Chen, J.; Feng, L.; Li, F.B.; Yu, L.F. Functional diversity of plant communities in relationship to leaf and soil stoichiometry in karst areas of south west China. Forests 2022, 13, 864. [Google Scholar] [CrossRef]
  17. Amazonas, N.T.; Martinelli, L.A.; Piccolo, M.D.; Rodrigues, R.R. Nitrogen dynamics during ecosystem development in tropical forest restoration. For. Ecol. Manag. 2011, 262, 1551–1557. [Google Scholar] [CrossRef]
  18. Guo, Z.M.; Zhang, X.Y.; Green, S.M.; Dungait, J.; Wen, X.F.; Quine, T.A. Soil enzyme activity and stoichiometry along a gradient of vegetation restoration at the karst critical zone observatory in southwest China. Land Degrad. Dev. 2019, 30, 1916–1927. [Google Scholar] [CrossRef]
  19. Waal, D.B.V.D.; Elser, J.J.; Martiny, A.C.; Sterner, R.W.; Cotner, J.B. Editorial: Progress in ecological stoichiometry. Front. Microbiol. 2018, 9, 1957. [Google Scholar] [CrossRef] [Green Version]
  20. Sterner, R.W.; Elser, J.J. Ecological Stoichiometry: The Biology of Elements from Molecules to the Biosphere; Princeton University Press: Princeton, NJ, USA, 2002; pp. 439–464. [Google Scholar]
  21. Qi, K.B.; Pang, X.Y.; Yang, B.; Bao, W.K. Soil carbon, nitrogen and phosphorus ecological stoichiometry shifts with tree species in subalpine plantations. PeerJ 2020, 8, e9702. [Google Scholar] [CrossRef] [PubMed]
  22. Wen, J.H.; Ji, H.W.; Sun, N.X.; Tao, H.M.; Du, B.M.; Hui, D.F.; Liu, C.J. Imbalanced plant stoichiometry at contrasting geologic-derived phosphorus sites in subtropics: The role of microelements and plant functional group. Plant Soil 2018, 430, 113–125. [Google Scholar] [CrossRef]
  23. Wang, L.J.; Wang, P.; Sheng, M.Y.; Tian, J. Ecological stoichiometry and environmental influencing factors of soil nutrients in the karst rocky desertification ecosystem, southwest China. Glob. Ecol. Conserv. 2018, 16, e449. [Google Scholar] [CrossRef]
  24. Hu, X.Y.; Duan, A.G.; Zhang, J.G.; Du, H.L.; Zhang, X.Q.; Guo, W.F.; Sun, J.J. Stoichiometry of carbon, nitrogen, and phosphorus of chinese fir plantations in daqing mountain, guangxi. Acta Ecol. Sin. 2020, 40, 1207–1218. [Google Scholar]
  25. Güsewell, S. N: P ratios in terrestrial plants: Variation and functional significance. New Phytol. 2004, 164, 243–266. [Google Scholar] [CrossRef]
  26. Wu, P.; Zhou, H.; Cui, Y.C.; Zhao, W.J.; Hou, Y.J.; Tan, C.J.; Yang, G.N.; Ding, F.J. Stoichiometric characteristics of leaf, litter and soil during vegetation succession in maolan national nature reserve, guizhou, China. Sustainability 2022, 14, 16517. [Google Scholar] [CrossRef]
  27. Finn, D.; Kopittke, P.M.; Dennis, P.G.; Dalal, R.C. Microbial energy and matter transformation in agricultural soils. Soil Biol. Biochem. 2017, 111, 176–192. [Google Scholar] [CrossRef] [Green Version]
  28. Sinsabaugh, R.L.; Shah, J. Ecoenzymatic stoichiometry and ecological theory. Annu. Rev. Ecol. Evol. Syst. 2012, 43, 313–343. [Google Scholar] [CrossRef] [Green Version]
  29. Schimel, J.P.; Weintraub, M.N. The implications of exoenzyme activity on microbial carbon and nitrogen limitation in soil: A theoretical model. Soil Biol. Biochem. 2003, 35, 549–563. [Google Scholar] [CrossRef]
  30. Yu, Y.; Zheng, W.; Zhong, X.; Ying, B. Stoichiometric characteristics of carbon, nitrogen and phosphorus in zanthoxylum planispinum var. Dintanensis plantation of different ages. Agron. J. 2020, 113, 685–695. [Google Scholar]
  31. Wang, X.F.; Li, J.L.; Xing, G.T.; Mai, S.W.; Liu, W.J.; Jiang, Y.M.; Xu, W.X.; Yang, Q.; Yang, H.; Lu, J.L.; et al. Soil organic carbon distribution, enzyme activities, and the temperature sensitivity of a tropical rainforest in wuzhishan, hainan island. Forests 2022, 13, 1943. [Google Scholar] [CrossRef]
  32. Hill, B.H.; Elonen, C.M.; Jicha, T.M.; Cotter, A.M.; Trebitz, A.S.; Danz, N.P. Sediment microbial enzyme activity as an indicator of nutrient limitation in great lakes coastal wetlands. Freshw. Biol. 2006, 51, 1670–1683. [Google Scholar] [CrossRef]
  33. Chen, H.N.; Xiang, Y.; Yao, Z.X.; Zhang, Q.; Li, H.; Cheng, M. Stability of C:N:P stoichiometry in the plant-soil continuum along age classes in natural pinus tabuliformis carr. Forests of the eastern loess plateau, China. Forests 2023, 14, 44. [Google Scholar] [CrossRef]
  34. Liu, C.H.; Ma, J.Y.; Qu, T.T.; Xue, Z.J.; Li, X.Y.; Chen, Q.; Wang, N.; Zhou, Z.C.; An, S.S. Extracellular enzyme activity and stoichiometry reveal nutrient dynamics during microbially-mediated plant residue transformation. Forests 2023, 14, 34. [Google Scholar] [CrossRef]
  35. Wang, J.P.; Wu, Y.H.; Li, J.J.; He, Q.Q.; Bing, H.J. Soil enzyme stoichiometry is tightly linked to microbial community composition in successional ecosystems after glacier retreat. Soil Biol. Biochem. 2021, 162, 108429. [Google Scholar] [CrossRef]
  36. Redel, Y.; Rubio, R.; Godoy, R.; Borie, F. Phosphorus fractions and phosphatase activity in an andisol under different forest ecosystems. Geoderma 2006, 145, 216–221. [Google Scholar] [CrossRef]
  37. Deforest, J. Effects of elevated pH and phosphorus fertilizer on soil C, N and P enzyme stoichiometry in an acidic mixed mesophytic deciduous forest. Soil Biol. Biochem. 2020, 150, 107996. [Google Scholar] [CrossRef]
  38. Moorhead, D.L.; Sinsabaugh, R.L.; Hill, B.H.; Weintraub, M.N. Vector analysis of ecoenzyme activities reveal constraints on coupled C, N and P dynamics. Soil Biol. Biochem. 2016, 93, 1–7. [Google Scholar] [CrossRef]
  39. Srivastava, S.C.; Singh, J.S. Microbial c, n and p in dry tropical forest soils: Effects of alternate land-uses and nutrient flux. Soil Biol. Biochem. 1991, 23, 117–124. [Google Scholar] [CrossRef]
  40. Sinsabaugh, R.L.; Lauber, C.L.; Weintraub, M.N.; Ahmed, B.; Allison, S.D.; Crenshaw, C.; Contosta, A.R.; Cusack, D.; Frey, S.; Gallo, M.E.; et al. Stoichiometry of soil enzyme activity at global scale. Ecol. Lett. 2008, 11, 1252–1264. [Google Scholar] [CrossRef] [PubMed]
  41. Bi, B.Y.; Wang, Y.; Wang, K.; Zhang, H.; Fei, H.Y.; Pan, R.P.; Han, F.P. Changes in microbial metabolic C- and N-limitations in the rhizosphere and bulk soils along afforestation chronosequence in desertified ecosystems. J. Environ. Manag. 2022, 303, 114215. [Google Scholar] [CrossRef]
  42. Peng, X.Q.; Wang, W. Stoichiometry of soil extracellular enzyme activity along a climatic transect in temperate grasslands of northern China. Soil Biol. Biochem. 2016, 98, 74–84. [Google Scholar] [CrossRef]
  43. Li, Y.; Niu, S.L.; Yu, G.R. Aggravated phosphorus limitation on biomass production under increasing nitrogen loading: A meta-analysis. Glob. Chang. Biol. 2016, 22, 934–943. [Google Scholar] [CrossRef] [PubMed]
  44. Vitousek, P.M.; Porder, S.; Houlton, B.Z.; Chadwick, O.A. Terrestrial phosphorus limitation: Mechanisms, implications, and nitrogen–phosphorus interactions. Ecol. Appl. 2010, 20, 5–15. [Google Scholar] [CrossRef] [Green Version]
  45. Zhou, Z.H.; Wang, C.K.; Jin, Y. Stoichiometric responses of soil microflora to nutrient additions for two temperate forest soils. Biol. Fertil. Soils 2017, 53, 397–406. [Google Scholar] [CrossRef]
  46. Clausing, S.; Pena, R.; Song, B.; Muller, K.; Mayer-Gruner, P.; Marhan, S.; Grafe, M.; Schulz, S.; Krueger, J.; Lang, F.; et al. Carbohydrate depletion in roots impedes phosphorus nutrition in young forest trees. New Phytol. 2021, 229, 2611–2624. [Google Scholar] [CrossRef]
  47. Bao, S.D. Soil Agrochemical Analysis; China Agricultural Press: Beijing, China, 2000. [Google Scholar]
  48. Kammann, C.I.; Schmidt, H.; Messerschmidt, N.; Linsel, S.; Steffens, D.; Müller, C.; Koyro, H.; Conte, P.; Joseph, S.; Stephen, J. Plant growth improvement mediated by nitrate capture in co-composted biochar. Sci. Rep. 2015, 5, 11080. [Google Scholar] [CrossRef] [Green Version]
  49. Li, Y.G.; Dong, X.X.; Yao, W.X.; Han, C.; Sun, S.; Zhao, C.M. C, N, P, K stoichiometric characteristics of the “leaf-root-litter-soil” system in dryland plantations. Ecol. Indic. 2022, 143, 109371. [Google Scholar] [CrossRef]
  50. Vance, E.D.; Brookes, P.C.; Jenkinson, D.S. An extraction method for measuring soil microbial biomass C. Soil Biol. Biochem. 1987, 19, 703–707. [Google Scholar] [CrossRef]
  51. Yu, W.; Brookes, P.C.; Qiang, M.; Zhou, H.; Xu, Y.; Shen, S. Extraction of soil nitrogen by chloroform fumigation—A new index for the evaluation of soil nitrogen supply. Soil Biol. Biochem. 2011, 43, 2423–2426. [Google Scholar] [CrossRef]
  52. Fanin, N.; Fromin, N.; Buatois, B.; Httenschwiler, S. An experimental test of the hypothesis of non-homeostatic consumer stoichiometry in a plant litter-microbe system (letter). Ecol. Lett. 2013, 16, 764–772. [Google Scholar] [CrossRef] [PubMed]
  53. Brookes, P.C.; Landman, A.; Pruden, G.; Jenkinson, D.S. Chloroform fumigation and the release of soil nitrogen: A rapid direct extraction method to measure microbial biomass nitrogen in soil—Sciencedirect. Soil Biol. Biochem. 1985, 17, 837–842. [Google Scholar] [CrossRef]
  54. Gao, M.L.; Song, W.H.; Zhou, Q.; Ma, X.J.; Chen, X.Y. Interactive effect of oxytetracycline and lead on soil enzymatic activity and microbial biomass. Environ. Toxicol. Pharmacol. 2013, 36, 667–674. [Google Scholar] [CrossRef] [PubMed]
  55. Guan, S.Y. Soil Enzyme and Its Research Methods; China Agriculture Press: Beijing, China, 1986; pp. 321–376. [Google Scholar]
  56. Sinsabaugh, R.L.; Hill, B.H.; Shah, J. Ecoenzymatic stoichiometry of microbial organic nutrient acquisition in soil and sediment (vol 462, pg 795, 2009). Nature 2010, 468, 122. [Google Scholar] [CrossRef] [Green Version]
  57. Hill, B.H.; Elonen, C.M.; Jicha, T.M.; Kolka, R.K.; Lehto, L.R.L.P.; Sebestyen, S.D.; Seifert-Monson, L.R. Ecoenzymatic stoichiometry and microbial processing of organic matter in northern bogs and fens reveals a common p-limitation between peatland types. Biogeochemistry 2014, 120, 203–224. [Google Scholar] [CrossRef]
  58. Moorhead, D.L.; Rinkes, Z.L.; Sinsabaugh, R.L.; Weintraub, M.N. Dynamic relationships between microbial biomass, respiration, inorganic nutrients and enzyme activities: Informing enzyme-based decomposition models. Front. Microbiol. 2013, 4, 223. [Google Scholar] [CrossRef] [PubMed] [Green Version]
  59. Liu, T.R.; Peng, D.L.; Tan, Z.J.; Guo, J.P.; Zhang, Y.X.; Liu, H.L. Do stand density and month regulate soil enzymes and the stoichiometry of differently aged larix principis-rupprechtii plantations? Catena 2023, 220, 106683. [Google Scholar] [CrossRef]
  60. Cleveland, C.C.; Liptzin, D. C:n:p stoichiometry in soil: Is there a “redfield ratio” for the microbial biomass? Biogeochemistry 2007, 85, 235–252. [Google Scholar] [CrossRef]
  61. Tian, H.Q.; Chen, G.S.; Zhang, C.; Melillo, J.M.; Hall, C.A.S. Pattern and variation of c:n:p ratios in China’s soils: A synthesis of observational data. Biogeochemistry 2010, 98, 139–151. [Google Scholar] [CrossRef]
  62. Li, W.N.; Huang, Z.Y.; Zhao, C.M.; Yang, M. Characteristics of soil microbial biomass C, N and nutrients in young plantations of Parashorea chinensis. J. Beijing For. Univ. 2020, 42, 51–62. [Google Scholar]
  63. Waring, B.G.; Weintraub, S.R.; Sinsabaugh, R.L. Ecoenzymatic stoichiometry of microbial nutrient acquisition in tropical soils. Biogeochemistry 2014, 117, 101–113. [Google Scholar] [CrossRef]
  64. Xu, Z.; Yu, G.; Zhang, X.; He, N.; Wang, Q.; Wang, S.; Wang, R.; Zhao, N.; Jia, Y.; Wang, C. Soil enzyme activity and stoichiometry in forest ecosystems along the north-south transect in eastern China (nstec). Soil Biol. Biochem. 2017, 104, 152–163. [Google Scholar] [CrossRef]
  65. Wang, M.W.; Ji, L.; Shen, F.Y.; Meng, J.; Wang, J.L.; Shan, C.F.; Yang, L.X. Differential responses of soil extracellular enzyme activity and stoichiometric ratios under different slope aspects and slope positions in larix olgensis plantations. Forests 2022, 13, 845. [Google Scholar] [CrossRef]
  66. Cui, Y.X.; Bing, H.J.; Fang, L.C.; Jiang, M.; Shen, G.T.; Yu, J.L.; Wang, X.; Zhu, H.; Wu, Y.H.; Zhang, X.C. Extracellular enzyme stoichiometry reveals the carbon and phosphorus limitations of microbial metabolisms in the rhizosphere and bulk soils in alpine ecosystems. Plant Soil 2021, 458, 7–20. [Google Scholar] [CrossRef]
  67. Cleveland, C.C.; Schmidt, T. Phosphorus limitation of microbial processes in moist tropical forests: Evidence from short-term laboratory incubations and field studies. Ecosystems 2002, 5, 680–691. [Google Scholar] [CrossRef]
  68. Deng, J.; Chong, Y.J.; Zhang, D.; Ren, C.J.; Zhao, F.Z.; Zhang, X.X.; Han, X.H.; Yang, G.H. Temporal variations in soil enzyme activities and responses to land-use change in the loess plateau, China. Appl. Sci. 2019, 9, 3129. [Google Scholar] [CrossRef] [Green Version]
  69. Wu, Z.; Haack, S.E.; Lin, W.; Li, B.; Wu, L.; Fang, C.; Zhang, Z. Soil microbial community structure and metabolic activity of pinus elliottii plantations across different stand ages in a subtropical area. PLoS ONE 2015, 10, e135354. [Google Scholar] [CrossRef] [PubMed]
  70. Xu, H.; Du, H.; Zeng, F.; Song, T.; Peng, W. Diminished rhizosphere and bulk soil microbial abundance and diversity across succession stages in karst area, southwest China. Appl. Soil Ecol. 2020, 158, 103799. [Google Scholar] [CrossRef]
  71. Zeng, Y.L.; Fang, X.; Xiang, W.H.; Deng, X.W.; Peng, C.H. Stoichiometric and nutrient resorption characteristics of dominant tree species in subtropical chinese forests. Ecol. Evol. 2017, 7, 11033–11043. [Google Scholar] [CrossRef] [Green Version]
  72. Wang, C.; Xue, L.; Jiao, R. Stoichiometric imbalances and the dynamics of phosphatase activity and the abundance of phoc and phod genes with the development of cunninghamia lanceolata (lamb.) Hook plantations. Appl. Soil Ecol. 2022, 173, 104373. [Google Scholar] [CrossRef]
  73. Deng, L.; Guan, Z.P.S. Afforestation drives soil carbon and nitrogen changes in China. Land Degrad. Dev. 2016, 28, 151–165. [Google Scholar] [CrossRef] [Green Version]
  74. Ali, A.; Hussain, M.; Ali, S.; Akhtar, K.; Muhammad, M.W.; Zamir, A.; Ali, A.; Nizami, S.M.; Ahmad, B.; Harrison, M.T.; et al. Ecological stoichiometry in pinus massoniana l. Plantation: Increasing nutrient limitation in a 48-year chronosequence. Forests 2022, 13, 469. [Google Scholar] [CrossRef]
  75. Dong, H.Y.; Ge, J.F.; Sun, K.; Wang, B.Z.; Xue, J.M. Change in root-associated fungal communities affects soil enzymatic activities during pinus massoniana forest development in subtropical China. For. Ecol. Manag. 2020, 482, 118817. [Google Scholar] [CrossRef]
  76. Wang, C.Q.; Jiao, R.Z. Adaptive pathways of microorganisms to cope with the shift from p- to n-limitation in subtropical plantations. Front. Microbiol. 2022, 13, 870667. [Google Scholar] [CrossRef]
  77. Han, W.Y.; Kemmitt, S.J.; Brookes, P.C. Soil microbial biomass and activity in chinese tea gardens of varying stand age and productivity. Soil Biol. Biochem. 2007, 39, 1468–1478. [Google Scholar] [CrossRef]
  78. Sanders, J.R. The effect of ph and organic matter of some soils on the ionic activities and concentrations of trace elements in soil solutions. J. Sci. Food Agric. 1983, 34, 52–55. [Google Scholar]
  79. Nannipieri, P.; Giagnoni, L.; Renella, G.; Puglisi, E.; Ceccanti, B.; Masciandaro, G.; Fornasier, F.; Moscatelli, M.C.; Marinari, S. Soil enzymology: Classical and molecular approaches. Biol. Fertil. Soils Coop. J. Int. Soc. Soil Sci. 2012, 48, 743–762. [Google Scholar] [CrossRef]
  80. Zhang, Y.; Liu, H.Y.; Lv, A.H. The variation of ecological stoichiometry characteristics of carbon, nitrogen and phosphorus in root system of myrica rubra and its soil microbial biomass with different stand ages. Ecol. Sci. 2022, 41, 84–90. [Google Scholar]
  81. Pan, J.W.; Guo, Q.Q.; Li, H.E.; Luo, S.Q.; Zhang, Y.Q.; Yao, S.; Fan, X.; Sun, X.G.; Qi, Y.J. Dynamics of soil nutrients, microbial community structure, enzymatic activity, and their relationships along a chronosequence of pinus massoniana plantations. Forests 2021, 12, 376. [Google Scholar] [CrossRef]
  82. Mooshammer, M.; Wanek, W.; Zechmeister-Boltenstern, S.; Richter, A. Stoichiometric imbalances between terrestrial decomposer communities and their resources: Mechanisms and implications of microbial adaptations to their resources. Front. Microbiol. 2014, 5, 22. [Google Scholar] [CrossRef] [Green Version]
  83. Jiao, P.Y.; Guo, W.; Chen, Z.L.; Liu, X.; Hu, Y.L.; Wang, Y.Z. Soil enzyme stoichiometric characteristics of pinus massoniana plantations at different stand ages in mid-subtropical areas. Environ. Sci. 2022, 43, 1059–1068. [Google Scholar]
  84. Osono, T.; Takeda, H. Potassium, calcium, and magnesium dynamics during litter decomposition in a cool temperate forest. J. For. Res. 2004, 9, 23–31. [Google Scholar] [CrossRef]
  85. Luo, H.Q.; Yu, J.L.; Li, R.X.; Gu, J.D.; Luo, L.; Zhang, Y.Y.; He, Y.; Xiao, Y.L.; Deng, S.H.; Zhang, Y.Z.; et al. Microbial biomass C:N:P as a better indicator than soil and ecoenzymatic c:n:p for microbial nutrient limitation and c dynamics in zoige plateau peatland soils. Int. Biodeterior. Biodegrad. 2022, 175, 105492. [Google Scholar] [CrossRef]
Figure 1. Nutrient stoichiometry ratios for rhizosphere and non-rhizosphere soils at different stand ages. Soil C/N (a), C/P (b), N/P (c), C/K (d), N/K (e) and P/K (f). Note: different capital letters indicate significant differences between stand ages; different lower-case letters indicate significant differences between rhizosphere and non-rhizosphere soils at the same stand age (p < 0.05).
Forests 14 00624 g001
Figure 2. Soil microbial biomass C (a), N (b), P (c) in the rhizosphere and non-rhizosphere soils at different stand ages. Note: different capital letters indicate significant differences between stand ages; different lower-case letters indicate significant differences between rhizosphere and non-rhizosphere soils at the same stand age (p < 0.05).
Forests 14 00624 g002
Figure 3. Ecological stoichiometric ratios of soil microbial biomass in rhizosphere and non-rhizosphere soils at different stand ages. SMBC/N (a), SMBC/P (b), SMBN/P (c). Note: different capital letters indicate significant differences between stand ages; different lower-case letters indicate significant differences between rhizosphere and non-rhizosphere soils at the same stand age (p < 0.05).
Forests 14 00624 g003
Figure 4. Soil enzyme activities in rhizosphere and non-rhizosphere soils at different stand ages. Note: different capital letters indicate significant differences between stand ages; different lower-case letters indicate significant differences between rhizosphere and non-rhizosphere soils at the same stand age (p < 0.05).
Forests 14 00624 g004
Figure 5. Characteristics of soil enzyme stoichiometry ratios in rhizosphere and non-rhizosphere soils at different stand ages. Logarithmic ratios of the activities of C-acquiring enzymes (BG+SU) and N-acquiring enzymes (UR) (a), C-acquiring enzymes (BG+SU) and P-acquiring enzymes (ACP) (b), and N-acquiring enzymes (UR) and P-acquiring enzymes (ACP) (c). Vector length (d) and vector angle (e) of the activities of C-acquiring enzymes (BG+SU), N- acquiring enzymes (UR) and P-acquiring enzymes (ACP). Correlation of vector length, vector angle and available nutrient content (f). BG, β-1,4-glucosidase activity; SU, sucrase activity; UR, urease activity; ACP, acid phosphatase activity. Note: different capital letters indicate significant differences between stand ages; different lower-case letters indicate significant differences between rhizosphere and non-rhizosphere soils at the same stand age (p < 0.05).
Forests 14 00624 g005
Figure 6. Entropy C (a), N (b), P (c) of soil microorganisms in the rhizosphere and non-rhizosphere soils at different stand ages. Note: different capital letters indicate significant differences between stand ages; different lower-case letters indicate significant differences between rhizosphere and non-rhizosphere soils at the same stand age (p < 0.05).
Forests 14 00624 g006
Figure 7. Correlation of soil nutrients, microbial biomass, and enzyme C, N, and P stoichiometric ratios. Note: *, p < 0.05; **, p < 0.01. SOC, soil organic carbon; TN, total nitrogen; TP, total phosphorus; TK, total potassium; SMBC, soil microbial biomass carbon; SMBN, soil microbial biomass nitrogen; SMBP, soil microbial biomass phosphorus; BG, β-1,4-glucosidase; SU, sucrase; UR, urease; ACP, acid phosphatase; Vector L, vector length of soil extracellular enzyme stoichiometry; Vector A, vector angle of soil extracellular enzyme stoichiometry; ln(BG+SU)/ln(UR), logarithmic conversion ratio of soil C and N acquisition enzyme activity; ln(BG+SU)/ln(ACP), the ratio of soil N and P acquisition enzyme activity; ln(UR)/ln(ACP), the ratio of soil C and P acquisition enzyme activity.
Forests 14 00624 g007
Figure 8. Redundancy analysis of soil physicochemical properties, microbial biomass, and enzyme stoichiometry ratios. Note: R, sample points of rhizosphere soil; NR, sample points of non-rhizosphere soil; SOC, soil organic carbon; TN, total nitrogen; TP, total phosphorus; TK, total potassium; SMBC, soil microbial biomass carbon; SMBN, soil microbial biomass nitrogen; SMBP, soil microbial biomass phosphorus; AN, ammonium nitrogen; NN, nitrate nitrogen; AP, available phosphorus; AK, available potassium.
Forests 14 00624 g008
Table 1. Differences in physicochemical properties and nutrient contents of rhizosphere and non-rhizosphere soils at different stand ages.
Stand Age Soil TypePHSoil Organic Matter, SOM (g·kg−1)Total Nitrogen, TN (g·kg−1)Total Phosphorus, TP (g·kg−1)Total Potassium, TK (g·kg−1)Nitrate Nitrogen, NN (mg·kg−1)Ammonium Nitrogen, AN (mg·kg−1)Available Phosphorus, AP (mg·kg−1)Available Potassium, AK (mg·kg−1)
1arhizosphere4.58 ± 0.36 Ba11.98 ± 0.09 Fb1.84 ± 0.63 Ca0.32 ± 0.00 Da3.59 ± 0.14 Ca5.93 ± 0.06 Da6.61 ± 0.63 Ba3.44 ± 0.09 Da52.49 ± 4.76 Ea
non rhizosphere3.74 ± 0.03 Ab21.24 ± 1.07 Da1.37 ± 0.16 Ba0.26 ± 0.04 Ea3.98 ± 0.76 Db4.58 ± 0.30 Db6.26 ± 0.95 Ba2.23 ± 0.10 Bb55.24 ± 0.79 Ca
2arhizosphere3.40 ± 0.10 Aa16.65 ± 0.49 Ea1.72 ± 0.36 Ca0.63 ± 0.05 Ba2.91 ± 0.78 Ca11.23 ± 0.62 Ca11.75 ± 1.14 Aa4.67 ± 0.46 Ca51.20 ± 2.64 Ea
non rhizosphere3.29 ± 0.03 Ca17.23 ± 0.43 Ea1.15 ± 0.35 Ba0.43 ± 0.03 Cb3.67 ± 0.36 Da8.92 ± 0.66 Cb8.42 ± 0.27 Ab1.17 ± 0.09 Db53.12 ± 0.95 Ca
3arhizosphere3.49 ± 0.09 Ba27.97 ± 0.44 Ca2.43 ± 0.43 Ba0.89 ± 0.08 Aa6.70 ± 0.53 Ba13.16 ± 0.20 Ba6.43 ± 1.19 Bb5.10 ± 0.02 BCa75.76 ± 3.77 Ca
non rhizosphere3.27 ± 0.18 Ca9.43 ± 0.28 Fb1.50 ± 0.33 Bb0.53 ± 0.03 Bb7.48 ± 1.12 Ca8.51 ± 1.24 Cb7.66 ± 0.51 Aa1.06 ± 0.26 Db37.68 ± 0.72 Eb
8arhizosphere3.61 ± 0.11 Ba68.52 ± 1.41 Aa3.40 ± 0.38 Aa0.32 ± 0.03 Da6.58 ± 1.34 Bb13.58 ± 1.12 Ba5.40 ± 0.56 BCa5.48 ± 0.18 Ba87.76 ± 2.72 Ba
non rhizosphere3.54 ± 0.01 Ba39.36 ± 2.16 Ab2.69 ± 0.15 Ab0.32 ± 0.02 Da9.31 ± 0.34 Ba11.28 ± 0.07 Bb4.37 ± 0.63 Ca4.50 ± 0.19 Ab46.68 ± 1.40 Db
9arhizosphere3.47 ± 0.01 Ba48.27 ± 1.85 Ba3.40 ± 0.27 Aa0.53 ± 0.03 Ca6.54 ± 1.03 Bb20.44 ± 1.76 Aa4.74 ± 0.09 Ca7.38 ± 0.38 Aa108.78 ± 0.77 Aa
non rhizosphere3.54 ± 0.01 Ba31.11 ± 0.50 Bb2.31 ± 0.09 ABb0.34 ± 0.01 Db12.58 ± 0.85 Aa15.76 ± 0.44 Ab3.30 ± 0.38 Db4.40 ± 0.37 Ab87.49 ± 5.72 Ab
42arhizosphere3.69 ± 0.16 Ba23.71 ± 0.23 Da1.70 ± 0.13 Ca0.96 ± 0.05 Aa13.2 ± 0.92 Aa10.43 ± 0.44 Ca3.11 ± 0.10 Da2.65 ± 0.15 Ea65.82 ± 1.37 Da
non rhizosphere3.72 ± 0.13 Aa23.08 ± 0.29 Ca2.27 ± 0.43 ABa0.78 ± 0.01 Ab6.92 ± 0.38 Cb9.11 ± 0.29 Cb3.26 ± 0.08 Da1.56 ± 0.06 Cb61.42 ± 1.02 Ba
Note: Different capital letters indicate significant differences between stand ages; different lower-case letters indicate significant differences between rhizosphere and non-rhizosphere soils at the same stand age (p < 0.05).
Disclaimer/Publisher’s Note: The statements, opinions and data contained in all publications are solely those of the individual author(s) and contributor(s) and not of MDPI and/or the editor(s). MDPI and/or the editor(s) disclaim responsibility for any injury to people or property resulting from any ideas, methods, instructions or products referred to in the content.

