
Usage of and Barriers to Green Spaces in Disadvantaged Neighborhoods: A Case Study in Shi Jiazhuang, Hebei Province, China


1
Department of Design, Faculty of Arts, Hebei University of Economics & Business, 47 Xuefu Road, Shijiazhuang 050061, China
2
Department of Landscape Architecture, Faculty of Design & Architecture, Universiti Putra Malaysia, Serdang 43400, Selangor Darul Ehsan, Malaysia
3
Department of Finance, Faculty of Economics & Management, Universiti Putra Malaysia, Serdang 43400, Selangor Darul Ehsan, Malaysia
*
Author to whom correspondence should be addressed.
Forests 2023, 14(2), 435; https://doi.org/10.3390/f14020435
Submission received: 15 January 2023
/
Revised: 10 February 2023
/
Accepted: 17 February 2023
/
Published: 20 February 2023
(This article belongs to the Special Issue Forest, Trees, Human Health and Wellbeing)
Abstract
:Studies have shown that disadvantaged neighborhoods have fewer green spaces, resources, and facilities, resulting in residents facing more barriers to using green spaces. This study aims to quantify green space usage patterns and constraints in old residential neighborhoods in a large city in northern China. A questionnaire survey and semi-structured interviews were conducted with 668 residents. Results showed that most residents visited their local green spaces daily, often in the evenings, and spent between 30 and 60 min there. The number of visits on weekends is higher than on weekdays, with no difference in visiting alone or in groups. The main reason for visiting green spaces was to relax and enjoy nature, followed by spending time with family. Limitations to usage included poor physical environments, such as inadequate facilities, lack of maintenance, overcrowding, poor accessibility, limited activities, and pet restrictions. This study provides insights into the current state of green space utilization in old residential neighborhoods, as well as a discussion of the limitations, which could inform future renovations and designs of green spaces in these areas.
1. Introduction
Community is the most basic unit in urban planning, and a neighborhood green space is an essential part of a community’s physical structure. It provides a place for residents to interact and engage in outdoor activities. It helps build residents’ sense of community and plays an important role in maintaining urban ecological balance [1]. However, there is evidence that compared to advantaged neighborhoods, green spaces in disadvantaged neighborhoods are underutilised due to quality, safety, environment, distance, and other issues [2]. Cohen et al. [3] argued that disadvantaged neighborhoods have fewer green spaces. Some studies showed more disruptive behaviors in disadvantaged neighborhoods, such as violent crime, gangs, and homelessness [4,5,6]. In addition, green infrastructure in disadvantaged neighborhoods is insufficient [5,7]. Hence, it is crucial to understand how vulnerable groups interact and use green spaces in these communities. Disadvantaged neighborhoods are not only quantified based on economic factors (e.g., low income and high unemployment) but also environmental (e.g., poor infrastructure and high environmental pollution) and social factors (e.g., health disparities, racial discrimination and segregation problems, lack of educational opportunities, and more disruptive behavior) [8,9]. China’s old residential neighborhoods represent typical disadvantaged communities. Despite the modernization brought about by urban expansion and economic growth, rapid urbanization in China has intensified social inequalities, including stark spatial differences in urban development [10]. This situation has caused a serious imbalance development between the old and newly built communities. From a global perspective, old residential areas are a unique phenomenon in urbanization, and they have become a common phenomenon in various cities in China, seriously hindering the healthy development of the urban environment [10].
Many new residential areas have been built in China since the economic reforms of the 1980s. This was due to the rapid development that accompanied the opening of China’s economy and the commercialization of housing. Therefore, people began to pay attention to green ecology and human settlements [11]. In contrast, the old residential neighborhoods that were the main urban residential areas under the original economy system plan have gradually declined [12]. Different parts of the same city have different levels of development and varying resident lifestyles, leading to a sharp contrast between new and old residential neighborhoods. These old residential neighborhoods hinder the harmonious and healthy development of the city [10]. According to preliminary statistics from the Ministry of Housing and Urban–Rural Development, there are nearly 170,000 old residential neighborhoods in China, with more than 42 million households, covering an area of about 4 billion square meters [13,14]. The old residential neighborhoods were primarily built in the 1980s and 1990s, with a small number built in the 1970s, by government agencies or as investments for companies [10]. These old residential neighborhoods comprise 4–6 story apartment buildings [15]. The apartment buildings in these residential areas are in disrepair and often cannot meet residents’ living requirements. They lack green spaces, have outdated infrastructure, face serious security issues, and the environment is unclean and chaotic [10,16,17,18,19]. These old residential neighborhoods are mostly located in urban centers and are home to more socially disadvantaged groups, such as low-income groups [20], migrant workers [21], and the elderly [10].
Green spaces make up a significant portion of the community and are not only a part of the living environment but are also a crucial aspect of the development of the urban ecological environment. The quality of green spaces in residential areas has a major impact on residents’ quality of life and happiness [22]. Neighborhood green spaces can encourage communication and interaction among residents, provide a space for them to rejuvenate in nature, and reduce stress in both life and work [23,24,25]. Additionally, these spaces can enhance community cohesion and attachment [26].
The presence of neighborhood green spaces improves residents’ health and contributes to the ecological development of cities [23,27]. Green spaces play a critical role in disadvantaged neighborhoods and a good living environment promotes leisure and entertainment activities. However, many green spaces in older residential neighborhoods in China fail to meet residents’ basic needs and face problems such as low-quality greenery and a lack of space [10]. These spaces also lack amenities such as benches, lights, trash cans, toilets, and recreational equipment [22]. Furthermore, the lack of diversity in plant species in most green spaces and the presence of toxic or insect-attracting plants pose a health risk to residents [11]. Another problem is that some residents treat neighborhood green spaces as personal property, building private structures, planting vegetables, and even parking their cars in these public spaces [11,28,29]. The lack of proper enforcement in older residential areas has led to commercial expansion and the occupation of green spaces [30]. Furthermore, the heavy use of impermeable pavements and the absence of sunken green spaces contribute to waterlogging and runoff pollution, especially during the rainy season [15,31]. As a result, the renovation of green spaces in older residential neighborhoods is crucial for the development of a modern city.
At present, research on the use of green spaces in disadvantaged neighborhoods is mostly relevant to Europe and the US [7,32,33,34,35]. However, there are only a few studies on the Asian region [36,37] and there is a scarcity of research in this area in China, particularly on the usage and limitations of green spaces in old residential neighborhoods. Ethnic, regional, and cultural differences can influence residents’ outdoor leisure activities [38]. As the primary stakeholders in the utilization of green spaces in old residential areas, residents are fundamental units in the community governance system. Understanding residents’ use of community green spaces and the restrictions they encounter is crucial in making green spaces relevant to residents’ new lifestyles, revitalizing the green spaces’ vitality, and enhancing residents’ happiness. This research centers around three goals. (1) To explore the usage patterns of green spaces among residents of old residential neighborhoods. (2) To identify the constraints that prevent the residents of old residential areas from using green spaces. (3) To provide a reference for the planning and design of green space in old residential areas in the future.
2. Materials and Methods
2.1. Study Site
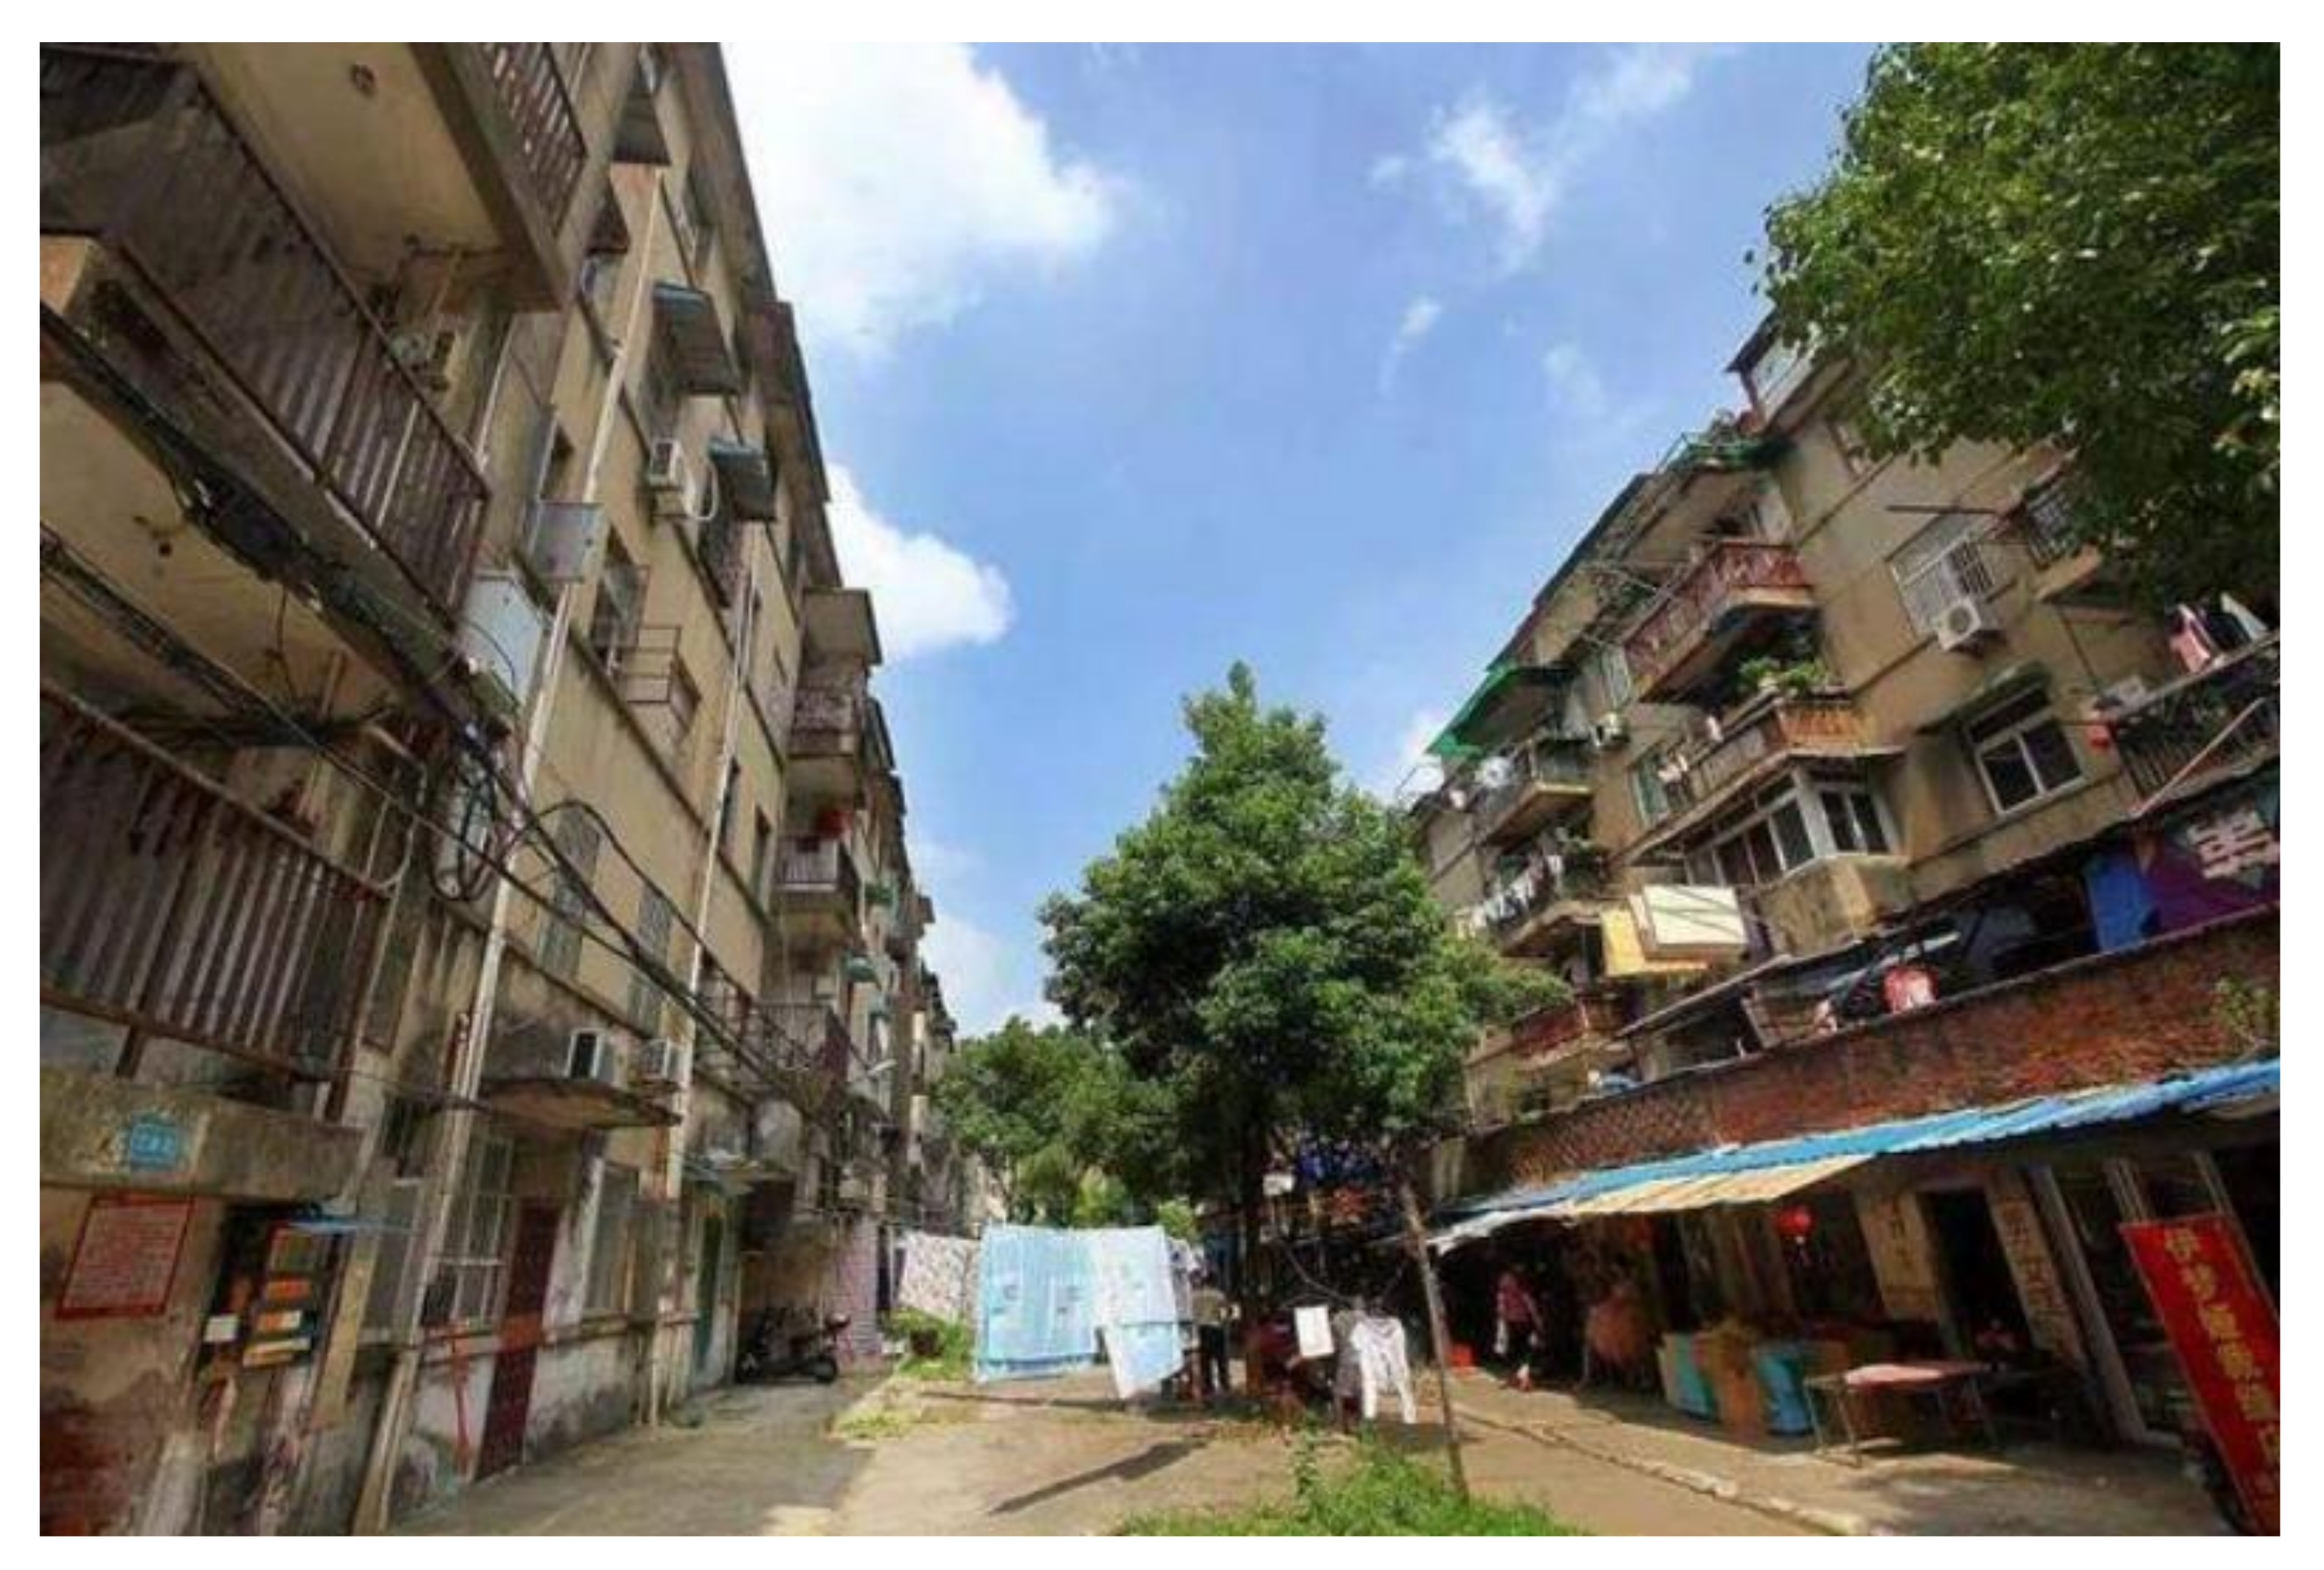
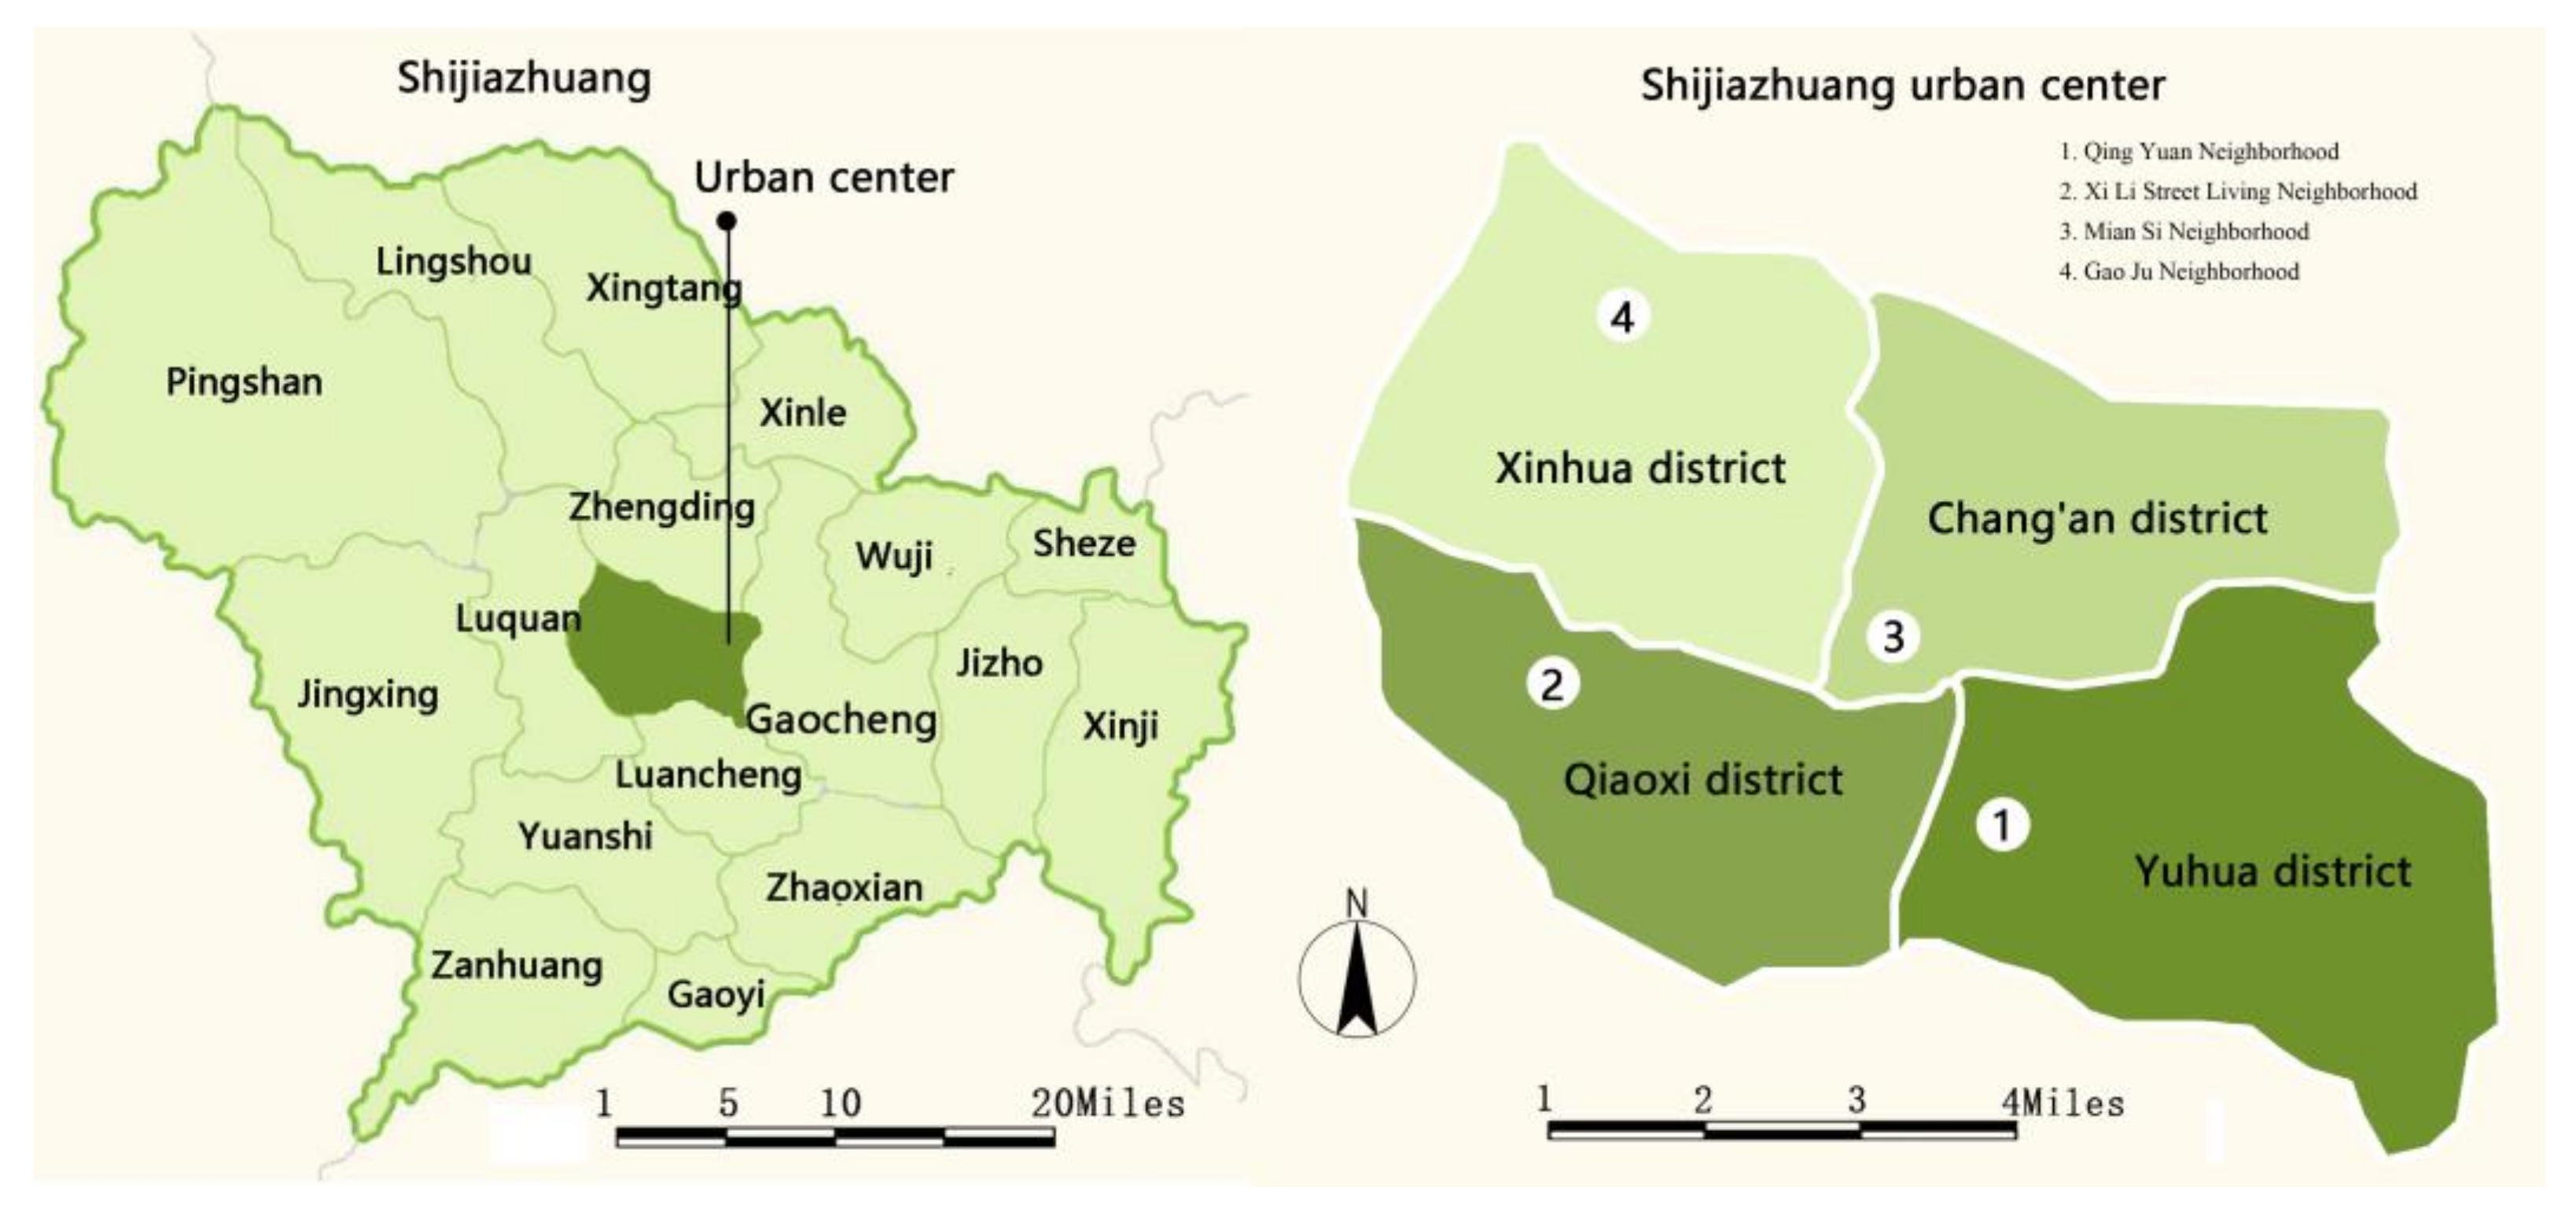
Shijiazhuang is the capital of Hebei Province in China (Figure 1). It is located in the plain area in northern China and is within the Beijing–Tianjin–Hebei Development Zone and the Bohai Bay Economic Zone. The city is important for its economic, cultural, and political significance in the province [39]. According to data from the Shijiazhuang Municipal Residents’ Government [40], Shijiazhuang has 2633 old residential neighborhoods built before 2000, including 1875 old residential neighborhoods in the main urban area, and covers an area of 38.182 million square meters. These neighborhoods were mostly built from the 1970s to the 1990s and consist of 4 to 7 story brick–concrete buildings (Figure 2). The main residents of these neighborhoods are elderly individuals, migrant workers, and low-income families [10,20,21]. The green space in the old residential neighborhood includes the green space next to the apartment, the tree-lined road, the community garden, the green space for central activities, the parking lot, etc. The subjects for this survey are primarily based on the 2018 and 2020 Shijiazhuang Old Residential Neighborhood Reconstruction Projects list. The selection criteria for old residential areas include the following. (1) Located in the main urban area (N = 891). (2) The main urban area consists of four districts, and we select the old residential neighborhoods with the largest number of households from each district (N = 4). After screening, four large-scale old residential neighborhoods in the main urban area of Shijiazhuang were selected, including Qing Yuan Neighborhood, Xi Li Street Living Neighborhood, Mian Si Neighborhood, and Gao Ju Neighborhood (Figure 3).
2.2. Survey Instruments and Procedure
The survey used a combination of questionnaires and semi-structured interviews to collect data. This mixed-method approach allows for a more comprehensive and accurate understanding of the research questions by utilizing the strengths of each method. The questionnaire consisted of three parts: the first concerned demographic information about the respondents (e.g., gender, education, age, and marital status). The use of demographic questions aids in understanding which personal attributes will affect the use of residents in the later quantitative analysis. The second part was about residents’ usage patterns of green spaces in old residential neighborhoods (e.g., frequency, reasons for visiting, time spent, and who they visited with). The third part was about the barriers to using green spaces experienced by the residents (e.g., lack of maintenance, safety concerns, and insufficient facilities). Multiple choice is allowed in questionnaires. This last part used a 4-point Likert scale for easier data analysis. The interviews were conducted with a sample of volunteers and covered personal background, green space usage patterns, and barriers in old communities. The purpose of the interviews was to obtain more in-depth information that could not be obtained through closed questionnaires. In total, 668 residents completed the questionnaire and 18 participated in the interviews.
2.3. Analysis
The first phase of analysis involved a descriptive quantitative analysis of the respondents’ demographic information. The second phase utilized descriptive statistics and a chi-square test to analyze usage patterns of green space in old residential neighborhoods. The chi-square test is a non-parametric test that mainly compares the association analysis of two or more groups of categorical variables [41]. The study used the chi-square test to examine the relationship between demographic variables (e.g., gender, age, education level, marital status, and occupation) on usage patterns. Fisher’s exact test was used when more than 20% of cells have expected frequencies < 5. The third phase used an ordinal logistic regression model to investigate the limitations of green space usage in old residential neighborhoods. The levels of constraints were based on a 4-point Likert scale (1—not at all, 2—somewhat, 3—a great deal, and 4—completely). Since the answers constitute a discrete and ordered variable, they do not meet the conditional constraints of general linear regression. The ordered regression is suitable for dependent variable analysis of changing attitudes [31], so an ordered logistic regression model was used. Statistical analysis of the results was performed using Statistical Software for Social Sciences (SPSS) version 26.0, where the confidence level was set at 90%.
The qualitative data was analyzed using a thematic analysis approach. Semi-structured face-to-face interviews were conducted with each respondent, transcribed, and analyzed using ATLAS.ti (Version 8, Berlin, Germany) software.
3. Results and Discussion
3.1. Demographic Characteristics
Table 1 summarizes the demographic information of the survey participants. In total, 668 residents of the old residential neighborhood took part in the survey. The distribution is slightly skewed towards female respondents (n = 368, 55.1%) compared to male respondents (n = 300, 44.9%). The majority of the respondents are in the age groups of 18–30 (n = 204, 30.5%), 31–45 (n = 200, 29.9%), and 46–55 (n = 123, 18.4%), followed by 56–60 (n = 73, 10.9%), over 60 (n = 55, 8.2%), and below 18 (n = 13, 2%). The lower participation of students under 18 is due to limitations in accessing electronic devices. Most respondents have a college degree or above (n = 367, 54.9%), indicating a relatively high level of education among the residents in the old residential neighborhoods, consistent with the overall education level in Shijiazhuang. The seventh census report of Shijiazhuang shows that the proportion of college graduates is 20.74% [42]. Furthermore, the respondents are mainly young and middle-aged residents, most of whom have received higher education. The respondents in this survey have diverse occupations with the majority in the private sector (42.2%) and pensioners (19.8%). The government sector (10.6%), self-employed (10.1%), unemployed (9.9%), and students (7.3%) make up the rest of the occupation categories. This is in line with the old residential neighborhoods mentioned above, whose residents mainly consist of the elderly and migrant workers. The majority of the respondents are married, with twice as many married residents as single residents.
3.2. Usage Patterns of Green Spaces in Old Residential Neighborhoods
Table 2 demonstrates the usage patterns of green spaces in old residential neighborhoods. The majority of respondents reported using these spaces daily (n = 253) or 1–2 times a week (n = 209). This frequent usage can likely be attributed to the close proximity of residents to green spaces, as in China where many neighborhoods are enclosed by walls and green spaces are within walking distance from residential buildings. A study from the US found that green space utilization increased fourfold when the distance between neighborhood green spaces and homes was reduced by 100 m [43]. Therefore, we can assume that proximity to neighborhood green spaces plays a significant role in determining how often those spaces are utilized. There are also statistically significant differences in gender (p < 0.01), age (p < 0.01), education level (p < 0.01), marital status (p < 0.01), and occupation (p < 0.01) (Table 3). A higher number of males visit green spaces 1–2 times/month compared to females. Welder et al. [44] state that observations and surveys indicate that for women there are barriers to visiting green spaces, such a limited mobility, childcare, and significantly more domestic responsibility. Older residents visit green spaces more frequently than younger residents. Meanwhile, we notice that the residents with a college degree make 1–2 visits per week, whereas those without a college degree visit daily. This suggests that residents with a higher education level visit green spaces less frequently than those with a lower education level. Based on marital status, married residents visit the green spaces for daily activities more frequently than single residents, where the number of single residents who chose 1–2 times/year is significantly higher than married residents. This finding shows the possibility that companionship positively affects the frequency of outdoor activities. This has been confirmed in previous studies that companionship has a positive impact on mental health and a positive facilitation of outdoor activities [45]. Research by Pleson et al. [46], showed that grandparent care for grandchildren is a common phenomenon in Taipei. Many elderly people indicate that accompanying children encourages them to spend more time in green spaces, which can effectively reduce their feelings of loneliness. There are also significant differences in occupation: unemployed and pensioners visit more often than office workers. This might be because the retired and unemployed group has more time to engage in outdoor activities.
Most residents prefer to visit community green spaces in the evening (n = 432) (Table 2), which also proves that residents of old residential areas are satisfied with the sense of community safety. This is consistent with studies conducted in disadvantaged communities in Colombia [47], Australia [48], and Malaysia [49]. According to data released by Gallup, a reputable polling agency in the US, Chinese residents rank third in the world in terms of the safety index. The survey included a composite score of residents’ confidence in local police, personal safety perceptions, and the incidence of theft, bodily injury, or robbery over the past year. China ranked fifth in terms of residents feeling safe while walking independently at night [50]. The study found significant differences in preferences based on age (p < 0.01), education level (p < 0.01), and occupation (p < 0.01) (Table 3). Younger and middle-aged respondents preferred to visit green spaces in the evening due to less free time during the day. The interview revealed that these young groups are the main force in the workplace and that they think it is difficult to maintain a balance between healthy work and life. The fast-paced nature of their work can cause a lack of sufficient leisure time, and they can only relax a little after work. On the other hand, older residents tended to prefer visiting in the afternoon. Education level also impacted preferences, with those who had primary schooling or below favoring morning visits and those with a higher education favoring evening visits. Residents with different occupations showed differing preferences, with pensioners tending to visit in the afternoon and those with other occupations visiting in the evenings, which corresponded with their age preferences.
The survey revealed that the majority of respondents prefer visiting green spaces during weekends (n = 591), as shown in Table 2. It is evident that residents enjoy spending time in nature during their leisure time. This preference aligns with findings from most studies of disadvantaged neighborhoods [35,48,51,52]. Wendel et al. [44] presented opposite results, explaining that people prefer city parks or outings on weekends and holidays. In terms of demographic variables, age (p < 0.01), education level (p < 0.01), and occupation (p < 0.01) had significant effects (Table 3). The results showed that as age decreased, the proportion of respondents who chose weekdays for visiting green spaces decreased significantly, likely due to the busy schedules of younger residents. This phenomenon is not limited to young people: many children also face the same problem. In China, children under the age of 12 make up 14.28% of the population. The distinctive education policies and competitive mechanisms have resulted in greater pressure on these children. The burden of homework and cram schooling are the reasons why children have limited access to community green spaces on weekdays [16]. However, residents with a junior high school education or higher, including those with a high school education or university degree, showed a preference for weekends. Additionally, differences were observed among occupations, with a significantly higher proportion of pensioners choosing weekdays for visiting green spaces compared to other occupations.
Residents spend mainly 30 to 60 min (n = 287) and 1 to 2 h (n = 214) in neighborhood green spaces, but they are reluctant to spend more than two hours (Table 2). This moderate amount of time is deemed enough for relaxation. The study found that only age (p < 0.05) and occupation (p < 0.05) had significant impacts on the amount of time spent (Table 3). There is little difference in the number of residents in different age groups who spend 30–60 min and 1–2 h for activities in the green spaces, but the difference is more significant among those spending less than 30 min and more than 2 h. Concerning their occupation, the proportion of pensioners and self-employed who chose less than 30 min is significantly lower than in other occupations. The proportion of pensioners and unemployed residents who spend more than 2 h is significantly higher than those with other occupations. This suggests that residents who do not need to work spend more time in their neighborhood green spaces.
There is no significant difference between visiting green spaces alone and in groups of residents living in old residential neighborhoods, with 49.5 and 50.5, respectively, as shown in Table 2. The study showed that age (p < 0.05) and occupation (p < 0.01) have a significant impact on their preferences (Table 3). Residents below 18 and the elderly prefer group activities, whereas there is little variation in the preferences of those in other age groups. Companionship encourages people to engage more actively in social interactions, which is especially important for older people living alone [53]. Children and older adults may benefit from the support and assistance of others when spending time outdoors, especially if they have limited mobility or health problems [53,54]. Similarly, when it comes to careers, students and retirees prefer group activities related to their age. Overall, going to outdoor spaces in groups provides a sense of community, security, and social engagement for seniors and children.
In a study, the majority of residents (n = 443) indicated that they visit neighborhood green spaces to enjoy nature and relax. This sentiment was also observed in disadvantaged neighborhoods in the US, where residents from low-income areas said they visit green spaces to escape stress from work, school, and family [33]. Similarly, residents from disadvantaged neighborhoods in Germany visited parks for sunshine and fresh air [55]. In the UK, children from underprivileged communities visit green spaces for the abundance of vegetation and endearing animals [56]. Research has found that natural elements in a neighborhood can increase opportunities for residents to interact [57,58]. The green space provides a refreshing environment for residents to breathe fresh air and improve their mood. Other residents visited green spaces to spend time with family (n = 279) or talk with friends (n = 170). One senior who was retired commented, “I take the kids and chat with the neighbors, which makes me happy.” In China, grandparents often care for their grandchildren, and green spaces provide an opportunity for interaction. Furthermore, in terms of group–individual relationships, Chinese residents have an extreme sense of family ties and new data shows that family relationships significantly impact Chinese people [59]. Malaysians also enjoy family-centered activities, such as visiting parks with family and friends [60]. Residents in many disadvantaged neighborhoods visit green spaces to meet friends and spend time with family [2,33,61]. Social interaction can effectively relieve loneliness and anxiety related to daily stress.
For sports activities, a higher proportion of residents choose to jog or walk (41.5%), while others participate in exercises (n = 167), ball games (n = 103), square dancing (n = 48), or Tai Chi (n = 28). This may be due to a lack of facilities and crowded spaces in old residential neighborhoods. A younger resident noted, “I like to play ball, but there are no facilities in the community.” There are 81 residents who chose to walk their dogs. Keeping pets, particularly cats and dogs, is a common practice in China. In disadvantaged neighborhoods in Berlin, Germany, dogs help residents to socialize [62]. However, due to differences in religion and culture, Malays do not view dog walking as a leisure activity [60,63]. Few respondents visit green spaces for shortcuts (n = 80), playing cards and chess (n = 64), and drying quilts and clothes (n = 56). Observation shows that many older residents play mahjong or chess with friends in the afternoons. Airing and drying clothes in green spaces is a unique phenomenon in old residential neighborhoods, particularly among the elderly. Compared with newly built neighborhoods, old residential areas are small and lack space for airing and drying clothes. Younger groups do not prefer drying clothes and quilts in green spaces, as they worry about dust making them dirty. There are 48 people who chose gardening activities, with a strong correlation to age, where more older residents chose gardening. Respondents commented that gardening takes up too much public space and looks disorganized without a unified plan.
In terms of the reasons for visiting green spaces, demographic variables such as gender, age, education level, marital status, and occupation all have a significant impact (p < 0.01) (Table 3). Female residents tend to participate in activities such as square dancing and airing or drying quilts and clothes, while male residents prefer playing cards and chess. Activity patterns vary by age, with the elderly tending to prefer quiet, calm activities and young residents participating in more vigorous activities related to physical movements. Additionally, education level also affects the reasons for visiting green spaces, with primary school graduates and below enjoying nature and relaxing; junior high school graduates enjoying nature, jogging or walking and talking with friends; and high school graduates and those with a university degree or higher tending to enjoy nature, spending time with family, and going jogging or walking. The analysis of marital status variables shows that married residents are more likely to spend time with family and dry quilts and clothes compared to single residents. Single residents, on the other hand, are more likely to engage in activities such as walking the dog, talking with friends, and playing ball games. This may be because they lack family companionship, and thus keep pets and spend time with friends to alleviate their feelings of loneliness. Occupation also plays a role, with pensioners being less likely to spend time with family and walk the dog compared to other occupations. However, pensioners are more likely to participate in activities such as talking with friends, square dancing, performing Tai Chi, playing cards and chess, and drying quilts and clothes compared to individuals in other occupations. Students are more likely to talk with friends and play ball games than individuals in other occupations. These differences in occupation align with the differences observed based on age.
3.3. The Residents’ Constraints in Using Green Spaces in Old Residential Neighborhoods
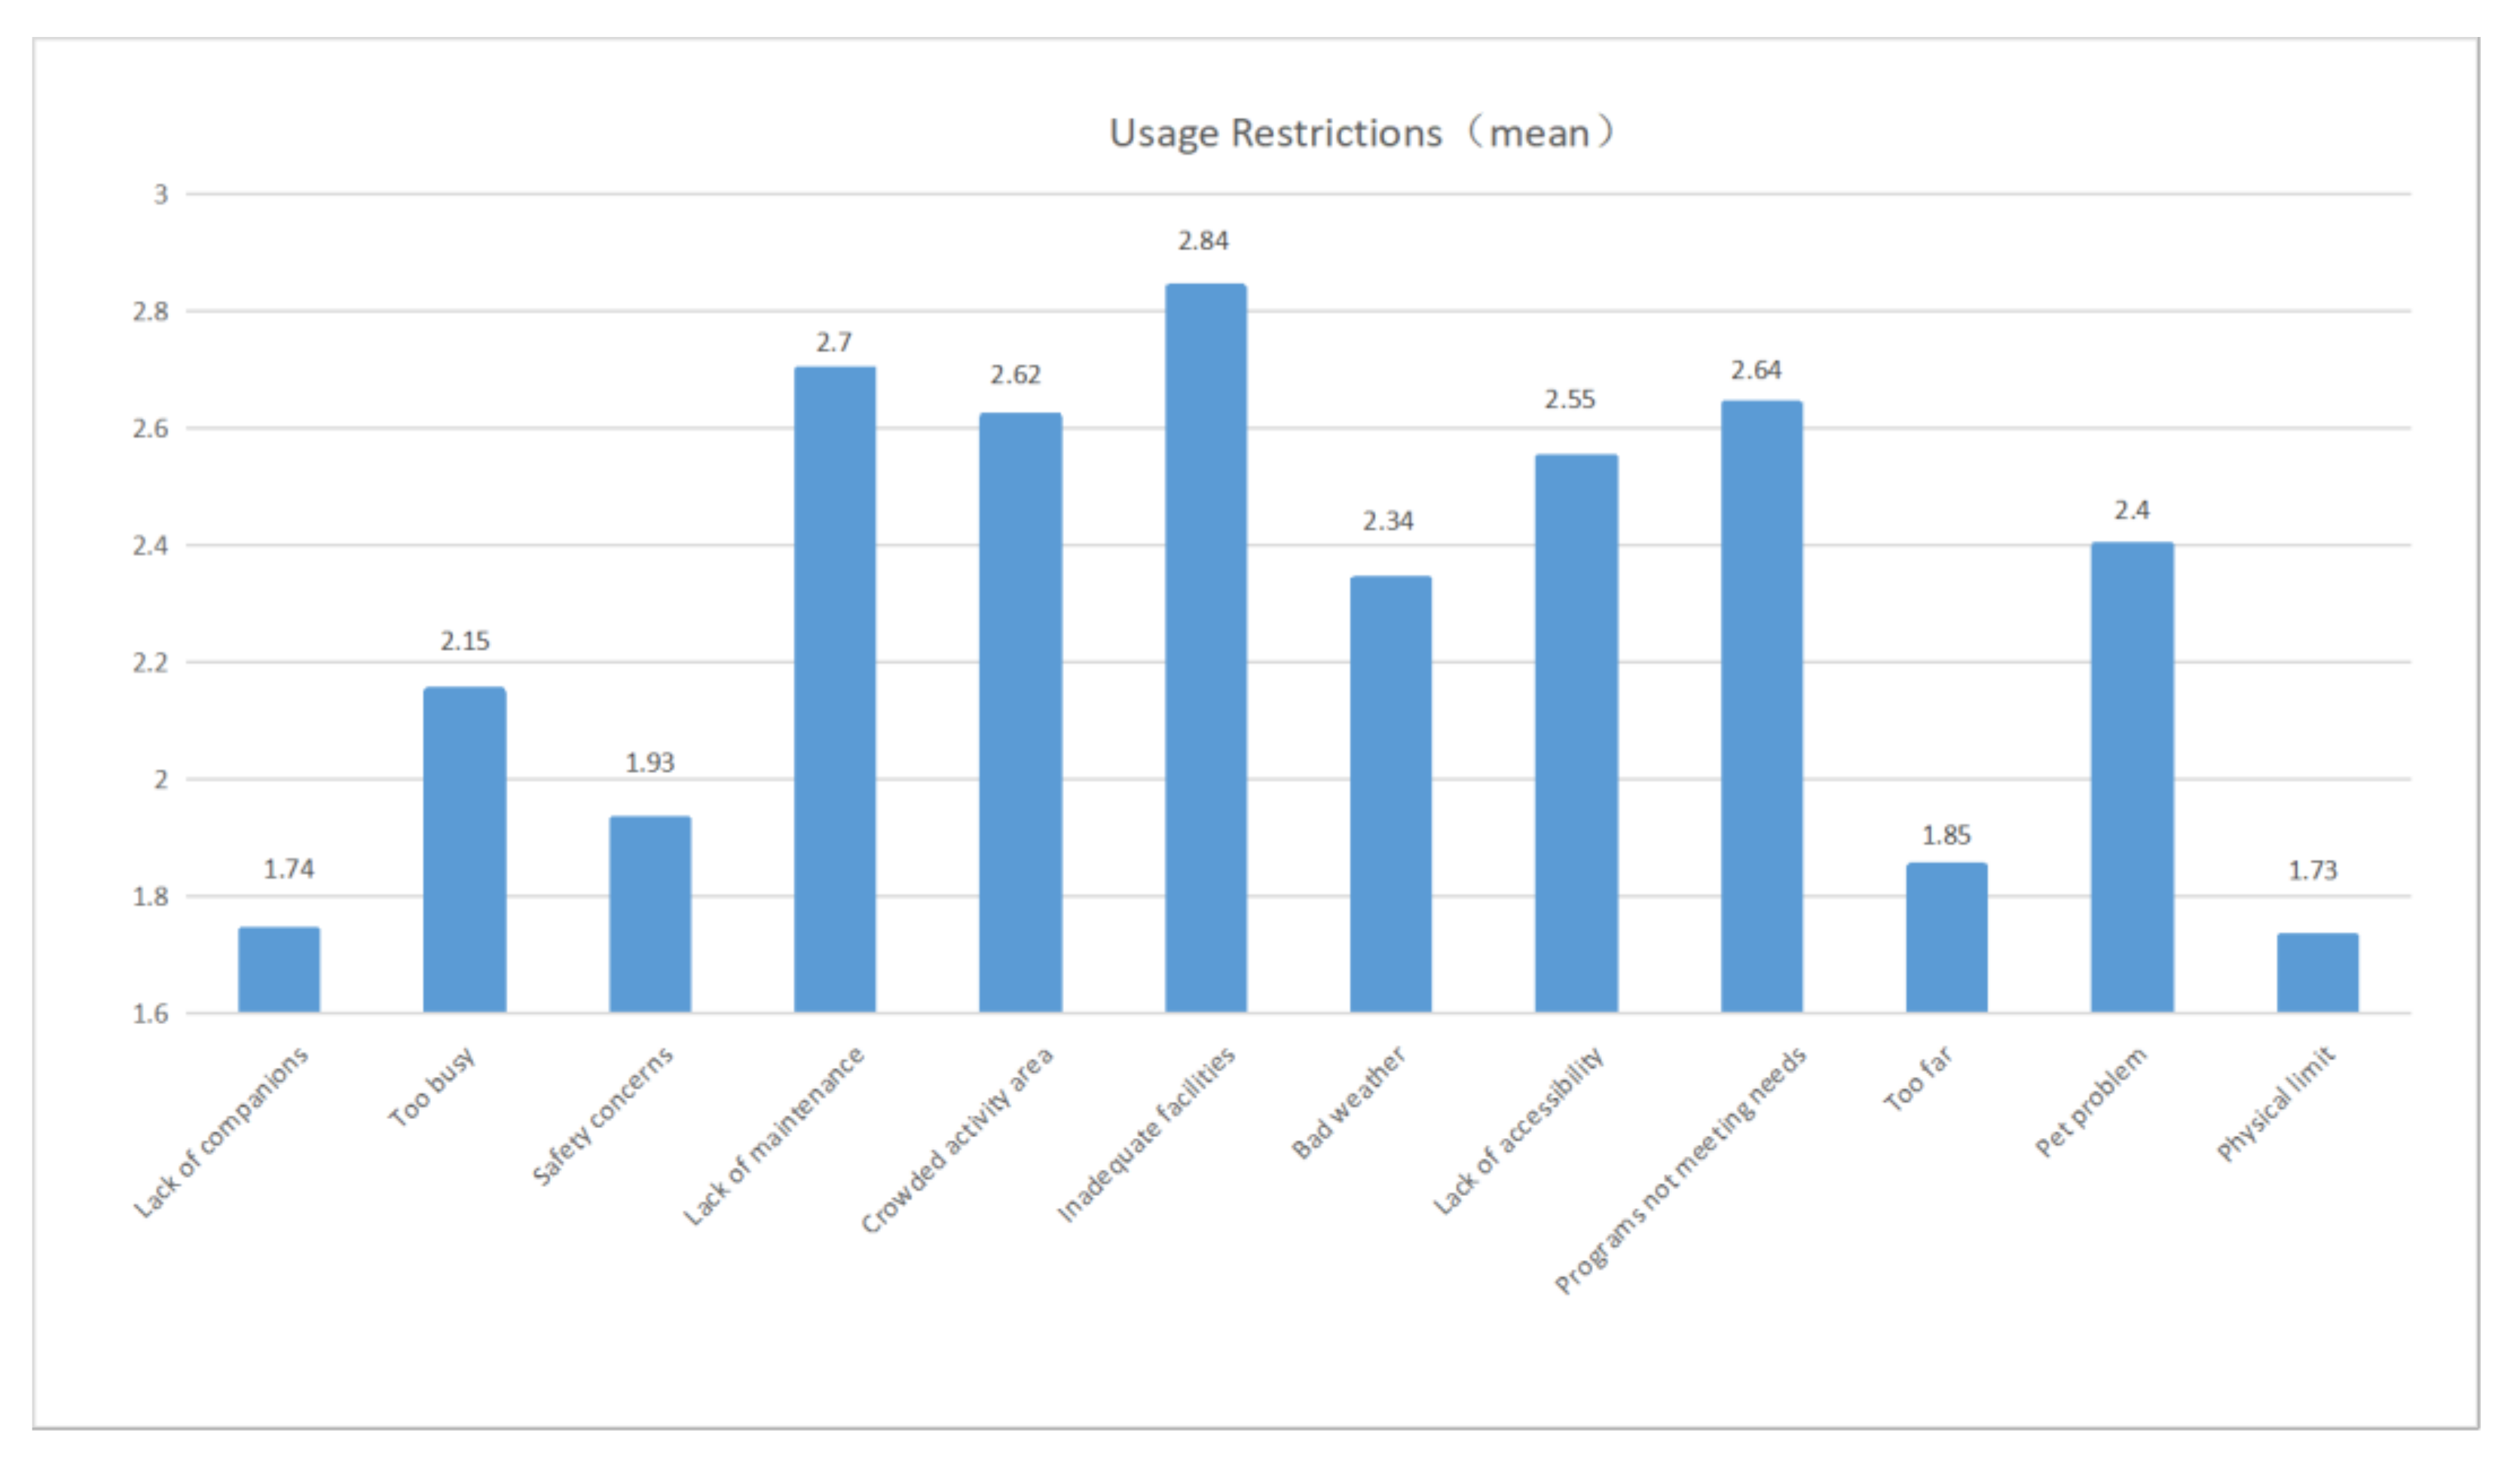
Figure 4 and Table 4 illustrate the constraints faced by respondents in utilizing green spaces in older residential neighborhoods. The most significant obstacle is the lack of facilities (MD = 2.84), and gender and age are the main factors hindering the use of green spaces. Female residents are 1.29 times more likely to experience restrictions in activities in neighborhood green spaces compared to males (OR = 1.29, p < 0.1). In terms of age, those under 18 years old (OR = 0.27, p < 0.1), 18–30 years old (OR = 0.4, p < 0.05), and 46–55 years old (OR = 0.38, p < 0.01) face fewer restrictions compared to those over 60 years old. The elderly appear to desire the addition of more facilities. Facilities play a vital role in meeting the daily needs of residents and enhancing their quality of life. The lack of facilities in disadvantaged communities is a prevalent issue. For example, minority communities in the US lack adequate facilities, leading to heightened health problems among their residents [5]. A survey from an impoverished community in South Korea found that residents want more fitness facilities to be added because it is difficult for these low-income groups to afford exercise in the gym [36]. Inadequate facilities in poor neighborhoods in the UK were found to be a hindrance to residents [32]. Hence, adequate facilities are crucial for disadvantaged neighborhoods.
Lack of maintenance (MD = 2.84) is the second major constraint. Demographic variables such as gender, age, and occupation are found to significantly impact the lack of maintenance. Women (OR = 1.38, p < 0.05) are 1.38 times more likely to be restricted due to the lack of maintenance compared to men. Younger age groups, including those under 18 years old (OR = 0.31, p < 0.1), 18–30 years old (OR = 0.22, p < 0.01), 31–45 years old (OR = 0.43, p < 0.05), 46–55 years old (OR= 0.24, p < 0.01), and those aged 56–60 (OR = 0.49, p < 0.05), are less restricted than those over 60 years old. The private sector (OR = 1.54, p < 0.1) is 1.54 times more restricted than the unemployed, indicating that they are more affected by the lack of environmental maintenance. The poor property management and maintenance practices in many old residential areas, including overgrown weeds, private constructions, and ineffective garbage disposal, are commonly reported problems. Only a quarter of the old residential areas in Shijiazhuang have proper property management [40]. A young man said: “The fitness facilities in the community are often broken, and no one manages them. There are also dog feces on the road.” This is consistent with previous surveys, showing that neighborhood green spaces are frequently not well-maintained [7,51,64]. Community maintenance encompasses sanitation, roads, sewage, noise, and the maintenance of recreational facilities [65]. A dirty, cluttered, and substandard environment will firstly have an immediate impact on people’s physical health. Secondly, the upkeep of the community environment directly impacts residents’ sense of security. The presence of graffiti, litter, and broken facilities can foster feelings of fear and insecurity. Maintenance is therefore of crucial importance to residents. It requires not only the oversight and management of relevant departments but also the active involvement of residents themselves [66].
The third limiting factor is that the programs are not meeting the needs of residents (MD = 2.64), with age and occupation having a significant impact. According to age, residents aged 46–55 years old (OR = 0.47, p < 0.05) are less affected by the inability of the programs to meet their needs compared to those over 60. Meanwhile, students (OR = 0.49, p < 0.1) were 0.49 times more constrained than the unemployed. The community projects consist of regular entertainment events, public welfare activities, and various clubs. These activities are particularly important for vulnerable groups within the community. The young group hopes to add more projects aimed at young residents, such as outdoor movies, basketball, badminton, and others. On the other hand, seniors also feel that there are too few activities and want to add more meaningful cultural and recreational activities. A lack of outdoor space is one of the main reasons for the lack of activities. Residents of different age groups usually share a square, and some old residential neighborhoods with relatively poor conditions have no activities. According to Eyler et al. [67], some organized activities can increase women’s participation in community activities. Many studies have also demonstrated that community activities have a positive effect on both physical and mental health [68].
They are followed by a crowded activity area (MD = 2.62). Gender, age, and occupation all have significant effects on visits to green spaces. Women are 1.34 times more likely to visit green spaces due to crowded conditions than men (OR = 1.34, p < 0.05). In terms of age, residents who are 18–30 years old (OR = 0.29, p < 0.01), 31–45 years old (OR = 0.5, p < 0.1), 46–55 years old (OR = 0.37, p < 0.05), and 56–60 years old (OR = 0.49, p < 0.05) are less restricted in visiting green spaces compared to those over 60 years old. Additionally, residents working in the government sector (OR = 1.69, p < 0.1) and private sector (OR = 1.97, p < 0.01) are more restricted in visiting green spaces than the unemployed. The main reason for the overcrowding was that older residential neighborhoods were constructed to accommodate more residents without sufficient consideration for green space. One respondent stated: “Many green spaces have become parking lots, and commercial streets have taken up some of the green space in the community.” Similar results were found in a survey of high-poverty neighborhoods in the US, where higher population densities led to lower physical activity [69]. In Malaysia, residents in low-income neighborhoods claimed that overcrowding of green spaces restricts their use [48]. Medical and social psychology studies suggest that crowding can lead to polluted air and negative emotions, which can harm residents’ physical and mental health and influence their behavior.
Another important aspect is the lack of accessibility (MD = 2.62), which is significantly affected by gender, age, and marital status. Women (OR = 1.38, p < 0.05) scored higher than men. Those who are 18–30 years old (OR = 0.34, p < 0.05), 31–45 years old (OR = 0.48, p < 0.1), and 46–55 years old (OR = 0.46, p < 0.05) are less restricted than those aged over 60 years old. More single residents (OR = 1.4, p < 0.1) consider lack of accessibility as their limiting factor than married residents. Interviews revealed that residents believe that poor accessibility is due to physical barriers, not distance. For instance, some lawns are inaccessible due to hedges and some public green spaces are fenced and turned into private spaces. Disadvantaged communities in the UK reported that locked gates, steps, and unconnected roads hindered their activities [56]. In other regions, distance is also a crucial factor in residents’ inaccessibility in disadvantaged communities [36,70]. In short, the accessibility of a neighborhood’s green spaces plays a crucial role in determining how they are used and perceived by residents. Poor design and physical barriers can lead to fear and decreased use, while convenient access to green spaces can improve people’s enjoyment of nature and their utilization of facilities.
Pet problems (MD = 2.4) pose a significant limitation related to age and occupation. Respondents aged 18 and below (OR = 0.18, p < 0.05), 18–30 years old (OR = 0.11, p < 0.01), 31–45 years old (OR = 0.14, p < 0.01), 46–55 years old (OR = 0.14, p < 0.01), and 56–60 years old (OR = 0.31, p < 0.01) have fewer limitations than those over 60 years old. This shows that the elderly groups consider pet problems to be more serious. Moreover, students (OR = 0.5, p < 0.1) have fewer restrictions compared to the unemployed. Some older residents have reported that walking dogs without leashes is a common occurrence in the community, particularly after 7 p.m., which makes them reluctant to exercise at night. In addition, one interviewee (57 years old, married) mentioned that there are many wild cats in the community that attract fleas. Despite the fact that Chinese residents view dogs as friends and the community promotes responsible pet ownership, the issue of dogs being walked without leashes is still prevalent in older residential areas.
Bad weather (MD = 2.34) also affects residents’ use of neighborhood green spaces. Age and education level have a significant impact. Residents aged 18–30 (OR = 0.37, p < 0.05), 31–45 (OR = 0.31, p < 0.01), 46–55 (OR = 0.29, p < 0.01), and 56–60 (OR = 0.36, p < 0.01) have fewer restrictions compared to those over 60 years old. Residents with a high school education (OR = 0.71, p < 0.1) have fewer limitations than those with a college education. Residents consider the weather to be a factor because Shijiazhuang is located in northern China and experiences four distinct seasons with varying temperatures. Winter temperatures can reach below zero degrees Celsius, while summer temperatures are around 30 to 40 degrees. As a result, residents prefer to go out during spring and autumn. This pattern is consistent with findings from other geographical locations. For example, in the US state of Minnesota, residents use community parks more frequently during warm weather than in cold weather [71], and in northern England, wet and cold weather can limit movement in neighborhood green spaces [56].
The next section discusses some of the less restrictive factors. The first is being too busy (MD = 2.15), which is significantly affected by age and level of education. As the age of the residents increases, the busyness of the residents will gradually decrease. In terms of education level, residents with a primary school education or below (OR = 0.29, p < 0.05) and high school (OR = 0.54, p < 0.01) face fewer restrictions compared to those with a university degree or higher, indicating that highly educated residents are busier. However, residents of old neighborhoods were not significantly affected by time constraints compared to other limiting factors. This differs from previous research in disadvantaged neighborhoods. For instance, a study showed that half of the residents in four low-income communities in Kuala Lumpur indicated that their busy work would limit their visits to the surrounding green spaces [48]. Another study in low-socioeconomic communities in Australia indicated that residents reported having no time to visit green spaces due to time constraints brought on by family responsibilities and obligations [64]. In this regard, further comparisons with other more affluent neighborhoods are required to arrive at more valid conclusions about busyness.
The second least selected factor is safety concern (MD = 1.93), which is significantly influenced by occupation. Students (OR = 0.49, p < 0.1) and the self-employed (OR = 0.53, p < 0.1) have fewer restrictions than the unemployed. Most residents consider community green spaces safe, which is quite different from previous studies in disadvantaged communities, especially in Europe and North America. In these areas, disadvantaged neighborhoods are often associated with higher crime rates, which affects residents’ access to green spaces. For example, in a deprived community in North Staffordshire, England, adult residents cited antisocial behavior as a barrier to using green spaces. The respondents indicated that issues such as young residents fighting, drinking, gang-related activities, poor lighting, and dense trees contribute to safety problems [32]. Highly disadvantaged neighborhoods are twice as likely to commit crimes than other neighborhoods in the US. Due to low income, poor neighborhoods are more prone to crime, leading to potential safety issues affecting residents’ use of green spaces [4]. Increased exposure to nature in disadvantaged communities can effectively reduce residents’ fatigue and decrease the incidence of aggressive and violent crime [72]. In some old residential neighborhoods in China, residents relate the safety of neighborhood green spaces to the effective community safety management. Hence, many old residential neighborhoods have installed cameras and night lighting facilities. Low crime rates also contribute to residents’ inner stability. Old residential neighborhoods often have a dense population, which increases residents’ sense of security.
Fewer respondents chose the constraint entitled too far (MD = 1.85) as a limiting factor. This is likely due to the small size of green spaces in the old residential area, which can be easily reached by walking. Similarly, Harnik and Simms [73] found that distance and transportation play important roles in people’s use of community parks and people prefer to use community parks within walking distance. If the distance is too far, people must travel by car, making it feel more like a trip rather than a casual walk. Residents prefer green spaces within a 5-min walk or 400 m [44]. Age has a significant impact on distance. Residents aged 18 and below (OR = 3.82, p < 0.1), 18–30 (OR = 3.87, p < 0.01), 31–45 (OR = 2.93, p < 0.05), and 46–55 (OR = 2.75, p < 0.05) face more restrictions than those over 60 years old, with the degree of restriction increasing with younger age. This reflects younger residents’ perception that distance affects them. One student reported: “I don’t want to go further to the square because I have a lot of homework to do, and if I have extra time, I’d rather play games at home.”
The mean for the lack of companions is 1.74, and only marital status has a significant impact. Single residents are 1.58 times more likely to limit their outdoor activities due to a lack of company than those who are married (OR = 1.58, p < 0.05). This finding highlights that single individuals have a greater need for social activities with friends and family. The survey revealed that many elderly people live alone in old residential areas and crave the companionship and support of others. As one elderly respondent stated, “My children live in other cities, and I cherish the time spent with friends.”. People are naturally social and communication between individuals is the most direct way to express one’s inner thoughts and gain external information. Similarly, companionship also plays a crucial role for the elderly to converse with each other and also in alleviating their spiritual and emotional loneliness. Therefore, the design of community green spaces should devote greater consideration to the needs of elderly individuals living alone.
Physical limitations have the lowest score (MD = 1.73) among all of the limiting factors. Significance is seen in the effects of gender, age, education, marital status, and occupation. People over 60 have higher physical limitations than other age groups. Residents with a junior high school education (OR = 1.68, p < 0.1) face more restrictions than those with a high school education or higher. Single residents (OR = 1.55, p < 0.05) face more limitations than married residents, while students (OR = 0.48, p < 0.1) have fewer limitations than the unemployed. Physical restrictions are significant for the elderly and those with disabilities. Although older adults are more affected by physical restrictions, many still want to improve their fitness through outdoor activities, which is similar to the findings of Derose et al. [74] who concluded that community green spaces are ideal for people with poor health.
4. Conclusions
Residential greening plays a crucial role in the development of urban ecological environments and directly impacts the quality of life of residents in old residential areas. An attractive outdoor space in residential areas can offer various leisure and entertainment opportunities. However, with the progress of society, traffic congestion, outdated facilities, and limited space in old residential neighborhoods are becoming more pronounced issues. This paper examines two aspects of green space utilization and limitations in old residential neighborhoods and compares them to disadvantaged neighborhoods in other countries. The study revealed that there are still substantial disparities among disadvantaged neighborhoods with different cultural backgrounds. Middle-aged and older residents are the main users of green spaces in old residential neighborhoods. Residents tend to visit the neighborhood green space in the evening, which is a departure from the practices in disadvantaged communities in other regions and is primarily related to the residents’ sense of security. The majority of residents still enjoy nature, relaxation, and spending time with their families, as well as walking or jogging. However, some residents engage in unique practices such as Tai Chi, square dancing, playing cards and chess, gardening, and drying clothes, which are cultural activities specific to the Chinese culture. When commenting on usage restrictions, residents mostly reported that the community’s physical environment (crowded space, inadequate facilities, small area, programs not meeting needs, pet threat, and bad weather) restricts their activities. In contrast, a lack of company, busy schedules, safety concerns, distance, and physical constraints have a minimal impact on residents’ activities, which contrasts sharply with the situation in some disadvantaged communities in other countries. Effectively exploring the use of old residential neighborhoods and honing the renovation system is an efficient way to promote urban development, improve the city’s appearance, preserve the urban context, and alleviate the huge wealth gap between the rich and poor. Government departments should adjust and improve the renovation standards and systems from the perspective of the real needs of residents in these neighborhoods, with a focus on improving the living environment and creating a community environment based on co-construction, co-governance, and sharing.
Author Contributions
Conceptualization, C.D. and S.M.; methodology, S.M. and C.D.; validation, C.D. and Y.C.; formal analysis, Y.C. and C.D.; investigation, C.D.; resources, C.D.; data curation, C.D.; writing—original draft preparation, C.D.; writing—review and editing, S.M. and C.D.; visualization, C.D. and S.M.; supervision, S.M. and M.F.S.; project administration, S.M. and C.D. All authors have read and agreed to the published version of the manuscript.
Funding
This research received no external funding.
Institutional Review Board Statement
Not applicable.
Informed Consent Statement
Not applicable.
Data Availability Statement
Data is available upon request.
Acknowledgments
The authors would like to thank the Shijiazhuang Municipal Bureau of Housing and Urban–Rural Development for providing the List of Shijiazhuang’s Old residential neighborhood Reconstruction Projects in 2018 and 2020.
Conflicts of Interest
The authors declare no conflict of interest.
References
- Salama, A.M.; Nishimoto, T.; Doganer, S.; Ornstein, S. Towards a sustainable neighborhood: The role of open spaces. Archit. Res. 2008, 2, 162–177. [Google Scholar]
- Thompson, C.W.; Aspinall, P.; Roe, J. Access to green space in disadvantaged urban communities: Evidence of salutogenic effects based on biomarker and self-report measures of wellbeing. Procedia-Soc. Behav. Sci. 2014, 153, 10–22. [Google Scholar] [CrossRef] [Green Version]
- Cohen, D.A.; Marsh, T.; Williamson, S.; Derose, K.P.; Martinez, H.; Setodji, C.; McKenzie, T.L. Parks and physical activity: Why are some parks used more than others? Prev. Med. 2010, 50, S9–S12. [Google Scholar] [CrossRef] [PubMed] [Green Version]
- Hughey, S.M.; Walsemann, K.M.; Child, S.; Powers, A.; Reed, J.A.; Kaczynski, A.T. Using an environmental justice approach to examine the relationships between park availability and quality indicators, neighborhood disadvantage, and racial/ethnic composition. Landsc. Urban Plan. 2016, 148, 159–169. [Google Scholar] [CrossRef]
- Suminski, R.R.; Connolly, E.K.; May, L.E.; Wasserman, J.; Olvera, N.; Lee, R.E. Park quality in racial/ethnic minority neighborhoods. Environ. Justice 2012, 5, 271–278. [Google Scholar] [CrossRef]
- Suecoff, S.A.; Avner, J.R.; Chou, K.J.; Crain, E.F. A comparison of New York City playground hazards in high-and low-income areas. Arch. Pediatr. Adolesc. Med. 1999, 153, 363–366. [Google Scholar] [CrossRef] [Green Version]
- Sefcik, J.S.; Kondo, M.C.; Klusaritz, H.; Sarantschin, E.; Solomon, S.; Roepke, A.; South, E.C.; Jacoby, S.F. Perceptions of nature and access to green space in four urban neighborhoods. Int. J. Environ. Res. Public Health 2019, 16, 2313. [Google Scholar] [CrossRef] [Green Version]
- Price-Robertson, R. What Is Community Disadvantage? Understanding the Issues, Overcoming the Problem; Communities and Families Clearinghouse Australia Australian Institute of Family Studies: Melbourne, Australia, 2011. [Google Scholar]
- Saunders, P. Measuring wellbeing using non-monetary indicators: Deprivation and social exclusion. Fam. Matters 2008, 78, 8–17. [Google Scholar]
- Yan, M.Y. Research on the Governing Measure of Old Open Community. Master’s Thesis, Shandong University, Jinan, China, 2015. [Google Scholar]
- Li, F. A Brief analysis on the greening transformation of old communities in Beijing urban construction. Theor. Res. Urban Constr. 2016, 78, 70–72. [Google Scholar] [CrossRef]
- Cheng, W.L. Research on the Integration of New Residential Areas in Chinese Cities. Master’s Thesis, Tianjin Normal University, Tianjin, China, 2006. [Google Scholar]
- Dai, X.; Wang, J.J.; Dong, B. Thoughts on the Reconstruction Mode of Guangzhou Old Community from the Perspective of Community Renewal. Shanghai Urban Manag. 2019, 28, 26–31. [Google Scholar]
- Liang, C.Z.; Li, C. The main methods and thinking of comprehensive reconstruction of old residential areas in Beijing. Constr. Sci. Technol. 2016, 20–23. [Google Scholar] [CrossRef]
- Ke, D.N. Research on the Comprehensive Benefit Evaluation of the Old Community after Cavernous Transformati. Master’s Thesis, Jiangxi University of Science and Technology, Ganzhou, China, 2020. [Google Scholar]
- Shi, Z. A Study on the Social Work Intervention of “Micro-Autonomy” in Urban Old Community Based on the Practice of YZ Community in Wuhan City. Master’s Thesis, Central China Normal University, Wuhan, China, 2017. [Google Scholar]
- Zhang, R. Research on the Optimization of the Old Community Management Model Based on Residents’ Well-Being. Master’s Thesis, Xi’an University of Architecture and Technology, Xi’an, China, 2019. [Google Scholar]
- Guo, B.; Li, Y.; Wang, J. The improvement strategy on the management status of the old residence community in Chinese cities: An empirical research based on social cognitive perspective. Cogn. Syst. Res. 2018, 52, 556–570. [Google Scholar] [CrossRef]
- Gu, X.D.; Xia, B. Policy evolution, target selection and optimal path of urban renewal. Acad. Res. 2017, 1, 49–55. [Google Scholar]
- Kong, N.N.; Chen, W.D. The Growth Mechanism of Civil Society: Cooperation between Government and Society—Taking the Community Property Service of Old Urban Area as the Interpreting Object. Contemp. World Social. 2011, 4, 158–162. [Google Scholar]
- Chen, Y.Q.; Tian, H. Study on the old community renovation under the background of population aging. J. Qingdao Univ. Technol. 2018, 39, 1. [Google Scholar]
- Wu, K. Study on the Transformation and Upgrading of Old ResidentialAreas’ Green Environment. Master’s Thesis, Xinjiang Agricultural University, Ürümqi, China, 2016. [Google Scholar]
- Ahirwal, A.A. Recreational Aspects of Open Green Spaces in Neighbourhood. Int. J. Res. Sci. Innov. 2020, 7, 6. [Google Scholar]
- Kaźmierczak, A. The contribution of local parks to neighbourhood social ties. Landsc. Urban Plan. 2013, 109, 31–44. [Google Scholar] [CrossRef]
- Alexander, C.; Ishikawa, S.; Silverstienm, M. A Pattern Language: Towns, Buildings, Construction; Oxford University Press: Oxford, UK, 1977. [Google Scholar]
- Stigsdotter, U.K.; Grahn, P. Stressed individuals’ preferences for activities and environmental character-istics in green spaces. Urban For. Urban Green. 2011, 10, 295–304. [Google Scholar] [CrossRef]
- Janicas, K. Exercise as a treatment in intellectual and developmental disability. J. Dev. Disabil. 2014, 20, 122–127. [Google Scholar]
- Wang, H.Z.; Zhang, Y.C. Problems and Suggestions on the Greening Reconstruction of Old Residential Districts. Green. Life 2012, 10, 29–30. [Google Scholar]
- Zhang, L. Study on the Transformation of Old Residential District. Master’s Thesis, Tianjin University, Tianjin, China, 2017. [Google Scholar]
- Zhang, X.J. Study on Elderly-Oriented Transformation of Urban Old Residential Community Based on the Psychological and Behavioral Characteristics of the Aged. Master’s Thesis, Taiyuan University of Technology, Taiyuan, China, 2017. [Google Scholar]
- Liu, B.W. Research on Sponge City Reconstruction Design of Rainwater System in Old Residential District. Chin. Foreign Constr. 2018, 7, 107–109. [Google Scholar]
- Gidlow, C.J.; Ellis, N.J. Neighbourhood green space in deprived urban communities: Issues and barriers to use. Local Environ. 2011, 16, 989–1002. [Google Scholar] [CrossRef]
- Groshong, L.; Stanis, S.A.W.; Kaczynski, A.T.; Hipp, J.A.; Besenyi, G.M. Exploring attitudes, perceived norms, and personal agency: Insights into theory-based messages to encourage park-based physical activity in low-income urban neighborhoods. J. Phys. Act. Health 2017, 14, 108–116. [Google Scholar] [CrossRef] [PubMed]
- Derose, K.P.; Han, B.; Park, S.; Williamson, S.; Cohen, D.A. The mediating role of perceived crime in gender and built environment associations with park use and park-based physical activity among park users in high poverty. Prev. Med. 2019, 129, 105846. [Google Scholar] [CrossRef] [PubMed]
- Marquet, O.; Hipp, J.A.; Alberico, C.; Huang, J.-H.; Fry, D.; Mazak, E.; Lovasi, G.S.; Floyd, M.F. Park use preferences and physical activity among ethnic minority children in low-income neighborhoods in New York City. Urban For. Urban Green. 2019, 38, 346–353. [Google Scholar] [CrossRef]
- Lee, Y.; Gu, N.; An, S. Residents’ perception and use of green space: Results from a mixed method study in a deprived neighbourhood in Korea. Indoor Built Environ. 2017, 26, 855–871. [Google Scholar] [CrossRef]
- Aziz, A.A.; Ahmad, A.S. Low cost flats outdoor space as children social environment. Procedia-Soc. Behav. Sci. 2012, 38, 243–252. [Google Scholar] [CrossRef] [Green Version]
- Shinew, K.J.; Stodolska, M.; Floyd, M.; Hibbler, D.; Allison, M.; Johnson, C.; Santos, C. Race and ethnicity in leisure behavior: Where have we been and where do we need to go? Leis. Sci. 2006, 28, 403–408. [Google Scholar] [CrossRef]
- Wang, Y. Research on Landscape Design Strategy for Outdoor Rehabilitation of Ellderly Activities Spacein Shijiazhuang Residential District. Master’s Thesis, Northeast Forestry University, Harbin, China, 2020. [Google Scholar]
- Shijiazhuang Municipal People’s Government. 2019. Available online: http://www.sjz.gov.cn/zfxxgk/col/1583914146048/2020/03/31/1585618497432.html2 (accessed on 14 January 2022).
- McHugh, M.L. The chi-square test of independence. Biochem. Med. 2013, 23, 143–149. [Google Scholar] [CrossRef] [Green Version]
- Shijiazhuang Statistics Bureau. Bulletin of the Seventh National Census of Shijiazhuang City; Shijiazhuang Statistics Bureau: Shijiazhuang, China, 2021.
- Dunton, G.F.; Almanza, E.; Jerrett, M.; Wolch, J.; Pentz, M.A. Neighborhood park use by children: Use of accelerometry and global positioning systems. Am. J. Prev. Med. 2014, 46, 136–142. [Google Scholar] [CrossRef] [Green Version]
- Wendel, H.E.W.; Zarger, R.K.; Mihelcic, J.R. Accessibility and usability: Green space preferences, perceptions, and barriers in a rapidly urbanizing city in Latin America. Landsc. Urban Plan. 2012, 107, 272–282. [Google Scholar] [CrossRef]
- Xiong, X.; Liu, L.; Peng, Z.; Wu, H. Physical Activities in Public Squares: The Impact of Companionship on Chinese Residents’ Health. Land 2021, 10, 720. [Google Scholar] [CrossRef]
- Pleson, E.; Nieuwendyk, L.M.; Lee, K.K.; Chaddah, A.; Nykiforuk, C.I.; Schopflocher, D. Understanding older adults’ usage of community green spaces in Taipei, Taiwan. Int. J. Environ. Res. Public Health 2014, 11, 1444–1464. [Google Scholar] [CrossRef] [PubMed] [Green Version]
- Camargo, D.M.; Ramírez, P.C.; Quiroga, V.; Ríos, P.; Férmino, R.C.; Sarmiento, O.L. Physical activity in public parks of high and low socioeconomic status in Colombia using observational methods. J. Phys. Act. Health 2018, 15, 581–591. [Google Scholar] [CrossRef] [PubMed] [Green Version]
- Dobbinson, S.; Simmons, J.; Chamberlain, J.; MacInnis, R.; Salmon, J.; Staiger, P.; Wakefield, M.; Veitch, J. Examining Health-Related Effects of Refurbishment to Parks in a Lower Socioeconomic Area: The ShadePlus Natural Experiment. Int. J. Environ. Res. Public Health 2020, 17, 6102. [Google Scholar] [CrossRef]
- Abu Bakar, N.; Malek, N.A.; Mansor, M. Access to Parks and Recreational Opportunities in Urban Low-income Neighbourhood. Procedia-Soc. Behav. Sci. 2016, 234, 299–308. [Google Scholar] [CrossRef] [Green Version]
- GALLUP. Global Law and Order; GALLUP: Washington, DC, USA, 2021; Available online: https://www.gallup.com/analytics/357173/2021-law-order-report.aspx (accessed on 18 June 2022).
- Cohen, D.; Lapham, S.; Evenson, K.; Williamson, S.; Golinelli, D.; Ward, P.; Hillier, A.; McKenzie, T. Use of neighbourhood parks: Does socio-economic status matter? A four-city study. Public Health 2013, 127, 325–332. [Google Scholar] [CrossRef] [Green Version]
- Huang, J.H.; Hipp, J.A.; Marquet, O.; Alberico, C.; Fry, D.; Mazak, E.; Lovasi, G.S.; Robinson, W.R.; Floyd, M.F. Neighborhood characteristics associated with park use and park-based physical activity among children in low-income diverse neighborhoods in New York City. Prev. Med. 2020, 131, 105948. [Google Scholar] [CrossRef] [PubMed]
- Irvine, K.N.; Fisher, D.; Marselle, M.R.; Currie, M.; Colley, K.; Warber, S.L. Social isolation in older adults: A qualitative study on the social dimensions of group outdoor health walks. Int. J. Environ. Res. Public Health 2022, 19, 5353. [Google Scholar] [CrossRef]
- Castonguay, G.; Jutras, S. Children’s appreciation of outdoor places in a poor neighborhood. J. Environ. Psychol. 2009, 29, 101–109. [Google Scholar] [CrossRef]
- Säumel, I.; Hogrefe, J.; Battisti, L.; Wachtel, T.; Larcher, F. The healthy green living room at one’s doorstep? Use and perception of residential greenery in Berlin, Germany. Urban For. Urban Green. 2021, 58, 126949. [Google Scholar] [CrossRef]
- Cronin-de-Chavez, A.; Islam, S.; McEachan, R.R. Not a level playing field: A qualitative study exploring structural, community and individual determinants of greenspace use amongst low-income multi-ethnic families. Health Place 2019, 56, 118–126. [Google Scholar] [CrossRef] [PubMed]
- Coley, R.L.; Sullivan, W.C.; Kuo, F.E. Where does community grow? The social context created by nature in urban public housing. Environ. Behav. 1997, 29, 468–494. [Google Scholar] [CrossRef]
- Kuo, F.E.; Bacaicoa, M.; Sullivan, W.C. Transforming inner-city landscapes: Trees, sense of safety, and preference. Environ. Behav. 1998, 30, 28–59. [Google Scholar] [CrossRef]
- China’s Great Survey of Good Life. (2020–2021). Lanzhou Daily. Available online: https://baijiahao.baidu.com/s?id=1697988113412054837&wfr=spider&for=pc (accessed on 16 February 2022).
- Paneerchelvam, P.T.; Maruthaveeran, S.; Maulan, S.; Shukor, S.F.A. The use and associated constraints of urban greenway from a socioecological perspective: A systematic review. Urban For. Urban Green. 2020, 47, 126508. [Google Scholar] [CrossRef]
- Dolash, K.; He, M.; Yin, Z.; Sosa, E.T. Factors that influence park use and physical activity in predominantly Hispanic and low-income neighborhoods. J. Phys. Act. Health 2015, 12, 462–469. [Google Scholar] [CrossRef]
- Blokland, T.; Nast, J. From Public Familiarity to Comfort Zone: The Relevance of Absent Ties for Belonging in Berlin’s Mixed Neighbourhoods. Int. J. Urban Reg. Res. 2014, 38, 1142–1159. [Google Scholar] [CrossRef]
- Harandi, M.F.; Moazezi, S.S.; Saba, M.; Grimm, F.; Kamyabi, H.; Sheikhzadeh, F.; Sharifi, I.; Deplazes, P. Sonographical and serological survey of human cystic echinococcosis and analysis of risk factors associated with seroconversion in rural communities of Kerman, Iran. Zoonoses Public Health 2011, 58, 582–588. [Google Scholar] [CrossRef]
- Austin, G.; Duncan, M.J.; Bell, T. Codesigning parks for increasing park visits and physical activity in a low-socioeconomic community: The active by community design experience. Health Promot. Pract. 2021, 22, 338–348. [Google Scholar] [CrossRef] [PubMed]
- Jiang, J.G. Urban Environmental Sanitation Infrastructure Construction and Management; Chemical Industry Press: Beijing, China, 2005; pp. 1–2. [Google Scholar]
- Cárdenas, S.B. Guy Peters, The Future of Governing: Four Emerging Models; University Press of Kansas: Lawrence, KS, USA, 1996; 179p. [Google Scholar]
- Eyler, A.A.; Baker, E.; Cromer, L.; King, A.C.; Brownson, R.C.; Donatelle, R.J. Physical activity and minority women: A qualitative study. Health Educ. Behav. 1998, 25, 640–652. [Google Scholar] [CrossRef] [PubMed]
- Cohen, S.; Syme, S.L. Issues in the study and application of social support. Soc. Support Health 1985, 3, 3–22. [Google Scholar]
- Park, S.; Han, B.; Cohen, D.A.; Derose, K.P. Contributions of neighborhood parks to physical activity in high-poverty urban neighborhoods. J. Urban Health 2018, 95, 881–887. [Google Scholar] [CrossRef] [PubMed]
- Cohen, D.A.; Han, B.; Derose, K.P.; Williamson, S.; Marsh, T.; Raaen, L.; McKenzie, T.L. Promoting physical activity in high-poverty neighborhood parks: A cluster randomized controlled trial. Soc. Sci. Med. 2017, 186, 130–138. [Google Scholar] [CrossRef] [PubMed]
- Das, K.V.; Fan, Y.; French, S.A. Park-use behavior and perceptions by race, Hispanic origin, and immigrant status in Minneapolis, MN: Implications on park strategies for addressing health disparities. J. Immigr. Minor. Health 2017, 19, 318–327. [Google Scholar] [CrossRef]
- Kuo, F.E.; Sullivan, W.C. Aggression and violence in the inner city: Effects of environment via mental fatigue. Environ. Behav. 2001, 33, 543–571. [Google Scholar] [CrossRef]
- Harnik, P.; Simms, J. Parks: How Far Is Too Far? Planning Magazine. December 2008. Available online: http://cloud.tpl.org/pubs/ccpe_Planning_mag_article12_2004.pdf (accessed on 21 March 2022).
- Derose, K.P.; Han, B.; Williamson, S.; Cohen, D.A. Gender disparities in park use and physical activity among residents of high-poverty neighborhoods in Los Angeles. Women’s Health Issues 2018, 28, 6–13. [Google Scholar] [CrossRef] [Green Version]
Figure 1.
The location of Shijiazhuang, Hebei Province, China.

Figure 2.
Buildings and green spaces in old residential neighborhoods.

Figure 3.
Selected old residential neighborhoods as study sites in Shijiazhuang.

Figure 4.
The respondents’ constraints in using green spaces in an old residential neighborhoods.


Table 1.
Demographic background of the respondents (N = 668).
| Respondents Profile | Number (N) | Percentage (%) |
|---|---|---|
| Gender | ||
| Male | 300 | 44.9% |
| Female | 368 | 55.1% |
| Age | ||
| <18 | 13 | 2% |
| 18−30 | 204 | 30.5% |
| 31−45 | 200 | 29.9% |
| 46−55 | 123 | 18.4% |
| 56−60 | 73 | 10.9% |
| >60 | 55 | 8.2% |
| Education Level | ||
| Primary school and below | 16 | 2.4% |
| Junior high school | 88 | 13.2% |
| High school | 197 | 29.5% |
| University degree or above | 367 | 54.9% |
| Marital status | ||
| Single | 204 | 30.5% |
| Married | 464 | 69.5% |
| Occupation | ||
| Student | 49 | 7.3% |
| Government sector | 71 | 10.6% |
| Private sector | 282 | 42.2% |
| Self-employed | 68 | 10.1% |
| Pensioner | 132 | 19.8% |
| Unemployed | 66 | 9.9% |
Table 2.
User pattern by respondents at an old residential neighborhood’s green space (N = 668).
| Characteristic | Number (N) |
|---|---|
| How often do you visit the neighborhood’s green space? | |
| 1–2 times/year | 96 |
| 1–2 times/month | 110 |
| 1–2 times/week | 209 |
| Daily | 253 |
| What time of the day do you prefer to visit the neighborhood green space? | |
| Morning | 229 |
| Noon | 85 |
| Afternoon | 307 |
| Evening | 432 |
| When do you prefer to come to the neighborhood’s green space? | |
| Weekends | 591 |
| Weekdays | 283 |
| How long do you normally stay here for? | |
| <30 min | 95 |
| 30–60 min | 287 |
| 1–2 h | 214 |
| >2 h | 72 |
| Do you prefer to visit the neighborhood green space alone or in a group? | |
| Alone | 331 |
| In a group | 337 |
| Why do you visit this neighborhood green space? | |
| Enjoy nature and relax | 443 |
| Accompany family | 279 |
| Walk the dog | 81 |
| Jog or walk | 277 |
| Talk with friends | 170 |
| Square dancing | 45 |
| Tai Chi | 28 |
| Play ball games | 103 |
| Gardening | 48 |
| Do exercises (equipment) | 167 |
| Play cards and chess | 64 |
| Take a shortcut | 80 |
| Dry quilts and clothes | 56 |
| Others | 68 |
Table 3.
User pattern by respondents at an old residential neighborhood’s green space (chi-square and Fisher’s exact test measure x² and p-value).
Table 3.
User pattern by respondents at an old residential neighborhood’s green space (chi-square and Fisher’s exact test measure x² and p-value).
| How Often Do You Visit the Neighborhood’s Green Space? | What Time of the Day Do You Prefer to Visit the Neighborhood Green Space? | |||||||||||||
|---|---|---|---|---|---|---|---|---|---|---|---|---|---|---|
| 1–2 Times/Year | 1–2 Times/Month | 1–2 Times/Week | Daily | Morning | Noon | Afternoon | Evening | |||||||
| Gender | ||||||||||||||
| Male, N (%) | 30 (10) | 64 (21.3) | 95 (31.7) | 111 (37) | 103 (34.3) | 36 (12) | 145 (48.3) | 185 (61.7) | ||||||
| Female, N (%) | 66 (17.9) | 46 (12.5) | 114 (31) | 142 (38.6) | 126 (34.2) | 49 (13.3) | 162 (44) | 247 (61.1) | ||||||
| Pearson’s x² (p) | 15.207 (0.002 ***) | 1.597 (0.66) | ||||||||||||
| 0 cells (0.0%) have expected count less than 5. The minimum expected count is 43.11. | 0 cells (0.0%) have expected count less than 5. The minimum expected count is 37.86. | |||||||||||||
| Age | ||||||||||||||
| <18, N (%) | 3 (23.1) | 4 (30.8) | 4 (30.8) | 2 (15.4) | 5 (38.5) | 4 (30.8) | 4 (30.8) | 7 (53.8) | ||||||
| 18−30, N (%) | 31 (15.2) | 43 (21.1) | 75 (36.8) | 55 (27) | 45 (22.1) | 32 (15.7) | 80 (39.2) | 146 (71.6) | ||||||
| 31−45, N (%) | 34 (17) | 30 (15) | 72 (36) | 64 (32) | 61 (30.5) | 33 (16.5) | 88 (44) | 142 (71) | ||||||
| 46−55, N (%) | 18 (14.6) | 17 (13.8) | 32 (26) | 56 (45.5) | 47 (38.2) | 11 (8.9) | 45 (36.6) | 85 (69.1) | ||||||
| 56−60, N (%) | 16 (8.2) | 8 (11) | 18 (24.7) | 41 (56.2) | 36 (49.3) | 3 (4.1) | 45 (61.6) | 40 (54.8) | ||||||
| >60, N (%) | 14 (7.3) | 8 (14.5) | 8 (14.5) | 35 (63.6) | 35 (63.6) | 2 (.6) | 45 (81.8) | 12 (21.8) | ||||||
| Pearson’s x² (p) | 50.486 (0 ***) | 83.144 (0 ***) | ||||||||||||
| 4 cells (16.7%) have expected count less than 5. The minimum expected count is 1.87. | 2 cells (8.3%) have expected count less than 5. The minimum expected count is 1.61. | |||||||||||||
| Education Level | ||||||||||||||
| Primary school and below, N (%) | 4 (25) | 2 (12.5) | 3 (18.8) | 7 (43.8) | 10 (62.5) | 2 (12.5) | 6 (37.5) | 7 (43.8) | ||||||
| Junior high school, N (%) | 15 (17) | 12 (13.6) | 16 (18.2) | 45 (51.1) | 36 (40.9) | 6 (6.8) | 40 (45.5) | 45 (51.1) | ||||||
| High school, N (%) | 28 (14.2) | 36 (18.3) | 49 (24.9) | 84 (42.6) | 78 (39.6) | 17 (8.6) | 105 (53.3) | 114 (57.9) | ||||||
| University degree or above, N (%) | 49 (13.4) | 60 (16.3) | 141 (38.4) | 117 (31.9) | 105 (28.6) | 60 (16.3) | 156 (42.5) | 266 (72.5) | ||||||
| Pearson’s x² (p) | 26.027 (0.002 ***) | 29.770 (0 ***) | ||||||||||||
| 2 cells (12.5%) have expected count less than 5. The minimum expected count is 2.3. | 1 cell (6.3%) has expected count less than 5. The minimum expected count is 2.02. | |||||||||||||
| Marital Status | ||||||||||||||
| Single, N (%) | 41 (20.1) | 42 (20.6) | 61 (29.9) | 60 (29.4) | 55 (27) | 28 (13.7) | 84 (41.2) | 134 (65.7) | ||||||
| Married, N (%) | 55 (11.9) | 68 (14.7) | 148 (31.9) | 193 (41.6) | 174 (37.5) | 57 (12.3) | 223 (48.1) | 298 (64.2) | ||||||
| Pearson’s x² (p) | 15.465 (0.001 ***) | 4.609 (0.203) | ||||||||||||
| 0 cells (0.0%) have expected count less than 5. The minimum expected count is 29.32. | 0 cells (0.0%) have expected count less than 5. The minimum expected count is 24.3. | |||||||||||||
| Occupation | ||||||||||||||
| Student, N (%) | 8 (16.3) | 7 (14.3) | 21 (42.9) | 13 (26.5) | 14 (28.6) | 12 (24.5) | 27 (55.1) | 29 (59.2) | ||||||
| Government sector, N (%) | 8 (11.3) | 14 (19.7) | 28 (39.4) | 21 (29.6) | 20 (28.2) | 11 (15.5) | 26 (36.6) | 44 (62) | ||||||
| Private sector, N (%) | 42 (14.9) | 55 (19.5) | 104 (36.9) | 81 (28.7) | 74 (26.2) | 34 (12.1) | 111 (39.4) | 214 (75.9) | ||||||
| Self-employed, N (%) | 16 (23.5) | 15 (22.1) | 12 (17.6) | 25 (36.8) | 17 (25) | 8 (11.8) | 21 (30.9) | 52 (76.5) | ||||||
| Pensioner, N (%) | 12 (9.1) | 11 (8.3) | 24 (18.2) | 85 (64.4) | 80 (60.6) | 7 (5.3) | 91 (68.9) | 49 (37.1) | ||||||
| Unemployed, N (%) | 10 (15.2) | 8 (12.1) | 20 (30.3) | 28 (42.4) | 24 (36.4) | 13 (19.7) | 31 (47) | 44 (66.7) | ||||||
| Pearson’s x² (p) | 68.562 (0 ***) | 26.269 (0 ***) | ||||||||||||
| 0 cells (0.0%) have expected count less than 5. The minimum expected count is 7.04. | 0 cells (0.0%) have expected count less than 5. The minimum expected count is 6.62. | |||||||||||||
| When do you prefer to come to the neighborhood’s green space? | How long do you normally stay here for? | Do you prefer to visit the neighborhood green space alone or in a group? | ||||||||||||
| Weekends | Weekdays | <30 min | 30–60 min | 1–2 h | >2h | Alone | In a group | |||||||
| Gender | ||||||||||||||
| Male, N (%) | 264 (88) | 140 (46.7) | 35 (11.7) | 125 (41.7) | 108 (36) | 32 (10.7) | 151 (50.3) | 149 (49.7) | ||||||
| Female, N (%) | 327 (88.9) | 143 (38.9) | 60 (16.3) | 162 (44) | 106 (28.8) | 40 (10.9) | 180 (48.9) | 188 (51.1) | ||||||
| Pearson’s x² (p) | 1.774 (0.183) | 5.39 (0.145) | 0.133 (0.715) | |||||||||||
| 0 cells (0.0%) have expected count less than 5. The minimum expected count is 130.81. | 0 cells (0.0%) have expected count less than 5. The minimum expected count is 32.34. | 0 cells (0.0%) have expected count less than 5. The minimum expected count is 148.65. | ||||||||||||
| Age | ||||||||||||||
| <18, N (%) | 11 (84.6) | 2 (15.4) | 4 (30.8) | 5 (38.5) | 4 (30.8) | 0 (0) | 4 (30.8) | 9 (69.2) | ||||||
| 18−30, N (%) | 182 (89.2) | 68 (33.3) | 39 (19.1) | 85 (41.7) | 61 (29.9) | 19 (9.3) | 107 (52.5) | 97 (47.5) | ||||||
| 31−45, N (%) | 183 (91.5) | 73 (36.5) | 27 (13.5) | 94 (47) | 58 (29) | 21 (10.5) | 93 (46.5) | 107 (53.5) | ||||||
| 46−55, N (%) | 106 (86.2) | 47 (38.2) | 19 (15.4) | 56 (45.5) | 36 (29.3) | 12 (9.8) | 72 (58.5) | 51 (41.5) | ||||||
| 56−60, N (%) | 62 (84.9) | 49 (67.1) | 3 (4.1) | 24 (32.9) | 35 (47.9) | 11 (15.1) | 35 (47.9) | 38 (52.1) | ||||||
| >60, N (%) | 47 (85.5) | 44 (80) | 3 (5.5) | 23 (41.8) | 20 (36.4) | 9 (16.4) | 20 (36.4) | 35 (63.6) | ||||||
| Pearson’s x² (p) | 24.336 (0 ***) | 29.234 (0.015 **) | 11.14 (0.049 **) | |||||||||||
| 1 cell (8.3%) has expected count less than 5. The minimum expected count is 4.21. | 3 cells (12.5%) have expected count less than 5. The minimum expected count is 1.4. | 0 cells (0.0%) have expected count less than 5. The minimum expected count is 130.81. | ||||||||||||
| Education Level | ||||||||||||||
| Primary school and below, N (%) | 11 (68.8) | 11 (68.8) | 3 (18.8) | 5 (31.3) | 5 (31.3) | 3 (18.8) | 7 (43.8) | 9 (56.3) | ||||||
| Junior high school, N (%) | 78 (88.6) | 41 (46.6) | 12 (13.6) | 35 (39.8) | 27 (30.7) | 14 (15.9) | 39 (44.3) | 49 (55.7) | ||||||
| High school, N (%) | 163 (82.7) | 105 (53.3) | 22 (11.2) | 91 (46.2) | 67 (34) | 17 (8.6) | 100 (50.8) | 97 (49.2) | ||||||
| University degree or above, N (%) | 339 (92.4) | 126 (34.3) | 58 (15.8) | 156 (42.5) | 115 (31.3) | 38 (10.4) | 185 (50.4) | 182 (49.6) | ||||||
| Pearson’s x² (p) | 14.939 (0.002 ***) | 7.753 (0.559) | 1.403 (0.705) | |||||||||||
| 0 cells (0.0%) have expected count less than 5. The minimum expected count is 7.12. | 2 cells (12.5%) have expected count less than 5. The minimum expected count is 1.72. | 0 cells (0.0%) have expected count less than 5. The minimum expected count is 7.93. | ||||||||||||
| Marital status | ||||||||||||||
| Single, N (%) | 175 (85.8) | 80 (39.2) | 39 (19.1) | 86 (42.2) | 58 (28.4) | 21 (10.3) | 108 (52.9) | 96 (47.1) | ||||||
| Married, N (%) | 416 (89.7) | 203 (43.8) | 56 (12.1) | 201 (43.3) | 156 (33.6) | 51 (11) | 223 (48.1) | 241 (51.9) | ||||||
| Pearson’s x² (p) | 0.167 (0.683) | 6.25 (0.1) | 1.35 (0.245) | |||||||||||
| 0 cells (0.0%) have expected count less than 5. The minimum expected count is 82.57. | 0 cells (0.0%) have expected count less than 5. The minimum expected count is 21.99. | 0 cells (0.0%) have expected count less than 5. The minimum expected count is 101.08. | ||||||||||||
| Occupation | ||||||||||||||
| Student, N (%) | 44 (89.8) | 13 (26.5) | 9 (18.4) | 17 (34.7) | 19 (38.8) | 4 (8.2) | 18 (36.7) | 31 (63.3) | ||||||
| Government sector, N (%) | 57 (80.3) | 31 (43.7) | 13 (18.3) | 37 (52.1) | 16 (22.5) | 5 (7) | 37 (52.1) | 34 (47.9) | ||||||
| Private sector, N (%) | 263 (93.3) | 92 (32.6) | 44 (15.6) | 129 (45.7) | 88 (31.2) | 21 (7.4) | 154 (54.6) | 128 (45.4) | ||||||
| Self-employed, N (%) | 58 (85.3) | 27 (39.7) | 7 (10.3) | 35 (51.5) | 19 (27.9) | 7 (10.3) | 36 (52.9) | 32 (47.1) | ||||||
| Pensioner, N (%) | 110 (83.3) | 93 (70.5) | 11 (8.3) | 45 (34.1) | 52 (39.4) | 24 (18.2) | 49 (37.1) | 83 (62.9) | ||||||
| Unemployed, N (%) | 59 (89.4) | 27 (40.9) | 11 (16.7) | 24 (36.4) | 20 (30.3) | 11 (16.7) | 37 (56.1) | 29 (43.9) | ||||||
| Pearson’s x² (p) | 26.269 (0 ***) | 31.331 (0.008 ***) | 15.883 (0.007 ***) | |||||||||||
| 0 cells (0.0%) have expected count less than 5. The minimum expected count is 18.46. | 0 cells (0.0%) have expected count less than 5. The minimum expected count is 5.28. | 0 cells (0.0%) have expected count less than 5. The minimum expected count is 24.28. | ||||||||||||
| Why do you visit this neighborhood green space? You can choose multiple reasons. | ||||||||||||||
| Enjoy nature and relax | Accompany family | Walk the dog | Jog or walk | Talk with friends | Square dancing | Tai Chi | Play ball games | Gardening | Do exercises: equipment | Play cards and chess | Take a shortcut | Dry quilts and clothes | Others | |
| Gender | ||||||||||||||
| Male, N (%) | 197 (65.7) | 131 (43.7) | 37 (12.3) | 136 (45.3) | 80 (26.7) | 5 (1.7) | 20 (6.7) | 58 (19.3) | 24 (8) | 75 (25) | 52 (17.3) | 31 (10.3) | 2 (0.7) | 25 (8.3) |
| Female, N (%) | 246 (66.8) | 148 (40.2) | 44 (12) | 141 (38.3) | 90 (24.5) | 40 (10.9) | 8 (2.2) | 45 (12.2) | 24 (6.5) | 92 (25) | 12 (3.3) | 49 (13.3) | 54 (14.7) | 43 (11.7) |
| Pearson’s x² (p) | 112.478 (0 ***) | |||||||||||||
| 0 cells (0.0%) have expected count less than 5. The minimum expected count is 12.8. | ||||||||||||||
| Age | ||||||||||||||
| <18, N (%) | 5 (38.5) | 2 (15.4) | 1 (7.7) | 3 (23.1) | 3 (23.1) | 0 (0) | 0 (0) | 5 (38.5) | 0 (0) | 0 (0) | 0 (0) | 2 (15.4) | 0 (0) | 2 (15.4) |
| 18−30, N (%) | 146 (33) | 70 (34.3) | 45 (22.1) | 88 (43.1) | 59 (28.9) | 15 (7.4) | 5 (2.5) | 41 (20.1) | 16 (7.8) | 44 (21.6) | 10 (4.9) | 36 (17.6) | 0 (0) | 20 (9.8) |
| 31−45, N (%) | 114 (25.7) | 131 (65.5) | 15 (7.5) | 81 (40.5) | 27 (13.5) | 2 (1) | 1 (0.5) | 36 (18) | 7 (3.5) | 52 (26) | 8 (4) | 16 (8) | 1 (0.5) | 17 (8.5) |
| 46−55, N (%) | 83 (67.5) | 35 (28.5) | 13 (10.6) | 52 (42.3) | 30 (24.4) | 12 (9.8) | 5 (4.1) | 14 (11.4) | 8 (6.5) | 27 (22) | 6 (4.9) | 13 (10.6) | 6 (4.9) | 14 (11.4) |
| 56−60, N (%) | 57 (78.1) | 27 (37) | 6 (8.2) | 30 (41.1) | 25 (34.2) | 9 (12.3) | 7 (9.6) | 4 (5.5) | 13 (17.8) | 22 (30.1) | 23 (31.5) | 10 (13.7) | 27 (37) | 8 (11) |
| >60, N (%) | 38 (69.1) | 14 (25.5) | 1 (1.8) | 23 (41.8) | 26 (47.3) | 7 (12.7) | 10 (18.2) | 3 (5.5) | 4 (7.3) | 22 (40) | 17 (30.9) | 3 (5.5) | 22 (40) | 7 (12.7) |
| Fisher’s Exact Test (p) | 348.361 (0 ***) | |||||||||||||
| 18 cells (21.4%) have expected count less than 5. The minimum expected count is 0.34. | ||||||||||||||
| Education Level | ||||||||||||||
| Primary school and below, N (%) | 9 (56.3) | 4 (25) | 0 (0) | 4 (25) | 3 (18.8) | 2 (12.5) | 1 (6.3) | 2 (12.5) | 3 (18.8) | 3 (18.8) | 1 (6.3) | 3 (18.8) | 4 (25) | 1 (6.3) |
| Junior high school, N (%) | 50 (56.8) | 30 (24.1) | 5 (5.7) | 33 (37.5) | 28 (31.8) | 12 (13.6) | 8 (9.1) | 9 (10.2) | 3 (3.4) | 22 (25) | 15 (17) | 5 (5.7) | 14 (15.9) | 8 (9.1) |
| High school, N (%) | 136 (69) | 71 (36) | 22 (11.2) | 79 (40.1) | 59 (29.9) | 11 (5.6) | 12 (6.1) | 20 (10.2) | 19 (9.6) | 51 (25.9) | 35 (17.8) | 16 (8.1) | 28 (14.2) | 16 (8.1) |
| University degree or above, N (%) | 248 (67.6) | 174 (47.4) | 54 (14.7) | 161 (43.9) | 80 (21.8) | 20 (5.4) | 17 (1.9) | 72 (19.6) | 23 (6.3) | 91 (24.8) | 13 (3.5) | 56 (15.3) | 10 (2.7) | 43 (11.7) |
| Fisher’s exact test (p) | 137.501 (0 ***) | |||||||||||||
| 12 cells (21.4%) have expected count less than 5. The minimum expected count is 0.59. | ||||||||||||||
| Marital status | ||||||||||||||
| Single, N (%) | 140 (68.6) | 42 (20.6) | 38 (18.6) | 85 (41.7) | 64 (31.4) | 15 (7.4) | 5 (2.5) | 42 (20.6) | 15 (7.4) | 48 (23.5) | 18 (8.8) | 32 (15.7) | 8 (3.9) | 19 (9.3) |
| Married, N (%) | 303 (65.3) | 237 (51.1) | 43 (9.3) | 192 (41.4) | 106 (22.8) | 30 (6.5) | 23 (5) | 61 (13.1) | 33 (7.1) | 119 (25.6) | 46 (9.9) | 48 (10.3) | 48 (10.3) | 49 (10.6) |
| Pearson’s x² (p) | 64.855 (0 ***) | |||||||||||||
| 0 cells (0.0%) have expected count less than 5. The minimum expected count is 8.38. | ||||||||||||||
| Occupation | ||||||||||||||
| Student, N (%) | 34 (69.4) | 15 (30.6) | 11 (22.4) | 19 (38.8) | 21 (42.9) | 6 (12.2) | 1 (2) | 16 (32.7) | 5 (10.2) | 10 (20.4) | 2 (4.1) | 8 (16.3) | 0 (0) | 4 (8.2) |
| Government sector, N (%) | 40 (56.3) | 34 (47.9) | 7 (9.9) | 34 (47.9) | 11 (15.5) | 2 (2.8) | 4 (5.6) | 11 (15.5) | 1 (1.4) | 17 (23.9) | 3 (4.2) | 12 (16.9) | 2 (2.8) | 7 (9.9) |
| Private sector, N (%) | 194 (68.8) | 132 (46.8) | 37 (13.1) | 119 (42.2) | 59 (20.9) | 14 (5) | 6 (2.1) | 49 (17.4) | 21 (7.4) | 66 (23.4) | 24 (8.5) | 37 (13.1) | 1 (0.4) | 22 (7.8) |
| Self-employed, N (%) | 37 (54.4) | 38 (55.9) | 8 (11.8) | 26 (38.2) | 11 (16.2) | 2 (2.9) | 2 (2.9) | 8 (11.8) | 3 (4.4) | 13 (19.1) | 4 (5.9) | 5 (7.4) | 0 (0) | 4 (5.9) |
| Pensioner, N (%) | 91 (68.9) | 33 (25) | 10 (7.6) | 51 (38.6) | 50 (37.9) | 19 (14.4) | 13 (9.8) | 9 (6.8) | 14 (10.6) | 41 (31.1) | 28 (21.2) | 11 (8.3) | 48 (36.4) | 19 (14.4) |
| Unemployed, N (%) | 47 (71.2) | 27 (40.9) | 8 (12.1) | 28 (42.4) | 18 (27.3) | 2 (3) | 2 (3) | 10 (15.2) | 4 (6.1) | 20 (30.3) | 3 (4.5) | 7 (10.6) | 50 (7.6) | 12 (18.2) |
| Pearson’s x² (p) | 267.071 (0 ***) | |||||||||||||
| 14 cells (16.7%) have expected count less than 5. The minimum expected count is 2.23. | ||||||||||||||
** p < 0.05, *** p < 0.0.
Table 4.
The respondents’ constraints in using the green space in an old residential neighborhood (ordered logistic regression model measure the odd ratio (OR) and p-value).
Table 4.
The respondents’ constraints in using the green space in an old residential neighborhood (ordered logistic regression model measure the odd ratio (OR) and p-value).
| Lack of Companions | Too Busy | Safety Concerns | Lack of Maintenance | Crowded Activity Area | Inadequate Facilities | Bad Weather | Lack of Accessibility | Programs Not Meeting Needs | Too Far | Pet Problem | Physical Limit | |
|---|---|---|---|---|---|---|---|---|---|---|---|---|
| Gender | ||||||||||||
| Female | 1.19 | 0.87 | 0.93 | 1.38 ** | 1.34 ** | 1.29 * | 1.09 | 1.38 ** | 1.13 | 0.92 | 1.2 | 1.47 ** |
| Male | - | - | - | - | - | - | - | - | - | - | - | - |
| Age | ||||||||||||
| <18 | 0.9 | 8.45 *** | 1.99 | 0.31 * | 0.39 | 0.27 * | 0.54 | 0.58 | 0.9 | 3.82 * | 0.18 ** | 0.2 ** |
| 18−30 | 1.06 | 3.53 *** | 1.19 | 0.22 *** | 0.29 *** | 0.4 ** | 0.37 ** | 0.34 ** | 0.54 | 3.87 *** | 0.11 *** | 0.22 *** |
| 31−45 | 0.9 | 2.61 ** | 1.29 | 0.43 ** | 0.5 * | 0.58 | 0.31 *** | 0.48 * | 0.59 | 2.93 ** | 0.14 *** | 0.18 *** |
| 46−55 | 1.07 | 2.19 ** | 1.25 | 0.24 *** | 0.37 *** | 0.38 *** | 0.29 *** | 0.46 ** | 0.47 ** | 2.75 ** | 0.14 *** | 0.21 *** |
| 56−60 | 1.02 | 0.74 | 0.79 | 0.49 ** | 0.49 ** | 0.68 | 0.36 *** | 0.63 | 0.82 | 0.95 | 0.31 *** | 0.33 *** |
| >60 | - | - | - | - | - | - | - | - | - | - | - | - |
| Education Level | ||||||||||||
| Primary school and below | 2.18 | 0.29 ** | 0.71 | 1.53 | 2.07 | 1.96 | 1.59 | 1.62 | 2.09 | 2.24 | 2.38 | 2.3 |
| Junior high school | 0.93 | 0.74 | 1.29 | 1.14 | 0.9 | 1.11 | 0.74 | 0.82 | 0.93 | 0.98 | 1.25 | 1.68 * |
| High school | 0.95 | 0.54 *** | 0.73 | 1.14 | 0.92 | 1.15 | 0.71 * | 1.04 | 1.07 | 0.79 | 1.13 | 0.98 |
| University degree or above | - | - | - | - | - | - | - | - | - | - | - | - |
| Marital Status | ||||||||||||
| Single | 1.58 ** | 1.09 | 0.88 | 1.28 | 1.21 | 1.14 | 1.19 | 1.4 * | 1.25 | 0.92 | 0.95 | 1.55 ** |
| Married | - | - | - | - | - | - | - | - | - | - | - | - |
| Occupation | ||||||||||||
| Student | 0.53 | 1.86 | 0.49 * | 0.64 | 0.94 | 0.97 | 0.54 | 0.65 | 0.49 * | 0.71 | 0.5 * | 0.48 * |
| Government Sector | 0.78 | 0.96 | 0.75 | 1.11 | 1.69 * | 1.33 | 1.51 | 1.56 | 1.3 | 1.18 | 1.23 | 1.09 |
| Private sector | 0.88 | 1.07 | 0.84 | 1.54 * | 1.97 *** | 1.36 | 1.21 | 1.19 | 1.28 | 1.16 | 1.38 | 1.01 |
| Self-employed | 1.12 | 0.84 | 0.53 * | 1.24 | 1.47 | 1.11 | 1.17 | 1.04 | 0.96 | 1.17 | 1.05 | 0.88 |
| Pensioner | 0.93 | 0.98 | 0.88 | 1.07 | 1.57 | 1.14 | 1.16 | 1.42 | 0.85 | 0.88 | 0.87 | 0.76 |
| Unemployed | - | - | - | - | - | - | - | - | - | - | - | - |
* p < 0.1, ** p < 0.05, *** p < 0.0.
Disclaimer/Publisher’s Note: The statements, opinions and data contained in all publications are solely those of the individual author(s) and contributor(s) and not of MDPI and/or the editor(s). MDPI and/or the editor(s) disclaim responsibility for any injury to people or property resulting from any ideas, methods, instructions or products referred to in the content. |
© 2023 by the authors. Licensee MDPI, Basel, Switzerland. This article is an open access article distributed under the terms and conditions of the Creative Commons Attribution (CC BY) license (https://creativecommons.org/licenses/by/4.0/).
Share and Cite
MDPI and ACS Style
Dai, C.; Maruthaveeran, S.; Shahidan, M.F.; Chu, Y. Usage of and Barriers to Green Spaces in Disadvantaged Neighborhoods: A Case Study in Shi Jiazhuang, Hebei Province, China. Forests 2023, 14, 435. https://doi.org/10.3390/f14020435
AMA Style
Dai C, Maruthaveeran S, Shahidan MF, Chu Y. Usage of and Barriers to Green Spaces in Disadvantaged Neighborhoods: A Case Study in Shi Jiazhuang, Hebei Province, China. Forests. 2023; 14(2):435. https://doi.org/10.3390/f14020435
Chicago/Turabian StyleDai, Chenyang, Sreetheran Maruthaveeran, Mohd Fairuz Shahidan, and Yichun Chu. 2023. "Usage of and Barriers to Green Spaces in Disadvantaged Neighborhoods: A Case Study in Shi Jiazhuang, Hebei Province, China" Forests 14, no. 2: 435. https://doi.org/10.3390/f14020435
Note that from the first issue of 2016, this journal uses article numbers instead of page numbers. See further details here.