

Modelling Climatically Suitable Areas for Mahogany (Swietenia macrophylla King) and Their Shifts across Neotropics: The Role of Protected Areas

 ,
,  , , , and
Abstract
:1. Introduction
2. Materials and Methods
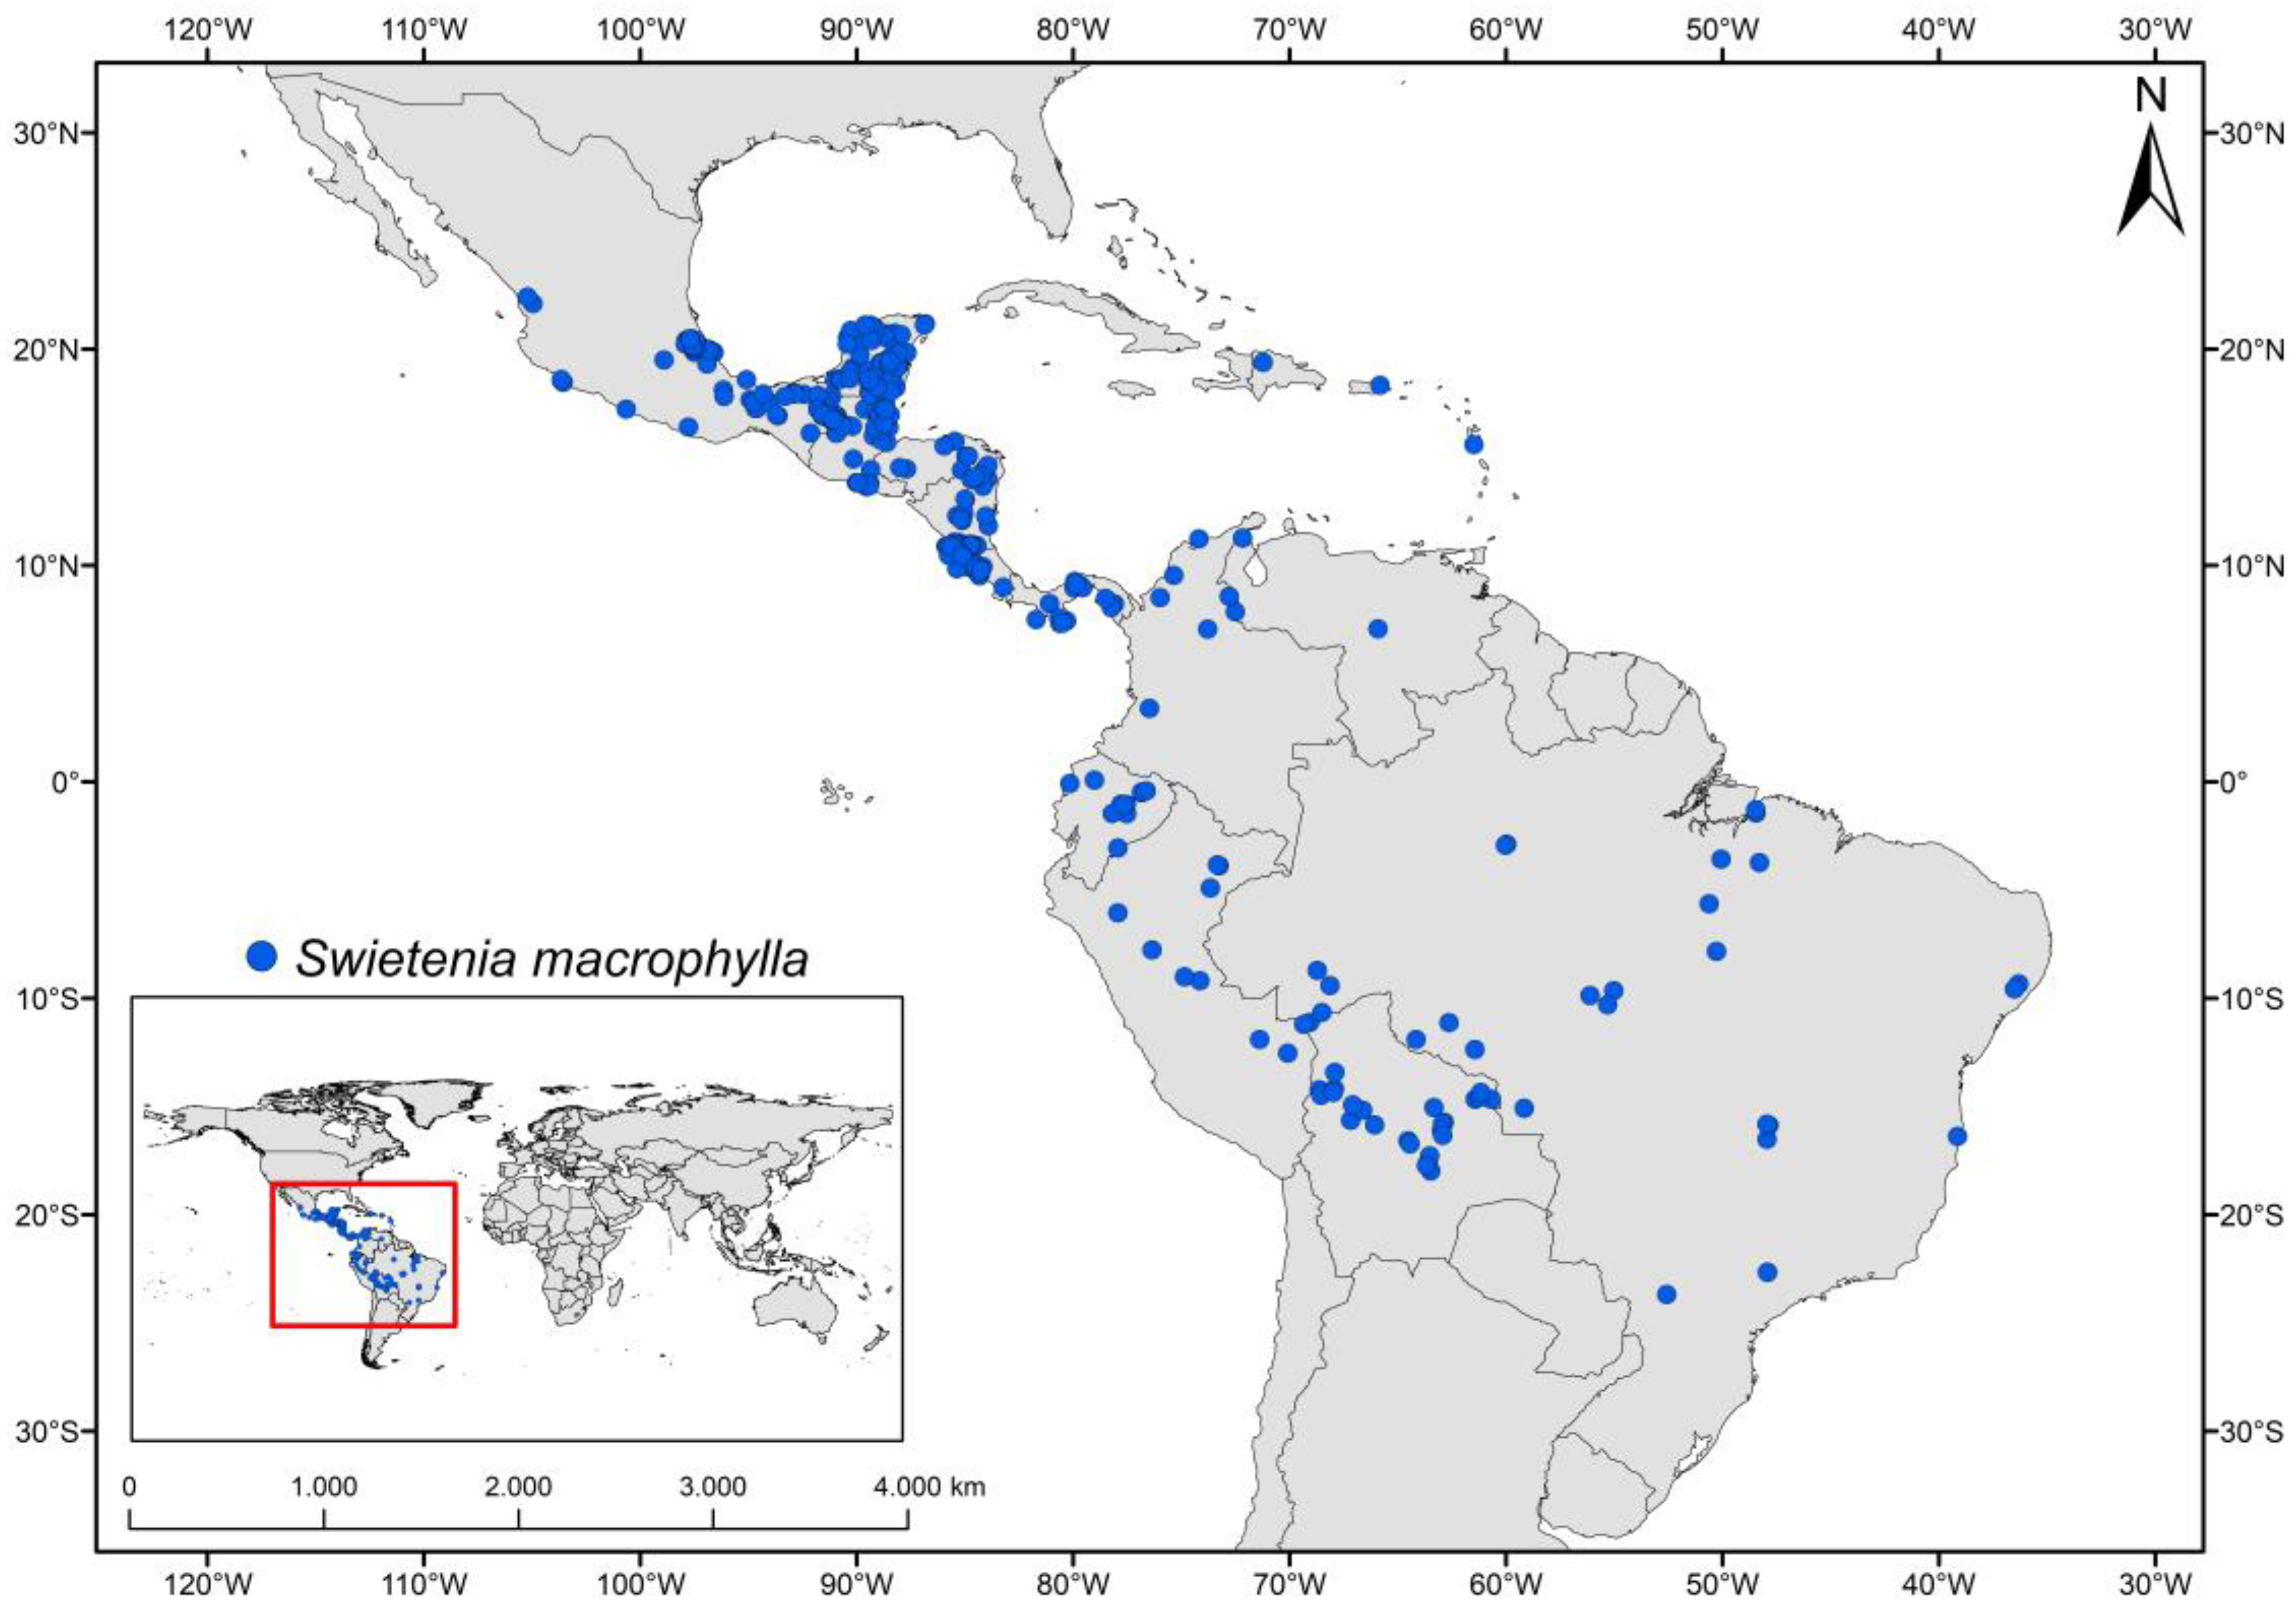
2.1. Study Area
2.2. Presence Records
2.3. Environmental Data
2.4. Species Distribution Models
2.5. Changes in the Potential Geographic Distribution of Mahogany
2.6. Representativeness of Distribution Areas of Mahogany in the Network of Protected Areas
3. Results
3.1. Statistical Performance of the Models
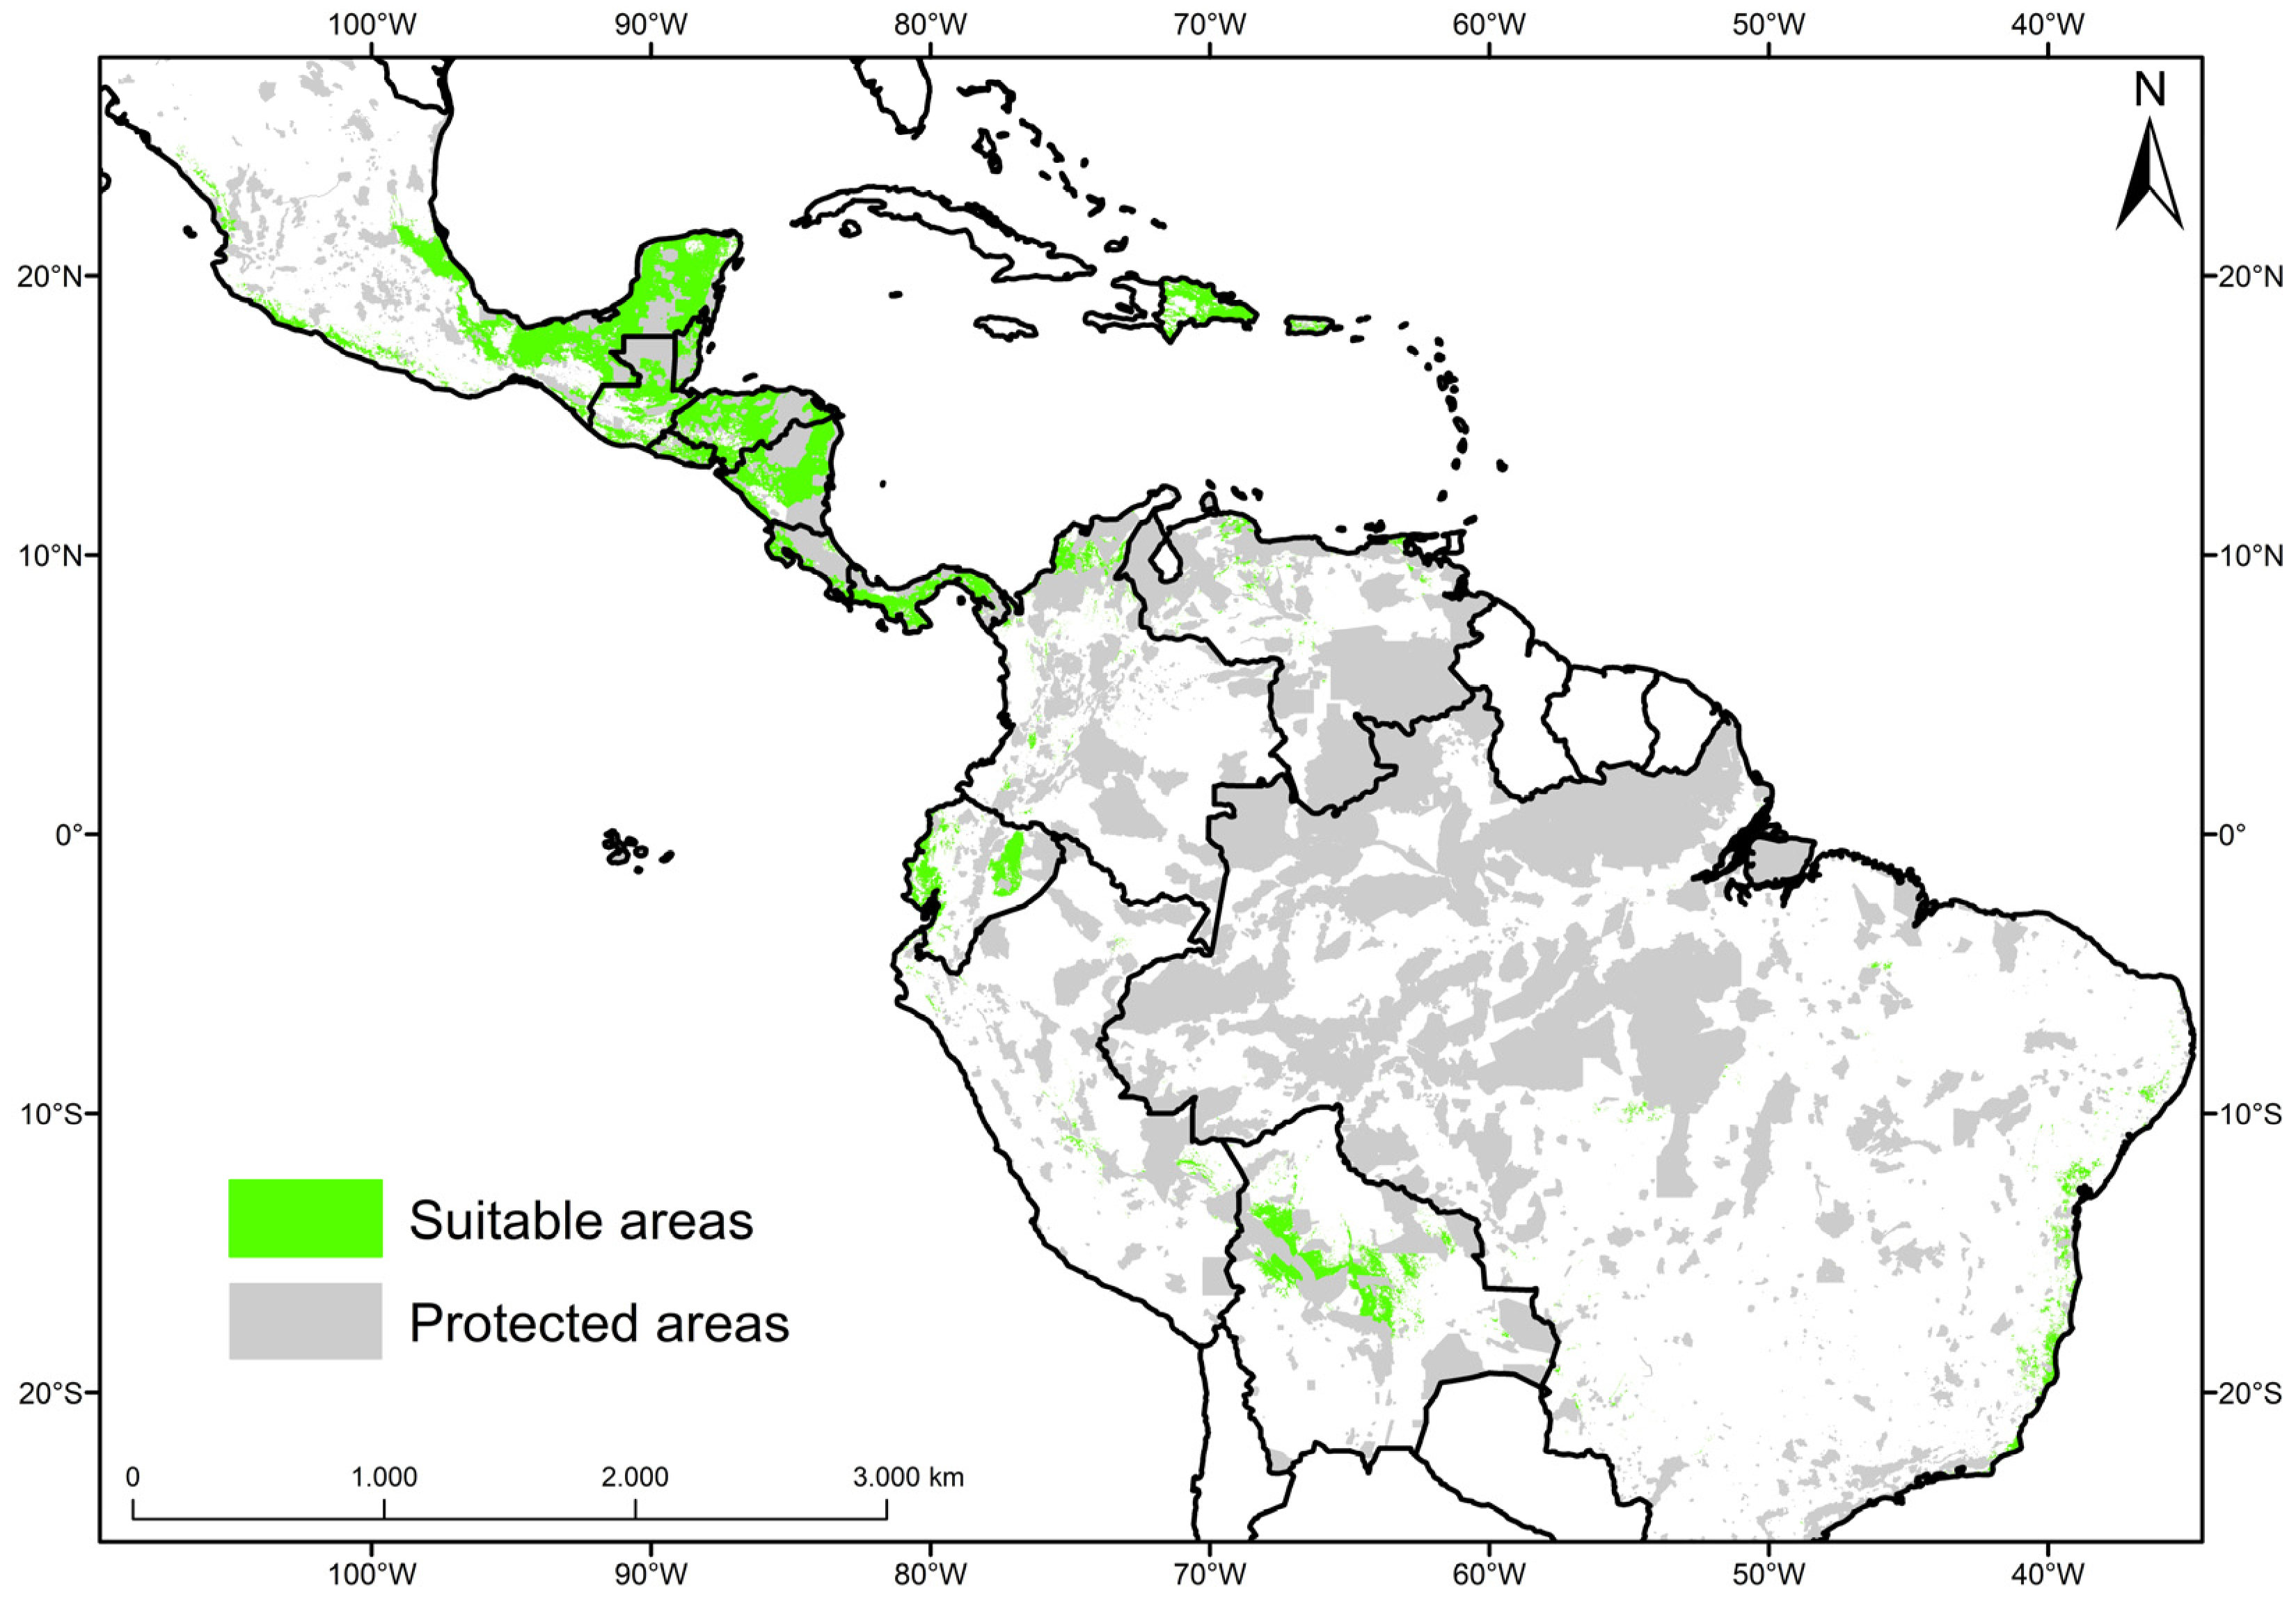
3.2. Current Potential Distribution of Mahogany
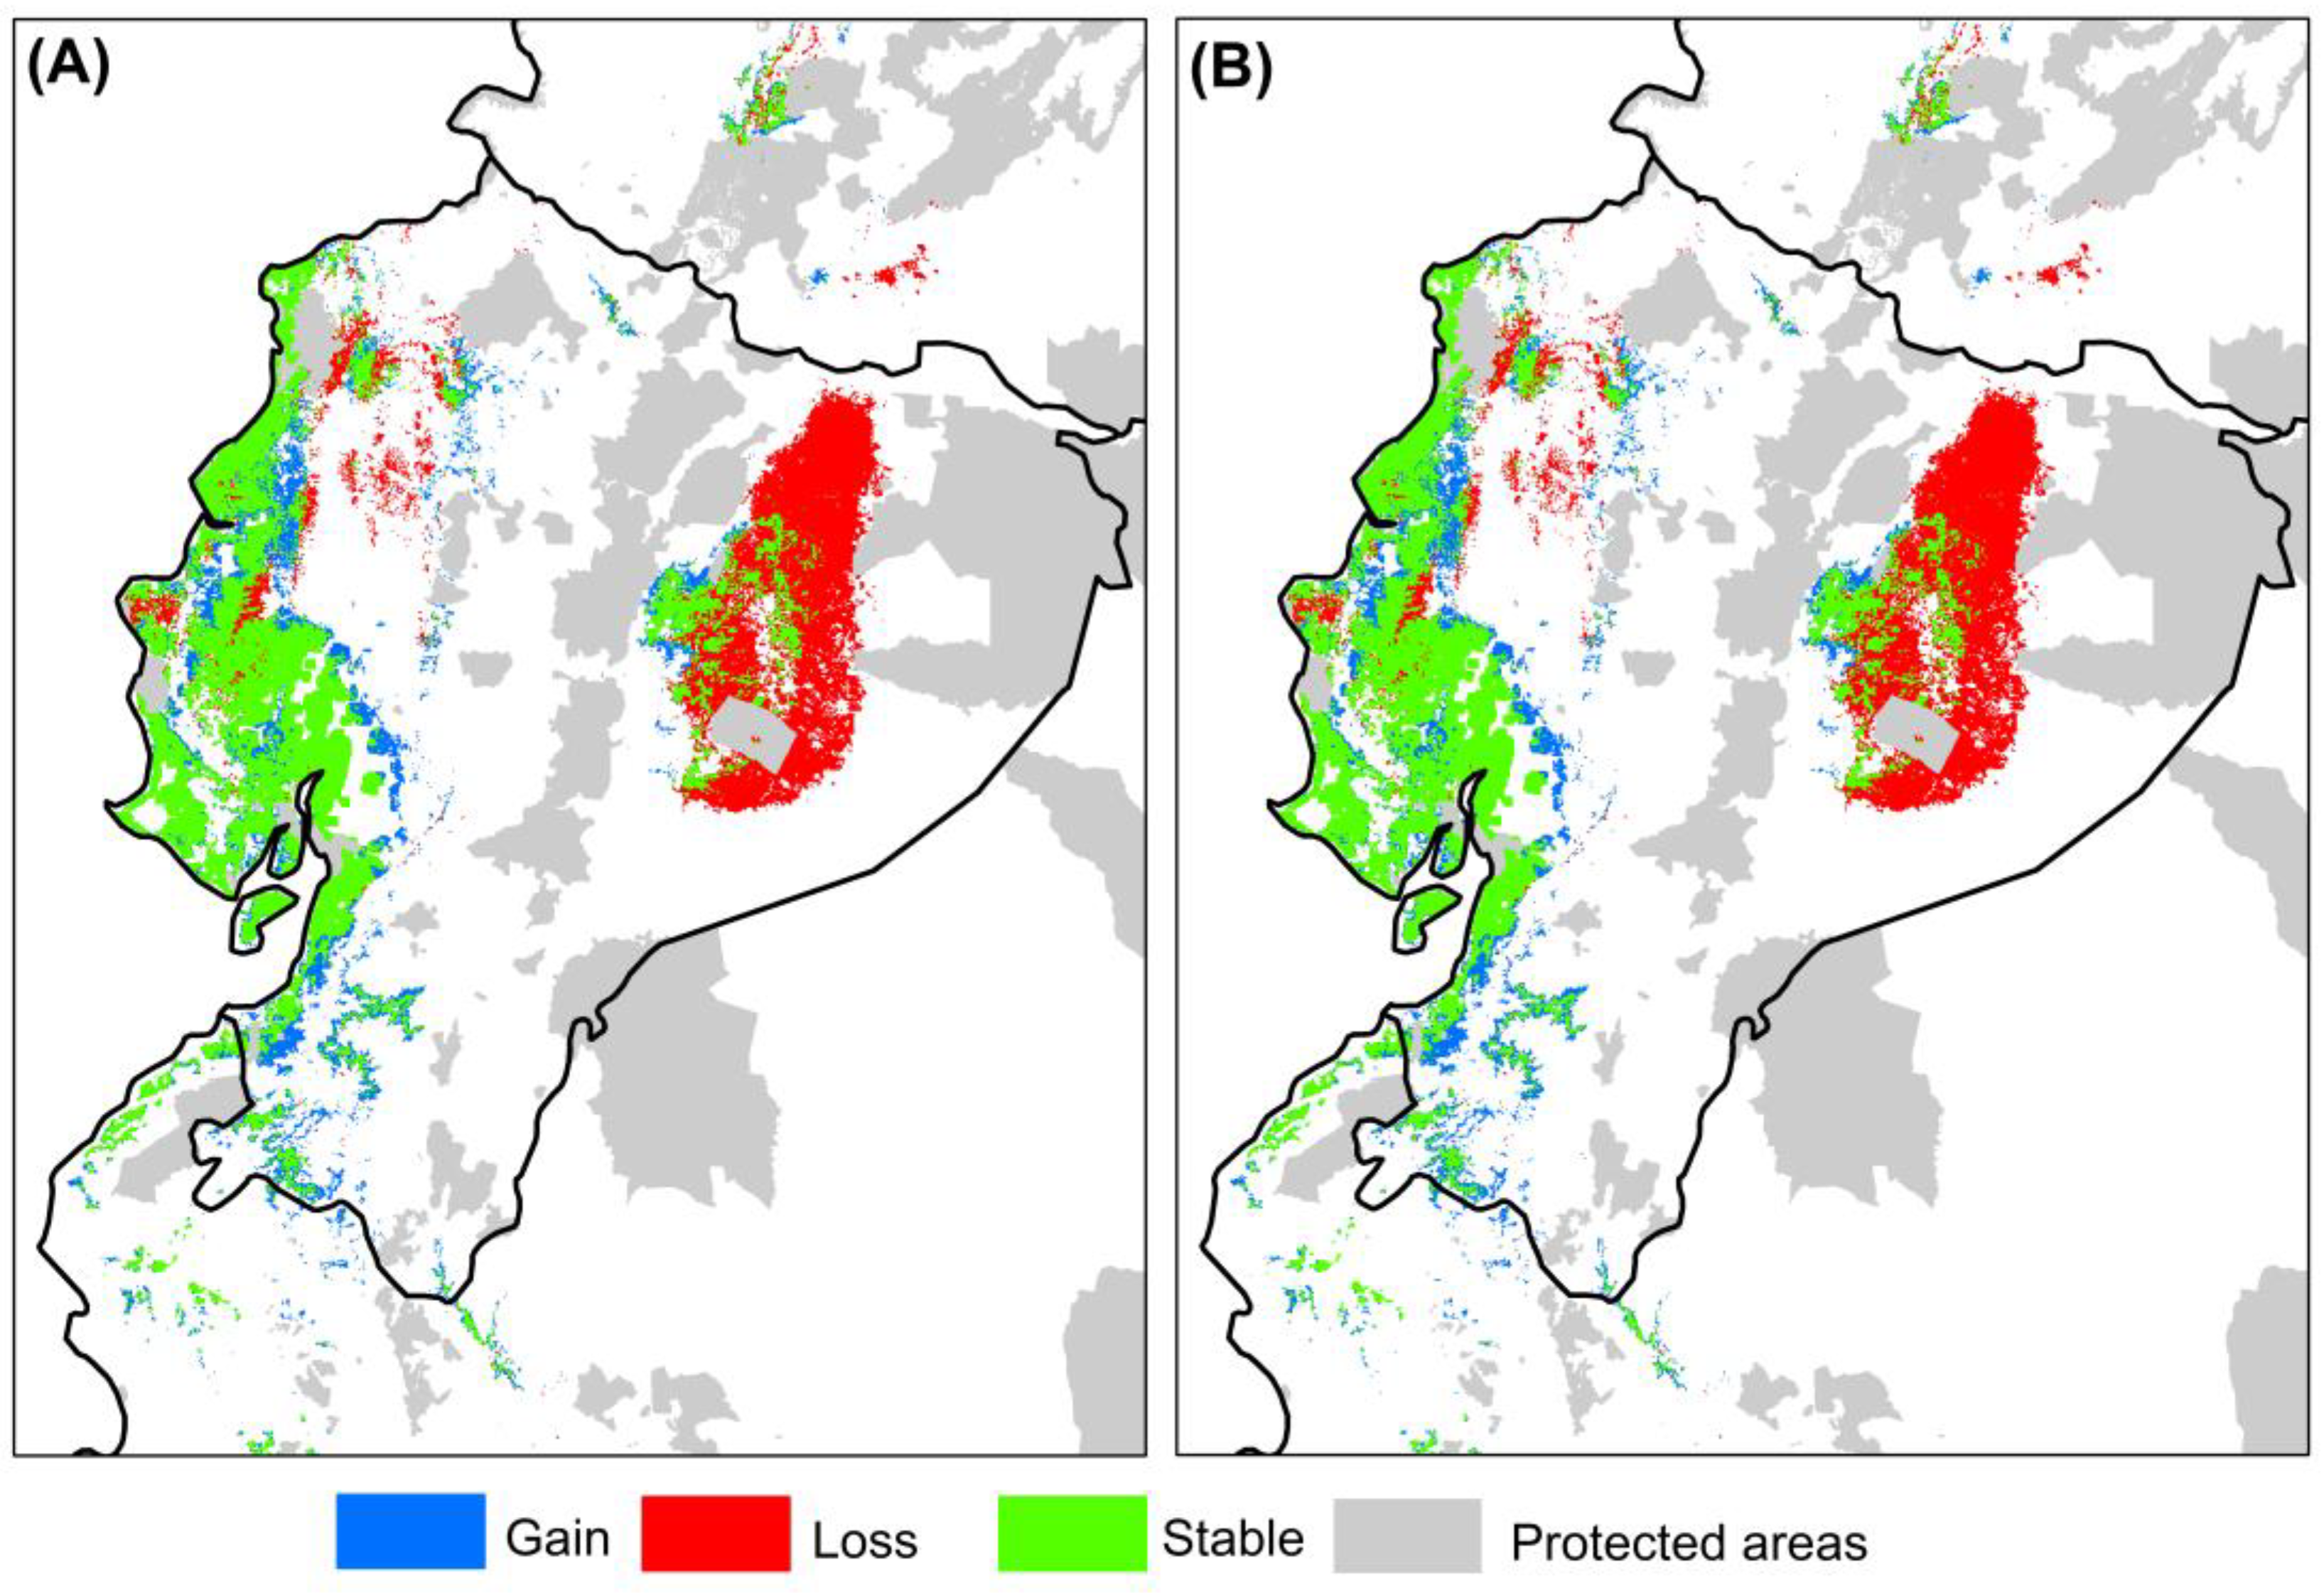
3.3. Possible Changes in the Environmentally Suitable Areas Predicted by Future Mahogany Models
3.4. Representativeness of Distribution Areas of Mahogany in the Network of Protected Areas
4. Discussion
4.1. Predictive Performance and Strengths of the Models
4.2. Model Limitations
4.3. Current Potential Distribution of Mahogany
4.4. Changes in the Potential Geographic Distribution of Mahogany in the Future
4.5. Representativeness of the Potential Distribution of Mahogany in the Network of Protected Areas
4.6. Considerations for Current and Future Monitoring of Mahogany Populations
Supplementary Materials
Author Contributions
Funding
Institutional Review Board Statement
Informed Consent Statement
Data Availability Statement
Acknowledgments
Conflicts of Interest
References
- Raven, P.H.; Gereau, R.E.; Phillipson, P.B.; Chatelain, C.; Jenkins, C.N.; Ulloa Ulloa, C. The distribution of biodiversity richness in the tropics. Sci. Adv. 2020, 6, eabc6228. [Google Scholar] [CrossRef]
- Ulloa Ulloa, C.; Acevedo-Rodríguez, P.; Beck, S.; Belgrano, M.J.; Bernal, R.; Berry, P.E.; Brako, L.; Celis, M.; Davidse, G.; Forzza, R.C. An integrated assessment of the vascular plant species of the Americas. Science 2017, 358, 1614–1617. [Google Scholar] [CrossRef] [PubMed]
- Ter Steege, H.; Prado, P.I.; de Lima, R.A.F.; Pos, E.; de Souza Coelho, L.; de Andrade Lima Filho, D.; Salomão, R.P.; Amaral, I.L.; de Almeida Matos, F.D.; Castilho, C.V. Biased-corrected richness estimates for the Amazonian tree flora. Sci. Rep. 2020, 10, 10130. [Google Scholar] [CrossRef]
- Koch, A.; Kaplan, J.O. Tropical forest restoration under future climate change. Nat. Clim. Chang. 2022, 12, 279–283. [Google Scholar] [CrossRef]
- Da Rosa, C.M.; Marques, M.C.M. How are biodiversity and carbon stock recovered during tropical forest restoration? Supporting the ecological paradigms and political context involved. J. Nat. Conserv. 2021, 65, 126115. [Google Scholar] [CrossRef]
- Valipour, M.; Bateni, S.M.; Jun, C. Global surface temperature: A new insight. Climate 2021, 9, 81. [Google Scholar] [CrossRef]
- Zu, K.; Wang, Z.; Zhu, X.; Lenoir, J.; Shrestha, N.; Lyu, T.; Luo, A.; Li, Y.; Ji, C.; Peng, S. Upward shift and elevational range contractions of subtropical mountain plants in response to climate change. Sci. Total Environ. 2021, 783, 146896. [Google Scholar] [CrossRef]
- Ramírez-Barahona, S.; Cuervo-Robayo, Á.P.; Feeley, K.; Ortiz-Rodríguez, A.; Vásquez-Aguilar, A.; Ornelas, J.F.; Rodríquez-Correa, H. Climate change and deforestation drive the displacement and contraction of tropical montane cloud forests. Biol. Sci. 2021. [Google Scholar] [CrossRef]
- Morueta-Holme, N.; Engemann, K.; Sandoval-Acuña, P.; Jonas, J.D.; Segnitz, R.M.; Svenning, J.-C. Strong upslope shifts in Chimborazo’s vegetation over two centuries since Humboldt. Proc. Natl. Acad. Sci. USA 2015, 112, 12741–12745. [Google Scholar] [CrossRef]
- Habel, J.C.; Rasche, L.; Schneider, U.A.; Engler, J.O.; Schmid, E.; Rödder, D.; Meyer, S.T.; Trapp, N.; Sos del Diego, R.; Eggermont, H. Final countdown for biodiversity hotspots. Conserv. Lett. 2019, 12, e12668. [Google Scholar] [CrossRef] [Green Version]
- Trew, B.T.; Maclean, I.M.D. Vulnerability of global biodiversity hotspots to climate change. Glob. Ecol. Biogeogr. 2021, 30, 768–783. [Google Scholar] [CrossRef]
- FAO. UN Global Forest Resources Assessment 2020: Key Findings. 2020. Available online: https://www.fao.org/forest-resources-assessment/en/ (accessed on 28 January 2023).
- Khaine, I.; Woo, S.Y. An overview of interrelationship between climate change and forests. Forest Sci. Technol. 2015, 11, 11–18. [Google Scholar] [CrossRef]
- Allen, K.; Dupuy, J.M.; Gei, M.G.; Hulshof, C.; Medvigy, D.; Pizano, C.; Salgado-Negret, B.; Smith, C.M.; Trierweiler, A.; Van Bloem, S.J.; et al. Will seasonally dry tropical forests be sensitive or resistant to future changes in rainfall regimes? Environ. Res. Lett. 2017, 12, 23001. [Google Scholar] [CrossRef]
- Myster, R.W. Effects of selective-logging, litter and tree species on forests in the Peruvian Amazon: Seed predation, seed pathogens, germination. New Zeal. J. For. Sci. 2021, 51. [Google Scholar] [CrossRef]
- Whitman, A.A.; Brokaw, N.V.L.; Hagan, J.M. Forest damage caused by selection logging of mahogany (Swietenia macrophylla) in northern Belize. For. Ecol. Manage. 1997, 92, 87–96. [Google Scholar] [CrossRef]
- Gillies, A.C.M.; Navarro, C.; Lowe, A.J.; Newton, A.C.; Hernandez, M.; Wilson, J.; Cornelius, J.P. Genetic diversity in Mesoamerican populations of mahogany (Swietenia macrophylla), assessed using RAPDs. Heredity 1999, 83, 722–732. [Google Scholar] [CrossRef]
- Krisnawati, H.; Kallio, M.H.; Kanninen, M. Swietenia macrophylla King: Ecology, Silviculture and Productivity; CIFOR: Bogor, Indonesia, 2011; ISBN 6028693391. [Google Scholar]
- Telrandhe, U.B.; Kosalge, S.B.; Parihar, S.; Sharma, D.; Hemalatha, S. Collection and Cultivation of Swietenia macrophylla King. Sch. Acad. J. Pharm. 2022, 1, 13–19. [Google Scholar] [CrossRef]
- Mahendra, C.K.; Goh, K.W.; Ming, L.C.; Zengin, G.; Low, L.E.; Ser, H.-L.; Goh, B.H. The Prospects of Swietenia macrophylla King in Skin Care. Antioxidants 2022, 11, 913. [Google Scholar] [CrossRef]
- Wang, G.-K.; Sun, Y.-P.; Jin, W.-F.; Yu, Y.; Zhu, J.-Y.; Liu, J.-S. Limonoids from Swietenia macrophylla and their antitumor activities in A375 human malignant melanoma cells. Bioorg. Chem. 2022, 123, 105780. [Google Scholar] [CrossRef]
- Yudhani, R.D.; Nugrahaningsih, D.A.A.; Sholikhah, E.N.; Mustofa, M. The molecular mechanisms of hypoglycemic properties and safety profiles of Swietenia macrophylla seeds extract: A review. Open Access Maced. J. Med. Sci. 2021, 9, 370–388. [Google Scholar] [CrossRef]
- Grogan, J.; Landis, R.M.; Free, C.M.; Schulze, M.D.; Lentini, M.; Ashton, M.S. Big-leaf mahogany Swietenia macrophylla population dynamics and implications for sustainable management. J. Appl. Ecol. 2014, 51, 664–674. [Google Scholar] [CrossRef]
- Jhou, H.C.; Wang, Y.N.; Wu, C.S.; Yu, J.C.; Chen, C.I. Photosynthetic gas exchange responses of Swietenia macrophylla King and Melia azedarach L. plantations under drought conditions. Bot. Stud. 2017, 58, 57. [Google Scholar] [CrossRef]
- Urrunaga, A.; Orbegozo, I.; Mulligan, F.J.J. La Máquina Lavadora: Cómo el Fraude y la Corrupción en el Sistema de Concesiones Están Destruyendo el Futuro de los Bosques del Perú; Environmental Investigation Agency (EIA): London, UK, 2012; Volume 1. [Google Scholar]
- Garza-López, M.; Ortega-Rodríguez, J.M.; Zamudio-Sánchez, F.J.; López-Toledo, J.F.; Domínguez-Álvarez, F.A.; Sáenz-Romero, C. Calakmul como refugio de Swietenia macrophylla King ante el cambio climático. Bot. Sci. 2016, 94, 43–50. [Google Scholar] [CrossRef]
- De Oliveira, S.S.; Campos, T.; Sebbenn, A.M.; d’Oliveira, M.V.N. Using spatial genetic structure of a population of Swietenia macrophylla King to integrate genetic diversity into management strategies in Southwestern Amazon. For. Ecol. Manage. 2020, 464, 118040. [Google Scholar] [CrossRef]
- Chuquizuta, P.D.; Rodríguez, O.A.V. Crecimiento de plántulas de caoba (Swietenia macrophylla King) en respuesta a extractos vegetales. Agrociencia 2020, 54, 673–681. [Google Scholar] [CrossRef]
- Sampayo-Maldonado, S.; Ordoñez-Salanueva, C.A.; Mattana, E.; Way, M.; Castillo-Lorenzo, E.; Dávila-Aranda, P.D.; Lira-Saade, R.; Téllez-Valdés, O.; Rodriguez-Arevalo, N.I.; Ulian, T. Thermal Niche for Seed Germination and Species Distribution Modelling of Swietenia macrophylla King (Mahogany) under Climate Change Scenarios. Plants 2021, 10, 2377. [Google Scholar] [CrossRef]
- Darko, C.B.; Opuni-Frimpong, E.; Owusu, S.A.; Kyere, B.; Storer, A.J. Sustainability of Mahogany Production in Plantations: Does Resource Availability Influence Susceptibility of Young Mahogany Plantation Stands to Hypsipyla robusta Infestation? Int. J. For. Res. 2022, 2022, 5588184. [Google Scholar] [CrossRef]
- Donald, L.G.; Pete, B.; Jacek, P.S.; Kevin, B. Chapter 2—Forest regions of the world. In Introduction to Forestry and Natural Resources; Academic Press: Cambridge, MA, USA, 2022; pp. 21–79. [Google Scholar] [CrossRef]
- Grogan, J.; Loveless, M.D. Flowering phenology and its implications for management of big-leaf mahogany Swietenia macrophylla in Brazilian Amazonia. Am. J. Bot. 2013, 100, 2293–2305. [Google Scholar] [CrossRef] [PubMed]
- Grogan, J.; Barreto, P. Big-leaf mahogany on CITES Appendix II: Big challenge, big opportunity. Conserv. Biol. 2005, 19, 973–976. [Google Scholar]
- Urzedo, D.; Westerlaken, M.; Gabrys, J. Digitalizing forest landscape restoration: A social and political analysis of emerging technological practices. Environ. Polit. 2022, 1–26. [Google Scholar] [CrossRef]
- Indrajaya, Y.; Yuwati, T.W.; Lestari, S.; Winarno, B.; Narendra, B.H.; Nugroho, H.Y.S.H.; Rachmanadi, D.; Turjaman, M.; Adi, R.N.; Savitri, E. Tropical Forest Landscape Restoration in Indonesia: A Review. Land 2022, 11, 328. [Google Scholar] [CrossRef]
- Jones, G.M.; Keyser, A.R.; Westerling, A.L.; Baldwin, W.J.; Keane, J.J.; Sawyer, S.C.; Clare, J.D.J.; Gutiérrez, R.J.; Peery, M.Z. Forest restoration limits megafires and supports species conservation under climate change. Front. Ecol. Environ. 2022, 20, 210–216. [Google Scholar] [CrossRef]
- Prieto, P.V.; Bukoski, J.J.; Barros, F.S.M.; Beyer, H.L.; Iribarrem, A.; Brancalion, P.H.S.; Chazdon, R.L.; Lindenmayer, D.B.; Strassburg, B.B.N.; Guariguata, M.R. Predicting landscape-scale biodiversity recovery by natural tropical forest regrowth. Conserv. Biol. 2022, 36, e13842. [Google Scholar] [CrossRef]
- Adiwinata, A.; Wicaksono, S.A.; Ichsan, A.C.; Yumn, A.; Goib, B.K.; Muslimah, S.; Susanti, F.N.; Purwanto, E. A Policy Framework to Facilitate Integrated Forest Landscape Restoration (FLR) to Enhance Local Livelihoods in Indonesia; CIFOR: Bogor, Indonesia, 2022. [Google Scholar]
- Erbaugh, J.T.; Oldekop, J.A. Forest landscape restoration for livelihoods and well-being. Curr. Opin. Environ. Sustain. 2018, 32, 76–83. [Google Scholar] [CrossRef]
- Verdone, M.; Seidl, A. Time, space, place, and the Bonn Challenge global forest restoration target. Restor. Ecol. 2017, 25, 903–911. [Google Scholar] [CrossRef]
- ONU Decenio de las Naciones Unidas Sobre la Restauración de los Ecosistemas. Available online: https://www.decadeonrestoration.org/es (accessed on 28 January 2023).
- Stanturf, J.A. Forest landscape restoration: Building on the past for future success. Restor. Ecol. 2021, 29, e13349. [Google Scholar] [CrossRef]
- Romijn, E.; Coppus, R.; De Sy, V.; Herold, M.; Roman-Cuesta, R.M.; Verchot, L. Land restoration in Latin America and the Caribbean: An overview of recent, ongoing and planned restoration initiatives and their potential for climate change mitigation. Forests 2019, 10, 510. [Google Scholar] [CrossRef]
- Di Sacco, A.; Hardwick, K.A.; Blakesley, D.; Brancalion, P.H.S.; Breman, E.; Cecilio Rebola, L.; Chomba, S.; Dixon, K.; Elliott, S.; Ruyonga, G. Ten golden rules for reforestation to optimize carbon sequestration, biodiversity recovery and livelihood benefits. Glob. Chang. Biol. 2021, 27, 1328–1348. [Google Scholar] [CrossRef]
- Mori, A.S.; Dee, L.E.; Gonzalez, A.; Ohashi, H.; Cowles, J.; Wright, A.J.; Loreau, M.; Hautier, Y.; Newbold, T.; Reich, P.B.; et al. Biodiversity–productivity relationships are key to nature-based climate solutions. Nat. Clim. Chang. 2021, 11, 543–550. [Google Scholar] [CrossRef]
- Bauman, D.; Fortunel, C.; Delhaye, G.; Malhi, Y.; Cernusak, L.A.; Bentley, L.P.; Rifai, S.W.; Aguirre-Gutiérrez, J.; Menor, I.O.; Phillips, O.L. Tropical tree mortality has increased with rising atmospheric water stress. Nature 2022, 608, 528–533. [Google Scholar] [CrossRef]
- Zheng, W.; Liu, Y.; Yang, X.; Fan, W. Spatiotemporal Variations of Forest Vegetation Phenology and Its Response to Climate Change in Northeast China. Remote Sens. 2022, 14, 2909. [Google Scholar] [CrossRef]
- Shahid, M.; Pinelli, E.; Dumat, C. Tracing trends in plant physiology and biochemistry: Need of databases from genetic to kingdom level. Plant Physiol. Biochem. 2018, 127, 630–635. [Google Scholar] [CrossRef]
- Boisvert-Marsh, L.; de Blois, S. Unravelling potential northward migration pathways for tree species under climate change. J. Biogeogr. 2021, 48, 1088–1100. [Google Scholar] [CrossRef]
- Nic Lughadha, E.; Bachman, S.P.; Leão, T.C.C.; Forest, F.; Halley, J.M.; Moat, J.; Acedo, C.; Bacon, K.L.; Brewer, R.F.A.; Gâteblé, G. Extinction risk and threats to plants and fungi. Plants People Planet 2020, 2, 389–408. [Google Scholar] [CrossRef]
- Haevermans, T.; Tressou, J.; Kwon, J.; Pellens, R.; Dubéarnès, A.; Veron, S.; Bel, L.; Dervaux, S.; Dibie-Barthelemy, J.; Gaudeul, M. Global Plant Extinction Risk Assessment Informs Novel Biodiversity Hotspots. bioRxiv 2021. [Google Scholar] [CrossRef]
- Antonelli, A.; Smith, R.J.; Fry, C.; Simmonds, M.S.J.; Kersey, P.J.; Pritchard, H.W.; Abbo, M.S.; Acedo, C.; Adams, J.; Ainsworth, A.M. State of the World’s Plants and Fungi. 2020. Available online: https://www.kew.org/science (accessed on 28 January 2023).
- Cowie, R.H.; Bouchet, P.; Fontaine, B. The Sixth Mass Extinction: Fact, fiction or speculation? Biol. Rev. 2022, 97, 640–663. [Google Scholar] [CrossRef]
- Littlefield, C.E.; Krosby, M.; Michalak, J.L.; Lawler, J.J. Connectivity for species on the move: Supporting climate-driven range shifts. Front. Ecol. Environ. 2019, 17, 270–278. [Google Scholar] [CrossRef]
- Aavik, T.; Helm, A. Restoration of plant species and genetic diversity depends on landscape-scale dispersal. Restor. Ecol. 2018, 26, S92–S102. [Google Scholar] [CrossRef]
- Camargo, P.H.S.A.; Pizo, M.A.; Brancalion, P.H.S.; Carlo, T.A. Fruit traits of pioneer trees structure seed dispersal across distances on tropical deforested landscapes: Implications for restoration. J. Appl. Ecol. 2020, 57, 2329–2339. [Google Scholar] [CrossRef]
- Liang, Y.; Duveneck, M.J.; Gustafson, E.J.; Serra-Diaz, J.M.; Thompson, J.R. How disturbance, competition, and dispersal interact to prevent tree range boundaries from keeping pace with climate change. Glob. Chang. Biol. 2018, 24, e335–e351. [Google Scholar] [CrossRef]
- Sajjad, H.; Kumar, P.; Masroor, M.; Rahaman, M.H.; Rehman, S.; Ahmed, R.; Sahana, M. Forest Vulnerability to Climate Change: A Review for Future Research Framework. Forests 2022, 13, 917. [Google Scholar]
- Barragán, G.; Wang, T.; Rhemtulla, J.M. Trees planted under a global restoration pledge have mixed futures under climate change. Restor. Ecol. 2022, e13764. [Google Scholar] [CrossRef]
- Pecl, G.T.; Araújo, M.B.; Bell, J.D.; Blanchard, J.; Bonebrake, T.C.; Chen, I.-C.; Clark, T.D.; Colwell, R.K.; Danielsen, F.; Evengård, B. Biodiversity redistribution under climate change: Impacts on ecosystems and human well-being. Science 2017, 355, eaai9214. [Google Scholar] [CrossRef]
- Sverdrup-Thygeson, A.; Skarpaas, O.; Blumentrath, S.; Birkemoe, T.; Evju, M. Habitat connectivity affects specialist species richness more than generalists in veteran trees. For. Ecol. Manag. 2017, 403, 96–102. [Google Scholar] [CrossRef]
- Davis, M.A.; Chew, M.K.; Hobbs, R.J.; Lugo, A.E.; Ewel, J.J.; Vermeij, G.J.; Brown, J.H.; Rosenzweig, M.L.; Gardener, M.R.; Carroll, S.P. Don’t judge species on their origins. Nature 2011, 474, 153–154. [Google Scholar] [CrossRef] [PubMed]
- Brancalion, P.H.S.; Amazonas, N.T.; Chazdon, R.L.; van Melis, J.; Rodrigues, R.R.; Silva, C.C.; Sorrini, T.B.; Holl, K.D. Exotic eucalypts: From demonized trees to allies of tropical forest restoration? J. Appl. Ecol. 2020, 57, 55–66. [Google Scholar] [CrossRef]
- Weidlich, E.W.A.; Flórido, F.G.; Sorrini, T.B.; Brancalion, P.H.S. Controlling invasive plant species in ecological restoration: A global review. J. Appl. Ecol. 2020, 57, 1806–1817. [Google Scholar] [CrossRef]
- Lewis, S.L.; Wheeler, C.E.; Mitchard, E.T.A.; Koch, A. Restoring natural forests is the best way to remove atmospheric carbon. Nature 2019, 568, 25–28. [Google Scholar] [CrossRef]
- Clark, J.S.; Bell, D.M.; Hersh, M.H.; Nichols, L. Climate change vulnerability of forest biodiversity: Climate and competition tracking of demographic rates. Glob. Chang. Biol. 2011, 17, 1834–1849. [Google Scholar] [CrossRef]
- Pyšek, P.; Hulme, P.E.; Simberloff, D.; Bacher, S.; Blackburn, T.M.; Carlton, J.T.; Dawson, W.; Essl, F.; Foxcroft, L.C.; Genovesi, P. Scientists’ warning on invasive alien species. Biol. Rev. 2020, 95, 1511–1534. [Google Scholar] [CrossRef]
- Seebens, H.; Bacher, S.; Blackburn, T.M.; Capinha, C.; Dawson, W.; Dullinger, S.; Genovesi, P.; Hulme, P.E.; van Kleunen, M.; Kühn, I. Projecting the continental accumulation of alien species through to 2050. Glob. Chang. Biol. 2021, 27, 970–982. [Google Scholar] [CrossRef]
- Cuthbert, R.N.; Diagne, C.; Hudgins, E.J.; Turbelin, A.; Ahmed, D.A.; Albert, C.; Bodey, T.W.; Briski, E.; Essl, F.; Haubrock, P.J. Biological invasion costs reveal insufficient proactive management worldwide. Sci. Total Environ. 2022, 819, 153404. [Google Scholar] [CrossRef] [PubMed]
- Gann, G.D.; McDonald, T.; Walder, B.; Aronson, J.; Nelson, C.R.; Jonson, J.; Hallett, J.G.; Eisenberg, C.; Guariguata, M.R.; Liu, J. International principles and standards for the practice of ecological restoration. Restor. Ecol. 2019, 27, S1–S46. [Google Scholar] [CrossRef]
- Horák, J.; Brestovanská, T.; Mladenović, S.; Kout, J.; Bogusch, P.; Halda, J.P.; Zasadil, P. Green desert?: Biodiversity patterns in forest plantations. For. Ecol. Manag. 2019, 433, 343–348. [Google Scholar] [CrossRef]
- Brancalion, P.H.S.; Bello, C.; Chazdon, R.L.; Galetti, M.; Jordano, P.; Lima, R.A.F.; Medina, A.; Pizo, M.A.; Reid, J.L. Maximizing biodiversity conservation and carbon stocking in restored tropical forests. Conserv. Lett. 2018, 11, e12454. [Google Scholar] [CrossRef]
- Guisan, A.; Thuiller, W.; Zimmermann, N.E. Habitat Suitability and Distribution Models: With Applications in R; Cambridge University Press: Cambridge, UK, 2017; ISBN 0521765137. [Google Scholar]
- Peterson, A.T.; Soberón, J.; Pearson, R.G.; Anderson, R.P.; Martínez-Meyer, E.; Nakamura, M.; Araújo, M.B. Ecological Niches and Geographic Distributions (MPB-49); Princeton University Press: Princeton, NJ, USA, 2011; ISBN 1400840678. [Google Scholar]
- Mateo, R.G.; Felicisimo, A.M.; Munoz, J. Species distributions models: A synthetic revision. Rev. Chil. Hist. Nat. 2011, 84, 217–240. [Google Scholar] [CrossRef]
- Sanczuk, P.; De Lombaerde, E.; Haesen, S.; Van Meerbeek, K.; Van der Veken, B.; Hermy, M.; Verheyen, K.; Vangansbeke, P.; De Frenne, P. Species distribution models and a 60-year-old transplant experiment reveal inhibited forest plant range shifts under climate change. J. Biogeogr. 2022, 49, 537–550. [Google Scholar] [CrossRef]
- Lima, V.P.; de Lima, R.A.F.; Joner, F.; Siddique, I.; Raes, N.; Ter Steege, H. Climate change threatens native potential agroforestry plant species in Brazil. Sci. Rep. 2022, 12, 2267. [Google Scholar] [CrossRef]
- Cotrina Sánchez, A.; Rojas Briceño, N.B.; Bandopadhyay, S.; Ghosh, S.; Torres Guzmán, C.; Oliva, M.; Guzman, B.K.; Salas López, R. Biogeographic Distribution of Cedrela spp. Genus in Peru Using MaxEnt Modeling: A Conservation and Restoration Approach. Diversity 2021, 13, 261. [Google Scholar] [CrossRef]
- Goicolea, T.; Mateo, R.G.; Aroca-Fernández, M.J.; Gastón, A.; García-Viñas, J.I.; Mateo-Sánchez, M.C. Considering plant functional connectivity in landscape conservation and restoration management. Biodivers. Conserv. 2022, 31, 1591–1608. [Google Scholar] [CrossRef]
- Gastón, A.; García-Viñas, J.I.; Bravo-Fernández, A.J.; López-Leiva, C.; Oliet, J.A.; Roig, S.; Serrada, R. Species distribution models applied to plant species selection in forest restoration: Are model predictions comparable to expert opinion? New For. 2014, 45, 641–653. [Google Scholar] [CrossRef]
- Carrillo-García, C.; Girola-Iglesias, L.; Guijarro, M.; Hernando, C.; Madrigal, J.; Mateo, R.G. Ecological niche models applied to post-megafire vegetation restoration in the context of climate change. Sci. Total Environ. 2023, 855, 158858. [Google Scholar] [CrossRef]
- Ramírez-Magil, G.; Botello, F.; Navarro-Martínez, M.A. Idoneidad de hábitat para Swietenia macrophylla en escenarios de cambio climático en México. Madera Bosques 2020, 26, e2631954. [Google Scholar] [CrossRef]
- Navarro-Martínez, A.; Ellis, E.A.; Hernández-Gómez, I.; Romero-Montero, J.A.; Sánchez-Sánchez, O. Distribution and abundance of big-leaf mahogany (Swietenia macrophylla) on the Yucatan Peninsula, Mexico. Trop. Conserv. Sci. 2018, 11, 1940082918766875. [Google Scholar] [CrossRef]
- Silva, M.C. Da Modelo de Distribuição de Nicho Ecológico Para Swietenia macrophylla King na Amazônia Brasileira. 2020. Available online: http://repositorio.ufra.edu.br/jspui/handle/123456789/1112 (accessed on 28 January 2023).
- Milagres, V.A.C.; Machado, E.L.M. Potential distribution modeling of useful Brazilian trees with economic importance. J. Agric. Sci. Technol. 2016, 6, 400–410. [Google Scholar]
- Sillero, N.; Barbosa, A.M. Common mistakes in ecological niche models. Int. J. Geogr. Inf. Sci. 2021, 35, 213–226. [Google Scholar] [CrossRef]
- Carretero, M.A.; Sillero, N. Evaluating how species niche modelling is affected by partial distributions with an empirical case. Acta Oecologica 2016, 77, 207–216. [Google Scholar] [CrossRef]
- Petitpierre, B.; McDougall, K.; Seipel, T.; Broennimann, O.; Guisan, A.; Kueffer, C. Will climate change increase the risk of plant invasions into mountains? Ecol. Appl. 2016, 26, 530–544. [Google Scholar] [CrossRef]
- Mateo, R.G.; Gaston, A.; Aroca-Fernández, M.J.; Broennimann, O.; Guisan, A.; Saura, S.; García-Viñas, J.I. Hierarchical species distribution models in support of vegetation conservation at the landscape scale. J. Veg. Sci. 2019, 30, 386–396. [Google Scholar] [CrossRef]
- Chevalier, M.; Zarzo-Arias, A.; Guélat, J.; Mateo, R.G.; Guisan, A. Accounting for niche truncation to improve spatial and temporal predictions of species distributions. Front. Ecol. Evol. 2022, 10, 760. [Google Scholar] [CrossRef]
- Mendes, P.; Velazco, S.J.E.; de Andrade, A.F.A.; Júnior, P.D.M. Dealing with overprediction in species distribution models: How adding distance constraints can improve model accuracy. Ecol. Modell. 2020, 431, 109180. [Google Scholar] [CrossRef]
- Velazco, S.J.E.; Ribeiro, B.R.; Laureto, L.M.O.; Júnior, P.D.M. Overprediction of species distribution models in conservation planning: A still neglected issue with strong effects. Biol. Conserv. 2020, 252, 108822. [Google Scholar] [CrossRef]
- Noroozi, J.; Talebi, A.; Doostmohammadi, M.; Rumpf, S.B.; Linder, H.P.; Schneeweiss, G.M. Hotspots within a global biodiversity hotspot-areas of endemism are associated with high mountain ranges. Sci. Rep. 2018, 8, 10345. [Google Scholar] [CrossRef]
- Myers, N.; Mittermeier, R.A.; Mittermeier, C.G.; da Fonseca, G.A.B.; Kent, J. Biodiversity hotspots for conservation priorities. Nature 2000, 403, 853–858. [Google Scholar] [CrossRef]
- Fick, S.E.; Hijmans, R.J. WorldClim 2: New 1-km spatial resolution climate surfaces for global land areas. Int. J. Climatol. 2017, 37, 4302–4315. [Google Scholar] [CrossRef]
- Jarvis, A. Hole-Filed Seamless SRTM Data. 2008. Available online: http//srtm.csi.cgiar.org (accessed on 28 January 2023).
- Lemes, M.R.; Dick, C.W.; Navarro, C.; Lowe, A.J.; Cavers, S.; Gribel, R. Chloroplast DNA microsatellites reveal contrasting phylogeographic structure in mahogany (Swietenia macrophylla King, Meliaceae) from Amazonia and Central America. Trop. Plant Biol. 2010, 3, 40–49. [Google Scholar] [CrossRef]
- Wightman, K.E.; Ward, S.E.; Haggar, J.P.; Santiago, B.R.; Cornelius, J.P. Performance and genetic variation of big-leaf mahogany (Swietenia macrophylla King) in provenance and progeny trials in the Yucatan Peninsula of Mexico. For. Ecol. Manag. 2008, 255, 346–355. [Google Scholar] [CrossRef]
- Degen, B.; Ward, S.E.; Lemes, M.R.; Navarro, C.; Cavers, S.; Sebbenn, A.M. Verifying the geographic origin of mahogany (Swietenia macrophylla King) with DNA-fingerprints. Forensic Sci. Int. Genet. 2013, 7, 55–62. [Google Scholar] [CrossRef] [PubMed]
- Navarro, C.; Hernández, G. Progeny test analysis and population differentiation of mesoamerican mahogany (Swietenia macrophylla). Agron. Costarric. 2004, 28, 37–51. [Google Scholar]
- Andino, J.E.G.; Pitman, N.C.A.; Ulloa, C.U.; Romoleroux, K.; Fernández-Fernández, D.; Ceron, C.; Palacios, W.; Neill, D.A.; Oleas, N.; Altamirano, P.; et al. Trees of Amazonian Ecuador: A taxonomically verified species list with data on abundance and distribution. Ecology 2019, 100, e02894. [Google Scholar] [CrossRef]
- Owens, H.L.; Merow, C.; Maitner, B.S.; Kass, J.M.; Barve, V.; Guralnick, R.P. occCite: Tools for querying and managing large biodiversity occurrence datasets. Ecography 2021, 44, 1228–1235. [Google Scholar] [CrossRef]
- De Lima, R.A.F.; Sánchez-Tapia, A.; Mortara, S.R.; ter Steege, H.; de Siqueira, M.F. plantR: An R package and workflow for managing species records from biological collections. Methods Ecol. Evol. 2021, 14, 332–339. [Google Scholar] [CrossRef]
- Maitner, B.S.; Boyle, B.; Casler, N.; Condit, R.; Donoghue, J.; Durán, S.M.; Guaderrama, D.; Hinchliff, C.E.; Jørgensen, P.M.; Kraft, N.J.B. The bien r package: A tool to access the Botanical Information and Ecology Network (BIEN) database. Methods Ecol. Evol. 2018, 9, 373–379. [Google Scholar] [CrossRef] [Green Version]
- Michonneau, F.; Collins, M.; Chamberlain, S. Ridigbio: An Interface to iDigBio’s Search API That Allows Downloading Specimen Records. R Package Version 0.3.2. 2016. Available online: https://github.com/iDigBio/ridigbio (accessed on 28 January 2023).
- Albani Rocchetti, G.; Armstrong, C.G.; Abeli, T.; Orsenigo, S.; Jasper, C.; Joly, S.; Bruneau, A.; Zytaruk, M.; Vamosi, J.C. Reversing extinction trends: New uses of (old) herbarium specimens to accelerate conservation action on threatened species. New Phytol. 2021, 230, 433–450. [Google Scholar] [CrossRef]
- Lang, P.L.M.; Willems, F.M.; Scheepens, J.F.; Burbano, H.A.; Bossdorf, O. Using herbaria to study global environmental change. New Phytol. 2019, 221, 110–122. [Google Scholar] [CrossRef]
- Nic Lughadha, E.; Walker, B.E.; Canteiro, C.; Chadburn, H.; Davis, A.P.; Hargreaves, S.; Lucas, E.J.; Schuiteman, A.; Williams, E.; Bachman, S.P. The use and misuse of herbarium specimens in evaluating plant extinction risks. Philos. Trans. R. Soc. B 2019, 374, 20170402. [Google Scholar] [CrossRef]
- Fei, S.; Yu, F. Quality of presence data determines species distribution model performance: A novel index to evaluate data quality. Landsc. Ecol. 2016, 31, 31–42. [Google Scholar] [CrossRef]
- Zurell, D.; Franklin, J.; König, C.; Bouchet, P.J.; Dormann, C.F.; Elith, J.; Fandos, G.; Feng, X.; Guillera-Arroita, G.; Guisan, A. A standard protocol for reporting species distribution models. Ecography 2020, 43, 1261–1277. [Google Scholar] [CrossRef]
- Sillero, N.; Arenas-Castro, S.; Enriquez-Urzelai, U.; Vale, C.G.; Sousa-Guedes, D.; Martínez-Freiría, F.; Real, R.; Barbosa, A.M. Want to model a species niche? A step-by-step guideline on correlative ecological niche modelling. Ecol. Modell. 2021, 456, 109671. [Google Scholar] [CrossRef]
- Boakes, E.H.; McGowan, P.J.K.; Fuller, R.A.; Chang-qing, D.; Clark, N.E.; O’Connor, K.; Mace, G.M. Distorted views of biodiversity: Spatial and temporal bias in species occurrence data. PLoS Biol. 2010, 8, e1000385. [Google Scholar] [CrossRef]
- Baker, D.J.; Maclean, I.M.D.; Goodall, M.; Gaston, K.J. Correlations between spatial sampling biases and environmental niches affect species distribution models. Glob. Ecol. Biogeogr. 2022, 31, 1038–1050. [Google Scholar] [CrossRef]
- Aiello-Lammens, M.E.; Boria, R.A.; Radosavljevic, A.; Vilela, B.; Anderson, R.P. spThin: An R package for spatial thinning of species occurrence records for use in ecological niche models. Ecography 2015, 38, 541–545. [Google Scholar] [CrossRef]
- Töpel, M.; Zizka, A.; Calió, M.F.; Scharn, R.; Silvestro, D.; Antonelli, A. SpeciesGeoCoder: Fast categorization of species occurrences for analyses of biodiversity, biogeography, ecology, and evolution. Syst. Biol. 2017, 66, 145–151. [Google Scholar] [CrossRef] [Green Version]
- Eyring, V.; Bony, S.; Meehl, G.A.; Senior, C.A.; Stevens, B.; Stouffer, R.J.; Taylor, K.E. Overview of the Coupled Model Intercomparison Project Phase 6 (CMIP6) experimental design and organization. Geosci. Model Dev. 2016, 9, 1937–1958. [Google Scholar] [CrossRef]
- Yukimoto, S.; Kawai, H.; Koshiro, T.; Oshima, N.; Yoshida, K.; Urakawa, S.; Tsujino, H.; Deushi, M.; Tanaka, T.; Hosaka, M. The Meteorological Research Institute Earth System Model version 2.0, MRI-ESM2. 0: Description and basic evaluation of the physical component. J. Meteorol. Soc. Japan. Ser. II 2019, 97, 931–965. [Google Scholar] [CrossRef]
- Tatebe, H.; Ogura, T.; Nitta, T.; Komuro, Y.; Ogochi, K.; Takemura, T.; Sudo, K.; Sekiguchi, M.; Abe, M.; Saito, F. Description and basic evaluation of simulated mean state, internal variability, and climate sensitivity in MIROC6. Geosci. Model Dev. 2019, 12, 2727–2765. [Google Scholar] [CrossRef]
- Thuiller, W.; Guéguen, M.; Renaud, J.; Karger, D.N.; Zimmermann, N.E. Uncertainty in ensembles of global biodiversity scenarios. Nat. Commun. 2019, 10, 1446. [Google Scholar] [CrossRef]
- Neupane, N.; Zipkin, E.F.; Saunders, S.P.; Ries, L. Grappling with uncertainty in ecological projections: A case study using the migratory monarch butterfly. Ecosphere 2022, 13, e03874. [Google Scholar] [CrossRef]
- Poggio, L.; De Sousa, L.M.; Batjes, N.H.; Heuvelink, G.; Kempen, B.; Ribeiro, E.; Rossiter, D. SoilGrids 2.0: Producing soil information for the globe with quantified spatial uncertainty. Soil 2021, 7, 217–240. [Google Scholar] [CrossRef]
- Feng, X.; Park, D.S.; Liang, Y.; Pandey, R.; Papeş, M. Collinearity in ecological niche modeling: Confusions and challenges. Ecol. Evol. 2019, 9, 10365–10376. [Google Scholar] [CrossRef]
- Brun, P.; Thuiller, W.; Chauvier, Y.; Pellissier, L.; Wüest, R.O.; Wang, Z.; Zimmermann, N.E. Model complexity affects species distribution projections under climate change. J. Biogeogr. 2020, 47, 130–142. [Google Scholar] [CrossRef]
- Dormann, C.F.; Elith, J.; Bacher, S.; Buchmann, C.; Carl, G.; Carré, G.; Marquéz, J.R.G.; Gruber, B.; Lafourcade, B.; Leitão, P.J. Collinearity: A review of methods to deal with it and a simulation study evaluating their performance. Ecography 2013, 36, 27–46. [Google Scholar] [CrossRef]
- Araújo, M.B.; New, M. Ensemble forecasting of species distributions. Trends Ecol. Evol. 2007, 22, 42–47. [Google Scholar] [CrossRef]
- Thuiller, W.; Lafourcade, B.; Engler, R.; Araújo, M.B. BIOMOD—A platform for ensemble forecasting of species distributions. Ecography 2009, 32, 369–373. [Google Scholar] [CrossRef]
- Hastie, T.J.; Tibshirani, R.J. Generalized Additive Models; Routledge: London, UK, 2017; ISBN 020375378X. [Google Scholar]
- Friedman, J.H. Greedy function approximation: A gradient boosting machine. Ann. Stat. 2001, 29, 1189–1232. [Google Scholar] [CrossRef]
- Breiman, L. Random forests. Mach. Learn. 2001, 45, 5–32. [Google Scholar] [CrossRef]
- Shabani, F.; Kumar, L.; Ahmadi, M. Assessing accuracy methods of species distribution models: AUC, specificity, sensitivity and the true skill statistic. Glob. J. Hum. Soc. Sci. 2018, 18, 6–18. [Google Scholar]
- Marmion, M.; Parviainen, M.; Luoto, M.; Heikkinen, R.K.; Thuiller, W. Evaluation of consensus methods in predictive species distribution modelling. Divers. Distrib. 2009, 15, 59–69. [Google Scholar] [CrossRef]
- Peterson, A.T.; Papeş, M.; Soberón, J. Rethinking receiver operating characteristic analysis applications in ecological niche modeling. Ecol. Modell. 2008, 213, 63–72. [Google Scholar] [CrossRef]
- Allouche, O.; Tsoar, A.; Kadmon, R. Assessing the accuracy of species distribution models: Prevalence, kappa and the true skill statistic (TSS). J. Appl. Ecol. 2006, 43, 1223–1232. [Google Scholar] [CrossRef]
- Anderson, R.P.; Lew, D.; Peterson, A.T. Evaluating predictive models of species’ distributions: Criteria for selecting optimal models. Ecol. Modell. 2003, 162, 211–232. [Google Scholar] [CrossRef]
- Simoes, M.; Romero-Alvarez, D.; Nuñez-Penichet, C.; Jiménez, L.; Cobos, M.E. General theory and good practices in ecological niche modeling: A basic guide. Biodivers. Inform. 2020, 15, 67–68. [Google Scholar] [CrossRef]
- Scherrer, D.; D’Amen, M.; Fernandes, R.F.; Mateo, R.G.; Guisan, A. How to best threshold and validate stacked species assemblages? Community optimisation might hold the answer. Methods Ecol. Evol. 2018, 9, 2155–2166. [Google Scholar] [CrossRef]
- Watson, J.E.M.; Dudley, N.; Segan, D.B.; Hockings, M. The performance and potential of protected areas. Nature 2014, 515, 67–73. [Google Scholar] [CrossRef]
- Kearney, S.G.; Adams, V.M.; Fuller, R.A.; Possingham, H.P.; Watson, J.E.M. Estimating the benefit of well-managed protected areas for threatened species conservation. Oryx 2020, 54, 276–284. [Google Scholar] [CrossRef]
- Mestanza-Ramón, C.; Henkanaththegedara, S.M.; Vásconez Duchicela, P.; Vargas Tierras, Y.; Sánchez Capa, M.; Constante Mejía, D.; Jimenez Gutierrez, M.; Charco Guamán, M.; Mestanza Ramón, P. In-Situ and Ex-Situ Biodiversity Conservation in Ecuador: A Review of Policies, Actions and Challenges. Diversy 2020, 12, 315. [Google Scholar] [CrossRef]
- Araújo, M.B.; Anderson, R.P.; Barbosa, A.M.; Beale, C.M.; Dormann, C.F.; Early, R.; Garcia, R.A.; Guisan, A.; Maiorano, L.; Naimi, B. Standards for distribution models in biodiversity assessments. Sci. Adv. 2019, 5, eaat4858. [Google Scholar] [CrossRef] [PubMed]
- Dubos, N.; Préau, C.; Lenormand, M.; Papuga, G.; Montsarrat, S.; Denelle, P.; Le Louarn, M.; Heremans, S.; Roel, M.; Roche, P. Assessing the effect of sample bias correction in species distribution models. arXiv 2021, arXiv:2103.07107. [Google Scholar] [CrossRef]
- Hallgren, W.; Santana, F.; Low-Choy, S.; Zhao, Y.; Mackey, B. Species distribution models can be highly sensitive to algorithm configuration. Ecol. Modell. 2019, 408, 108719. [Google Scholar] [CrossRef]
- Urbina-Cardona, N.; Blair, M.E.; Londoño, M.C.; Loyola, R.; Velásquez-Tibatá, J.; Morales-Devia, H. Species distribution modeling in Latin America: A 25-year retrospective review. Trop. Conserv. Sci. 2019, 12, 1940082919854058. [Google Scholar] [CrossRef]
- Qiao, H.; Feng, X.; Escobar, L.E.; Peterson, A.T.; Soberón, J.; Zhu, G.; Papeş, M. An evaluation of transferability of ecological niche models. Ecography 2019, 42, 521–534. [Google Scholar] [CrossRef]
- Escobar, L.E.; Qiao, H.; Cabello, J.; Peterson, A.T. Ecological niche modeling re-examined: A case study with the Darwin’s fox. Ecol. Evol. 2018, 8, 4757–4770. [Google Scholar] [CrossRef] [PubMed]
- Hao, T.; Elith, J.; Guillera-Arroita, G.; Lahoz-Monfort, J.J. A review of evidence about use and performance of species distribution modelling ensembles like BIOMOD. Divers. Distrib. 2019, 25, 839–852. [Google Scholar] [CrossRef]
- Hao, T.; Elith, J.; Lahoz-Monfort, J.J.; Guillera-Arroita, G. Testing whether ensemble modelling is advantageous for maximising predictive performance of species distribution models. Ecography 2020, 43, 549–558. [Google Scholar] [CrossRef] [Green Version]
- Roe, N.A.; Ducey, M.J.; Lee, T.D.; Fraser, O.L.; Colter, R.A.; Hallett, R.A. Soil chemical variables improve models of understorey plant species distributions. J. Biogeogr. 2022, 49, 753–766. [Google Scholar] [CrossRef]
- Zuquim, G.; Costa, F.R.C.; Tuomisto, H.; Moulatlet, G.M.; Figueiredo, F.O.G. The importance of soils in predicting the future of plant habitat suitability in a tropical forest. Plant Soil 2020, 450, 151–170. [Google Scholar] [CrossRef]
- De Castro Oliveira, G.; Arruda, D.M.; Fernandes Filho, E.I.; Veloso, G.V.; Francelino, M.R.; Schaefer, C.E.G.R. Soil predictors are crucial for modelling vegetation distribution and its responses to climate change. Sci. Total Environ. 2021, 780, 146680. [Google Scholar] [CrossRef]
- Marcer, A.; Chapman, A.D.; Wieczorek, J.R.; Xavier Picó, F.; Uribe, F.; Waller, J.; Ariño, A.H. Uncertainty matters: Ascertaining where specimens in natural history collections come from and its implications for predicting species distributions. Ecography 2022, 2022, e06025. [Google Scholar] [CrossRef]
- Smith, A.B.; Murphy, S.J.; Henderson, D.; Erickson, K.D. Imprecisely georeferenced specimen data provide unique information on species’ distributions and environmental tolerances: Don’t let the perfect be the enemy of the good. bioRxiv 2021. [Google Scholar] [CrossRef]
- Hughes, A.C.; Orr, M.C.; Ma, K.; Costello, M.J.; Waller, J.; Provoost, P.; Yang, Q.; Zhu, C.; Qiao, H. Sampling biases shape our view of the natural world. Ecography 2021, 44, 1259–1269. [Google Scholar] [CrossRef]
- Iglesias, J.; Muñoz, L.; Santiana, J.; Chinchero, M.; Jiménez, D.; Palacios, W.; Jadán, A. Estudio Poblacional de Swietenia macrophylla King (Caoba/Ahuano) en la Provincia de Pastaza, Ecuador. In Proceedings of the XII Congreso Latinoamericano de Botánica, Quito, Ecuador, 21 October 2018; Volume 1. [Google Scholar]
- Pérez-Salicrup, D.R.; Esquivel, R. Tree infection by Hypsipyla grandella in Swietenia macrophylla and Cedrela odorata (Meliaceae) in Mexico’s southern Yucatan Peninsula. For. Ecol. Manag. 2008, 255, 324–327. [Google Scholar] [CrossRef]
- Pinto, R.C.; Pinheiro, C.; Vidal, E.; Schwartz, G. Technical and financial evaluation of enrichment planting in logging gaps with the high-value species Swietenia macrophylla and Handroanthus serratifolius in the Eastern Amazon. For. Ecol. Manag. 2021, 495, 119380. [Google Scholar] [CrossRef]
- De Castro, M.T.; Montalvão, S.C.L.; Monnerat, R.G. Breeding and biology of Hypsipyla grandella Zeller (Lepidoptera: Pyralidae) fed with mahogany seeds (Swietenia macrophylla King). J. Asia. Pac. Entomol. 2016, 19, 217–221. [Google Scholar] [CrossRef]
- Lunz, A.M.; Thomazini, M.J.T.; Moraes, M.C.B.; Neves, E.J.M.; Batista, T.F.C.; Degenhardt, J.; de Sousa, L.A.; Ohashi, O.S. Hypsipyla grandella em mogno (Swietenia macrophylla): Situação atual e perspectivas. Pesqui. Florest. Bras. 2009, 45. [Google Scholar] [CrossRef] [Green Version]
- Bebber, D.P.; Gurr, S.J. Biotic interactions and climate in species distribution modelling. BioRxiv 2019, 520320. [Google Scholar] [CrossRef]
- Dormann, C.F.; Bobrowski, M.; Dehling, D.M.; Harris, D.J.; Hartig, F.; Lischke, H.; Moretti, M.D.; Pagel, J.; Pinkert, S.; Schleuning, M. Biotic interactions in species distribution modelling: 10 questions to guide interpretation and avoid false conclusions. Glob. Ecol. Biogeogr. 2018, 27, 1004–1016. [Google Scholar] [CrossRef]
- Oliveira, M.R.; Tomas, W.M.; Guedes, N.M.R.; Peterson, A.T.; Szabo, J.K.; Júnior, A.S.; Camilo, A.R.; Padovani, C.R.; Garcia, L.C. The relationship between scale and predictor variables in species distribution models applied to conservation. Biodivers. Conserv. 2021, 30, 1971–1990. [Google Scholar] [CrossRef]
- Ashraf, U.; Chaudhry, M.N.; Peterson, A.T. Ecological niche models of biotic interactions predict increasing pest risk to olive cultivars with changing climate. Ecosphere 2021, 12, e03714. [Google Scholar] [CrossRef]
- Anderson, R.P. When and how should biotic interactions be considered in models of species niches and distributions? J. Biogeogr. 2017, 44, 8–17. [Google Scholar] [CrossRef]
- Gábor, L.; Šímová, P.; Keil, P.; Zarzo-Arias, A.; Marsh, C.J.; Rocchini, D.; Malavasi, M.; Barták, V.; Moudrý, V. Habitats as predictors in species distribution models: Shall we use continuous or binary data? Ecography 2022, 2022, e06022. [Google Scholar] [CrossRef]
- Merow, C.; Galante, P.J.; Kass, J.M.; Aiello-Lammens, M.E.; Babich Morrow, C.; Gerstner, B.E.; Grisales Betancur, V.; Moore, A.C.; Noguera-Urbano, E.A.; Pinilla-Buitrago, G.E. Operationalizing expert knowledge in species’ range estimates using diverse data types. Front. Biogeogr. 2022, 14, 2. [Google Scholar] [CrossRef]
- Navarro-Martínez, A.; Ramírez-Magil, G. Geographic Information Systems for Forest Species Distribution and Habitat Suitability. In GIS LATAM Conference; Springer: Berlin/Heidelberg, Germany, 2020; pp. 125–135. [Google Scholar]
- Garza López, M. El Centro de la Peninsula de Yucatán, México, Como Refugio de dos Especies Forestales Ante los Efectos del Cambio Climático. 2015. Available online: https://repositorio.chapingo.edu.mx/items/12260729-5098-46fd-ab05-0afe8954ac02 (accessed on 28 January 2023).
- Caballero, R.I.A. Nicho Ecológico y Variables Que Intervienen en el Desempeño de Swietenia en México. 2019. Available online: http://riaa.uaem.mx/xmlui/handle/20.500.12055/501 (accessed on 28 January 2023).
- Grogan, J.; Ashton, M.S.; Galvao, J. Big-leaf mahogany (Swietenia macrophylla) seedling survival and growth across a topographic gradient in southeast Pará, Brazil. For. Ecol. Manag. 2003, 186, 311–326. [Google Scholar] [CrossRef]
- Grogan, J.; Matthew Landis, R. Growth history and crown vine coverage are principal factors influencing growth and mortality rates of big-leaf mahogany Swietenia macrophylla in Brazil. J. Appl. Ecol. 2009, 46, 1283–1291. [Google Scholar] [CrossRef]
- Ruokolainen, K.; Moulatlet, G.M.; Zuquim, G.; Hoorn, C.; Tuomisto, H. Geologically recent rearrangements in central Amazonian river network and their importance for the riverine barrier hypothesis. Front. Biogeogr. 2019, 11, e45046. [Google Scholar] [CrossRef] [Green Version]
- Nazareno, A.G.; Dick, C.W.; Lohmann, L.G. A biogeographic barrier test reveals a strong genetic structure for a canopy-emergent Amazon tree species. Sci. Rep. 2019, 9, 18602. [Google Scholar] [CrossRef] [PubMed]
- Gullison, R.E.; Panfil, S.N.; Strouse, J.J.; Hubbell, S.P. Ecology and management of mahogany (Swietenia macrophylla King) in the Chimanes Forest, Beni, Bolivia. Bot. J. Linn. Soc. 1996, 122, 9–34. [Google Scholar] [CrossRef]
- Boisvert-Marsh, L.; Périé, C.; de Blois, S. Divergent responses to climate change and disturbance drive recruitment patterns underlying latitudinal shifts of tree species. J. Ecol. 2019, 107, 1956–1969. [Google Scholar] [CrossRef]
- Steinbauer, M.J.; Grytnes, J.-A.; Jurasinski, G.; Kulonen, A.; Lenoir, J.; Pauli, H.; Rixen, C.; Winkler, M.; Bardy-Durchhalter, M.; Barni, E. Accelerated increase in plant species richness on mountain summits is linked to warming. Nature 2018, 556, 231–234. [Google Scholar] [CrossRef]
- Román-Palacios, C.; Wiens, J.J. Recent responses to climate change reveal the drivers of species extinction and survival. Proc. Natl. Acad. Sci. USA 2020, 117, 4211–4217. [Google Scholar] [CrossRef] [PubMed]
- Fahad, S.; Sonmez, O.; Saud, S.; Wang, D.; Wu, C.; Adnan, M.; Turan, V. Climate Change and Plants: Biodiversity, Growth and Interactions; CRC Press: Boca Raton, FL, USA, 2021; ISBN 1000379787. [Google Scholar]
- Sánchez-Fernández, D.; Rizzo, V.; Cieslak, A.; Faille, A.; Fresneda, J.; Ribera, I. Thermal niche estimators and the capability of poor dispersal species to cope with climate change. Sci. Rep. 2016, 6, 23381. [Google Scholar] [CrossRef]
- Kleemann, J.; Zamora, C.; Villacis-Chiluisa, A.B.; Cuenca, P.; Koo, H.; Noh, J.K.; Fürst, C.; Thiel, M. Deforestation in Continental Ecuador with a Focus on Protected Areas. Land 2022, 11, 268. [Google Scholar] [CrossRef]
- Torres, B.; Fischer, R.; JC, V.; Günter, S. Deforestación en Paisajes Forestales tropicales del Ecuador: Bases científicas para perspectivas políticas. Univ. Estatal Amaz. Inst. Johan Heinrich Thunen. Puyo. Ecuador. Ser. Publ. Misceláneas Ina. 2020, 15, 172. [Google Scholar]
- Mestanza-Ramón, C.; Cuenca-Cumbicus, J.; D’Orio, G.; Flores-Toala, J.; Segovia-Cáceres, S.; Bonilla-Bonilla, A.; Straface, S. Gold mining in the Amazon Region of ecuador: History and a review of its socio-environmental impacts. Land 2022, 11, 221. [Google Scholar] [CrossRef]
- Huera-Lucero, T.; Salas-Ruiz, A.; Changoluisa, D.; Bravo-Medina, C. Towards sustainable urban planning for Puyo (Ecuador): Amazon forest landscape as potential green infrastructure. Sustainability 2020, 12, 4768. [Google Scholar] [CrossRef]
- Haight, J.; Hammill, E. Protected areas as potential refugia for biodiversity under climatic change. Biol. Conserv. 2020, 241, 108258. [Google Scholar] [CrossRef]
- De Souza, A.C.; Prevedello, J.A. The importance of protected areas for overexploited plants: Evidence from a biodiversity hotspot. Biol. Conserv. 2020, 243, 108482. [Google Scholar] [CrossRef]
- Kuempel, C.D.; Adams, V.M.; Possingham, H.P.; Bode, M. Bigger or better: The relative benefits of protected area network expansion and enforcement for the conservation of an exploited species. Conserv. Lett. 2018, 11, e12433. [Google Scholar] [CrossRef]
- Geldmann, J.; Barnes, M.; Coad, L.; Craigie, I.D.; Hockings, M.; Burgess, N.D. Effectiveness of terrestrial protected areas in reducing habitat loss and population declines. Biol. Conserv. 2013, 161, 230–238. [Google Scholar] [CrossRef]
- Gray, C.L.; Hill, S.L.L.; Newbold, T.; Hudson, L.N.; Börger, L.; Contu, S.; Hoskins, A.J.; Ferrier, S.; Purvis, A.; Scharlemann, J.P.W. Local biodiversity is higher inside than outside terrestrial protected areas worldwide. Nat. Commun. 2016, 7, 12306. [Google Scholar] [CrossRef]
- De Koning, F.; Aguiñaga, M.; Bravo, M.; Chiu, M.; Lascano, M.; Lozada, T.; Suarez, L. Bridging the gap between forest conservation and poverty alleviation: The Ecuadorian Socio Bosque program. Environ. Sci. Policy 2011, 14, 531–542. [Google Scholar] [CrossRef]
- Andrade-Núñez, M.J.; Aide, T.M. Using nighttime lights to assess infrastructure expansion within and around protected areas in South America. Environ. Res. Commun. 2020, 2, 21002. [Google Scholar] [CrossRef]
- Guo, W.-Y.; Serra-Diaz, J.M.; Schrodt, F.; Eiserhardt, W.L.; Maitner, B.S.; Merow, C.; Violle, C.; Anand, M.; Belluau, M.; Bruun, H.H. High exposure of global tree diversity to human pressure. Proc. Natl. Acad. Sci. USA 2022, 119, e2026733119. [Google Scholar] [CrossRef]
- Kleemann, J.; Koo, H.; Hensen, I.; Mendieta-Leiva, G.; Kahnt, B.; Kurze, C.; Inclan, D.J.; Cuenca, P.; Noh, J.K.; Hoffmann, M.H. Priorities of action and research for the protection of biodiversity and ecosystem services in continental Ecuador. Biol. Conserv. 2022, 265, 109404. [Google Scholar] [CrossRef]
- Cuesta, F.; Peralvo, M.; Merino-Viteri, A.; Bustamante, M.; Baquero, F.; Freile, J.F.; Muriel, P.; Torres-Carvajal, O. Priority areas for biodiversity conservation in mainland Ecuador. Neotrop. Biodivers. 2017, 3, 93–106. [Google Scholar] [CrossRef]
- Fajardo, J.; Lessmann, J.; Bonaccorso, E.; Devenish, C.; Munoz, J. Combined use of systematic conservation planning, species distribution modelling, and connectivity analysis reveals severe conservation gaps in a megadiverse country (Peru). PLoS ONE 2014, 9, e114367. [Google Scholar] [CrossRef] [PubMed] [Green Version]
- Saura, S.; Bertzky, B.; Bastin, L.; Battistella, L.; Mandrici, A.; Dubois, G. Protected area connectivity: Shortfalls in global targets and country-level priorities. Biol. Conserv. 2018, 219, 53–67. [Google Scholar] [CrossRef]
- Brennan, A.; Naidoo, R.; Greenstreet, L.; Mehrabi, Z.; Ramankutty, N.; Kremen, C. Functional connectivity of the world’s protected areas. Science 2022, 376, 1101–1104. [Google Scholar] [CrossRef]
- McGuire, J.L.; Shipley, B.R. Dynamic priorities for conserving species. Science 2022, 376, 1048–1049. [Google Scholar] [CrossRef]
- Gorelick, N.; Hancher, M.; Dixon, M.; Ilyushchenko, S.; Thau, D.; Moore, R. Google Earth Engine: Planetary-scale geospatial analysis for everyone. Remote Sens. Environ. 2017, 202, 18–27. [Google Scholar] [CrossRef]
- Zhao, Q.; Yu, L.; Li, X.; Peng, D.; Zhang, Y.; Gong, P. Progress and trends in the application of Google Earth and Google Earth Engine. Remote Sens. 2021, 13, 3778. [Google Scholar] [CrossRef]
- Birk, A. Seeing through the forest and the trees with drones. Sci. Robot. 2021, 6, eabj3947. [Google Scholar] [CrossRef] [PubMed]
- Kocer, B.B.; Ho, B.; Zhu, X.; Zheng, P.; Farinha, A.; Xiao, F.; Stephens, B.; Wiesemüller, F.; Orr, L.; Kovac, M. Forest drones for environmental sensing and nature conservation. In Proceedings of the 2021 Aerial Robotic Systems Physically Interacting with the Environment (AIRPHARO), Biograd na Moru, Croatia, 4–5 October 2021; IEEE: Piscataway, NJ, USA, 2021; pp. 1–8. [Google Scholar]
- Veloz Mino, S.P.; del Carmen Villavicencio Narváez, L.; Serrano Avalos, K.V.; Avalos Perez, M.C.; Veloz Mino, M.F.; Lopez Rodriguez, M.A. Impact of educational workshops for the conservation and protection of forests in the environmental education of children. Dilemas Contemp. Polit. Valores 2018, 5, 2. [Google Scholar]
- Jackowiak, B.; Lawenda, M.; Nowak, M.M.; Wolniewicz, P.; Błoszyk, J.; Urbaniak, M.; Szkudlarz, P.; Jędrasiak, D.; Wiland-Szymańska, J.; Bajaczyk, R. Open Access to the Digital Biodiversity Database: A Comprehensive Functional Model of the Natural History Collections. Diversity 2022, 14, 596. [Google Scholar] [CrossRef]
- Enquist, B.J.; Feng, X.; Boyle, B.; Maitner, B.; Newman, E.A.; Jørgensen, P.M.; Roehrdanz, P.R.; Thiers, B.M.; Burger, J.R.; Corlett, R.T. The commonness of rarity: Global and future distribution of rarity across land plants. Sci. Adv. 2019, 5, eaaz0414. [Google Scholar] [CrossRef]
- ENF Inventario Nacional Forestal. Available online: http://enf.ambiente.gob.ec/web_enf/ (accessed on 28 January 2023).
- Zizka, A.; Antonelli, A.; Silvestro, D. Sampbias, a method for quantifying geographic sampling biases in species distribution data. Ecography 2021, 44, 25–32. [Google Scholar] [CrossRef]
- Daru, B.H.; Park, D.S.; Primack, R.B.; Willis, C.G.; Barrington, D.S.; Whitfeld, T.J.S.; Seidler, T.G.; Sweeney, P.W.; Foster, D.R.; Ellison, A.M. Widespread sampling biases in herbaria revealed from large-scale digitization. New Phytol. 2018, 217, 939–955. [Google Scholar] [CrossRef] [PubMed] [Green Version]
- Engemann, K.; Enquist, B.J.; Sandel, B.; Boyle, B.; Jørgensen, P.M.; Morueta-Holme, N.; Peet, R.K.; Violle, C.; Svenning, J. Limited sampling hampers “big data” estimation of species richness in a tropical biodiversity hotspot. Ecol. Evol. 2015, 5, 807–820. [Google Scholar] [CrossRef]
- SoberónM, J.; LlorenteB, J. The use of species accumulation functions for the prediction of species richness. Conserv. Biol. 1993, 7, 480–488. [Google Scholar] [CrossRef]
- Velásquez-Tibatá, J. Package WhereNext. Available online: https://github.com/jivelasquezt/WhereNext-Pkg (accessed on 28 January 2023).
- Ferrier, S.; Manion, G.; Elith, J.; Richardson, K. Using generalized dissimilarity modelling to analyse and predict patterns of beta diversity in regional biodiversity assessment. Divers. Distrib. 2007, 13, 252–264. [Google Scholar] [CrossRef]
- Nuñez-Penichet, C.; Cobos, M.E.; Soberón, J.; Gueta, T.; Barve, N.; Barve, V.; Navarro-Sigüenza, A.G.; Peterson, A.T. Selection of sampling sites for biodiversity inventory: Effects of environmental and geographical considerations. Methods Ecol. Evol. 2022, 13, 1595–1607. [Google Scholar] [CrossRef]


| Category | Variable | Description | Unit |
|---|---|---|---|
| Bioclimatic variables | bio3 | Isothermality | °C |
| bio5 | Max temperature of warmest month | °C | |
| bio6 | Min temperature of coldest month | °C | |
| bio17 | Precipitation of driest quarter | mm | |
| bio18 | Precipitation of warmest quarter | mm | |
| bio19 | Precipitation of coldest quarter | mm | |
| Soil variables | bdod | Bulk density of the fine earth fraction | kg dm−3 |
| nitrogen | Total nitrogen (N) | g kg−1 | |
| phh2o | pH (H2O) | - | |
| sand | Sand (>0.05 mm) in fine earth | % | |
| soc | Soil organic carbon in fine earth | g kg−1 |
| Model | AUC Media | TSS | Partial AUC | Omision Rate 5% |
|---|---|---|---|---|
| Complex | 0.93 | 0.74 | 1.85 | 0.050 |
| Intermediate | 0.93 | 0.74 | 1.71 | 0.049 |
| Simple | 0.93 | 0.74 | 1.69 | 0.051 |
| Country | Current | SSP2-4.5 | SSP5-8.5 | ||||||||||
|---|---|---|---|---|---|---|---|---|---|---|---|---|---|
| Stable | % | Loss | % | Gain | % | Stable | % | Loss | % | Gain | % | ||
| Belize | 26,251 | 26,196 | 99.8 | 55 | 0.2 | 0.0 | 0.0 | 26,181 | 99.7 | 70 | 0.3 | 1 | 0.004 |
| Bolivia | 15,2876 | 114,041 | 74.6 | 38,835 | 25.4 | 47,652 | 31.2 | 118,038 | 77.2 | 34,838 | 22.8 | 41,876 | 27.4 |
| Brazil | 64,690 | 54,111 | 83.6 | 10,579 | 16.4 | 127,285 | 196.8 | 47,707 | 73.7 | 16,983 | 26.3 | 102,627 | 158.6 |
| Colombia | 65,862 | 54,472 | 82.7 | 11,390 | 17.3 | 23,827 | 36.2 | 47,849 | 72.7 | 18,013 | 27.3 | 33,427 | 50.8 |
| Costa Rica | 38,259 | 35,473 | 92.7 | 2786 | 7.3 | 1606 | 4.2 | 33,641 | 87.9 | 4618 | 12.1 | 2542 | 6.6 |
| Dominica | 834 | 771 | 92.4 | 63 | 7.6 | 0.0 | 0.0 | 706 | 84.7 | 128 | 15.3 | 1 | 0.1 |
| Ecuador | 56,900 | 33,772 | 59.4 | 23,128 | 40.6 | 11,050 | 19.4 | 32,817 | 57.7 | 24,083 | 42.3 | 20,670 | 36.3 |
| El Salvador | 19,146 | 19,091 | 99.7 | 55 | 0 | 3474 | 18.1 | 18,945 | 99.0 | 201 | 1.0 | 3452 | 18.0 |
| Guatemala | 89,556 | 86,531 | 96.6 | 3025 | 3.4 | 11,110 | 12.4 | 85,836 | 95.8 | 3720 | 4.2 | 15,023 | 16.8 |
| Honduras | 116,168 | 115,535 | 99.5 | 633 | 0.5 | 10,008 | 8.6 | 113,661 | 97.8 | 2507 | 2.2 | 12,299 | 10.6 |
| México | 355,755 | 342,038 | 96.1 | 13,717 | 3.9 | 58,797 | 16.5 | 324,593 | 91.2 | 31,162 | 8.8 | 59,811 | 16.8 |
| Nicaragua | 132,988 | 130,865 | 98.4 | 2123 | 1.6 | 2469 | 1.9 | 129,975 | 97.7 | 3013 | 2.3 | 3149 | 2.4 |
| Perú | 18,544 | 10,896 | 58.8 | 7648 | 41.2 | 17,550 | 94.6 | 11,631 | 62.7 | 6913 | 37.3 | 25,814 | 139.2 |
| Panamá | 61,645 | 54,667 | 88.7 | 6978 | 11.3 | 1693 | 2.7 | 56,104 | 91.0 | 5541 | 9.0 | 3672 | 6.0 |
| Puerto Rico | 6928 | 5517 | 79.6 | 1411 | 20.4 | 424 | 6.1 | 4269 | 61.6 | 2659 | 38.4 | 219 | 3.2 |
| Venezuela | 43,919 | 27,086 | 61.7 | 16,833 | 38.3 | 18,111 | 41.2 | 19,326 | 44.0 | 24,593 | 56.0 | 34,255 | 78.0 |
| Total | 1,250,321 | 1,111,062 | 88.9 | 139,259 | 11.1 | 335,056 | 26.8 | 1,071,279 | 85.7 | 179,042 | 14.3 | 358,838 | 28.7 |
| Country | Current | Protected Areas | % | SSP2-4.5 | SSP5-8.5 | ||||||||||
|---|---|---|---|---|---|---|---|---|---|---|---|---|---|---|---|
| Stable | % | Loss | % | Gain | % | Stable | % | Loss | % | Gain | % | ||||
| Belice | 26,251 | 9712 | 37.0 | 9681 | 99.7 | 31 | 0.3 | 0 | 0.0 | 9676 | 99.6 | 36 | 0.4 | 0 | 0.0 |
| Bolivia | 152,876 | 55,563 | 36.3 | 44,194 | 79.5 | 11,369 | 20.5 | 15,142 | 27.3 | 44,577 | 80.2 | 10,986 | 19.8 | 16,745 | 30.1 |
| Brasil | 64,690 | 13,714 | 21.2 | 10,687 | 77.9 | 3027 | 22.1 | 53,598 | 390.8 | 10,251 | 74.7 | 3463 | 25.3 | 43,045 | 313.9 |
| Colombia | 65,862 | 30,973 | 47.0 | 26,192 | 84.6 | 4781 | 15.4 | 11,095 | 35.8 | 24,142 | 77.9 | 6831 | 22.1 | 14,073 | 45.4 |
| Costa Rica | 38,259 | 17,295 | 45.2 | 15,985 | 92.4 | 1310 | 7.6 | 1330 | 7.7 | 15,177 | 87.8 | 2118 | 12.2 | 2171 | 12.6 |
| Dominica | 834 | 189 | 22.7 | 183 | 96.8 | 6 | 3.2 | 0 | 0.0 | 185 | 97.9 | 4 | 2.1 | 1 | 0.5 |
| Ecuador | 56,900 | 3384 | 5.9 | 1873 | 55.3 | 1511 | 44.7 | 582 | 17.2 | 1958 | 57.9 | 1426 | 42.1 | 911 | 26.9 |
| El Salvador | 19,146 | 2909 | 15.2 | 2877 | 98.9 | 32 | 1.1 | 877 | 30.1 | 2837 | 97.5 | 72 | 2.5 | 1008 | 34.7 |
| Guatemala | 89,556 | 37,037 | 41.4 | 36,836 | 99.5 | 201 | 0.5 | 906 | 2.4 | 36,645 | 98.9 | 392 | 1.1 | 1429 | 3.9 |
| Honduras | 116,168 | 31,004 | 26.7 | 30,846 | 99.5 | 158 | 0.5 | 2907 | 9.4 | 30,397 | 98.0 | 607 | 2.0 | 3900 | 12.6 |
| México | 355,755 | 61,281 | 17.2 | 58,697 | 95.8 | 2584 | 4.2 | 6537 | 10.7 | 54,174 | 88.4 | 7107 | 11.6 | 5830 | 9.5 |
| Nicaragua | 132,988 | 50,831 | 38.2 | 49,997 | 98.4 | 834 | 1.6 | 739 | 1.5 | 49,127 | 96.6 | 1704 | 3.4 | 631 | 1.2 |
| Perú | 18,544 | 6255 | 33.7 | 3809 | 60.9 | 2446 | 39.1 | 5738 | 91.7 | 3869 | 61.9 | 2386 | 38.1 | 7278 | 116.4 |
| Panamá | 61,645 | 12,590 | 20.4 | 9828 | 78.1 | 2762 | 21.9 | 541 | 4.3 | 10,276 | 81.6 | 2314 | 18.4 | 1248 | 9.9 |
| Puerto Rico | 6928 | 324 | 4.7 | 232 | 71.6 | 92 | 28.4 | 57 | 17.6 | 192 | 59.3 | 132 | 40.7 | 44 | 13.6 |
| Venezuela | 43,919 | 23,190 | 52.8 | 16,016 | 69.1 | 7174 | 30.9 | 11,670 | 50.3 | 11931 | 51.4 | 11,259 | 48.6 | 24,905 | 107.4 |
| Total | 1,250,321 | 356,251 | 28.5 | 317,933 | 89.24 | 38,318 | 10.76 | 111,719 | 31.36 | 305414 | 85.73 | 50,837 | 14.27 | 123,219 | 34.59 |
Disclaimer/Publisher’s Note: The statements, opinions and data contained in all publications are solely those of the individual author(s) and contributor(s) and not of MDPI and/or the editor(s). MDPI and/or the editor(s) disclaim responsibility for any injury to people or property resulting from any ideas, methods, instructions or products referred to in the content. |
© 2023 by the authors. Licensee MDPI, Basel, Switzerland. This article is an open access article distributed under the terms and conditions of the Creative Commons Attribution (CC BY) license (https://creativecommons.org/licenses/by/4.0/).
Share and Cite
Herrera-Feijoo, R.J.; Torres, B.; López-Tobar, R.; Tipán-Torres, C.; Toulkeridis, T.; Heredia-R, M.; Mateo, R.G. Modelling Climatically Suitable Areas for Mahogany (Swietenia macrophylla King) and Their Shifts across Neotropics: The Role of Protected Areas. Forests 2023, 14, 385. https://doi.org/10.3390/f14020385
Herrera-Feijoo RJ, Torres B, López-Tobar R, Tipán-Torres C, Toulkeridis T, Heredia-R M, Mateo RG. Modelling Climatically Suitable Areas for Mahogany (Swietenia macrophylla King) and Their Shifts across Neotropics: The Role of Protected Areas. Forests. 2023; 14(2):385. https://doi.org/10.3390/f14020385
Chicago/Turabian StyleHerrera-Feijoo, Robinson J., Bolier Torres, Rolando López-Tobar, Cristhian Tipán-Torres, Theofilos Toulkeridis, Marco Heredia-R, and Rubén G. Mateo. 2023. "Modelling Climatically Suitable Areas for Mahogany (Swietenia macrophylla King) and Their Shifts across Neotropics: The Role of Protected Areas" Forests 14, no. 2: 385. https://doi.org/10.3390/f14020385