
Landscape Preference Evaluation of Old Residential Neighbourhoods: A Case Study in Shi Jiazhuang, Hebei Province, China


1
Department of Landscape Architecture, Faculty of Design & Architecture, Universiti Putra Malaysia, Serdang 43400, Selangor Darul Ehsan, Malaysia
2
Department of Design, Faculty of Arts, Hebei University of Economics & Business, 47 Xuefu Road, Shijiazhuang 050061, China
3
Department of Finance, Faculty of Economics & Management, Universiti Putra Malaysia, Serdang 43400, Selangor Darul Ehsan, Malaysia
*
Author to whom correspondence should be addressed.
Forests 2023, 14(2), 375; https://doi.org/10.3390/f14020375
Submission received: 19 January 2023
/
Revised: 1 February 2023
/
Accepted: 7 February 2023
/
Published: 13 February 2023
(This article belongs to the Special Issue Forest, Trees, Human Health and Wellbeing)
Abstract
:Landscape preference and cognition are essential in determining the external environment’s subjective reflections. Although much research has been conducted on landscape preferences, there is still a lack of information on landscape perceptions and preferences among residents of disadvantaged neighbourhoods, especially in Chinese cities. Taking old residential neighbourhoods of Shijiazhuang as an example, this paper used a large-scale questionnaire survey and semi-structured interviews to determine the landscape preference of the residents of old residential neighbourhoods for the community green spaces using the virtual model method. The chi-square test method is used to explore the inner logic of aesthetic preference from two aspects: landscape characteristics and socio-demographic characteristics. The respondents are 668 residents of old residential neighbourhoods (300 males, 368 females) distributed in four larger communities in the main urban area of Shijiazhuang. Random sampling and volunteer sampling were used to choose the survey respondents. The results showed this: (1) In terms of soft landscapes, respondents prefer natural planting, spaces with very high plant richness and high green coverage. In terms of hard landscapes, there is a preference for fitness and leisure facilities, rubber floors and a slight preference for water features and decorative landscape elements. (2) From the chi-square results, age significantly affects landscape preference, gender and education level. In contrast, marital status and occupation have no significant effect on landscape preference. The expression of the landscape preference of the residents of old residential neighbourhoods reflects the needs for functionality, reality and local concept. The main aim of this study is to fully understand the landscape preferences of residents in old residential neighbourhoods when using green space, and to find out what factors will affect residents’ landscape preferences. The research results have guiding significance for rationally improving the landscape planning, design and management of old residential neighbourhoods, and at the same time make up for the lack of international research on landscape preferences of disadvantaged communities. Improving the environment of old residential neighbourhoods can develop a higher sense of security, happiness and satisfaction among the residents.
1. Introduction
1.1. Background
In the 20th century, disadvantaged communities have become an important social issue worldwide [1]. Uncontrolled urbanisation is currently a major challenge for urban planners [2]. Since the 1960s, the number of urban centres has gradually declined, and there has been a trend of suburbanisation, with outdated urban housing and infrastructure and severe resource shortages [3]. As a result, the number of disadvantaged neighbourhoods in cities has doubled since 1980 [4], and at the “HABITAT II” Conference in 1996, the United Nations proposed that the improvement and development of human settlements should be an important theme in the future [5]. In this light, although many studies have focused on neighbourhood landscape preference and perception over the past few decades [6,7,8,9,10,11], studies found that disadvantaged neighbourhoods’ landscapes have received little attention [12,13,14]. Studies have shown that compared with wealthier neighbourhoods, disadvantaged or low-income neighbourhoods have lower green coverage and bad basic design and maintenance, seriously affecting the residents’ health [15,16,17].
Imbalances in social development have an impact on the community landscape. In the urbanisation process in China, a stark contrast has been observed between the landscape of many old and new residential areas. From a global perspective, old residential neighbourhoods are a typical form of disadvantaged communities, but they are a common phenomenon in the development of cities in China [18]. According to statistics from the Ministry of Housing and Construction, nearly 170,000 old residential neighbourhoods are distributed in each city in China [19]. With the acceleration of urbanisation, facilities and environment in communities built in the 1970s and 1980s have become unsuitable for modern life [20], which has led to issues such as limited green spaces, inadequate facilities, limited plants or vegetation, unreasonable space allocation and poor sanitary conditions.
Consequently, issues brought by old residential neighbourhoods have become a significant concern to the residents and stakeholders, such as the government [18,21]. In addition, many vulnerable groups live in these old residential neighbourhoods, such as seniors and low-income earners. Most of these communities are located in the centre of the city, and the number is enormous, which seriously hinders the healthy development of the urban environment [20]. Therefore, it is necessary to formulate a scientific and reasonable management and renovation plan to improve the current condition of old residential neighbourhoods and ultimately create a harmonious, orderly and healthy living environment. In recent years, the Chinese government has attached great importance to the landscape renovation and development of old residential areas. The “Thirteenth Five-Year Plan”, released in 2016, proposed to promote the comprehensive renovation of old residential neighbourhoods in an orderly manner. In 2017, the Ministry of Housing and Urban-Rural Development issued a notice promoting the pilot work of renovation of old residential neighbourhoods [22,23]. From a policy point of view, it is mainly a top-down executive order, a single government control model, and a surprise transformation targeting weak links. Management and renovation methods cannot meet residents’ needs, so the landscape environment problem in old residential neighbourhoods has not been fundamentally solved [18,24].
1.2. Landscape Preferences
It is essential to understand the landscape preferences of residents of old residential neighbourhoods and how to shape and maintain their community landscape. Landscape preference refers to the comprehensive evaluation and subjective selection of landscape environmental information through personal experience, expectations, needs and psychological states. It is accompanied by the appearance of certain behavioural habits and decision-making and is a cognitive process of the environment. Landscape preference can also be called personal landscape assessment [25,26]. Landscape preference is based on the theory of environmental perception, the degree of preference of individuals or groups expressed through the continuous cognitive experience of environmental information [27]. In the study of landscape preference, it is not only related to the characteristics of the landscape itself but also to the way people interact with the landscape and the attributes of individuals [28,29,30]. The formation of landscape preferences differs according to the experiencer’s age, gender, economic status, education level, psychological state, family values, and racial and political ideology, all of which could affect the individual’s perception of the world around them [31,32]. Landscape preference, as an assessment strategy for environmental quality, can determine the pros and cons of the environment through comparative analysis of data. At the same time, the environment can be evaluated and improved according to the perception of the environment at different times, places and people [27].
Landscape preference is an essential issue in the research between humans and the environment, and the research literature has gradually increased in recent years. These research papers mainly focus on several levels. The first is the geographical and cultural aspect. Yu [33] examined differences in landscape preferences between Chinese groups and Western design experts. The results showed macro-cultural differences between China and the West, and Chinese people have a unique preference for Chinese gardens. In the meantime, residents living in Santa Fe, New Mexico, prefer high desert plants to beautify their homes, which is associated with greater familiarity with desert environments [34]. Other studies include Yang & Brown [35], which compared the differences in landscape preferences in different cultural backgrounds of Korea, Japan, and pointed out that landscape perception varies from site to site due to environmental and cultural gaps between the two sites. The second aspect is the characteristics of the landscape itself. There is a great correlation between the preference of landscape elements and the psychological effect. Natural landscapes such as blue sky and plants will alleviate people’s negative emotions [36]. A study from the United States reported that people prefer spaces with high tree coverage, however, people’s preference will decrease a little when the density of trees exceeds a specific value, but it will still increase gradually [37]. Lastly, Zhang et al. [38] analysed the impact of four visual attributes (spatial scale, richness of landscape elements, spatial order and depth of view) on landscape preference by simulating landscape scenarios. Some articles examined demographic characteristics; for instance, a study of urban green spaces reported that gender significantly affects landscape preference. Women are more concerned with colour and plant maturity, while men are concerned with naturalness, plant growth and other landscape elements [39]. However, no relationship between gender and landscape preference was found in Yu [33]. In addition, age and education level are predictors of landscape preference. In the deciduous landscape preference survey, seniors are more concerned about the falling side of the deciduous landscape, and other age groups are more concerned about the colour of the deciduous landscape [40]. Another study by Sevenant and Antrop [41] observed that people with lower education levels are more concerned about nature. Similarly, people with lower education levels prefer wild landscapes [42]. On the other hand, a Canadian study did not find that education affects preferences for landscape aesthetics [43].
While community landscape preferences have been extensively investigated in recent years, limited research has been conducted on the landscape preferences of residents in disadvantaged communities. Larsen and Harlan [44] constructed a virtual model to investigate the front and backyard landscape preferences among 232 residents in Phoenix, Arizona. The study found that income is an essential factor influencing people’s landscape preferences. In addition, the design of the front yard differs across class and status, while the backyard will follow individual preferences and imagination. Similarly, research on desert communities in the southwestern United States observed that maintenance costs, maintenance time, cultural and social factors, and concerns about water scarcity are crucial factors influencing residents’ landscape preferences [7]. Meanwhile, a longitudinal study in Australia found that residents prefer large, attractive green spaces when going for a leisure walk, and the attractiveness of green spaces is more important than the size or number of green spaces [45]. Some studies have focused on a particular group within the community. For instance, a study in Canada discussed the preferences of 7–12-year-olds for outdoor community spaces. The study pointed out that preferred spatial features would change as children age. For example, younger children prefer to play in spaces close to their homes, while older children prefer playgrounds and parks with more recreational facilities. In this light, children are more inclined to natural elements, and spaces with a high green rate will attract them more [46]. In another study of college students, Zheng et al. [8] used a visual and language preference survey to analyse the underlying factors of students’ preference for residential landscapes. The result showed that students prefer neat green spaces over natural landscapes. However, due to different personal and social factors such as major, age, gender, family background, and education level, there are still differences in students’ preferences for residential landscapes.
1.3. Aim of Current Study
Lyons [47] asserted that location and living experience strongly influence individual landscape preferences. In this regard, regional and cultural influences in landscape preferences are more likely to appear in specific landscape contexts [48]. Based on the literature review, although numerous studies have been conducted on landscape preferences, the factors influencing the landscape perceptions and preferences of residents in disadvantaged communities are still unclear. There is also a lack of in-depth studies on the relationship between preferences for landscapes and environmental characteristics, especially in Asia. China is carrying out renovation projects for old residential neighbourhoods, and the community landscape will inevitably become the renovation focus. Therefore, this study investigates the preference for different types of landscapes among residents of old residential neighbourhoods in Shijiazhuang. We determined the physical characteristics of the six landscapes (Appendix A) and the different socio-demographic characteristics of respondents (gender, age, education level, marital status, occupation). It is mainly achieved through three aims: (a) understand the landscape preference pattern of residents in Shijiazhuang old residential neighbourhoods through the physical characteristic model of landscape; (b) analyse and summarise the attributes and factors that affect the landscape preference of residents in old residential areas; (c) put forward specific optimisation measures and suggestions for the transformation of green space in old communities. The research hopes to use the virtual model as a carrier, combine quantitative and qualitative analysis, and explore the landscape preference of green space in old residential neighbourhoods from the perspective of residents’ vision. Old residential neighbourhoods are a living pattern formed under the special social background in China. This research can not only help planners or managers understand the actual perception of landscape by residents of old residential areas, so as to take corresponding planning and design strategies in a targeted manner, but also it will fill in the gaps in the international research field on the landscape preferences of disadvantaged communities.
2. Methods
2.1. Study Site
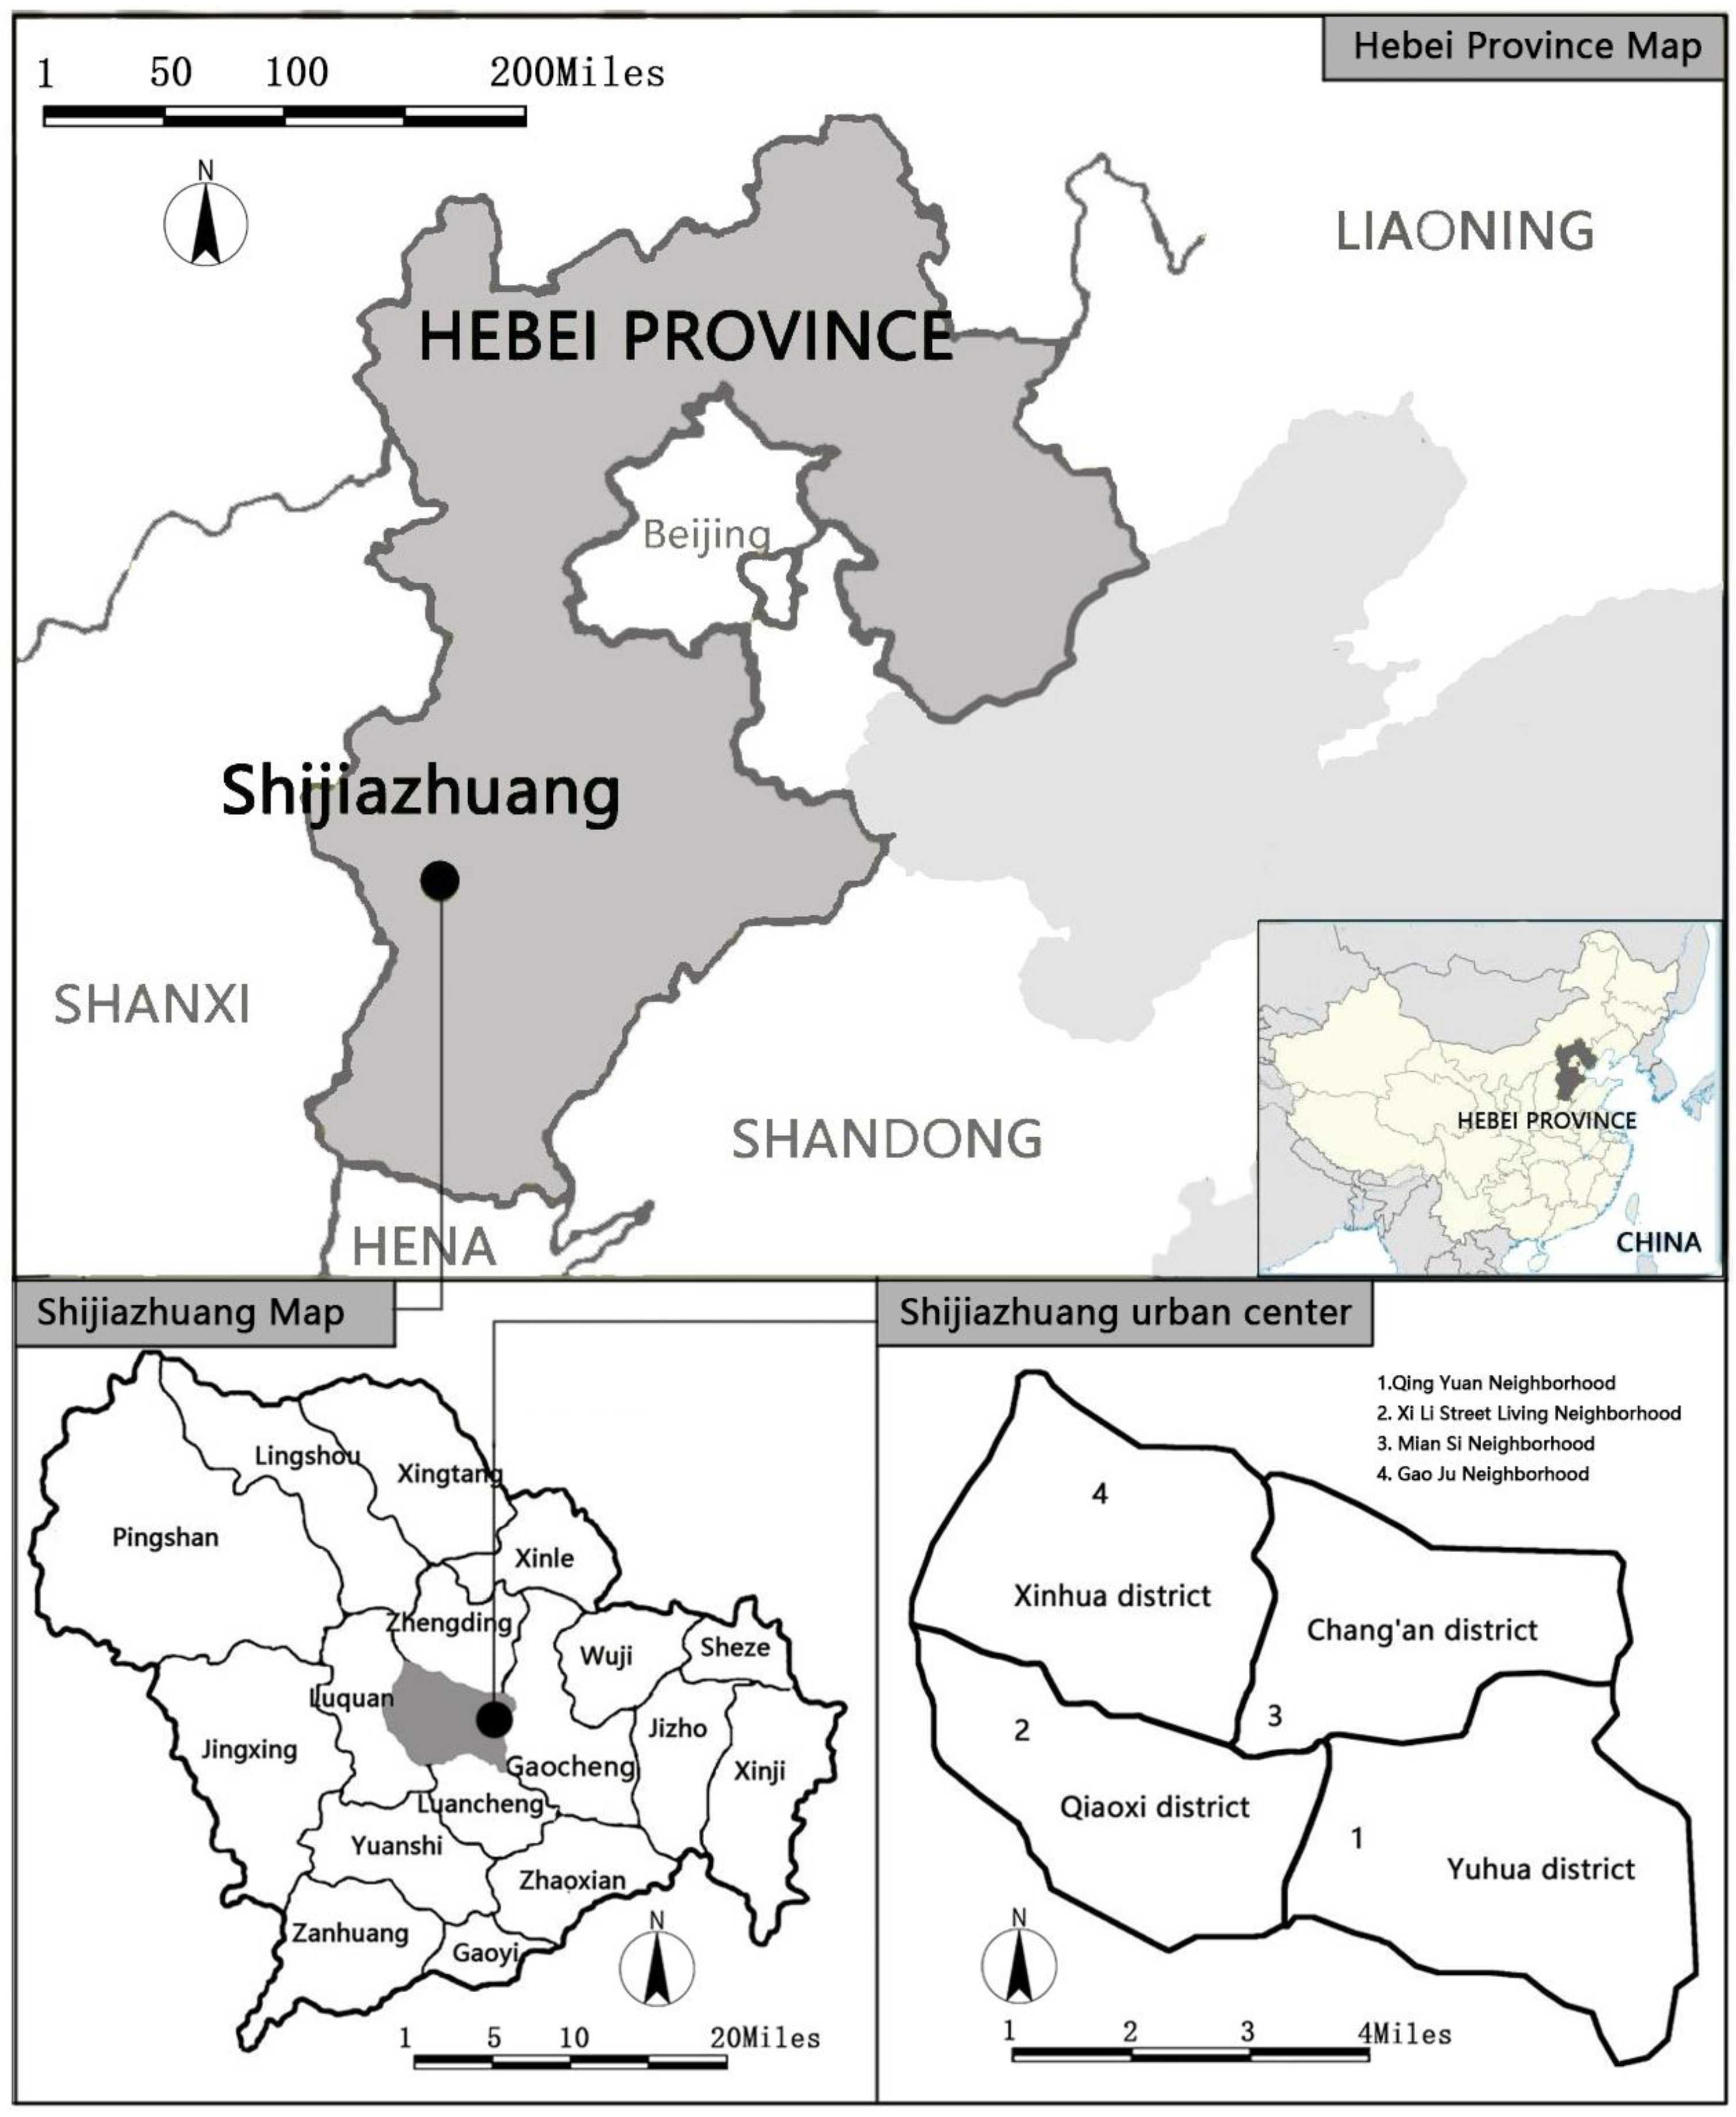
The study site is in Shijiazhuang, the capital of Hebei Province, China (Figure 1). Shijiazhuang is in the plain area of northern China and is part of the Bohai Rim economy. It is adjacent to the capital Beijing and is the political, economic and cultural centre of Hebei Province [49]. Shijiazhuang has a total area of 14,530 square kilometres and a permanent population of 11.2047 million [49]. According to the information released by the Shijiazhuang Municipal People’s Government [50], there are 2633 old residential neighbourhoods in Shijiazhuang, of which 1875 are in the main urban area. The items in this survey were based on the “Reconstruction Project List of Old Residential Quarters in Shijiazhuang City in 2018 and 2020”. The scope of the study comprises old residential areas in the main urban area of Shijiazhuang City, including Xinhua District, Chang’an District, Qiaoxi District and Yuhua District. The old residential area with the largest population was selected for each urban area. These old residential neighbourhoods were built in the 1970s and 1980s, with dilapidated buildings, a lack of green infrastructure, insufficient space and many vulnerable groups, such as the elderly and low-income groups. After screening, four old residential neighbourhoods: Qingyuan Community, Xili Street Living Community, Miansi Community and Gaozhu Community, were included in the survey scope (Figure 1). We summarised the construction time, the number of families, building types, and community characteristics of these four old residential neighbourhoods based on the statistics of the preliminary investigation (Table 1).
2.2. Sample
The sample size is related to the population size. According to the general idea, the larger the overall size, the larger the sample size to ensure a certain accuracy. However, this idea is only true to a certain extent. When the population size reaches a certain level, the rate of sample size increase will not be the same as the population size. In other words, when the population size reaches a certain level, the amount of change in the sample size is very small [51]. The sample size was estimated based on the number of residents in each residential area under investigation. We introduced the sample size calculation formula [51]:
In the formula, t is the critical value corresponding to the confidence (1 − α); p is the population percentage; e is the allowable error. The confidence level of the sample is set at 95%; that is, the t is 1.96. Take p = 0.5, which is a relatively conservative approach. The standard error e is 4%. By calculating n = 601, the sample size is 601. The non-response rate is assumed to be 10%, and the final sample size is 668.
2.3. Survey Instruments and Procedure
The survey period was from 4 March to 28 April 2022. To verify the landscape preferences of residents in old residential areas, we obtained data through questionnaires and semi-structured interviews and conducted an empirical analysis of the data and content. The questionnaire design was divided into two forms: a paper questionnaire and an online electronic questionnaire, and the survey content was the same. Online questionnaires were mainly distributed to residents through community WeChat groups. Respondents need to complete all the content before submitting it. Residents who complete the questionnaire are given a gift card of 1 CNY (Chinese Yuan Renminbi) as a token. The paper questionnaire was distributed to the seniors in the community, and five enumerators used the method of on-site inquiry to help the seniors to complete the questionnaire. Semi-structured interviews were conducted by recruiting volunteers through WeChat groups and video conferences. The closed-ended questionnaire consists of two parts in total.
The first part is a survey on the basic information of residents, including gender, age, education, marital status, and occupation. The second part is related to the landscape preference of the residents of old residential neighbourhoods, which was investigated through a virtual model. Literal narration will cause differences in respondents’ understanding of landscape preferences, affecting the survey results. Therefore, the research uses visualisation and makes the virtual model as consistent as possible in background, light, colour and perspective. Landscape preference is divided into six environmental factors: soft landscape (planting pattern, green space ratio, plant richness) and hard landscape (facilities, waterscape, pavement) as independent variables for analysis. Among them, planting pattern is divided into lawn planting, tree planting, natural planting and gardening planting; green space ratio is divided into low green space ratio, medium green space ratio, high green space ratio and very high green space ratio; plant richness is divided into low plant richness, medium plant richness, high plant richness and very high plant richness; facilities are divided into children activity facility, fitness facility, decorative facility and lease facility; waterscape is divided into ponds, fountains, pools and waterwalls. Meanwhile, the different types of pavement include rubber, floor tiles, grass planting tiles and wood. The research adopted the method of multiple-choice questions. The respondents were asked to select their favourite landscape style from the above 24 virtual scenes to determine the residents’ preferences for the old residential neighbourhoods. Finally, 668 residents participated in the questionnaire survey, and 18 residents participated in the interview.
2.4. Data Analysis
There are two main methods for analysing the questionnaire survey results in this study; the first is descriptive statistical analysis, which directly calculates the frequency and percentage of data. The second is the chi-square test. The chi-square test is a nonparametric test, mainly to compare two or more sample rates and the correlation analysis of two categorical variables [52]. We used chi-square to test whether gender, age, education level, marital status and occupation affect the landscape preferences of residents in old residential neighbourhoods. The demographic variables are the dependent variables, and the landscape feature attributes are the independent variables. In this study, the chi-square test was mainly used to calculate the chi-square value x² of the sample and the corresponding p value. The meaning of the p value is the probability that the chi-square distribution is greater than the calculated chi-square value, reflecting the probability of sample differences caused by sampling error [53]. When the chi-square value is larger, the corresponding p value is smaller, and it can be said that the difference between the two samples is “significant”. Conversely, the smaller the chi-square value, the larger the p value and the difference between the two samples is said to be “insignificant” [53]. SPSS 11.0 version was used for statistical analysis of the results. The statistical analysis methods included frequency calculation, chi-square test, etc. The confidence level was set at 90%.
Thematic analysis was employed in the qualitative data analysis section. This study focused on analysing the results of a qualitative survey of residents (18 respondents) living in 4 old residential neighbourhoods in Shijiazhuang. Semi-structured face-to-face interviews were conducted with each respondent, transcribed, and analysed using ATLAS.ti (Version 8) software. ATLAS.ti is a very professional qualitative data analysis software which can manage and analyse various kinds of qualitative data, including documents, audio, video, pictures and other data.
3. Results and Discussion
3.1. Demographic Characteristics
According to the statistical results (Table 1), out of the 688 questionnaires collected from old residential neighbourhoods, 44.9% of the respondents are males, and 55.1% are females. This indicates a relatively uniform gender distribution. As for age, 18–30 years old accounted for 30.5%, 31–45 years old accounted for 29.9%, 46–55 years old accounted for 18.4%, and 56–60 years old accounted for 10%. For their education level, 2.4% completed primary school education and below; 13.2% completed junior high school education; 29.5% completed high school education; 54.9% completed a college education or above. This is linked to China’s education level improvement in recent years. Based on the demographics, the respondents are mainly young and middle-aged, who are the product of China’s improved education system; hence, there is a higher proportion of respondents with higher education levels. Regarding marital status: the married population (69.5%) is twice as much as the unmarried population (30.5%). The residents have a broad range of occupations, ranging from private employees (42.2%, pensioners (19.8%), government employees (10.6%), self-employed (10.1%), unemployed (9.9%) and students (7.3%). Furthermore, nearly half of the respondents are migrant workers.
3.2. Landscape Preferences of Residents of Old Residential Neighbourhoods
This study used the chi-square test to compare the effects of demographic variables on planting pattern preference. The results showed that age (p < 0.01) and education level (p < 0.05) had a significant effect on the preference score (Appendix B). The study found that with the increase in age, people’s preference for gardening grows stronger. One of the seniors (62, Female, Single, Pensioner) said: “I like to grow some vegetables, which reminds me of the scene of farming in the countryside when I was a child.” Most people are aged 56–60, and over 60 have experienced traditional agricultural production. The initial formation of aesthetics originated from agrarian civilisation. Still, due to accelerated modernisation, conventional farming is no longer common. Consequently, it remains a memory for the older generation, forming the most yearning scenery in their hearts. A study by Lindemann-Matthies et al. [54] found that personal experiences can affect a person’s landscape aesthetics. Older respondents were exposed to and experienced mountain farming landscapes as children and, as a result, would prefer crops in alpine regions rather than alpine regions with only meadows. Another senior (66, female, pensioner) said: “Gardening has brought regularity to my life, which is both physical and mental pleasure.” While the preference for gardening among young people is low, the main reason is that the current residents voluntarily plant some vegetables or ornamental plants. There is no unified plan, so the visual aesthetics are poor. It is also related to time constraints, with one young man (26, private sector) claiming: “Because of work and family pressure, I don’t have as much time to look after the garden”. In terms of education level, compared to other educational backgrounds, people with a college degree or above are the least likely to prefer gardening. We suspect that more educated residents may spend more time at work and less time tending to their gardens. Second, they may not like cluttered and disordered landscape forms. Some earlier studies also confirmed the potential impact of education on preferences. The more educated people prefer tidy landscaping to horticultural landscaping that is not well-designed and maintained [8], which also explains our previous inferences. Therefore, some experts propose that general preferences can be changed by improving educational attainment and shifting ideology [55,56].
In terms of green space ratio, respondents prefer a high green space ratio (44%), followed by a very high green space ratio (38.9%) and medium green space ratio (30.2%), while a low green space ratio (12.4%) has the least choice (Appendix B). People like a space with a large number of plants and shaded trees. A Canadian study found that children prefer natural elements, and similarly, spaces with a high rate of greenery attract more children [46]. In urban parks in Guangzhou, China, shaded green areas are preferred to spaces without vegetation, indicating that the environmental regulation system has important implications for landscape preferences [57]. This survey showed that although residents like spaces with a high greening rate, it does not mean that the higher the greening rate, the higher their preference. The preference may be proportional to the greening rate until the greening rate reaches a certain threshold. One of the young males replied (26, private sector), “Too dense vegetation makes me feel unsafe”. Similarly, in the United States, empirical surveys of children’s landscape preferences in communities have found that children prefer spaces with diverse land use and high accessibility over spaces with greater homogeneity and privacy [58]. People do not like a wholly occluded space environment, and a certain degree of openness can better monitor the surrounding situation to obtain a sufficient sense of security [59]. Overly dense vegetation and enclosed spaces positively correlate with people’s insecurities [60]. In addition, residents did not choose a very high greening rate, which is also related to functional needs. Some residents also claimed that although plants are essential, due to the small area of outdoor space in the old residential neighborhoods, they hope to allocate the space reasonably, with both greenery and enough venues for activities.
In terms of significance, there are also statistically significant differences in age (p < 0.01) and education level (p < 0.05) (Appendix B). Although the proportion of the greening rate is higher, people aged 56–60 and over 60 are significantly fonder of a very high greening rate than other age groups. Through observation, the seniors like to play chess and mahjong and chat together in the afternoon, so they need more green space. Similarly, an article studying the outdoor walking level and community green spaces characteristics of the elderly in the UK suggested that the area of green space will affect the walking level of the seniors, and the seniors prefer areas with more green space [61]. In the meantime, The preference for a very high greening rate among people with primary school education and below is significantly higher than that of other education. Yu [33] observed that rural populations, landscape experts, and urban populations have differences in landscape preferences due to different educational levels.
In terms of plant richness, more residents chose very high plant richness (41.9%), followed by high plant richness (32.2%) and medium plant richness (31.9%), and the proportion of low plant richness was 19.6% (Appendix B). Through interviews, it was found that residents like tall trees for shade and hope to see various flowering plants in different seasons. A middle-aged person (37, male, private sector) replied: “When I see different kinds of flowers, my mood will become happy.” That is to say, the more species and number of trees, shrubs and herbs in the old residential neighbourhoods, the more people like them. In addition, residents expressed a special love for flowering plants. This was confirmed in previous studies. Green spaces with high plant abundance are preferred by residents [62]. Similarly, Kuper [63] and Cai [57] reported that plant diversity and landscape preference have a strong positive correlation. In Berlin, Germany, most residents said they liked listening to the sounds of nature and watching different kinds of plants and animals in the green space of the residential area [64]. From an evolutionary point of view, people prefer flowering plants, probably because bright colours provide a food source for people’s lives [65]. Scenes with high plant abundance can help relieve anxiety, improve concentration, and positively affect landscape preference [66]. In addition, small changes in plant richness can have significant impacts on biodiversity [67]. Certainly, there are also a few studies that suggest the opposite. A study from the United States showed that tree species richness had no particular effect on community residents’ landscape preferences, with high levels of richness being more favoured than medium and low levels [68]. Qiu et al. [69] investigated people’s landscape preferences in four different types of parks in the Swiss region. The results showed that wild woodlands with high plant richness scored the lowest, and there was a negative correlation between high plant diversity and human aesthetic preferences. Wild woodland parks with high plant richness may be considered disordered and overgrown.
From the perspective of demographic variables on residents’ landscape preferences, gender, age, education level, marital status and occupation have no significant effect (Appendix B). This is different from previous reports. Lindemann-Matthies et al. [54] argue that females understand plants better than males and prefer landscapes with high plant richness. They have a greater affinity for grasses with rich vegetation and colourful flowers [70]. In a study at the Swiss Botanical Gardens, where participants were asked to match plants, the areas assembled by women were richer in vegetation and more structurally diverse. In addition, older people create richer plant communities than younger ones [71].
The hardscape comprises three environmental factors: facilities, waterscape, and pavement (Appendix A). First, the most selected facilities are fitness facilities (64.4%) and leisure facilities (57%). The lesser choices were the children’s activity facility (37.9%) and the decorative facility (25.3%) (Appendix C). It can be considered that residents still prefer functional facilities, such as fitness equipment, seats, etc., rather than decorative landscapes. A senior person (66, female, pensioner) replied: “There are so few seats in the community that I sometimes have to carry a stool out to chat with friends or play cards.” A middle-aged man (51, unemployed) said: “There are almost no fitness facilities in this community. I can only go to a nearby city park to exercise.” Some parents want to add some facilities for children’s entertainment. Another empirical study comes from the Shenzhen Overseas Chinese Town community. People prefer practical facilities, while some decorative structures and improved vegetation cannot attract more residents [10]. Similarly, a study of urban green space found that people also favour areas with seating [72]. Park areas lacking recreational facilities have stronger cognition but lower landscape preference [73].
In the preference survey of landscape facilities, only age (p < 0.01) was significantly different, while gender, occupation, marital status and education level had little effect on facility preference (Appendix C). People under 18 prefer the children’s activity facility, and those aged 18–30 and 31–45 prefer the Fitness facility. People aged 46–55, 56–60 and older than 60 prefer fitness and leisure facilities. The proportion of people under 18 years old, 56–60 years old and over 60 who choose decorative facilities is extremely low. A study from Japan found that the preference for benches was higher among community residents, dominated by seniors over 70 years old [11]. Many seniors prefer to sit or exercise in green spaces [74].
There is not much difference in the preference for water features. The most selected options are ponds (32.6%) and fountains (29.2%). People are less inclined towards waterwall (21.4%) and pool (16.8%) (Appendix C). However, water has been considered by many experts and scholars for centuries to be one of the most important and favoured landscape elements [57,75,76]. For example, Cai [57] reported that water has a significant positive correlation with landscape preference compared with other landscape elements, especially flowing water. Kuper [66] believed that water is a necessity for survival in the process of human evolution, which has a particular relationship with biological heredity. In addition, the preference for water stems from cultural, geographical and climatic influences. In Turkish garden landscapes, water for cooling is an essential landscape element, and water features are also very important in Persia, Egypt and other regions [77]. However, the survey found that residents do not want to add water features in the community, mainly considering the limited green space in the neighbourhood. A middle-aged person (38, male, private sector) said: “The outdoor space in the community is too small, and I hope to add some facilities that meet the functional needs”. The second consideration is safety. A woman (51, self-employed) said, “My child once fell into the pond at school, so I am very worried about the safety of water features in the community”. People’s preference for water features is more based on functionality and living environment. It can be seen that personal life background and environmental value orientation will strongly influence the landscape preference type of residents. This has been confirmed in previous studies [76]. Park et al. [78] claimed that people dominated by ecological value orientations are more inclined to uninterrupted natural landscapes. Residents with people-centred value orientation are more focused on people’s perspectives and ignore the impact on the environment. Due to the limitations of their living environment, these residents living in old residential neighbourhoods will first consider landscape forms dominated by functional qualities. Therefore, the great influence of social and environmental background will make people in a specific area form a consistent environmental value orientation, and the shared value orientation of residents will affect their landscape preferences.
Gender (p < 0.01) and age (p < 0.01) are two significant demographic variables (Appendix C). More male respondents prefer ponds, while female respondents prefer fountains. This may be related to differences in the personality and thinking styles of males and females. Males are more rational and composed and thus will be more interested in calm ponds, and females’ emotional thinking makes them prefer flowing and jumping water. In contrast, in an Argentine study, no differences were found between genders in water landscape preferences [79]. In addition, age also affects waterscape preferences. People younger than 18 prefer fountains. “I love seeing the splashes where my friends and I can play,” explained one pupil (12, male). In some studies, children are more attracted to flowing water than adults, they have a primordial attachment to water, and water brings them more simple pleasures [80,81]. The senior group (50–60 and >60 years old) prefers the quiet pond. Seniors generally decline in physical strength and energy, and their physiological functions are ageing. A quiet environment is conducive to inner peace and comfort. In addition, the Howley [76] study found that people’s preference for water decreases with age. This can be explained by the vulnerability of senior residents to the dangers of water features.
In terms of paving, rubber floors (61.2%) are the most selected, followed by grass planting tiles (36.7%), floor tiles (32.5%) and lastly, wood (13.5%) (Appendix C). According to the interviews, rubber floors are considered soft and slip-resistant, making them safer for the elderly and children. Second, they have rich colours, and better visual effects can be obtained. Previous studies have shown that hard surfaces are less attractive to people because hard surfaces remind people of an indoor working environment, and feel green and monotonous [82]. Therefore, some green plants can be reasonably matched around the hard floor so that people can feel the vitality and interest of the space, thereby reducing people’s negative emotions about the environment.
Age (p < 0.01) and education level (p < 0.01) have significant effects on the landscape preference of residents in old residential neighbourhoods (Appendix C). Although all ages have the same preference for rubber floors, people under 18 have a significantly higher preference for floor tiles than other ages, and their preference for planting grass is also significantly lower than other ages. This may be due to children’s lively and active characteristics, who like relatively empty venues without too many obstacles. Older residents (46−55, 56−60 and over 60) prefer grass-planted bricks. In this light, one of the retired seniors (62, female) said, “There is less green vegetation in the community, and grass-planting bricks can increase the green area of the community”.
4. Recommendations
Hunziker et al. [83] argued that landscape preferences differ significantly between planners and users. Therefore, great consideration should be given to the needs and feelings of users and the opinions of decision-makers. The transformation plan should be formulated rationally and scientifically and thoroughly consider the local community’s current situation. There is also a need to consider and balance the aesthetic and living needs of people with different attributes. Based on the analysis of the influence of the socio-demographic characteristics on the landscape preference of old residential neighbourhoods’ residents, the study puts forward the following suggestions:
Reasonable allocation of different landscape spaces should be carried out according to the landscape preferences of people with different attributes, especially for special groups such as seniors and children. Considering the shortage of outdoor space in old residential areas, a shared activity space that meets the needs of people of different ages can be comprehensively designed because it is a common phenomenon in China for grandparents to take care of children. When carrying out landscape collocation, attention should be paid to the combination and balance of natural elements and various facilities. A certain number of fitness facilities, leisure facilities, etc., should be added to meet the needs of daily residents’ activities.
Old residential neighbourhoods should have a reasonable layout regarding plant collocation, pay attention to the issue of plant diversity, and consider the collocation and changes of plants in four seasons. Plant some tall trees on the activity square and on the road to meet the needs of residents for shade. The green space at the front and back of the apartment is mainly composed of low shrubs, flowers and lawns, which can achieve a good landscape effect without blocking the light. However, considering the safety of residents and the lack of outdoor space, it is not easy to have too many or too dense plants.
Considering that some older adults like gardening and planting, some spaces can be divided for gardening and planting community gardens. At the same time, community managers should supervise them to ensure that other residents’ space rights and interests are not infringed. Although the form of horticultural planting is not a neat and standardised design, it reveals a rustic and unique beauty. The form of a community garden not only educates residents about nature, reduces the cost of property management and maintenance, but also adds more humanistic care to the community.
During the survey, it was found that the residents of old residential neighbourhoods have a low preference for decorative landscapes and water features, and they mainly focused on functional landscapes in landscape design. Due to the ageing drainage pipe network and the low drainage standard, the pipe network is often blocked on rainy days. In this regard, the design of the waterscape can help prevent large-scale waterlogging. The community can combine the concept of a rain garden to transform the green space into a sunken green space and lay permeable pavement to solve waterlogging and runoff pollution in old residential neighbourhoods during the rainy season.
5. Conclusions
Landscape preference is shaped by perception and is unique to a location, as people’s views of landscape elements and categories are often a natural reflection of their attitudes. It reflects people’s views of nature, shows their aesthetic needs, and is the main way people perceive their surroundings. This study focuses on old residential neighbourhoods and compares them with communities in other regions. Combined with the research virtual model method, the differences in preferences of different attribute groups for landscape elements and landscape types in old residential areas were analysed and compared. Old residential neighbourhoods are a common phenomenon in China’s rapid urbanisation, but they are a special pattern in disadvantaged communities. They have many similarities and differences with disadvantaged communities in other countries and regions. Due to the special living environment and social background, the residents of the old community have complex and diverse needs for landscape. Residents still prefer spaces with rich plants and high greening rate, and they care more about functionality and safety. The elderly have a special preference for spontaneous planting, drying space and activity space. In-depth study of its internal laws will help to understand the needs of different residents and create a more beneficial landscape for residents of old residential neighbourhoods. This study extends research trends in the landscape preference literature to old residential neighbourhoods and highlights the extent to which the physical characteristics of the environment, as well as demographic factors, influence residents’ perceptions of neighbourhood green spaces. The research methodology can be extended to other areas of disadvantaged community landscape preference research. It is hoped that this study will not only enrich the intuitive expression of landscape evaluation in terms of methods and techniques, it will also add valuable data to the scarce information of disadvantaged communities in the city. In the context of the current rapid urban development, landscape planning and design should focus on the special groups in the city, and the sensory appeal and emotional experience of residents should be considered and balanced when renovating old residential neighbourhoods. This study can not only provide new perspectives and feasible strategic suggestions for the improvement of the environmental quality of old residential neighbourhoods represented by Shijiazhuang, but also be applicable to other regions and cities undergoing rapid urbanisation to a certain extent.
Author Contributions
Conceptualization, S.M. and C.D.; methodology, S.M. and C.D.; validation, C.D. and Y.C.; formal analysis, Y.C.; investigation, C.D.; resources, C.D.; data curation, Y.C.; writing—original draft preparation, C.D. and S.M.; writing—review and editing, S.M. and C.D.; visualization, C.D.; supervision, S.M. and M.F.S.; project administration, S.M. All authors have read and agreed to the published version of the manuscript.
Funding
This research received no external funding.
Conflicts of Interest
The authors declare no conflict of interest.
Appendix A

Table A1.
The physical characteristics of the six landscapes.
| Soft Landscape | ||
|---|---|---|
| Planting pattern |  Lawn planting |  Tree planting |
 Natural planting |  Gardening planting | |
| Green space ratio |  Low green space ratio |  Medium green space ratio |
 High green space ratio |  Very high green space ratio | |
| Plant richness |  Low plant richness |  Medium plant richness |
 High plant richness |  Very high plant richness | |
| Hard landscape | ||
| Facilities |  Children activity facility |  Fitness facility |
 Decorative facility |  Leisure facility | |
| Waterscape |  Pond |  Fountain |
 Pool |  Waterwall | |
| Pavement |  Rubber |  Floor tiles |
 Grass planting tiles |  Wood | |
Appendix B
Table A2.
The analysis of the soft landscape preferences (chi-square test measure x2 and p-value).
| Please Select Your Preferred Planting Pattern? | |||||||
|---|---|---|---|---|---|---|---|
| Lawn Planting | Tree Planting | Natural Planting | Gardening Planting | x² | p | ||
| Total | 259 (%) | 261 (%) | 405 (%) | 242 (%) | |||
| Gender | Male | 101 (33.7%) | 121 (40.3%) | 178 (59.3%) | 103 (34.3%) | 3.058 | 0.383 |
| Female | 158 (42.9%) | 140 (38%) | 227 (61.7%) | 139 (37.8%) | |||
| 0 cells (0.0%) have expected count less than 5. The minimum expected count is 104.31. | |||||||
| Age | <18 | 5 (38.5%) | 4 (30.8%) | 6 (46.2%) | 1 (7.7%) | 41.263 | 0 *** |
| 18−30 | 96 (47.1%) | 63 (30.9%) | 120 (58.8%) | 54 (26.5%) | |||
| 31−45 | 68 (34%) | 81 (40.5%) | 129 (64.5%) | 56 (28%) | |||
| 46−55 | 56 (45.5%) | 58 (47.2%) | 69 (56.1%) | 58 (47.2%) | |||
| 56−60 | 19 (26%) | 31 (42.5%) | 43 (58.9%) | 40 (54.8%) | |||
| >60 | 15 (27.3%) | 24 (43.6%) | 38 (69.1%) | 33 (60%) | |||
| 0 cells (12.5%) have expected count less than 5. The minimum expected count is 3.32. | |||||||
| Education level | Primary school and below | 6 (37.5%) | 7 (43.8%) | 9 (56.3%) | 5 (31.3%) | 17.62 | 0.04 ** |
| Junior high school | 30 (34.1%) | 38 (43.2%) | 48 (54.5%) | 39 (44.3%) | |||
| High school | 69 (35%) | 83 (42.1%) | 123 (62.4%) | 95 (48.2%) | |||
| University degree or above | 154 (42%) | 133 (36.2%) | 225 (61.3%) | 103 (28.1%) | |||
| 0 cells (0.0%) have expected count less than 5. The minimum expected count is 69.05. | |||||||
| Marital status | Single | 76 (37.3%) | 71 (34.8%) | 124 (60.8%) | 62 (30.4%) | 2.18 | 0.536 |
| Married | 183 (39.4%) | 190 (40.9%) | 281 (60.6%) | 180 (38.8%) | |||
| 0 cells (0.0%) have expected count less than 5. The minimum expected count is 12.8. | |||||||
| Occupation | Student | 18 (%) | 13 (%) | 28 (%) | 9 (%) | 20.421 | 0.156 |
| Government sector | 30 (%) | 31 (%) | 40 (%) | 27 (%) | |||
| Private sector | 109 (%) | 93 (%) | 167 (%) | 84 (%) | |||
| Self-employed | 26 (%) | 25 (%) | 43 (%) | 23 (%) | |||
| Pensioner | 50 (%) | 61 (%) | 82 (%) | 75 (%) | |||
| Unemployed | 26 (%) | 38 (%) | 45 (%) | 24 (%) | |||
| 0 cells (0.0%) have expected count less than 5. The minimum expected count is 12.8. | |||||||
| Please select your preferred green space ratio? | |||||||
| Low green space ratio | Medium green space ratio | High green space ratio | Very high green space ratio | x² | p | ||
| Total | 83 (12.4%) | 202 (30.2%) | 294 (44%) | 260 (38.9%) | |||
| Gender | Male | 40 (10.4%) | 86 (%) | 126 (32.7%) | 133 (34.5%) | 5.062 | 0.167 |
| Female | 43 (9.522.3%) | 116 (25.6%) | 168 (37%) | 127 (28%) | |||
| 0 cells (0.0%) have expected count less than 5. The minimum expected count is 38.09. | |||||||
| Age | <18 | 4 (23.5%) | 4 (23.5%) | 4 (23.5%) | 5 (29.4%) | 31.263 | 0.008 *** |
| 18−30 | 34 (13.3%) | 60 (23.4%) | 90 (35.2%) | 72 (28.1%) | |||
| 31−45 | 16 (7%) | 52 (22.6%) | 94 (40.9%) | 68 (29.6%) | |||
| 46−55 | 17 (10.5%) | 53 (32.7%) | 51 (31.5%) | 41 (25.3%) | |||
| 56−60 | 19 (7.1%) | 18 (18.4%) | 30 (30.6%) | 43 (43.9%) | |||
| >60 | 5 (6.6%) | 15 (19.7%) | 25 (32.9%) | 31 (40.8%) | |||
| 0 cells (8.3%) have expected count less than 5. The minimum expected count is 1.68. | |||||||
| Education level | Primary school and below | 4 (16%) | 5 (20%) | 5 (20%) | 11 (44%) | 17.793 | 0.038 ** |
| Junior high school | 21 (16.9%) | 29 (23.4%) | 38 (30.6%) | 36 (29%) | |||
| High school | 15 (6.3%) | 58 (24.2%) | 82 (34.2%) | 85 (35.4%) | |||
| University degree or above | 43 (9.6%) | 110 (24.4%) | 169 (37.6%) | 128 (28.4%) | |||
| 0 cells (6.3%) have expected count less than 5. The minimum expected count is 2.47. | |||||||
| Marital status | Single | 32 (12.5%) | 58 (22.7%) | 81 (31.8%) | 84 (32.9%) | 4.456 | 0.216 |
| Married | 51 (8.7%) | 144 (24.7%) | 213 (36.5%) | 176 (30.1%) | |||
| 0 cells (0.0%) have expected count less than 5. The minimum expected count is 25.23. | |||||||
| Occupation | Student | 5 (8.1%) | 17 (27.4%) | 21 (33.9%) | 19 (30.6%) | 9.41 | 0.855 |
| Government sector | 11 (12.1%) | 20 (22%) | 35 (38.5%) | 25 (27.5%) | |||
| Private sector | 31 (9.3%) | 86 (25.7%) | 117 (34.9%) | 101 (30.1%) | |||
| Self-employed | 12 (14.3%) | 18 (21.4%) | 27 (32.1%) | 27 (32.1%) | |||
| Pensioner | 18 (10.2%) | 42 (23.7%) | 55 (31.1%) | 62 (35%) | |||
| Unemployed | 6 (6.7%) | 19 (21.1%) | 39 (43.3%) | 26 (28.9%) | |||
| 0 cells (0.0%) have expected count less than 5. The minimum expected count is 6.13. | |||||||
| Please select your preferred plant richness? | |||||||
| Low plant richness | Medium plant richness | High plant richness | Very high plant richness | x² | p | ||
| Total | 131 (19.6%) | 213 (31.9%) | 215 (32.2%) | 280 (41.9%) | |||
| Gender | Male | 57 (14.8%) | 85 (22%) | 106 (27.5%) | 138 (35.8%) | 5.672 | 0.129 |
| Female | 74 (16.3%) | 128 (28.3%) | 109 (24.1%) | 142 (31.3%) | |||
| 0 cells (0.0%) have expected count less than 5. The minimum expected count is 60.27. | |||||||
| Age | <18 | 5 (31.3%) | 4 (25%) | 2 (12.5%) | 5 (31.3%) | 16.202 | 0.369 |
| 18−30 | 42 (16.1%) | 69 (26.4%) | 67 (25.7%) | 83 (31.8%) | |||
| 31−45 | 28 (12.5%) | 57 (25.4%) | 59 (26.3%) | 80 (35.7%) | |||
| 46−55 | 28 (16.7%) | 50 (29.8%) | 47 (28%) | 43 (25.6%) | |||
| 56−60 | 15 (15.8%) | 18 (18.9%) | 22 (23.2%) | 40 (42.1%) | |||
| >60 | 13 (17.3%) | 15 (20%) | 18 (24%) | 29 (38.7%) | |||
| 0 cells (12.5%) have expected count less than 5. The minimum expected count is 2.5. | |||||||
| Education level | Primary school and below | 6 (25%) | 5 (20.8%) | 4 (16.7%) | 9 (37.5%) | 8.869 | 0.449 |
| Junior high school | 27 (22.1%) | 29 (23.8%) | 29 (23.8%) | 37 (30.3%) | |||
| High school | 38 (15.4%) | 60 (24.4%) | 61 (24.8%) | 87 (35.4%) | |||
| University degree or above | 60 (13.4%) | 119 (26.6%) | 121 (27.1%) | 147 (32.9%) | |||
| 0 cells (6.3%) have expected count less than 5. The minimum expected count is 3.75. | |||||||
| Marital status | Single | 41 (16%) | 60 (23.4%) | 63 (24.6%) | 92 (35.9%) | 1.464 | 0.619 |
| Married | 90 (15.4%) | 153 (26.2%) | 152 (26.1%) | 188 (32.2%) | |||
| 0 cells (0.0%) have expected count less than 5. The minimum expected count is 39.97. | |||||||
| Occupation | Student | 10 (15.2%) | 14 (21.2%) | 20 (30.3%) | 22 (33.3%) | 13.375 | 0.573 |
| Government sector | 14 (15.7%) | 25 (28.1%) | 24 (27%) | 26 (29.2%) | |||
| Private sector | 46 (13.7%) | 79 (23.6%) | 86 (25.7%) | 124 (37%) | |||
| Self-employed | 17 (20.5%) | 21 (25.3%) | 25 (30.1%) | 20 (24.1%) | |||
| Pensioner | 33 (19.1%) | 44 (25.4%) | 38 (22%) | 58 (33.5%) | |||
| Unemployed | 11 (11.8%) | 30 (32.3%) | 22 (23.7%) | 30 (32.3%) | |||
| 0 cells (0.0%) have expected count less than 5. The minimum expected count is 10.31. | |||||||
** p < 0.05, *** p < 0.01.
Appendix C
Table A3.
The analysis of the hard landscape preferences (chi-square test measure x2 and p-value).
| Please Select Your Preferred Facilities? | |||||||
|---|---|---|---|---|---|---|---|
| Children Activity Facility | Fitness Facility | Decorative Facility | Leisure Facility | x² | p | ||
| Total | 253 (37.9%) | 430 (64.4%) | 169 (25.3%) | 381 (57%) | |||
| Gender | Male | 103 (19.6%) | 181 (34.5%) | 65 (12.4%) | 176 (33.5%) | 3.611 | 0.307 |
| Female | 150 (21.2%) | 249 (35.2%) | 104 (14.7%) | 205 (29%) | |||
| 0 cells (0.0%) have expected count less than 5. The minimum expected count is 71.96. | |||||||
| Age | <18 | 7 (41.2%) | 5 (29.4%) | 1 (5.9%) | 4 (23.5%) | 45.274 | 0 *** |
| 18−30 | 80 (22.3%) | 117 (32.7%) | 64 (17.9%) | 97 (27.1%) | |||
| 31−45 | 95 (25.2%) | 121 (32.1%) | 55 (14.6%) | 106 (28.1%) | |||
| 46−55 | 32 (13.8%) | 84 (36.2%) | 33 (14.2%) | 83 (35.8%) | |||
| 56−60 | 23 (17%) | 58 (43%) | 5 (3.7%) | 49 (36.3%) | |||
| >60 | 16 (14%) | 45 (39.5%) | 11 (9.6%) | 42 (36.8%) | |||
| 0 cells (8.3%) have expected count less than 5. The minimum expected count is 2.33. | |||||||
| Education level | Primary school and below | 7 (25%) | 10 (35.7%) | 3 (10.7%) | 8 (28.6%) | 11.18 | 0.264 |
| Junior high school | 30 (18.4%) | 62 (38%) | 20 (12.3%) | 51 (31.3%) | |||
| High school | 67 (17.5%) | 139 (36.3%) | 44 (11.5%) | 133 (34.7%) | |||
| University degree or above | 149 (22.6%) | 219 (33.2%) | 102 (15.5%) | 189 (28.7%) | |||
| 0 cells (6.3%) have expected count less than 5. The minimum expected count is 3.84. | |||||||
| Marital status | Single | 64 (19.2%) | 114 (34.1%) | 52 (15.6%) | 104 (31.1%) | 1.65 | 0.648 |
| Married | 189 (21%) | 316 (35.2%) | 117 (13%) | 277 (30.8%) | |||
| 0 cells (0.0%) have expected count less than 5. The minimum expected count is 45.78. | |||||||
| Occupation | Student | 22 (27.8%) | 21 (26.6%) | 13 (16.5%) | 23 (29.1%) | 21.137 | 0.133 |
| Government sector | 34 (24.6%) | 44 (31.9%) | 20 (14.5%) | 40 (29%) | |||
| Private sector | 95 (19%) | 185 (36.9%) | 74 (14.8%) | 147 (29.3%) | |||
| Self-employed | 31 (25.4%) | 40 (32.8%) | 17 (13.9%) | 34 (27.9%) | |||
| Pensioner | 39 (15.1%) | 102 (39.4%) | 28 (10.8%) | 90 (34.7%) | |||
| Unemployed | 32 (23.9%) | 38 (28.4%) | 17 (12.7%) | 47 (35.1%) | |||
| 0 cells (0.0%) have expected count less than 5. The minimum expected count is 10.83. | |||||||
| Please select your preferred waterscape? | |||||||
| Pond | Fountain | Pool | Waterwall | x² | p | ||
| Total | 218 (32.6%) | 195 (29.2%) | 112 (16.8%) | 143 (21.4%) | |||
| Gender | Male | 121 (40.3%) | 80 (26.7%) | 46 (15.3%) | 53 (17.7%) | 15.306 | 0.002 *** |
| Female | 97 (26.4%) | 115 (31.3%) | 66 (17.9%) | 90 (24.5%) | |||
| Age | <18 | 2 (15.4%) | 7 (53.8%) | 3 (23.1%) | 1 (7.7%) | 51.173 | 0 *** |
| 18−30 | 59 (28.9%) | 67 (32.8%) | 29 (14.2%) | 49 (24%) | |||
| 31−45 | 61 (30.5%) | 60 (30%) | 34 (17%) | 45 (22.5%) | |||
| 46−55 | 28 (22.8%) | 29 (23.6%) | 29 (23.6%) | 37 (30.1%) | |||
| 56−60 | 38 (52.1%) | 21 (28.8%) | 8 (11%) | 6 (8.2%) | |||
| >60 | 30 (54.5%) | 11 (20%) | 9 (16.4%) | 5 (9.1%) | |||
| 0 cells (16.7%) have expected count less than 5. The minimum expected count is 2.18. | |||||||
| Education level | Primary school and below | 8 (50%) | 3 (18.8%) | 3 (18.8%) | 2 (12.5%) | 7.613 | 0.574 |
| Junior high school | 30 (34.1%) | 29 (33%) | 16 (18.2%) | 13 (14.8%) | |||
| High school | 69 (35%) | 57 (28.9%) | 28 (14.2%) | 43 (21.8%) | |||
| University degree or above | 111 (30.2%) | 106 (28.9%) | 65 (17.7%) | 85 (23.2%) | |||
| 0 cells (18.8%) have expected count less than 5. The minimum expected count is 2.68. | |||||||
| Marital status | Single | 70 (34.3%) | 66 (32.4%) | 28 (13.7%) | 40 (19.6%) | 3.323 | 0.344 |
| Married | 148 (31.9%) | 129 (27.8%) | 84 (18.1%) | 103 (22.2%) | |||
| 0 cells (0.0%) have expected count less than 5. The minimum expected count is 34.2. | |||||||
| Occupation | Student | 15 (30.6%) | 19 (38.8%) | 6 (15.5%) | 9 (18.4%) | 17.016 | 0.318 |
| Government sector | 28 (39.4%) | 16 (22.5%) | 11 (16.7%) | 16 (22.5%) | |||
| Private sector | 87 (30.9%) | 85 (30.1%) | 47 (22.1%) | 63 (22.3%) | |||
| Self-employed | 19 (27.9%) | 15 (22.1%) | 15 (17.4%) | 19 (27.9%) | |||
| Pensioner | 53 (40.2%) | 35 (26.5%) | 23 (15.2%) | 21 (15.9%) | |||
| Unemployed | 16 (24.2%) | 25 (37.9%) | 10 (16.8%) | 15 (22.7%) | |||
| 0 cells (0.0%) have expected count less than 5. The minimum expected count is 8.22. | |||||||
| Please select your preferred pavement? | |||||||
| Rubber | Floor tiles | Grass planting tiles | Wood | x² | p | ||
| Total | 409 (61.2%) | 157 (23.5%) | 245 (36.7%) | 90 (13.5%) | |||
| Gender | Male | 186 (46.6%) | 64 (16%) | 114 (28.6%) | 35 (8.8%) | 2.587 | 0.46 |
| Female | 223 (44.4%) | 93 (18.5%) | 131 (26.1%) | 55 (11%) | |||
| 0 cells (0.0%) have expected count less than 5. The minimum expected count is 39.86. | |||||||
| Age | <18 | 6 (46.2%) | 4 (30.8%) | 1 (7.7%) | 2 (15.4%) | 31.632 | 0.007 *** |
| 18−30 | 130 (48.5%) | 50 (18.7%) | 51 (19%) | 37 (13.8%) | |||
| 31−45 | 128 (48.7%) | 42 (16%) | 70 (26.6%) | 23 (8.7%) | |||
| 46−55 | 62 (36%) | 35 (20.3%) | 60 (34.9%) | 15 (8.7%) | |||
| 56−60 | 49 (46.7%) | 12 (11.4%) | 36 (34.3%) | 8 (7.6%) | |||
| >60 | 34 (42.5%) | 14 (17.5%) | 27 (33.8%) | 5 (6.3%) | |||
| 0 cells (12.5%) have expected count less than 5. The minimum expected count is 1.3. | |||||||
| Education level | Primary school and below | 8 (34.8%) | 3 (13%) | 7 (30.4%) | 5 (21.7%) | 17.988 | 0.035 ** |
| Junior high school | 58 (45.3%) | 22 (17.2%) | 38 (29.7%) | 10 (7.8%) | |||
| High school | 114 (41.9%) | 50 (18.4%) | 90 (33.1%) | 18 (6.6%) | |||
| University degree or above | 229 (47.9%) | 82 (17.2%) | 110 (23%) | 57 (11.9%) | |||
| 0 cells (12.5%) have expected count less than 5. The minimum expected count is 2.3. | |||||||
| Marital status | Single | 121 (46.2%) | 49 (18.7%) | 61 (23.3%) | 31 (11.8%) | 3.729 | 0.292 |
| Married | 288 (45.1%) | 108 (16.9%) | 184 (28.8%) | 59 (9.2%) | |||
| 0 cells (0.0%) have expected count less than 5. The minimum expected count is 26.17. | |||||||
| Occupation | Student | 25 (37.3%) | 18 (26.9%) | 15 (22.4%) | 9 (13.4%) | 21.86 | 0.112 |
| Government sector | 44 (47.8%) | 14 (15.2%) | 22 (23.9%) | 12 (13%) | |||
| Private sector | 181 (49.5%) | 59 (16.1%) | 92 (25.1%) | 34 (9.3%) | |||
| Self-employed | 38 (43.7%) | 18 (20.7%) | 22 (25.3%) | 9 (10.3%) | |||
| Pensioner | 76 (40.9%) | 33 (17.7%) | 66 (35.5%) | 11 (5.9%) | |||
| Unemployed | 45 (43.7%) | 15 (14.6%) | 28 (27.2%) | 15 (14.6%) | |||
| 0 cells (0.0%) have expected count less than 5. The minimum expected count is 6.69. | |||||||
** p < 0.05, *** p < 0.01.
References
- Wang, R. Outdoor Space Environment Design of Residential Area—Study on the Reality of Residential Area in Zhengzhou City. Master’s Thesis, Zhengzhou University, Zhengzhou, China, 2006. [Google Scholar]
- Dechaicha, A.; Daikh, A.; Alkama, D. Monitoring and Landscape Quantification of Uncontrolled Urbanisation in Oasis Regions: The Case of Adrar City in Algeria. J. Contemp. Urban Aff. 2021, 5, 209–219. [Google Scholar] [CrossRef]
- Davies, J.S. Partnerships and Regimes: The Politics of Urban Regeneration in the UK; Routledge: New York, NY, USA, 2017. [Google Scholar]
- Patino, M. Poor Neighborhoods Are Only Getting Poorer; Bloomberg CityLab. 2020. Available online: https://www.bloomberg.com/news/articles/2020-05-26/poor-neighborhoods-fall-deeper-into-poverty (accessed on 19 February 2022).
- Okpala, D.C.I. The Second United Nations Conference on Human Settlements (Habitat II). Third World Plan. Rev. 1996, 18, 3. [Google Scholar] [CrossRef]
- Larsen, L.; Harlan, S.L. Desert dreamscapes: Residential landscape preference and behavior. Landsc. Urban Plan. 2006, 78, 85–100. [Google Scholar] [CrossRef]
- Yü, Y.; Prell, C.; Skaggs, R.; Hubacek, K. Landscape Preferences in a Desert City in the American Southwest. Scott. Geogr. J. 2015, 131, 36–48. [Google Scholar] [CrossRef]
- Zheng, B.; Zhang, Y.; Chen, J. Preference to home landscape: Wildness or neatness? Landsc. Urban Plan. 2011, 99, 1–8. [Google Scholar] [CrossRef]
- Machemer, P.L.; Bruch, S.P.; Kuipers, R. Comparing Rural and Urban Children’s Perceptions of an Ideal Community. J. Plan. Educ. Res. 2008, 28, 143–160. [Google Scholar] [CrossRef]
- Chen, Y.; Liu, T.; Xie, X.; Marušić, B.G. What Attracts People to Visit Community Open Spaces? A Case Study of the Overseas Chinese Town Community in Shenzhen, China. Int. J. Environ. Res. Public Health 2016, 13, 644. [Google Scholar] [CrossRef]
- Pratiwi, P.; Furuya, K. Characteristics of Tokiwadaira Neighbourhood Park in Matsudo, Japan: A space for the elderly. Environ. Proc. J. 2018, 3, 37. [Google Scholar] [CrossRef]
- Marquet, O.; Hipp, J.A.; Alberico, C.; Huang, J.-H.; Fry, D.; Mazak, E.; Lovasi, G.S.; Floyd, M.F. Park use preferences and physical activity among ethnic minority children in low-income neighborhoods in New York City. Urban For. Urban Green. 2019, 38, 346–353. [Google Scholar] [CrossRef]
- Vaughan, C.A.; Colabianchi, N.; Hunter, G.P.; Beckman, R.; Dubowitz, T. Park use in low-income urban neighborhoods: Who uses the parks and why? J. Urban Health 2018, 95, 222–231. [Google Scholar] [CrossRef]
- Ghanbari-Azarneir, S.; Anbari, S.; Hosseini, S.-B.; Yazdanfar, S.-A. Identification of Child-friendly Environments in Poor Neighborhoods. Procedia-Soc. Behav. Sci. 2015, 201, 19–29. [Google Scholar] [CrossRef]
- Heynen, N.; Perkins, H.A.; Roy, P. The political ecology of uneven urban green space: The impact of political economy on race and ethnicity in producing environmental inequality in Milwaukee. Urban Aff. Rev. 2006, 42, 3–25. [Google Scholar] [CrossRef]
- Jennings, V.; Gaither, C.J.; Gragg, R.S. Promoting Environmental Justice through Urban Green Space Access: A Synopsis. Environ. Justice 2012, 5, 1–7. [Google Scholar] [CrossRef]
- Chenyang, D.; Maruthaveeran, S.; Shahidan, M.F. The usage, constraints and preferences of green space at disadvantage neighbourhood: A review of empirical evidence. Urban For. Urban Green. 2022, 127696. [Google Scholar] [CrossRef]
- Yan, M.Y. Research on the Governing Measure of Old Open Community. Master’s Thesis, Shandong University, Shandong, China, 2015. [Google Scholar]
- Liang, C.Z.; Li, C. The main methods and thinking of comprehensive reconstruction of old residential areas in Beijing. Constr. Sci. Technol. 2016, 9, 20–23. [Google Scholar]
- Zhang, L. Study on the Transformation of Old Residential District. Master’s Thesis, Tianjin University, Tianjin, China, 2017. [Google Scholar]
- Wu, K. Study on the Transformation and Upgrading of Old ResidentialAreas’ Green Environment. Master’s Thesis, Xinjiang Agricultural University, Xinjiang, China, 2016. [Google Scholar]
- Li, D.Z.; Zhang, M.; Guan, N.N.; Zhang, L.; Gu, T. Research on the Influencing Factors of Resident Participation in the Reconstruction of Old Residential Areas—A Case Study of Nanjing. Constr. Econ. 2019, 40, 93–99. [Google Scholar]
- Wu, Y. A Dissertation Submitted to Guangdong University of Technology for the Degree of Master. Master’s Thesis, Guangdong University of Technology, Guangdong, China, 2019. [Google Scholar]
- Shi, Z. A Study on the Social WorkIntervention of ”Micro-autonomy” inUrban Old CommunityBased on the Practice of YZ Community in Wuhan City. Master’s Thesis, Central China Normal University, Wuhan, China, 2017. [Google Scholar]
- Chen, W.Y.; Hu, J.; Wang, H. Review of research on landscape preference and planting space landscape preference. Shandong For. Sci. Technol. 2014, 153, 54–56. [Google Scholar]
- Kaplan, S. Aesthetics, affect, and cognition: Environmental preference from an evolutionary perspective. Environ. Behav. 1987, 19, 3–32. [Google Scholar] [CrossRef]
- Ma, M.Y. Research on Survey and Optimization Strategy of Habitat Garden Landscape Preference Based on Public Perception—Taking Nanmen Garden of Xi’an University of Architecture and Technology as an Example. Master’s Thesis, Xi’an University of Architecture and Technology, Xi’an, China, 2019. [Google Scholar]
- Dramstad, W.E.; Tveit, M.S.; Fjellstad, W.J.; Fry, G.L. Relationships between visual landscape preferences and map-based indicators of landscape structure. Landsc. Urban Plan. 2006, 78, 465–474. [Google Scholar] [CrossRef]
- Hetherington, J.; Daniel, T.C.; Brown, T.C. Is motion more important than it sounds?: The medium of presentation in environment perception research. J. Environ. Psychol. 1993, 13, 283–291. [Google Scholar] [CrossRef]
- Kaymaz, I.C. Landscape Perception. Landsc. Plan. 2012, 251–276. [Google Scholar] [CrossRef]
- Buttel, F. New directions in environment sociology. Annu. Rev. Sociol. 1987, 13, 465–488. [Google Scholar] [CrossRef]
- Ma, X.; Bateson, D.J. A Multivariate Analysis of the Relationship Between Attitude Toward Science and Attitude toward the Environment. J. Environ. Educ. 1999, 31, 27–32. [Google Scholar] [CrossRef]
- Yu, K. Cultural variations in landscape preference: Comparisons among Chinese sub-groups and Western design experts. Landsc. Urban Plan. 1995, 32, 107–126. [Google Scholar] [CrossRef]
- Hilaire, R.S.; VanLeeuwen, D.M.; Torres, P. Landscape Preferences and Water Conservation Choices of Residents in a High Desert Environment. Horttechnology 2010, 20, 308–314. [Google Scholar] [CrossRef]
- Yang, B.-E.; Brown, T.J. A Cross-Cultural Comparison of Preferences for Landscape Styles and Landscape Elements. Environ. Behav. 1992, 24, 471–507. [Google Scholar] [CrossRef]
- Pratiwi, P.I.; Sulistyantara, B.; Sisriany, S.; Lazuardi, S.N. The Psychological Effects of Park Therapy Components on Campus Landscape Preferences. J. Contemp. Urban Aff. 2022, 6, 143–155. [Google Scholar] [CrossRef]
- Jiang, B.; Larsen, L.; Deal, B.; Sullivan, W.C. A dose–response curve describing the relationship between tree cover density and landscape preference. Landsc. Urban Plan. 2015, 139, 16–25. [Google Scholar] [CrossRef]
- Zhang, G.; Yang, J.; Wu, G.; Hu, X. Exploring the interactive influence on landscape preference from multiple visual attributes: Openness, richness, order, and depth. Urban For. Urban Green. 2021, 65, 127363. [Google Scholar] [CrossRef]
- Wang, R.; Zhao, J. Demographic groups’ differences in visual preference for vegetated landscapes in urban green space. Sustain. Cities Soc. 2017, 28, 350–357. [Google Scholar] [CrossRef]
- Fan, R.; Fan, J.; Song, J.; Li, K.; Ji, W. Naturalness in the City: Demographic Groups’ Differences in Preference for Deciduous Landscape. Sustainability 2021, 13, 7615. [Google Scholar] [CrossRef]
- Sevenant, M.; Antrop, M. The use of latent classes to identify individual differences in the importance of landscape dimensions for aesthetic preference. Land Use Policy 2010, 27, 827–842. [Google Scholar] [CrossRef]
- Berg, A.E.V.D.; Koole, S.L. New wilderness in the Netherlands: An investigation of visual preferences for nature development landscapes. Landsc. Urban Plan. 2006, 78, 362–372. [Google Scholar] [CrossRef]
- Dearden, P. Factors influencing landscape preferences: An empirical investigation. Landsc. Plan. 1984, 11, 293–306. [Google Scholar] [CrossRef]
- Sugiyama, T.; Francis, J.; Middleton, N.J.; Owen, N.; Giles-Corti, B. Associations between Recreational Walking and Attractiveness, Size, and Proximity of Neighborhood Open Spaces. Am. J. Public Health 2010, 100, 1752–1757. [Google Scholar] [CrossRef]
- Castonguay, G.; Jutras, S. Children’s appreciation of outdoor places in a poor neighborhood. J. Environ. Psychol. 2008, 29, 101–109. [Google Scholar] [CrossRef]
- Lyons, E. Demographic Correlates of Landscape Preference. Environ. Behav. 1983, 15, 487–511. [Google Scholar] [CrossRef]
- Hull, R.B., IV; Reveli, G.R. Cross-cultural comparison of landscape scenic beauty evaluations: A case study in Bali. J. Environ. Psychol. 1989, 9, 177–191. [Google Scholar] [CrossRef]
- Wang, Y. Research on Landscape Design Strategy for Outdoor Rehabilitation of Ellderly Activities Spacein Shijiazhuang Residential District. Master’s Thesis, Northeast Forestry University, Harbin, China, 2020. [Google Scholar]
- Shijiazhuang Municipal People’s Government. 2019. Available online: http://www.sjz.gov.cn/zfxxgk/col/1583914146048/2020/03/31/1585618497432.html2 (accessed on 23 July 2022).
- Gong, S.J. Research on Wetland of Residential Area and Residents’ behavior in Nanchang. Master’s Thesis, Huaqiao University, Huaqiao, China, 2015. [Google Scholar]
- McHugh, M.L. The Chi-square test of independence. Biochem. Med. 2013, 23, 143–149. [Google Scholar] [CrossRef]
- Wang, S. An Empirical Study on Growth Circumstances of Foster Children—A Perspective from the County Educational Administration. Ph.D. Thesis, East China Normal University, Shanghai, China, 2016. [Google Scholar]
- Lindemann-Matthies, P.; Briegel, R.; Schüpbach, B.; Junge, X. Aesthetic preference for a Swiss alpine landscape: The impact of different agricultural land-use with different biodiversity. Landsc. Urban Plan. 2010, 98, 99–109. [Google Scholar] [CrossRef]
- Bandura, A. Social Cognitive Theory: An Agentic Perspective. Annu. Rev. Psychol. 1991, 2, 21–41. [Google Scholar]
- Watt, J.H., Jr.; Van Den Berg, S.A. Time series analysis of alternative media effects theories. Ann. Int. Commun. Assoc. 1978, 2, 215–224. [Google Scholar] [CrossRef]
- Cai, K.; Huang, W.; Lin, G. Bridging landscape preference and landscape design: A study on the preference and optimal combination of landscape elements based on conjoint analysis. Urban For. Urban Green. 2022, 73, 127615. [Google Scholar] [CrossRef]
- Talen, E.; Coffindaffer, M. The utopianism of children: An empirical study of children’s neighborhood design preferences. J. Plan. Educ. Res. 1999, 18, 321–331. [Google Scholar] [CrossRef] [Green Version]
- Baran, P.K.; Tabrizian, P.; Zhai, Y.; Smith, J.W.; Floyd, M.F. An exploratory study of perceived safety in a neighborhood park using immersive virtual environments. Urban For. Urban Green. 2018, 35, 72–81. [Google Scholar] [CrossRef]
- Maruthaveeran, S.; Bosh, C.K.V.D. Fear of crime in urban parks—What the residents of Kuala Lumpur have to say? Urban For. Urban Green. 2015, 14, 702–713. [Google Scholar] [CrossRef]
- Zandieh, R.; Martinez, J.; Flacke, J. Older Adults’ Outdoor Walking and Inequalities in Neighbourhood Green Spaces Characteristics. Int. J. Environ. Res. Public Health 2019, 16, 4379. [Google Scholar] [CrossRef]
- Wei, F.; Wang, Y.; Chen, L.; Liu, Y. Renovation of informal green spaces in old urban residential communities in chinese cities and related public perception investigation. Landsc. Arch. Front. 2020, 8, 30–45. [Google Scholar] [CrossRef]
- Kuper, R. Evaluations of landscape preference, complexity, and coherence for designed digital landscape models. Landsc. Urban Plan. 2017, 157, 407–421. [Google Scholar] [CrossRef]
- Säumel, I.; Hogrefe, J.; Battisti, L.; Wachtel, T.; Larcher, F. The healthy green living room at one’s doorstep? Use and perception of residential greenery in Berlin, Germany. Urban For. Urban Green. 2021, 58, 126949. [Google Scholar] [CrossRef]
- Orians, G.H.; Heerwagen, J.H. Humans, Habitats and Aesthetics. In The Biophilia Hypothesis; Island Press: Washington, DC, USA, 1993. [Google Scholar]
- Kuper, R. Effects of Flowering, Foliation, and Autumn Colors on Preference and Restorative Potential for Designed Digital Landscape Models. Environ. Behav. 2020, 52, 544–576. [Google Scholar] [CrossRef]
- Raupp, M.J.; Shrewsbury, P.M.; Herms, D.A. Ecology of Herbivorous Arthropods in Urban Landscapes. Annu. Rev. Èntomol. 2010, 55, 19–38. [Google Scholar] [CrossRef]
- Zhao, J. Woody Plant Richness and Landscape Preference. Ph.D. Dissertation, University of Illinois at Urbana-Champaign, Champaign, IL, USA, 2014. [Google Scholar]
- Qiu, L.; Lindberg, S.; Nielsen, A.B. Is biodiversity attractive?—On-site perception of recreational and biodiversity values in urban green space. Landsc. Urban Plan. 2013, 119, 136–146. [Google Scholar] [CrossRef]
- Strumse, E. Demographic differences in the visual preferences for agrarian landscapes in western Norway. J. Environ. Psychol. 1996, 16, 17–31. [Google Scholar] [CrossRef]
- Lindemann-Matthies, P.; Bose, E. Species richness, structural diversity and species composition in meadows created by visitors of a botanical garden in Switzerland. Landsc. Urban Plan. 2007, 79, 298–307. [Google Scholar] [CrossRef]
- Wang, X.; Rodiek, S. Older Adults’ Preference for Landscape Features Along Urban Park Walkways in Nanjing, China. Int. J. Environ. Res. Public Health 2019, 16, 3808. [Google Scholar] [CrossRef]
- Fu, X.Y.; Jiang, S.; Wang, X.N.; Zou, T.A.; Kang, D.; Xing, J.X. Taking Harbin Pingfang Park as an Example. J. Southwest China Norm. Univ. Nat. Sci. Ed. 2020, 45, 127–136. [Google Scholar]
- Wen, C.; Albert, C.; Von Haaren, C. The elderly in green spaces: Exploring requirements and preferences concerning nature-based recreation. Sustain. Cities Soc. 2018, 38, 582–593. [Google Scholar] [CrossRef]
- Steinitz, C. Toward a sustainable landscape with high visual preference and high ecological integrity: The loop road in Acadia National Park, USA. Landsc. Urban Plan. 1990, 19, 213–250. [Google Scholar] [CrossRef]
- Howley, P. Landscape aesthetics: Assessing the general publics’ preferences towards rural landscapes. Ecol. Econ. 2011, 72, 161–169. [Google Scholar] [CrossRef]
- Polat, A.T.; Akay, A. Relationships between the visual preferences of urban recreation area users and various landscape design elements. Urban For. Urban Green. 2015, 14, 573–582. [Google Scholar] [CrossRef]
- Park, J.J.; Jorgensen, A.; Selman, P.; Swanwick, C. Relationships between Environmental Values and the Acceptability of Mobile Telecommunications Development in a Protected Area. Landsc. Res. 2008, 33, 587–604. [Google Scholar] [CrossRef]
- Faggi, A.; Breuste, J.; Madanes, N.; Gropper, C.; Perelman, P. Water as an appreciated feature in the landscape: A comparison of residents’ and visitors’ preferences in Buenos Aires. J. Clean. Prod. 2013, 60, 182–187. [Google Scholar] [CrossRef]
- Yamashita, S. Perception and evaluation of water in landscape: Use of Photo-Projective Method to compare child and adult residents’ perceptions of a Japanese river environment. Landsc. Urban Plan. 2002, 62, 3–17. [Google Scholar] [CrossRef]
- Zube, E.H.; Pitt, D.G.; Evans, G.W. A lifespan developmental study of landscape assessment. J. Environ. Psychol. 1983, 3, 115–128. [Google Scholar] [CrossRef]
- Duan, Y.; Li, S. Study of Different Vegetation Types in Green Space Landscape Preference: Comparison of Environmental Perception in Winter and Summer. Sustainability 2022, 14, 3906. [Google Scholar] [CrossRef]
- Hunziker, M.; Felber, P.; Gehring, K.; Buchecker, M.; Bauer, N.; Kienast, F. Evaluation of landscape change by different social groups. Mt. Res. Dev. 2008, 28, 140–147. [Google Scholar] [CrossRef]
- Bryan, B.A.; Raymond, C.; Crossman, N.; King, D. Comparing Spatially Explicit Ecological and Social Values for Natural Areas to Identify Effective Conservation Strategies. Conserv. Biol. 2011, 25, 172–181. [Google Scholar] [CrossRef]
Figure 1.
The location of Shijiazhuang, Hebei Province, China.

Table 1.
Demographic background of the respondents (N = 668).
| Respondents Profile | Number (N) | Percentage (%) |
|---|---|---|
| Gender | ||
| Male | 300 | 44.9% |
| Female | 368 | 55.1% |
| Age | ||
| <18 | 13 | 2% |
| 18−30 | 204 | 30.5% |
| 31−45 | 200 | 29.9% |
| 46−55 | 123 | 18.4% |
| 56−60 | 73 | 10.9% |
| >60 | 55 | 8.2% |
| Education level | ||
| Primary school and below | 16 | 2.4% |
| Junior high school | 88 | 13.2% |
| High school | 197 | 29.5% |
| University degree or above | 367 | 54.9% |
| Marital status | ||
| Single | 204 | 30.5% |
| Married | 464 | 69.5% |
| Occupation | ||
| Student | 49 | 7.3% |
| Government sector | 71 | 10.6% |
| Private sector | 282 | 42.2% |
| Self-employed | 68 | 10.1% |
| Pensioner | 132 | 19.8% |
| Unemployed | 66 | 9.9% |
Disclaimer/Publisher’s Note: The statements, opinions and data contained in all publications are solely those of the individual author(s) and contributor(s) and not of MDPI and/or the editor(s). MDPI and/or the editor(s) disclaim responsibility for any injury to people or property resulting from any ideas, methods, instructions or products referred to in the content. |
© 2023 by the authors. Licensee MDPI, Basel, Switzerland. This article is an open access article distributed under the terms and conditions of the Creative Commons Attribution (CC BY) license (https://creativecommons.org/licenses/by/4.0/).
Share and Cite
MDPI and ACS Style
Dai, C.; Maruthaveeran, S.; Shahidan, M.F.; Chu, Y. Landscape Preference Evaluation of Old Residential Neighbourhoods: A Case Study in Shi Jiazhuang, Hebei Province, China. Forests 2023, 14, 375. https://doi.org/10.3390/f14020375
AMA Style
Dai C, Maruthaveeran S, Shahidan MF, Chu Y. Landscape Preference Evaluation of Old Residential Neighbourhoods: A Case Study in Shi Jiazhuang, Hebei Province, China. Forests. 2023; 14(2):375. https://doi.org/10.3390/f14020375
Chicago/Turabian StyleDai, Chenyang, Sreetheran Maruthaveeran, Mohd Fairuz Shahidan, and Yichun Chu. 2023. "Landscape Preference Evaluation of Old Residential Neighbourhoods: A Case Study in Shi Jiazhuang, Hebei Province, China" Forests 14, no. 2: 375. https://doi.org/10.3390/f14020375
Note that from the first issue of 2016, this journal uses article numbers instead of page numbers. See further details here.