Article

Soil-Available Nutrients Associated with Soil Chemical and Aggregate Properties following Vegetation Restoration in Western Sichuan, China

1
School of Life Science and Engineering, Southwest University of Science and Technology, Mianyang 621010, China
2
College of Forestry, Sichuan Agricultural University, Chengdu 611130, China
3
Water Management Station, Water Authority, Luzhou 646000, China
4
College of Soil and Water Conservation, Beijing Forestry University, Beijing 100083, China
*
Authors to whom correspondence should be addressed.
These authors contributed equally to this work.
Forests 2023, 14(2), 259; https://doi.org/10.3390/f14020259
Submission received: 19 November 2022 / Revised: 10 January 2023 / Accepted: 11 January 2023 / Published: 30 January 2023
(This article belongs to the Special Issue Effects of Disturbances on Forest Soil Biochemistry)

Abstract

:
The status and drivers of soil-available nutrients in plant-recovered soils are not fully understood, limiting our ability to explore the role of soil-available nutrients in soil geochemical cycling and ecosystem sustainability. Here, we combined the spatial distribution of soil-available nutrients and chemical and aggregate properties from six soil types (subalpine meadow soil, meadow soil, dark brown soil, brown soil, yellow-brown soil, and cinnamon soil) and three horizons (a leaching horizon, sediment horizon, and parent material horizon) to study the status and drivers of soil-available nutrients. Our findings reveal that the soil-available nitrogen (AN) ranged from 72.33 to 169.67 mg/kg, the soil-available phosphorus (AP) ranged from 1.77 to 75.90 mg/kg, and the soil-available potassium (AK) ranged from 46.43 to 88.55 mg/kg in the six soil types. The subalpine meadow soil and the dark brown soil had the highest soil AN, with means of 169.67 and 139.35 mg/kg, respectively. The brown soil had the highest soil AP, with a mean of 75.9 mg/kg, and the dark brown soil and the brown soil had the highest soil AK, with means of 83.49 and 88.55 mg/kg, respectively. The results show that the soil types and soil depths had a significant impact on the status of AN, AP, and AK (p < 0.05). Moreover, a higher cation exchange capacity (CEC), the macro-aggregate contents (with 2–1 mm and 1–0.5 mm particle sizes) of the non-water-stable aggregates, and the macro-aggregate content and stability (2–1 mm particle size and geometric mean diameter (GMD) of the water-stable aggregates were deemed to facilitate soil-available nitrogen because of the positive correlations (p < 0.05). Lower exchangeable cations (ECs) and the micro-aggregate content (≤0.1 mm particle size) of the water-stable aggregates and higher soil cations helped in the accumulation of soil-available phosphorus and soil-available potassium, respectively. Moreover, the regulation of the soil chemical and aggregate properties was found to vary with soil type and horizon in a correlation analysis. Together, our results provide insights into the importance of chemical and aggregate properties in regulating soil nutrient availability across soil types, as well as providing strong support for the inclusion of soil resource utilization in regional forest restoration and management.

1. Introduction

It has long been known that soil-available nutrients can constrain ecosystem functioning and plant growth [1,2]. Nitrogen (N) was first considered to be the main limiting nutrient, promoting the productivity of vegetation and carbon (C) storage in terrestrial ecosystems [3,4]. Similarly, phosphorus (P) and potassium (K) are resources, which often limit plant growth and reproduction, particularly in some old soils [5,6]. The availability of these soil nutrients is related to the physical, chemical, and biological coupling processes in soil [7,8]. For example, Peterson et al. (1985) showed that the seasonal changes in soil-available N (AN, including ammonium nitrogen and nitrate nitrogen) in forest soil are related to soil organic carbon (SOC) and soil mineralization processes and that the availability of soil P is affected by pH and O2 conditions [9]. Therefore, understanding the soil AN, phosphorus, and potassium distributions and their relationships with soil physics and chemistry are crucial prerequisites for evaluating nutrient status at regional and global scales.
The ability of soil aggregate properties to expand the volume of soil-available nutrients is one widespread mechanism of soil nutrient availability [10,11]. The adsorption capacity of the soil exchangeable cation capacity can be quantified via soil cation exchange, which influences soil nutrient availability [12]. During the fertilizer retention process, cationic nutrients and those that can be used by plants, such as N, P, and K, are stored temporarily through cation adsorption on the colloidal surface. Conversely, during the fertilizer supply process, cationic nutrients are released by cations that dissociate into the soil solution [10,13]. Soil aggregation has been found to accelerate the accumulation of soil nutrients through non-capillary porosity, cation adsorption, and microbial activity enhancement [14]. The evidence of the significant role of soil aggregates indicates that >5 and <0.25 mm size fractions, as the main carriers of soil organic C and nutrients, have relatively high stocks of SOC, total N, available phosphorus (AP), as well as exchangeable cation elements [15]. Most researchers have observed that the vertical distribution of nutrient content tends to be spatially heterogeneous, being higher in the upper layer of the soil [16,17]. However, the driving factors of soil-available nutrients based on soil genetic horizons remain unclear, especially in the ecosystem of vegetation restoration.
The natural forest in Southwest China has decreased by 35.1% due to the massive deforestation in the 1950s–1980s [18,19]. The ecosystem of west Sichuan in Southwest China has been characterized as an ecologically fragile area, with low nutrient availability and disturbed biodiversity [20]. Vegetation restoration has been widely used to restore the disturbed ecosystem because in an attempt to reduce soil erosion and improve soil nutrient availability for plants [21,22]. Benefitting from the “forest plantation program” and the “Grain to Green” program in China (ecological restoration programs dominate vegetation greening in China) [23,24], the natural forest in Southwest China is expected to spontaneously return to the pre-disturbance equilibrium state. Previous studies have revealed increases in soil nutrient accumulation during the vegetation restoration process. For example, a meta-analysis in China has revealed that restoration actions have made a large contribution to the recovery of soil nutrients, especially soil nitrogen and phosphorus [25]. A study of four vegetation recovery stages (grassland, shrub grass, bush forest, and secondary forest stages) has also shown that revegetation improves soil composition and promotes the formation of macro-aggregates [26]. Hence, studying the status and drivers of soil AN, AP, and available potassium (AK) content provides favorable evidence for exploring and understanding the functional role of the vegetation restoration of soil systems in the nutrient geochemical cycle.
In this paper, we aim to study the status of soil AN, AP, and AK nutrients in six typical soil types under long-term vegetation restoration in Southwest China. The goals of this study are as follows: (1) to explore the patterns of soil-available nutrients content and soil chemical and aggregate properties in six soil types (namely, subalpine meadow soil, meadow soil, dark brown soil, brown soil, yellow-brown soil, and cinnamon soil) and three horizons (a leaching horizon, sediment horizon, and parent material horizon) in western Sichuan, China, and (2) to identify how the soil chemical and aggregate properties regulate soil-available nutrients across the six soil types and three horizons.

2. Materials and Methods
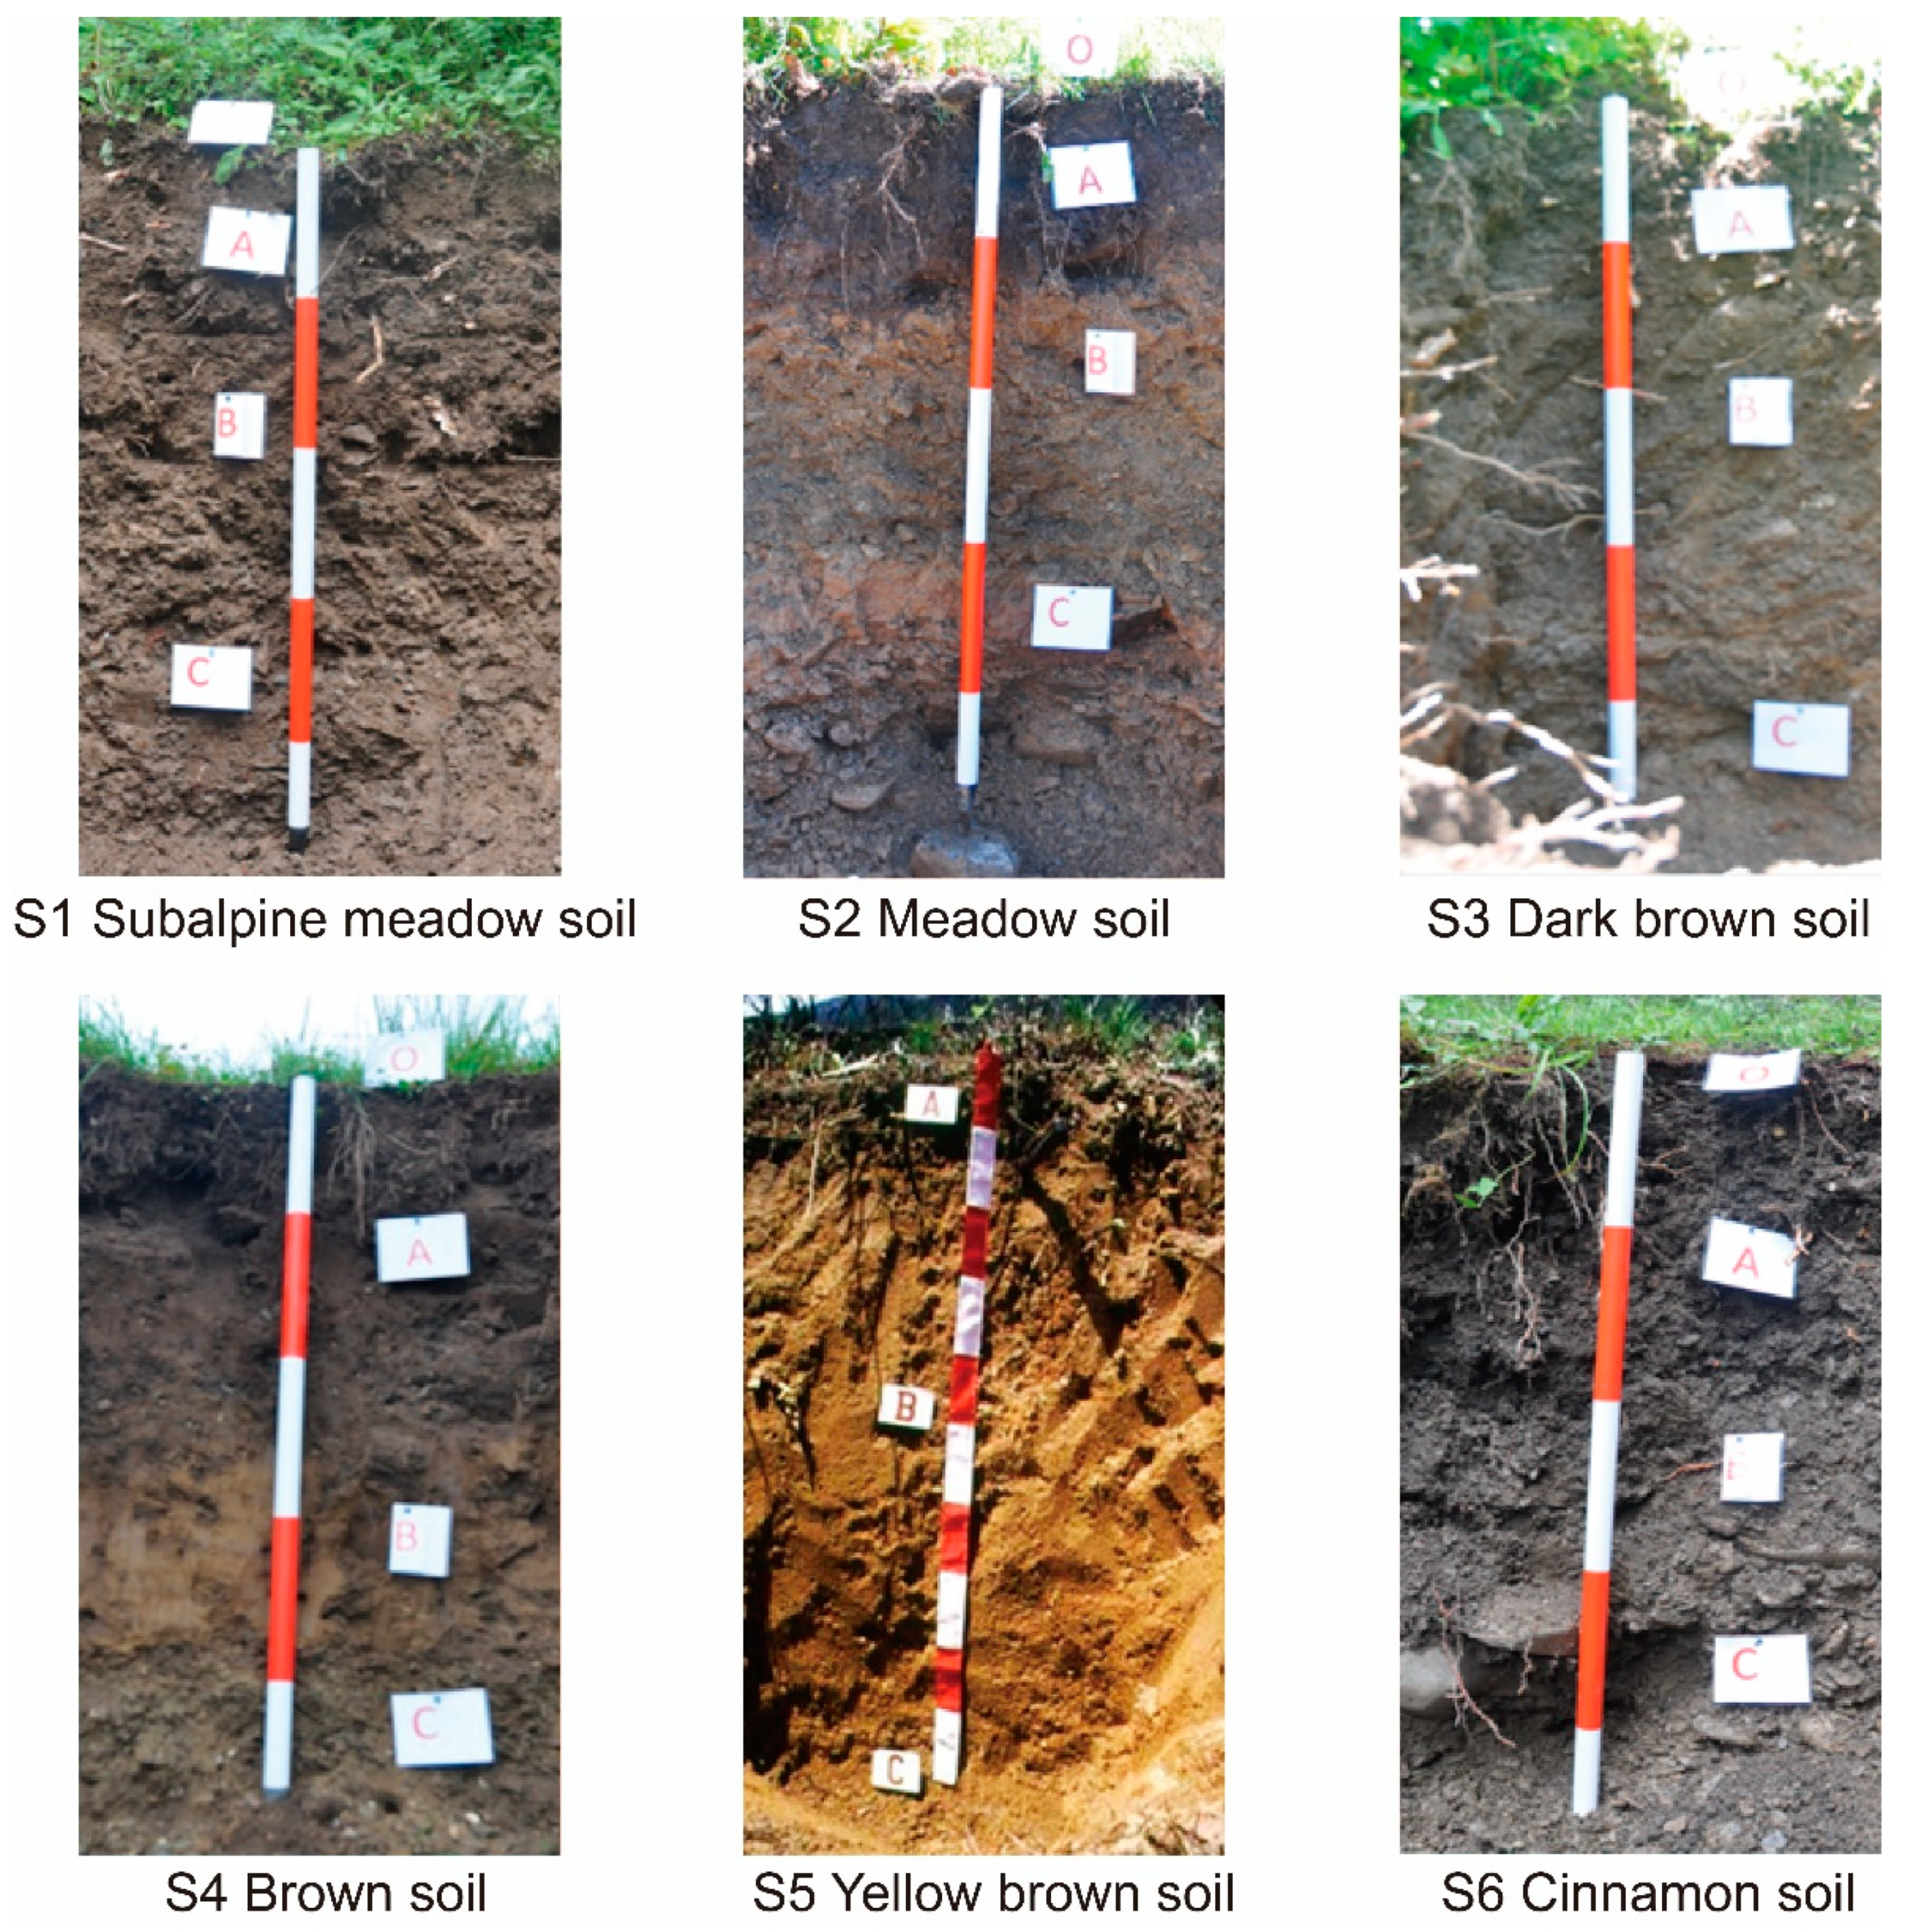
2.1. Study Site

Our study area is located in Hongyuan, Li and Mao Counties, in the southeast of the Tibetan Plateau, China. The middle section of the study area is a mountainous landform, and the southeast section is an alpine canyon. The climate of the mountainous area is a semi-humid climate, characterized by obvious dry and wet seasons. The high mountain areas are humid and cold, and the valley is dry and warm, with an annual average temperature of 5.6–8.9 °C. The climate of the high mountains and the valleys varies from a subtropical zone to a temperate zone, a cold temperate zone, and a cold zone, showing obvious vertical distribution differences. The valley area, the altitude is below 2500 m, which is characterized by concentrated precipitation patterns and rapid evaporation, and it is an arid and semi-arid area. The slope valley zone, at an altitude of 2500–4100 m, is a cold temperate zone, with a 1–5 °C average annual temperature. The cold zone, with an altitude above 4100 m, is covered with snow all year round (Table 1).

2.2. Sample Collection

From August to September 2015, we collected 6 soil types, namely, subalpine meadow soil, meadow soil, dark brown soil, brown soil, yellow-brown soil, and cinnamon soil (Figure 1). For each soil sample, we excavated a 1.0 m-deep soil profile and divided it into a leaching horizon (A horizon), sediment horizon (B horizon), and parent material horizon (C horizon) according to the soil genetic horizon. A total of 53 sites were sampled (Figure S1), with 10 replicates of the subalpine meadow soil, 5 replicates of the meadow soil, 10 replicates of the dark brown soil, 10 replicates of the brown soil, 8 replicates of the yellow-brown soil, and 10 replicates of the cinnamon soil. A total of 146 soil samples were collected from the various soil types and soil genetic horizons, and their physical and chemical properties were measured. The geographical coordinates were obtained by using GPS. The soil samples were ground through a 60-mesh sieve after natural air drying and stored in a sealed manner.

2.3. Soil Chemical and Physical Analyses

The soil-available nitrogen (AN) was then measured by using the Kjeldahl distillation method as described by Mckenzie and Wallace [27]. The soil-available phosphorus (AP) was extracted with anion exchange resin membranes following the method described by Kouno et al. [28], and the soil-available potassium (AK) was extracted following the method described by Mc Lean and Watson [29].
The cation exchange capacity (CEC) was determined by using a buffered solution (pH = 7) with ammonium acetate as the extractant and following these steps: 0.1-mol L−1 BaCl2 (50:1, solution:soil) was used to examine the exchangeable cations H+, K+, Na+, Ca2+, Mg2+, Al3+, Fe3+, and Mn2+ [30,31]. Then, the CEC was calculated by adding all the exchangeable base cations on an equivalent basis. The sum of the exchangeable cations (K, Mg, Ca, and Na) in the CEC was calculated as the base saturation [32]. The soil electrical conductivity (EC) was determined in a laboratory by using a conductivity meter (DDS-11A) in a 1:5 soil/water suspension [33,34]. Soil pH was determined with a pH meter (Mettler Toledo, Shanghai, China) by using a 5:1 ratio of 1 M KCl solution to soil.
Soil aggregates were classified using the wet-sieving method and the dry-sieving method [35,36]. For dry sieving, 50 g of each of the air-dried soils was shaken through a nest of sieves with hole sizes of 5.0, 2.0, 1, 0.5, and 0.25 mm in sequence; then, the aggregates remaining on the respective sieves were weighed. For wet sieving, 50 g of each of the air-dried soils was pre-soaked for 30 min in water and then placed in the topmost sieve of a nest of five sieves with 2.0, 1.0, 0.5, 0.25, and 0.1 mm mesh sizes. Next, these sieves and soils were oscillated vertically in water with a 38 mm amplitude and a 30 times/min vibration frequency for 30 min by an oscillator. During each oscillation, the soil aggregates on the topmost sieve were always below the water surface. Thereafter, these aggregates were transferred into beakers and dried in an oven.
After combining the different fractions of the soil non-water-stable aggregates and the water-stable aggregates, the mean weight diameter (MWD) and the geometric mean diameter (GMD) were calculated by using the following equation:
M W D = i n x i w i / i n w i
G M D = exp ( i n w i l n x i / i n w i )
where xi and wi are the mean diameter (mm) and proportion (%) of each size fraction of the aggregates, respectively.
The soil aggregate mass fractal dimension (D) values of the soil condition after each soil type was imposed were calculated as follows:
D = 3 l o g M ( r < R i ) M t o t l o g R i R m a x
where r is the grain size, M (r < Ri) is the cumulative mass of the aggregates of size r less than Ri, Mtot is the total mass, Ri is the aggregate size class, and Rmax is the mean diameter of the largest aggregate class.

2.4. Statistical Analyses

The experimental data were initially collated in Excel. The sample site was mapped using ArcGIS 10.4.1 spatial analyst tools. R software v3.6.3 (R Core Team, 2020) was subsequently used to conduct statistical analyses, including one-way and two-way analyses of variance (ANOVA) and the chi-square test with the least significant difference (LSD) method for multiple comparisons of the significance. The relationships between the measurements were characterized via Pearson’s correlation and general linear regression, with tabular and boxplot data presented as the mean ± standard error. A data analysis was carried out using the “tidyverse” and “agricolae” packages. The results were visualized with the “ggplot2”, “cowplot”, “ggcorrplot”, and “ggpmisc” packages.

3. Result

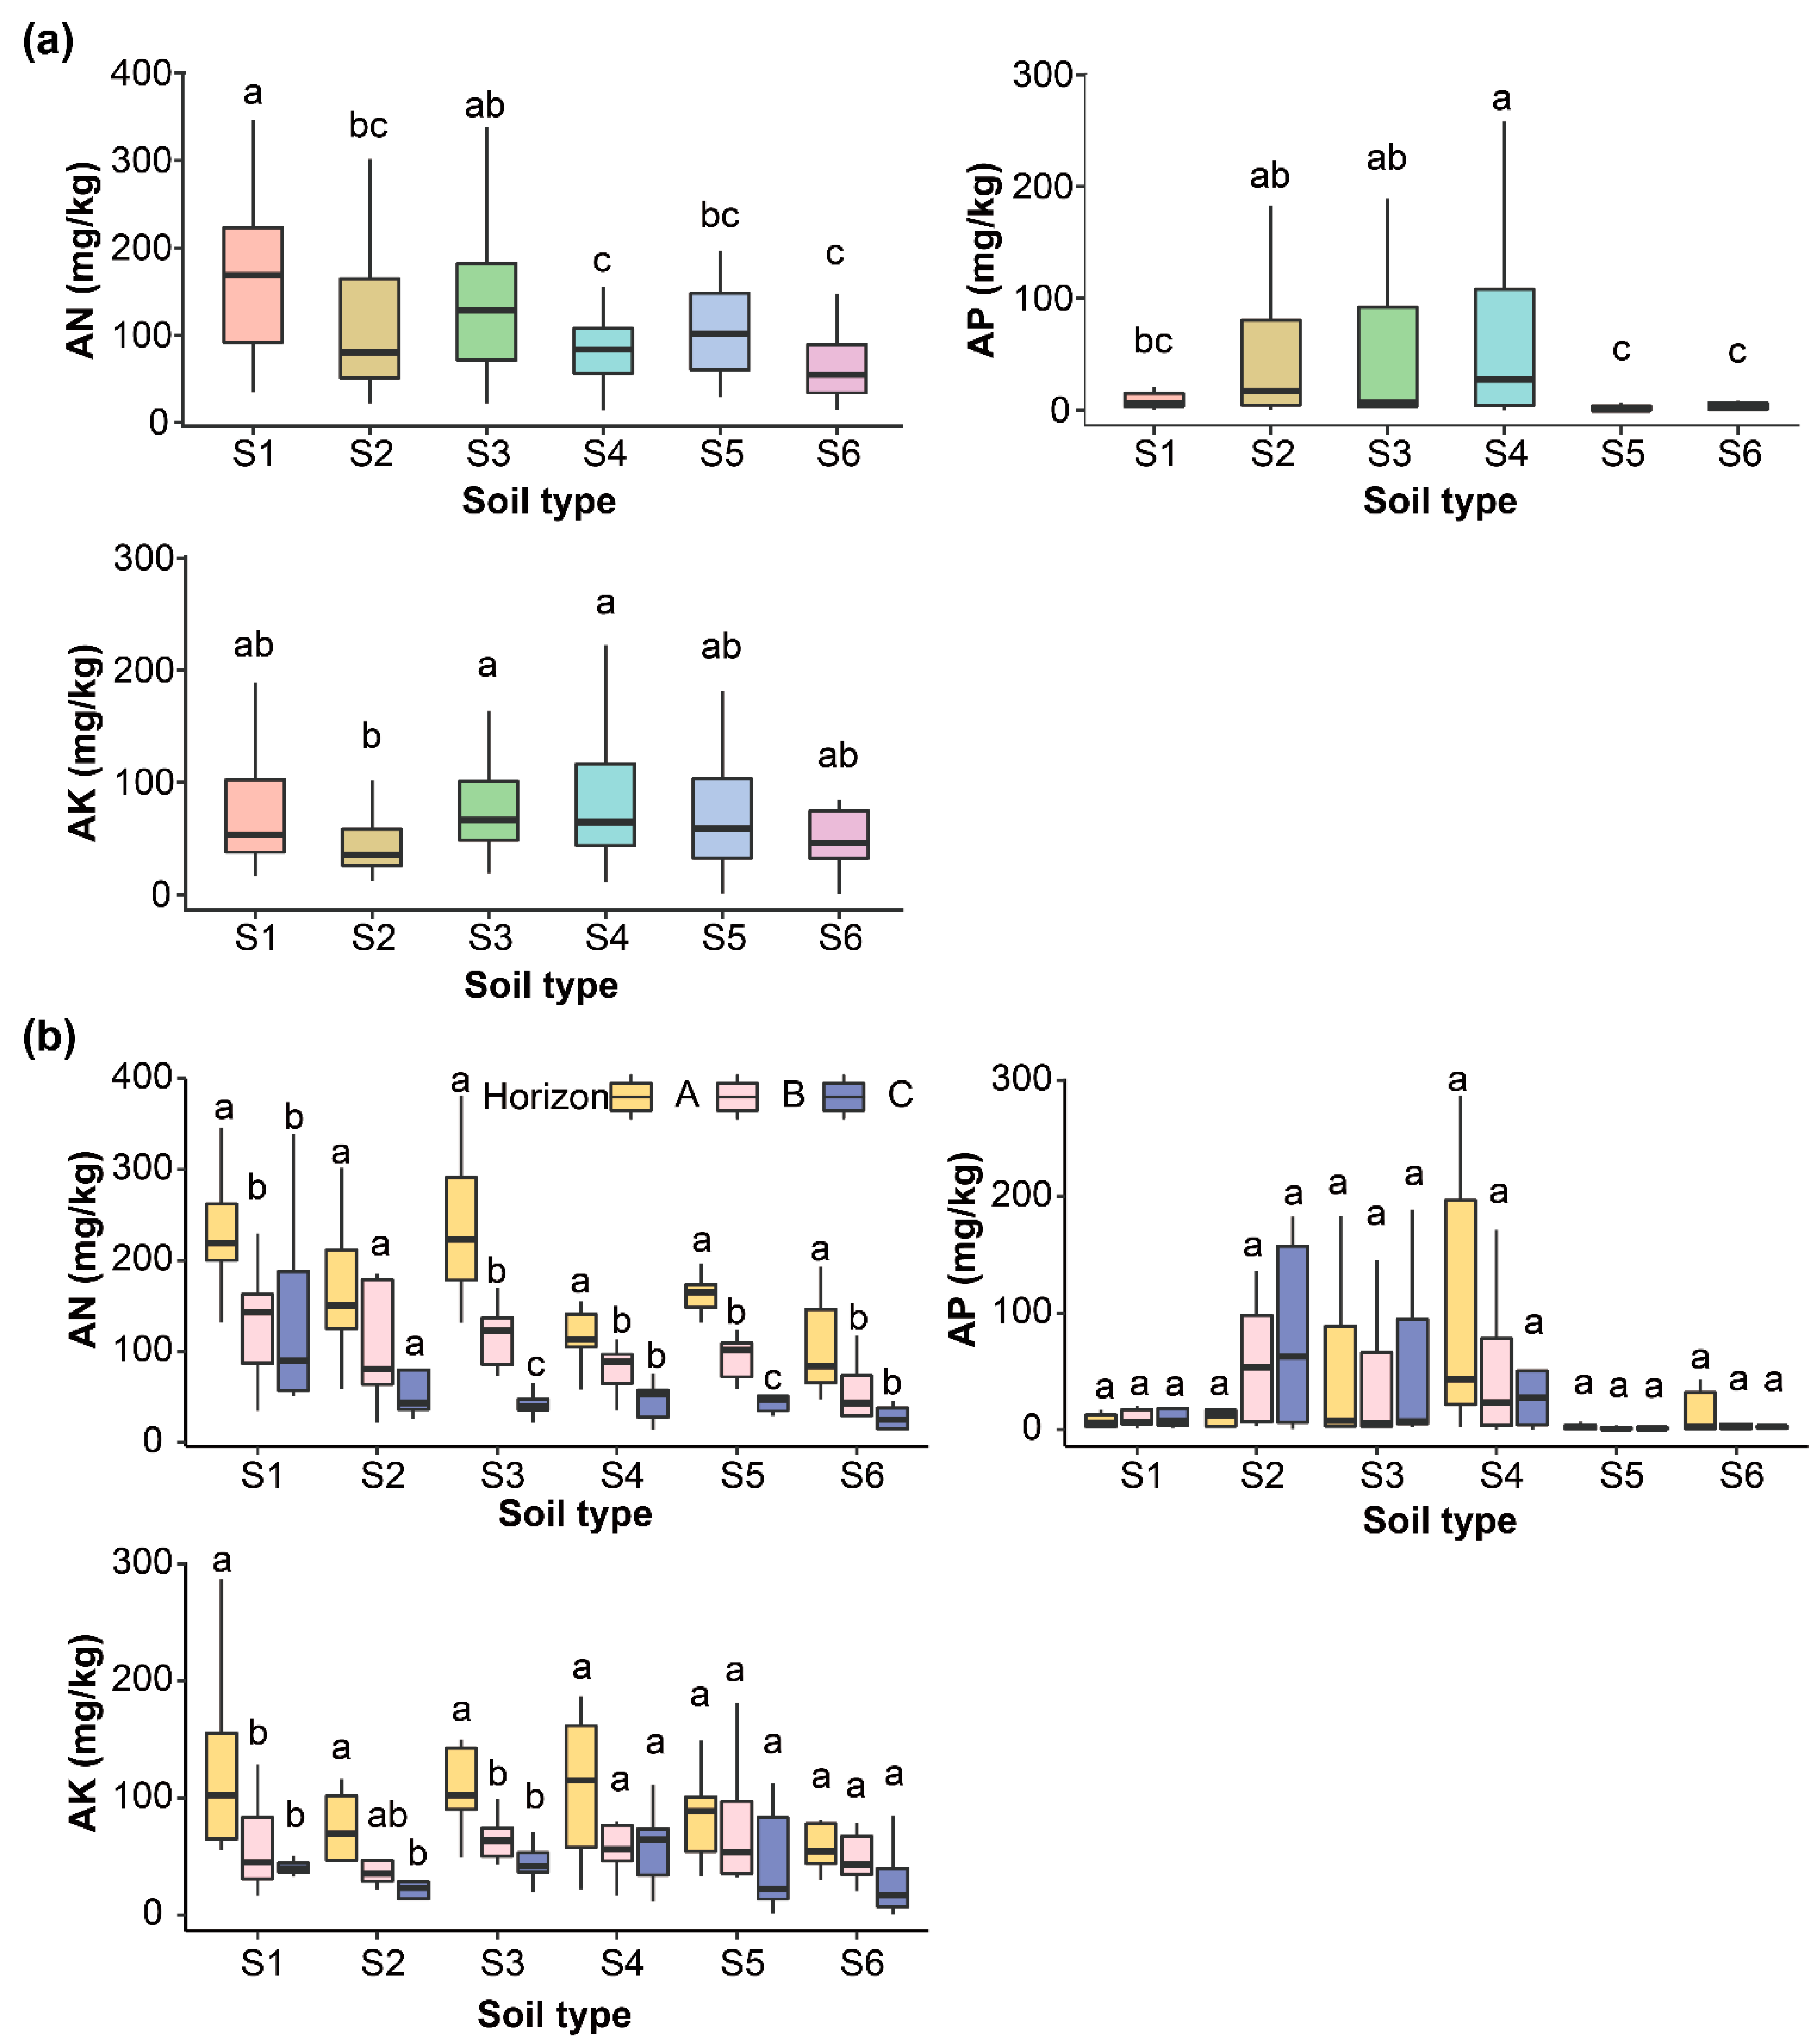
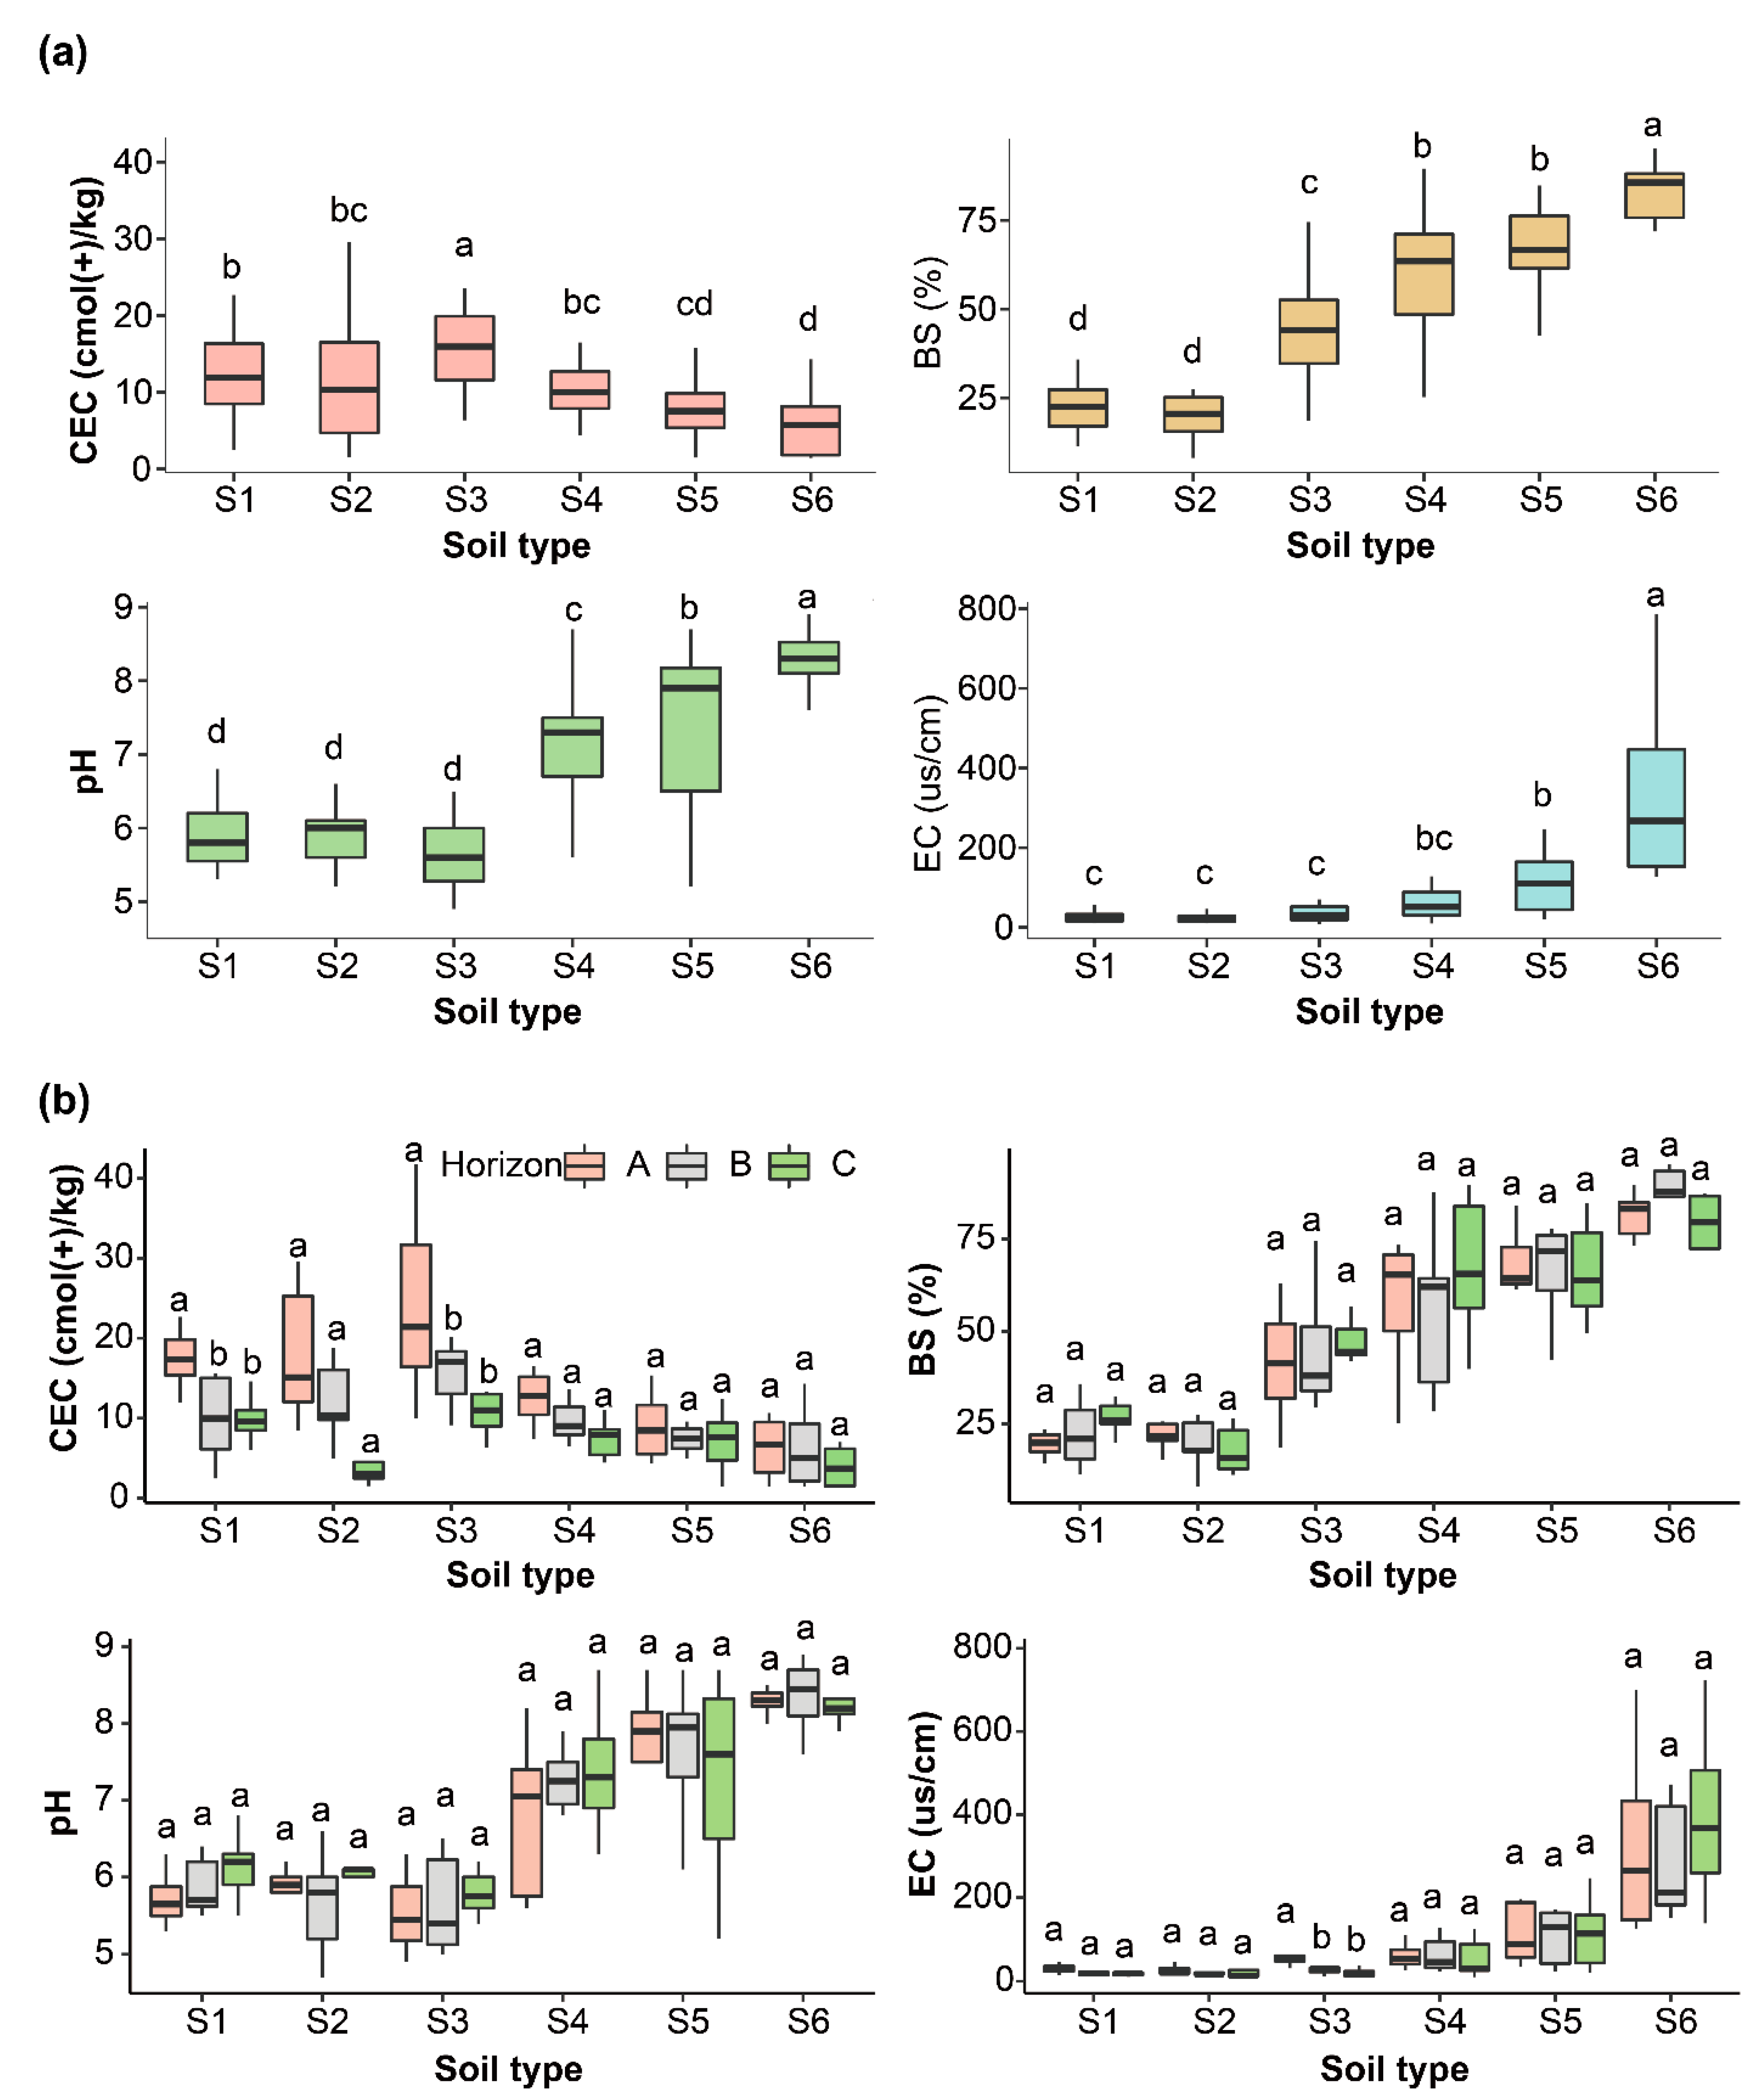
3.1. General Soil Properties

The results show that AN ranged from 72.33 to 169.67 mg/kg, AP ranged from 1.77 to 75.90 mg/kg, and AK ranged from 46.43 to 88.55 mg/kg in the six soil types. We observed significant differences in soil AN, AP, and AK content across the six soil types. Specifically, the means of S1 and S3 (with means of 169.67 and 139.35 mg/kg, respectively) of soil AN were higher than those of S4 and S6 (with means of 86.05 and 72.32 mg/kg, respectively). For AP, the means of S2, S3, and S4 (with means of 53.22, 50.17, and 75.9, respectively) were significantly higher than those of S5 and S6 (1.77 and 9.94, respectively). Similarly, the means of S3 and S4 (83.49 and 88.55, respectively) of soil AK were significantly higher than those of S1, S2, S5, and S6 (Figure 2a). We also studied the vertical distribution of soil AN, AP, and AK content across the A, B, and C horizons in the six soil types. The results show that the AN of the A horizon was higher than that of the B and C horizons, especially in S1, S3, S4, S5, and S6. Moreover, the AK of the A horizon was higher than that of the B and C horizons in S1, S2, and S3. We did not find significant differences among the A, B, and C horizons in S4, S5, S6. However, we observed no significant difference in AP among the A, B, and C horizons in the six soil types (Figure 2b and Table 2).
Our results show that the CEC of S3 (17.31) was the highest and that the CECs of S5 (8.02) and S6 (6.31) were the lowest. Conversely, the BS and EC of S6 were the highest, with averages of 83.84 and 342.98, respectively. In this study, S4, S5, and S6 were alkaline soils, with S6 having the highest soil pH value, and the mean value was 8.3. Moreover, S1, S2, and S3 were acidic soils (Figure 3a). The one-way ANOVA of the ionic characteristics of the A, B, and C horizons throughout the six soil types showed that there was no significant difference along the vertical space in the soil CEC, BS, pH, and EC, except for in the soil CECs in S1 and S3 (Figure 3b).

3.2. Aggregate Size Fractions and Stability

The non-water-stable aggregate size fractions of the six soil types with a ≥ 5 mm particle size ranged from 52.21% to 34.91%, of which S5 was the highest, and S1 and S6 were the lowest. However, the aggregate size fractions of S6 and S2 at ≤0.25 mm were significantly higher than those of the other soil types. This means that S1, S3, S4, and S5 were dominated by non-water-stable aggregates with larger particle sizes and that S6 and S2 were dominated by smaller particle sizes (Figure S2a and Table S1). For the water-stable aggregates (Figure S2b and Table S2), the aggregate size fractions of S3 at ≥ 2 mm and 2–1 mm were the highest (46.33 and 12.49, respectively), and those of S2 were the lowest (24.05 and 9.11, respectively). However, there was no significant difference in the aggregate size fractions of the six soil types at 1–0.5 mm. We also found that, at the ≤ 0.1 mm aggregate size, the aggregate size fractions of S2 and S6 (25.62 and 27.85, respectively) were significantly higher than those of the other soil types, while S3 and S4 (14.71 and 14.17, respectively) were the lowest.
The MWD and GMD of the non-water-stable aggregates of S5 were 4.89 and 1.68, respectively, which were significantly higher than those of S2 (3.31 and 1.22), S4 (4.29 and 1.52), and S6 (3.67 and 1.29). The D values of the six soil types were significantly higher in S2 (mean 2.21) and S6 (mean 2.11) than in the other four soil types. Meanwhile, the MWD and GMD of the water-stable aggregates of S3 (1.92 and 0.99) and S4 (1.87 and 0.97) were significantly higher than those of the other soil types, and S2 was the lowest. The D of S2 (2.48) was the highest (Table 3).

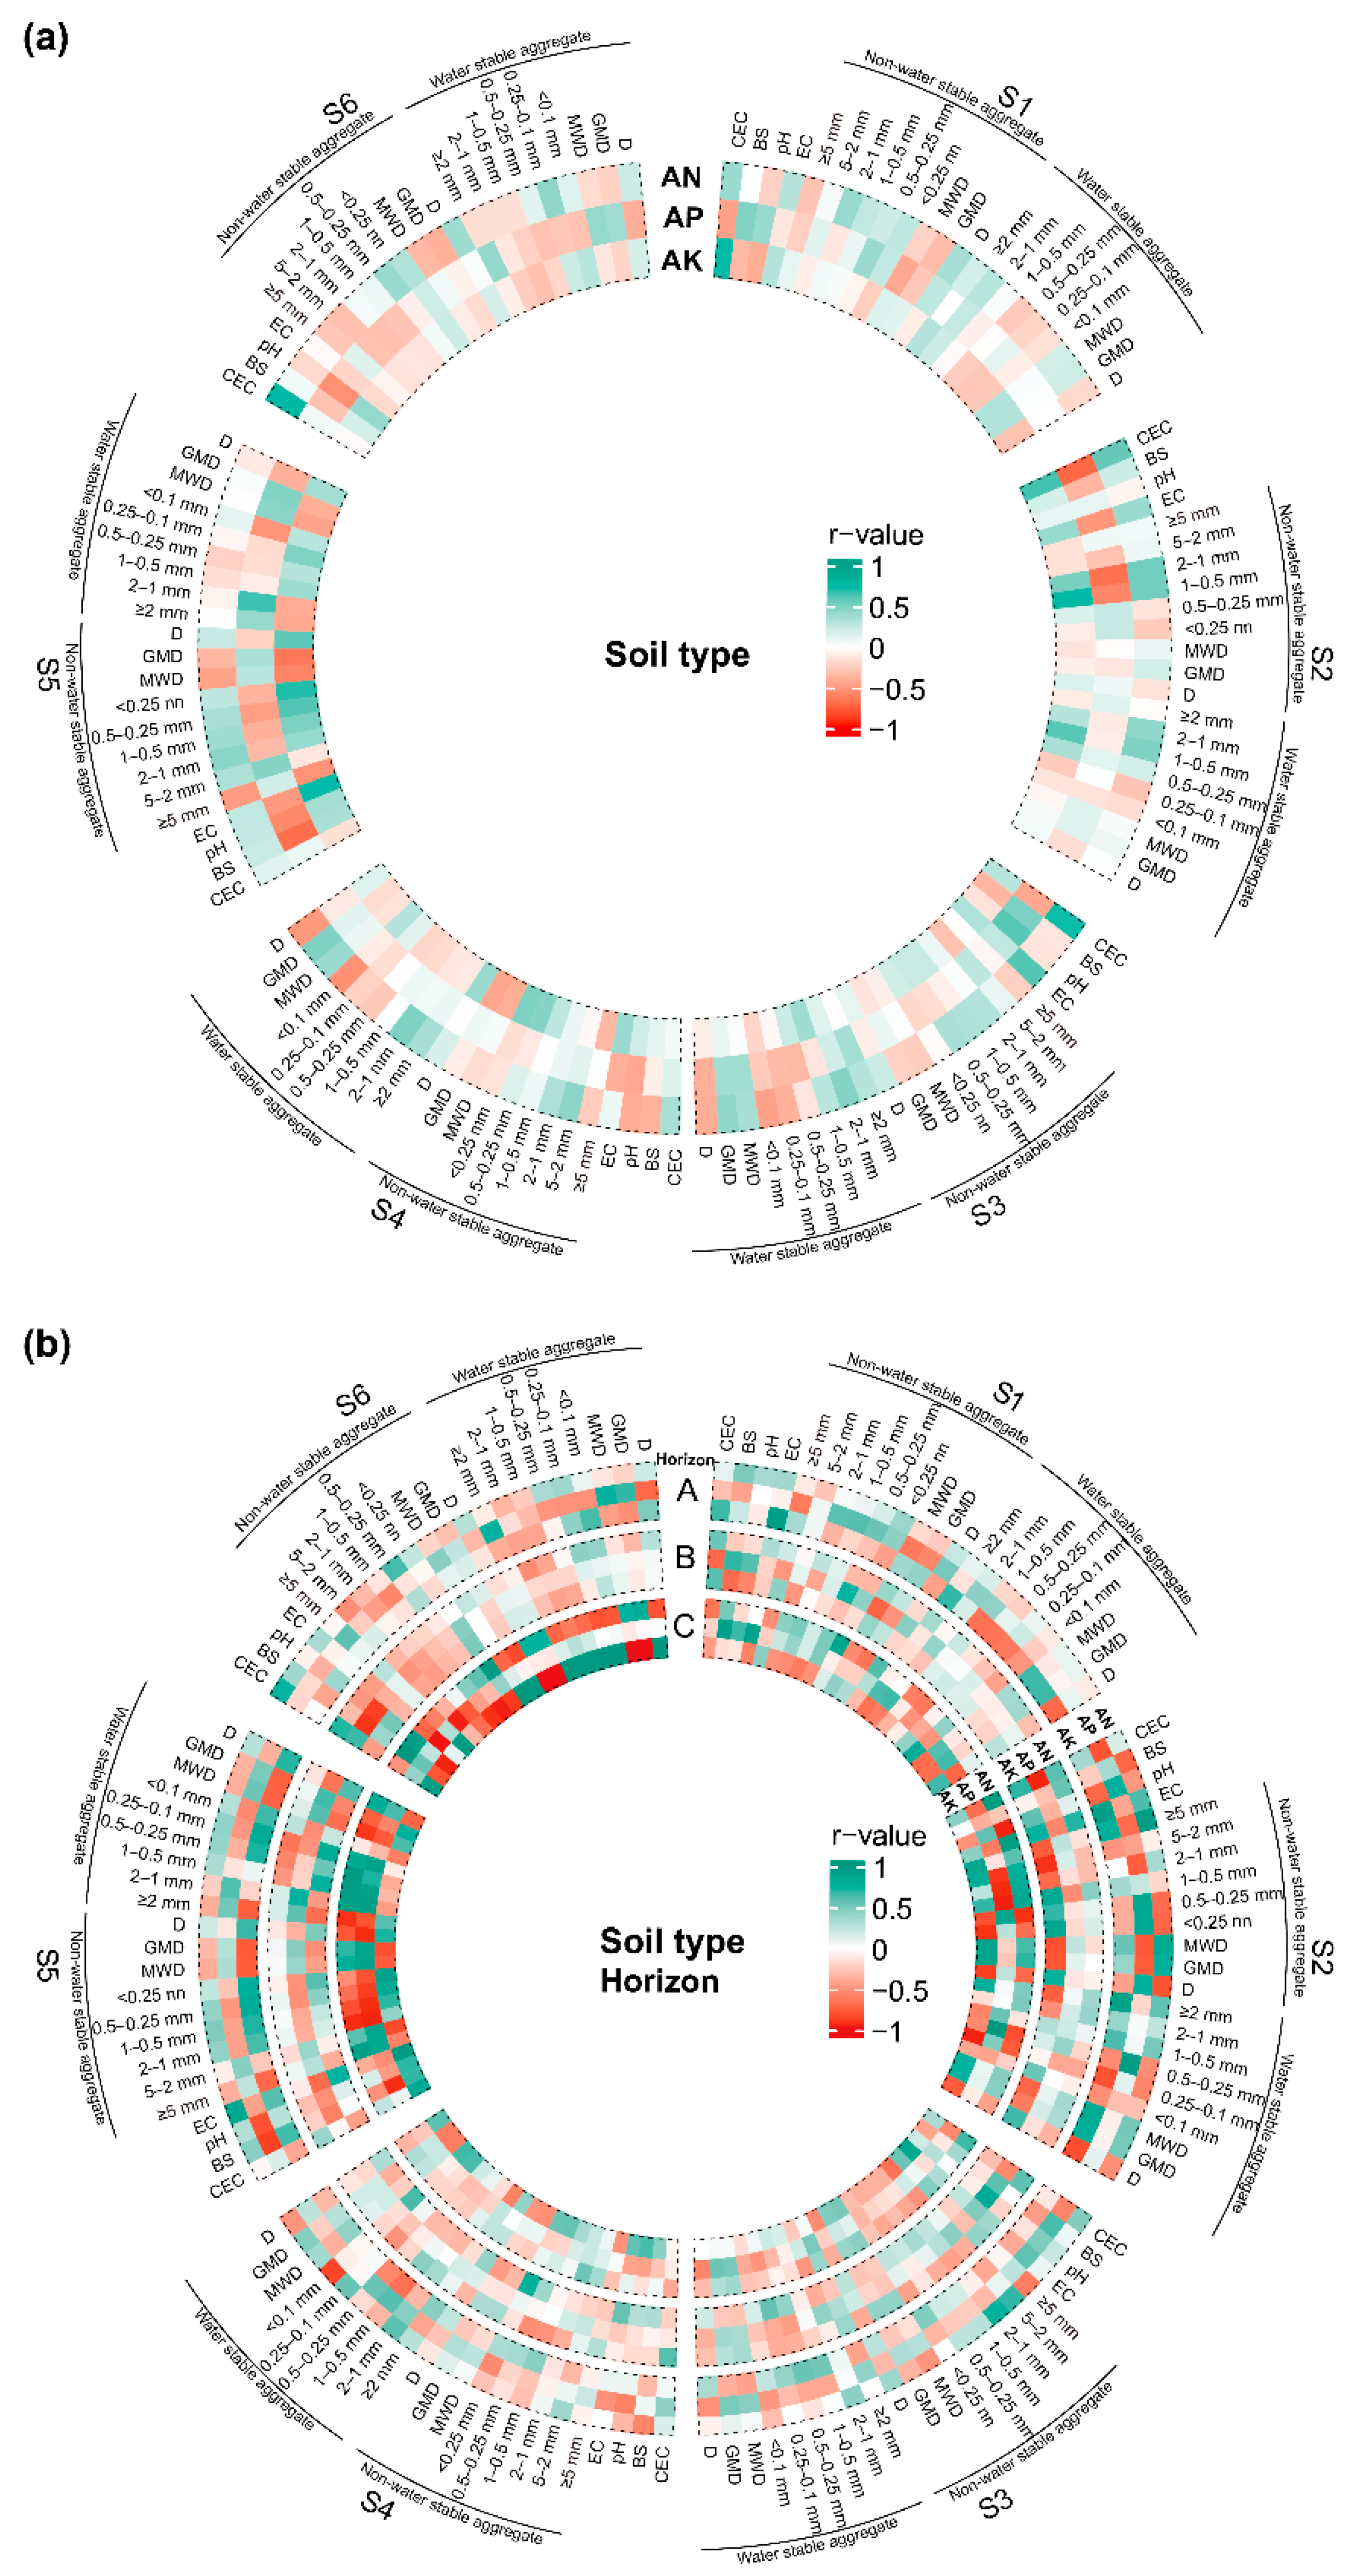
3.3. Relationships between Soil-Available Nutrients and Aggregate Properties

The Pearson’s correlation analysis showed that the CECs of S1, S2, and S3 were significantly positively correlated with the content of soil AN and AK and that they were negatively correlated with soil AP. We also found that BS and pH were related to soil-available nutrients. For example, in S1 and S3, the relationships between the soil BS, soil pH, and soil AP were positive, but in S4, S5, and S6, they were negative. The content of the non-water-stable aggregates with particle sizes of 2 mm and 2–1 mm was positively related to soil AN and AP in S1, S2, S4, and S5. The soil AK of S4 and S5 was positively related to the size fractions of the non-water-stable aggregates at smaller sizes (1–0.5 mm, 0.5–0.25 mm, and ≤0.25 mm) and D, while it was negatively related to MWD and GMD. Additionally, for the water-stable aggregates, the soil AN, AP, and AK of the S2, S3, S4, and S5 soils were positively related to the water-stable aggregate size fractions of 2–1 mm and 1–0.5 mm. While the AN and AP of the S3, S4, and S5 soil types were negatively related to the water-stable aggregate size fractions of 0.25–0.1 mm and ≤0.1 mm and D, and they were positively related to MWD and GMD (Figure 4a).
We further explored the relationships among the soil AN, AP, and AK nutrients; the general soil properties; and the aggregate properties across the three horizons. The results show that the relationships between the soil-available nutrients and the other properties were strongly dependent on the soil type and horizon. In S6, the soil AN and AK in the C horizon showed stronger correlations with the soil properties. In the C horizon of S5, AN, AP, and AK showed strong correlations, while that of the S2 soil type was mainly in the A and C horizons.

4. Discussion

4.1. The Chemical Properties of the Six Soil Types

Understanding the impact of changes in soil type on soil-available nutrients under long-term vegetation restoration is important for soil resource utilization in regional land restoration and management. Several studies have found that vegetation restoration modifies soil physical and chemical properties, varying by vegetation type and soil depths. Our study also reveals that soil types and soil depths significantly affect soil AN. The subalpine meadow soil (S1) and the dark brown soil (S3) (with means of 169.67 and 139.35 mg/kg, respectively) had higher soil AN. Indeed, S1 and S3 were distributed at a high altitude, which may contribute to the enhanced soil AN in these soil types. Due to the low temperature at a high altitude, the microbial decomposition of soil nitrogen is inhibited, which can decrease the soil nitrogen loss in the form of N2O and CH4. Furthermore, S1 and S3 had lower pH values. During sampling, we found that S1 had a thicker humus layer, and the dominant species in S3 were Picea asperata, Abies fabri, and Cupressus chengiana, those with a rich litter and microorganism activities. More organic acids are released from these litters and microorganisms during organic matter decomposition, thus significantly reducing pH values [37].
Studies have shown that the soil parent materials influence the actual P pools of soils and physical–chemical properties [1]. Similarly, soil type had significant effects on soil AP in our study. For example, the meadow soil (S2), S3, and the brown soil (S4, with means of 53.22, 50.17, and 75.9, respectively) had higher soil AP in the six soil types. These results are consistent with the soil parent material hypothesis declaring that parent material P can have an effect on the total soil P. However, soil AK was significantly affected by the soil depth rather than the soil type. In this study, the soil AK of S1, S2, and S3 decreased with soil depth, which is consistent with the findings of previous studies [38,39,40].
Soil electrical conductivity is a good indicator of the hydrolysable salt content of soil [41]. Our result shows that the soil electric conductivity of the cinnamon soil (S6) was the highest; most samples with a soil conductivity and pH value of 4.0 mS/cm and 8, respectively, have been recognized as saline soils [42]. S6 was dominated by Pinus tabulaeformis, Cypress minjiangensis, and Ailanthus altissima, which grew after returning farmland to forest. During the soil formation process, salt ions are deposited, and CaCO3 is accumulated in the deep soil horizon due to the higher precipitation in southwest Sichuan, contributing to the higher soil pH value and electrical conductivity [43].

4.2. Soil Aggregate Properties of the Six Soil Types

Soil aggregate composition is one of the indicators used to identify soil fertility because soils with macro-aggregates have higher porosities and water holding capacities, which can reduce surface runoff and soil nutrient loss [44]. EvelinPihlap et al. (2019) demonstrated that, in reclaimed soils, the inherent properties of the loess parent material controlled the formation of aggregates [45]. In our study, the six soil types were dominated by non-water-stable aggregates ≥ 5 mm, while the content of ≤0.25 mm non-water-stable aggregates was significantly higher in S2 and S6 than in the other soil types. The water-stable aggregate size fractions of ≥ 2 mm and 2–1 mm were the highest in S3, while the content of water-stable aggregates of ≤0.1 mm was the highest in S2 and S6. This observation is explained by the fact that, under the rainy and humid climate in western Sichuan, which has serious soil erosion and soil loss, the surface soil aggregates are greatly affected by rainfall and aboveground vegetation. Meanwhile, a sufficient hydrothermal environment provides favorable conditions for litter decomposition [46]. Because of the diverse aboveground shrub and grass vegetation in S3, their stems and leaves can help to build a shield in order to reduce the structural damage caused by the direct splashing of raindrops under heavy rainfall [47]. In addition, more vegetation helps soil micro-aggregates develop into macro-aggregates through the entanglement of plant roots and microbial hyphae [48].

4.3. Relationship between General Soil Properties and Aggregate Characteristics

This study highlighted the relationships of the physicochemical characteristics of six soil types and three soil horizons with soil-available nutrients. We found that, in S1, S2, and S3, the AN and AK contents were positively related to soil CECs. Similarly, some studies have found that the large specific surface area and surface negative charge density of soil colloids increase soil CEC and organic matter [49,50,51,52]. The underlying mechanism is that an increase in the generation of negative charges increases the exchange point of cations, thus helping to adsorb more cations and improve soil nutrient availability [53]. Additionally, soil pH can affect the release and availability of phosphorus in parent soil, and exchangeable Ca2+ is the main limiting factor [54]. When the pH value of soil acidity is higher than 7.5 or lower than 6, stable compounds and phosphorus with calcium, iron, and aluminum are formed, reducing the availability of soil phosphorus and vice versa. The six soil types in this study had a wide distribution area, and the ecological environment factors influencing the soil nutrients are complex. Hence, the interaction of multiple environmental factors weakens the direct effect of a single environmental factor. However, the correlation analysis between the multiple factors in this study was based on the six soil types. It was found that the six soil types had dramatic differences in their soil nutrient availability properties and maintenance mechanisms. A thorough study of the status and drivers of soil-available nutrients in different soil types is conducive to a comprehensive understanding of the characteristics of soil properties and the mutual mechanism in general soil properties.

5. Conclusions

Our results demonstrate that the six soil types showed significant differences in soil-available nutrient content, soil chemical and aggregate properties, and the regulation of soil chemical and aggregate properties in soil nutrient availability. The soil-available nitrogen of S1 and S3 was significantly higher than that of S4 and S6. Moreover, the soil-available phosphorus of S4 was significantly higher than that of S5 and S6. The soil-available potassium of S4 and S3 was significantly higher than that of S2. We suggest that soil-available nitrogen and soil-available phosphorus benefit from soil cations and the polymerization of aggregates, for which higher CECs, contents of non-water-stable aggregates with particle sizes of 2–1 mm and 1–0.5 mm, and contents of 2–1 mm and the GMD of water-stable aggregates could be the driving factors of soil-available nitrogen and those with noticeable characteristics of soil-surface nutrient distributions. A lower EC and content of water-stable aggregates with a ≤ 0.1 mm particle size could be the driving factors of soil-available phosphorus. Higher soil cations promoted the accumulation of soil-available potassium. Collectively, our findings reveal that the soil chemical and aggregate properties play pivotal roles in regulating soil nutrient availability, and they serve to highlight the complexity of the mechanisms underlying forest restoration.

Supplementary Materials

The following supporting information can be downloaded at: https://www.mdpi.com/article/10.3390/f14020259/s1, Figure S1: Description of sample point; Figure S2: Variance analysis of non-water stable aggregate content (a) at 6 particle size levels (≥5 mm, 5–2 mm, 2–1 mm, 1–0.5 mm, 0.5–0.25 mm, ≤0.25 mm) and water stable aggregate content (b) at 6 particle size levels (≥2 mm, 2–1 mm, 1–0.5 mm, 0.5–0.25 mm, 0.25–0.1 mm, ≤0.1 mm) in 6 soil types (subalpine meadow soil, S1; meadow soil, S2; dark brown soil, S3; brown soil, S4; yellow brown soil, S5; and cinnamon soil, S6). Different lowercases indicate significant differences in non-water stable aggregate content at the same particle size among soil types, and the same letter indicates no significant differences in non-water stable aggregate content at the same particle size content among soil types.; Table S1: Variance analysis of non-water stable aggregate (mean and sd) of size fraction in 6 soil types (subalpine meadow soil, S1; meadow soil, S2; dark brown soil, S3; brown soil, S4; yellow brown soil, S5; and cinnamon soil, S6). The different lowercase letter indicates significant difference at p < 0.05 by LSD test among 3 horizon; Table S2: Variance analysis of water stable aggregate (mean and sd) of size fraction in 6 soil types (subalpine meadow soil, S1; meadow soil, S2; dark brown soil, S3; brown soil, S4; yellow brown soil, S5; and cinnamon soil, S6). The different lowercase letter indicates significant difference at p < 0.05 by LSD test among 3 horizon.

Author Contributions

H.C., M.C. and Y.G. conceived the idea and wrote most of the manuscript. W.H. designed the figures. Q.W., Y.C., X.H., S.X. and J.Z. contributed to part of the writing and the overall improvement of the manuscript. All authors have read and agreed to the published version of the manuscript.

Funding

This study was funded by the Natural Science Foundation of Southwest University of Science and Technology (22ZX7113), the Guangxi Key Science and Technology Innovation Base on Karst Dynamics (BL202104), the National Natural Science Foundation of China (422ZX7113) and the Major Science and Technology Special Project of Sichuan Province (2018SZDZX0034).

Data Availability Statement

The original contributions presented in the study are included in the article/Supplementary Material; further inquiries can be directed to the corresponding author.

Acknowledgments

We thank Ying Liu, Yao Li, Dewen Zhu, and Yaojia Chen for the great assistance in data collection.

Conflicts of Interest

The authors declare no conflict of interest.

References

  1. Augusto, L.; Achat, D.L.; Jonard, M.; Vidal, D.; Ringeval, B. Soil parent material-A major driver of plant nutrient limitations in terrestrial ecosystems. Glob. Chang. Biol. 2017, 23, 3808–3824. [Google Scholar] [CrossRef]
  2. Vitousek, P.M.; Porder, S.; Houlton, B.Z.; Chadwick, O.A. Terrestrial phosphorus limitation: Mechanisms, implications, and nitrogen–phosphorus interactions. Ecol. Appl. 2010, 20, 5–15. [Google Scholar] [CrossRef] [PubMed] [Green Version]
  3. Post, W.M.; Pastor, J.; Zinke, P.J.; Stangenberger, A.G. Global patterns of soil nitrogen storage. Nature 1985, 317, 613–616. [Google Scholar] [CrossRef]
  4. Yang, Y.; Li, T.; Pokharel, P.; Liu, L.; Qiao, J.; Wang, Y.; An, S.; Chang, S.X. Global effects on soil respiration and its temperature sensitivity depend on nitrogen addition rate. Soil Biol. Biochem. 2022, 174, 108814. [Google Scholar] [CrossRef]
  5. Sardans, J.; Peñuelas, J. Potassium: A neglected nutrient in global change. Glob. Ecol. Biogeogr. 2015, 24, 261–275. [Google Scholar] [CrossRef] [Green Version]
  6. Gargallo Garriga, A.; Sardans, J.; Pérez Trujillo, M.; Oravec, M.; Urban, O.; Jentsch, A.; Kreyling, J.; Beierkuhnlein, C.; Parella, T.; Peñuelas, J. Warming differentially influences the effects of drought on stoichiometry and metabolomics in shoots and roots. New Phytol. 2015, 207, 591–603. [Google Scholar] [CrossRef] [Green Version]
  7. Schinner, F.; Öhlinger, R.; Kandeler, E.; Margesin, R. Methods in Soil Biology; Springer Science & Business Media: Berlin/Heidelberg, Germany, 2012. [Google Scholar]
  8. Yang, Y.; Li, T.; Wang, Y.; Cheng, H.; Chang, S.X.; Liang, C.; An, S. Negative effects of multiple global change factors on soil microbial diversity. Soil Biol. Biochem. 2021, 156, 108229. [Google Scholar] [CrossRef]
  9. Peterson, D.L.; Rolfe, G.L. Temporal variation in nutrient status of a floodplain forest soil. Forest Ecol. Manag. 1985, 12, 73–82. [Google Scholar] [CrossRef]
  10. Bronick, C.J.; Lal, R. Soil structure and management: A review. Geoderma 2005, 124, 3–22. [Google Scholar] [CrossRef]
  11. Qadir, M.; Schubert, S.; Ghafoor, A.; Murtaza, G. Amelioration strategies for sodic soils: A review. Land Degrad. Dev. 2001, 12, 357–386. [Google Scholar] [CrossRef]
  12. Havlin, J.L. Soil: Fertility and Nutrient Management; Landscape and land capacity; CRC Press: Boca Raton, FL, USA, 2020; pp. 251–265. [Google Scholar]
  13. Ross, D.S.; Matschonat, G.; Skyllberg, U. Cation exchange in forest soils: The need for a new perspective. Eur. J. Soil Sci. 2008, 59, 1141–1159. [Google Scholar] [CrossRef]
  14. Bai, Y.; Xue, W.; Yan, Y.; Zuo, W.; Shan, Y.; Feng, K. The challenge of improving coastal mudflat soil: Formation and stability of organo-mineral complexes. Land Degrad. Dev. 2018, 29, 1074–1080. [Google Scholar] [CrossRef]
  15. Wang, S.; Li, T.; Zheng, Z.; Chen, H.Y. Soil aggregate-associated bacterial metabolic activity and community structure in different aged tea plantations. Sci. Total Environ. 2019, 654, 1023–1032. [Google Scholar] [CrossRef] [PubMed]
  16. van Nes, E.H.; Scheffer, M. Implications of spatial heterogeneity for catastrophic regime shifts in ecosystems. Ecology 2005, 86, 1797–1807. [Google Scholar] [CrossRef]
  17. Tian, H.; Chen, G.; Zhang, C.; Melillo, J.M.; Hall, C.A. Pattern and variation of C: N: P ratios in China’s soils: A synthesis of observational data. Biogeochemistry 2010, 98, 139–151. [Google Scholar] [CrossRef]
  18. Hou, Y.; Zhang, M.; Meng, Z.; Liu, S.; Sun, P.; Yang, T. Assessing the impact of forest change and climate variability on dry season runoff by an improved single watershed approach: A comparative study in two large watersheds, China. Forests 2018, 9, 46. [Google Scholar] [CrossRef] [Green Version]
  19. Cheng, H.; Gong, Y.; Wu, Q.; Li, Y.; Liu, Y.; Zhu, D. Content and Ecological Stoichiometry Characteristics of Organic Carbon, Nitrogen and Phosphorus of Typical Soils in Sub-alpine/Alpine Mountain of Western Sichuan. J. Nat. Resour. 2018, 33, 161–172. (In Chinese) [Google Scholar]
  20. Lin, Z.; Wu, T.; Xiao, Y.; Rao, E.; Shi, X.; Ouyang, Z. Protecting biodiversity to support ecosystem services: An analysis of trade-offs and synergies in southwestern China. J. Appl. Ecol. 2022, 59, 2440–2451. [Google Scholar] [CrossRef]
  21. Stokes, A.; Douglas, G.B.; aFourcaud, T.; Giadrossich, F.; Gillies, C.; Hubble, T.; Kim, J.H.; Loades, K.W.; Mao, Z.; McIvor, I.R. Ecological mitigation of hillslope instability: Ten key issues facing researchers and practitioners. Plant Soil 2014, 377, 1–23. [Google Scholar] [CrossRef] [Green Version]
  22. Lin, Y.; Wang, D.; Farooq, T.H.; Luo, K.; Wang, W.; Qin, M.; Chen, S. Effects of restoration strategies on wetland: A case-study of Xinqiang River National Wetland Park. Land Degrad. Dev. 2022, 33, 1114–1127. [Google Scholar] [CrossRef]
  23. Deng, L.; Liu, G.B.; Shangguan, Z.P. Land-use conversion and changing soil carbon stocks in C hina’s ‘Grain-for-Green’Program: A synthesis. Glob. Chang. Biol. 2014, 20, 3544–3556. [Google Scholar] [CrossRef]
  24. Song, W.; Feng, Y.; Wang, Z. Ecological restoration programs dominate vegetation greening in China. Sci. Total Environ. 2022, 848, 157729. [Google Scholar] [CrossRef] [PubMed]
  25. Huang, C.; Zeng, Y.; Wang, L.; Wang, S. Responses of soil nutrients to vegetation restoration in China. Reg. Environ. Chang. 2020, 20, 82. [Google Scholar] [CrossRef]
  26. Wei, H.; Deng, Y.; Lin, L.; Wang, J.; Huang, J. Improved soil composition promotes nutrient recovery during vegetation restoration in karst peak-cluster depressions. Catena 2023, 222, 106769. [Google Scholar] [CrossRef]
  27. McKenzie, H.A.; Wallace, H.S. The Kjeldahl determination of nitrogen: A critical study of digestion conditions-temperature, catalyst, and oxidizing agent. Aust. J. Chem. 1954, 7, 55–70. [Google Scholar] [CrossRef]
  28. Kouno, K.; Tuchiya, Y.; Ando, T. Measurement of soil microbial biomass phosphorus by an anion exchange membrane method. Soil Biol. Biochem. 1995, 27, 1353–1357. [Google Scholar] [CrossRef]
  29. Mc Lean, E.O.; Watson, M.E. Soil measurements of plant-available potassium. Potassium Agric. 1985, 277–308. [Google Scholar] [CrossRef]
  30. Crovo, O.; Aburto, F.; Da Costa Reidel, C.; Montecino, F.; Rodríguez, R. Effects of livestock grazing on soil health and recovery of a degraded Andean Araucaria Forest. Land Degrad. Dev. 2021, 32, 4907–4919. [Google Scholar] [CrossRef]
  31. Zarif, N.; Khan, A.; Wang, Q. Linking Soil Acidity to P Fractions and Exchangeable Base Cations under Increased N and P Fertilization of Mono and Mixed Plantations in Northeast China. Forests 2020, 11, 1274. [Google Scholar] [CrossRef]
  32. Blaser, P.; Walthert, L.; Zimmermann, S.; Graf Pannatier, E.; Luster, J. Classification schemes for the acidity, base saturation, and acidification status of forest soils in Switzerland. J. Plant Nutr. Soil Sci. 2008, 171, 163–170. [Google Scholar] [CrossRef]
  33. Rietz, D.N.; Haynes, R.J. Effects of irrigation-induced salinity and sodicity on soil microbial activity. Soil Biol. Biochem. 2003, 35, 845–854. [Google Scholar] [CrossRef]
  34. Yang, S.; Liu, F.; Song, X.; Lu, Y.; Li, D.; Zhao, Y.; Zhang, G. Mapping topsoil electrical conductivity by a mixed geographically weighted regression kriging: A case study in the Heihe River Basin, northwest China. Ecol. Indic. 2019, 102, 252–264. [Google Scholar] [CrossRef]
  35. Chai, Y.; Zeng, X.; Shengzhe, E.; Che, Z.; Bai, L.; Su, S.; Wang, Y. The stability mechanism for organic carbon of aggregate fractions in the irrigated desert soil based on the long-term fertilizer experiment of China. Catena 2019, 173, 312–320. [Google Scholar] [CrossRef]
  36. Okolo, C.C.; Gebresamuel, G.; Zenebe, A.; Haile, M.; Eze, P.N. Accumulation of organic carbon in various soil aggregate sizes under different land use systems in a semi-arid environment. Agric. Ecosyst. Environ. 2020, 297, 106924. [Google Scholar] [CrossRef]
  37. Pennanen, T. Microbial communities in boreal coniferous forest humus exposed to heavy metals and changes in soil pH—A summary of the use of phospholipid fatty acids, Biology and 3H-thymidine incorporation methods in field studies. Geoderma 2001, 100, 91–126. [Google Scholar] [CrossRef]
  38. Ondrasek, G.; Begić, H.B.; Zovko, M.; Filipović, L.; Meriño-Gergichevich, C.; Savić, R.; Rengel, Z. Biogeochemistry of soil organic matter in agroecosystems & environmental implications. Sci. Total Environ. 2019, 658, 1559–1573. [Google Scholar]
  39. Zhang, Y.; Xu, X.; Li, Z.; Liu, M.; Xu, C.; Zhang, R.; Luo, W. Effects of vegetation restoration on soil quality in degraded karst landscapes of southwest China. Sci. Total Environ. 2019, 650, 2657–2665. [Google Scholar] [CrossRef]
  40. Mukhopadhyay, S.; Masto, R.E.; Yadav, A.; George, J.; Ram, L.C.; Shukla, S.P. Soil quality index for evaluation of reclaimed coal mine spoil. Sci. Total Environ. 2016, 542, 540–550. [Google Scholar] [CrossRef]
  41. Boudjabi, S.; Chenchouni, H. Soil fertility indicators and soil stoichiometry in semi-arid steppe rangelands. Catena 2022, 210, 105910. [Google Scholar] [CrossRef]
  42. Gamalero, E.; Bona, E.; Todeschini, V.; Lingua, G. Saline and arid soils: Impact on bacteria, plants, and their interaction. Biology 2020, 9, 116. [Google Scholar] [CrossRef]
  43. Schofield, R.; Thomas, D.S.; Kirkby, M.J. Causal processes of soil salinization in Tunisia, Spain and Hungary. Land Degrad. Dev. 2001, 12, 163–181. [Google Scholar] [CrossRef]
  44. Vaezi, A.R.; Eslami, S.F.; Keesstra, S. Interrill erodibility in relation to aggregate size class in a semi-arid soil under simulated rainfalls. Catena 2018, 167, 385–398. [Google Scholar] [CrossRef]
  45. Pihlap, E.; Vuko, M.; Lucas, M.; Steffens, M.; Schloter, M.; Vetterlein, D.; Endenich, M.; Kögel-Knabner, I. Initial soil formation in an agriculturally reclaimed open-cast mining area-the role of management and loess parent material. Soil Tillage Res. 2019, 191, 224–237. [Google Scholar] [CrossRef]
  46. Liski, J.; Nissinen, A.; Erhard, M.; Taskinen, O. Climatic effects on litter decomposition from arctic tundra to tropical rainforest. Glob. Chang. Biol. 2003, 9, 575–584. [Google Scholar] [CrossRef]
  47. Brandt, C.J. The size distribution of throughfall drops under vegetation canopies. Catena 1989, 16, 507–524. [Google Scholar] [CrossRef]
  48. Hoorman, J.J.; Sá, J.; Reeder, R. The biology of soil compaction. Soil Tillage Res. 2011, 68, 49–57. [Google Scholar]
  49. Oades, J.M.; Gillman, G.P.; Uehara, G.; Hue, N.V.; Van Noordwijk, M.; Robertson, G.P.; Wada, K. Interactions of soil organic matter and variable-charge clays. Dyn. Soil Org. Matter Trop. Ecosyst. 1989, 3, 69–96. [Google Scholar]
  50. Meimaroglou, N.; Mouzakis, C. Cation Exchange Capacity (CEC), texture, consistency and organic matter in soil assessment for earth construction: The case of earth mortars. Constr. Build. Mater. 2019, 221, 27–39. [Google Scholar] [CrossRef]
  51. Alemayehu, B.; Teshome, H. Soil colloids, types and their properties: A review. Open J. Bioinform. Biostat. 2021, 5, 8–13. [Google Scholar]
  52. Zhou, J.; Saeidi, N.; Wick, L.Y.; Kopinke, F.; Georgi, A. Adsorption of polar and ionic organic compounds on activated carbon: Surface chemistry matters. Sci. Total Environ. 2021, 794, 148508. [Google Scholar] [CrossRef]
  53. Yang, F.; Sui, L.; Tang, C.; Li, J.; Cheng, K.; Xue, Q. Sustainable advances on phosphorus utilization in soil via addition of biochar and humic substances. Sci. Total Environ. 2021, 768, 145106. [Google Scholar] [CrossRef] [PubMed]
  54. Lv, L.; Gao, Z.; Liao, K.; Zhu, Q.; Zhu, J. Impact of conservation tillage on the distribution of soil nutrients with depth. Soil Tillage Res. 2023, 225, 105527. [Google Scholar] [CrossRef]
Figure 1. Profiles of main soil types (taken during sampling). O is humus horizon, A is leaching horizon, B is sediment horizon, and C is parent material horizon in the pictures. The picture of S5 (Yellow brown soil) was collected from Chine Soil Census.
Forests 14 00259 g001
Figure 2. Variance analysis of soil-available nitrogen (AN), soil-available phosphorus (AP), and soil-available potassium (AK) in 6 soil types (subalpine meadow soil, S1; meadow soil, S2; dark brown soil, S3; brown soil, S4; yellow-brown soil, S5; and cinnamon soil, S6). The different lowercase letters indicate significant differences in (a) at p < 0.05 by LSD test among 6 soil types, and the same letters indicate no significant differences at p < 0.05 by LSD test among 6 soil types. The different lowercase letters indicate significant differences in (b) at p < 0.05 by LSD test among 3 horizons (leaching horizon, A; sediment horizon, B; and parent material horizon, C) in the same soil types, and the same letters indicate no significant differences at p < 0.05 by LSD test among 3 horizons in the same soil types.
Forests 14 00259 g002
Figure 3. Variance analysis of soil cation exchange capacity (CEC), degree of base saturation (BS), pH value (pH), and electric conductivity (EC) in 6 soil types (subalpine meadow soil, S1; meadow soil, S2; dark brown soil, S3; brown soil, S4; yellow-brown soil, S5; and cinnamon soil, S6). The different lowercase letters indicate significant differences in (a) at p < 0.05 by LSD test among 6 soil types, and the same letters indicate no significant differences at p < 0.05 by LSD test among 6 soil types. The different lowercase letters indicate significant differences in (b) at p < 0.05 by LSD test among 3 horizons (leaching horizon, A; sediment horizon, B; and parent material horizon, C) in the same soil types, and the same letters indicate no significant differences at p < 0.05 by LSD test among 3 horizons in the same soil types.
Forests 14 00259 g003
Figure 4. Pearson’s correlation analysis of soil-available nitrogen (AN), soil-available phosphorus (AP), soil-available potassium (AK), soil chemical and aggregate properties (soil cation exchange capacity, CEC; degree of base saturation, BS; pH value, pH; electric conductivity, EC), and aggregate properties (non-water-stable aggregate content and water-stable aggregate content, soil aggregate of mean weight diameter, MWD; geometric mean diameter, GMD; fractal dimensions, D) in 6 soil types ((a); subalpine meadow soil, S1; meadow soil, S2; dark brown soil, S3; brown soil, S4; yellow-brown soil, S5; and cinnamon soil, S6) and 3 horizons ((b); leaching horizon, A; sediment horizon, B; and parent material horizon, C). The results with green and red squares show significant positive and negative pairwise relationships, respectively.
Forests 14 00259 g004
Table 1. Descriptions of the sampling plots.
CodeSoil TypeLatitude (m)Vegetation Composition
S1Subalpine meadow soil3432–4136Shrub meadow, such as Salix cupularis Rehd., Rhododendron simsii Planch.; Subalpine meadow, such as Rhododendron watsonii Hemsl. et Wils., Sibiraea angustata (Rehd.) Hand.-Mazz., Rhododendron amesiae Rehd. et Wils., Potentilla fruticose L., Lonicera rupicola Hook. f. et Thoms.
S2Meadow soil3521–3543Meadow
S3Dark brown soil3405–3737Picea asperata Mast., Abies fabri Craib, Cupressus chengiana Hu, Rhododendron simsii Planch.
S4Brown soil2534–3370Picea asperata Mast., Cupressus chengiana Hu, Larix gmelinii Kuzen., Populus davidiana Dode, Tsuga chinensis (Franch.) Pritz., Betula albosinensis Burkill, Betula platyphylla Suk., Acer caesium Wall. ex Brandis
S5Yellow-brown soil 2330–1842Cupressus chengiana S. Y. Hu, Pinus tabuliformis Carriere, Robinia pseudoacacia L., Ailanthus altissima (Mill.) Swingle, Malus pumila Mill., Zanthoxylum bungeanum Maxim., Betula platyphylla Suk., Quercus glauca Thunb.
S6Cinnamon soil1319–1694Returning farmland to forest, such as Platycladus orientalis (L.) Franco, Cupressus chengiana S. Y. Hu, Pinus tabuliformis Carriere, Ailanthus altissima (Mill.) Swingle
Table 2. Two-way ANOVA of soil-available nutrients. *** indicates significant differences at p < 0.01.
DfSum Sq Mean Sq F Valvep Value
ANSoil type5171,30834,26211.951***
Horizon2321,571160,78556.084***
Soil type×Horizon1047,90147901.6710.0944
APSoil type5107,60921,5225.975***
Horizon2630.0010.999
Soil type×Horizon1024,65624660.6840.737
AKSoil type524,68549371.7240.134
Horizon262,01531,00810.826***
Soil type×Horizon1014,53514540.5070.882
Table 3. Variance analysis of non-water- and water-stable aggregates (mean and sd) of mean weight diameter (MWD), geometric mean diameter (GMD), and fractal dimensions (D) in 6 soil types (subalpine meadow soil, S1; meadow soil, S2; dark brown soil, S3; brown soil, S4; yellow-brown soil, S5; and cinnamon soil, S6). The different uppercase letters indicate significant difference at p < 0.05 by LSD test among 6 soil types, and the same letters indicate no significant differences at p < 0.05 by LSD test among 6 soil types. The different lowercase letters indicate significant difference at p < 0.05 by LSD test among 3 horizons (leaching horizon, A; sediment horizon, B; and parent material horizon, C) in the same soil types, and the same letters indicate no significant differences at p < 0.05 by LSD test among 3 horizons in the same soil types.
Soil TypeHorizonNon-Water-Stable Aggregates Water-Stable Aggregates
MWDGMDDMWDGMDD
S1A4.3 ± 0.95 a1.52 ± 0.26 a1.86 ± 0.37 a1.94 ± 0.56 a1.03 ± 0.24 a2.03 ± 0.4 a
B4.31 ± 0.88 a1.54 ± 0.19 a1.83 ± 0.3 a1.84 ± 0.67 a0.96 ± 0.31 a2.1 ± 0.51 a
C5.01 ± 1.13 a1.69 ± 0.27 a1.56 ± 0.5 a1.43 ± 0.75 a0.79 ± 0.31 a2.38 ± 0.43 a
Mean4.51 ± 1.01 AB1.57 ± 0.25 AB1.76 ± 0.41 BC1.79 ± 0.65 AB0.94 ± 0.29 A2.14 ± 0.45 C
S2A3.43 ± 0.65 a1.26 ± 0.18 a2.22 ± 0.2 a1.23 ± 0.35 a0.74 ± 0.17 a2.49 ± 0.19 a
B3.43 ± 1.94 a1.23 ± 0.47 a2.17 ± 0.55 a0.67 ± 0.52 a0.53 ± 0.17 a2.74 ± 0.21 a
C3.07 ± 1.99 a1.17 ± 0.5 a2.24 ± 0.6 a1.77 ± 1.05 a0.9 ± 0.44 a2.14 ± 0.67 a
Mean3.31 ± 1.42 C1.22 ± 0.38 C2.21 ± 0.44 A1.15 ± 0.77 C0.71 ± 0.30 C2.48 ± 0.43 A
S3A4.2 ± 0.66 a1.52 ± 0.18 a1.88 ± 0.26 a2.11 ± 0.39 a1.11 ± 0.16 a1.91 ± 0.3 a
B4.31 ± 0.72 a1.57 ± 0.16 a1.81 ± 0.26 a1.91 ± 0.49 a1 ± 0.24 ab2.08 ± 0.36 a
C4.65 ± 0.75 a1.63 ± 0.18 a1.71 ± 0.3 a1.67 ± 0.63 a0.86 ± 0.24 b2.29 ± 0.34 a
Mean4.37 ± 0.72 AB1.57 ± 0.17 AB1.8 ± 0.27 BC1.92 ± 0.52 A0.99 ± 0.23 A2.08 ± 0.36 C
S4A3.96 ± 0.69 a1.44 ± 0.19 a1.99 ± 0.26 a2.11 ± 0.26 a1.09 ± 0.11 a1.96 ± 0.21 a
B4.21 ± 0.77 a1.51 ± 0.21 a1.89 ± 0.32 a1.83 ± 0.32 a0.95 ± 0.15 a2.19 ± 0.22 a
C4.75 ± 1.1 a1.61 ± 0.33 a1.67 ± 0.52 a1.7 ± 0.55 a0.88 ± 0.22 a2.26 ± 0.32 a
Mean4.29 ± 0.86 B1.52 ± 0.24 B1.86 ± 0.38 B1.87 ± 0.42 A0.97 ± 0.18 A2.14 ± 0.27 C
S5A4.43 ± 0.86 a1.57 ± 0.26 a1.76 ± 0.49 a1.88 ± 0.9 a0.97 ± 0.39 a2.04 ± 0.64 a
B5.04 ± 0.67 a1.71 ± 0.22 a1.53 ± 0.45 a1.49 ± 0.72 a0.82 ± 0.26 a2.34 ± 0.35 a
C5.33 ± 0.28 a1.79 ± 0.11 a1.43 ± 0.21 a1.73 ± 0.51 a0.87 ± 0.16 a2.27 ± 0.24 a
Mean4.9 ± 0.76 A1.68 ± 0.23 A1.59 ± 0.44 C1.72 ± 0.74 AB0.9 ± 0.29 AB2.19 ± 0.47 BC
S6A3.19 ± 0.73 a1.18 ± 0.22 a2.29 ± 0.23 a1.52 ± 0.51 a0.8 ± 0.2 a2.37 ± 0.28 a
B3.79 ± 1.27 a1.31 ± 0.36 a2.06 ± 0.59 a1.82 ± 0.32 a0.89 ± 0.13 a2.25 ± 0.19 a
C4.57 ± 0.87 a1.55 ± 0.27 a1.81 ± 0.39 a1.61 ± 0.53 a0.8 ± 0.17 a2.36 ± 0.24 a
Mean3.66 ± 0.92 C1.29 ± 0.26 C2.11 ± 0.32 A1.54 ± 0.45 B0.83 ± 0.17 BC2.37 ± 0.24 AB
Disclaimer/Publisher’s Note: The statements, opinions and data contained in all publications are solely those of the individual author(s) and contributor(s) and not of MDPI and/or the editor(s). MDPI and/or the editor(s) disclaim responsibility for any injury to people or property resulting from any ideas, methods, instructions or products referred to in the content.

