Article

Effects of Human Social-Economic Activities on Vegetation Suitability in the Yellow River Basin, China

1
College of Economics and Management, China Agricultural University, Beijing 100083, China
2
Research Institute of Forestry Policy and Information, Chinese Academy of Forestry, Beijing 100091, China
*
Author to whom correspondence should be addressed.
Forests 2023, 14(2), 234; https://doi.org/10.3390/f14020234
Submission received: 24 December 2022 / Revised: 13 January 2023 / Accepted: 16 January 2023 / Published: 27 January 2023
(This article belongs to the Special Issue Changes in the Value of Forest Resources: Impacts of Human Activities)

Abstract

:
Vegetation suitability assessment is the premise of scientific vegetation restoration and identifying its effect factors is conducive to imposing more targeted measures. In this paper, we take 24 social-economic factors that may affect vegetation suitability as indicators and construct the three criterion layers of production, life and policy. Then, we use cross-sectional data of 448 counties in the Yellow River Basin during 2018 to analyze how the social-economic factors influence the vegetation suitability. The results show that human activity factors affecting vegetation suitability vary a lot for counties in different reaches of the Yellow River. To be specific, overirrigation and overfertilization have negative influences on vegetation suitability in upstream counties. In the middle reaches, development of the secondary industry and urbanization have the most significant negative effects on vegetation suitability. When it comes to the lower reaches, economic advance contributes to the vegetation suitability, but an excessive population density counteracts this positive effect. We also find that the implementation of major ecological projects has played a positive role in improving vegetation suitability in the last few years, and the more targeted the policies are, the more significant their effects will be. In summary, there is no doubt that overfrequent human activities can interfere with the vegetation suitability. At the end of this article, we put forward some pertinent suggestions on how to better play the subjective initiative of human activities to improve the suitability of vegetation.

1. Introduction

The Yellow River Basin plays an irreplaceable role in both social and economic development and ecological security. On the one hand, it has always been the center of political, economic and cultural progress in the historical process of the great unification of China for more than 3000 years [1]. The Huang-Huai-Hai Plain, Fen-Wei Plain and Hetao irrigation district along the Yellow River, which are the main agriculture-producing areas, contribute about one-third of the total grain and meat in China. Shanxi Province and Shaanxi Province are the most important energy bases in our country [2]. On the other hand, the Yellow River Basin also works as an ecological corridor connecting the east and west of China. In view of such important functions as wind-breaking, sand-fixing and ecological protection, it will directly affect the evolution trend of ecological security and environmental quality of our country in the medium to long term [3,4]. However, worryingly, the Yellow River has always been a “River of Trouble” in Chinese history due to it being prone to silting as well as to breaking the banks. When studying the Yellow River carefully, we find that the natural conditions in the upper, middle and lower reaches are quite different, which might explain why it is one of the rivers with the highest sand content and is one of the most seriously flooded in the world, and thus undoubtedly being one of the most difficult to manage. Just because of that, the ecological protection of the Yellow River Basin has received continuous and high attention from the academic community and the government over the years.
Vegetation, which is the link between atmosphere, water and soil [5], is a most sensitive factor that reflects the change of ecological environment directly [6]. A dynamic and long-term monitoring of vegetation growth is helpful to better simulate the trend of ecological environment change and better evaluate the functionality and serviceability of ecosystem [7]. Therefore, scholars are accustomed to using the vegetation distribution characteristics in a certain region to represent the overall status of regional ecological environment and try to explore the factors that affect the vegetation distribution and thus seek efficient and effective ways to improve the ecological environment. On the analysis of existing literature, we find that when it refers to the research areas, the Loess Plateau, Qinghai-Tibet Plateau, Inner Mongolia and Northwest China and other ecologically fragile areas attract great attention of scholars [8]. From the perspective of research objects, the normalized vegetation index (NDVI) is the most widely used in both qualitative and quantitative evaluation of vegetation cover and its growth vigor [9]. NDVI increased significantly on all continents except for Oceania [10]. Reams of studies have shown that climatic change, represented by temperature and precipitation, is the most important natural factor that affects vegetation NDVI [11]. For example, Fensholt et al. (2012) pointed out that temperature and precipitation were the main factors limiting the growth of vegetation in the global semi-arid areas [12]. Guo et al. (2017) also found that temperature was the main factor affecting vegetation growth in the permafrost region of northeast China [13]. In addition, studies on different ecological types in areas such as the headwaters of the Three Rivers, North China and the Loess Plateau also confirmed the important role of climate change in vegetation cover change [14,15,16]. Usually, in arid and semi-arid areas such as Central Asia, the southern Sahara, South Africa, Australia and South America, as well as the northern Loess Plateau and Xinjiang in China, higher precipitation has led to higher NDVI [17]. Gao et. al. (2019) studied the spatial distribution and dynamic characteristics of the response of NDVI to climatic change in China during 1982–2013. They not only discovered the significant spatial heterogeneity of vegetation NDVI in China, but also revealed that the water-dominated regions were distributed in North China and the Qinghai-Tibet Plateau, while the temperature-dominated regions were mainly in eastern, central and southwestern China. A non-stationary spatial relationship between NDVI and land surface temperature was also unveiled in their study [18].
In addition to natural factors, scholars have gradually focused on the impact of human activities on vegetation cover change in recent years, especially the effects of land use change, agricultural production, urbanization and policies. Relevant studies have reached a relatively consistent conclusion; that is, human activities have a dual impact on vegetation cover change. Studies on the impacts of anthropogenic activities on the vegetation were undertaken in Egypt, Chile, Poland, Kuwait and Tunisia [19,20,21,22,23]. Ethar et al. (2021) found that long-term intensive human activities led to vegetation degradation and species loss, so vegetation species were the most abundant in the protected areas in Egypt [19]. Neji et al. (2018) observed that in Tunisia, after 13 years of protection for specific species against human activities, the total cover increased 58.3% and the plant density increased 21.7% [23]. As for China, Xin et al. (2007) discovered that it was human activities, such as deforestation, farming in the river loop areas and urbanization, that resulted in the regional differences in vegetation cover change between Inner Mongolia and Mongolia with similar climatic conditions [24]. Deng et al. (2018) found that human activities had become a major contributing factor to vegetation cover change in Qinling Mountains [25]. Yi et al. (2014) found positive and negative effects of human activities coexisted with the change of vegetation cover in the Loess Plateau region, among which, urbanization, overgrazing, indiscriminate deforestation, excessive reclamation and energy exploitation led to the reduction of NDVI, but implementing returning cropland to forestry (grass) was gradually exerting positive effects [26]. Zhao et al. (2019) used night light data to confirm that urbanization was the main cause of vegetation change in Hubei Province [27]. However, Wang et al. (2019) analyzed the spatial distinction of human activities affected the vegetation cover and found that the negative effects were decreasing while positive ones were on the increase across the country [28]. When Wu et al. (2020) investigated the spatial-temporal evolution of vegetation index in Sichuan Province, they found artificial ecological engineering was the main driving force [29]. It was also proved that after the implementation of China’s plan to return farmland to forests, the vegetation restoration rate was more than six times the rate before [30].
Although the research objects and emphasis are somewhat different, literature analysis is of great benefit to better understand the spatial-temporal changes of vegetation cover and its influencing factors in different regions of the Yellow River Basin. However, on the one hand, the vegetation cover index can only reflect the amount of vegetation cover in each region rather than its quality, which is defined as the relationship between vegetation and specific environment and the degree of suitability. From this perspective, vegetation suitability is undoubtedly a more accurate and comprehensive measure. We believe that a correct assessment of the suitability of the existing vegetation under the present natural conditions is the prerequisite for scientific vegetation restoration in the Yellow River Basin. On the other hand, the influence of natural factors on the vegetation suitability is slow and can only be shown after a long time. However, such human activities as river excavation, reservoir construction and desert greening can lead to vegetation change directly in a short run, and other production and living activities to meet the needs of human survival and development can also affect the vegetation suitability by affecting soil, water and climate. In previous research, the impact of human activities is generally analyzed by selecting one or several proxy variables, which cannot reflect the important role comprehensively and profoundly. Based on this, we selected 24 indicators of county-level from the three dimensions of production, life and policy intensity, and established a multiple regression model to identify which social-economic factors can affect the vegetation suitability of the Yellow River Basin and how they do that. We hope that our study is helpful to formulate more targeted and practical policy to improve the ecological fragility of the Yellow River Basin, scientifically carry out vegetation restoration and promote the high-quality development of forests and grass.

2. Basic Concepts, Methods and Data
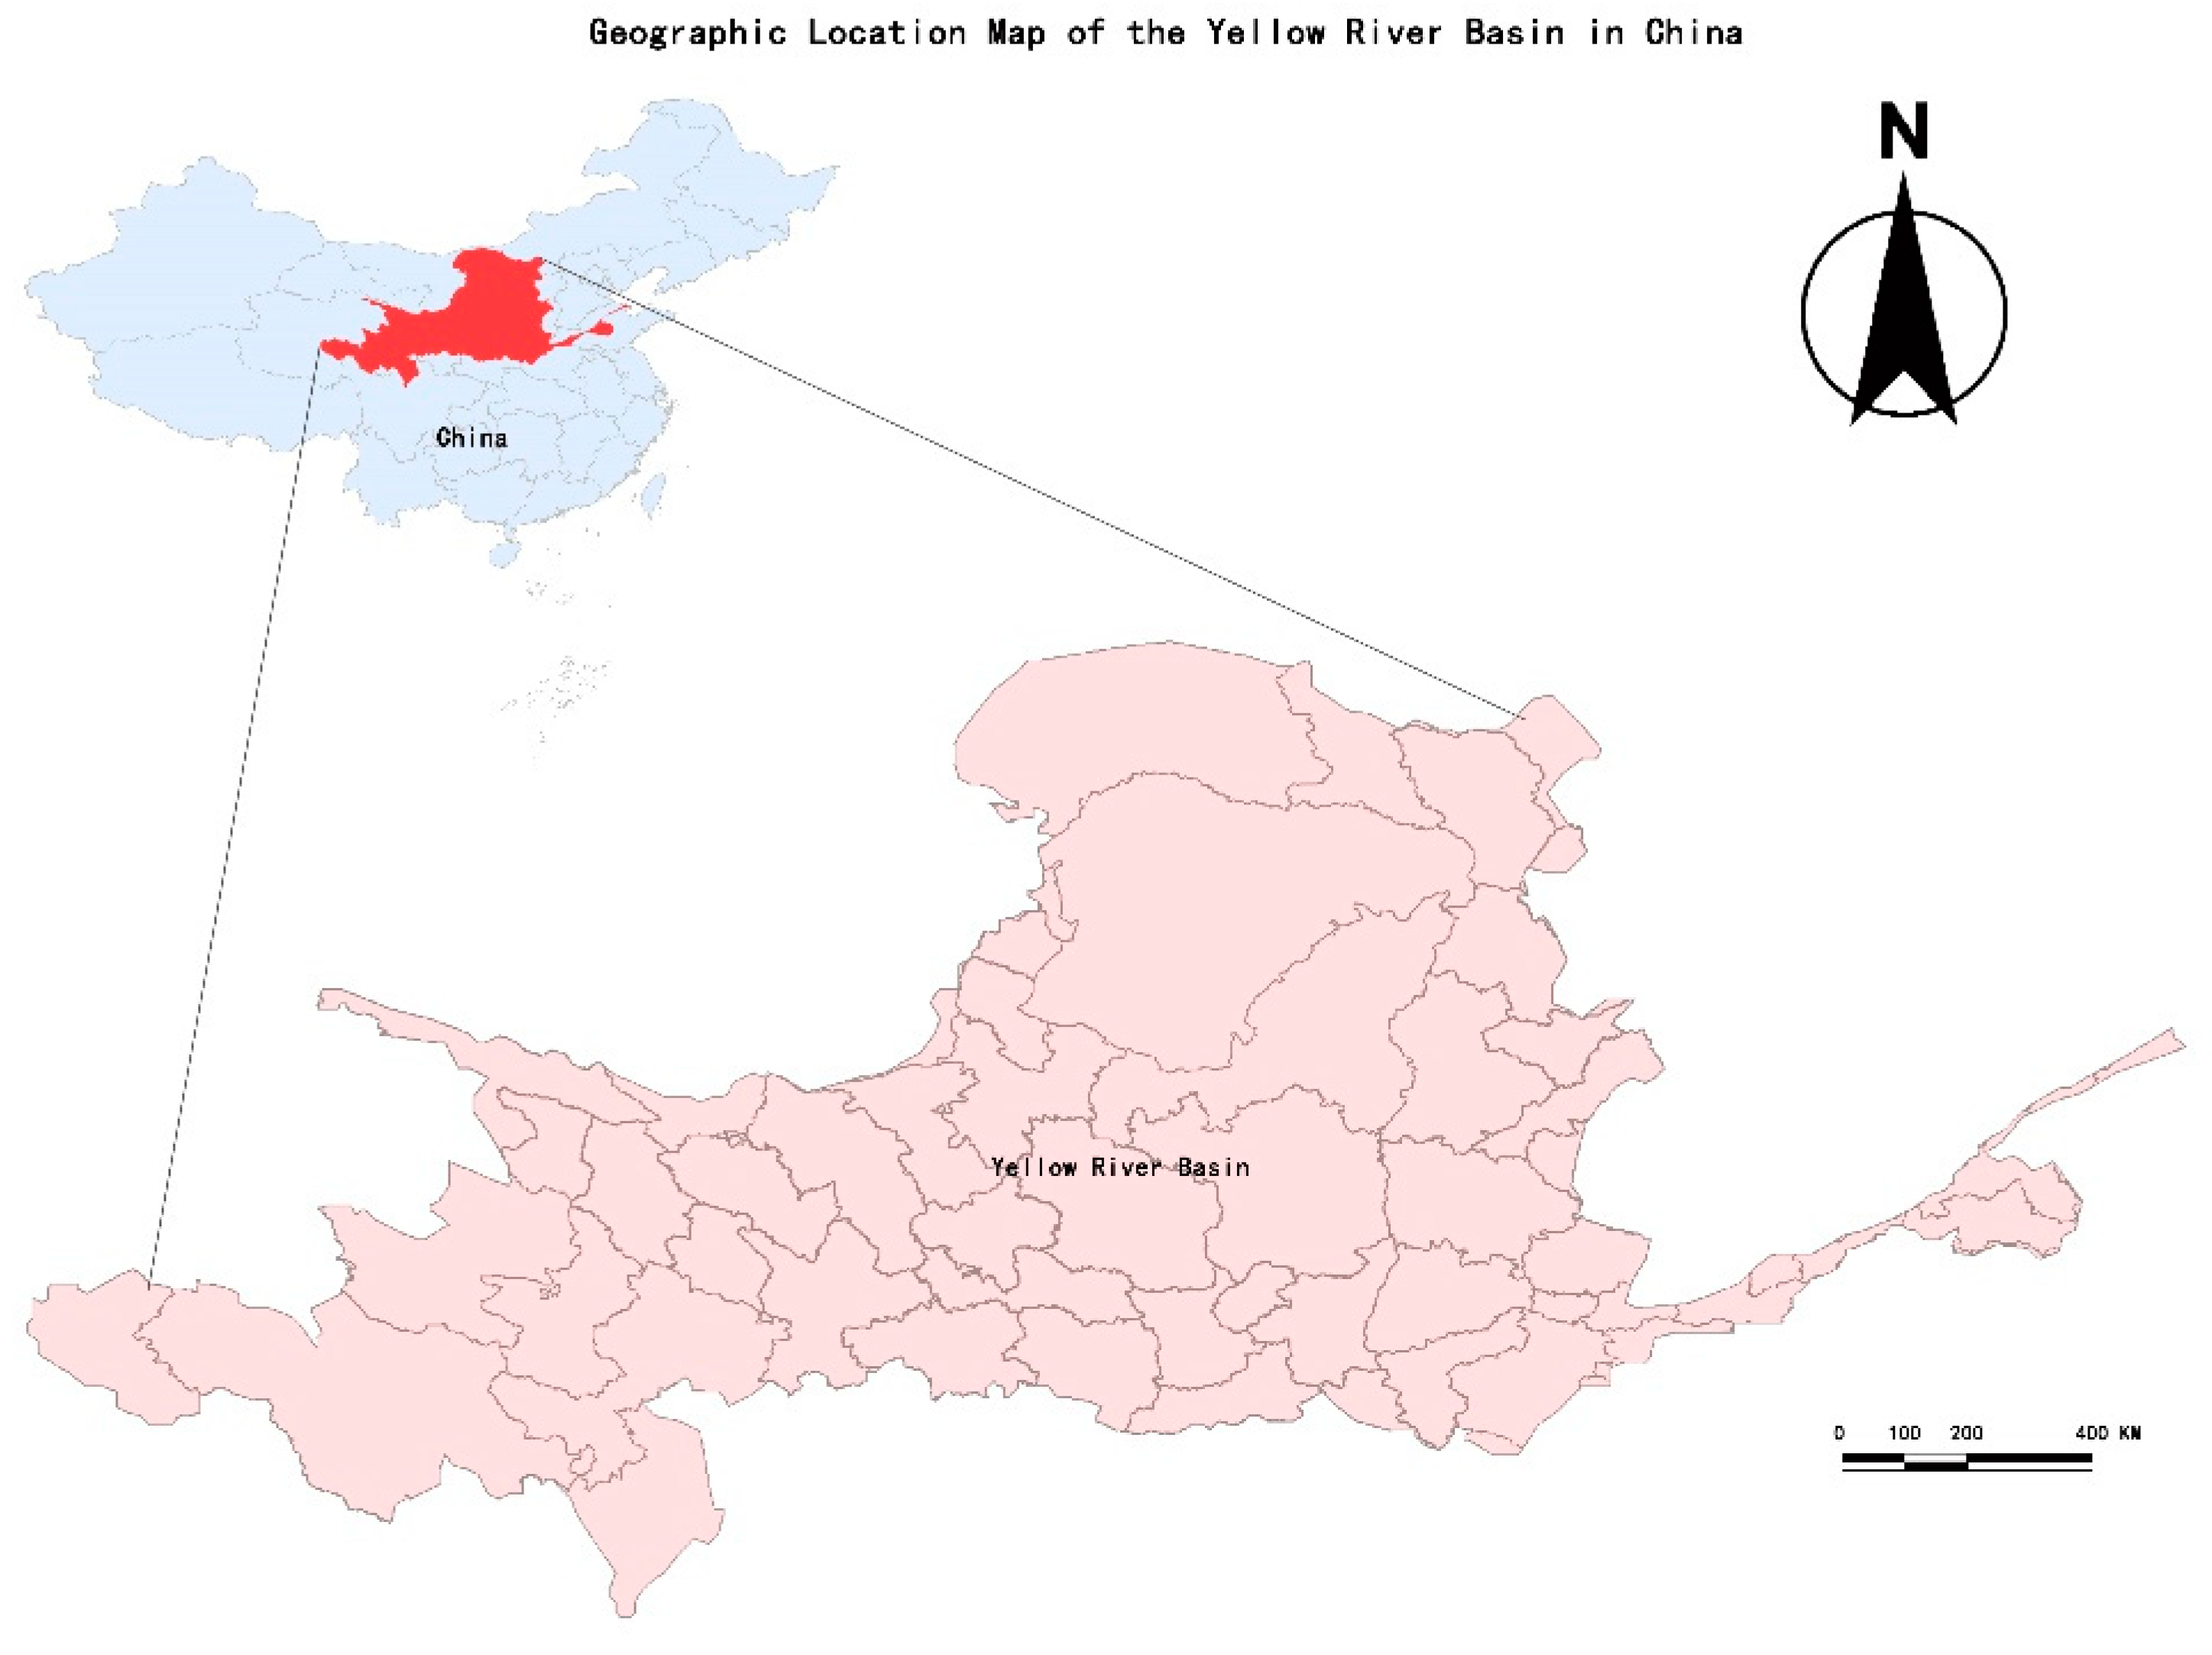
2.1. Study Area

The Yellow River (located between 96°~119° E and 32°~42° N) originates from the northern foot of Bayan Har Mountain. With a total length of 5464 km (3395 miles), it is the fifth largest river in the world. It flows through nine provinces: Qinghai, Sichuan, Gansu, Ningxia, Inner Mongolia, Shaanxi, Shanxi, Henan and Shandong [31], spanning 3 climatic zones, 8 climatic zones and 15 climatic sub-zones [32]. The Yellow River Basin (Figure 1) covers a total area of 795,000 square kilometers, with an internal flowing area of 42,000 square kilometers. From west to east, it strides across four geomorphic units: Qinghai-Tibet Plateau, Inner Mongolia Plateau, Loess Plateau and Huang-Huai-Hai Plain. The western source area has an average elevation of more than 4000 m. It is composed of a series of high mountains with persistent snow and glacier landforms. The central region, with an altitude of 1000 to 2000 m, is dominated by loess landforms. The eastern part consists of the Yellow River alluvial plain, which is no more than 100 m above sea level. The precipitation in the Yellow River Basin is spatially uneven and with great inter-annual variations. The main vegetation types are grassland, farmland, woodland and shrub. Other vegetation types such as bare land, wetland and tundra are also distributed [33]. Due to its large altitude difference, complex geographical and climatic conditions and fragile ecosystem, the Yellow River Basin has become one of the regions with the most intense human activities in the world [34].

2.2. Basic Concepts

2.2.1. Vegetation Suitability

“Vegetation suitability” refers to the appropriateness degree to which the natural elements in the environment (including climate, soil and terrain) provide living space and productivity for a specific vegetation type under a certain land-use type in a certain region. In this paper, the vegetation is classified as forest, shrub and grass; thus, vegetation suitability is represented by Forest–Shrub–Grass Suitability (FSGS).

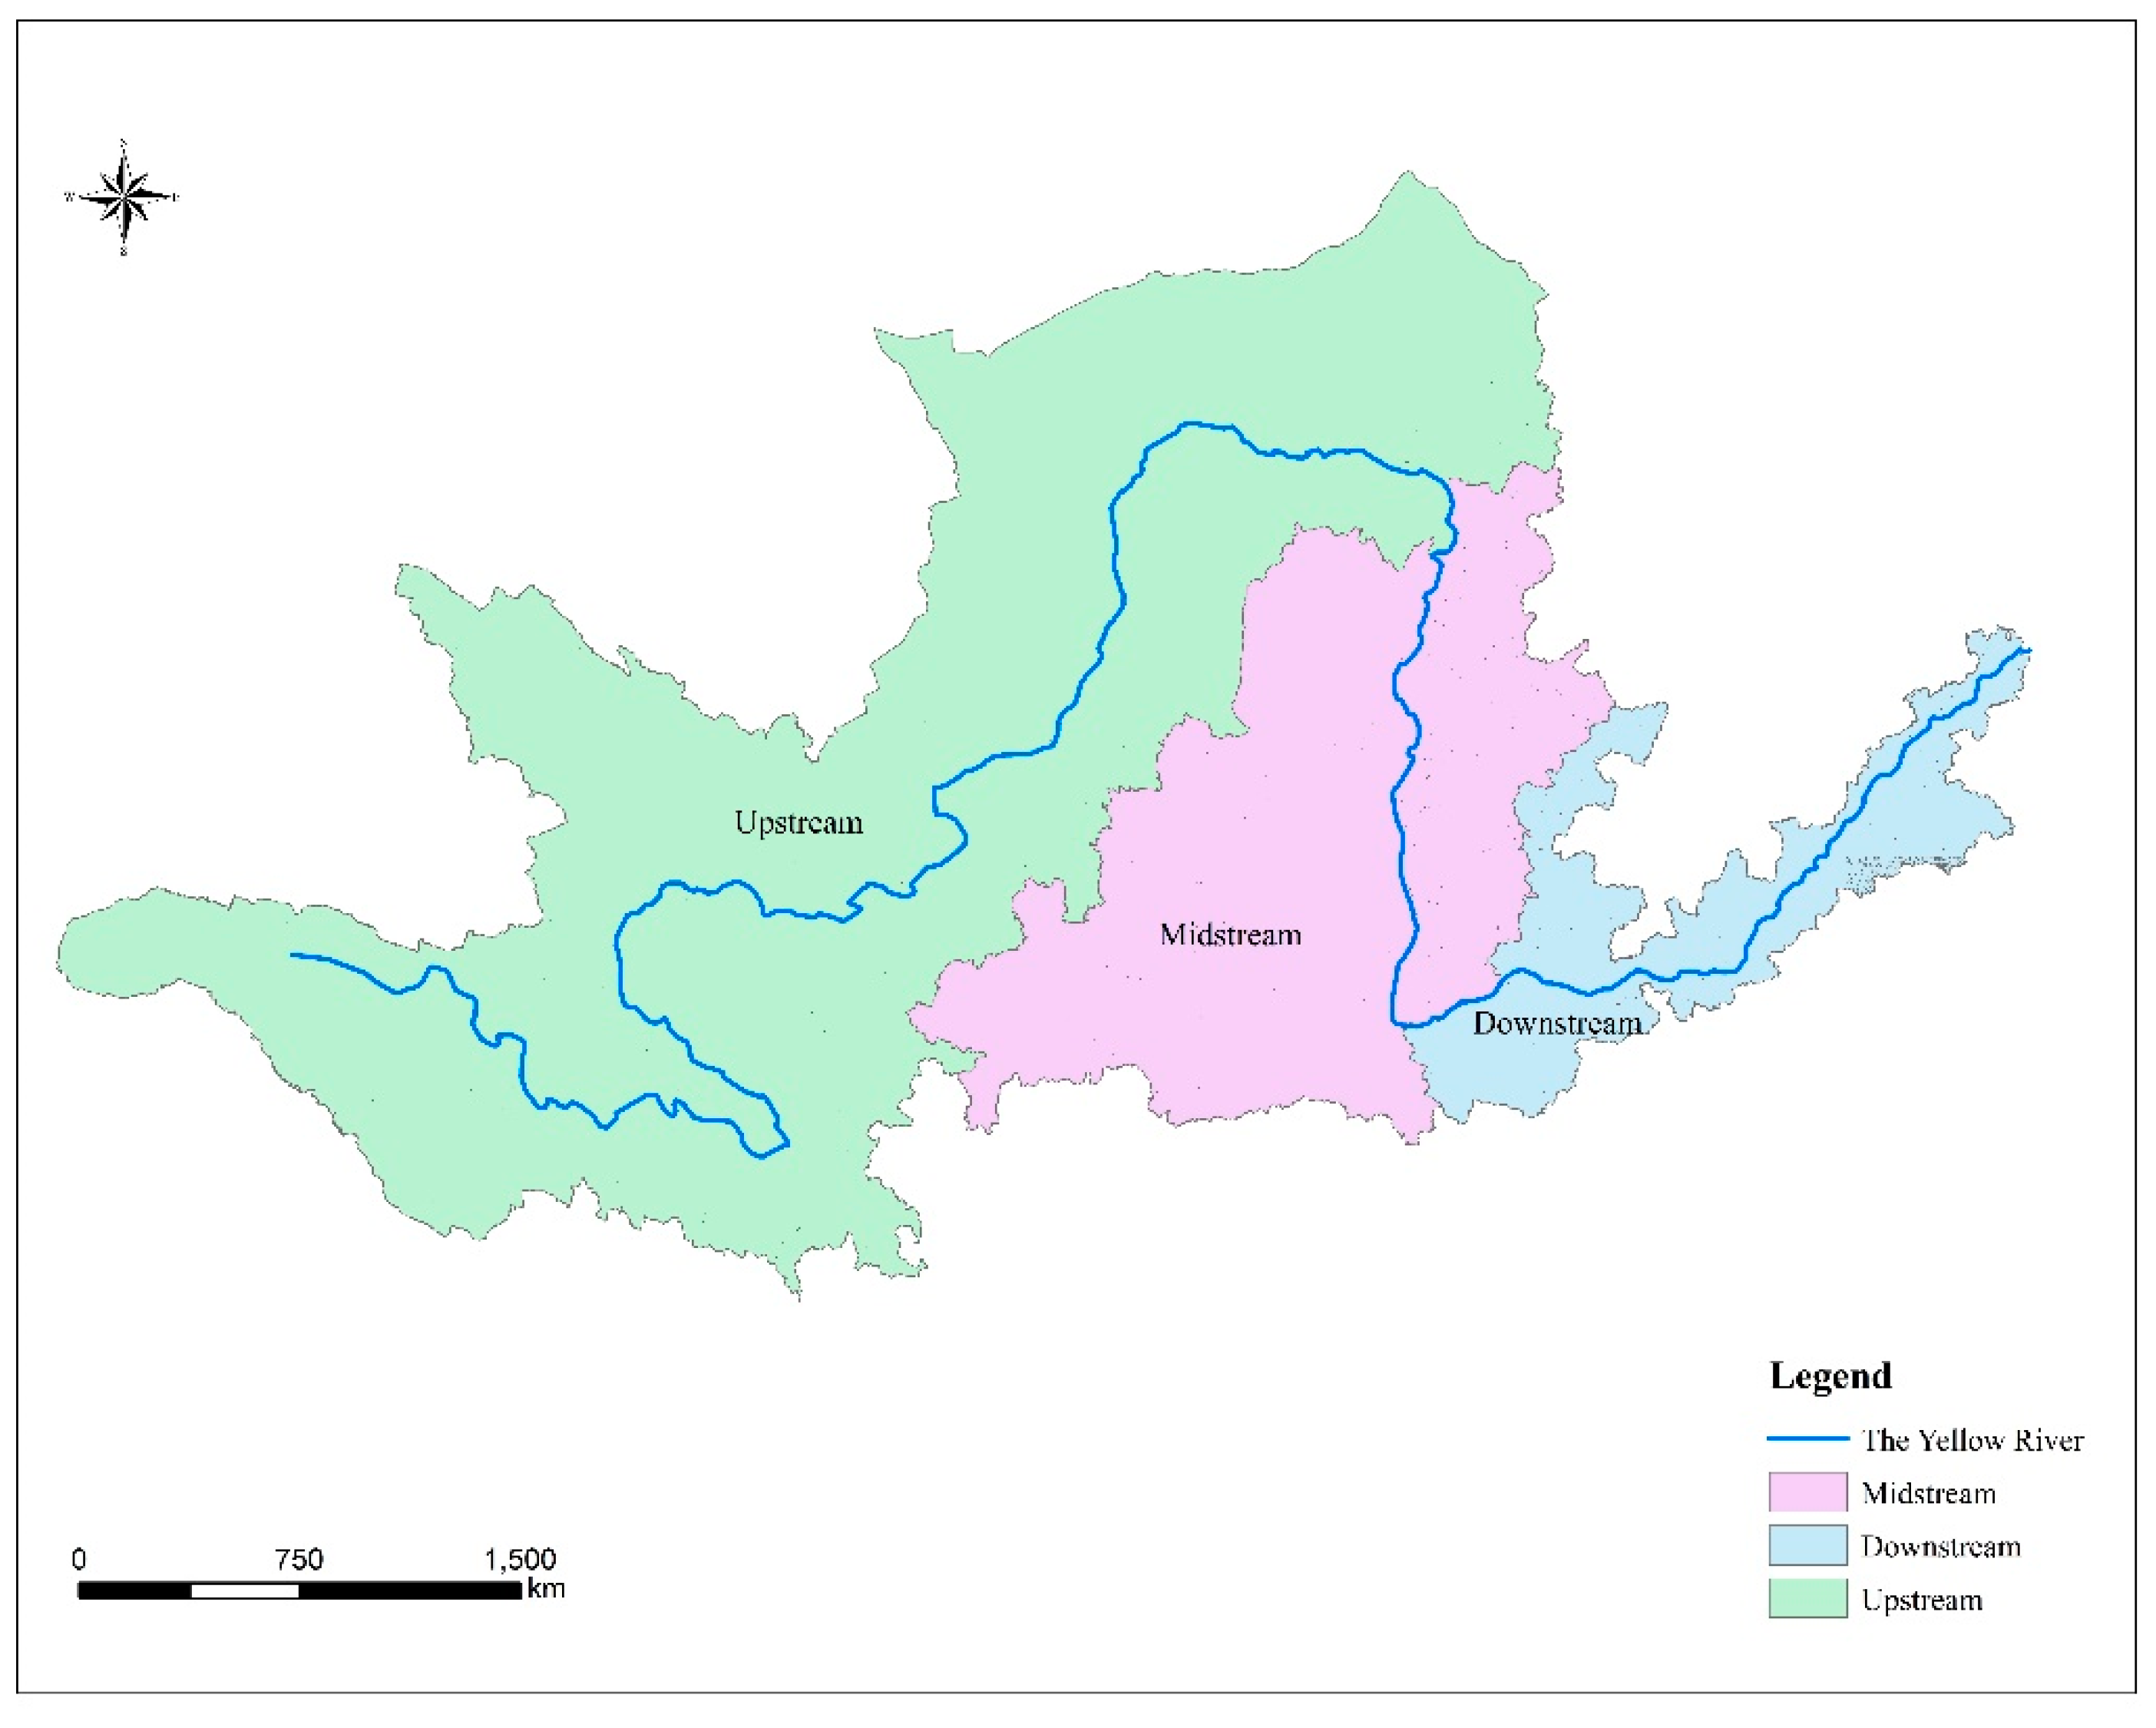
2.2.2. Different Reaches of the Yellow River Basin

As shown in Figure 2, the upper, middle and lower reaches of the Yellow River are divided with Hekou Town and Taohua Valley as the boundary by referring to the division scheme of the Yellow River Water Conservancy Commission. To be specific, it is the upper reaches of the Yellow River from the headwaters to Hekou Town in Tuoketuo County, Inner Mongolian Autonomous Region. The middle reaches are from Hekou Town to Taohua Valley, Xingyang City, Zhengzhou City, Henan Province. Below Taohua Valley is the lower reaches of the Yellow River [35].

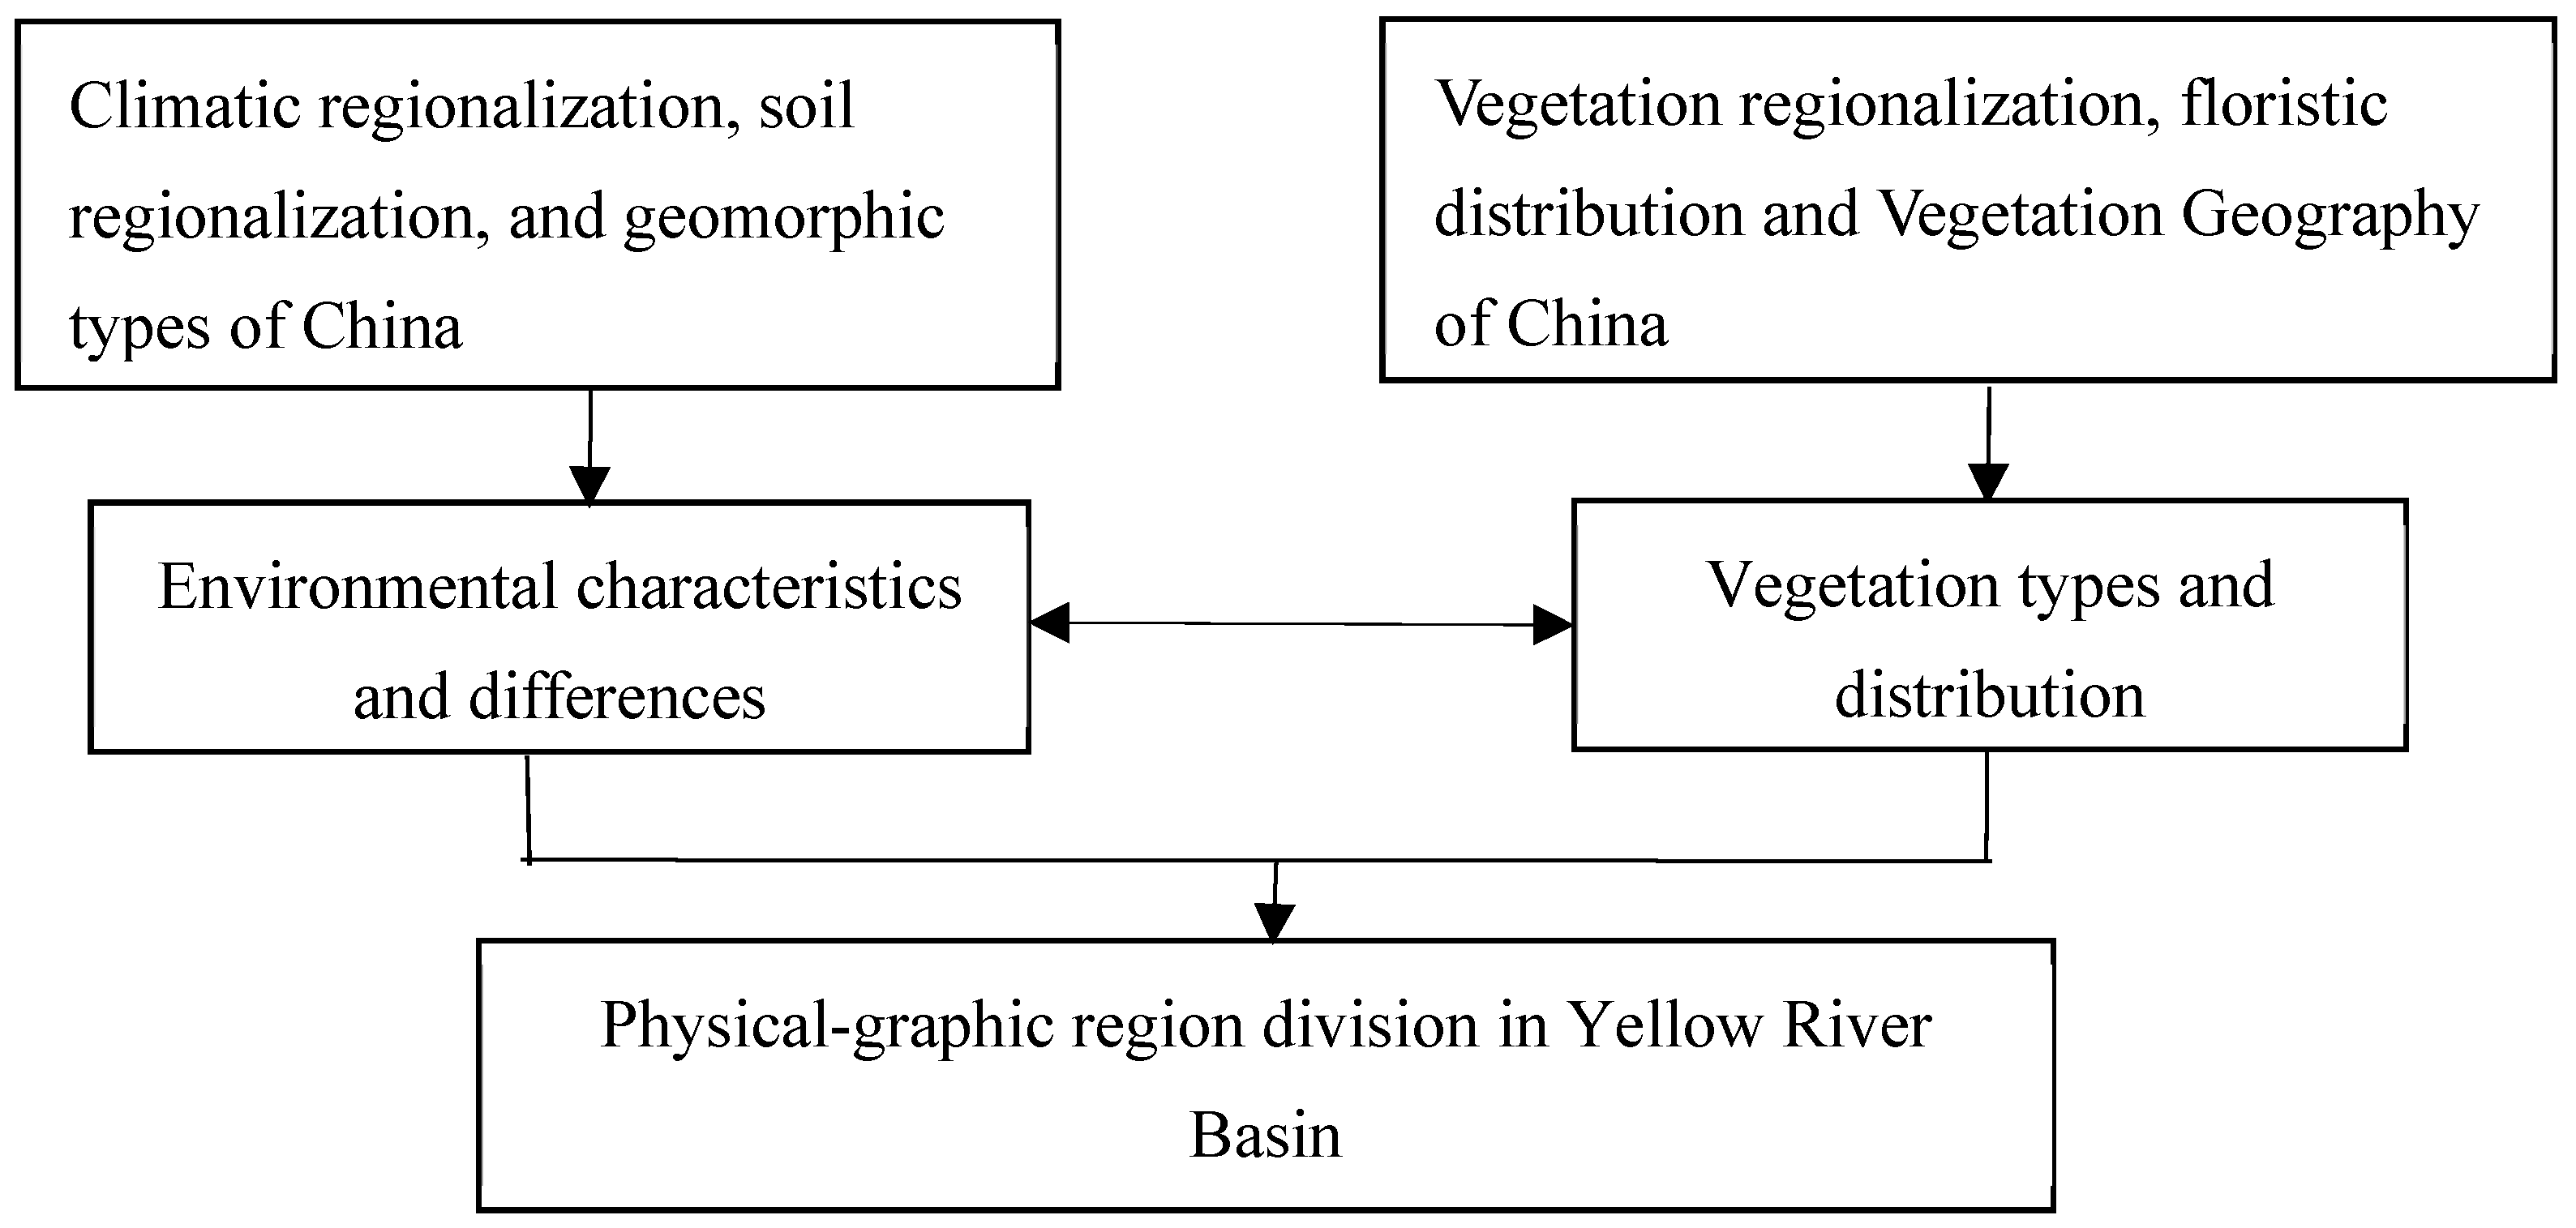
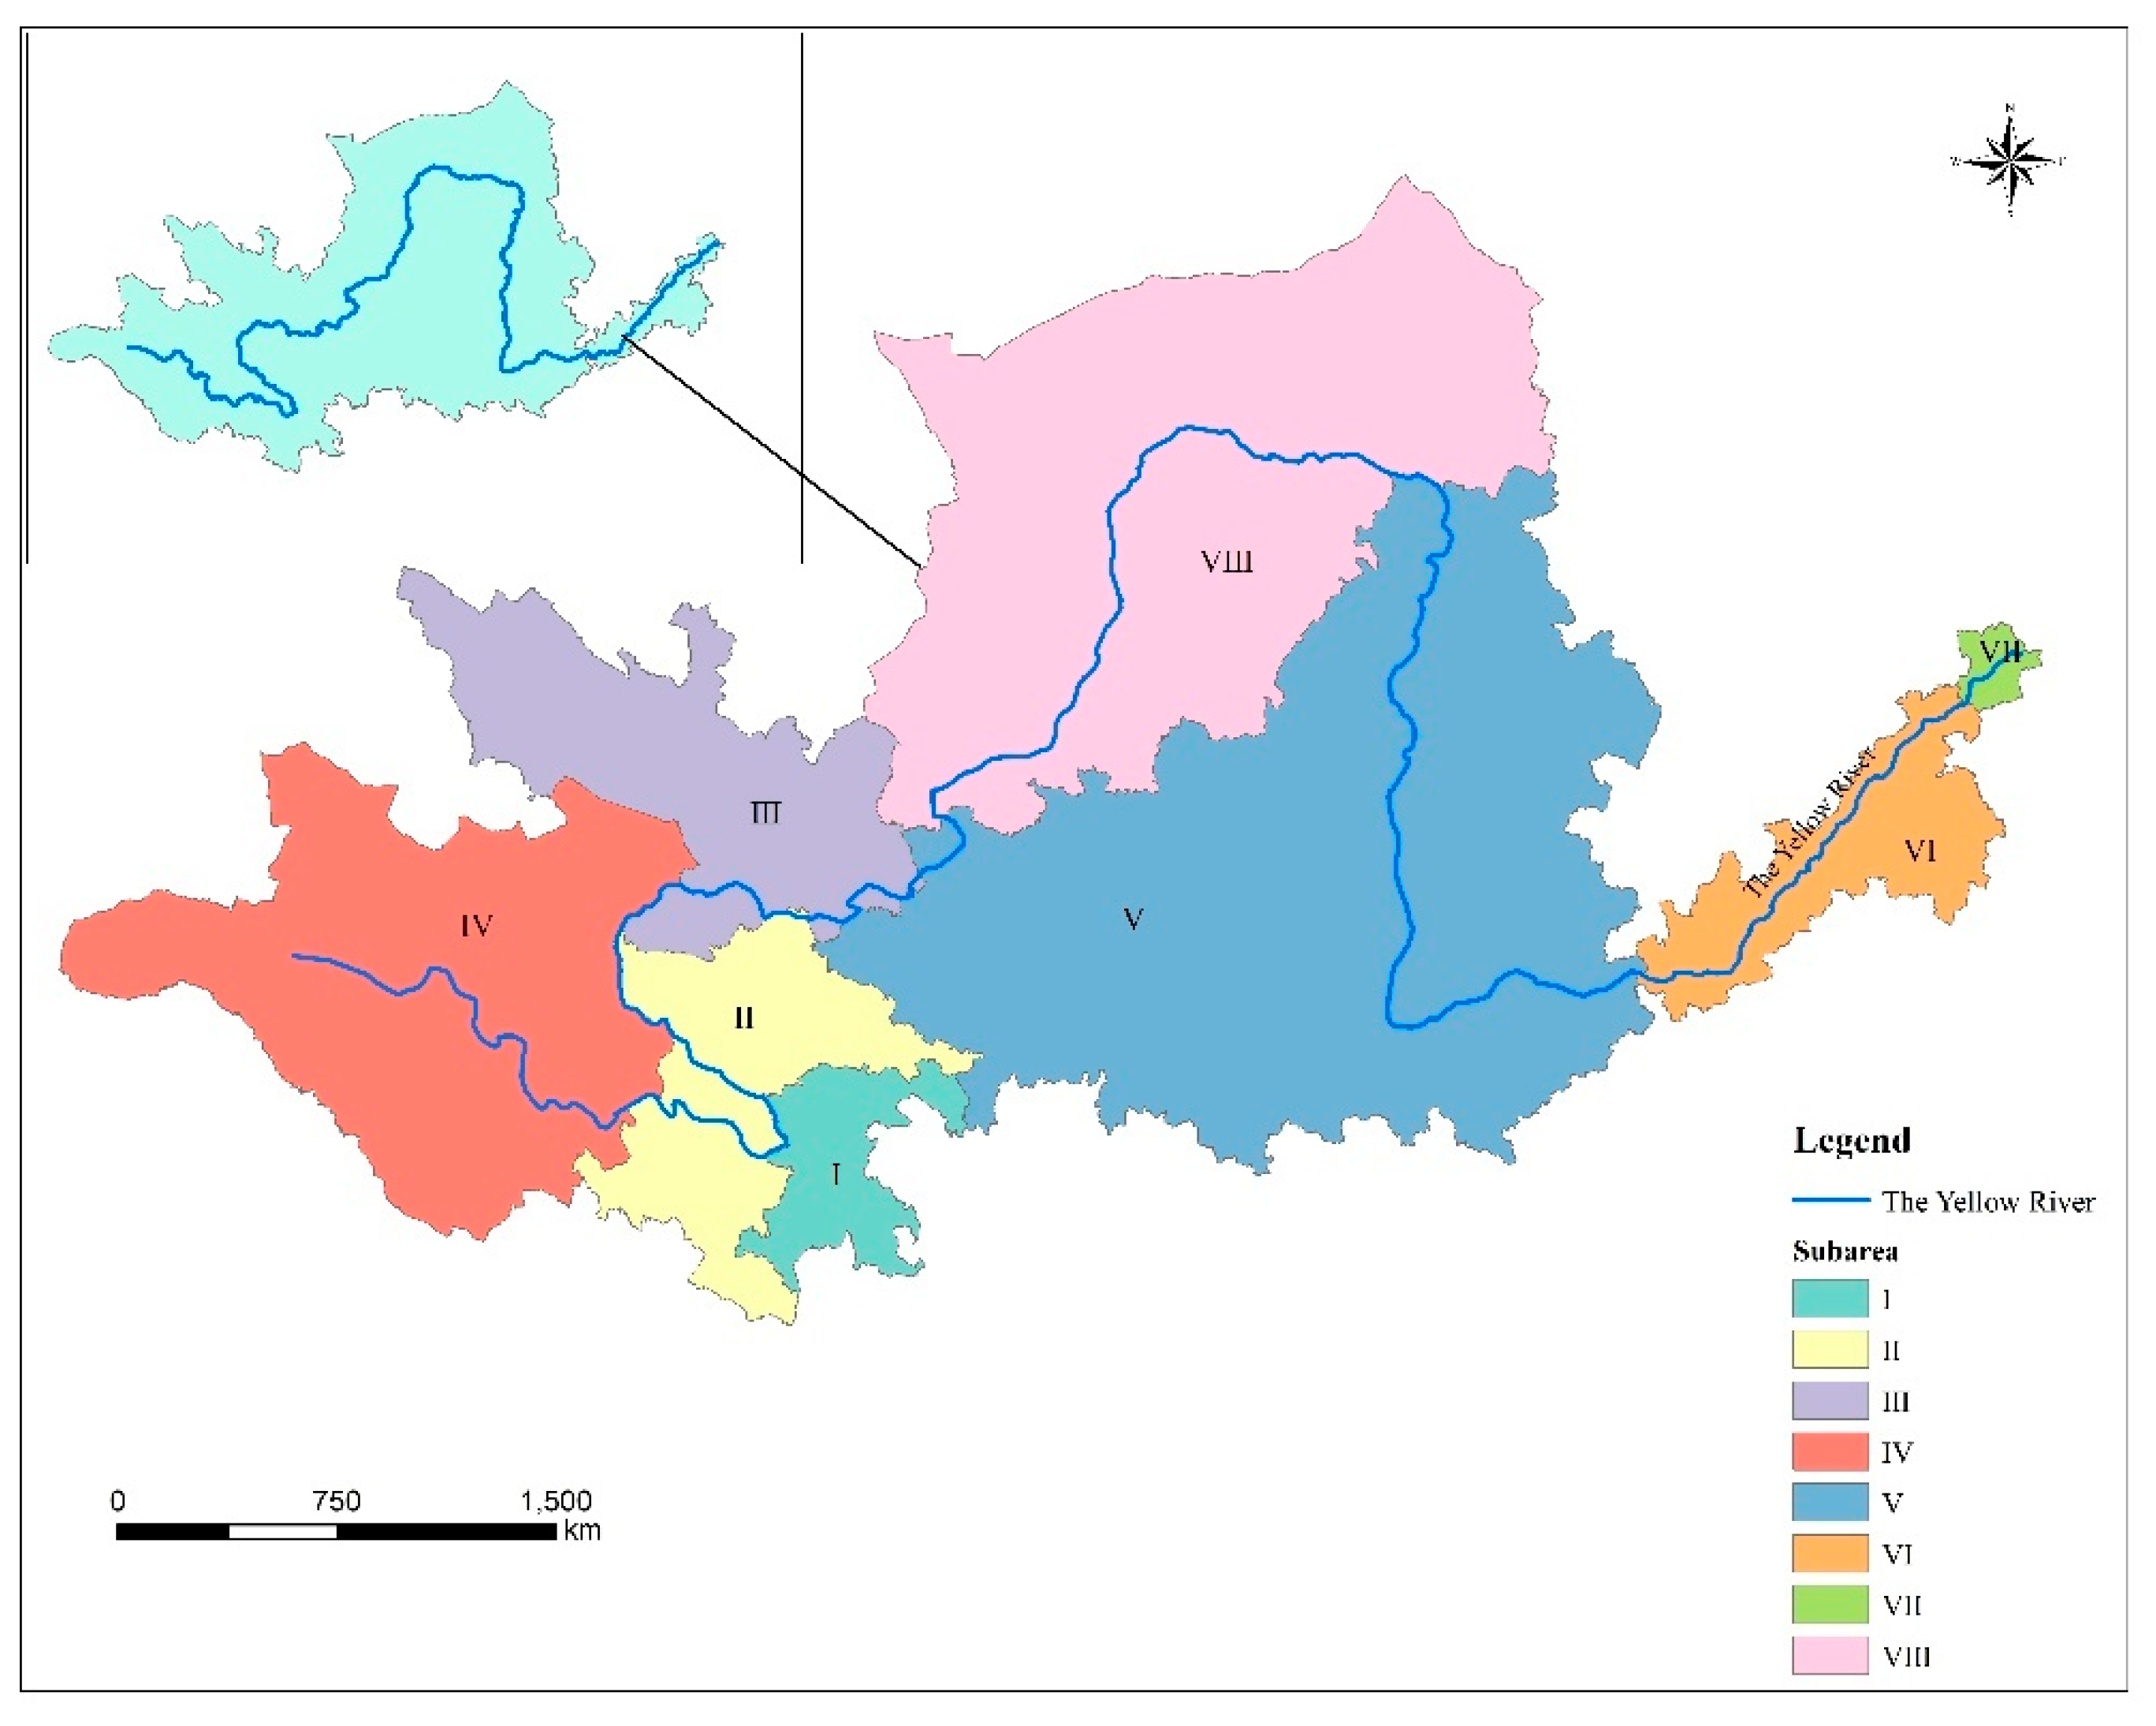
2.2.3. Physical Geographic Areas of the Yellow River Basin

Based on the vegetation classification system formulated by the national climate regionalization and Vegetation Map of the People’s Republic of China (1:1000,000,000), the Yellow River Basin is divided into eight physical geographic regions by referring to the annual average temperature and precipitation and soil regionalization data of China. The objective is to reflect the differences of vegetation types or sub-types made by hydro-thermal change due to horizontal or vertical variation in a certain vegetation area. We take it as the vegetation geographic basis for the vegetation suitability evaluation in each county in this paper. The technical framework for physical geographic area division is shown in Figure 3.
The eight physical geographical areas are as follows in Figure 4: (Ⅰ) sub-frigid semi-arid meadow steppe region in Qinghai Plateau; (Ⅱ) sub-frigid semi-humid scrub meadow region in Zoige Plateau uplands; (Ⅲ) temperate humid, sub-humid alpine deep valley coniferous forest regions in West Sichuan and East Tibet Plateau; (Ⅳ) coniferous forest and grassland regions in the temperate semi-arid alpine basin of Qilian Qingdong Plateau; (Ⅴ) warm temperate steppe, desert-grassland region in Yellow River loop and Ordos Plateau; (Ⅵ) warm temperate semi-arid grassland area in the northwest and semi-humid forest area in the southeast of the Loess Plateau; (Ⅶ) warm temperate humid and sub-humid forest region in the plain and mountain of lower Yellow River; and (Ⅷ) warm temperate sub-humid saline meadow area in the Yellow River Delta.

2.3. Methods

2.3.1. Multivariate Regression Analysis

In a simple linear regression (SLR) model, there is only one explanatory variable. When it comes to the correlation between one explained variables and multiple explanatory variables, a multiple linear regression model is usually established. Multiple linear regression is basically an extension of simple linear or ordinary least squares regression, which allows for several explanatory variables to depend on the mean function E(Y) [36]. The common representation of multiple linear regression is:
Y = β 0 + β 1 X 1 + β 2 X 2 + + β k X k + ε
where Y and X i   ( i = 1 , 2 , , k ) represent explained variables and explanatory variables, respectively. β i   ( i = 1 , 2 , , k ) are model parameters to be estimated and ε represents the random error term. In this paper, we attempt to explore how human social-economic activities affect the vegetation suitability of the Yellow River Basin and naturally take the vegetation suitability index of each county (district) as the explained variable. Explanatory variables are divided into three dimensions, summarizing human social and economic activities as comprehensively as possible. β 1 β k represents the partial regression coefficient, which means the average change of vegetation suitability caused by one unit increase or decrease of a certain activity when other independent variables remain unchanged.
Since the explained variable (vegetation suitability) in this paper is a percentage ranging from 0 to 100 (including 0 and 100), traditional linear estimation methods such as ordinary least squares (OLS) are not suitable for estimating such dependent variables [37]. Papke et al. (1996) suggest using the Fractional Logit model to deal with such situations [38]. After synthesizing and extending the generalized linear model (GLM) and the quasi-likelihood method, the Fractional Logit model can not only overcome the shortcomings of other traditional econometric models when the dependent variable is fraction, but also produce a better fit than the linear estimation. Therefore, we use the Fractional Logit method to estimate the model in this paper.

2.3.2. Variables of Influential Factors Analysis

First, we consider factors of the economic development. (I) Economic density, measured by GDP per unit area, reflects the efficiency of regional economic activities. The data are collected from China County Statistical Yearbook. (II) The proportion of output value of the primary industry in GDP. (III) The proportion of output value of the secondary industry in GDP. Factors (II) and (III) comprehensively reflect the structure of industrial development. Usually, developing the primary and secondary industries means more resource commitment, such as land, water and minerals, which may be accompanied by greater the damage to the local natural environment. (IV) The proportion of cultivated land, an indicator reflecting the status of land use. The data of land use come from China’s land-use status in 2018 released by the Data Center for Resources and Environmental Sciences, Chinese Academy of Sciences. (V) Effective irrigation ratio of cultivated land, reflecting the situation of water conservancy facilities and thus the stability of agricultural production. (VI) The amount of fertilizer applied per mu. The data of irrigated area and manuring amount are collected from statistical yearbooks of prefecture-level cities.
Secondly, we consider human living activities. (I) The proportion of construction land, which is the sum of urban built-up areas, rural residential areas, industrial areas, factories and mines, oil fields, transportation and other land areas, reflecting the land demand for production and living except agricultural production. The data source is the same as arable land. (II) Population density, that is the population per unit area. Greater population density means more human activities. (III) Urbanization ratio, measured by the proportion of resident population in urban areas in entire population, can reflect the trend of population concentration to urban areas. (IV) Per capita rural disposable income and (V) per capita urban disposable income are used to reflect the living standards of residents. (VI) Density of the road network, which refers to the operating length of the transportation facilities per unit of land, not only showing the accessibility of a place, but also indicating its regional advantages. (VII) The urban green coverage rate, which is an important index to reflect the status of ecological and environmental conservation. The above data are basically from statistical yearbooks of prefecture-level cities and statistical bulletin of economic and social development of county-level areas.
Finally, the policy intensity is important. During the early stage of economic development, the ecological environment in China was not protected, resulting in frequent natural disasters in the late 1990s. Since 2000, China has implemented a series of ecological restoration projects, including the “Natural Forest Protection”, “Turn Marginal Farmland to Forests and Grasslands”, “the Three-North Shelter Forest Program”, “the Control over the Sources of Sandstorms Affecting Beijing and Tianjin” and “Fast-Growing and High-Yield Plantation” [39]. These can be called the largest ecological engineering constructions in the world [40,41,42]. In terms of grassland protection, since 2011, incentive and subsidy policies for grassland ecological protection have been implemented in eight major grassland pastoral provinces (or autonomous regions), such as Inner Mongolia, Qinghai and Gansu. These policies benefit 639 counties and districts in China at present, covering an area of 320 million hm2 of grassland, accounting for over 80% of the national grassland areas [43]. Beyond that, China has also done a lot to protect wetland since the “13th Five-Year Plan”, including compensation and subsidies for wetland ecological benefits, reverting farmland to wetland, wetland protection and restoration subsidies and establishing nature reserves, with the overall protection rate of national wetlands reaching 52.65% until now [44]. These projects have played an important role in desertification control, water protection and biodiversity conservation [45,46]. Therefore, in this paper, whether there is participation in these ecological projects and to what extent are variables employed into the model in order to analyze the impact of policies on the vegetation suitability in the Yellow River Basin. Specifically, in the global regression, six variables were selected to characterize the influence of policy intensity on vegetation suitability: the number of key forestry ecological projects they participate, the proportion of afforested area in total forestland area, whether grassland ecological protection program has been implemented and to what extent, whether wetland ecological protection project has been implemented and the ratio of the area of natural reserve to the county area. The data are from China Forestry and Grassland Statistical Yearbook (2018) [47] and China Forestry Statistical Yearbook (from 2002 to 2017) [48]. The description of all variables is shown in Table 1.

2.4. Data

We construct a database of cross-sections on vegetation suitability and human social-economic activities in the Yellow River Basin in 2018 at the county-level scale for this study, which contains 448 county-level units divided into 282 counties, 128 municipal districts and 38 county-level cities. The social and economic data come from China’s Economic and Social Big Data Research Platform (EPS data platform), which integrates multiple database clusters such as industrial operation, regional economy, resources and environment, county and city data, humanities and social sciences and census data. The data on vegetation suitability are obtained through expert scoring method. A total of 357 experts engaged in forestry, ecology, protoculture science, soil and water conservation, desertification and other research, as well as administrative personnel in the industry, practitioners in forestry or grass industry at the primary-level and local inhabitants in the corresponding areas are invited to make their subjective evaluation of vegetation suitability.

3. Results and Discussion

3.1. Distribution of Vegetation Suitability in the Yellow River Basin

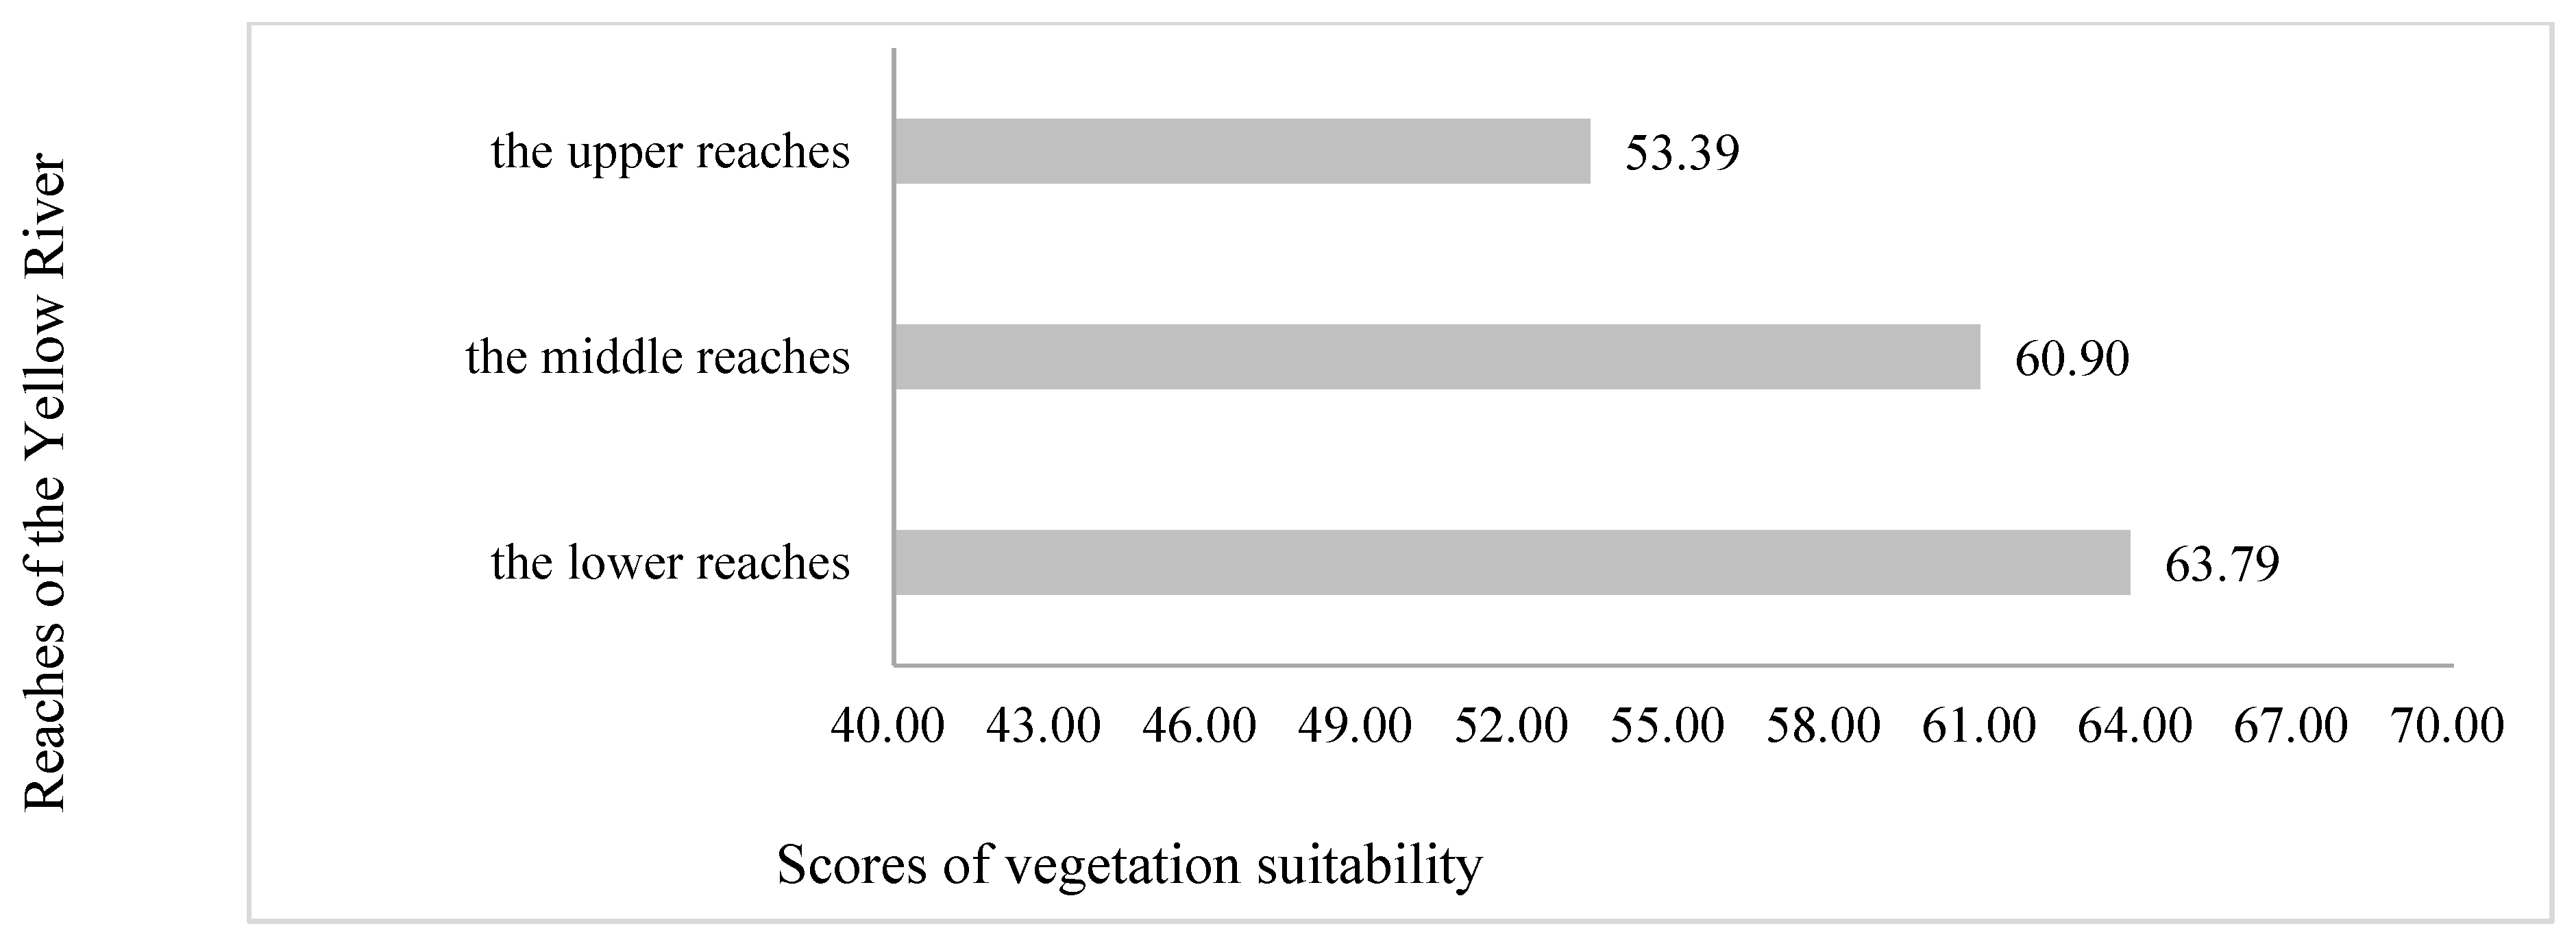
3.1.1. Vegetation Suitability Analysis of Different Reaches

Figure 5 shows that the vegetation suitability in the Yellow River Basin is generally poor, leaving extremely daunting tasks of ecological protection and restoration. Comparatively speaking, vegetation suitability in the upper reaches is the worst. That is likely because most upstream counties are located in the high, frigid, ecologically vulnerable region, where vegetation is more responsive to human activities. Once the ecological environment is destroyed, it takes a lot of effort to restore. The vegetation suitability in the downstream counties turns out to be the best of the three reaches at present, but the average score only hits 63.79. Wetland protection and ecological management should be promoted to improve the ecological function in the lower reaches, especially in the region near the mouth of the Yellow River.

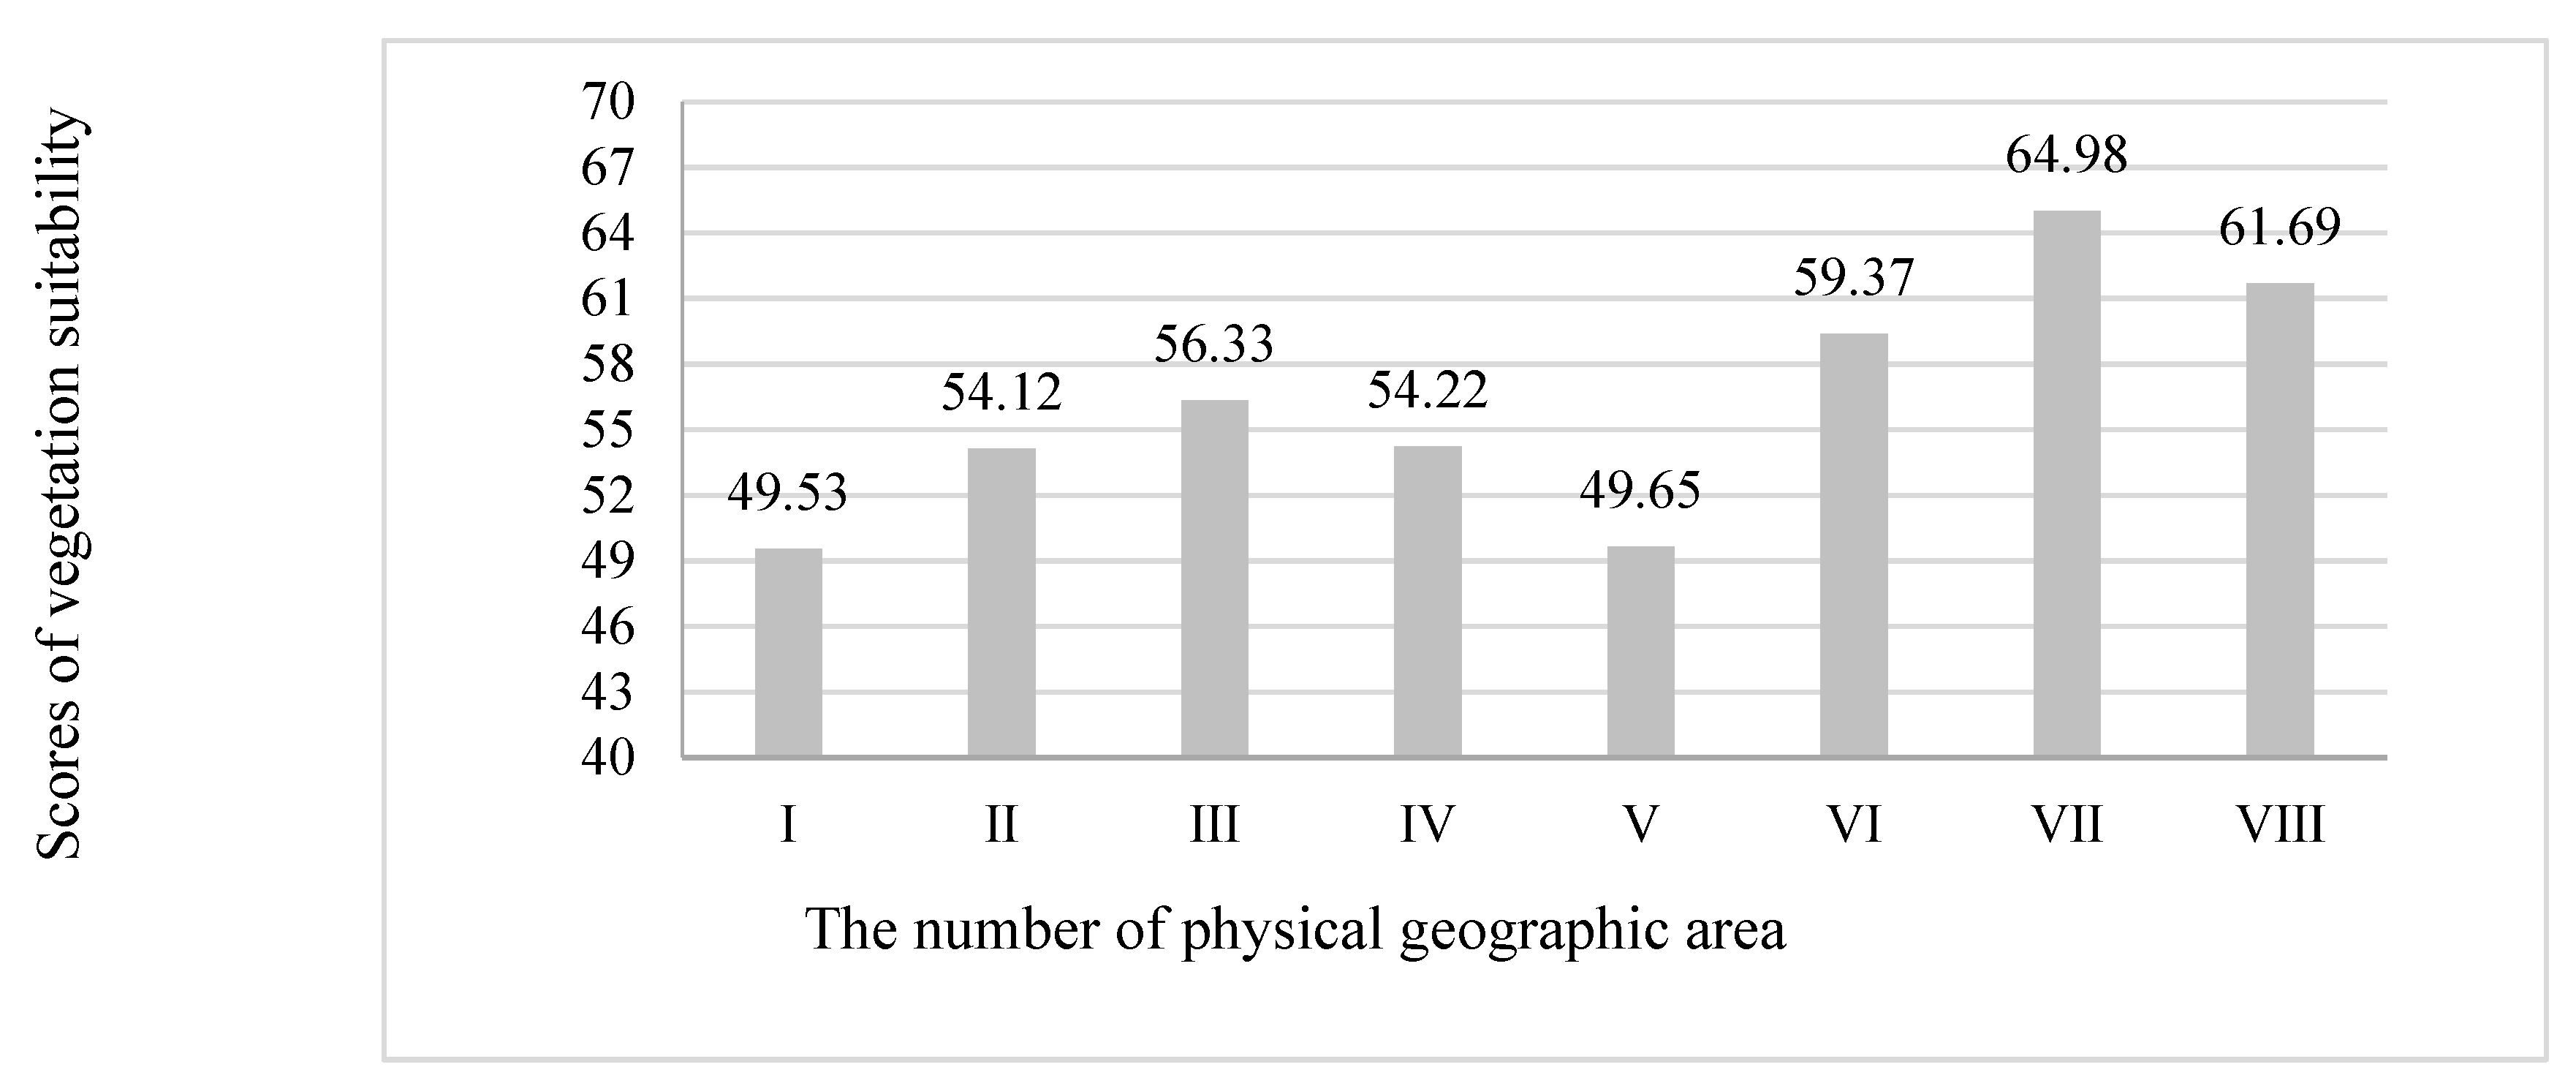
3.1.2. Vegetation Suitability Analysis of the Eight Physical Geographic Areas

As is shown in Figure 6., the vegetation suitability in warm temperate humid and sub-humid forest region in the plain and mountain of lower Yellow River is the best. In this area, forests and grass are mainly planted artificially. The vegetation suitability of warm temperate sub-humid saline meadow area in the Yellow River Delta is also relatively high, where the youngest wetland ecosystem in China is distributed. The scores for vegetation suitability sub-frigid semi-arid meadow steppe region in Qinghai Plateau and the warm temperate steppe, desert–grassland region in Yellow River loop and Ordos Plateau are 49.53 and 49.65, respectively. This is due to severe overgrazing in pastures there. According to statistics, the overloading of livestock in the upper reaches of the Yellow River during summer and autumn is 1.42 times, while it is 2.5 times during winter and spring, beyond the self-resilience of the ecosystem [49].

3.2. Results and Discussion of Influential Factors Analysis

Firstly, the impact of producing activities is discussed (according to the results shown in Table 2). The development of the primary and secondary industries has a remarkable negative impact on the vegetation suitability for the whole Yellow River Basin; that is to say, the vegetation suitability declines as these two industries advance, with industrial production in particular. Considering the reality that the economic development level of the upper, middle and lower reaches of the Yellow River varies greatly, we find in economically backward upstream counties, it is better to develop industry than to do nothing and leave the land idle. However, for the midstream counties, where the secondary industry buttresses the economic and social development, the economic density influences vegetation suitability negatively. Shanxi Province and Shaanxi Province are important energy centers as well as basic industrial bases in China, but due to the backward transformation and upgrading of traditional industries, too many resource-intensive industries are triggering serious environmental problems, such as soil pollution and air pollution, while competing with natural vegetation for water and land, and thus affecting the suitability of vegetation there. With the further development of economy, economic density shows a positive effect on the vegetation suitability, just as it does in counties of the lower reaches. This may give the credit to a faster upgrading of the industrial structure (the ratio of three industrial structures is 10:43:47), and the tertiary industry has become the focus of economic development. As we all know, compared with the first two industries, the tertiary industry is more environmentally friendly. Many previous studies have confirmed the noble correlation between agricultural production and vegetation coverage [50]; we further reveal the relation is positive in this paper, especially in the upper and lower reaches of the Yellow River. According to the 2019 Bulletin of the National Cultivated Land Quality Grade, the quality of arable land in Hetao Plain and Huang-Huai-Hai Plain, the two main producing areas of agricultural products along the Yellow River, is mainly classified as Grade 1 to Grade 3 with high soil fertility [51], which is quite suitable for cultivation. Overall, the ratio of effectively irrigated area and the intensity of fertilizer application have significant positive effects on the suitability of vegetation, which is verified in the middle reaches of the Yellow River. Considering that irrigation and fertilizer input is positively associated with output in most cases, farmers naturally increase the input of water and fertilizer in order to improve crop yield. Once water-saving irrigation technology and equipment are introduced in such areas with chronic water shortages as counties in the middle reaches of the Yellow River, not only does the irrigated area increase substantially, but so does the vegetation cover of cultivated land, which correspondingly helps to improve the vegetation suitability. The main problems that chronically trouble the upstream counties span desertification, water competition between crops and vegetation, overfertilizing and the overuse of pesticides and other non-point source pollution from agriculture; thus, the more irrigation water and fertilizer application used for agricultural production, the greater negative effect is on vegetation suitability.
Secondly, we analyze the effect of human daily living activities. The proportion of construction land in county area and road network density positively influence the vegetation suitability, while urbanization rate and per capita urban disposable income have negative impacts, as originally expected. The areas of construction and the road network density can witness the regional development level and location advantages. Generally speaking, areas with higher proportion of construction land are usually those developed earlier, and a place with the highest road network density is often regarded as the pivot of the region. In recent years, more attention has been paid to ecology, green practices and livability in China’s urban construction. The average urban green coverage rate of counties along the Yellow River has reached 36.57%, and the figure hits 39.77% in districts and county-level cities with higher urbanization rate. That provide sufficient evidence that highlighting ecological civilization construction can improve the suitability of local vegetation. With the acceleration of urbanization, the population gather faster to cities and towns. Then comes a higher demand for water supply, power supply, heat supply and others. Inevitably, more household garbage is generated, which affect the vegetation suitability through their damage to the soil, water and climate. In other words, the higher population urbanization rate partly means the poorer vegetation suitability. The increase in disposable income indicates the raise of people’s living standards, so that they can participate in more social-economic activities, which may have negative impacts on the vegetation suitability. However, these activities will not increase indefinitely. When the basic needs are fully met, people pay more attention to the quality of consumption rather than the quantity. If the requirements for ecological environment improve in human life, their positive effects on vegetation suitability will appear.
Finally, from the analysis of policy factors. From the results for the whole basin, participating in grassland and wetland ecological projects has significantly improved the vegetation suitability of the counties covered by related policies, and for grassland ecological protection, the more subsidies there are, the greater improvement of vegetation suitability is. This fully proves that the implementation of these ecological projects has achieved the desired goals in vegetation conservation and restoration. However, it is worth noting that the proportion of afforested area in total forestland area seems to have a significant negative effect on vegetation suitability in this study, which is not in line with our expectations. On the one hand, we should recognize that afforestation is one task but not the only of forestry ecological projects. For example, the core task of “Natural Forest Protection” is to protect the natural forest in key areas and allow the forest to recuperate. However, limited by the availability of data, there may be some inevitable bias of the results in this paper. On the other hand, major ecological protection and restoration projects of the Yellow River have been carried out one after another since the founding of PRC in 1949. At this late hour, areas with more new forests, grass and wetlands are precisely those with lower vegetation cover and weaker ecological foundations, which may be the root of their lower vegetation suitability.
When analyzing the impact on various reaches, we found sharp differences. Firstly, for counties in the upper reaches, Natural Forest Protection and Turn Marginal farmland to forests and grasslands are the most extensively launched projects that almost cover all the counties; they have actually improved the local vegetation suitability. By contrast, the vegetation suitability goes up in some degree after practicing grassland ecological protection, but the effect is not so good; even in certain areas, the more that forbidden grazing and forage livestock balance are in the areas, the worse vegetation suitability appears. More surprisingly, a significant negative correlation emerges when it comes to the impact of the Control over the Sources of Sandstorms Affecting Beijing and Tianjin program, the construction of shelter-belt system and wetland ecological protection. A possible reason is that grassland degeneration and desertification as well as wetland degradation caused by long-term overgrazing are the key and difficult points upstream governments must encounter; therefore, the policy mix should also be inclined to explore new patterns of sustainable grassland and wetland ecological restoration and productivity restoration. Secondly, for most of the counties along the middle reaches of the Yellow River, the Natural Forest Protection, Turn Marginal Farmland to Forests and Grasslands, the Control over the Sources of Sandstorms Affecting Beijing and Tianjin and the Three-North Shelter Forest Programs, as well as general wetland ecological protection are widely implemented. At first, we find a negative correlation between the vegetation suitability and implementing the Natural Forest Protection and the Control over the Sources of Sandstorms Affecting Beijing and Tianjin programs. Constructing shelter-belt forests has a positive effect on vegetation suitability but not very significant; meanwhile, carrying out wetland protection markedly increases the vegetation suitability. The ecological protection projects involved in the downstream districts or counties turn out to be returning farmland to forests and grassland, the fast-growing and high-yield forest construction and wetland ecological protection. From the perspective of improving the vegetation suitability, it makes most sense to promote returning farmland to forests and grasslands in Shandong, Henan and other traditional agricultural provinces. Practice has proven that planting fast-growing and high-yield forests not only expands the forest area, but also improves the vegetation suitability while bringing more benefits to farmers. It can be seen that the policy orientation of growing trees and grass in suitable areas is correct and quite effective.

3.3. Robust Test of Influential Factors

After the above analysis, we need to verify the robustness of these regression results. This paper divides the sample into two groups, using multivariate regression model estimated by Fractional Logit. The first group consists of 166 county-level cities and districts with higher economic development level, population density and urbanization rate; the second group includes the remaining 282 counties in the Yellow River Basin. The results are shown in columns 3–6 of Table 3. It can be seen that the effects of social-economic activities on vegetation suitability in both groups are basically consistent with the above analysis, which proves that the above analysis results have a certain degree of robustness and are credible.

4. Conclusions and Implications

4.1. Conclusions

This paper constructed an index system with three dimensions of production, people’s living and policy intensity to explore what human activities influence vegetation suitability and how they work. The findings demonstrated that the development of primary and secondary industry had a significant negative impact on vegetation suitability for the whole basin. The higher urbanization rate is, the greater the disturbance to vegetation suitability will be. The adoption of modern agriculture technology and equipment (water-saving irrigation technology, for instance) has not only improved the agricultural production conditions, but also elevated vegetation suitability. The social-economic factors affecting the vegetation suitability are of great difference among counties in the Yellow River Basin. The upstream counties are the most backward in economic development, excessive irrigation and fertilization are the main factors destructing the ecological environment and thus decreasing vegetation suitability here. As for midstream counties where economic development mainly depends on secondary industries and traditional energy, a higher economic density and urbanization rate make vegetation suitability lower. While in relatively developed counties in the lower reaches, economic advancement can help to improve vegetation suitability after economic restructuring and upgrading, overcrowding has exactly the opposite effect. The implementation of ecological projects plays a positive role in vegetation conservation and restoration. If a county in the upper or lower reaches participated in turning marginal farmland to forests and grasslands, the vegetation suitability there must be better than in counties that did not. The compensation award policy for grassland ecological protection executed in upstream pastoral areas has significantly improved the vegetation suitability, and the effect of policy strengthens as the subsidy increases. The same goes for constructing wetland nature reserves in the middle and lower reaches.

4.2. Implications

The environment is the foundation of economic development, while rational and orderly economic growth is an important support for strengthening environmental protection. The key to their symbiosis lies in improving the quality and efficiency of industrial development. We should vigorously promote environment-friendly industry and technology, innovate the mode of economy and industry alliance and realize the sustainable development of economy. Meanwhile, the vegetation suitability assessment in this paper was made in 2019 and regrettably we did not keep track of the latest data. Limited by this, we cannot delve into the dynamic change of human impacts on vegetation suitability and its trend. We hope that an ongoing regular investigation of vegetation suitability can be implemented, which may contribute to better design vegetation restoration programs and optimize the ecological protection policies.

Author Contributions

Q.W. is the key author and did most of the writing in this contribution. J.Z. gave review suggestions for the manuscript. X.Z. led the research, solidified the argument and gave review suggestions for the manuscript during the whole writing process. All authors have read and agreed to the published version of the manuscript.

Funding

This research was funded by the 14th Five-Year Plan Pioneering Project of High Technology Plan of the National Department of Technology under Grant “Carbon sink ascending techniques and potential in typical forest ecosystems”, grant number 2021YFD2200405.

Data Availability Statement

The data presented in this study are openly available at https://data.cnki.net; https://www.resdc.cn/Data.Search.aspx, accessed on 16 January 2023.

Acknowledgments

We are indebted to the anonymous reviewers and editor.

Conflicts of Interest

The authors declare no conflict of interest.

References

  1. Huang, C.; Ma, J.; Wei, D.; Zhang, L.; Zhang, Y.; Du, Y. History, Experience and Enlightenment of CPC’s Protection and High-quality Development of the Yellow River Basin. China Popul. Resour. Environ. 2022, 32, 1–9. [Google Scholar]
  2. Miao, C.; Zhang, B. Regulation Strategy of Zoning-Gradation-Classification for High-quality Development in the Yellow River Basin. Econ. Geogr. 2021, 41, 143–153. [Google Scholar]
  3. Zhang, W.; Wang, Y.; Li, J.; Hao, Z. Coupling Coordination Network Analysis of Ecological Protection and High-quality Economic Development in the Yellow River Basin. Ecol. Econ. 2022, 38, 179–189. [Google Scholar]
  4. Jin, F.; Ma, L.; Xu, D. Environmental Stress and Optimized Path of Industrial Development in the Yellow River Basin. Resour. Sci. 2020, 42, 127–136. [Google Scholar] [CrossRef]
  5. Fu, B.J.; Wang, S.; Liu, Y.; Liu, J.B.; Liang, W.; Miao, C.Y. Hydrogeomorphic Ecosystem Responses to Natural and Anthropogenic Changes in the Loess Plateau of China. Annu. Rev. Earth Planet. Sci. 2017, 45, 223–243. [Google Scholar] [CrossRef]
  6. Wei, X.D.; Wang, S.N.; Wang, Y.K. Spatial and Temporal Change of Fractional Vegetation Cover in North-western China from 2000 to 2010. Geol. J. 2018, 53, 427–434. [Google Scholar] [CrossRef] [Green Version]
  7. Alistair, W.R.; Macias, F.M.; Long, P.R.; Benz, D.; Willis, K.J. Sensitivity of Global Terrestrial Ecosystems to Climate Variability. Nature 2016, 531, 229–232. [Google Scholar]
  8. Jin, K.; Wang, F.; Han, J. Contribution of Climatic Change and Human Activities to Vegetation NAVI Change over China during 1982–2015. Acta Ecol. Sin. 2020, 75, 961–974. [Google Scholar]
  9. Militino, A.F.; Ugarte, M.D.; Perez-Goya, U. Stochastic Spatial-temporal Models for Analyzing NDVI Distribution of GIMMS NDVI3g Images. Remote Sens. 2017, 9, 76. [Google Scholar] [CrossRef] [Green Version]
  10. Eastman, J.R.; Sangermano, F.; Machado, E.A.; Rogan, J.; Anyamba, A. Global Trends in Seasonality of Normalized Difference Vegetation Index (NDVI), 1982–2011. Remote Sens. 2013, 5, 4799–4811. [Google Scholar] [CrossRef] [Green Version]
  11. Wang, F.; An, P.; Huang, C.; Zhang, Z.; Hao, J. Is Afforestation-induced Land Use Change the Main Contributor to Vegetation Dynamics in the Semiarid Region of North China? Ecol. Indic. 2018, 88, 282–291. [Google Scholar] [CrossRef]
  12. Fensholt, R.; Langanke, T.; Rasmussen, K.; Reenberg, A.; Prince, S.D.; Tucker, C.; Scholes, R.J.; Le, Q.B.; Bondeau, A.; Eastman, R.; et al. Greenness in Semi-arid Areas across the Globe 1981–2007—An Earth Observing Satellite Based Analysis of Trends and Drivers. Remote Sens. Environ. 2012, 121, 144–158. [Google Scholar] [CrossRef]
  13. Guo, J.; Hu, Y.; Xiong, Z.; Yan, X.; Bu, R. Spatiotemporal Variations of Growing-season NDVI Associated with Climate Change in Northeastern China’s Permafrost Zone. Pol. J. Environ. Stud. 2017, 26, 1521–1530. [Google Scholar] [CrossRef] [PubMed]
  14. Liu, X.; Ren, Z.; Lin, Z.; Liu, Y.; Zhang, D. The Spatial-temporal Changes of Vegetation Coverage in the Three-river Head-water Region in Recent 12 Years. Acta Ecol. Sin. 2013, 68, 897–908. [Google Scholar]
  15. Liu, B.; Sun, Y.; Wang, Z.; Zhao, T. Analysis of the Vegetation Cover Change and Relative Role of Its Influencing Factors in North China. J. Nat. Resour. 2015, 30, 12–23. [Google Scholar]
  16. Sun, R.; Chen, S.; Su, H. Spatial and temporal Variation of NDVI in Different Eco-types on the Loess Plateau and Its Response to Climate Change. Geogr. Res. 2020, 39, 1200–1214. [Google Scholar]
  17. Xu, Y.; Yang, J.; Chen, Y. NDVI-based Vegetation Responses to Climate Change in an Arid Area of China. Theor. Appl. Climatol. 2016, 126, 213–222. [Google Scholar] [CrossRef]
  18. Gao, J.; Jiao, K.; Wu, S. Investigating the Spatially Heterogeneous Relationships between Climate Factors and NDVI in China during 1982 to 2013. J. Geogr. Sci. 2019, 29, 1597–1609. [Google Scholar] [CrossRef]
  19. Ethar, H.; Abd El-Ghani, M.; Rim, H. Lamiaa, Shalabi. Do Anthropogenic Activities Affect Floristic Diversity and Vegetation Structure More Than Natural Soil Properties in Hyper-Arid Desert Environments? Diversity 2021, 4, 157. [Google Scholar]
  20. San Martín, C.; Alvarez, M. Floristic Composition of Anthropogenic Seasonal Wetlands in the Coastal Mountain Range of Cautin, Chile. Agro Sur. 2009, 37, 9–25. [Google Scholar] [CrossRef]
  21. Kota’nska, M.; Buziak-Chmielowiec, E.; Dabrowska, A.; Gladysz, M.; Jakielaszek, A.; Wójcik, T. Human Impact on the Plant Cover of Four Villages in SE Poland. Steciana 2015, 19, 115–121. [Google Scholar] [CrossRef]
  22. Abd El-Wahab, R.H. Plant Assemblage and Diversity Variation with Human Disturbances in Coastal Habitats of the Western Arabian Gulf. J. Arid. Land 2016, 8, 787–798. [Google Scholar] [CrossRef] [Green Version]
  23. Neji, M.; Serbaji, M.M.; Hardy, O.; Chaieb, M. Floristic Diversity and Vegetation Patterns along Disturbance Gradient in Arid Coasts in Southern Mediterranean: Case of the Gulf of Gabès, Southern Tunisia. Arid. Land Res. Manag. 2018, 32, 291–315. [Google Scholar] [CrossRef]
  24. Xin, B.; Xu, J.; Zheng, W. Influence of Climate Change and Human Activities on the Vegetation Coverage on the Loess Plateau. Sci. China 2007, 11, 1504–1514. [Google Scholar]
  25. Deng, C.; Bai, H.; Gao, S.; Liu, R.; Ma, X.; Huang, X.; Meng, Q. Spatial-temporal Variation of the Vegetation Coverage in Qinling Mountains and Its Dual Response to Climate Change and Human Activities. J. Nat. Resour. 2018, 33, 425–438. [Google Scholar]
  26. Yi, L.; Ren, Z.; Zhang, C.; Liu, W. Vegetation Coverage, Climate and Human Activities on the Loess Plateau. Resour. Sci. 2014, 36, 166–174. [Google Scholar]
  27. Zhao, W.; Li, J.; Chu, L.; Wang, T.; Li, Z.; Cai, C. Analysis of Spatial and Temporal Variations in Vegetation Index and Its Driving Force in Hubei Province in the Last 10 Years. Acta Ecol. Sin. 2019, 39, 7722–7736. [Google Scholar]
  28. Wang, J.; Zhao, J.; Li, C.; Zhu, Y.; Kang, C.; Gao, C. The Spatial-temporal Patterns of the Impact of Human Activities on Vegetation Coverage in China from 2001 to 2015. J. Geogr. Sci. 2019, 74, 504–519. [Google Scholar]
  29. Wu, Y.; Ma, Y.; Wu, H.; Xiao, Y.; Li, H. Characteristics of Temporal and Spatial Evolution and Driving Forces of Vegetation Index in Sichuan Based on MODIS-EVI. Res. Soil Water Conserv. 2020, 27, 230–236. [Google Scholar]
  30. Wang, Y.; Wang, S. China Has Returned More than 500 Million Acres of Cultivated Land to Grassland Over the Past 20 Years. J. Cent. South Univ. For. Technol. 2019, 39, 2. [Google Scholar]
  31. Lu, D.; Sun, D. Development and Management Tasks of the Yellow River Basin: A Preliminary Understanding and Suggestion. Acta Ecol. Sin. 2019, 12, 2431–2436. [Google Scholar]
  32. Zhou, G.; Zhou, L.; Ji, Y.; Lv, X.; Zhou, M. Basin Integrity and Temporal-spatial Connectivity of the Water Ecological Carrying Capacity of the Yellow River. Sci. Bull. 2021, 22, 2785–2792. [Google Scholar] [CrossRef]
  33. Wang, X.; Shi, S.; Chen, J. Fractional Vegetation Cover Change and Its Driving Factors in the Yellow River Basin. China Environ. Sci. 2023, 1, 1–15. [Google Scholar]
  34. Fan, J.; Wang, Y.; Wang, Y. High Quality Regional Development Research Based on Geographical Units: Discuss on the Difference in Development Conditions and Priorities of the Yellow River Basin Compared to the Yangtze River Basin. Econ. Geogr. 2020, 1, 1–11. [Google Scholar]
  35. Zhao, X.; Cui, F.; Zhang, N.; Chen, X. Discussions on the Division of the Main Stream of the Yellow River. Tech. Superv. Water Resour. 2018, 4, 69–72+114. [Google Scholar]
  36. Eslamian, S.A.; Li, S.; Haghighat, F. A New Multiple Regression Model for Predictions of Urban Water Use. Sustain. Cities Soc. 2016, 27, 419–429. [Google Scholar] [CrossRef]
  37. Chegere, M.J. Post-harvest Losses Reduction by Small-scale Maize Farmers: The Role of Handling Practices. Food Policy 2018, 77, 103–115. [Google Scholar] [CrossRef]
  38. Papke, L.E.; Wooldridge, J.M. Econometric Methods for Fractional Response Variables with an Application to 401K Plan Participation Rates. J. Appl. Econom. 1996, 116, 619–632. [Google Scholar] [CrossRef]
  39. Dai, L.; Li, S.; Zhou, W.; Qi, L.; Zhou, L.; Wei, Y.; Li, J.; Shao, G.; Yu, D. Opportunities and Challenges for the Protection and Ecological Functions Promotion of Natural Forests in China. For. Ecol. Manag. 2018, 410, 187–192. [Google Scholar] [CrossRef]
  40. Li, W.; Chen, J.; Zhang, Z. Forest Quality-based Assessment of the Returning Farmland to Forest Program at the Community Level in SW China. For. Ecol. Manag. 2020, 461, 117938. [Google Scholar] [CrossRef]
  41. Huang, C. On the Development of Ecological Civilization under the Leadership of the CPC over the 70 Years since the Founding of the People’s Republic of China. Lit. Chin. Communist Party 2019, 5, 49–56. [Google Scholar]
  42. Chen, W. The Ministry of Finance Launched a New Round of Subsidies and Incentives for Grassland Ecology. In China Financial News; 31 March 2016; p. 8. Available online: http://www.gov.cn/xinwen/2016-04/02/content_5060811.htm (accessed on 23 December 2022).
  43. Mi, C. China Has Achieved Remarkable Results in the Ecological Protection of Wetland. Ecol. Econ. 2022, 38, 9–12. [Google Scholar]
  44. Kong, R.; Zhang, Z.; Zhang, F.; Tian, J.; Chang, J.; Jiang, S.; Zhu, B.; Chen, X. Increasing Carbon Storage in Subtropical Forests over the Yangtze River Basin and Its Relations to the Major Ecological Projects. Sci. Total Environ. 2020, 709, 136163. [Google Scholar] [CrossRef] [PubMed]
  45. Londe, V.; Turini Farah, F.; Ribeiro Rodrigues, R.; Roberto Martins, F. Reference and Comparison Values for Ecological Indicators in Assessing Restoration Areas in the Atlantic Forest. Ecol. Indic. 2020, 110, 105928. [Google Scholar] [CrossRef]
  46. Yu, X.; Jia, G. The Core Task is to Protect and Govern. Land Today 2021, 4, 15–16. [Google Scholar]
  47. National Forestry and Grassland Administration. China Forestry and Grassland Statistical Yearbook; China Forestry Publishing House: Beijing, China, 2018.
  48. National Forestry and Grassland Administration. China Forestry Statistical Yearbook; China Forestry Publishing House: Beijing, China, 2002–2017.
  49. Zhang, J.; Cheng, P.; Zhang, R.; Yan, M.; Ren, H. Influence of Human Activities on Vegetation Cover Variations on Shanxi Plateau. J. Northwest Norm. Univ. 2016, 6, 118–124. [Google Scholar]
  50. Sun, Y.; Yi, L.; Yin, S. Vegetation Cover Change in Dongting Lake Basin and Its Coordination Governance. Econ. Geogr. 2022, 4, 190–201. [Google Scholar]
  51. Ministry of Agriculture and Rural Affairs of the People’s Republic of China. Bulletin of the Quality Grade of China’s Cultivated Land in 2019. [EB/OL] (2020-05-06). Available online: www.moa.gov.cn (accessed on 14 January 2023).
Figure 1. Location of the Yellow River Basin in China.
Forests 14 00234 g001
Figure 2. The Yellow River Basin divided by segment characteristics.
Forests 14 00234 g002
Figure 3. Technical framework for physical geographic area division.
Forests 14 00234 g003
Figure 4. The Yellow River Basin divided by physical geographic areas.
Forests 14 00234 g004
Figure 5. Vegetation suitability index of different reaches.
Forests 14 00234 g005
Figure 6. Vegetation suitability of each physical geographic area.
Forests 14 00234 g006
Table 1. Variables’ description and data source.
Classification of VariablesMeaning of VariablesSource of DataExpected Result
Explained Variable
FSGSForest–Shrub–Grass Suitability/100Expert Scoring Method
Explanatory Variables
Production activitiesEcothe ratio of gross regional domestic product to county area (100 million yuan per square kilometers)China County Statistical Yearbook -
Agrithe ratio of the value added of primary industry to gross regional domestic product (%)-
Industhe ratio of the value added of secondary industry to gross regional domestic product (%)-
Frmlndthe ratio of cultivated area to county area (%)Data Center for Resources and Environment Sciences of Chinese Academy of Sciences-
Irrithe ratio of irrigated area to cultivated area (%)Statistical yearbooks of prefecture-level cities+
Fertthe amount of fertilization (kilograms per mu)To be estimated
Daily living activitiesConstthe ratio of construction land area to county area (%)Data Center for Resources and Environment Sciences of Chinese Academy of Sciences-
Poputhe ratio of resident population to county area (one thousand per square kilometers)Statistical yearbooks of prefecture-level cities;
Statistical bulletin of economic and social development of county-level
-
Urbniurbanization ratio of resident population (%)-
Incom1per capita rural disposable income (ten thousand yuan)To be estimated
Incom2per capita urban disposable income (ten thousand yuan)To be estimated
Roadthe ratio of road mileage to county area (one kilometer per square kilometers)To be estimated
Greenithe ratio of urban green coverage to construction land area (%)+
PoliciesNfpWhether natural forest protection project has been implemented: Yes = 1, No = 0⟪China Forestry and Grassland Statistical Yearbook⟫ (2018) [47];
⟪China Forestry Statistical Yearbook⟫ (2002 to 2017) [48]
+
RftfWhether return farmland to forests or grassland has been implemented: Yes = 1, No = 0+
CssWhether the control over the sources of sandstorms affecting Beijing and Tianjin has been implemented: Yes = 1, No = 0+
ThsWhether the three-north shelter forest program has been implemented: Yes = 1, No = 0+
Rgaywhether fast-growing and high-yield plantation has been implemented: Yes = 1, No = 0+
Afforthe ratio of afforestation area through key ecological projects to forestland area (%)+
Wetlwhether wetland conservation or restoration projects have been implemented: Yes = 1, No = 0+
Naresvthe ratio of the area of natural reserve within the county to the county area (%)+
Graslewhether the incentive and subsidy policies for grassland ecological protection have been implemented: Yes = 1, No = 0Official websites of Forestry Bureau of prefecture-level cities+
Subsidythe amount of subsidy (yuan per mu)+
Table 2. Estimation results of the fractional logit regression model.
Classification of VariablesName of Each VariableThe Whole YR BasinUpper Yellow RiverMiddle Yellow RiverLower Yellow River
CoefficientZ-ValueCoefficientZ-ValueCoefficientZ-ValueCoefficientZ-Value
Production activitiesEco−0.014 −1.280.007 0.31−0.023 ** −2.190.04 *** 4.07
Agri−0.002 ** −2.00−0.001 −1.46−0.001 −0.500.0002 0.07
Indus−0.001 *** −3.32−0.0003 −0.65−0.001 −1.57−0.001 −0.76
Frmlnd0.002 *** 4.030.004 *** 4.630.0003 0.400.003 * 1.86
Irri0.002 *** 2.99−0.003 *** −2.820.003 ***4.110.0005 0.31
Fert0.0004 ** 2.52−0.001 ** −2.470.000 ** 2.12−0.0004 −0.35
Daily living activitiesConst0.01 *** 5.300.001 0.630.003 ** 2.470.004 1.35
Popu0.02 1.120.04 1.360.021 1.52−0.04 * −1.72
Urbni−0.002 *** −3.320.001 1.02−0.002 *** −2.620.001 0.4
Incom1−0.003 −0.19−0.03 −1.480.008 0.36−0.01 −0.52
Incom2−0.04 ** −2.56−0.04 *** −2.730.055 ** 2.13−0.02 −0.55
Road0.02 ** 2.05−0.01 −0.320.021 ** 2.51−0.001 −0.08
Greeni0.0004 0.49−0.001 −0.98−0.0001 −0.120.003 1.15
PoliciesNfp0.13 * 1.72−0.132 *** −3.89
Rftf0.12 ** 2.55−0.012 −0.140.14 *** 2.95
Css−0.12 *** −5.69−0.245 *** −11.87
Ths−0.07 * −1.760.047 1.33
Rgay0.18 *** 2.95
Number−0.02 −1.17
Affor−0.001 *** −3.99−0.0002 −0.660.001 1.43−0.0003 −1.15
Grasle0.14 *** 3.880.02 0.69
Area----−0.0001 *−1.96
Subsidy0.001 *** 3.930.0003 1.24
Wetl0.04 * 1.66−0.03 ** −2.060.07 *** 3.620.01 0.47
Naresv0.0002 0.49−0.0001 −0.110.0002 0.330.001 1.55
Region dummy variablesUpper−0.37 *** −10.25
Middle0.04 * 1.77
Constant term0.58 *** 8.650.14 1.580.34 ***2.690.08 0.34
Sample size48816821961
Note: * is p < 0.1; ** is p < 0.05; *** is p < 0.01.
Table 3. Results of robustness test.
Classification of VariablesName of Each VariableCoefficientZ-ValueCoefficientZ-Value
Production activitiesEco−0.02 *−1.92−0.039 −0.26
Agri0.0010.46−0.002 * −1.89
Indus−0.001−1.2−0.002 *** −3.07
Frmlnd0.002 ** 2.280.001 * 1.7
Irri0.002 ** 2.42−0.0004 −0.53
Fert0.0003 0.640.0005 *** 3.23
Daily living activitiesConst0.004 *** 3.590.005 1.43
Popu0.03 * 1.820.389 *** 3.04
Urbni−0.001 −1.54−0.001 ** −2.03
Incom10.014 0.96−0.072 * −1.78
Incom2−0.06 *** −2.590.004 0.21
Road0.02 ** 2.2−0.006 −0.4
Greeni0.003 1.64−0.001 −0.63
PoliciesNumber−0.07 ** −2.460.024 1.08
Affor−0.002 *** −3.74−0.001 ** −2.43
Grasle0.16 *** 2.650.066 * 1.9
Subsidy0.002 *** 2.920.001 *** 3.05
Wetl0.11 *** 2.99−0.014 −0.52
Naresv0.0002 0.480.001 1.42
Region dummy variablesUpper−0.28 *** −5.23−0.375 *** −6.25
Middle0.114 *** 2.79−0.020 −0.61
Constant termConstant0.620 *** 4.380.472 *** 6.19
Sample size166282
Note: * is p < 0.1; ** is p < 0.05; *** is p < 0.01. Generally, the results are kept to two decimal places. When the result data are too small, 3–4 decimal places are retained. The same as below.
Disclaimer/Publisher’s Note: The statements, opinions and data contained in all publications are solely those of the individual author(s) and contributor(s) and not of MDPI and/or the editor(s). MDPI and/or the editor(s) disclaim responsibility for any injury to people or property resulting from any ideas, methods, instructions or products referred to in the content.

