Article

The Differences in Water Repellency in Root Mat (Biomat) and Soil Horizons of Thinned and Non-thinned Chamaecyparis obtusa (Siebold et Zucc.) Endl. Plantations

1
Ecohydrology Research Institute, The University of Tokyo Forests, Graduate School of Agriculture and Life Sciences, University of Tokyo, Aichi 489-0031, Japan
2
Faculty of Regional Environment Science, Tokyo University of Agriculture, Tokyo 156-8502, Japan
3
Executive Office, The University of Tokyo Forests, Graduate School of Agricultural and Life Sciences, The University of Tokyo, Tokyo 113-8657, Japan
4
Toyota Yahagi River Institute, Aichi 471-0025, Japan
*
Author to whom correspondence should be addressed.
Forests 2023, 14(2), 210; https://doi.org/10.3390/f14020210
Submission received: 23 December 2022 / Revised: 17 January 2023 / Accepted: 18 January 2023 / Published: 21 January 2023

Abstract

:
Water repellency (WR) is one cause of root mat (biomat) flow and soil surface runoff in dense Chamaecyparis obutsa (Siebold et Zucc.) Endl. plantations. However, the changes in WR of biomat and soil horizons are unclear in the thinned C. obtusa plantations. This study compares the WR of biomat and soil horizons in the thinned and non-thinned C. obtusa plantations by considering the water content and surface temperature of biomat and soil from July 2021 to June 2022. We selected one plot in each thinned and non-thinned area in a catchment at Obora Experimental Forest in Japan. Our results showed that the 40% thinned plot lacked a biomat horizon, whereas the non-thinned plot had a ca. 3 cm depth of biomat. The biomat WR of the non-thinned plot (none to very strong) was higher than the soil WR of the thinned plot (none to strong). There was no relationship between WR and both water content and surface temperature of biomat and/or soil in either thinned or non-thinned plots. Our findings show that the biomat horizon had an essential role in the severity of WR in C. obtusa plantations. The lack of biomat after thinning could substantially impact soil surface hydrology.

1. Introduction

Forest ecosystems have complex ecohydrology processes driven by various environmental and anthropogenic variables [1], such as forest operation [2]. Water repellency (WR) in the decomposed organic and surface soil layers causes low infiltration and direct runoff in the slope areas [3,4]. Soil WR originates from water repellent organic matter with a lower affinity with water [5,6]. WR exists in all types of landscapes, from agricultural areas [7,8] and grasslands [9] to forest areas [2,10], and is considered an essential factor in ecohydrological modeling [10]. Although wildfire is one phenomenon that induces the WR of mineral soil, WR also occurs naturally where soil organic matter composition changes from a wettable phase to a water repellent phase in the process of decomposition [1,11,12,13].
Chamaecyparis obtusa ((Siebold & Zucc.) Endl.; Hinoki cypress) is one of the most prevalent conifers in Japan and has been widely planted for timber products [14]. In Japan, this species accounts for 25% of all plantation areas (ca. 10 million ha; [15]). In Chamaecyparis obtusa (C. obtusa) plantations, severe WR repellency has been observed in Japan [16,17,18]. These plantations are also well-known for high direct runoff because of low ground cover and high WR [19,20]. WR usually occurs in upper soil horizons of forest areas. The upper soil horizons in forest areas consist of an organic (O) and topsoil (A) horizons. The O horizon divides into litter (L), fragmented litter (F), and humus (H) layers. The forest floor in dense C. obtusa plantations consists of a sparse understory and a very thin L layer [16,20]. Below the L layer of C. obtusa plantations, the F and H layers consist of a dense network of fine roots with a diameter of less than 2 mm [16,21]. In some studies, these LFH layers were called biomat [21,22]. Studies show the importance of biomat in water movement during the rain on the slope [21,22]. However, little is known about the WR of the biomat horizon in C. obtusa plantations.
In silviculture and forest management, thinning refers to the selective removal of trees to improve the remaining trees’ health or growth rate [23] and develop understory vegetation [24]. Implemented selectively or systematically, thinning can be designed in different intensities and with different purposes [25]. In response to climate change, the thinning of forest stands has been used to mitigate the impacts of droughts on remaining trees [26]. Removing trees through thinning reduces the leaf area index (LAI) and canopy interception loss and increases the amount of solar energy reaching the forest floor [27]. Therefore, it has a significant impact on most ecohydrological processes, such as rainfall partitioning [28], soil water redistribution [29], transpiration [30], evapotranspiration [31], and water yield [32]. In addition, thinning is a practical forest operation in the dense C. obtusa plantations to reduce direct runoff and increase water infiltration into the soil in Japan [33,34]. Increasing direct runoff after several years of thinning was also observed in the thinned C. obtusa plantations [35,36]. The studies suggested that lack of understory development and remaining WR in the soil could return direct runoff to the level before thinning periods [35,36]. However, little is known about the differences between WR in biomat and soil horizons of thinned and non-thinned C. obtusa plantations.
Water content is an essential factor impacting the WR of porous media such as biomat and mineral soil horizons in forest areas [8,37]. By increasing water content to a critical threshold, WR disappears, whereas by decreasing water content below that critical threshold, WR reappears [38,39,40,41]. The surface temperature of biomat and mineral soil horizons is another essential factor impacting both WR and water content (i.e., by evaporation) [9,13]. In general, after a prolonged dry period, the intensity of WR increases because of reduced moisture [13]. Conversely, a prolonged dry period during hot seasons could enhance WR because of higher air temperatures [9]. Studies show that soil water content and temperature altered after thinning [42,43,44]. However, how these changes could impact the WR of biomat and soil horizons in the thinned C. obtusa is unclear.
The main objective of this study is to recognize the differences in the WR of biomat and soil horizons in the thinned and non-thinned C. obutsa plantations. We considered water content and surface temperature as factors that could explain the differences of WR in biomat and soil horizons in the thinned and non-thinned C. obtusa plantations. The second objective of this study is to find the potential impact of biomat and soil WR on surface runoff in the thinned and non-thinned C. obtusa plantations.

2. Materials and Methods
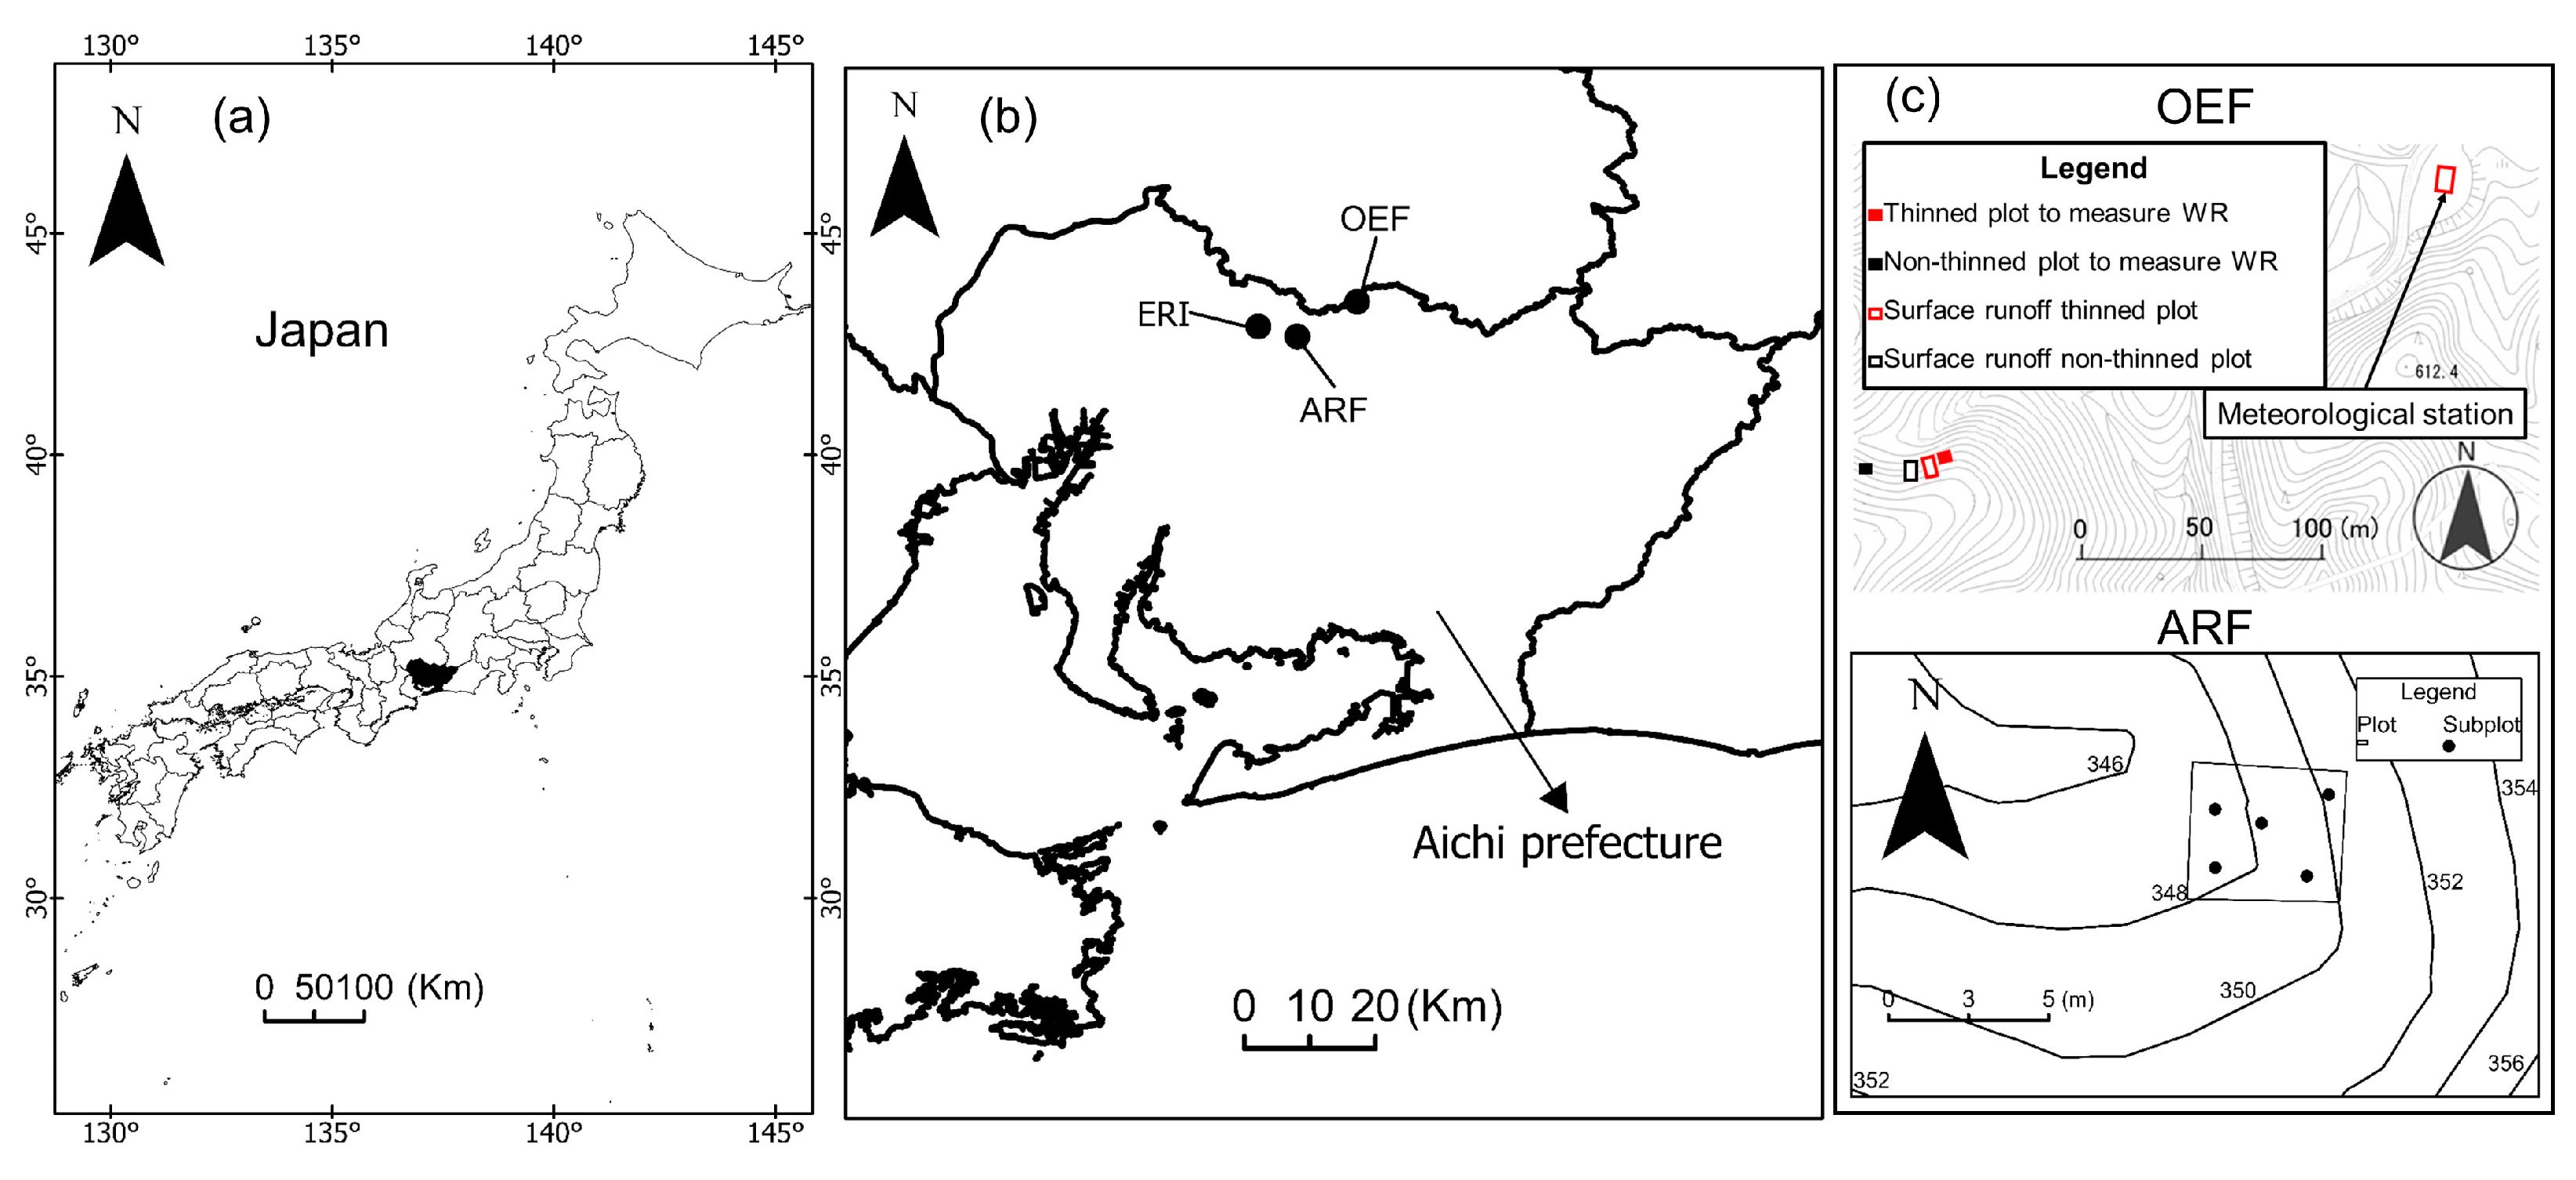
2.1. Study Site

We selected two study sites for this study (Figure 1a,b). These are the Akazu Research Forest (ARF, 35°13ʹ N, 137°10ʹ E; 340 m a.s.l.), which belongs to the University of Tokyo Forests and is located nearby the Ecohydrology Research Institute (ERI) headquarters, and Obora Experimental Forest (OEF, 35°16ʹ N, 137°15ʹ E; 585 m a.s.l.), which belongs to the Toyota City Hall (Figure 1b,c). One small Chamaecyparis obtusa (C. obtusa) catchment (ARF: 0.44 ha and OEF: 1.45 ha) was selected in each site (in total, two catchments). Both studied sites were in central Japan (Figure 1a) and have very hot and humid summers and moderate cold winters [45]. The climate class of the region (i.e., studied sites) is warm temperate, and fully humid with hot summers (Cfa) according to the Köppen–Geiger climate classification [46]. The mean annual precipitation is 1470 mm, and the mean annual temperature is 15.3 °C (1991–2020) [47]. Japan has two distinct rainy seasons: May–June (the Baiu season) with frequent and prolonged rainfall events and September–October (typhoon season) with high-intensity rainfall, whereas periodical rain occurs all year around.
The selected C. obtusa plantations were established in 1990 (ARF) and 1989 (OEF). No thinning was operated at the ARF, whereas some parts of OEF were under a 40% thinning, in terms of stand density (tree/ha), in early 2019. This study was conducted between 1 July 2021, to 30 June 2022. The studied sites’ geology is the Mesozoic late cretaceous layer with granite bedrock [48]. The soil type is brown forest soil [49], equivalent to cambisol [50]. The forest floor has a low understory (mainly Cleyera japonica) and a fragile litter cover (less than 1 cm). Detailed information regarding studied sites and plots is summarized in Table 1.

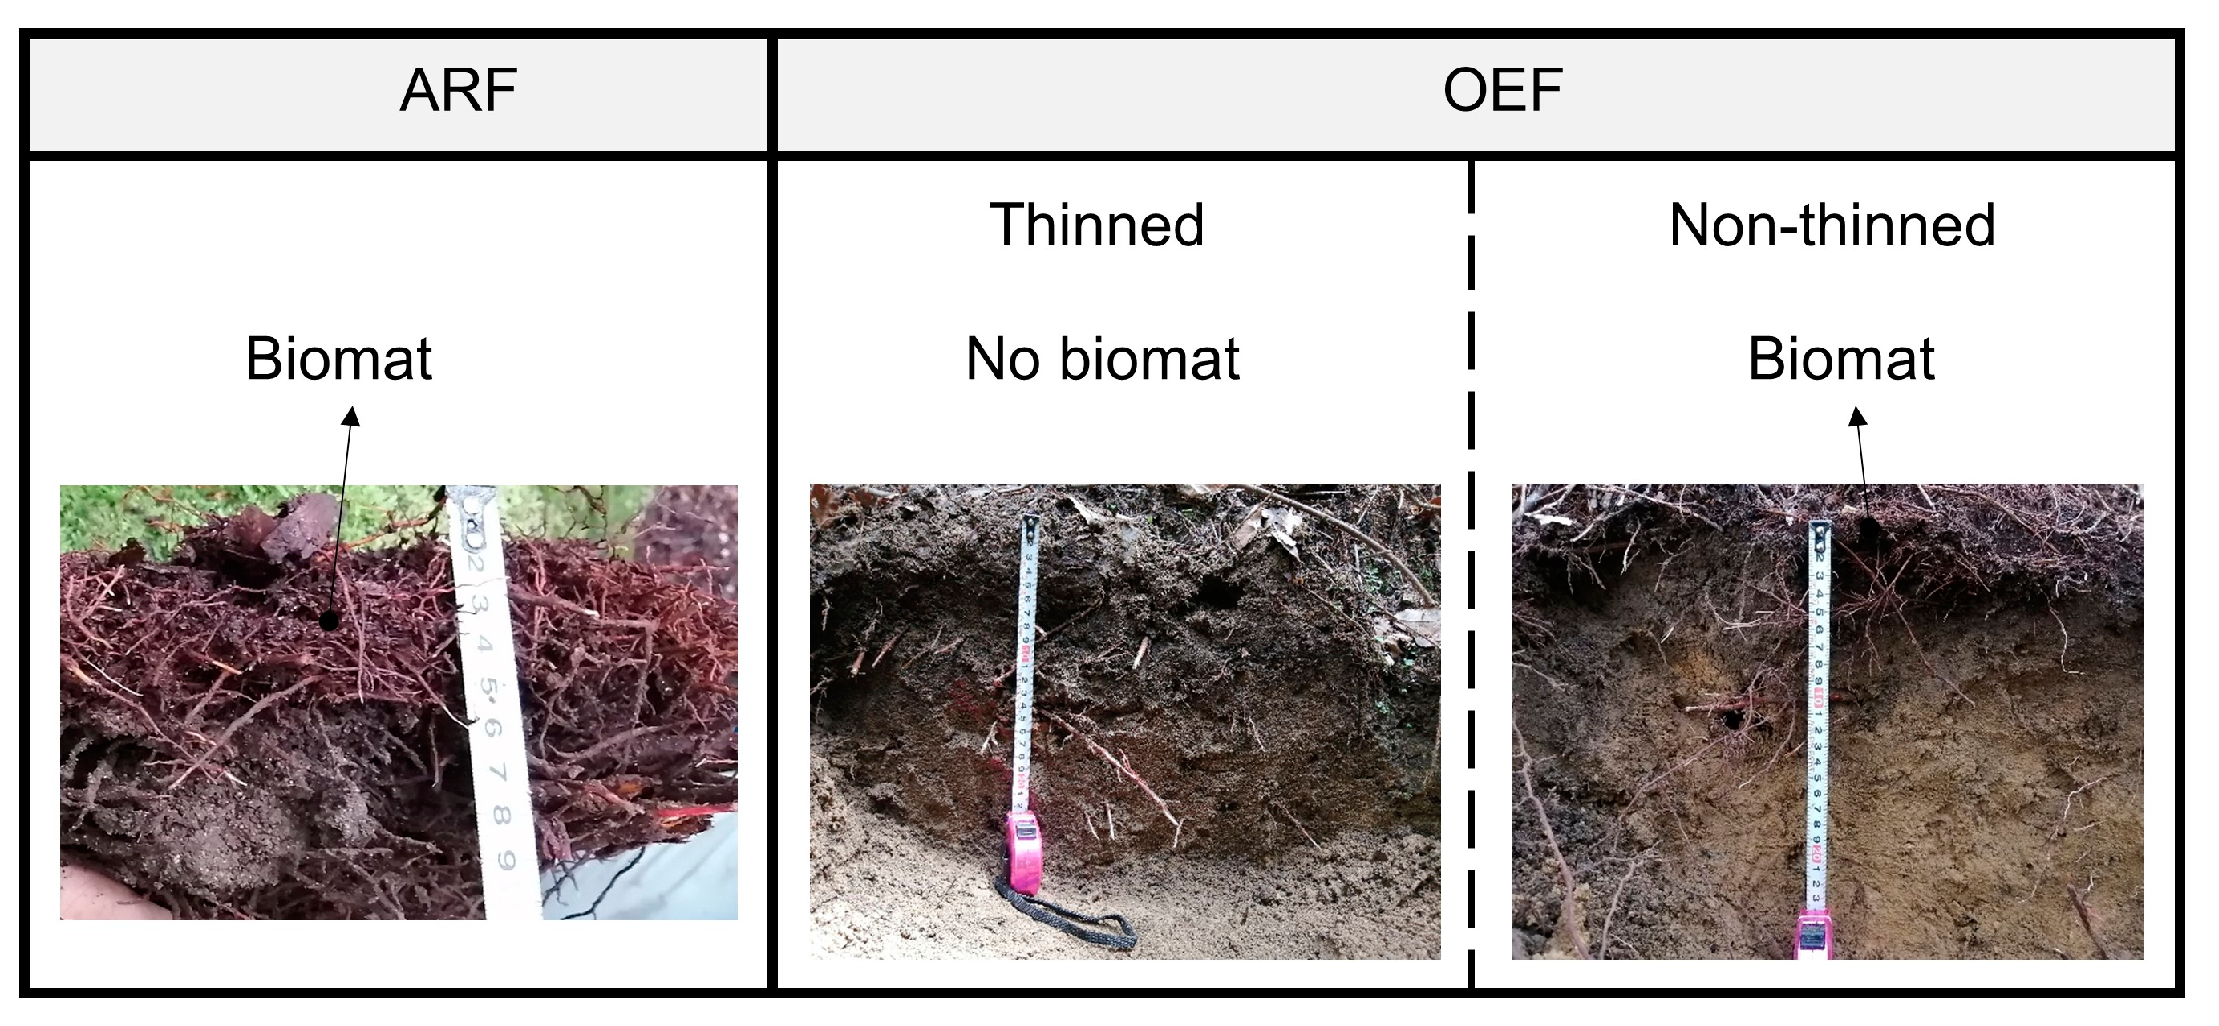
2.2. Experimental Design

Five subplots (50 cm × 50 cm) within one plot (5 m × 5 m) were selected at the ARF to (in situ) measure the WR of biomat and soil horizons on a monthly basis (Figure 1c; ARF). Six subplots (30 cm × 30 cm) within one plot (6 m × 6 m) were selected in each of the thinned and non-thinned areas at the OEF (in total, two plots, Figure 1c; OEF). The plots at the OEF were selected to measure the WR (monthly in situ) and monitor the water content and surface temperature of biomat and soil horizons. We also monitored surface runoff in the thinned and non-thinned areas with two adjacent closed-type runoff plots (4 m width and 10 m length, Figure 1c; OEF). Each surface runoff plot was surrounded by inserting the plastic sheet into the ground. Surface runoff was guided to a tipping bucket gauge (Uizin UIZ-TB200) through a gutter at the bottom boundary of each plot. A plastic sheet was installed on the ground to cover each plot’s gutter from direct rainfall. Rainfall data were recorded at a nearby weather station (500 m from the studied plots, Figure 1c; OEF) by a tipping bucket rain gauge (Ota Keiki OW-34-BP; 0.5 mm/tip). The evapotranspiration rate (ET0) was calculated by the Penman-Monteith equation:
ET 0 = 0.408 Δ R n G + γ 900 T + 273 u 2 e s e a Δ + γ 1 + 0.34 u 2
where ET0 is evapotranspiration rate (mm/day), T is air temperature (°C), u is wind speed (m/s), Rn is net surface radiation flux (Mj/m2day), G is sensible heat flux into the soil, es is mean saturation vapor pressure (kPa), ea refers to ambient vapor pressure (kPa), γ is the psychrometric constant, and ∆ is the rate of change of saturated vapor pressure with temperature (kPa °C−1). According to Penman-Monteith, based on the energy balance theory and water vapor diffusion, various influencing factors are considered in regions with complex climatic conditions [51].
One capacitive soil moisture sensor (ECH2OEC-5; METER Environment, formerly Decagon Devices, Inc., Pullman, WA, USA Group) was positioned horizontally in a 5 cm depth of biomat and/or soil horizon in each thinned and non-thinned plots at the OEF (in total, two sensors). In addition, ten thermocouple t-type were made for measuring the surface temperature of biomat and/or soil horizons and installed in the studied plots (5 in each thinned or non-thinned plot) at the OEF. Soil moisture sensors and thermocouples were connected to a CR10X data logger (Campbell Scientific, Logan, UT, USA) to record data at 30 min intervals.

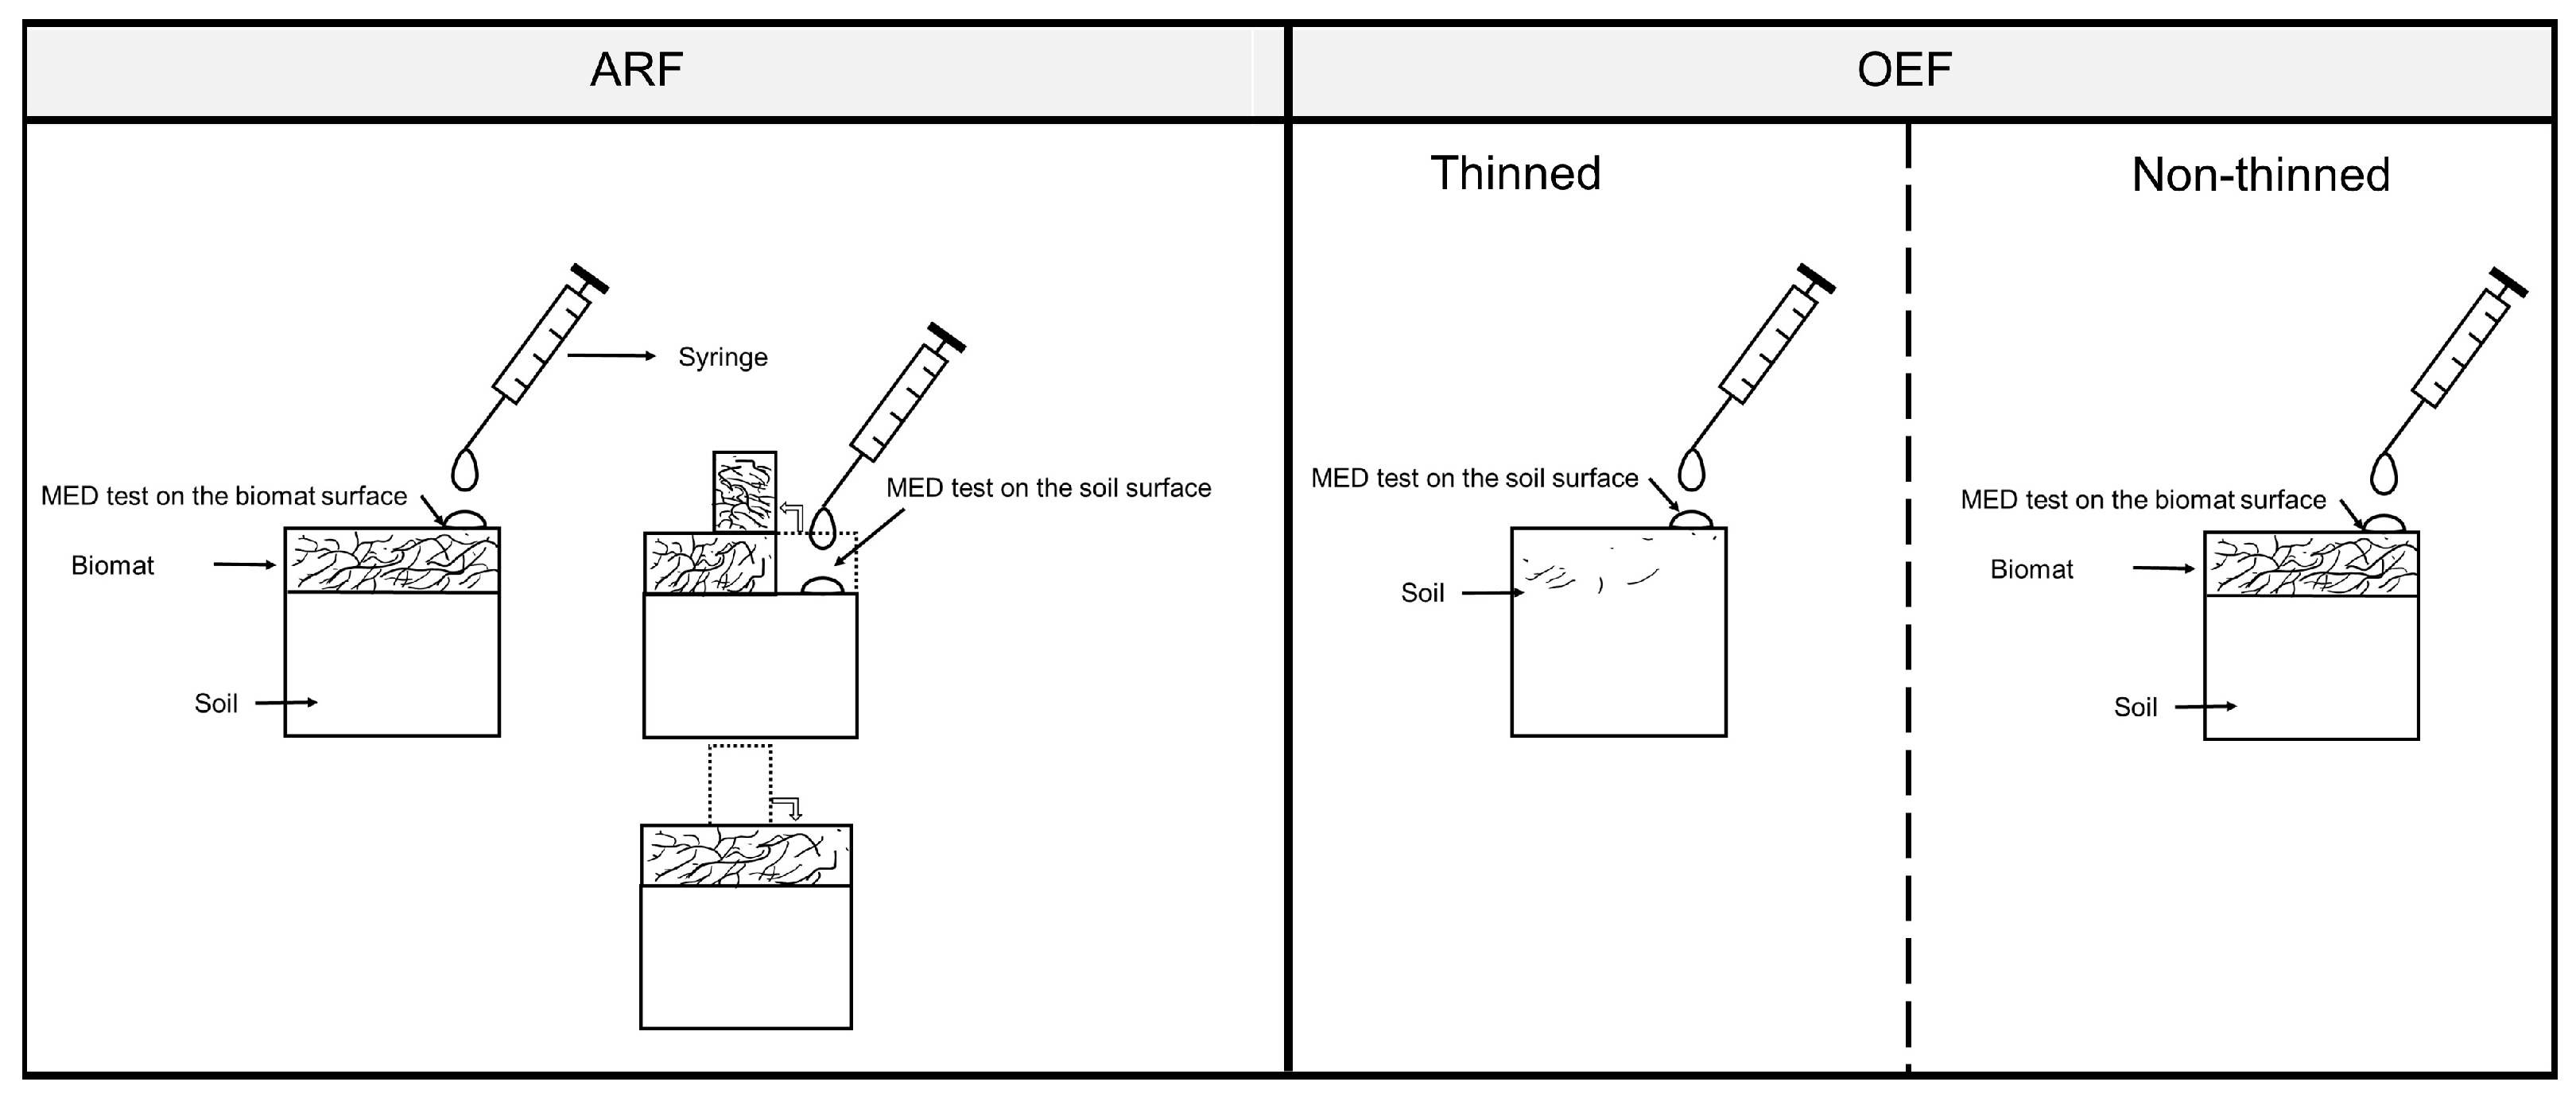
2.3. Molarity of an Ethanol Droplet Test

We used the molarity of an ethanol droplet (MED) test (in situ) to evaluate WR severity in the biomat and soil horizons (Figure 2). The MED test was conducted monthly in each subplot after at least five rain-free days. The MED test measures the severity of WR of the biomat or soil surface by dropping various ethanol dilutions (5 droplets in each subplot) and observing their infiltration performance within 5 s (Figure 2). Pure ethanol has a lower surface tension (22.7 mN m−1 at 20 °C) than water (72.8 mN m−1 at 20 °C). Dilution of pure ethanol with water at different percentages provides different surface tension values. The surface tension of a droplet on the porous media (i.e., biomat or soil) surface decreases with increasing ethanol percentage and vice versa. In our experiment, pure ethanol was diluted with ultra-pure water into separate solutions containing different percentages of ethanol on a volume basis (0%, 1.0%, 3.0%, 5.0%, 8.5%, 13.0%, 18.0%, 24.0%, and 36.0% v v−1). We used the WR classification proposed by Doerr et al. [52]. Doerr et al. [52] defined the ethanol % (threshold) of WR as 0–3 (none), 5 (slight), 8.5 (moderate), 13 (strong), 18–24 (very strong), and 36 (extreme). The WR severity was tested by dropping these solutions on the surface of biomat or soil (after gently removing the litter layer) using a syringe from a 5.0 mm height in increasing order of concentration, from 0% to 36% at the OEF (Figure 2; OEF). When a droplet of specific solution infiltrated the biomat or soil within 5 s, the solution before that was selected as the SWR intensity (except 0%). For example, if the 8.5% droplet infiltrated within 5 s, the 5.0% solution was selected as the solution defining the SWR intensity of that subplot. For a more detailed description of the MED test experiment, see [16]. In the ARF, in addition to the MED test on the biomat, we gently cut some parts of the biomat and then tested the MED on the soil surface (Figure 2; ARF). The MED test was conducted in the ARF to show the differences of the WR in biomat and soil horizons in the same plot in a C. obtusa plantation. We presented ethanol % in the results to show the severity of WR in biomat and soil horizons (with increasing ethanol %, WR severity also increases).

2.4. Statistical Analyses

The software R (Version 3.4.2, Vienna, Austria) was used for statistical analyses. A t-test was used to analyze differences in the WR between biomat and soil horizons in the ARF and biomat and/or soil WR between thinned and non-thinned plots in the OEF. Pearson’s correlation (r) analysis was performed between WR with water content and surface temperature of biomat and/or soil horizons and monthly surface runoff in the thinned and non-thinned plots at a 5% significance level. For Pearson’s correlation analysis, we used water content, and surface temperature data recorded simultaneously as the WR measurement time.

3. Results

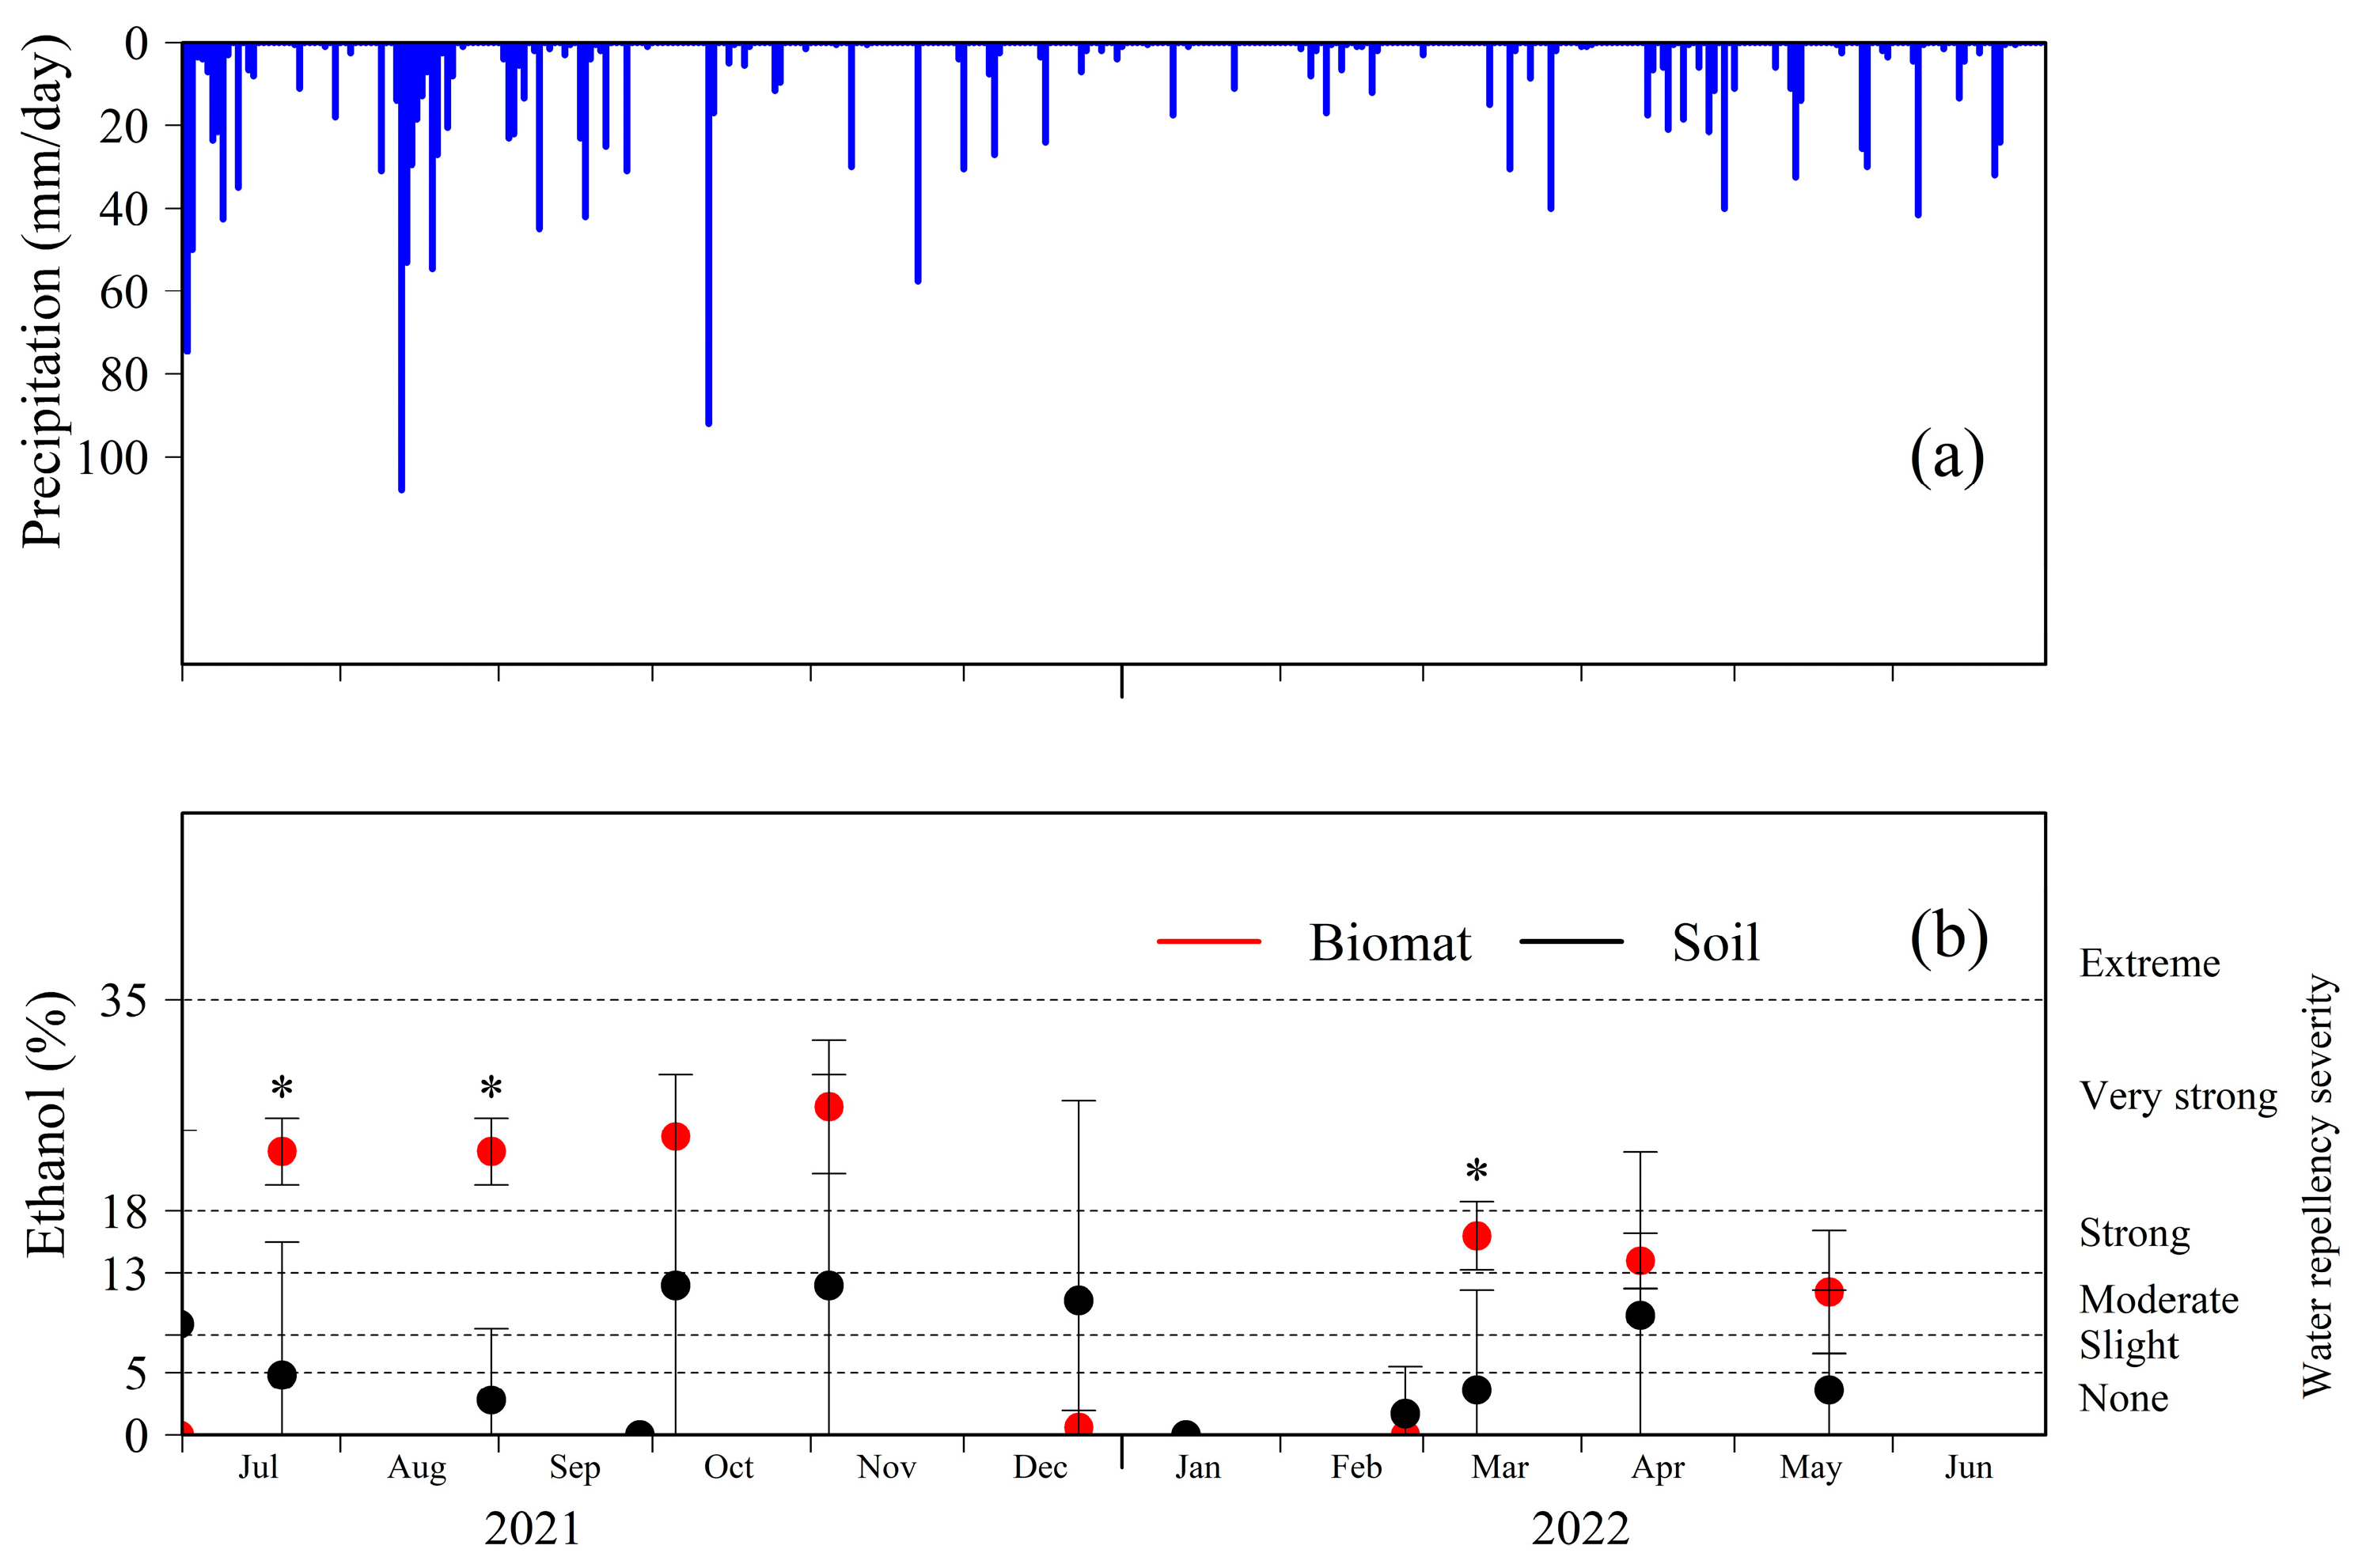
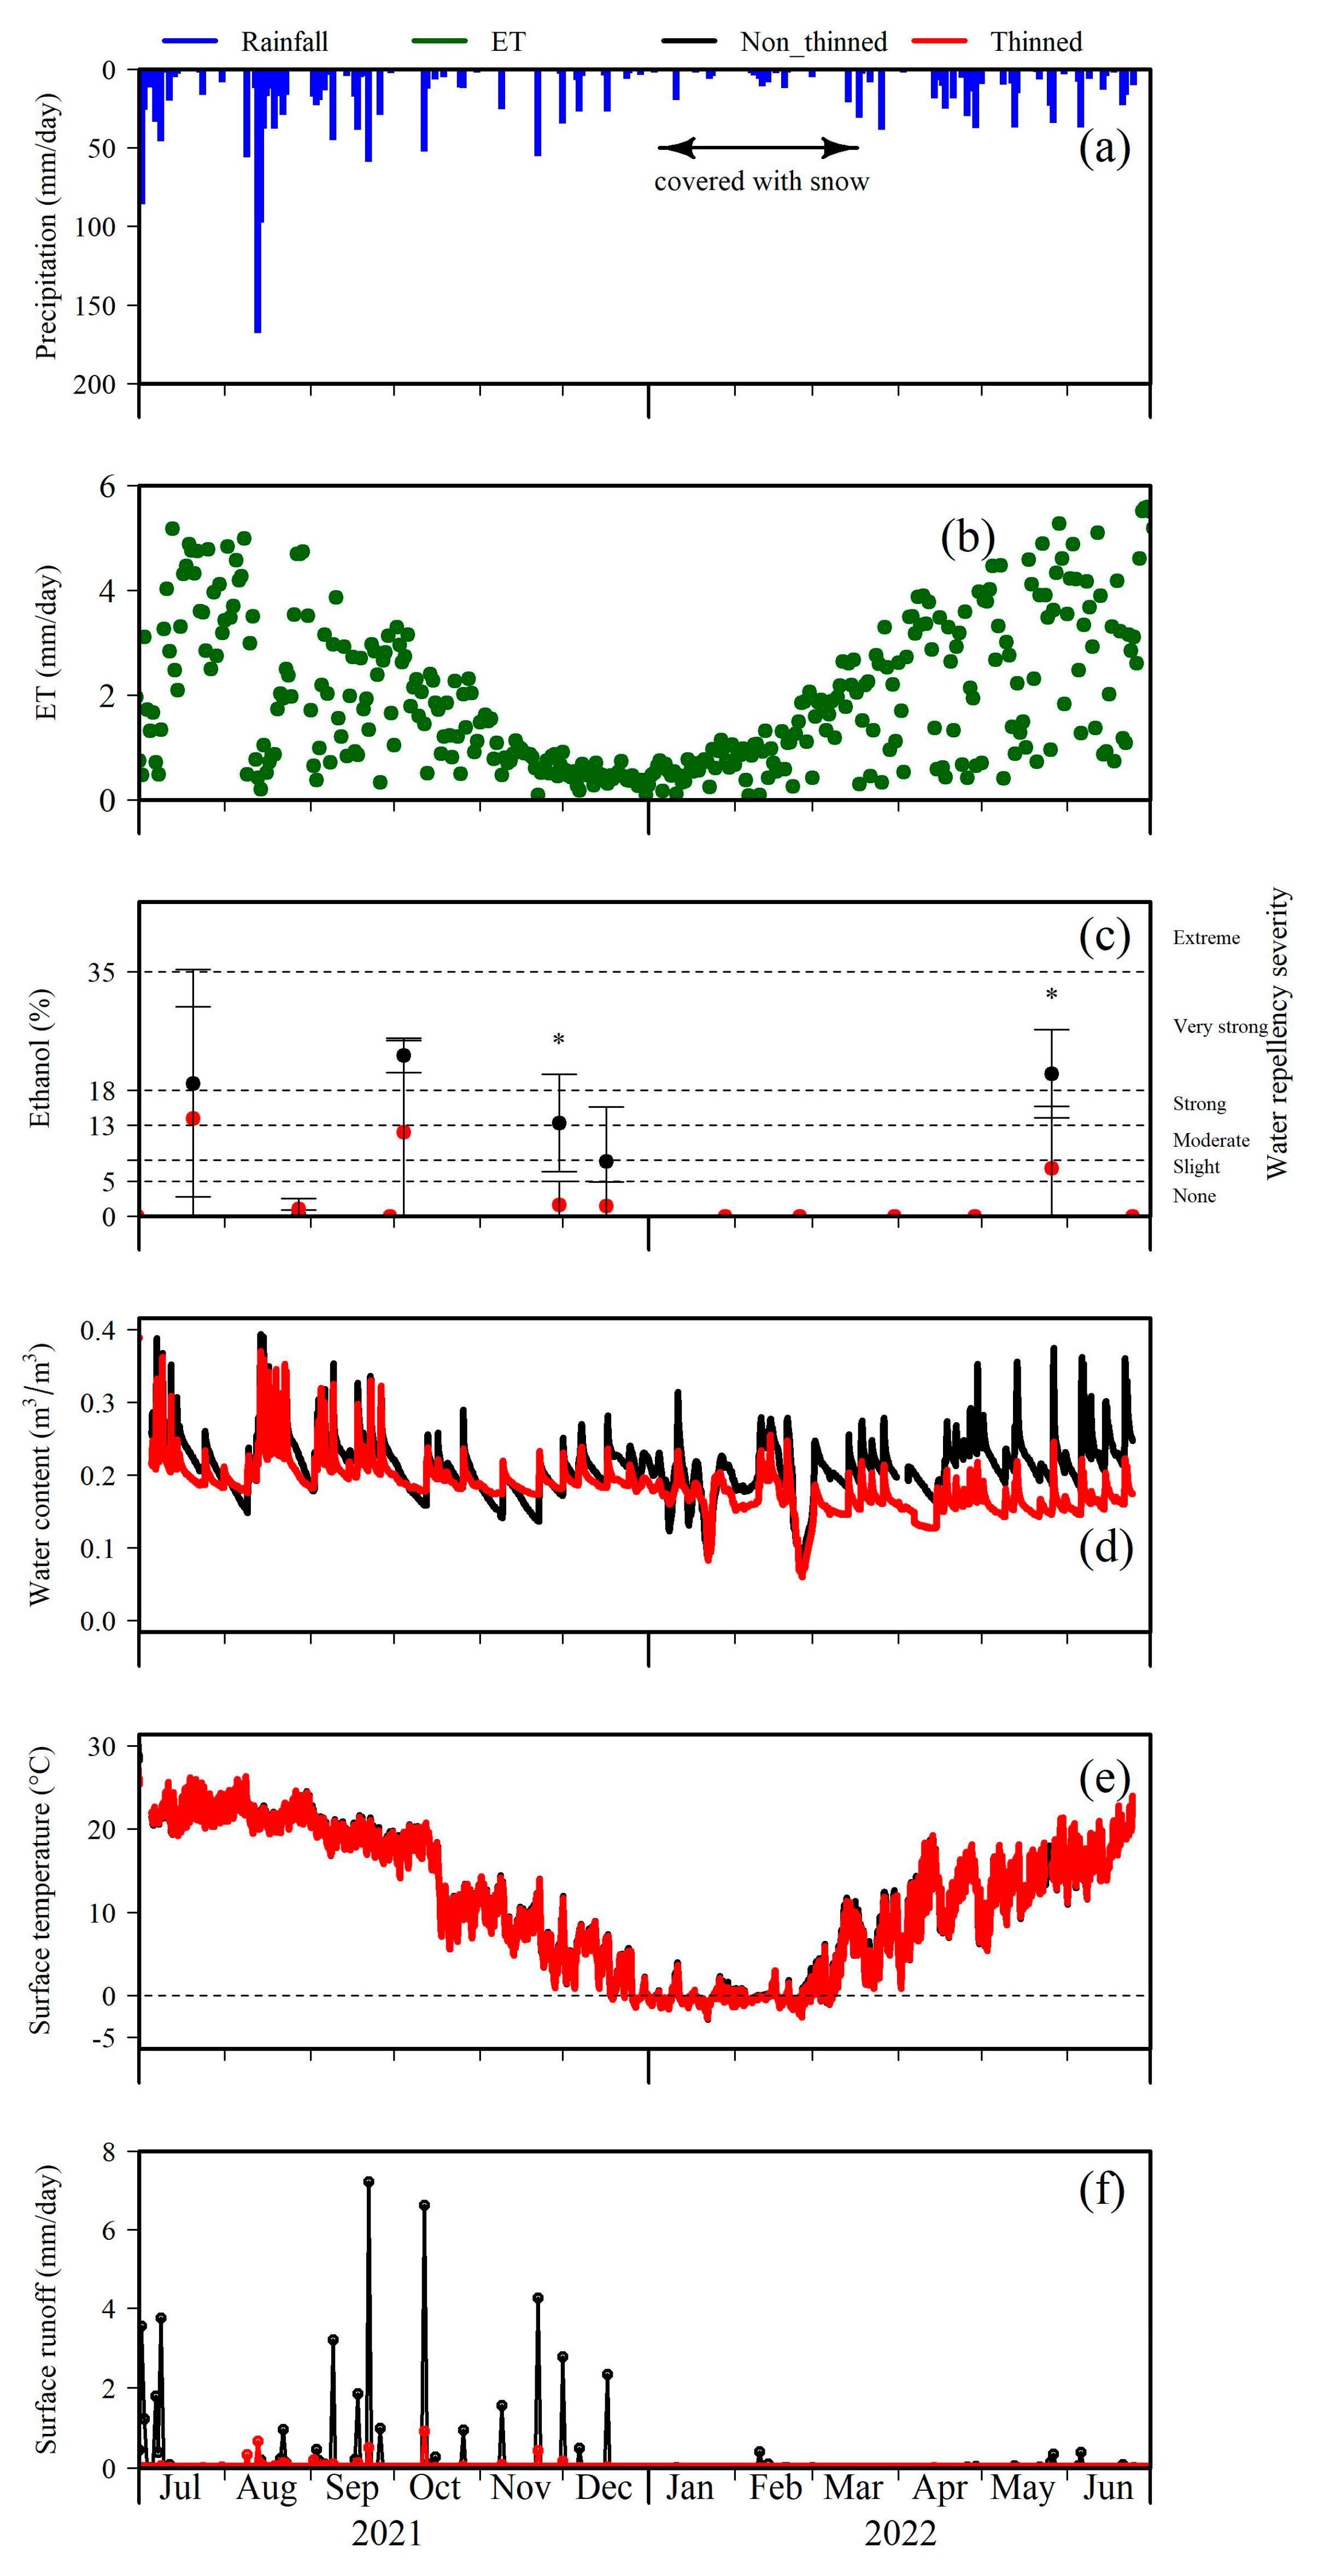
3.1. Water Repellency of Biomat and Soil Horizons

Our results show that the biomat had a 2.10, 2.58, and 0.00 cm depth in the studied plots at the ARF and the non-thinned and thinned plots at the OEF, respectively (Table 1, Figure 3). We observed that the biomat WR was higher than the soil WR in the C. obtusa at the ARF during the studied periods (Table 1 and Figure 4). The biomat WR was statistically higher than the soil WR in July and August 2021 and March 2022 (t-test, p-value < 0.05, Figure 4). In December 2021, soil WR was higher than biomat WR at the ARF (Figure 2). During the snowy season (January and February 2022), the WR of biomat and soil were similar at the ARF (Figure 4).

3.2. Water Repellency of Biomat and/or Soil Horizons in the Thinned and Non-Thinned Plots

After three years of thinning, the thinned areas lacked a biomat horizon and bare soil was exposed to the atmosphere, whereas the non-thinned plot had a 2.58 cm biomat depth (Table 1, Figure 3). The results of ET show a high temporal variability during rainy periods, whereas the lowest amount of ET was observed at the end of 2021 and early 2022 (snowy seasons) (Figure 5b). Our results show that the soil WR of the thinned plot was lower than the biomat WR of the non-thinned plot during the studied period in 2021 at the OEF (Figure 5c). In early 2022, the OEF site was covered with snow from January to early March, and the WR of thinned and non-thinned plots were similar (Figure 5a,c). In May 2022, the biomat WR of the non-thinned plot increased and was higher than the soil WR of the thinned plot (Figure 5c). The biomat water content of the non-thinned plot was similar to the soil water content of the thinned plot during the studied period in 2021 (Figure 5d). In contrast, the soil water content of the thinned plot dropped in 2022 and was lower than the biomat water content of the non-thinned plot (Figure 5d). The surface temperature of the biomat in the non-thinned plot was similar to the soil surface temperature of the thinned plot during the studied periods (Figure 5e). Most surface runoffs occurred in 2021 in either the thinned or non-thinned plots (Figure 5f). We also noticed that the surface runoff of the thinned plot was lower than the non-thinned plot (Figure 5f).

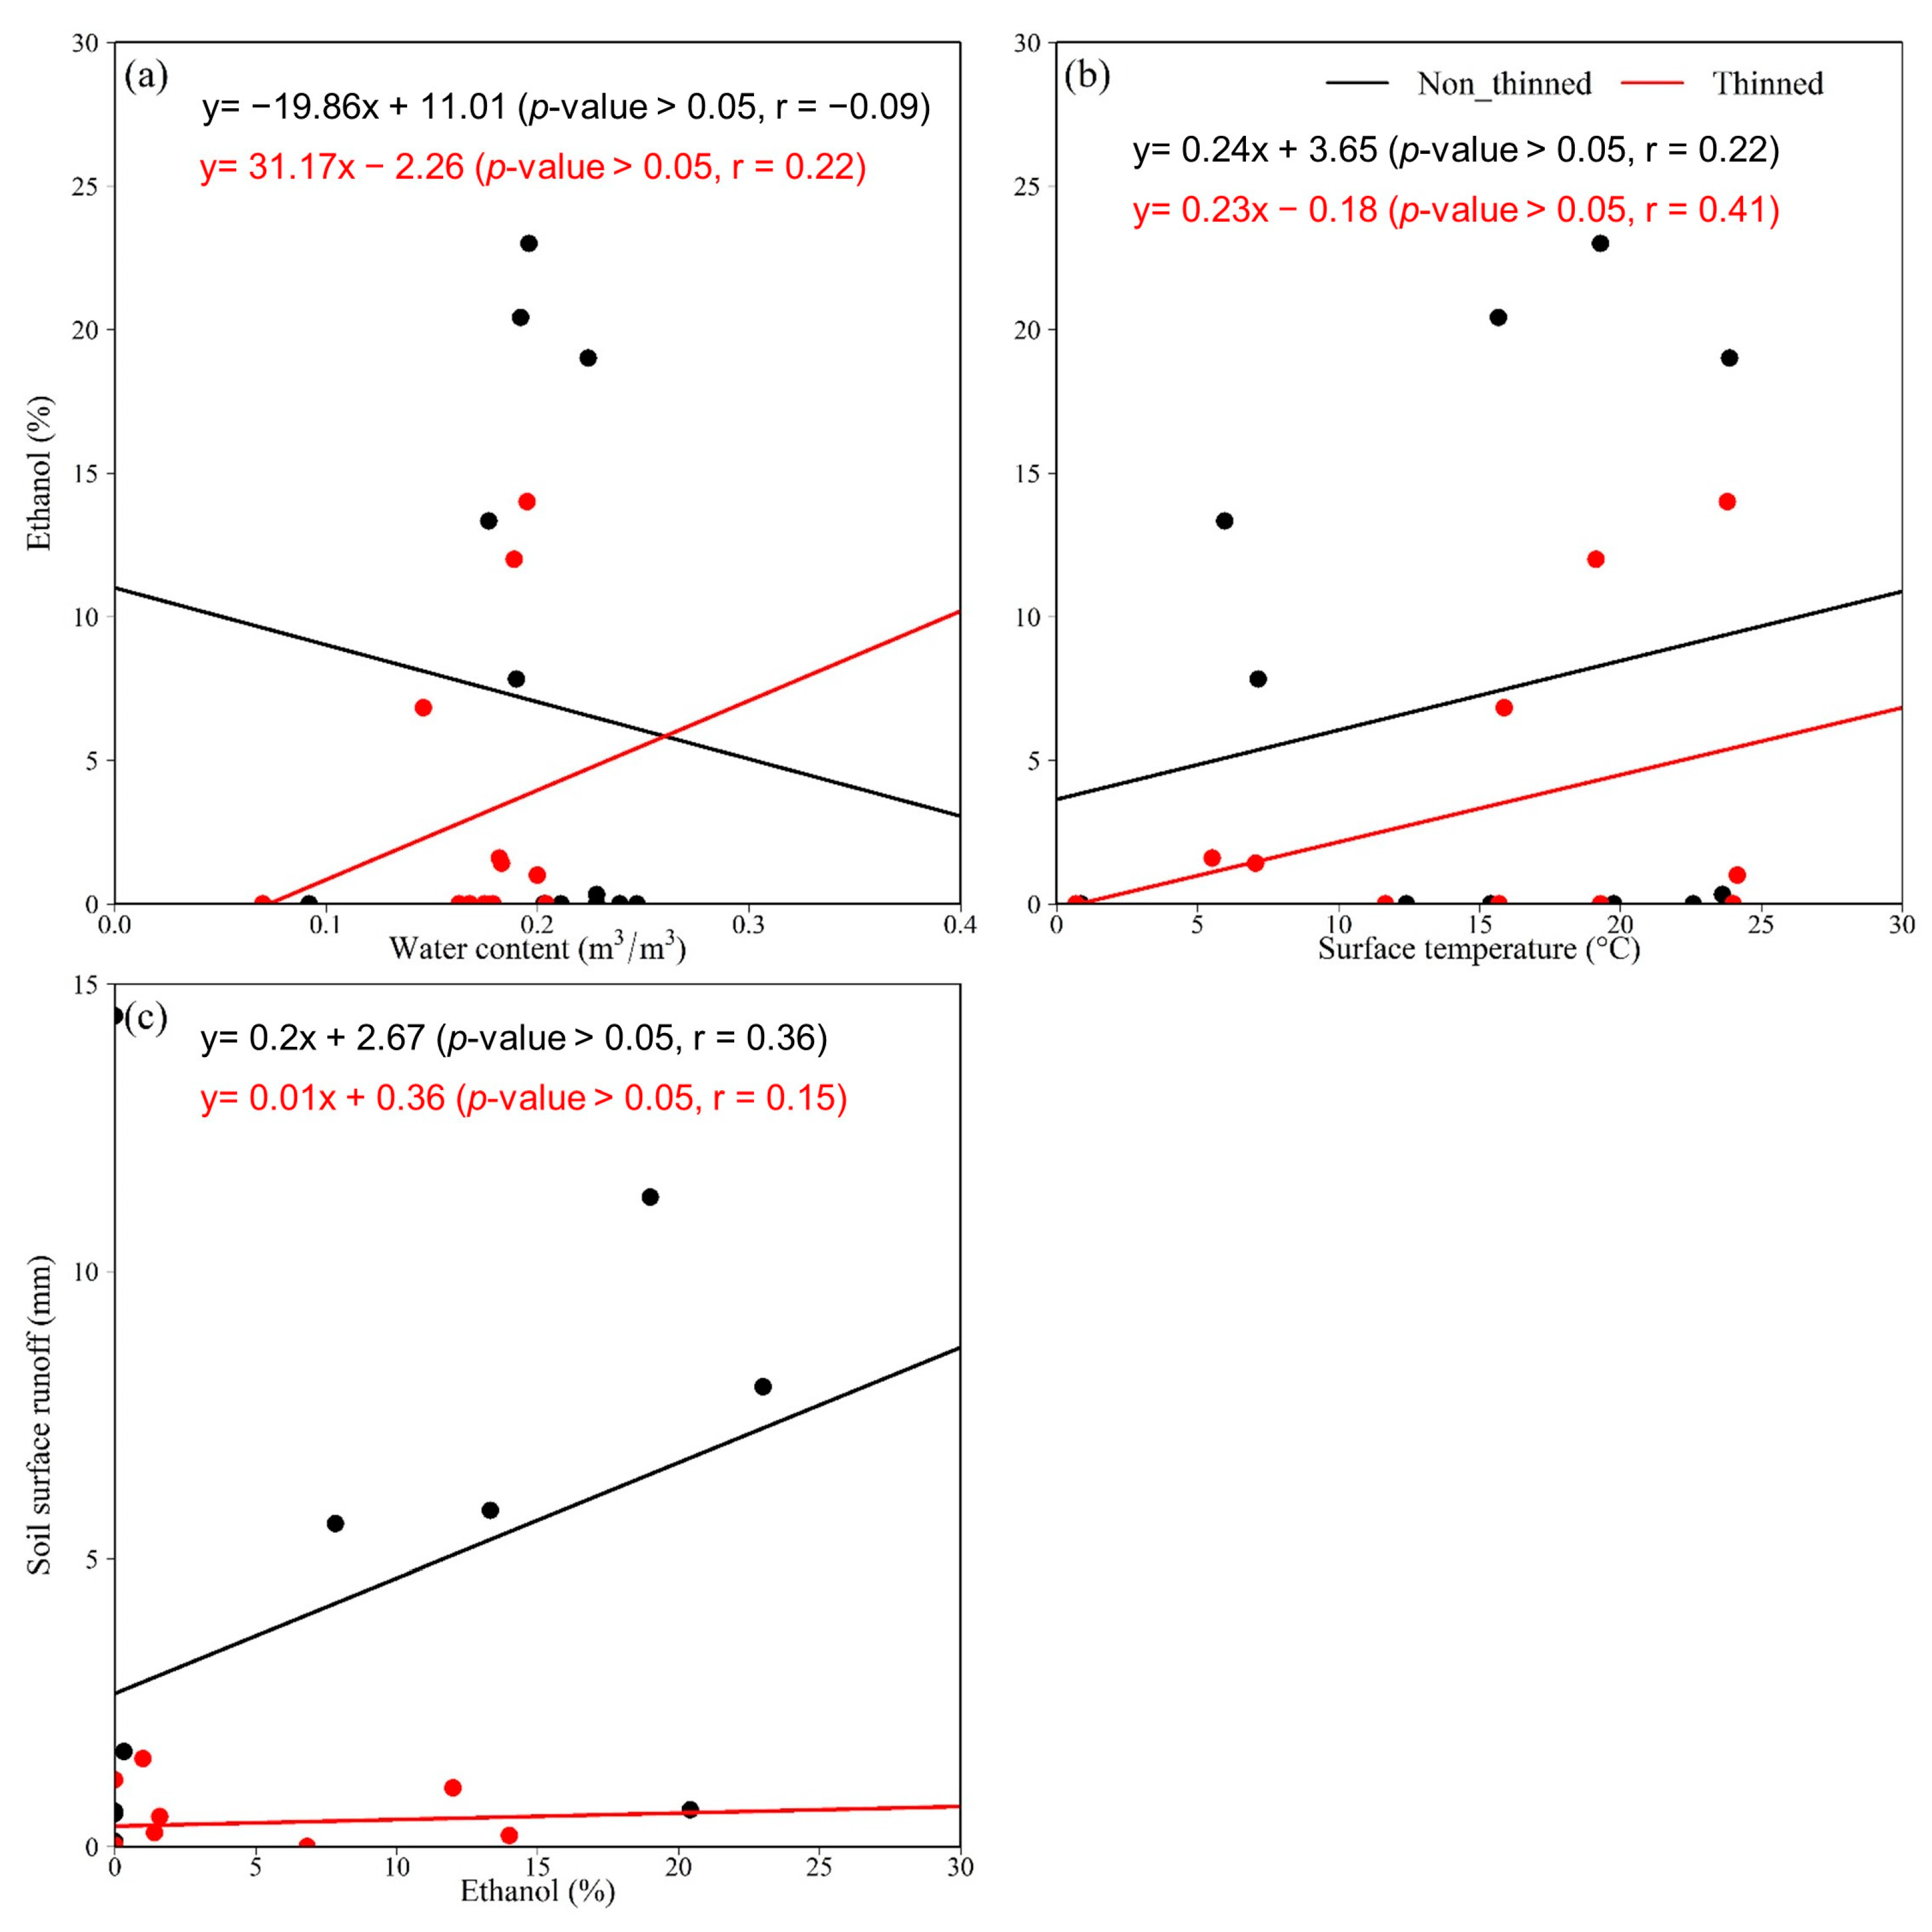
3.3. The Relationship between Water Repellency with Water Content and the Surface Temperature of Biomat and/or Soil Horizons and Potential Impact on Surface Runoff

There was a weak relationship between the WR and water content and surface temperature of the biomat in the non-thinned plot (Figure 6a,b). The thinned plot also had very similar results, with a weak relationship between the WR and water content and the surface temperature of the soil layer (Figure 6a,b). However, we noticed that the relationship between WR and surface runoff was stronger in the non-thinned plot than in the thinned plot (Figure 6c).

4. Discussion

We examined the WR of biomat and soil horizons in the thinned and non-thinned C. obtusa plantations. Our findings show that WR differed between a 40% thinned C. obtusa plot with a nearby non-thinned plot. Farahnak et al. [16] also mentioned the reduction of soil WR after one year of clear-cutting in a C. obtusa plantation in Kyushu, the southern part of Japan. However, we show that the lower WR of the thinned C. obtusa plot was related to the lack of a biomat horizon rather than soil WR. The higher biomat WR than soil WR in the ARF site supports our results that the differences in WR in the thinned and non-thinned plots in the OEF were related to the existence or absence of a biomat horizon. On the contrary, Kajiura and Tange [53] show that the presence of an organic horizon reduced the WR of mineral soil under a secondary forest (dominant tree species: Castanopsis sieboldii). The different types of tree species and the existence of biomat in the C. obtusa plantation could be the reason for these differences between our study and Kajiura and Tange [53].
In addition, Farahnak et al. [42] mentioned that the dry biomass and length of very fine roots with a diameter less than 0.5 mm—which is the main part of the biomat horizon—significantly reduced after tree cutting in a stump scale study in a C. obtusa plantation in Kyushu, the southern part of Japan. In this study, we also found that the thinned plot of C. obtusa lacked a biomat horizon compared with the non-thinned plot. Therefore, we assumed that the biomat horizon decomposed after three years of thinning.
We also noticed that water content had no relationship with the WR of biomat and/or soil in either thinned or non-thinned C. obtusa plots. In contrast, previous studies show a negative relationship between soil water content and WR [38,40]. One reason for this discrepancy with the previous studies could be related to the dryness of the biomat and/or soil surface because of exposure to the atmosphere (i.e., evaporation). In contrast, the bulk of biomat and or soil still had moisture. Therefore, the dryness of the biomat and soil surface could explain a lack of relationship between WR and water content in our study.
The similarity of the WR of thinned and non-thinned plots at the OEF during the snowy seasons could be related to the isolation impact of snow cover (i.e., low evaporation from biomat and soil surface) [54]. Furthermore, our results show that soil water content dropped in 2022 in the thinned plot. Therefore, the reduced soil water content in the thinned plot could be related to lower water retention of mineral soil compared with the biomat horizon [55] and lower precipitation in 2022 at 649.9 mm, compared with 1441 mm in 2021. In addition, higher WR of the biomat surface could reduce evaporation from the biomat layer [56].
Surface runoff in the non-thinned plot was higher than the thinned plot when the WR of the biomat was higher than the soil WR of the thinned plot. Our findings show that a higher WR of the biomat could potentially increase surface runoff only during hot seasons when ET was high. These findings support a higher WR of biomat than soil layers. Sidle et al. [21] also suggested that the WR of the biomat layer could potentially increase a higher biomat flow in a C. obtusa plantation with a poor ground cover than the biomat flow of a deciduous forest. Furthermore, Farahnak et al. [16] suggested that a higher soil WR on the downslope of C. obtusa trees could impact the generation of soil surface runoff. In this study, we also realized that the reduction of soil WR could be related to a lack of a biomat horizon in the thinned plot, which eventually reduced the soil surface runoff. We also noticed that during the snowy season with a low ET, both WR and surface runoff were low regardless of the thinned or non-thinned plots of C. obtusa plantations.
Our findings show the biomat horizon’s importance in differentiating WR between thinned and non-thinned C. obtusa plantations. The lack of relationship between WR and water content could be related to the differences between surface water content and the bulk water content of biomat and soil horizons.

5. Conclusions

This study investigated the differences in the WR of biomat and/or soil horizons in the thinned and non-thinned C. obtusa plantations in central Japan. We also measured water content and surface temperature of biomat and soil layers as two factors impacting WR. The potential impact of WR on surface runoff was also investigated. We noticed that the thinned plot of a C. obtusa plantation had a lack of biomat horizon, whereas the non-thinned plot had ca. 3 cm depth of biomat. Our results show that the soil WR of the thinned plot was lower than the biomat WR of the non-thinned plot. We also observed that surface runoff in the non-thinned plot was higher when a severe biomat WR occurred. Our findings show that the biomat horizon had an essential role in the differing WR between thinned and non-thinned C. obtusa plantations. Therefore, the lack of a biomat horizon could potentially impact surface runoff generation in the thinned C. obtusa plantations. Further studies need to clarify the changes in fine roots and biomat horizon after thinning to better understand the surface runoff generation mechanism.

Author Contributions

Conceptualization, M.F.; Data curation, M.F.; Formal analysis, M.F.; Funding acquisition, K.K.; Investigation, K.K. and T.S. (Toko Suzaki); Methodology, M.F., T.S. (Takanori Sato), Y.O. and T.S. (Toko Suzaki); Project administration, K.K.; Resources, K.K.; Software, M.F.; Supervision, K.K.; Validation, K.K.; Visualization, M.F. and T.S. (Takanori Sato); Writing—original draft, M.F.; Writing—review & editing, M.F. and Y.O. All authors have read and agreed to the published version of the manuscript.

Funding

This research was partly funded by the Toyota City Hall forestry division.

Data Availability Statement

Not applicable.

Acknowledgments

We gratefully thank Yoshimasa Nakane and Ryuosuke Shibata for their support in this project. The authors would like to thank the anonymous reviewers for their insightful suggestions and careful reading of the manuscript.

Conflicts of Interest

The funders had no role in the design of the study; in the collection, analyses, or interpretation of data; in the writing of the manuscript; or in the decision to publish the results.

References

  1. Carrà, B.G.; Bombino, G.; Denisi, P.; Plaza-Àlvarez, P.A.; Lucas-Borja, M.E.; Zema, D.A. Water infiltration after prescribed fire and soil mulching with fern in mediterranean forests. Hydrology 2021, 8, 95. [Google Scholar] [CrossRef]
  2. Crampe, E.A.; Segura, C.; Jones, J.A. Fifty years of runoff response to conversion of old-growth forest to planted forest in the HJ Andrews Forest, Oregon, USA. Hydrol. Process. 2021, 35, e14168. [Google Scholar] [CrossRef]
  3. Orfánus, T.; Zvala, A.; Čierniková, M.; Stojkovová, D.; Nagy, V.; Dlapa, P. Peculiarities of infiltration measurements in water-repellent forest soil. Forests 2021, 12, 472. [Google Scholar] [CrossRef]
  4. Mirbabaei, S.M.; Shabanpour, M.; van Dam, J.; Ritsema, C.; Zolfaghari, A.; Khaledian, M. Observation and simulation of water movement and runoff in a coarse texture water repellent soil. Catena 2021, 207, 105637. [Google Scholar] [CrossRef]
  5. Zema, D.A.; Plaza-Alvarez, P.A.; Xu, X.; Carra, B.G.; Lucas-Borja, M.E. Influence of forest stand age on soil water repellency and hydraulic conductivity in the Mediterranean environment. Sci. Total Environ. 2021, 753, 142006. [Google Scholar] [CrossRef] [PubMed]
  6. Zema, D.A.; Van Stan, J.T.; Plaza-Alvarez, P.A.; Xu, X.; Carra, B.G.; Lucas-Borja, M.E. Effects of stand composition and soil properties on water repellency and hydraulic conductivity in Mediterranean forests. Ecohydrology 2021, 14, e2276. [Google Scholar] [CrossRef]
  7. Yeap, S.G.H.; Bell, R.W.; Scanlan, C.; Stefanova, K.; Harper, R.; Davies, S. Soil water repellence increased early wheat growth and nutrient uptake. Plant Soil 2022, 473, 273–289. [Google Scholar] [CrossRef]
  8. Hewelke, E.; Gozdowski, D.; Korc, M.; Małuszynska, I.; Gorska, E.B.; Sas, W.; Mielnik, L. Influence of soil moisture on hydrophobicity and water sorptivity of sandy soil no longer under agricultural use. Catena 2022, 208, 105780. [Google Scholar] [CrossRef]
  9. Sándor, R.; Iovino, M.; Lichner, L.; Alagna, V.; Forster, D.; Fraser, M.; Kollár, J.; Šurda, P.; Nagy, V.; Szabó, A.; et al. Impact of climate, soil properties and grassland cover on soil water repellency. Geoderma 2021, 383, 114780. [Google Scholar] [CrossRef]
  10. Santos, J.M.; Verheijen, F.G.; Tavares Wahren, F.; Wahren, A.; Feger, K.H.; Bernard-Jannin, L.; Rial-Rivas, M.E.; Keizer, J.J.; Nunes, J.P. Soil water repellency dynamics in pine and eucalypt plantations in Portugal—A high-resolution time series. Land Degrad. Dev. 2016, 27, 1334–1343. [Google Scholar] [CrossRef]
  11. Smettem, K.R.J.; Rye, C.; Henry, D.J.; Sochacki, S.J.; Harper, R.J. Soil water repellency and the five spheres of influence: A review of mechanisms, measurement and ecological implications. Sci. Total Environ. 2021, 787, 147429. [Google Scholar] [CrossRef] [PubMed]
  12. Tinebra, I.; Alagna, V.; Iovino, M.; Bagarello, V. Comparing different application procedures of the water drop penetration time test to assess soil water repellency in a fire affected Sicilian area. Catena 2019, 177, 41–48. [Google Scholar] [CrossRef]
  13. Stoof, C.R.; Moore, D.; Ritsema, C.J.; Dekker, L.W. Natural and fire-induced soil water repellency in a Portuguese shrubland. Soil Sci. Soc. Am. J. 2011, 75, 2283–2295. [Google Scholar] [CrossRef]
  14. Ono, K.; Hiradate, S.; Morita, S.; Ohse, K.; Hirai, K. Humification processes of needle litters on forest floors in Japanese cedar (Cryptomeria japonica) and Hinoki cypress (Chamaecyparis obtusa) plantations in Japan. Plant Soil 2011, 338, 171–181. [Google Scholar] [CrossRef]
  15. Forestry Agency. Annual Report on Forest and Forestry in Japan (FY2020). Available online: https://www.rinya.maff.go.jp/j/kikaku/hakusyo/R2hakusyo/attach/pdf/zenbun-64.pdf (accessed on 20 December 2021). (In Japanese)
  16. Farahnak, M.; Mitsuyasu, K.; Otsuki, K.; Shimizu, K.; Kume, A. Factors determining soil water repellency in two coniferous plantations on a hillslope. Forests 2019, 10, 730. [Google Scholar] [CrossRef] [Green Version]
  17. Kobayashi, M.; Shimizu, T. Soil water repellency in a Japanese cypress plantation restricts increases in soil water storage during rainfall events. Hydrol. Process. 2007, 21, 2356–2364. [Google Scholar] [CrossRef]
  18. Kobayashi, M.; Tsurita, T.; Itoh, Y.; Kato, M. Spatial distribution of soil water repellency in a Japanese cypress plantation and an adjacent deciduous broad-leaved forest. J. Jpn. For. Soc. 2006, 88, 354–362, (In Japanese with English Abstract). [Google Scholar] [CrossRef] [Green Version]
  19. Miyata, S.; Kosugi, K.I.; Gomi, T.; Onda, Y.; Mizuyama, T. Surface runoff as affected by soil water repellency in a Japanese cypress forest. Hydrol. Process. 2007, 21, 2365–2376. [Google Scholar] [CrossRef]
  20. Sato, T.; Tanaka, N.; Nainar, A.; Kuraji, K.; Gomyo, M.; Suzuki, H. Soil erosion and overland flow in Japanese cypress plantations: Spatio-temporal variations and a sampling strategy. Hydrol. Sci. J. 2020, 65, 2322–2335. [Google Scholar] [CrossRef]
  21. Sidle, R.C.; Hirano, T.; Gomi, T.; Terajima, T. Hortonian overland flow from Japanese forest plantations—An aberration, the real thing, or something in between? Hydrol. Process. 2007, 21, 3237–3247. [Google Scholar] [CrossRef]
  22. Gomi, T.; Sidle, R.C.; Ueno, M.; Miyata, S.; Kosugi, K.I. Characteristics of overland flow generation on steep forested hillslopes of central Japan. J. Hydrol. 2008, 361, 275–290. [Google Scholar] [CrossRef]
  23. Benedetti-Ruiz, S.; Loewe-Muñoz, V.; Del Río, R.; Delard, C.; Barrales, L.; Balzarini, M. Effect of thinning on growth and shape of Castanea sativa adult tree plantations for timber production in Chile. For. Ecol. Manag. 2023, 530, 120762. [Google Scholar] [CrossRef]
  24. Trentini, C.P.; Campanello, P.I.; Villagra, M.; Ritter, L.; Ares, A.; Goldstein, G. Thinning of loblolly pine plantations in subtropical Argentina: Impact on microclimate and understory vegetation. For. Ecol. Manag. 2017, 384, 236–247. [Google Scholar] [CrossRef]
  25. Lõhmus, A. Silviculture as a disturbance regime: The effects of clear-cutting, planting and thinning on polypore communities in mixed forests. J. For. Res. 2011, 16, 194–202. [Google Scholar] [CrossRef]
  26. Vernon, M.J.; Sherriff, R.L.; van Mantgem, P.; Kane, J.M. Thinning, tree-growth, and resistance to multi-year drought in a mixed-conifer forest of northern California. For. Ecol. Manag. 2018, 422, 190–198. [Google Scholar] [CrossRef]
  27. Sadeghi, S.M.M.; Gordon, D.A.; Van Stan, J.T., II. A global synthesis of throughfall and stemflow hydrometeorology. In Precipitation Partitioning by Vegetation; Springer: Cham, Switzerland, 2020; pp. 49–70. [Google Scholar] [CrossRef]
  28. Hakimi, L.; Sadeghi, S.M.M.; Van Stan, J.T.; Pypker, T.G.; Khosropour, E. Management of pomegranate (Punica granatum) orchards alters the supply and pathway of rain water reaching soils in an arid agricultural landscape. Agric. Ecosyst. Environ. 2018, 259, 77–85. [Google Scholar] [CrossRef]
  29. Smit, G.N.; Rethman, N.F.G. The influence of tree thinning on the soil water in a semi-arid savanna of southern Africa. J. Arid. Environ. 2000, 44, 41–59. [Google Scholar] [CrossRef]
  30. Lagergren, F.; Lankreijer, H.; Kučera, J.; Cienciala, E.; Mölder, M.; Lindroth, A. Thinning effects on pine-spruce forest transpiration in central Sweden. For. Ecol. Manag. 2008, 255, 2312–2323. [Google Scholar] [CrossRef]
  31. Liu, X.; Sun, G.; Mitra, B.; Noormets, A.; Gavazzi, M.J.; Domec, J.C.; Hallema, D.W.; Li, J.; Fang, Y.; King, J.S.; et al. Drought and thinning have limited impacts on evapotranspiration in a managed pine plantation on the southeastern United States coastal plain. Agric. For. Meteorol. 2018, 262, 14–23. [Google Scholar] [CrossRef]
  32. Hawthorne, S.N.; Lane, P.N.; Bren, L.J.; Sims, N.C. The long term effects of thinning treatments on vegetation structure and water yield. For. Ecol. Manag. 2013, 310, 983–993. [Google Scholar] [CrossRef]
  33. Japan Forestry Agency, Annual Report on Trends in Forests and Forestry Fiscal Year 2021. 2022. Available online: https://www.maff.go.jp/e/data/publish/attach/pdf/index-211.pdf (accessed on 16 December 2022).
  34. Kuraji, K.; Gomyo, M.; Nainar, A. Thinning of cypress forest increases subsurface runoff but reduces peak storm-runoff: A lysimeter observation. Hydrol. Res. Lett. 2019, 13, 49–54. [Google Scholar] [CrossRef] [Green Version]
  35. Sun, X.; Onda, Y.; Kato, H.; Gomi, T.; Liu, X. Estimation of throughfall with changing stand structures for Japanese cypress and cedar plantations. For. Ecol. Manag. 2017, 402, 145–156. [Google Scholar] [CrossRef]
  36. Tateishi, M.; Xiang, Y.; Matsuda, H.; Otsuki, K.; Saito, T. Evapotranspiration change due to thinning in Chamaecyparis obtusa and Cryptomeria japonica forest. In Proceedings of the 2014 Annual Conference, Japan Society of Hydrology and Water Resources, Miyazaki, Japan, 25–27 September 2014. (In Japanese). [Google Scholar]
  37. Weber, P.L.; Hermansen, C.; Norgaard, T.; Pesch, C.; Moldrup, P.; Greve, M.H.; Müller, K.; Arthur, E.; de Jonge, L.W. Moisture-dependent water repellency of Greenlandic cultivated soils. Geoderma 2021, 402, 115189. [Google Scholar] [CrossRef]
  38. Vogelmann, E.S.; Reichert, J.M.; Prevedello, J.; Consensa, C.O.B.; Oliveira, A.É.; Awe, G.O.; Mataix-Solera, J. Threshold water content beyond which hydrophobic soils become hydrophilic: The role of soil texture and organic matter content. Geoderma 2013, 209, 177–187. [Google Scholar] [CrossRef]
  39. Buczko, U.; Bens, O.; Hüttl, R.F. Changes in soil water repellency in a pine—Beech forest transformation chronosequence: Influence of antecedent rainfall and air temperatures. Ecol. Eng. 2007, 31, 154–164. [Google Scholar] [CrossRef]
  40. Doerr, S.H.; Thomas, A.D. The role of soil moisture in controlling water repellency: New evidence from forest soils in Portugal. J. Hydrol. 2000, 231, 134–147. [Google Scholar] [CrossRef]
  41. González-Peñaloza, F.A.; Zavala, L.M.; Jordán, A.; Bellinfante, N.; Bárcenas-Moreno, G.; Mataix-Solera, J.; Granged, A.J.; Granja-Martins, F.M.; Neto-Paixão, H.M. Water repellency as conditioned by particle size and drying in hydrophobized sand. Geoderma 2013, 209, 31–40. [Google Scholar] [CrossRef]
  42. Farahnak, M.; Mitsuyasu, K.; Hishi, T.; Katayama, A.; Chiwa, M.; Jeong, S.; Otsuki, K.; Sadeghi, S.M.M.; Kume, A. Relationship between very fine root distribution and soil water content in pre-and post-harvest areas of two coniferous tree species. Forests 2020, 11, 1227. [Google Scholar] [CrossRef]
  43. Železnik, P.; Vilhar, U.; Starr, M.; De Groot, M.; Kraigher, H. Fine root dynamics in Slovenian beech forests in relation to soil temperature and water availability. Trees 2016, 30, 375–384. [Google Scholar] [CrossRef]
  44. Noguchi, K.; Han, Q.; Araki, M.G.; Kawasaki, T.; Kaneko, S.; Takahashi, M.; Chiba, Y. Fine-root dynamics in a young hinoki cypress (Chamaecyparis obtusa) stand for 3 years following thinning. J. For. Res. 2011, 16, 284–291. [Google Scholar] [CrossRef]
  45. JMA (Japan Meteorological Agency). Climate of Tokai District. 2020. Available online: https://www.data.jma.go.jp/gmd/cpd/longfcst/en/tourist/file/Tokai.html (accessed on 6 February 2020).
  46. Kottek, M.; Grieser, J.; Beck, C.; Rudolf, B.; Rubel, F. World map of the Köppen-Geiger climate classification updated. Meteorol. Z. 2006, 15, 259–263. [Google Scholar] [CrossRef] [PubMed]
  47. JMA (Japan Meteorological Agency). The Normal Value of Toyota City, Aichi Prefecture. 2020. Available online: http://www.data.jma.go.jp/obd/stats/etrn/view/nml_amd_ym.php?prec_no=51&block_no=0464&year=&month=&day=&view= (accessed on 6 February 2020). (In Japanese)
  48. Tobe, H.; Chigira, M.; Doshida, S. Comparisons of landslide densities between rock types in weathered granitoid in Obara village, Aichi prefecture. J. Jpn. Soc. Eng. Geol. 2007, 48, 66–79, (In Japanese with English Abstract). [Google Scholar] [CrossRef] [Green Version]
  49. Forest Soil Division. Classification of forest soil in Japan (1975). Bull Gov. For. Exp. Stn. 1976, 280, 1–28, (In Japanese with English Summary). [Google Scholar]
  50. IUSS Working Group WRB. World reference base for soil resources 2014, update 2015: International soil classification system for naming soils and creating legends for soil maps. World Soil Sci. Res. 2015, 106, 192. [Google Scholar]
  51. Allen, R.G.; Pereira, L.S.; Raes, D.; Smith, M. Crop Evapotranspiration-Guidelines for Computing Crop Water Requirements; FAO Irrigation and Drainage Paper 56; FAO: Rome, Italy, 1998; Volume 300, p. D05109. [Google Scholar]
  52. Doerr, S.H.; Ferreira, A.J.D.; Walsh, R.P.D.; Shakesby, R.A.; Leighton-Boyce, G.; Coelho, C.O.A. Soil water repellency as a potential parameter in rainfall-runoff modelling: Experimental evidence at point to catchment scales from Portugal. Hydrol. Process. 2003, 17, 363–377. [Google Scholar] [CrossRef]
  53. Kajiura, M.; Tange, T. The organic layer reduces water repellency of surface mineral soil under a humid-temperate forest. Geoderma 2022, 425, 116064. [Google Scholar] [CrossRef]
  54. Warrach, K.; Mengelkamp, H.T.; Raschke, E. Treatment of frozen soil and snow cover in the land surface model SEWAB. Theor. Appl. Climatol. 2001, 69, 23–37. [Google Scholar] [CrossRef]
  55. Franzluebbers, A.J. Water infiltration and soil structure related to organic matter and its stratification with depth. Soil Tillage Res. 2002, 66, 197–205. [Google Scholar] [CrossRef]
  56. Lichner, Ľ.; Alagna, V.; Iovino, M.; Laudicina, V.A.; Novák, V. Evaporation from soils of different texture covered by layers of water repellent and wettable soils. Biologia 2020, 75, 865–872. [Google Scholar] [CrossRef]
Figure 1. The location of the studied sites in Japan (a), the Akazu Research Forest (ARF), Obora Experimental Forests (OEF), the Ecohydrology Research Institute (ERI) headquarters (b), and the studied plots and subplots (c).
Forests 14 00210 g001
Figure 2. Schematic of molarity of ethanol droplet (MED) test on the biomat and soil surfaces in the Akazu Research Forest (ARF) and thinned and non-thinned plots of the Obora Experimental Forest (OEF).
Forests 14 00210 g002
Figure 3. Biomat horizon in the Akazu Research Forest (ARF) plot; the thinned and non-thinned plots of the Obora Experimental Forest (OEF).
Forests 14 00210 g003
Figure 4. Daily precipitation (a) and water repellency of the Chamaecyparis obtusa ((Siebold & Zucc.) Endl. plantation in biomat and soil horizons (b) at the Akazu Research Forest (ARF). Error bars denote the standard deviation. Asterisks (*) denote the differences in water repellency (WR) between biomat and soil horizons (t-test; p-value < 0.05). Water repellency severity classification is according to Doerr et al. [52].
Forests 14 00210 g004
Figure 5. Daily precipitation (a) and evapotranspiration (ET) (b), water repellency (ethanol%) (c), water content (d) and surface temperature (e) of biomat and soil layers, and daily surface runoff (f) in the thinned and non-thinned Chamaecyparis obtusa plantations at the Obora Experimental Forest (OEF). The studied plots were covered with snow from January to early March 2022. Error bars denote the standard error. Asterisks (*) denote the differences in water repellency (WR) between thinned and non-thinned plots (t-test; p < 0.05). Water repellency (WR) severity classification is according to Doerr et al. [52].
Forests 14 00210 g005
Figure 6. Pearson correlation coefficient (r) between water repellency (WR) and water content (a) and surface temperature (b) of biomat and soil horizons and monthly surface runoff (c) in the thinned and non-thinned Chamaecyparis obtusa plantations at the Obora Experimental Forest (OEF) site. The data of WR, water content, and surface temperature of biomat and soil horizons were from the same time.
Forests 14 00210 g006
Table 1. General statistics of Chamaecyparis obtusa ((Siebold & Zucc.) Endl. plantations plots at Akazu Research Forest (ARF) and Obora Experimental Forest (OEF) sites.
ARFOEF
Non-ThinnedThinnedNon-Thinned
DBH (cm)12.9 ± 2.921.1 ± 1.521.7 ± 2.2
Stand density (tree/ha)3500947900
Biomat depth (cm)2.10 (0.50–4.00)0.002.58 (2.00–3.00)
WR (ethanol %)Biomat12.55 ± 10.67-6.99 ± 10.52
Soil5.54 ± 10.803.07 ± 7.81-
Biomat/soil WC (m3/m3)-0.18 (0.06–0.39)0.21 (0.08–0.39)
Biomat/soil surface T (°C)-11.07 (−2.75–29.70)11.31 (−2.83–31.00)
Surface runoff (mm)-4.6652.81
Rainfall (mm)1728.52090.90
ET (mm/day)-1.89
The data show the average and standard deviation during the study periods. The numbers inside the parentheses show the range of data. Diameter at breast height (DBH), water repellency (WR), volumetric water content (WC), surface temperature (T), and evapotranspiration (ET). WC and T were measured in and on the soil in the thinned plot and biomat in the non-thinned plot. Surface runoff and rainfall are the total amounts during the studied period. ET is the average daily during the studied period.
Disclaimer/Publisher’s Note: The statements, opinions and data contained in all publications are solely those of the individual author(s) and contributor(s) and not of MDPI and/or the editor(s). MDPI and/or the editor(s) disclaim responsibility for any injury to people or property resulting from any ideas, methods, instructions or products referred to in the content.

