
Plant Community Degradation Inquiry and Ecological Restoration Design in South Lake Scenic Area of China

1
College of Landscape Architecture and Arts, Northwest A&F University, Xianyang 712100, China
2
College of Grassland and Agriculture, Northwest A&F University, Xianyang 712100, China
3
Shaanxi Forestry Survey & Planning Institute, Xi’an 710127, China
4
Xi’an Northwest University Research Institute of Urban-Rural Planning and Environment Engineering, Xi’an 710127, China
*
Author to whom correspondence should be addressed.
†
These authors contributed equally to this work and should be considered co-first authors.
Forests 2023, 14(2), 181; https://doi.org/10.3390/f14020181
Submission received: 1 December 2022
/
Revised: 10 January 2023
/
Accepted: 13 January 2023
/
Published: 18 January 2023
(This article belongs to the Topic Sustainable Landscape in Rural Areas: Theories, Strategies, and Practices)
Abstract
:The most visited provincially administered park in Hanzhong City, the South Lake Scenic Area, is degrading the Masson Pine forest communities. Determining and repairing the landscape degradation and impacts on recreational value due to the degraded community structure is essential for restoring the environment of the southern Qinling Mountains. By evaluating the degree, trend, and pattern (DTP) of impacts, we identified the degradation status of the plant community in the South Lake Scenic Area in the past 20 years. We show that the scenic area has experienced an increase in the degradation of vegetation cover in the last 20 years. The area of degraded vegetation cover is significantly larger than the area of improvement, and the overall area is changing, with fewer stable areas. The area of reduced forest cover in the South Lake Scenic Area from 2000–2010 and 2010–2020 has been expanding, and the area of forest land transferred to nonforest land from 2010–2020 has been accelerating compared with 2000–2010; the landscape pattern index has decreased year over year, fragmentation has become serious, landscape connectivity is declining, woodland patches are subject to human disturbance, and patch shapes are simplifying. Based on theories of natural succession and moderate disturbance, the Miyawaki method and interlogging are used to promote plant community renewal and biodiversity restoration. This is intended to shorten the natural succession process in the scenic area and to rapidly restore the ecological foundation of the scenic area. Recovery will meet the aesthetic and ecological values of the South Lake Scenic Area.
1. Introduction
Forest degradation is one of the most pressing and widespread environmental problems worldwide [1]. In recent decades, global issues related to socioeconomic development and intense exploitation of forest resources have directly or indirectly led to their degradation [2], leading to sustained loss of forest biodiversity [3]. The global net loss of forests is 3.39 million hm2 per year, most of which is in developing countries [4].
China’s forest cover is among the top ten countries in the world but has extensive forest ecosystem degradation, with complex and diverse consequences [5]. Anthropogenic pressures result in forest loss, fragmentation and degradation [6] and have led to substantial declines in biodiversity and increased landscape homogenization [7,8,9]. These negative trends are expected to continue (e.g., [8]). Forest restoration is an important way to slow (reduce) forest degradation and is relevant to human wellbeing [10]. By strengthening the ecological restoration of degraded forests globally, it is possible to turn the “Sustainable Development Goals by 2030” proposed by the Food and Agriculture Organization of the United Nations (FAO) in 2020 into reality [11]. Therefore, it is crucial to construct a scientific degradation assessment system and develop an ecological restoration plan consistent with forest natural succession.
Research teams and international organizations have used different indicators and criteria to evaluate degraded forest ecosystems over the years. This is largely due to different forest management objectives, and although there are differences in how the concept of degradation is understood, the principle is the same among indices, to measure the average decrease in forest productivity and ecosystem services [12].
Several studies have been carried out in China and abroad to evaluate degraded forests. Forests are complex ecosystems, and because of the practicality and operability of forest degradation assessment, many have used field surveys and remote sensing monitoring. For example, Duarte proposed a method to monitor degradation using Landsat time series and measure degradation emissions in pine forest areas in the Dominican Republic. They confirmed the effectiveness of remote sensing monitoring of forest degradation [13]. Bahamonde et al. proposed a quantitative method that quantitatively assesses forest degradation impacts on productivity using a production forest in Chile as an example. Their results showed that forest productivity measured by stand growth can be used to establish a threshold value to inform management responses [14]. Thompson assessed forest productivity by assessing biodiversity, abnormal disturbance, conservation function, and carbon storage as criteria, obtaining indicators through remote sensing to determine the type and extent of forest degradation [15]. Sasaki began by stopping the causes of degradation and allowing the forest to regenerate itself. They accelerated the regeneration and growth of trees by actively managing the natural regeneration of degraded areas, demonstrating that alternative forest restoration is more beneficial than traditional planting [16].
Indeed, considerable work has been carried out to study degraded forest restoration. Mariscal applied traditional ecological knowledge to provide insights into ecosystem–plant–animal interactions. They identified native plants useful to both humans and wildlife for forest restoration projects, reconnecting isolated forest patches [17]. Within China, Wang assessed and analyzed forest ecosystems in the Greater Bay Area to identify landscape patterns, ecosystem services, and pest and disease risks. They found areas of significant ecological degradation and suggested ecological restoration countermeasures [18]. Throughout the research on forest degradation assessment and restoration in China and abroad, it is evident that the assessment and restoration of forest degradation in this special landscape attribute of scenic areas has not received sufficient attention. How to conduct targeted work on plant community optimization in scenic areas requires a clear understanding of forest degradation. We suggest that restoration with native plants and application of the Miyawaki method has important theoretical and practical significance when used with functional zoning of scenic areas.
In this study, the degradation of the Masson Pine community in the Nanhu Scenic Area of Hanzhong City was evaluated, applying the three-dimensional DTP (degree, trend, pattern) degradation assessment system. Nanhu Scenic Area is bounded by Qinling Mountains to the north and Ba Mountain to the south, promoting the natural landscape form of “two mountains and one lake” to create a meaningful ecological and humanistic landscape. Currently, however, the vegetation in the scenic area is seriously degraded, and the work to protect and restore the ecology of this area is facing challenges. The objectives of this study were to: (1) confirm the degradation status of plant communities in the Nanhu Scenic Area using three-dimensional evaluation of fly-seeding afforestation to rapidly restore a barren mountain; (2) using the current distribution of Masson pine forest in the Nanhu Scenic and Historic Interest Area, promote the regeneration of forest plant communities and biodiversity to quickly restore the ecology and aesthetic character of the Nanhu Scenic and Historic Interest Area. The study is based on “the vegetation planning section of the South Lake Scenic Area Master Plan (2019–2035)” that we wrote in 2021. The planning is currently in the process of implementation. We planned the vegetation restoration in this area according to the literature data, and in 2021, we carried out the real vegetation restoration in the Nanhu Scenic Area. The results of this study will have theoretical and practical significance for the identification of degradation in plant communities and landscape restoration.
2. Materials and Methods
2.1. Study Site
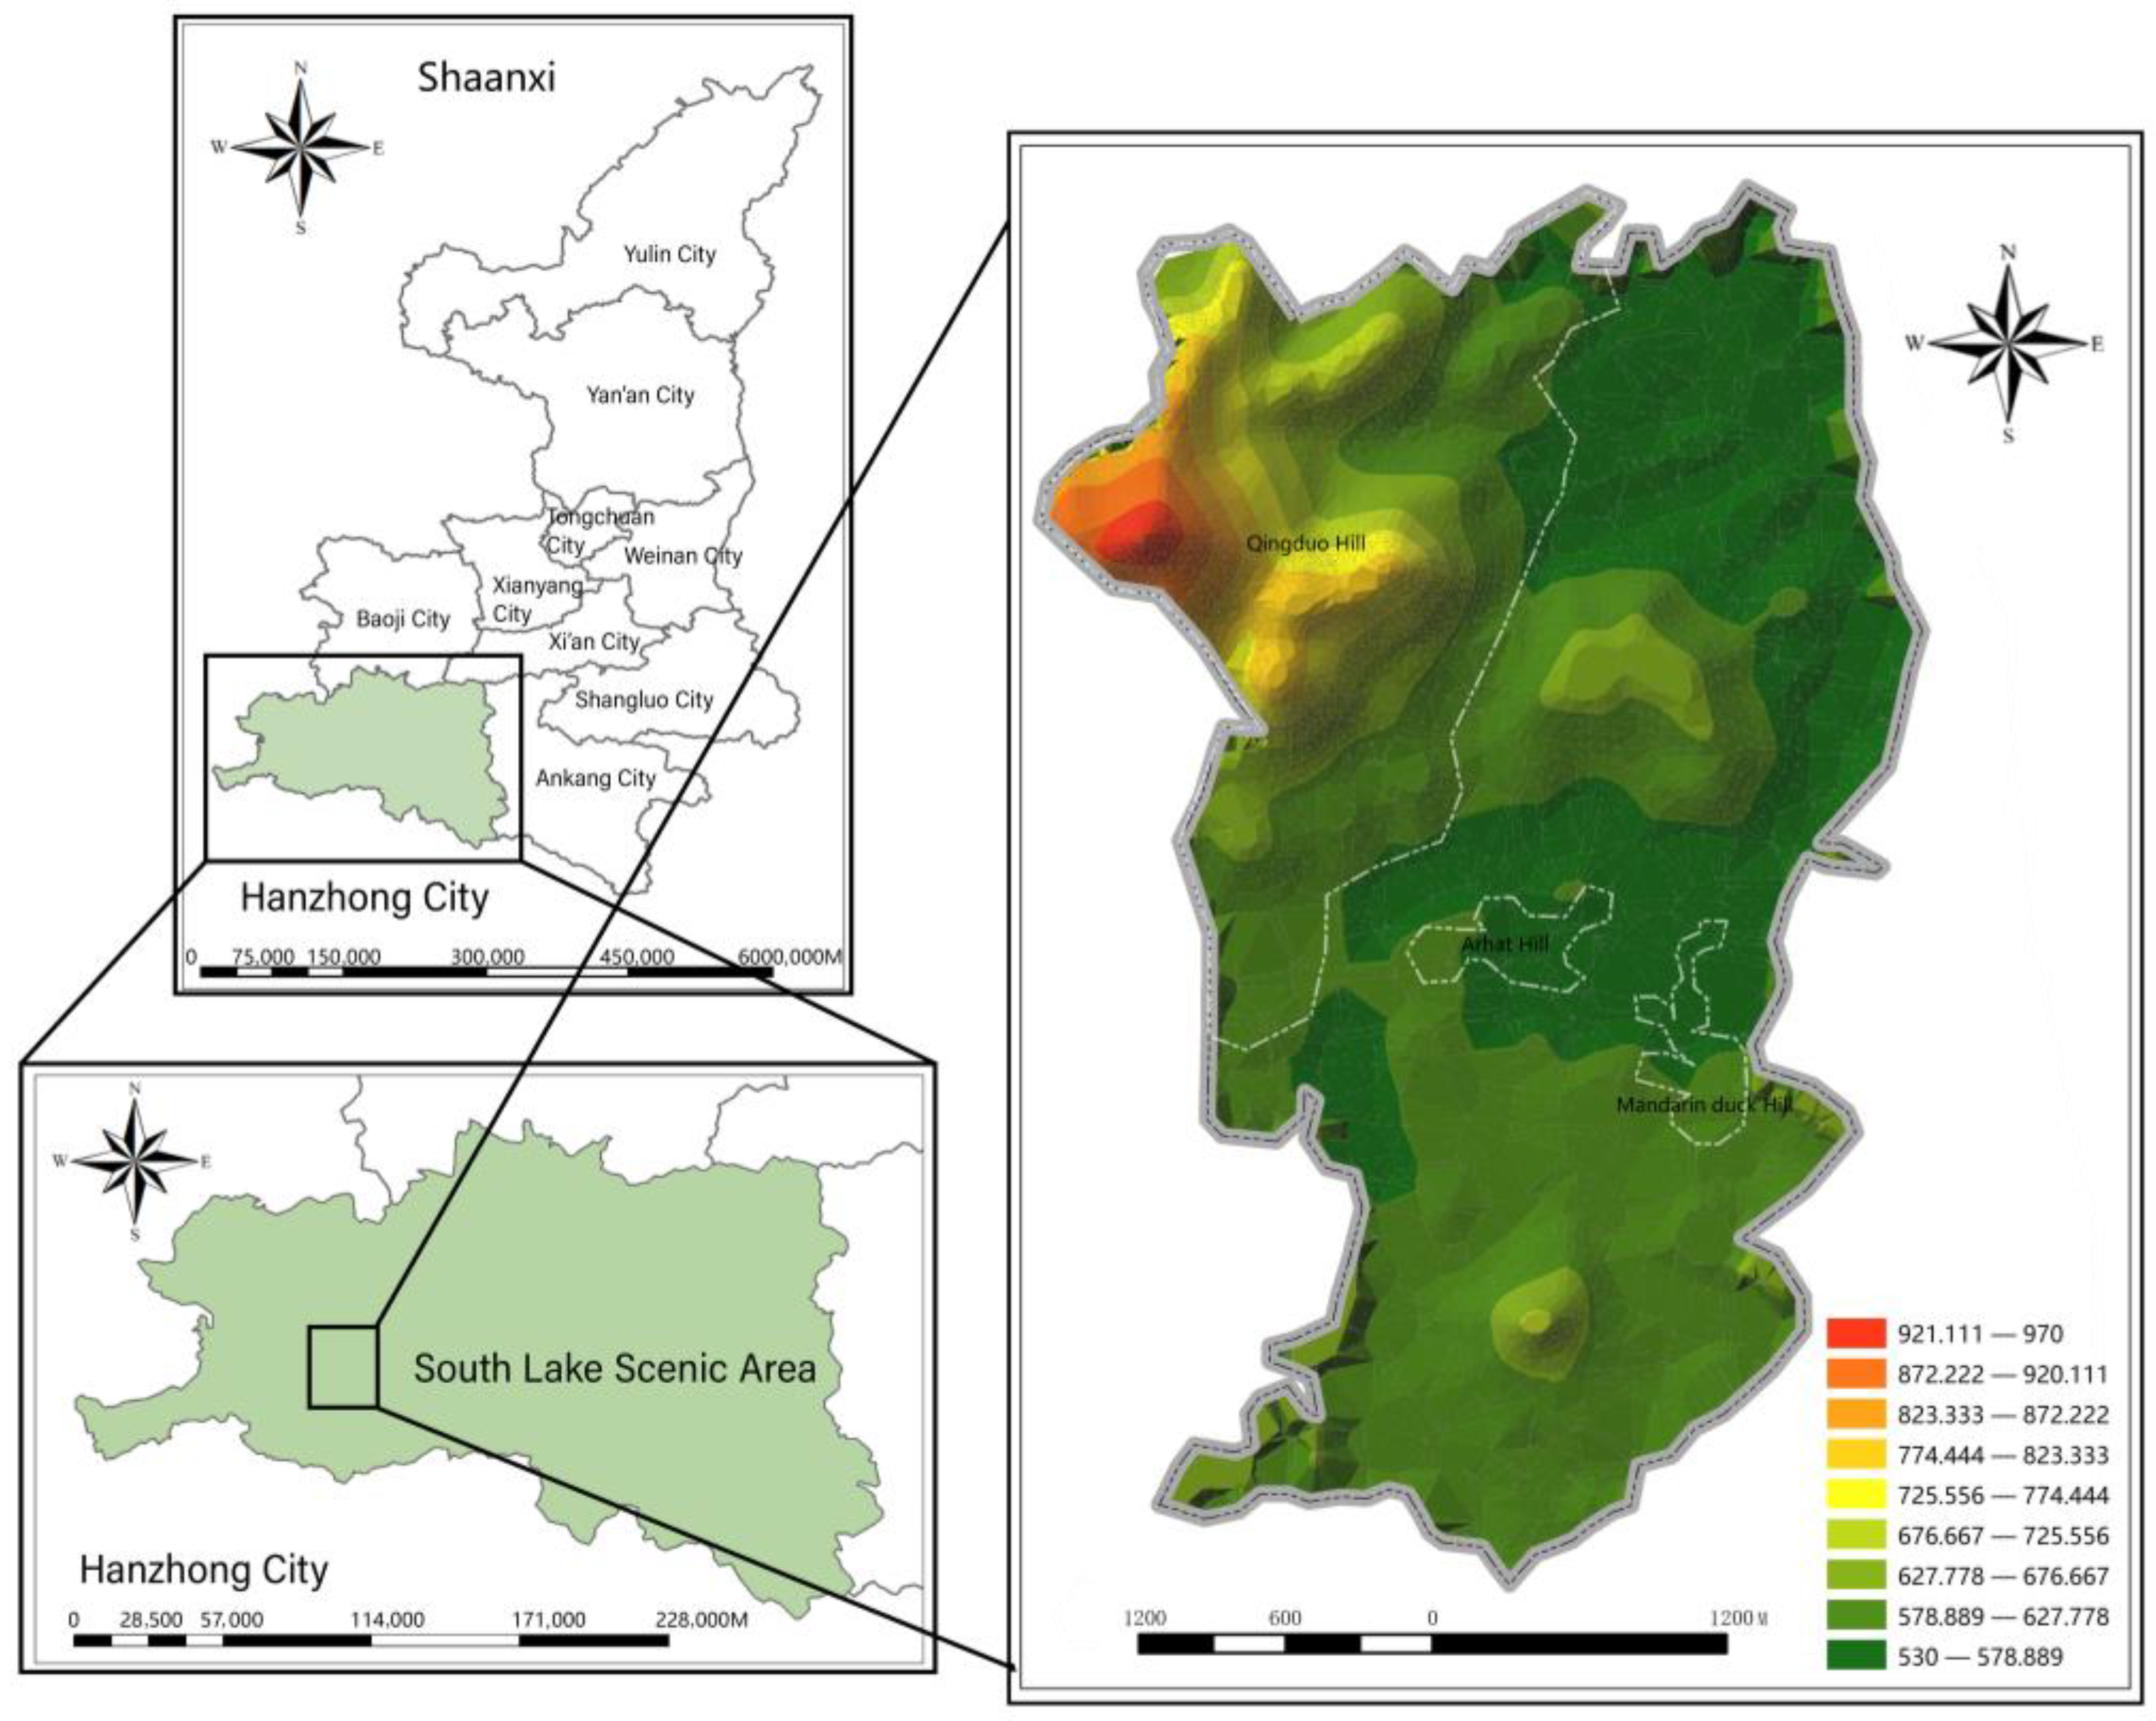
The Hanzhong Nanhu Scenic Area is located northwest of Qingshu Town, Nanzheng District, Hanzhong City, Shaanxi Province (Figure 1). It lies north of the Qinling Mountains and south of Ba Mountain, it is part of the low hills of the Great Ba Mountain. Its altitude, except for the main peak of the Great Han Mountain, which exceeds 1400 m, lies between 600~1000 m, with a relative height of 100~500 m. The climate of Nanzheng belongs to the northern subtropical humid monsoon zone, with vertical differences in temperature and precipitation significant due to the influence of topography. The northern subtropical humid climate zone of the Pingchuan Hills includes areas below 800 m above sea level, with an extreme minimum temperature of −10–6 °C and extreme maximum temperature of 36–37 °C. Annual precipitation is 900–1100 mm. The mountainous warm-temperate, normally humid climate zone, includes shallow mountain areas of 800–1400 m. The average annual temperature is 9.7–13.3 °C, with extreme minimum temperatures of −15–11 °C and precipitation of 1300–1500 mm. The soil of the Nanzheng District is 82.4% yellow-brown loam and 15.7% rice soil, with brown loam, silt loam, and tidal loam accounting for 1.04%, 0.5%, and 0.3%, respectively. In the 1980s and 1990s, the city of Hanzhong conducted afforestation by aerial seeding to rapidly restore its barren hills. At that time, a large number of horsetail pine forests remained in the scenic area, due to the establishment of the scenic area; only the Qingchi Mountain area is relatively intact, while nearby areas are patchy. The South Lake Scenic Area is located in the shallow hilly area at the edge of the northern foothills of Bashan Mountain, which has undergone a period of aerial-seeded afforestation. The scenic area continues to protect regional ecological biodiversity [19]. A large amount of arable land and area under villages remains in the scenic area, and it is interspersed with human footprints (fields, buildings) that are inconsistent with its protective intent.
2.2. Data Sources
In this study, we had to consider the influence of weather conditions such as clouds, dust, and seasonal disparity of vegetation growth in Hanzhong City. Landsat (5/7/8) series satellite image data (resolution: 30 m) with 0%–10% cloudiness and good impact quality without anomalies were selected to represent three growth periods (30 July 2000, 23 May 2010, and 3 June 2020). The 30 m DEM ground cover data, the administrative boundary map of the South Lake Scenic Area, and other remote sensing and vector data were obtained from the Geospatial Data Cloud (www.gscloud.cn accessed on 30 September 2021.) of the Network Information Center of the Chinese Academy of Sciences. The GlobeLand 30 dataset (which includes ten main land cover types, among which the Nanhu scenic area occurs with cultivated, forest, grassland, and water cover) and Forest Management Inventory data (land type area, forest area, forest phase map, forest distribution map, and other data) were obtained from Shaanxi Forestry Survey and Planning Institute, and the rest of the information were obtained from field survey data (in order to ensure the accuracy of the data, we conducted a field study in the South Lake Scenic Area in order to understand the current status of the landscape. The authors investigated the basic data of dominant species, age group, canopy coverage, and diameter at breast height in 2020 and 2021, respectively, as well as the published literature.
2.3. Data Analyses
2.3.1. Construction of Degradation Assessment System DTP
Forest degradation is manifested by a reduction in forest area and loss of structure, quality, and function [12]. This definition of degradation, combined with the development needs of the South Lake scenic area and data acquisition of South Lake, guided our pursuit of five principles of the evaluation system (wholeness, indicator generality, indicator dynamism, combinations of qualitative and quantitative indicators, hierarchy of evaluation indicator system) [15,20,21], and a combination of remote sensing interpretation with in situ surveys to construct a three-dimensional DTP (degree, trend, and pattern) (Table 1).
The degree of productivity in degraded forests is difficult to assess in the context of ecological management. However, increasing human-caused degradation can be identified at the stand or landscape level by the sequential decrease in the distribution of number, density, or size classes in the forest over time or departure from a defined point [22]. Fraction of vegetation coverage (FVC) refers to the percentage of the vertical projection area of vegetation (stems, branches, and leaves) on the ground to the total area of the statistical area, which can directly reflect the vegetation coverage in a certain area [23]. Spatial and temporal differences of FVC can reflect the degree of restoration or degradation of regional ecosystems [24]. FVC inversion using a pixel dichotomy model based on NDVI data is a common inversion method [25].
Trends in degraded forests are caused by both natural and human factors, but are dominated by anthropogenic pressure [12]. The study of land cover change under intense human disturbance in the South Lake Scenic Area landscape is useful to identify changes in forest degradation trends. Spatial and temporal trends can be assessed visually using land cover change maps.
The study of forest landscape patterns is useful to identify the function and structure of regional forest ecosystems and their interactions. This is significant to guide the conservation of forest resources and ecosystem services [26].
2.3.2. Degradation Degree
- 1.
- FVC (Fraction of vegetation coverage) calculation
The NDVI (normalized difference vegetation index) was calculated after preprocessing the Landsat remote sensing data with ENVI5.3 for radiometric calibration and atmospheric correction. The calculation formula is:
where NIR is the NIR band value of Landsat 5, 7, and 8 remote sensing images (Band 4 for Landsat 5/7 and Band 5 for Landsat 8); R is the IR band value of Landsat 5, 7, and 8 remote sensing images (Band 3 for Landsat 5/7 and Band 4 for Landsat 8) [27]. The NDVI algorithm takes advantage of the fact that green vegetation reflects less visible light and more NIR, while sparse or less green vegetation reflects a greater portion of the visible and less near-IR [28].
The pixel with FVC contains the fraction of spectral data of vegetation. The linear relationship between NDVI and FVC was used to model the extraction of regional FVC by creating a transformation relationship. The expression of the pixel dichotomy model (PDM) is:
where NDVIVeg demonstrates the NDVI of the vegetation and NDVISoil demonstrates soil.
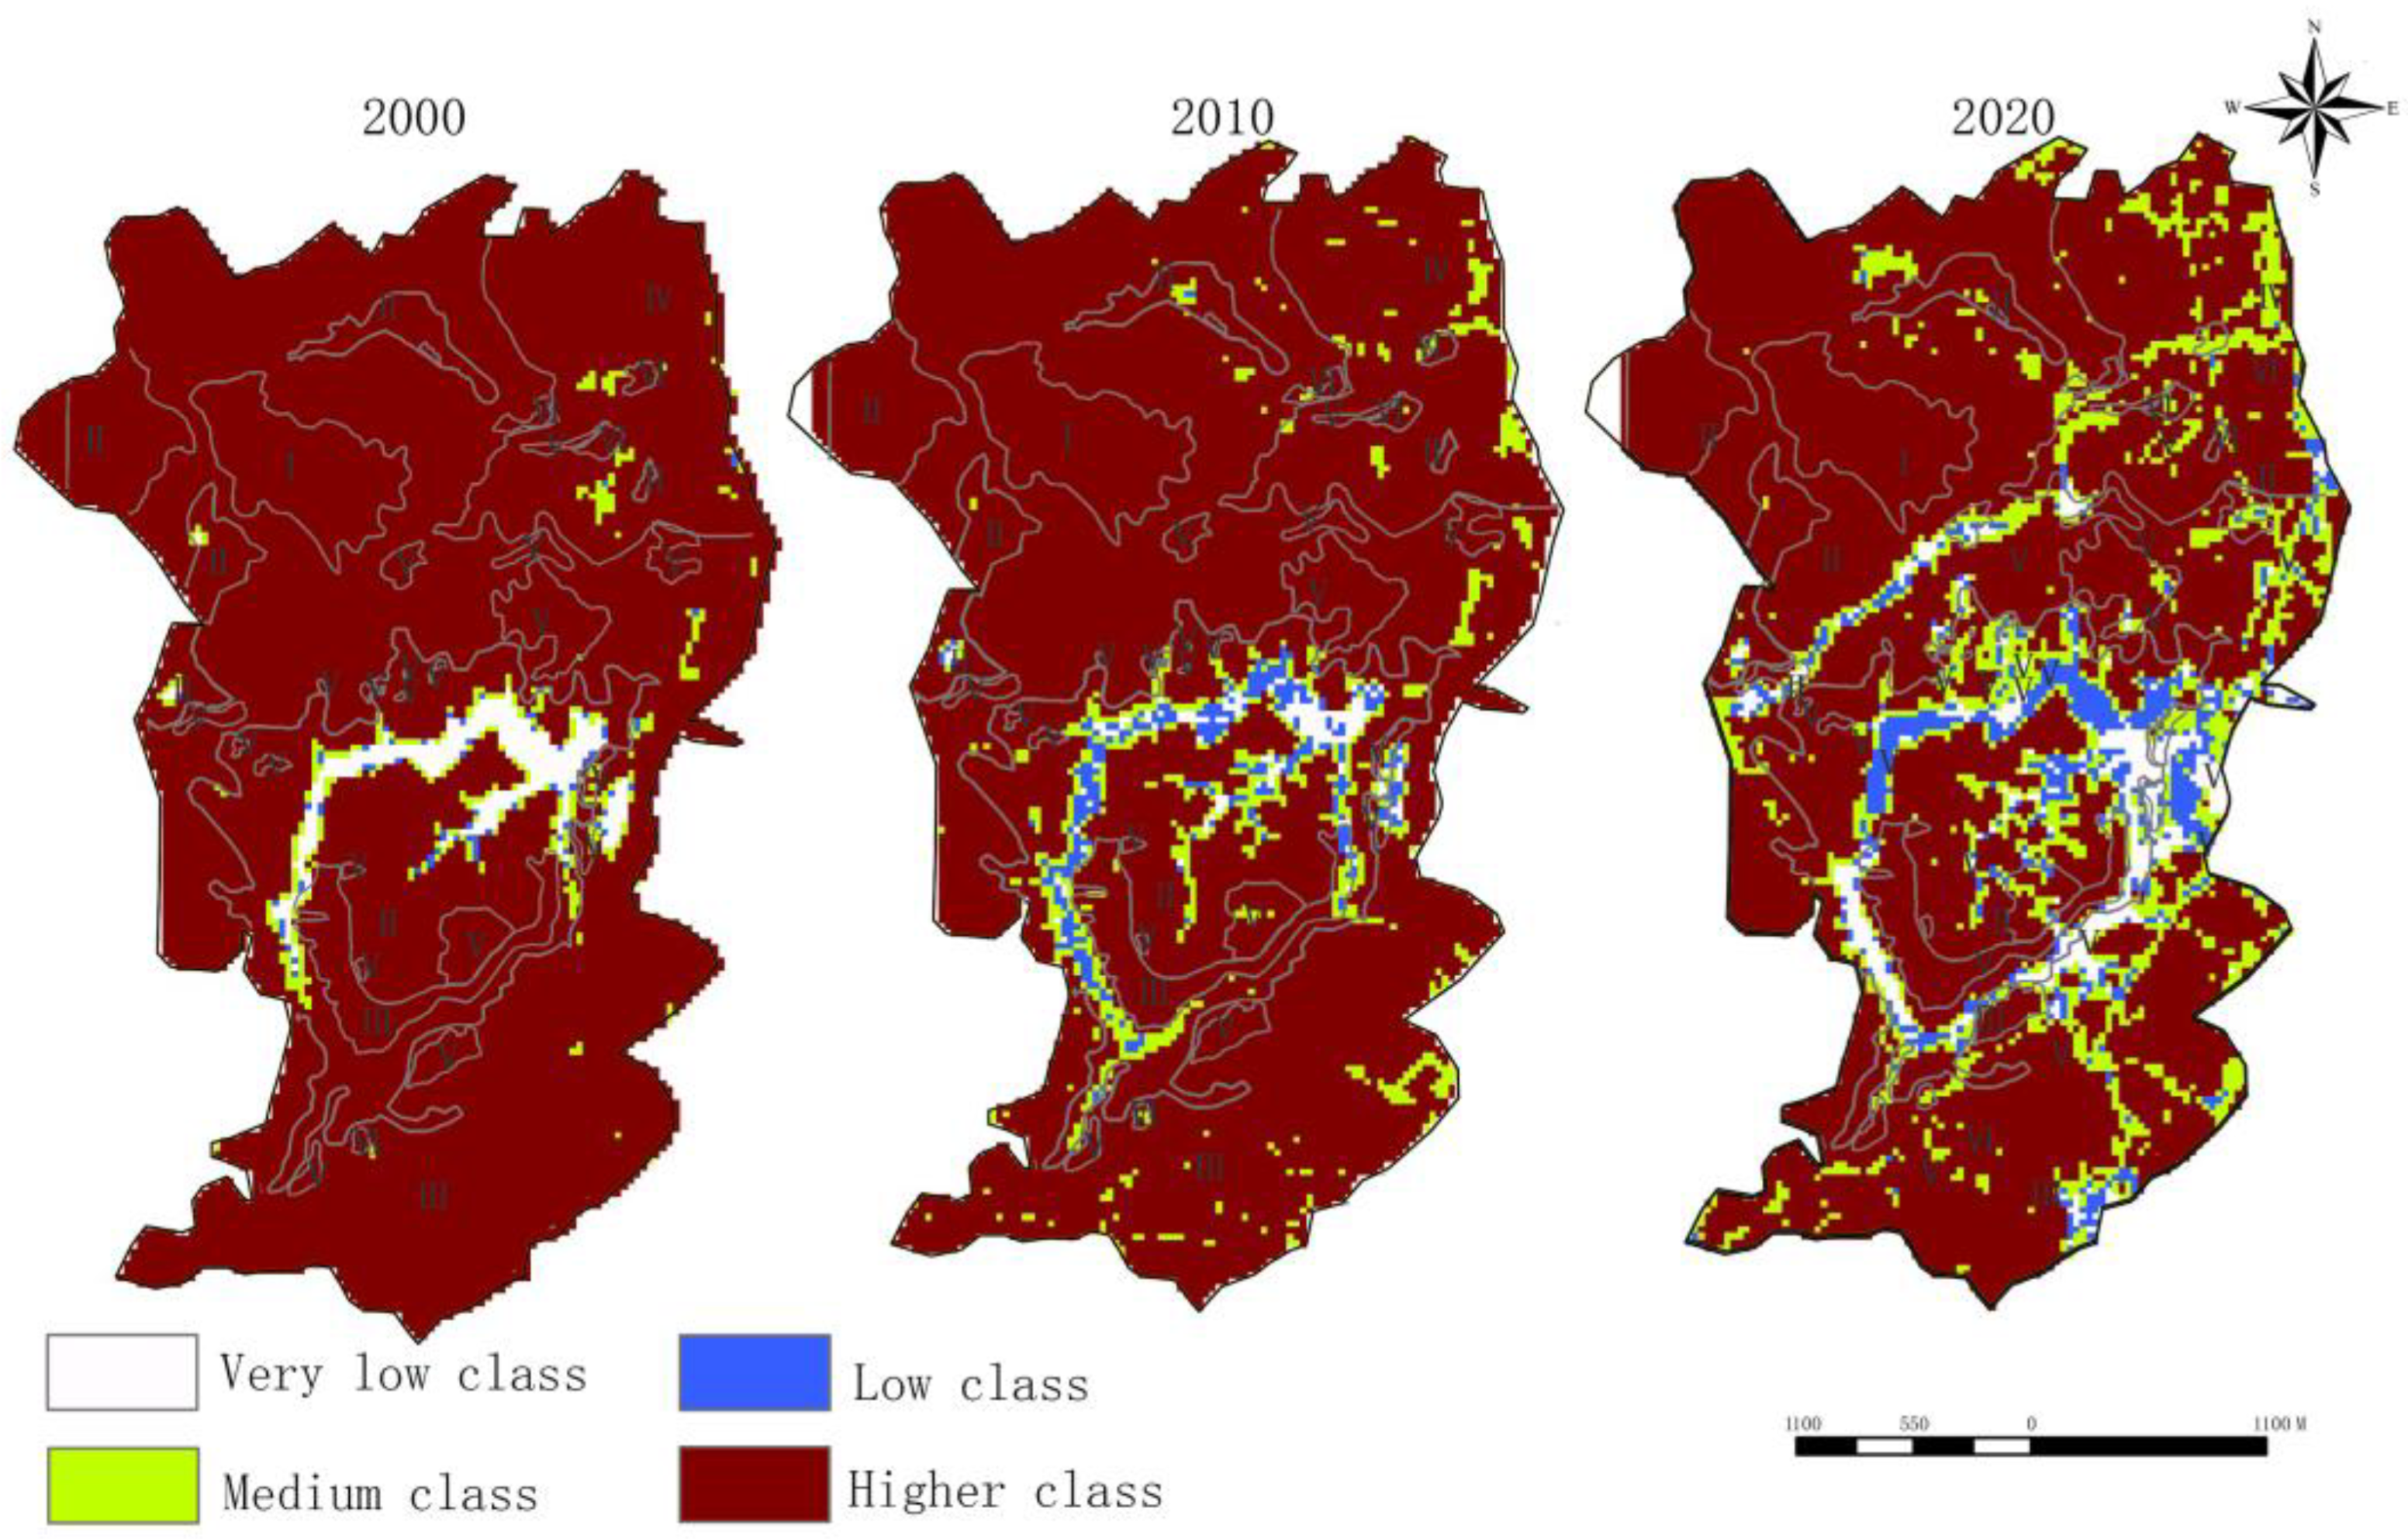
The analysis of theoretical methods of vegetation cover estimation suggests that NDVISoil and NDVIVeg should be given values of 0 and 1. However, in reality, due to the interference factors, their values will have small but unknown fluctuations. Based on this, a cumulative 2% was selected as NDVISoil and 98% as NDVIVeg. To date, there has been no unified grading threshold standard found for vegetation cover, so we adopted the threshold value of FVC according to the national Technical Regulations of Land Use Status Survey, Technical Regulations of Grassland Resources Survey, and the Classification and Grading Standard of Soil Erosion promulgated by the Ministry of Water Resources combined with the unique ecological characteristics of vegetation growth in the study area. The threshold segmentation of the FVC was carried out using FVC threshold partitioning, divided into four classes from a traditional classification method (Class I [0, 20%], Class II [20%, 30%], Class III [30%, 60%], and Class IV [60%, 100%]), divided into very low, low, medium, and high class, respectively [29].
- 2.
- Image map difference comparison method
To reveal the spatial variation of vegetation cover in the South Lake Scenic Area over time, the difference comparison method of image maps was used to calculate the amount of vegetation cover change (ΖFVCg) with the different range in [−1, 1]. The calculation equation is:
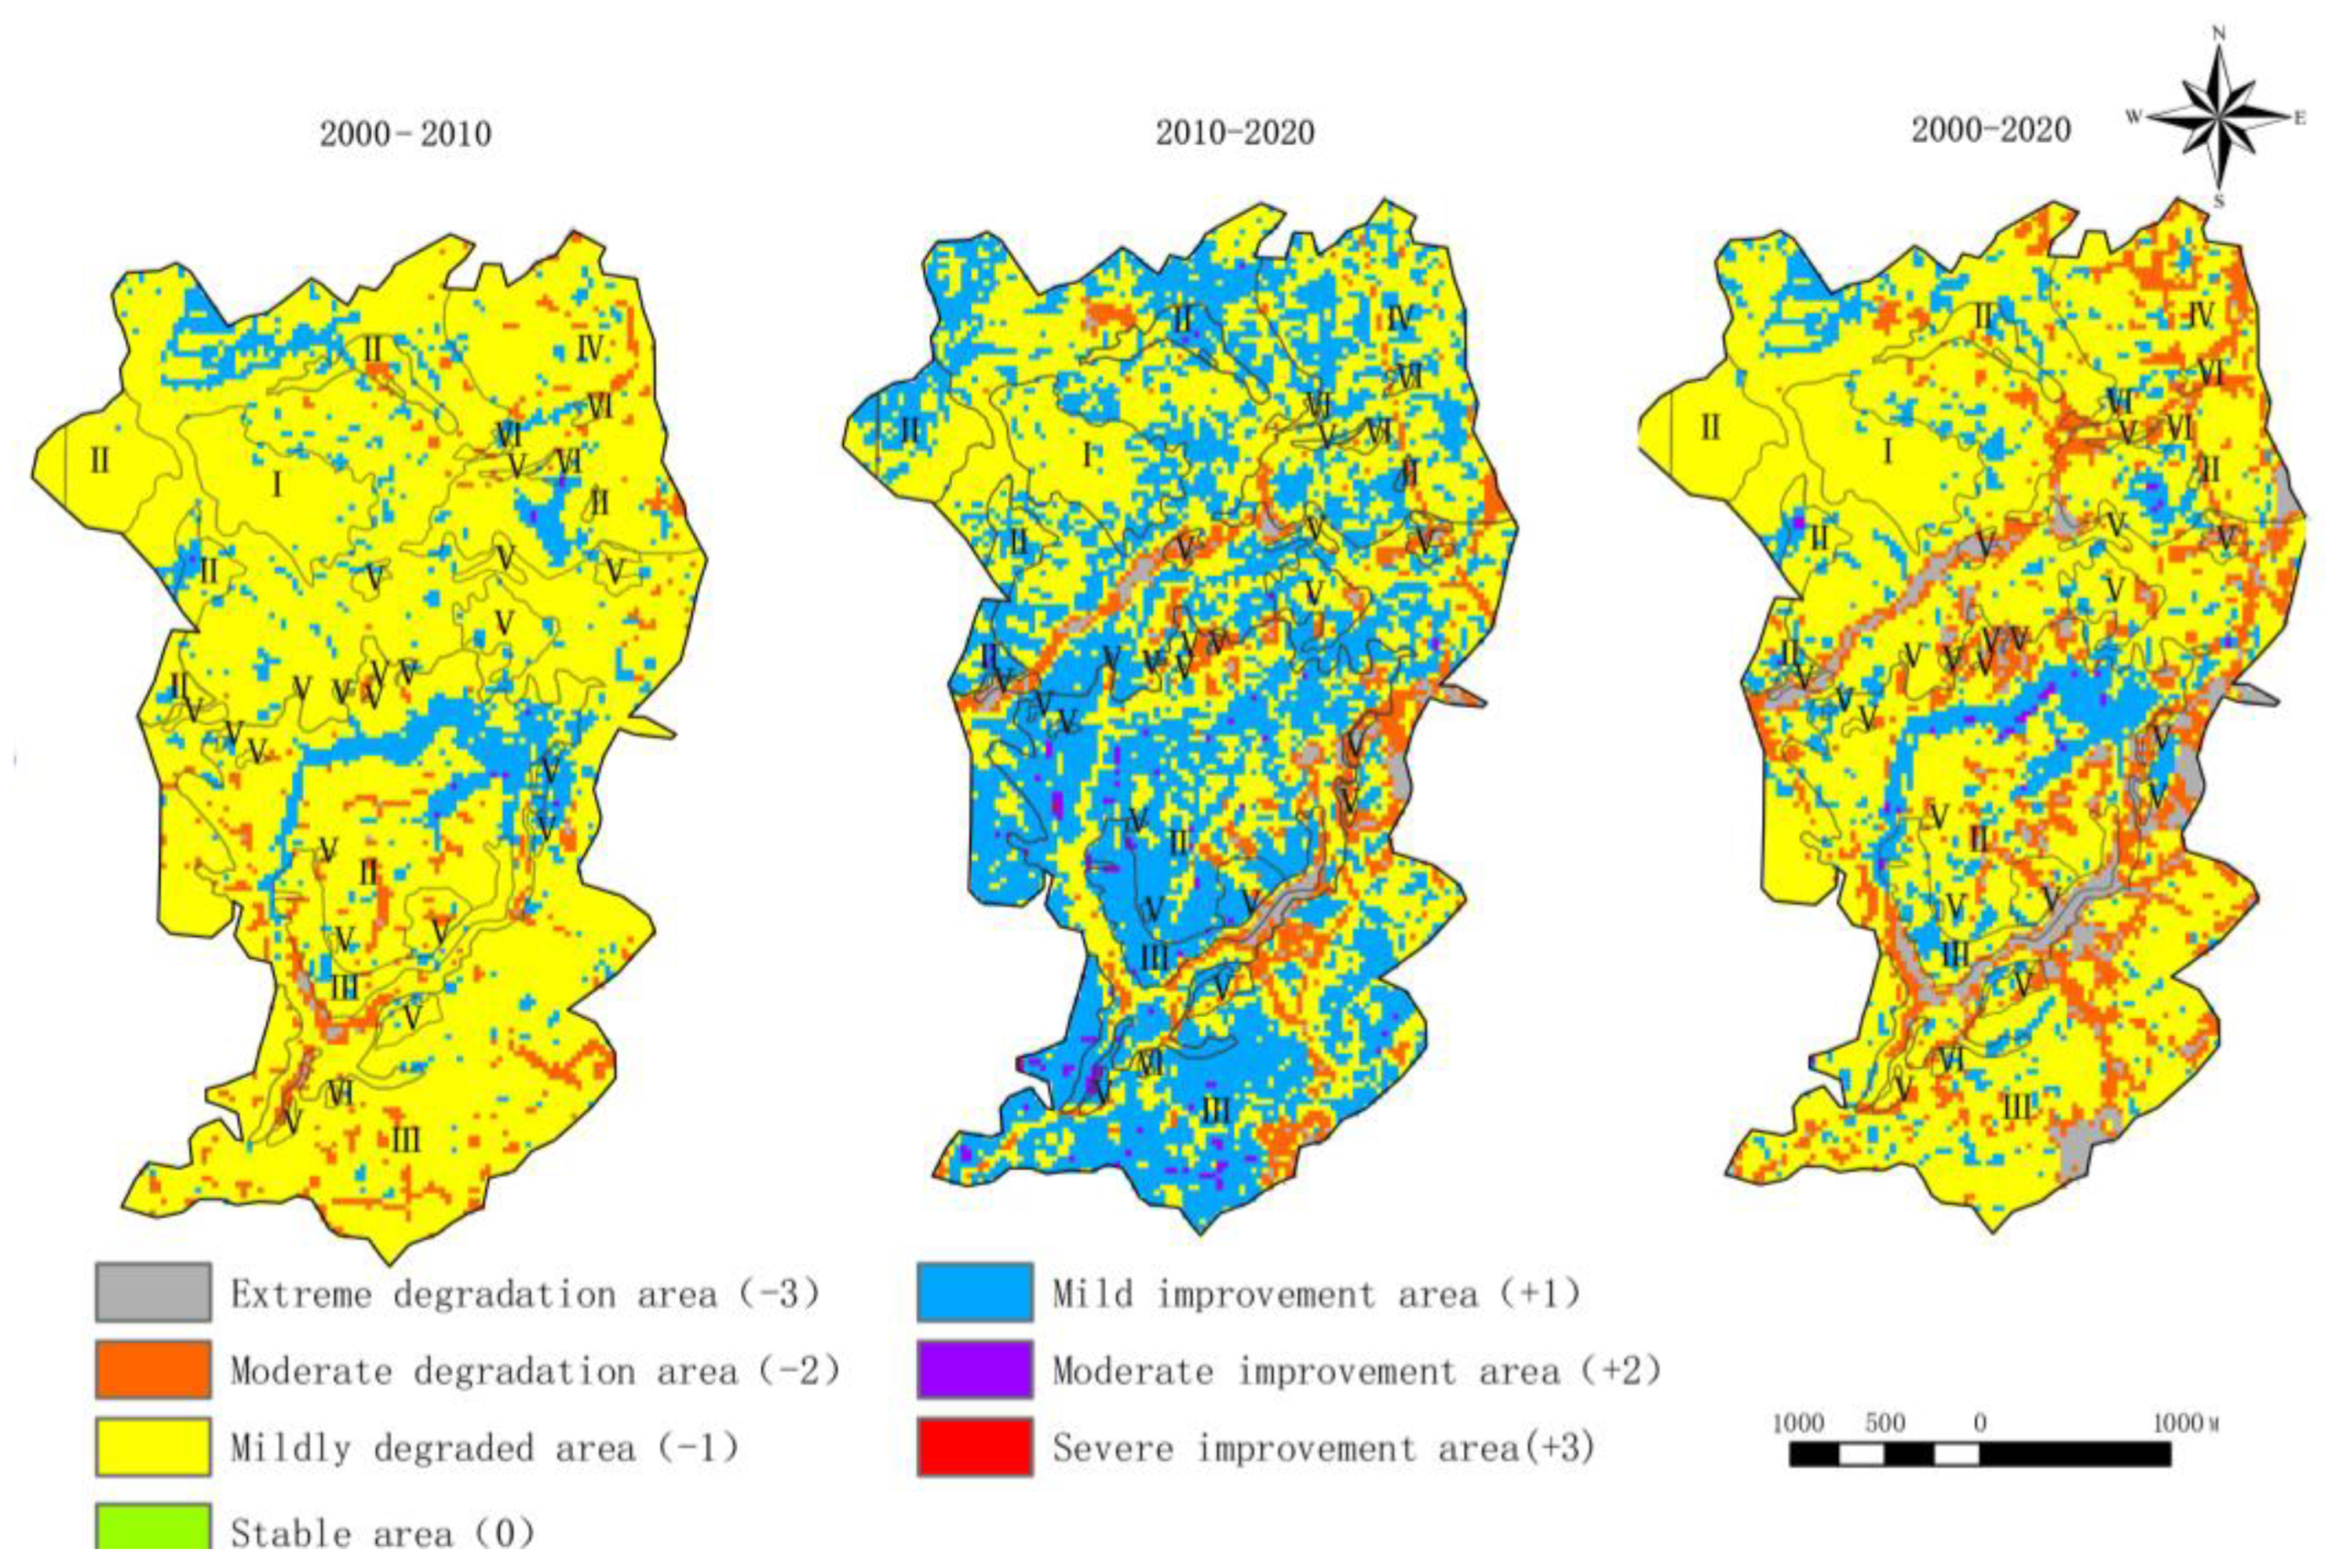
where ΔFVCg_t2 and ΔFVCg_t1 are the raster data of vegetation cover classes corresponding to two different periods in the study area, and the amount of change is divided into vegetation cover increase (+), decrease (−), and no change (0), where the increase zone is divided into the extreme improvement zone (+3), with a threshold range of (0.66 > ΔFVCg > 1); the moderate improvement zone (+2); and the decrease zone (+1), with a threshold range of (0 > ΔFVCg > 0.33). With a threshold range of (0.33 > ΔFVCg > 0.66), the mild improvement zone (+1) has a threshold range of (0 > ΔFVCg > 0.33). The decreasing zone is divided into the mild degradation zone (−1), with a threshold range of (0 > ΔFVCg > −0.33), the moderate degradation zone (−2), with a threshold range of (−0.33 > ΔFVCg > −0.66), the extreme degradation region (−3) with a threshold range of (−0.66 > ΔFVCg > −1).
2.3.3. Degradation Trend
- Land cover change
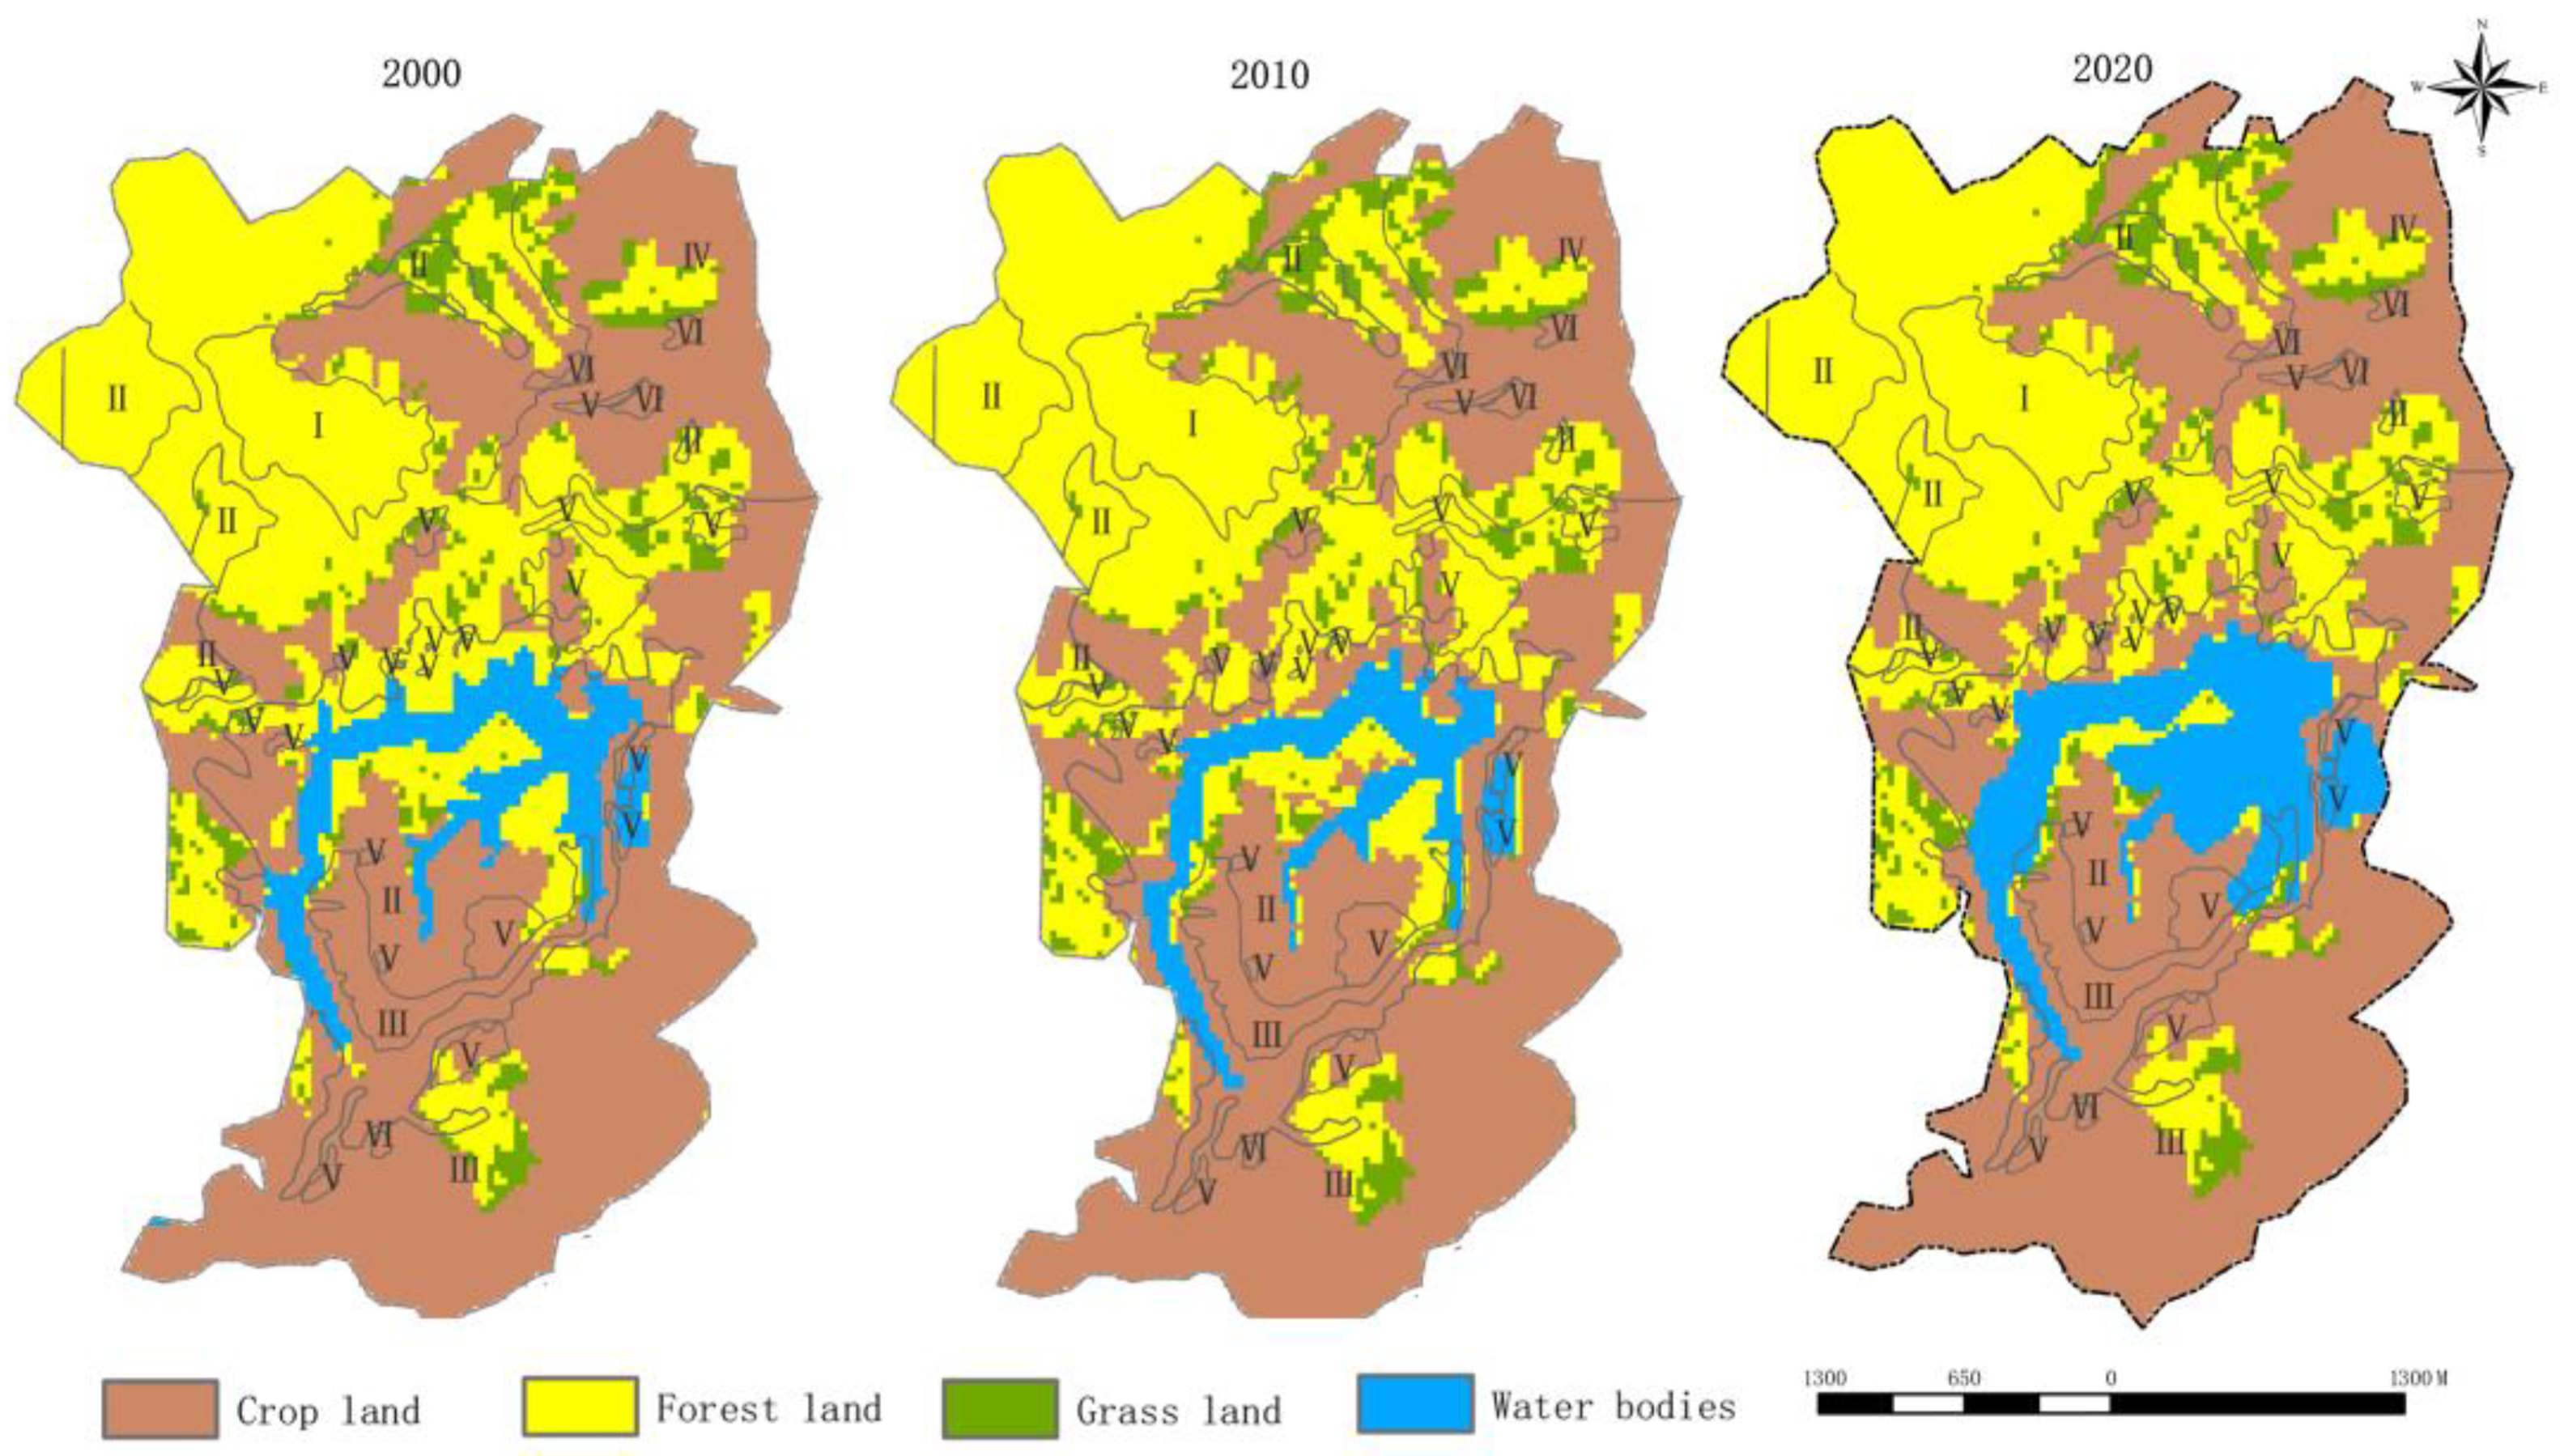
The 30 m global land cover data GlobeLand30 dataset contains ten major land cover types, four of which fall in the South Lake Scenic Area: arable, forest, grass, and water. Based on the land cover map in 2020, the land cover change map of the South Lake Scenic Area was obtained by combining Sky Map, BIGEMAP, and field surveys for comparison.
- 2.
- Land cover transfer matrix
The land cover transfer matrix can characterize the spatial and temporal change among cover types in the study area over different periods of time and is a common method for analyzing landscape change [30].
2.3.4. Degradation Pattern
Landscape pattern analysis refers to analysis of the structural composition characteristics and spatial configuration relationships of the landscape [31,32,33]. In this study, based on the ArcGis-processed surface cover of the South Lake Scenic Area, 11 landscape evaluation indices (Table 1) such as patch density, dispersion, and disaggregation indices of the overall landscape and each type among periods were analyzed using Fragstats 4.2 landscape pattern analysis software.
3. Results
3.1. Status of Vegetation Communities in South Lake Scenic Area
All analyses are of data of the Forest Management Inventory in the study area, a forest dominated by Masson Pine, fir, oak, and other hardwood tree species plus eight sub-dominant categories (Figure 2, Table 2). The Masson Pine species accounted for 89.41% of the study area, with an age near or at mature, average diameter at breast height (DBH) of 14.8 cm, and canopy coverage between 0.55–0.8. Other hardwood species and oak accounted for 5.88% and 2.9%, being mid-aged, with average DBH of 16cm and 10.9cm, and canopy coverage of 0.4–0.6, 0.3–0.6, respectively. The remaining four types of dominant species accounted for only 1.81% of all forests in the study area.
Total forest species richness decreases significantly with increasing successional age. Masson Pine in the region was as high as 89.41%, which was related to the species selection of aerial-seeded afforestation in Hanzhong City. Masson Pine is highly adaptable, endures drought, tolerates barrenness, and is the main species for aerial-seeded afforestation in southern China, an effective means of rapid revegetation [34,35,36]. The whole area is sparsely forested, and the phenomenon of “It is green from a distance, but it is found to be soil erosion from a closer look” is remarkable [37]. The community structure is simple—only Masson’s pine population is distributed in the upper layer, with almost no clear sublayer. Soil erosion through rainfall runoff increases year over year, which inhibits microbial activity that can destabilize the already damaged soil ecosystem, increasing the rate of soil degradation [38]. The horsetail pine forest canopy line phase (single, seasonal) is not species-rich. Thus, the impact of human activities reduces the natural landscape protection function. This suggests that it is difficult to form a stable and diverse plant community in the short term. New species gradually appear, and at South Lake, “for 4A scenic area, strong cultural and tourism industry” development goals are inconsistent with restoration goals. (4A scenic area refers to one of the scenic spot levels according to the quality standards of tourist attractions of the People’s Republic of China).
3.2. Degradation Degree of Plant Communities in South Lake
The FVC of the South Lake Scenic Area was calculated using ENVI5.3 and Arcgis10.4 for three different periods with the NDVI-based dimidiate pixel model. Combined with its unique growth characteristics, an image threshold segmentation was carried out to obtain the spatial pattern distribution of vegetation cover in in three different periods in 2000, 2010, and 2020 (Figure 3). The overall vegetation in the South Lake Scenic Area in 2000–2020 was dominated by high classes; the medium and low classes were centered on the scenic tour area and scenic restoration area, with a small scattered distribution, and spread to the surrounding area over time (Figure 3).
In order to further reveal the dynamic change degree of FVC in the South Lake Scenic Area from 2000 to 2020, the DN (digital number) difference value of image elements was calculated using remote sensing image differencing. A positive DN difference value of image elements indicated an increase in the FVC area (+), a negative value indicated a decrease in the FVC area (−), and a zero value indicated a constant FVC area (0).
The area of degraded vegetation cover in the South Lake Scenic Area in the three periods was significantly larger than in the improved area. The overall area was dynamic, with little stability. Improved areas were concentrated in the scenic tour area extended in all directions, while some were found in other functional areas. The degraded areas are dominated by high vegetation cover, while the improved areas are dominated by medium and low vegetation cover. The area of reduced vegetation cover is larger than the area of increased vegetation cover during 2000–2020, among which the area of lightly degraded area is largest and much larger than that of the lightly improved area (Figure 4). The area of increased vegetation cover increased during 2010–2020, among which the lightly improved area is mainly a scenic tour area and scenic restoration area in a large area. The area of vegetation cover from 2000 to 2020 did not differ from that in 2000 to 2010. The area of extremely degraded areas and moderately degraded areas in each functional area clearly increased from 2000 to 2020. Overall, the degradation of vegetation cover in the South Lake Scenic Area intensified.
3.3. Degradation Trend of Plant Communities in South Lake
Tracking the land cover over three periods (Figure 5), ArcGIS was used to calculate changes in cultivated land, forest, grassland, and water bodies in the South Lake Scenic Area by reclassification and raster calculation (Figure 6). The amount of change among time periods varied; the area of land cover types is generally unchanged, the scenic tour area changes the most with the most significant changes the increase in the water reservoir area in forest area. During two time periods, the decrease is greater than the increase and the magnitude of the decrease is expanding, which appears to be related to aerial afforestation methods and subsequent construction. There was a very small increase in the special protection area, and each of the remaining functional areas either increased or decreased; none remained unchanged.
We calculated the area and proportion of various landscape type transformation among periods based on South Lake land cover data (Table 3 and Table 4). Transformation of forest land to cropland was nearly 1.6% more in 2010 compared to 2000 than from cropland to forest land. The transformation of forest to water was nearly 6.9% less than the transfer of water to forest, but the overall area of forest land was still reduced. The area of cropland increased and the area of water declined, which is largely related to the anthropogenic interference in the South Lake Scenic Area. During 2010–2020, the change of forest to cropland was nearly 0.6% more than the transfer of forest to crop. The change in area of forest to grassland was 34.1% less than the transformation of grassland to forest. The transformation of forest to water was 4.9% more than the transfer area of water to forest, which was highest proportion of all changes. From 2010 to 2020, the change was higher than the changed area of forest to nonforest from 2000 to 2010 year over year, and the forest land area was significantly reduced during 2010–2020.
3.4. Change in Landscape Pattern Index
The landscape pattern index of the forest was calculated at two scales: class (each particular patch type) and landscape (mosaic of patches as a complete unit) level (Fragstats 4.2 landscape pattern analysis software), using the landscape type raster of South Lake Scenic Area for eleven periods (2000–2020) as the base data.
The landscape level of the South Lake Scenic Area demonstrates (Table 5) that it can be seen that the patch density (PD) in the study area tends to decrease, and the overall heterogeneity of the landscape is low; the contagion index (CONTAG) tends to increase, then decrease and then continue to increase, and the patch connectivity of the various landscape types in the study area is in a state of flux; the interspersion and juxtaposition index (IJI) is low and connected to only a few other landscape types; the landscape DIVISION index as a whole is on the medium-high level and increases year by year, and the degree of segmentation and fragmentation in patches in scenic spots increases year by year; the SPLIT index is a trend of first decrease, then increase, and then decrease. During the period from 2010 to 2014, the separation degree between patches increased and the landscape was broken into smaller patches; the Shannon diversity index (SHDI) indicates that the land use is abundant, and the fragmentation degree is at a medium-high level. The Shannon evenness index (SHEI) is low and the landscape pattern is even.
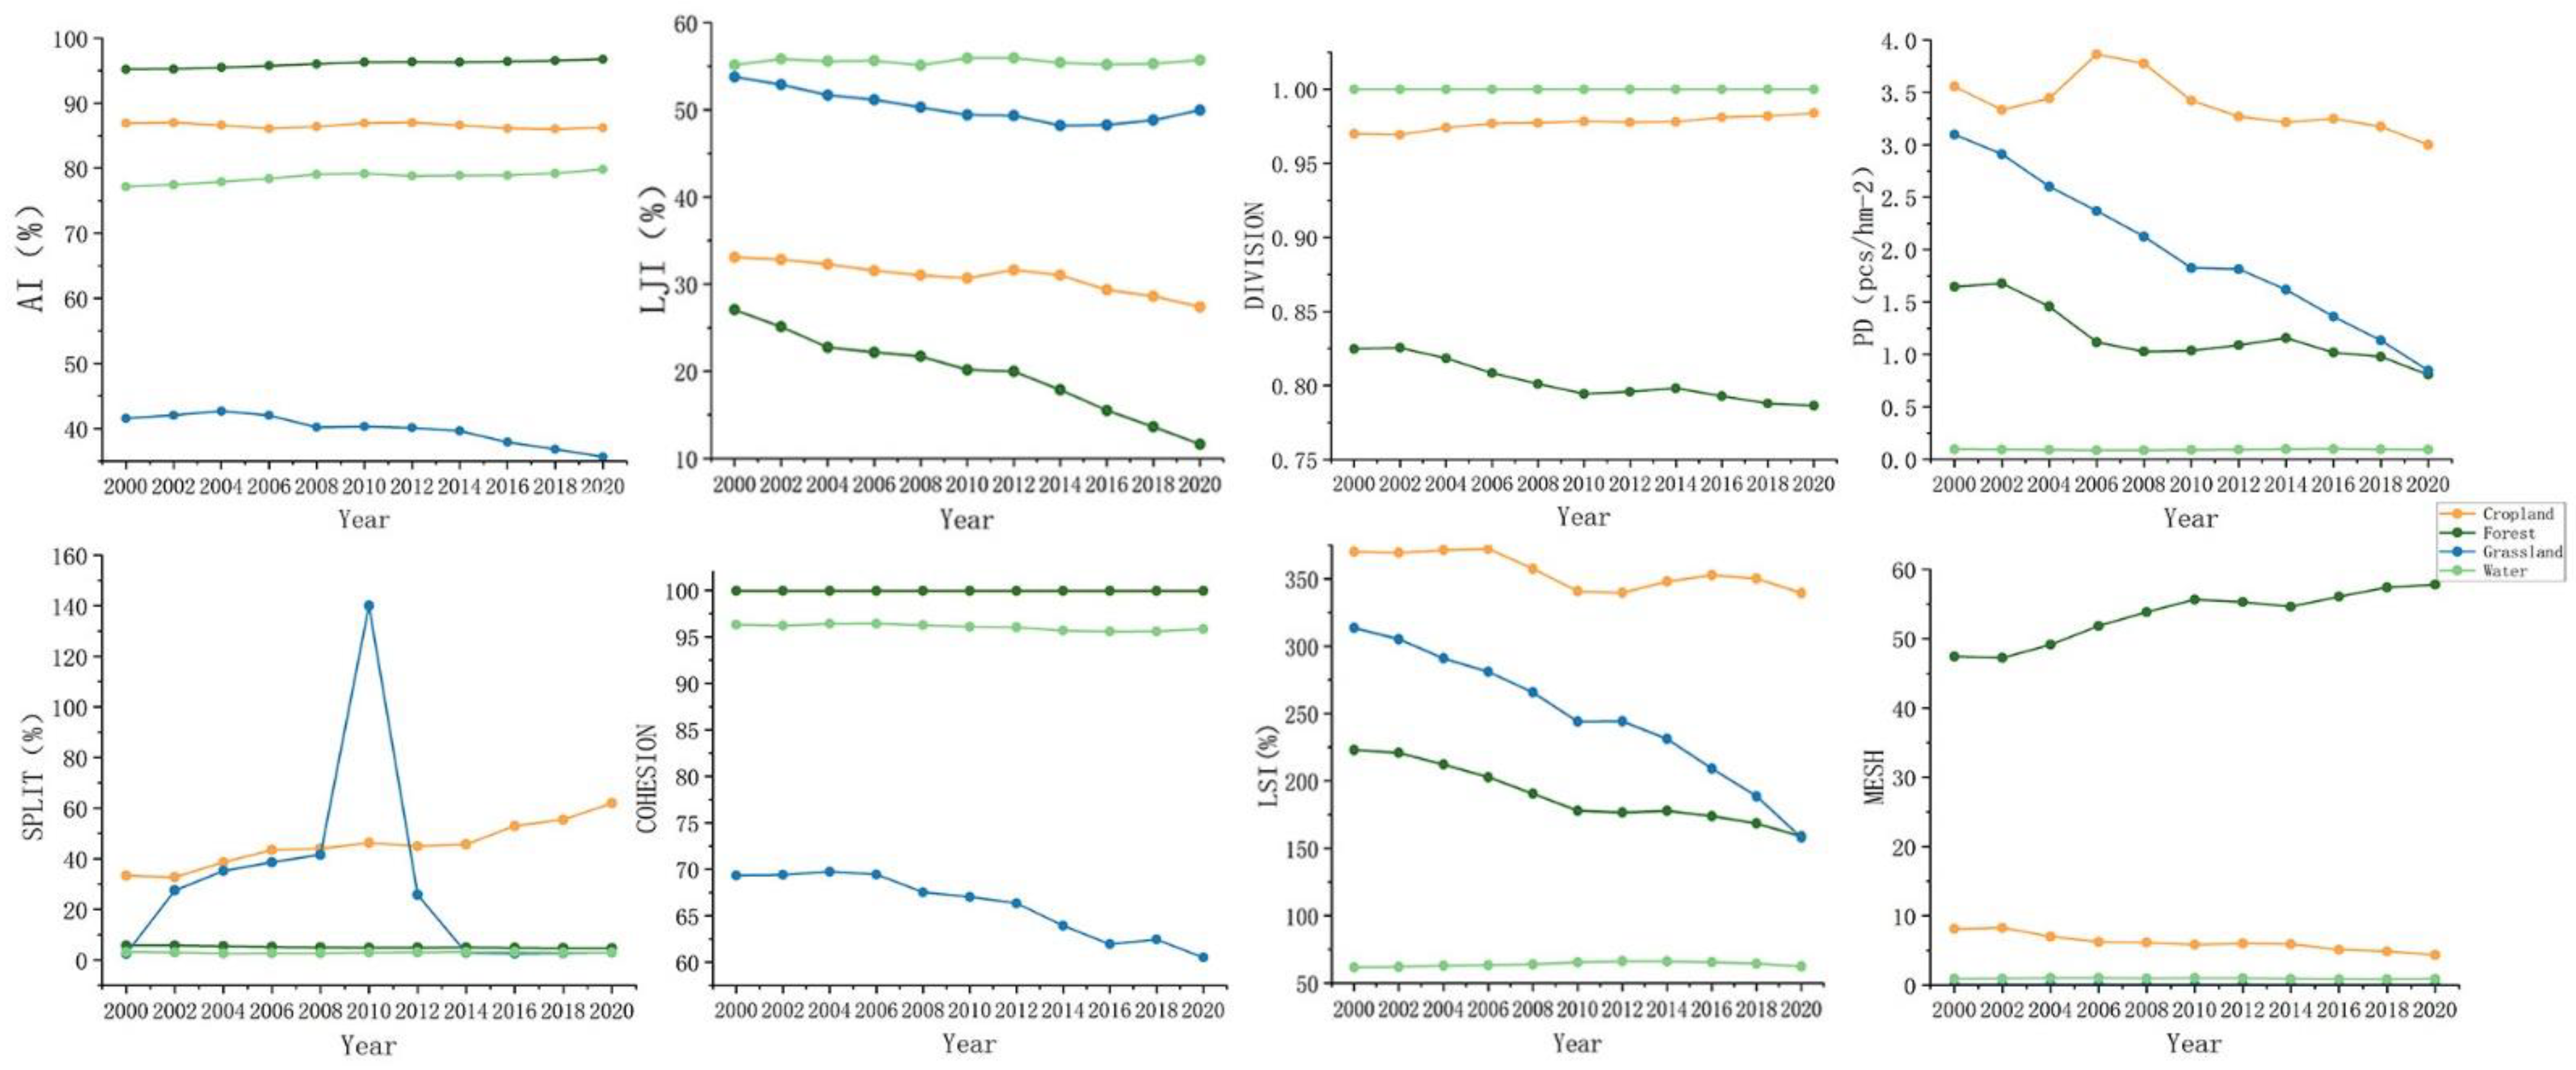
At the class level (Figure 7). In the last 20 years, the forest patch density (PD) monotonously decreased and the effective mesh size (MESH) monotonously increased in the Nanhu Scenic Area. During the period of 2010–2020, the forest patch was subjected to human intervention, which made the shape tend to be simple, and the ecological vulnerability increased. The overall landscape shape index (LSI) showed a decreasing trend; the SPLIT index of forest land was at a low level; the aggregation index (AI) and patch cohesion index (COHESION) did not change much, but remained at a high level. The results showed that the forest land showed a clustered distribution, and the landscape division index (DIVISION) of the forest land monotonously decreased. Although it was lower than the other three categories, it was still at a higher level, indicating that the whole forest land was scattered and the ecological vulnerability was greater. The interspersion and juxtaposition index (IJI) decreased year after year, which indicated that forest land formed the dominant landscape.
4. Discussion
Through the assessment of forest degradation in the South Lake Scenic Area using DTP, the degradation of FVC has intensified, with high-class FVC declining over time and extremely degraded areas increasing. The total woodland area has decreased significantly, and the degradation trend is clear. The degree of landscape fragmentation is high, and thus connectivity has declined. The forest degradation degree, trend, and pattern is significant in the South Lake Scenic Area. The Masson pine natural succession process is slow, making it difficult to “fix water and protect the source”.
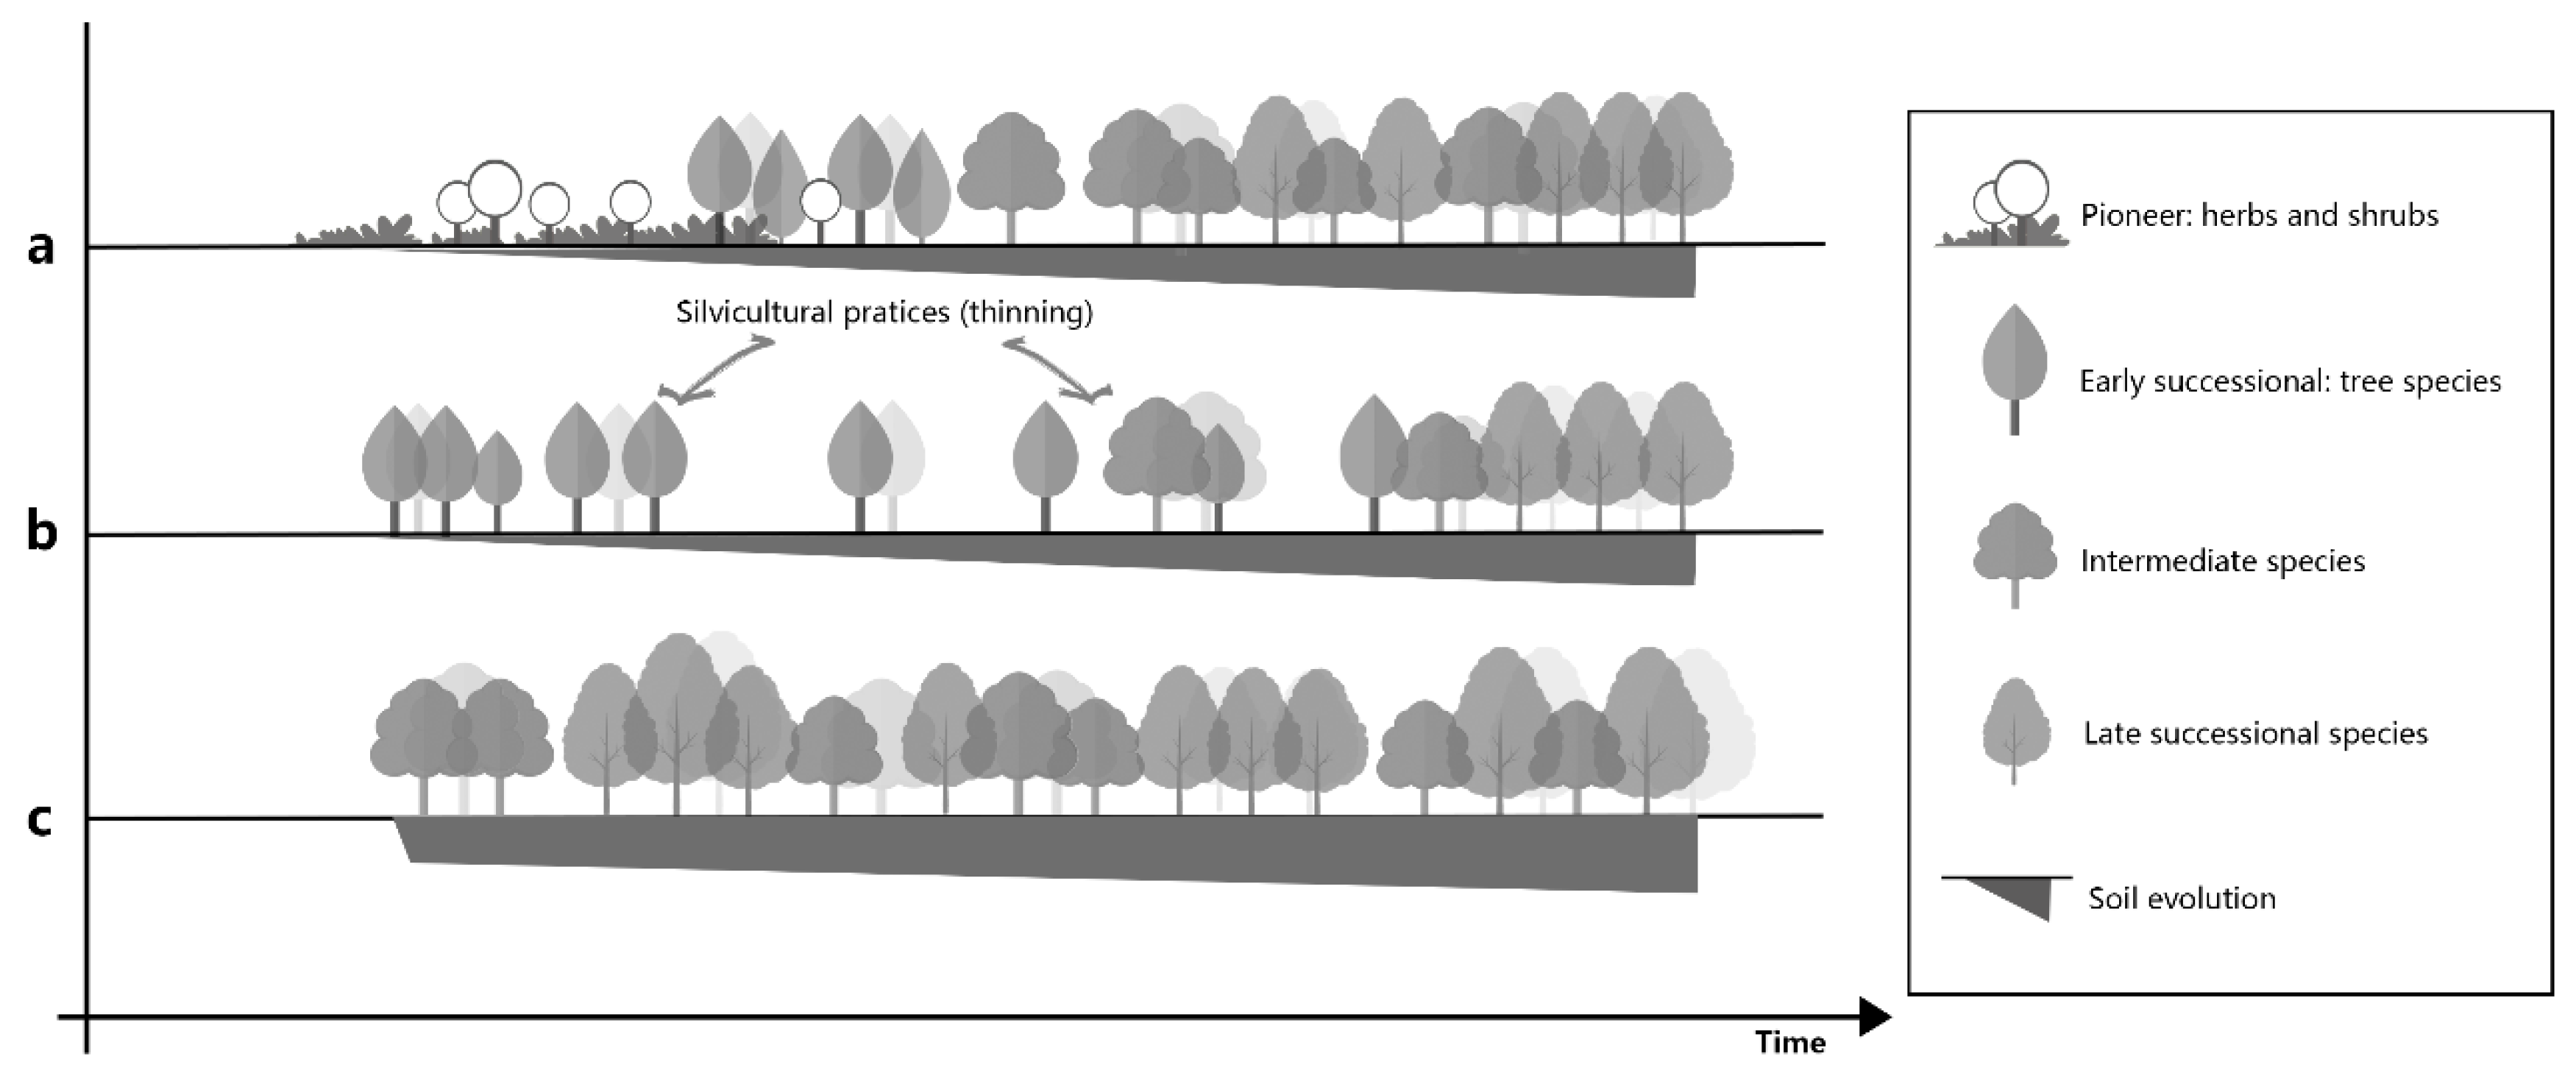
The essence of landscape conservation is to protect the integrity of the natural environment [39], based on the conservation of ecological value as a landscape resource and the identification and valuation of their landscape components. Restoration ecology is dedicated to improving and reconstructing degraded natural ecosystems, reusing them for their functional role, and restoring their biological potential [40]. Currently, most forest restoration methods are based on the principle of natural succession from pioneer plants gradually changing late successional communities, a process that usually takes a long time (Figure 8a). Using a traditional reforestation method, the natural succession process is accelerated by introducing intermediate species [10] (Figure 8b). The silvicultural method, created and named after Professor Akira Miyawaki of Yokohama National University in Japan, is based on the theoretical basis of potential vegetation and succession theory [41]. It reduces the succession time for covering the bare ground and forming plant communities in silvicultural spaces to 3/5–4/5 of that of natural communities. The results obtained by applying the Miyawaki method at about 550 sites in Japan, as well as in Malaysia, Southeast Asia, Brazil, Chile, and some areas of China, have been promising in severely degraded areas [42] (Figure 8c). In this study, by combining the Miyawaki silvicultural method and intermediate cuttings (Figure 9), monitored through a vegetation survey of the Nanhu Scenic Area and Micang Mountain Nature Reserve, we selected the dominant tree species, collected seeds and seedlings, and conducted interlogging, land preparation, and tree planting. The saplings are then left to compete naturally, and through elimination, eventually form a stable community.
The theory of vegetation ecology suggests that the forest vegetation in an area is the result of the action of integrated ecological factors such as climate, geomorphology, and soil. Using the Miyawaki afforestation method, the Micang Mountain Nature Reserve (site B), selected as our target community, and which is in the same area as South Lake (site A), has 14 tree species in the Masson pine community, with an importance value of 65.38% for Masson pine and a more stable stand structure (Table 6). Thirty-two species in the shrub layer, rich in species, were found to have a tendency to evolve to mixed coniferous and broad-leaved forests and some self-renewal capacity. The herbaceous layer has 16 species, a high degree of canopy coverage, a warm and humid climate, and shady understory species [43,44].
Restoration of ecological functions of landscapes in the landscape is urgent, determined by the degree of degradation, biodiversity loss, and ecosystem services [45]. Combining the current situation and the urgency of ecological restoration in the scenic area, an expedient starting point is to protect a large area of the current horsetail pine community and its ecological service functions. This should be followed by a systematic restoration of the woodland cover, scale, species, pattern, and other ecological processes to improve the stability, self-healing ability, and ecological diversity of the ecosystem. This will serve to improve the support and service functions of the ecosystem—the “one center, two belts” forest phase renewal strategy (Figure 10). “One center” refers to maintaining the top of the mountain in its original state—ecological forestland protection. The “two belts” are restoration and transformation in “two zones” (restoration and transformation), which comprise ecological forestland restoration and forest landscape creation. The process includes “one heart”, based on the theories of natural succession and moderate disturbance to transplant areas of Sargassum pine in the forestland to form a forest window, relying on natural forces to achieve positive community succession and form the ecological background of the landscape.
Applying the principle of minimal intervention, the trees are only transplanted in phases to form the forest windows without any other treatment, and community renewal is achieved by natural forces. Transplanting trees accelerates endogenous succession and changes in light, temperature, humidity, and soil physical and chemical properties, as well as promotes the natural renewal of the community. Alternatively, because ecologically protected forestlands and ecologically restored forestlands are a mosaic of connected and proximate patches, the continuous restoration of recovering forestlands will accelerate species dispersal with wind, insects, decomposers, and consumers. This will provide new impetus for the succession of ecologically protected forestlands.
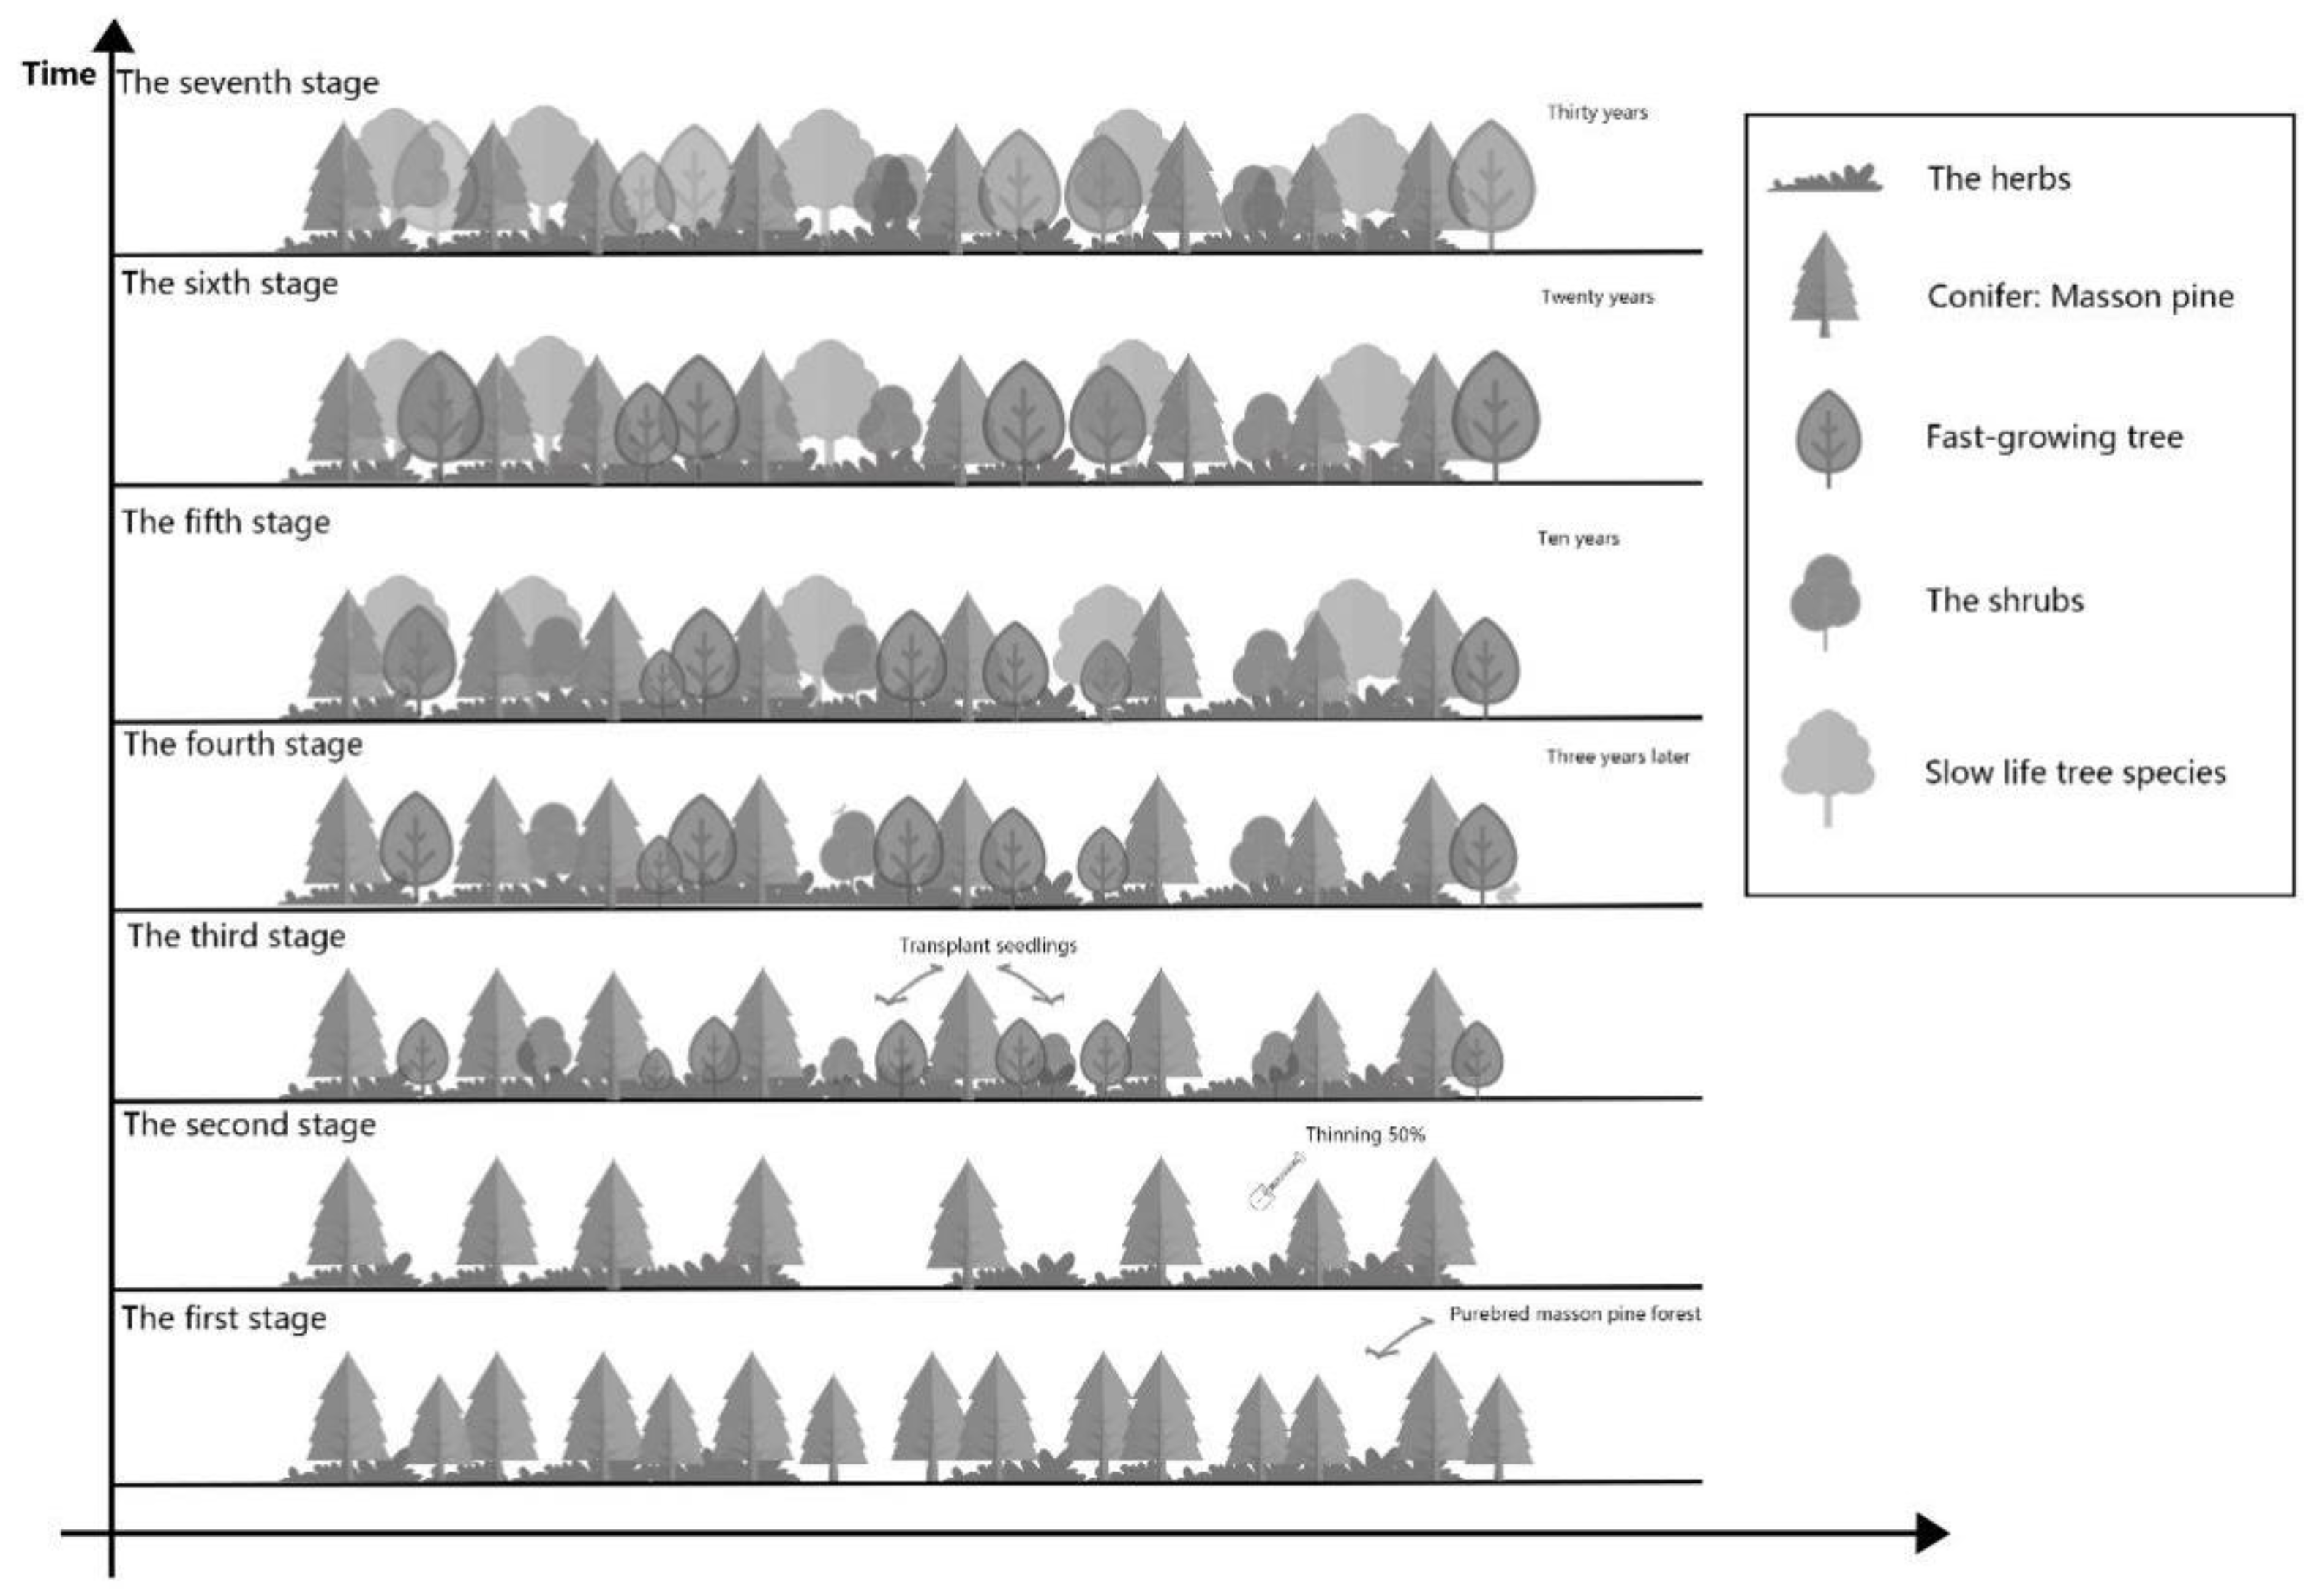
The repair zone is based on the theory of forest vegetation restoration and the Miyawaki method. The core of the restoration of native forest vegetation is based on native tree species. In this study, we adopted the “interlogging–transplanting–nurture–reproduction–establishment” scheme for the degraded Sargassum pine forest. Fertilization is an important tool for forest management because it can regulate stand density, reduce canopy closure, and optimize light, water, and heat conditions in the forest [46], as well as promote the regeneration of species and understory vegetation [47]. In the study of Si-Ze Liu, 20%, 30%, 40%, and 50% intercutting intensities were positively correlated with community characteristics and soil water content, while 50% intercutting intensity was negatively correlated. Since this study is in a scenic area and needs to maintain an aesthetic, the 40% intensity transplanting was selected to form a forest window in two phases (Figure 11). In the immature community, transplanting creates good environmental conditions for the remaining stand, improves the community ecosystem and stand structure, accelerates stand growth, improves stand quality, accelerates the regeneration of understory vegetation, and obtains higher ecological and environmental benefits (Figure 10). After 40% felling during the subdivision period, seedlings of the Mikuran plant community were artificially introduced. After 3 years, the natural succession process was established, and the community grew naturally without artificial intervention. Ten years later, fast-growing species entered the canopy, and the forest landscape was founded. Twenty years later, slow-growing species entered the canopy, and the community became stable and could achieve self-renewal. The reconstruction zone is near the water, which meets the requirements of river and bay characteristics. Natural succession theory suggests that with the aid of moderate human intervention, the area can gradually resume the natural succession of the current horsetail pine community to the natural community of horsetail pine in the Micang Mountains of Hanzhong. Fast-growing species are combined with slow-growing species, negative species are combined with neutral species, and upper-layer species are combined with lower-layer species so that the forest has a clear hierarchical structure. The restoration and growth of the understory vegetation can maintain the process of soil building; good soil structure serves as a medium for plant growth and preventing successional reversal, and promotes the gradual improvement of biodiversity (Figure 11).
Forest degradation is a global environmental issue that needs to be urgently addressed. Enhanced global restoration of degraded forests is necessary to achieve sustainable development goals. However, there have been multiple definitions of forest degradation with different interpretations, reflecting not only the differences among forest structures but also different perceptions, goals, and values [48]. How to assess degradation will be the direction for future development. At the same time, scenic and multiuse areas (protection, use) should be given full play while emphasizing resource protection. We combine the needs of scenic areas and select well-established indicators of spatial attributes to reflect the degradation status of scenic communities in three dimensions: degree, trend, and pattern. We used palm coercion with significant restoration and short ecological restoration in the South Lake Scenic Area.
However, we could not study all outstanding factors. For the current situation at the South Lake Scenic Area, an in-depth research and exploration of two elements is needed. First, succession takes time, and our study may not have been long enough. The data in this study were selected from the spatial remote sensing images for the past 20 years, so may reflect temporary, not permanent, degradation. Long-term continuous observation of the degraded forest assessment system in the scenic area to monitor and compare the degradation process in different stages would be needed. Second, we have only planned ecological restoration based on the existing plant communities in the scenic area. Further validation, combining remote sensing analysis with field investigation to fundamentally target different functional zones of the Masson Pine forest, is needed. A degraded landscape restoration project and the use of predictive models, such as the spatially intuitive landscape model LANDIS PRO, for further prediction of scenic vegetation resilience, would extend our study [49,50].
5. Conclusions
We constructed a DTP degradation assessment system to study the degradation status of plant communities in the South Lake Scenic Area. We propose countermeasures for plant degradation and landscape restoration, with theoretical and practical significance for the identification of plant community degradation and landscape restoration. We evaluated the Masson pine community in South Lake by assessing the degradation degree, trend, and pattern, demonstrating the following: (1) The FVC of the Nanhu Scenic Area degrades to low vegetation coverage over a large area. The area of fraction vegetation coverage degradation was significantly larger than that of fraction vegetation coverage improvement in the three periods examined. (2) The degradation trend of forest in the Nanhu Scenic Area was decreasing. Over time, the decrease in forest in the Nanhu Scenic Area expanded from 2000 to 2010 and from 2010 to 2020. It is also apparent that the transfer area of forestland to nonforestland increased year over year from 2010 to 2020 compared with 2000 to 2010. (3) At the landscape level, the forest patch was subjected to human intervention, which made the shape tend to be simple and the ecological vulnerability increase, and rich land use, high fragmentation, and patch types became evenly distributed. There is no clear dominant type—the shape of forest patches in the Nanhu Scenic Area is being simplified due to human intervention.
Through a more in-depth analysis of the degradation assessment system, based on the spatial distribution of the current Masson pine forest in the South Lake Scenic Area, and the theories of natural succession and moderate disturbance, the Miyawaki method and interlogging are used to promote the renewal of plant communities and the restoration of plant community biodiversity. Another objective was to shorten the natural succession of the forest in the scenic area in time and space dimensions, to quickly form the ecological foundation of the scenic area, and to meet the scenic needs and ecological requirements of the South Lake Scenic Area. This study adopts the Miyawaki method within the landscape with practical significance for the restoration and conservation of this type of plant community.
Author Contributions
Conceptualization, X.Z. (Xue Zhang) and X.W.; methodology, X.Z. (Xue Zhang) and X.W.; software, Q.T.; validation, H.H., Q.T., and X.Z. (Xingyao Zhong); formal analysis, X.Z. (Xue Zhang); investigation, Q.T.; resources, H.H.; data curation, H.H.; writing—original draft preparation, X.Z. (Xue Zhang) and X.W.; writing—review and editing, X.Z. (Xue Zhang); visualization, X.Z. (Xingyao Zhong); supervision, X.Z. (Xue Zhang) and X.W.; project administration, Q.T.; funding acquisition, X.W. and L.S. All authors have read and agreed to the published version of the manuscript.
Funding
This work was supported by China University Industry—the Natural Science Basic Research Plan in Shaanxi Province of China (No. 2020-JM-418) and Chinese Universities Scientific Fund (No. 2452019203).
Data Availability Statement
The data presented in this study are available on request from the corresponding author.
Conflicts of Interest
The authors declare no conflict of interest.
References
- FAO. State of the World’s Forests 2016 (SOFO): Forests and Agriculture: Land use Challenges and Opportunities; Food and Agriculture Organization of the United Nations: Roma, Italy, 2016. [Google Scholar]
- Liu, S. Principles and Techniques of Natural Forest Ecological Restoration; China Forestry Publishing House: Beijing, China, 2013; pp. 1–4. [Google Scholar]
- FAO. Global Forest Resources Assessment 10. Main Report: FAO Forestry Paper; Food and Agriculture Organization of the United Nations: Roma, Italy, 2020. [Google Scholar]
- Food and Agriculture Organisation of the United Nations. Global Guidelines for the Restoration of Degraded Forests and Landscapes in Drylands Building Resilience and Benefiting Livelihoods. FAO Forestry Paper 175; Food and Agriculture Organization of the United Nations: Roma, Italy, 2015. [Google Scholar]
- Zhao, J.; Lu, W. Status and Trend of Forest Certification. World For. Res. 2004, 17, 1–4. [Google Scholar]
- FAO. Global Forest Resources Assessment 10. Main Report: FAO Forestry Paper; Food and Agriculture Organization of the United Nations: Roma, Italy, 2015. [Google Scholar]
- Calver, M. Conserving Forest Biodiversity: A Comprehensive, Multiscaled Approach. Pac. Conserv. Biol. 2002, 8, 291. [Google Scholar] [CrossRef]
- Newbold, T.; Hudson, L.; Hill, S. Global effects of land use on local terrestrial biodiversity. Nature 2015, 520, 45–50. [Google Scholar] [CrossRef] [Green Version]
- Van der Plas, F.; Manning, P.; Soliveres, S. Biotic homogenization can decrease landscape scale ecosystem multifunctionality. Proc. Natl. Acad. Sci. USA 2016, 113, 357–362. [Google Scholar] [CrossRef] [PubMed] [Green Version]
- Tian, T.; Bai, Y.; Zhang, X. Problems and Countermeasures in Forest Restoration in China. J. Northwest For. Univ. 2019, 34, 269–272. [Google Scholar]
- Chen, J. The FAO is calling for greater forest and landscape restoration. China For. Ind. 2021, 06, 66. [Google Scholar]
- Zhu, J.; Li, F. Forest degradation/decline research and practice. Chin. J. Appl. Ecol. 2007, 18, 1601–1609. [Google Scholar]
- Duarte, E.; Barrera, J.; Dube, F. Monitoring Approach for Tropical Coniferous Forest Degradation Using Remote Sensing and Field Data. Remote Sens. 2020, 12, 2531. [Google Scholar] [CrossRef]
- Bahamondez, C.; Thompson, I.D. Determining forest degradation, ecosystem state and resilience using a standard stand stocking measurement diagram: Theory into practice. For. Int. J. For. Res. 2016, 89, 290–300. [Google Scholar] [CrossRef]
- Thompson, I.D.; Guariguata, M.R.; Okabe, K. An Operational Framework for Defining and Monitoring Forest Degradation. Ecol. Soc. 2013, 18, 20. [Google Scholar] [CrossRef]
- Sasaki, N.; Asner, G.P. Approaches to classifying and restoring degraded tropical forests for the anticipated REDD plus climate change mitigation mechanism. Iforest-Biogeosci. For. 2011, 4, 1–4. [Google Scholar] [CrossRef] [Green Version]
- Mariscal, A.; Tigabu, M.; Savadogo, P. Regeneration Status and Role of Traditional Ecological Knowledge for Cloud Forest Ecosystem Restoration in Ecuador. Forests 2022, 13, 92. [Google Scholar] [CrossRef]
- Wang, Y. Spatial identification and restoration of forest ecosystem degradation in Guangdong-Hong Kong-Macao Greater Bay Area. China Territ. Today 2020, 06, 35–38. [Google Scholar]
- FAO. Global Forest Resources Assessment 10. Main Report: FAO Forestry Paper; Food and Agriculture Organization of the United Nations: Roma, Italy, 2010. [Google Scholar]
- Yang, J.; Li, J.; Song, Y. A model to assess the degradation degree of damaged evergreen broad-leaved forest ecosystem. Acta Ecol. Sin. 2006, 26, 3749–3756. [Google Scholar]
- Zhang, J.; Xu, Q. Diagnostic characteristics and evaluation index system of degraded ecosystem. Resour. Environ. Yangtze Basin 1999, 8, 215–220. [Google Scholar]
- Gao, J. Study on Fundamental Theory and Assessment Approaches on Forest Health. Ph.D. Thesis, Beijing Forestry University, Beijing, China, 2007. [Google Scholar]
- Gitelson, A.A.; Kaufman, Y.J.; Stark, R.; Rundquist, D. Novel algorithms for remote estimation of vegetation fraction. Remote Sens. Environ. 2002, 80, 76–87. [Google Scholar] [CrossRef] [Green Version]
- Huang, l.; Yang, Y.; Gao, P. Analysis of Temporal and Spatial Variation of Vegetation Coverage and Topographic Differentiation Characteristics in the Upper Reaches of Minjiang River by Landsat Image Data. J. Northeast. For. Univ. 2023, 51, 54–60. [Google Scholar]
- Pang, J.; Duan, J.; Zhang, R. Temporal and spatial evolution characteristics and climate response of vegetation coverage in Weihe River Basin from 2000 to 2019. Res. Soil. Water Conserv. 2021, 28, 230–237. [Google Scholar]
- Meng, C.; Wang, J.; Zhi, X. Spatial Characteristics of Forest Landscape in County Level Based on GIS. Trans. Chin. Soc. Agric. Mach. 2018, 49, 187–194, 204. [Google Scholar]
- Sun, Y.; Maimaitituxun, M.; Mahemujiang, A. Research on the Temporal and Spatial Dynamic Changes of Vegetation Coverage in Kashgar City from 1995 to 2020. China Rural. Water Hydropower 2022, 01, 71–78, 92. [Google Scholar]
- Yengoh, G.T.; Dent, D.; Olsson, L.; Tengberg, A.E.; Tucker, C.J., II. Use of the Normalized Difference Vegetation Index (NDVI) to Assess Land Degradation at Multiple Scales; Springer: Berlin/Heidelberg, Germany, 2016. [Google Scholar]
- Anees, S.A.; Zhang, X.; Khan, K.A. Estimation of fractional vegetation cover dynamics and its drivers based on multi-sensor data in Dera Ismail Khan, Pakistan. J. King Saud Univ. Sci. 2022, 34, 1018–3647. [Google Scholar] [CrossRef]
- Zhou, C.; Liu, S.; Wang, P. Analysis of the driving factors of land use and change based on GIS-Logistic coupling model in Guanghe County. J. Gansu Agric. Univ. 2018, 53, 118–125. [Google Scholar]
- Yang, W. Spatiotemporal change and driving forces of urban landscape pattern in Beijing. Acta Ecol. Sin. 2015, 35, 4357–4366. [Google Scholar]
- Tan, J.; Zhao, S.; Tan, X. Change characteristics of land use and landscape pattern in Dongting Lake during 1996–2016. Ecol. Sci. 2017, 36, 89–97. [Google Scholar]
- Wu, J.; Peng, J.; Gu, S. Remote Sensing Analysis of Temporal and Spatial Dynamics of Forest Landscape: A Case Study of Huangshan City. J. Northwest For. Univ. 2020, 35, 269–278. [Google Scholar]
- Lin, H.; Guo, X.; Ouyang, X. Variation of Soil Enzyme Activity and Soil Nutrients in Aerially Seeded Pinus massoniana Plantation Replanting with Schima superba. J. Northeast For. Univ. 2015, 43, 136–139. [Google Scholar]
- Wan, Y.; Fu, X.; Yang, F. Supply of Seed Reserves and Environmental Restrictions of Seed Germination of Sparse and Dwarfish Pinus massoniana Forest in South China. Acta Agric. Univ. Jiangxiensis 2014, 36, 782–789. [Google Scholar]
- Xiao, X.; Wei, X.; Liu, Y. Aerial seeding: An effective forest restoration method in highly degraded forest landscapes of sub-tropic regions. Forests 2015, 6, 1748–1762. [Google Scholar] [CrossRef] [Green Version]
- Zhao, F.; Ouyang, X. Relationships between understory vegetation coverage and environmental factors in Pinus massoniana plantations from aerial seeding. Chin. J. Appl. Ecol. 2015, 26, 1071–1076. [Google Scholar]
- Luo, D.; Liu, S.; Shi, Z. Soil microbial community structure in Picea asperata plantations with different ages in subalpine of western Sichuan, Southwest China. Chin. J. Appl. Ecol. 2017, 28, 519–527. [Google Scholar]
- Yan, G.; Song, L. The Value and Development Path of Scenic and Historic Area under the National Park System. Chin. Landsc. Archit. 2021, 37, 112–117. [Google Scholar]
- Wei, Z.; Li, Y.; Zhang, B. Principles and Applications of Restoration Ecology, 1st ed.; Harbin Institute of Technology: Harbin, China, 2012; pp. 1–3. [Google Scholar]
- Miyawaki, A. Restoration of native forests from Japan to Malaysia. In Restoration of Tropical Forest Ecosystems; Springer: Berlin/Heidelberg, Germany, 1993; pp. 5–24. [Google Scholar]
- Schirone, B.; Salis, A.; Vessella, F. Effectiveness of the Miyawaki method in Mediter ranean forest restoration programs. Landsc. Ecol. Eng. 2011, 7, 81–92. [Google Scholar] [CrossRef]
- Li, J.; He, Y.; Liu, P. Diversity of Native Pinus massoniana Community of Micangshan Nature Reserve in Shaanxi Province. Shaanxi For. Sci. Technol. 2014, 2, 6–9. [Google Scholar]
- Liu, H.; Li, W.; Chen, J. Species diversity of six typical natural forest communities in Shaanxi Micangshan Nature Reserve. J. Northwest A F Univ.-Nat. Sci. Ed. 2017, 45, 29–39. [Google Scholar]
- Mansourian, S.; Stanturf, J.A.; Derkyi, M.A.A. Forest Landscape Restoration: Increasing the positive impacts of forest restoration or simply the area under tree cover? Restor. Ecol. 2017, 25, 178–183. [Google Scholar] [CrossRef]
- Liu, S.; Yin, H.; Shen, Y. Effects of thinning intensity on species composition and diversity of undergrowth vegetation community in Pinus massoniana plantation at initial stage of thinning. Chin. J. Appl. Ecol. 2020, 31, 2866–2874. [Google Scholar]
- Shi, J.; Chen, Z.; Wang, G. Impacts of thinning on canopy structure and understory light in secondary poplar-birch forests. Chin. J. Appl. Ecol. 2019, 30, 1956–1964. [Google Scholar]
- Ghazoul, J.; Burivalova, Z.; Garcia-Ulloa, J.; King, L.A. Conceptualizing Forest Degradation. Trends Ecol. Evol. 2015, 30, 622–632. [Google Scholar] [CrossRef] [PubMed]
- Wang, W.J.; He, H.S.; Fraser, J.S.; Thompson, F.R., III; Shifley, S.R.; Spetich, M.A. LANDIS PRO: A landscape model for predicting changes in forest composition and structure at a regional scale. Oecologia 2014, 37, 225–229. [Google Scholar] [CrossRef] [Green Version]
- Xiao, J.; Yu, L.; Hong, S. The formulations of site-scale processes affect landscape-scale forest change predictions: A comparison between LANDIS PRO and LANDIS-II forest landscape models. Landsc. Ecol. 2017, 32, 1347–1363. [Google Scholar] [CrossRef]
Figure 1.
Geographical location of the study area.

Figure 2.
Spatial distribution of dominant species in South Lake Scenic Area. Note: I is a special protection zone, II is a scenic tour area, III is a scenic restoration area, IV is a scenic coordination area, V is a tourism service area, and VI is a development control area.
Figure 2.
Spatial distribution of dominant species in South Lake Scenic Area. Note: I is a special protection zone, II is a scenic tour area, III is a scenic restoration area, IV is a scenic coordination area, V is a tourism service area, and VI is a development control area.

Figure 3.
Spatial distribution of different grades of FVC in Nanhu Scenic Area from 2000 to 2020. Note: I is a special protection zone, II is a scenic tour area, III is a scenic restoration area, IV is a scenic coordination area, V is a tourism service area, and VI is a development control area.
Figure 3.
Spatial distribution of different grades of FVC in Nanhu Scenic Area from 2000 to 2020. Note: I is a special protection zone, II is a scenic tour area, III is a scenic restoration area, IV is a scenic coordination area, V is a tourism service area, and VI is a development control area.

Figure 4.
Distribution map of absolute change of vegetation coverage in Nanhu Scenic Area from 2000 to 2020. Note: I is a special protection zone, II is a scenic tour area, III is a scenic restoration area, IV is a scenic coordination area, V is a tourism service area, and VI is a development control area.

Figure 5.
Spatial distribution of land cover in phase iii from 2000 to 2020. Note: I is a special protection zone, II is a scenic tour area, III is a scenic restoration area, IV is a scenic coordination area, V is a tourism service area, and VI is a development control area.
Figure 5.
Spatial distribution of land cover in phase iii from 2000 to 2020. Note: I is a special protection zone, II is a scenic tour area, III is a scenic restoration area, IV is a scenic coordination area, V is a tourism service area, and VI is a development control area.

Figure 6.
Map of forest land change from 2000 to 2020. Note: I is a special protection zone, II is a scenic tour area, III is a scenic restoration area, IV is a scenic coordination area, V is a tourism service area, and VI is a development control area.
Figure 6.
Map of forest land change from 2000 to 2020. Note: I is a special protection zone, II is a scenic tour area, III is a scenic restoration area, IV is a scenic coordination area, V is a tourism service area, and VI is a development control area.

Figure 7.
Change in landscape level index in Nanhu Scenic Area from 2000 to 2020.

Figure 8.
Schematic diagram of plant community succession. Note: (a) Natural succession methods; (b) traditional reforestation methods; (c), palustrine silvicultural succession methods.
Figure 8.
Schematic diagram of plant community succession. Note: (a) Natural succession methods; (b) traditional reforestation methods; (c), palustrine silvicultural succession methods.

Figure 9.
Technical route of Miyawaki afforestation method.

Figure 10.
Forest phase update chart.

Figure 11.
The process of community renewal in South Lake Scenic Area.


Table 1.
List of research methods for DTP degradation assessment system.
| Research Dimension | Concept Definition | Research Methodology | Meaning |
|---|---|---|---|
| Degradation degree | Stand- or landscape-level degradation degree in the distribution of number, density, or size classes in the forest over time. | FVC calculation. | The range of FVC assignment is [0, 1], and the larger the assignment, the higher the FVC class. |
| Image map difference comparison. | The amount of vegetation cover change (ΔFVCg), with the difference range at [−1, 1], was divided into improvement zone (+), degradation zone (−), and no change (0). | ||
| Degradation trend | Changes in the trend of forest degradation due to the influence of human activities that cause significant forest disturbance. | Land cover change | From the values of forest land remote sensing images’ digital number (DN) change in three time periods, we can determine the increase, decrease, and change in forest area, and thus infer the trend of forest land change. |
| Land cover transfer matrix | Land use intertransfer on a continuous period scale as an indication of degradation trends in the conversion of forest to nonforest land. | ||
| Degradation Pattern | A specified amount of information expressing landscape patterns, reflecting landscape structural characteristics and spatial distribution. | Landscape Index | The patch density (PD) and contagion index (CONTAG) indicate landscape connectivity. |
| Interspersion and juxtaposition index (IJI), landscape division index (DIVISION), and splitting index (SPLIT) indicate the degree of fragmentation. | |||
| Shannon evenness index (SHEI) and Shannon diversity index (SHDI) indicates diversity. | |||
| Effective mesh size (MESH) and landscape shape index (LSI) indicate the degree of disturbance. | |||
| Patch cohesion index (COHESION) and aggregation index (AI) indicate landscape dominance. |
Table 2.
List of dominant species in South Lake Scenic Area.
| Dominant Species | Latin Scientific Name | Age Group | Average DBH (CM) | Canopy Coverage | Area (ha) | Area Ratio (%) |
|---|---|---|---|---|---|---|
| Masson pine | Pinus massoniana | Near-mature forest, mature forest | 14.8 | 0.55–0.8 | 439.87 | 89.41 |
| Fir | Cunninghamia lanceolata | Young forest | 6 | 0.3–0.4 | 3.56 | 0.72 |
| Metasequoia | Metasequoia glyptostroboides | Middle-aged forest | 12.6 | 0.5 | 0.13 | 0.01 |
| Oak | —— | Middle-aged forest | 16 | 0.4–0.6 | 14.21 | 2.90 |
| Other hardwood tree species | —— | Middle-aged forest | 10.9 | 0.3–0.6 | 28.92 | 5.88 |
| Walnuts | Carya cathayensis | —— | —— | —— | 1.85 | 0.38 |
| Chestnuts | Castaneamollissima | Young forest | 6 | 0.2 | 0.63 | 0.13 |
| Tea | Sageretiacamellifolia | —— | —— | —— | 2.8 | 0.57 |
Table 3.
Land cover transfer matrix from 2000 to 2010.
| 2010 | Crop | Forest | Grass | Water | Total (ha) | |||||
|---|---|---|---|---|---|---|---|---|---|---|
| 2000 | Area (ha) | Ratio (%) | Area (ha) | Ratio (%) | Area (ha) | Ratio (%) | Area (ha) | Ratio (%) | ||
| Crop | 565.18 | - | 23.94 | 4.0 | 15.93 | 2.6 | 0.81 | 0.1 | 605.86 | |
| Forest | 28.26 | 5.6 | 477.84 | - | - | - | 1.44 | 0.3 | 507.54 | |
| Grass | 7.47 | 11 | - | - | 60.48 | - | 0.09 | 0.1 | 68.04 | |
| Water | 7.83 | 10.1 | 5.58 | 7.2 | 0.36 | 0.5 | 63.99 | - | 77.76 | |
| Total | 608.74 | 507.36 | 76.77 | 66.33 | 1259.2 | |||||
Table 4.
Land cover transfer matrix from 2010 to 2020.
| 2020 | Crop | Forest | Grass | Water | Total (ha) | |||||
|---|---|---|---|---|---|---|---|---|---|---|
| 2010 | Area (ha) | Ratio (%) | Area (ha) | Ratio (%) | Area (ha) | Ratio (%) | Area (ha) | Ratio (%) | ||
| Crop | 540.34 | - | 24.21 | 3.9 | 15.3 | 2.4 | 28.89 | 4.6 | 608.74 | |
| Forest | 20.52 | 4.5 | 434.64 | - | 22.59 | 4.9 | 29.61 | 6.5 | 507.36 | |
| Grass | 7.38 | 9.6 | 29.97 | 39 | 37.26 | - | 2.16 | 2.8 | 76.77 | |
| Water | 5.76 | 8.7 | 1.08 | 1.6 | 0.63 | 0.9 | 58.86 | - | 66.33 | |
| Total | 574 | 489.9 | 75.78 | 119.52 | 1259.2 | |||||
Table 5.
Landscape-level index.
| Year | PD (pcs·hm−2) | CONTAG (%) | IJI (%) | DIVISION | SPLIT | SHDI | SHEI |
|---|---|---|---|---|---|---|---|
| 2000 | 10.45 | 74.15 | 34.12 | 0.79 | 4.87 | 0.71 | 0.36 |
| 2002 | 9.86 | 74.22 | 33.01 | 0.80 | 4.88 | 0.71 | 0.36 |
| 2004 | 9.13 | 74.91 | 31.55 | 0.79 | 4.82 | 0.69 | 0.35 |
| 2006 | 8.80 | 75.77 | 30.90 | 0.79 | 4.66 | 0.67 | 0.34 |
| 2008 | 8.24 | 76.46 | 30.39 | 0.78 | 4.51 | 0.65 | 0.34 |
| 2010 | 7.42 | 77.01 | 29.50 | 0.77 | 4.40 | 0.65 | 0.33 |
| 2012 | 7.30 | 76.87 | 29.92 | 0.77 | 4.42 | 0.65 | 0.33 |
| 2014 | 7.03 | 76.95 | 28.44 | 0.78 | 4.47 | 0.65 | 0.33 |
| 2016 | 6.55 | 77.57 | 26.39 | 0.77 | 4.42 | 0.63 | 0.32 |
| 2018 | 6.14 | 77.97 | 25.09 | 0.77 | 4.35 | 0.62 | 0.32 |
| 2020 | 5.44 | 78.60 | 23.45 | 0.77 | 4.35 | 0.61 | 0.31 |
Table 6.
Table of the main characteristics and the target communities of the site survey.
| Site A | Site B | ||
|---|---|---|---|
| Locality | Nanzheng District, Hanzhong City, Shaanxi Province | Xixiang County, Hanzhong City, Shaanxi Province | |
| Coordinates | N 32°97′51″–32°94′11″, E 106°89′32″–107°91′89″ | N 32°33′33″–32°46′31″, E 107°15′24″–107°33′06″ | |
| Altitude | 600–1400 | 1688–1721 | |
| Climate | Northern subtropical humid climate | Northern subtropical semihumid monsoon climate | |
| Rocks | - | Carbonate area | |
| Targeting Community | Herbaceous layer | Reed, water artemisia, needlegrass, palm, fern, konjac, wild eggplant | Phyllanthus, long-stalked mountain locust, stinkweed, broad-leaved carex, etc. |
| Shrub layer | Shrub willow, Camellia sinensis, Carthamus tinctorius, Firethorn, Mucuna pruriens | Gooseberry, three-branched aconite, six-way wood, double shield wood, wood ginger, etc. | |
| Arboreal layer | Masson pine, oak, etc. | Masson pine, big-leaf beech, Huashan pine, etc. | |
Note: A indicates the main features of the South Lake Scenic Area; B indicates the main features of the area where the potential vegetation is located.
Disclaimer/Publisher’s Note: The statements, opinions and data contained in all publications are solely those of the individual author(s) and contributor(s) and not of MDPI and/or the editor(s). MDPI and/or the editor(s) disclaim responsibility for any injury to people or property resulting from any ideas, methods, instructions or products referred to in the content. |
© 2023 by the authors. Licensee MDPI, Basel, Switzerland. This article is an open access article distributed under the terms and conditions of the Creative Commons Attribution (CC BY) license (https://creativecommons.org/licenses/by/4.0/).
Share and Cite
MDPI and ACS Style
Zhang, X.; Hu, H.; Wang, X.; Tian, Q.; Zhong, X.; Shen, L. Plant Community Degradation Inquiry and Ecological Restoration Design in South Lake Scenic Area of China. Forests 2023, 14, 181. https://doi.org/10.3390/f14020181
AMA Style
Zhang X, Hu H, Wang X, Tian Q, Zhong X, Shen L. Plant Community Degradation Inquiry and Ecological Restoration Design in South Lake Scenic Area of China. Forests. 2023; 14(2):181. https://doi.org/10.3390/f14020181
Chicago/Turabian StyleZhang, Xue, Haitao Hu, Xuhui Wang, Qianqian Tian, Xingyao Zhong, and Lina Shen. 2023. "Plant Community Degradation Inquiry and Ecological Restoration Design in South Lake Scenic Area of China" Forests 14, no. 2: 181. https://doi.org/10.3390/f14020181
Note that from the first issue of 2016, this journal uses article numbers instead of page numbers. See further details here.