Article

Design and Conceptual Development of a Novel Hybrid Intelligent Decision Support System Applied towards the Prevention and Early Detection of Forest Fires

by
Manuel Casal-Guisande
1,2,*,
José-Benito Bouza-Rodríguez
1,2,
Jorge Cerqueiro-Pequeño
1,2 and
Alberto Comesaña-Campos
1,2,*
1
Department of Design in Engineering, University of Vigo, 36208 Vigo, Spain
2
Design, Expert Systems and Artificial Intelligent Solutions Research Group (DESAINS), Galicia Sur Health Research Institute (IIS Galicia Sur), SERGAS-UVIGO, 36213 Vigo, Spain
*
Authors to whom correspondence should be addressed.
Forests 2023, 14(2), 172; https://doi.org/10.3390/f14020172
Submission received: 7 December 2022 / Revised: 10 January 2023 / Accepted: 13 January 2023 / Published: 17 January 2023

Abstract

:
Forest fires have become a major problem that every year has devastating consequences at the environmental level, negatively impacting the social and economic spheres of the affected regions. Aiming to mitigate these terrible effects, intelligent prediction models focused on early fire detection are becoming common practice. Considering mainly a preventive approach, these models often use tools that indifferently apply statistical or symbolic inference techniques. However, exploring the potential for the hybrid use of both, as is already being done in other research areas, is a significant novelty with direct application to early fire detection. In this line, this work proposes the design, development, and proof of concept of a new intelligent hybrid system that aims to provide support to the decisions of the teams responsible for defining strategies for the prevention, detection, and extinction of forest fires. The system determines three risk levels: a general one called Objective Technical Fire Risk, based on machine learning algorithms, which determines the global danger of a fire in some area of the region under study, and two more specific others which indicate the risk over a limited area of the region. These last two risk levels, expressed in matrix form and called Technical Risk Matrix and Expert Risk Matrix, are calculated through a convolutional neural network and an expert system, respectively. After that, they are combined by means of another expert system to determine the Global Risk Matrix that quantifies the risk of fire in each of the study regions and generates a visual representation of these results through a color map of the region itself. The proof of concept of the system has been carried out on a set of historical data from fires that occurred in the Montesinho Natural Park (Portugal), demonstrating its potential utility as a tool for the prevention and early detection of forest fires. The intelligent hybrid system designed has demonstrated excellent predictive capabilities in such a complex environment as forest fires, which are conditioned by multiple factors. Future improvements associated with data integration and the formalization of knowledge bases will make it possible to obtain a standard tool that could be used and validated in real time in different forest areas.

1. Introduction

Every year, forest fires destroy hundreds of millions of hectares of forest around the world [1], generating a problem that goes beyond the environmental sphere and causes obvious economic and social damage. In 2020 alone, 3400 km2 of land was burned in Europe, including protected areas within Europe’s Natura 2000 network [2], which will take several years to recover. In addition to the loss of forest mass, there is the possible disappearance of species of fauna and flora of great biological value due to the destruction of their ecosystems, causing dramatic interruptions in the trophic chain.
According to the technical report published by the European Commission for the year 2020, the countries that suffered the most fires were in southern Europe, with Romania ranked highest, followed by Portugal and Spain. However, the latest statistics show that forest fires have increased in frequency in central and northern European countries [2].
In order to reduce the impact of fires in environmental, social, and economic terms, a determined effort has been made in recent decades to prevent and detect forest fires early. Of particular interest, and increasingly more evident, is the use of software and hardware tools to support the decision-making process associated with the detection, warning, and eradication of fires in an attempt to cover all stages related to the management of firefighting resources. In this sense, according to Faroudja Abid [3], there are currently two main groups of tools in this field. The first group includes those oriented towards the prediction of areas where possible fire outbreaks may occur even before they appear. The second group, on the other hand, would include corrective tools oriented towards the rapid detection of fire outbreaks once they are already active. Although both approaches can, and should, work together, preventive tools, supported by intelligent software-based systems, play a decisive role in the definition of regional or national fire-fighting strategies, identifying risk areas and helping to decide where prevention and surveillance tasks should be carried out, as well as determining the optimal location of fire-fighting resources in order to facilitate faster and more effective actions. The software can be combined with and complemented by corrective tools, mostly based on hardware elements, making it possible to define physical detection and alert generation systems, and place those devices in the tree mass to detect the advance of fire outbreaks. It is clear that, in this case, the preventive approach has greater advantages from the point of view of development and implementation when compared to the corrective approach. Difficulties in the implementation of hardware and data processing and transmission, together with the limitations implicit in the placement, distribution, and protection of the sensors, hinder their implementation and increase the uncertainty associated with their operation. Conversely, preventive tools, although presenting greater difficulties in conceptualization and testing, also have a much greater development potential, are less costly, and have a great potential for their integration as a consequence of the use of artificial intelligence.
In addition to what has already been indicated, preventive tools can group different datasets related to fire detection in more efficient ways and with this find underlying patterns or relationships between them that allow obtaining a completely different and novel viewpoint. The capacity of these new intelligent systems and their consequent evolution towards hybrid systems [4] allows not only grouping data that are presumed to be objective, such as numbers, but also data that include a certain subjectivity and are based on logical symbols represented, for example, through syllogisms. Thus, the starting database is increased, although always focusing on preventive and predictive aspects. Factors associated with the study and analysis of the dynamics of forest fires [5,6,7] or current suppression systems [8,9], although being of enormous importance in extinction, are in themselves optimizable problems that require their own processing before providing consistent data to a forecasting system. It is understandable that only the outcome of the optimization of a problem that contains numerous explanatory variables linked through an analytical or numerical model contains sufficient logical relevance to be able to be combined, at the same ontological level, with other similar ones in order to carry out a reliable prediction. In this same sense, other factors such as those related to the effects of forest fires on the environment [10,11] or on human health [12,13] show even weaker evident causal relationships with the appearance of a fire, so the formalization of knowledge from these data should be carefully evaluated.
Within this context, this paper presents the design, development, and proof of concept [14] of a novel methodology based on intelligent hybrid systems [4], implemented in software, oriented towards the prevention and early detection of forest fires by categorizing fire risk zones within a specific study region. To achieve this, the methodology is distributed over two levels, action and detection, that will combine different inferential models with a clear common objective: to reduce the dimensionality of the problem and to narrow down uncertainty in the categorization.

1.1. Intelligent Firefighting Systems

There are different approaches and proposals in the current literature regarding the application of intelligent systems in the field of firefighting. As mentioned above, predictive software models have been developed in this work that, broadly speaking, define and determine a risk value for the occurrence of a fire. For this reason, the related literature review will not consider those studies where hardware-supported models are proposed or developed since they entail a different design and development process. Among the works that can be considered as employing intelligent systems, the work by Amparo Alonso-Betanzos et al. [15] is worth mentioning as it presents a system—developed for the region of Galicia, in northern Spain—that aims to cover practically the entire cycle of forest firefighting, from prevention to planning the recovery of burned areas, including monitoring and extinction. The prevention model is based on the use of an artificial neural network, which was trained using historical data on fires in Galicia between 1988 and 2001. Starting from a set of data (temperature, humidity, rainfall, and fire history per quadrant), the network allows the determination, on a daily basis, of the fire risk associated with each of the quadrants on the map of the study region, based on four risk categories (low, medium, high, and extreme). The published model had an accuracy value of 0.789. In relation to fire extinguishing and the recovery of burned areas, the authors indicate that the proposed system tries to structure the knowledge of firefighting organizations in a way that can provide them with help in mobilizing and locating resources, supported by knowledge-based systems as an aid and complement in decision making.
The work of Mar Bisquert et al. [16] proposes the use of multivariate analysis approaches using logistic regression and artificial neural networks to obtain fire risk models. The proposal also focuses on the region of Galicia, which, for the purpose of this study, is divided into a series of quadrants. This is undertaken using historical fire data that incorporate information on vegetation and land surface temperature, which are used to adjust the different models. The authors point out that their best results are obtained using an artificial neural network, with an accuracy of 76%. Finally, from the results provided by the artificial neural network, a risk map is determined, on which, considering a series of threshold values, it is possible to establish a series of risk labels (low, medium, and high) and colorations which are associated with each of the quadrants on the map.
The work by Paulo Cortez and Aníbal Morais [17] evaluated the use of different algorithms to predict the amount of burnt area in Montesinho Natural Park (Portugal) on the basis of meteorological data collected by a station located in the center of the park. Of the different alternatives analyzed, the authors point out that the best is the one based on the use of support vector machines (SVMs).
The work by Binh Thai Pham et al. [18] evaluates the performance of different machine learning approaches (Bayes network, Naïve Bayes, decision tree, and multivariate logistic regression) for fire prediction in Pu Mat National Park (Vietnam). To do so, the authors first prepare a dataset and from it determine the training and validation datasets. After preparing the datasets, they go on to train different models by applying k-fold cross-validation. After the training, they obtain the following values for the area under the ROC (receiver operating characteristic) curve of the binary classifier in the validation set for the Bayes network, decision tree, multivariate logistic regression, and Naïve Bayes models: 0.96, 0.94, 0.937, and 0.939, respectively. Considering the predictions, a color map is generated for each model, which allows those areas more susceptible to fires to be highlighted, considering three levels of risk: low, medium, and high.
The work by Ángela Nebot and Francisco Múgica [19] assesses the use of fuzzy logic techniques to predict the area burnt in a fire, more specifically, using fuzzy inductive reasoning and an adaptive neuro-fuzzy inference system (ANFIS) on the dataset from Montesinho Natural Park (Portugal).
The work by Abolfazl Jaafari et al. [20] presents an intelligent system based on the joint use of an ANFIS with a metaheuristic optimization algorithm for the determination of fire probabilities in the Zagros region (Iran). The metaheuristic optimization algorithm seeks to adjust the best parameters for the determination of the ANFIS membership functions. In this case, they opt for the use of genetic (GA) and firefly algorithms (FA). They start from a dataset from the period 2013–2016, 70% of which is used to train the model and the remaining 30% to validate it. Both in the case of using GA and in the case of combining FA with ANFIS, areas under the ROC curve (AUC) close to 0.90 are obtained, with some superiority in the case of GA. Then, using GA-ANFIS, they construct a map of the probability of fire in the study region.
The work by Can Lai et al. [21] proposes the use of a new method for forest fire prediction based on the use of a sparse autoencoder-based deep neural network and a novel data balancing procedure in which synthetic samples are generated through the addition of Gaussian noise in the minority class.
In general terms, it can be observed that most of the analyzed works share a common objective: to determine a fire risk level for each of the areas under study. Many of them opt to construct models based on machine learning (regression models, decision trees, random forest, support vector machines, shallow artificial neural networks, etc.) that allow the prediction of fire risks throughout a region, facilitating the subsequent creation of maps, which are of great use in tasks of prevention and locating firefighting resources. Machine learning models are highly dependent on the data used for their training, and in general, the datasets available in the literature present large mismatches between the classes to be used for the classification (fire vs. non-fire). In this sense, most authors usually choose not to solve the problem associated with data imbalance [21], using datasets that are clearly unbalanced, with all the consequences that this entails. Some of the works opt for the use of hybrid approaches, using neural networks and fuzzy logic through ANFIS systems, which allows the interpretation of results to be improved by better representation of knowledge.
This paper is organized in five sections. Section 2.1 presents the general outline of the proposed methodology. After that, a detailed description of the methodology implementation is proposed in Section 2.2. Section 3 presents an applied case study of the methodology that exemplifies its operation. Section 4 presents a discussion of the novelties and advances in the methodology in addition to a comparative analysis. Finally, Section 5 presents conclusions and lines for future work.

2. Materials and Methods

2.1. Definition of the System

In this work, a new intelligent hybrid system is designed and developed that aims to combine statistical and symbolic inferential models to obtain a fire risk level in each of the areas in which the study region is divided. For this, a system architecture based on two levels of action is defined, the information flow of which will be briefly described next. Thus, on the first level and based on data from a meteorological station located in the study region, a classification algorithm based on statistical inference [22] will determine an initial level of risk associated with the occurrence of fire in that region. If a high risk level is produced, i.e., if the development of a fire is plausible, the second level of detection will be activated, in which, based on a map of the study region zoned by means of a superimposed grid, it will be possible to identify those areas where there is a higher risk of a fire occurring. Determination of this final risk level will be based on a hybrid inferential model, which concurrently combines an expert system based on fuzzy logic and a convolutional neural network [23,24,25,26]. Starting from the opinions and assessments of an expert on each of the zones or quadrants and an artificially generated image that is capable of bringing together all the representative information for each zone (risk level, percentage of fires in the history of the quadrant by day and month), the model determines two risk matrices associated with each of the divisions of the map corresponding to the models based on declarative rules and supervised learning, respectively. These matrices are then combined in a second expert system, also based on fuzzy logic, to obtain a third matrix representing the global fire risk in the different quadrants. These risk values are represented on the map of the region as a superimposed layer with a given color scale indicating the identified risk levels. With this, those areas or quadrants of the map with a higher risk of fire can be identified quickly and visually, thus improving the decision-making process, especially regarding these preventive terms, and therefore optimizing surveillance work.

2.1.1. Database Usage

As may seem evident, it is not feasible to develop predictive intelligent systems, i.e., algorithmic developments in data science, without data. The existence of records is fundamental both for those approaches that seek to model knowledge and employ symbolic reasoning and for those that seek to determine underlying relationships in the data and employ variants of statistical reasoning. The issue, therefore, transcends the necessary presence of data and moves towards their nature, diversity and, above all, quantity. As will be seen, the creation of logical knowledge bases can reduce the need for a large volume of numerical starting data, which facilitates the validation of algorithms.
This work will start from a dataset of 517 records collected between 2000 and 2003 in the Montesinho Natural Park in north-eastern Portugal, provided by Paulo Cortez and Aníbal Morais and publicly available in the UC Irvine Machine Learning Repository. [17,27].
Table 1 shows a summary of the variables considered, which are divided into two main groups.
The first group of data was collected daily by the warden responsible for the natural park and includes the area burnt by fire, the dates, and the quadrant in which the fire occurred. It should be clarified that the area of the park in which the fires were recorded is indicated by a pair of coordinates (X,Y), referring to a 9 × 9 grid overlayed on the map of the natural park which thus identifies 81 zones on the map.
The second set of data comes from a weather station that is located in the center of the natural park to record temperature, relative humidity, wind speed, and collected rainfall.

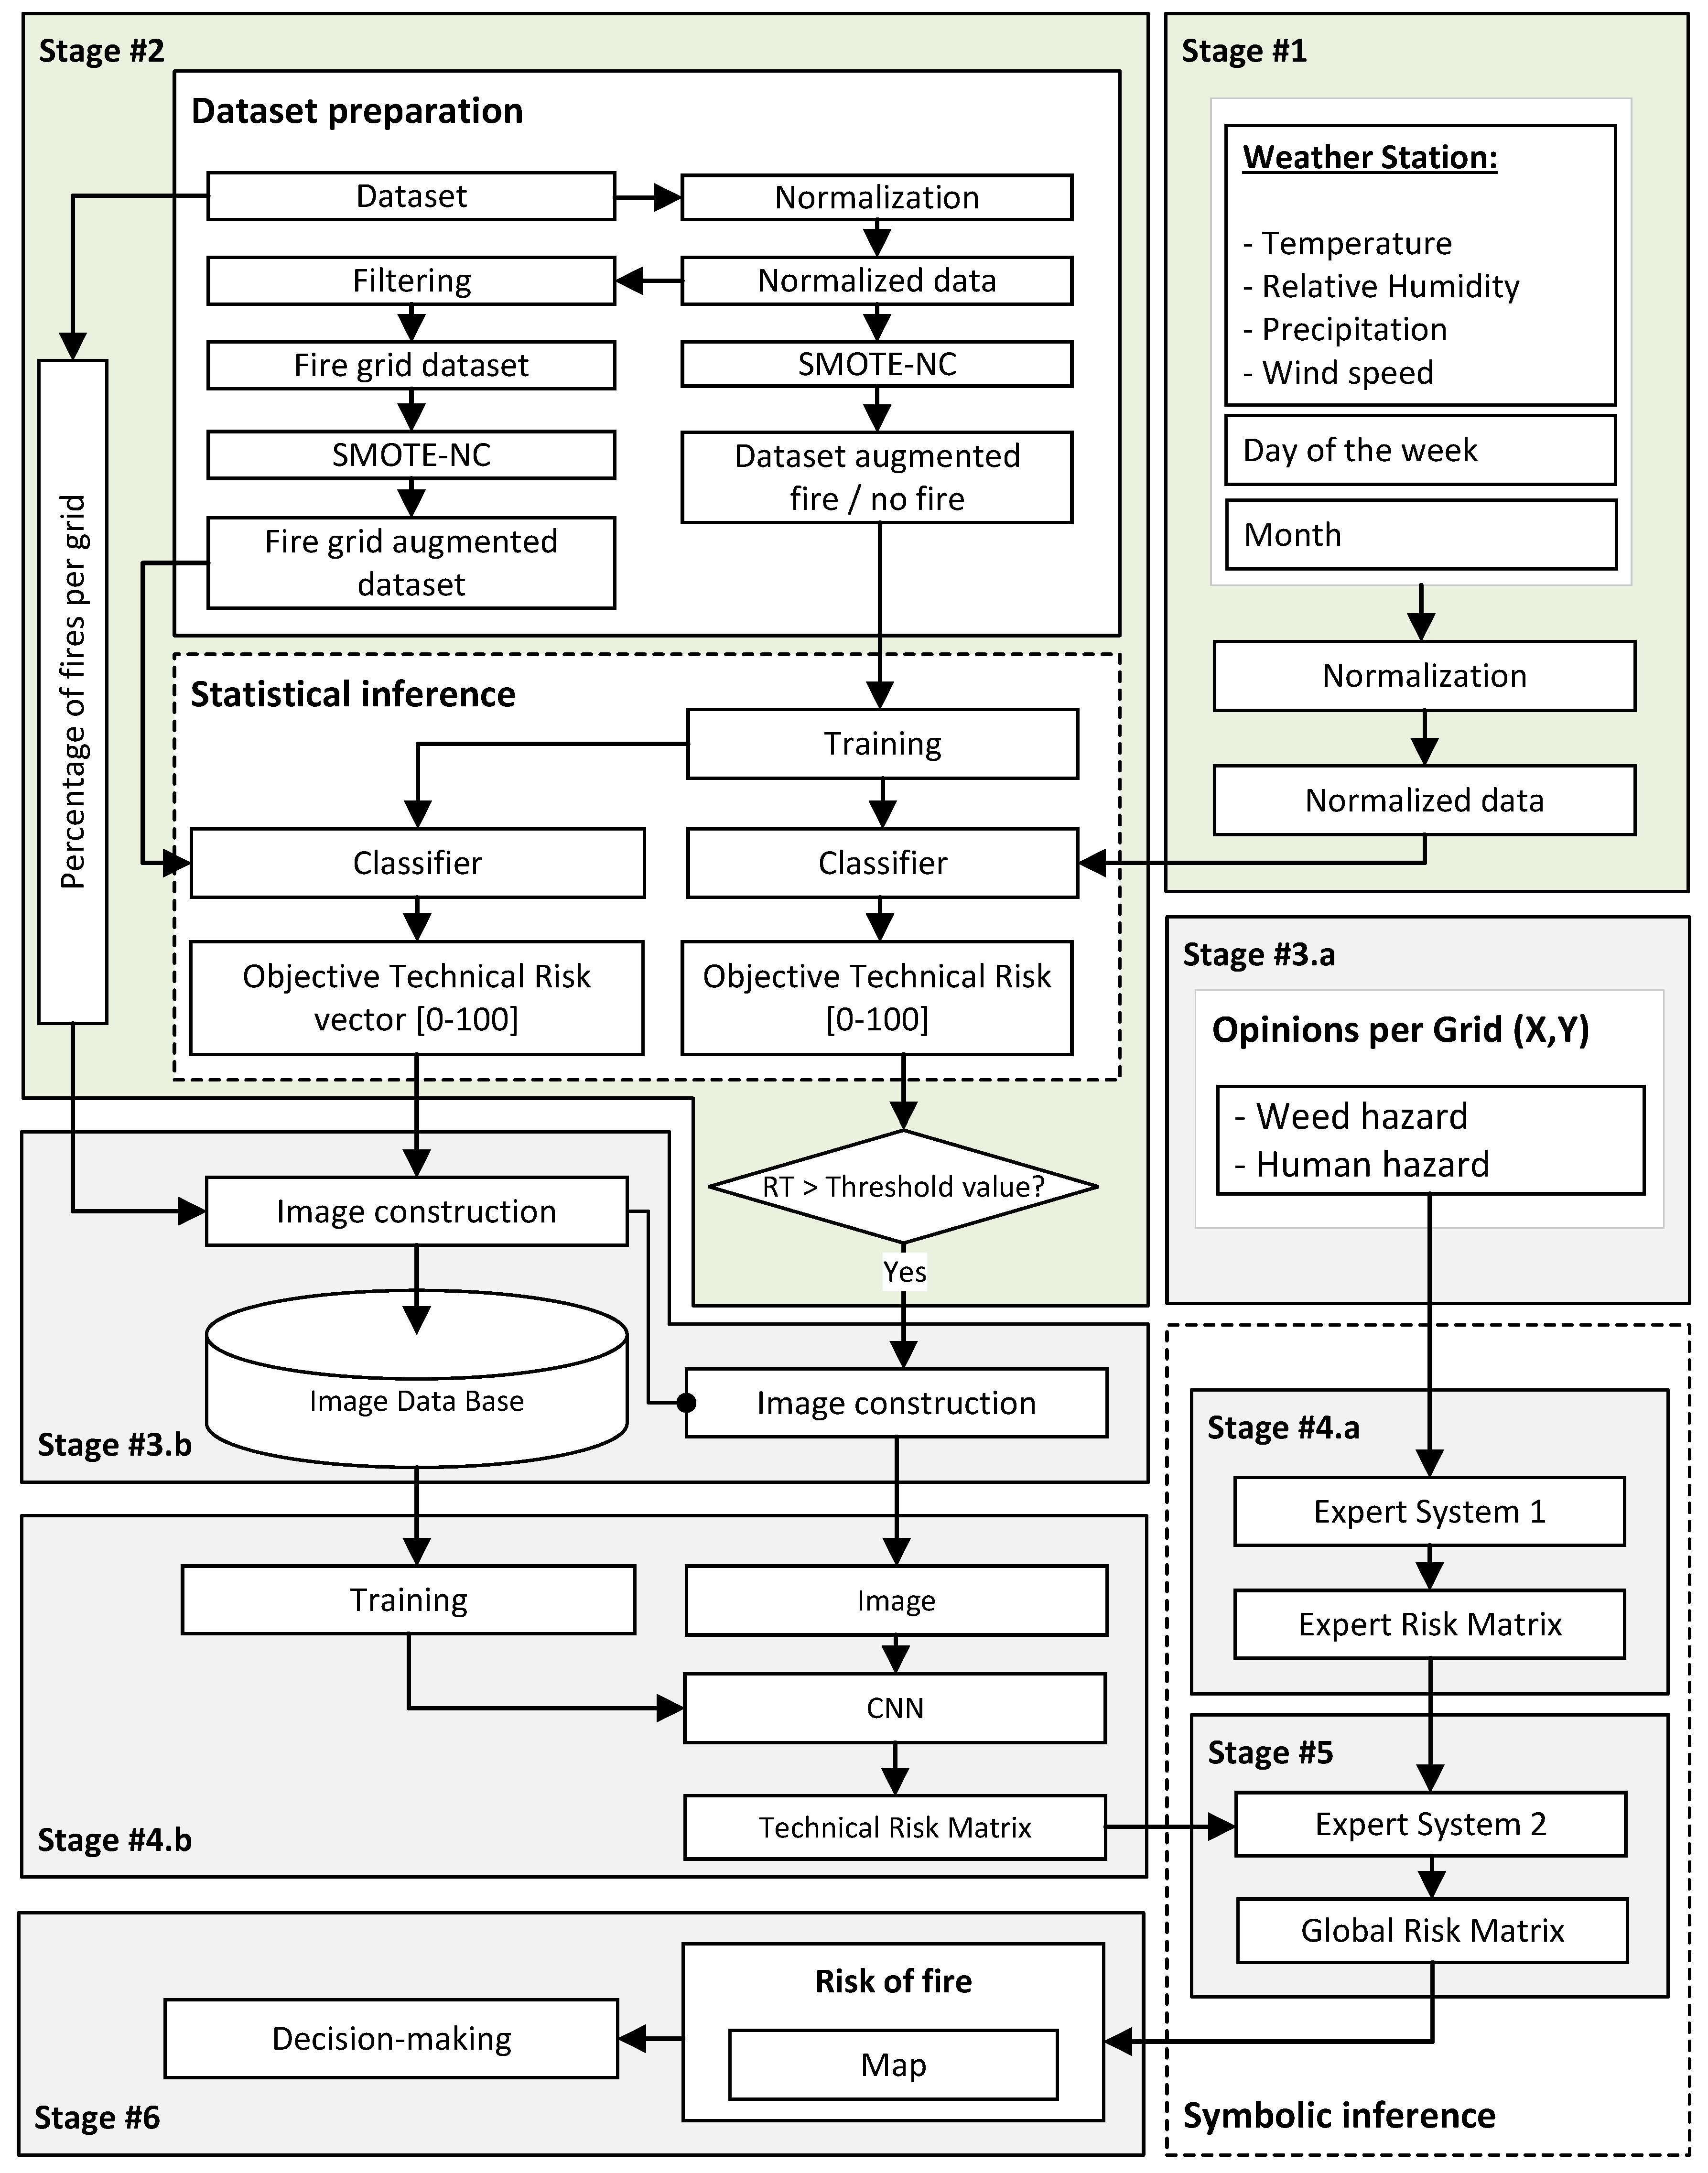
2.1.2. Conceptual Design and Description of the System

An intelligent hybrid system, combining symbolic logics with machine learning algorithms, processes data and interleaves diverse inferential engines in this processing. These allow the machine to emulate a reasoned response process while in turn reducing both the uncertainty associated with certainty and the variability of the data, thereby increasing the reliability of the response. The more the different inferential engines are fed with information closer to knowledge, the less influence the system will have on the training processes, gaining in accuracy and formalization of the classifications. In this initial conceptualization of the system, it is essential to determine the progress of the information in the different stages in which the system is deployed.
Figure 1 shows the flow diagram of the proposed methodology, which is described in detail below. As can be seen in the diagram, there is a series of stages with different background colors. The stages in green (Stage 1 and Stage 2) are limited to the first level of the methodology in which the aim is to determine whether a fire could occur in any area of the study region. On the other hand, the stages in gray (Stages 3.a, 3.b, 4.a, 4.b, 5, and 6) are limited to the second level of the methodology in which the aim is to determine, after confirming the fire risk, in which area of the study region it is more plausible that a fire could break out.
To implement and use this methodology, several newly defined concepts will be needed that are specific to the methodological process being described. All of them are related to the concept of risk. Throughout this section, different variables associated with this concept will be introduced. Generally speaking, in this work, risk is established as a measure of the presence of a fire in a given area. It will, therefore, be a term that implicitly bears a measure of uncertainty which, in this case, will not have a probabilistic nature but will be managed in the hybrid model proposed by different mechanisms.
The distinct levels of the methodology are described below.
Level 1:
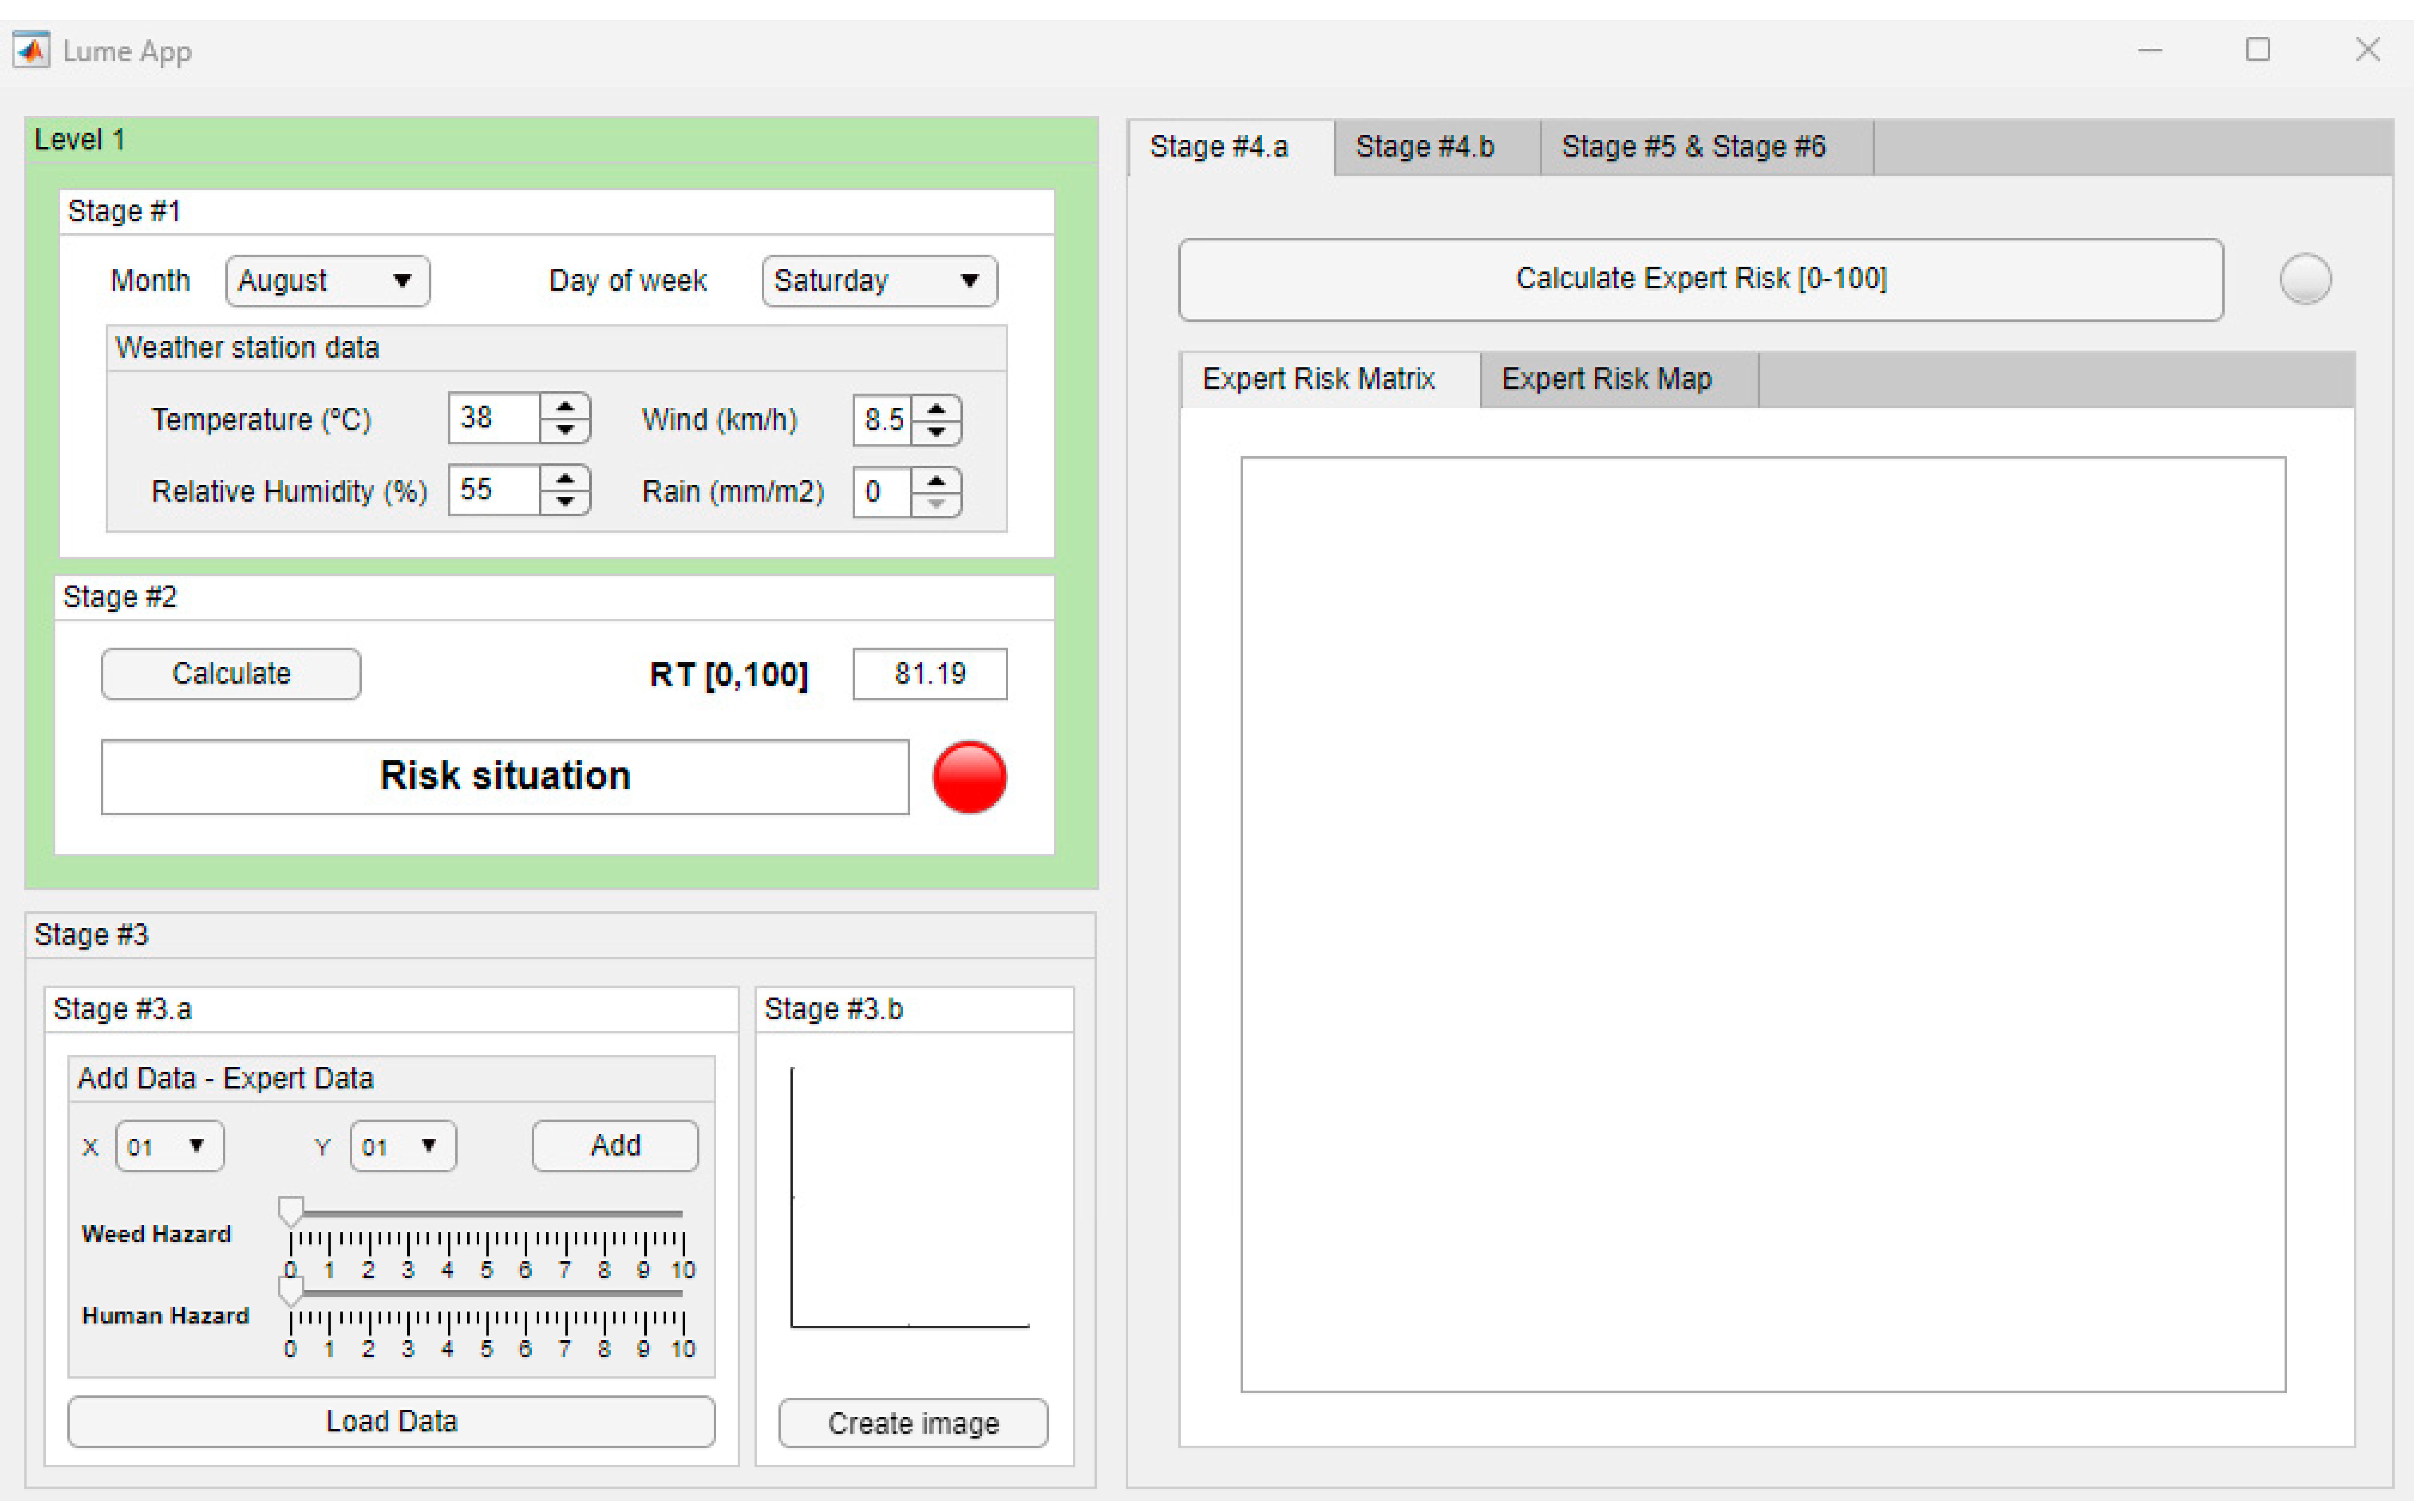
  • Stage 1—Information collection from the weather station: In this stage, the atmospheric variables (temperature, relative humidity, wind speed, and precipitation) from the weather station are gathered, as well as the day of the week and month. Once all the initial information has been collected, it is analyzed and normalized, discarding strange values or those far from the average. Then, the data are processed and interpreted.
  • Stage 2—Calculation of the risk level in the study area: In the second stage, the aim is to determine whether a fire could occur in the natural park based on the historical dataset, taking into account the data collected in the previous stage. For this, a classification machine learning algorithm will be used [22]. This employs an approach that can be understood as a statistical inference process where a reasonable data distribution is determined. The use of such algorithms, dependent on training in the search for relationships, obeys the basic assumption that some kind of distribution or pattern exists that can relate the variables under study taken within a period of time. As can be deduced, this is a naive and certainly questionable estimate because the start of a fire will be influenced by very diverse variables.
Furthermore, there will be an unquestionable random component associated, on the one hand, with the variables not contemplated in the study and, on the other, with the categorization and discretization of the variables considered. However, the aim of this first level is not to disregard, or even limit, the influence of chance but to assess in a general and imprecise way whether there are variables associated, directly or indirectly, with the prevalence of fires in a given area. It is, in fact, a casuistic relationship modeled through underlying patterns in the data that the training process is able to find, assuming the dataset is reliable. If, for example, and as is logical, it is observed that the incidence of fires is higher in summer months, this first level of risk must be quantified in a vague way, only warning of this relationship but never presenting a reasoned model.
To this end, the starting dataset will be prepared first and then a classification algorithm will be trained to determine the risk, which we will call Objective Technical Fire Risk, of a fire occurring in the areas studied, taking into account the incidence variables indicated in Table 1. If a risk situation is observed, the second level of the methodology could be used to determine in which areas it would be more plausible for a fire to occur. Otherwise, it will be indicated that there is no risk and that it is not necessary to intensify surveillance and prevention tasks.
Level 2:
  • Stage 3—Collection and adaptation of information: During this stage, the information needed to determine in which area of the study region the fire could occur is compiled and adapted. This stage is a necessary step prior to approaching the inferential process of fire detection in a given area. Any algorithm with inference capabilities must have data to support this knowledge generation. These data can be expressed in different ways and constitute, in themselves, an ontology characterized by classes, relations, axioms, and instances [28,29,30,31]. However, this ontology of knowledge will have a different structure depending on its purpose and application in the inferential process and, of course, will adopt a particular form in each of these applications.
As already mentioned, this paper presents an approach to the problem of fire detection using a hybrid model of artificial intelligence. It combines statistical and symbolic inference models, i.e., algorithms employing machine learning, preferably supervised, with those employing symbolic reasoning models based on fuzzy logic engines. Although both models are formally different, both share a common link: they start from the same knowledge to obtain their answers. It is the nature and expression of that knowledge that differs, and therefore the ontological basis of each of them will be different. While in a symbolic model syllogisms must be sought to express reasoning, in a statistical model data must be available to represent knowledge objectively, using mathematically coherent structures. Thus, if in the former the key is to formalize and diversify knowledge through a series of declarative rules, in the latter the key is to reduce the dimensionality of the data, increasing their statistical relevance; although, ideally, an effective formalization is also sought. Therefore, in the methodology presented here, it will be necessary to create two different knowledge bases.
One of them, the symbolic knowledge base, will collect inference or implication syllogisms stated by experts based on their experience. The other will create an image structure which will merge different data arrays, all related to the presence of fires, with others associated to the geographical layout of the areas to be analyzed. The starting point is a map of the region under study which necessarily includes a overlain grid to delimit the different zones using a pair of coordinates (X,Y). Below, we will discuss the creation of each of the described knowledge bases through two sequential stages:
Stage 3.a—Compilation of expert opinions and evaluations: In this sub-stage, the opinions and evaluations of an expert on each of the different study region zones are collected. The expert will answer a series of questions in pairs, which are summarized in Table 2. The expert must answer each of the questions indicating on a ten-point Likert scale with a step of one the fire danger value associated with both the undergrowth and the human presence. These questions must be based on an unambiguous definition of the term ‘hazardousness’ to avoid cognitive biases on the part of the expert.
Hazardousness is a term associated only with the cause of a wildfire. On the one hand, excessive and neglected undergrowth can act as fuel in a fire, which is a proven and unquestionable fact. Likewise, it has also been proven that carelessness due to human factors lies at the origin of many fires. However, does the presence of undergrowth and human activity increase the hazardousness of an area, or in other words, does it increase the risk of fire in the area? It is certainly not possible to confirm or disprove such a statement categorically. There is an enormous component of randomness and uncertainty which manifests itself in many different ways. Therefore, the determination of this hazardousness is a complex problem which includes uncertainty.
The results collected in Table 2 quantify the danger level that, in the opinion of the expert, each of the factors presents in a specific area of the study region. These quantifiable values will be subsequently interpreted through a fuzzy inference system that will link them with the set of syllogisms that make up the expert knowledge base, a base that must be defined before the application of the system.
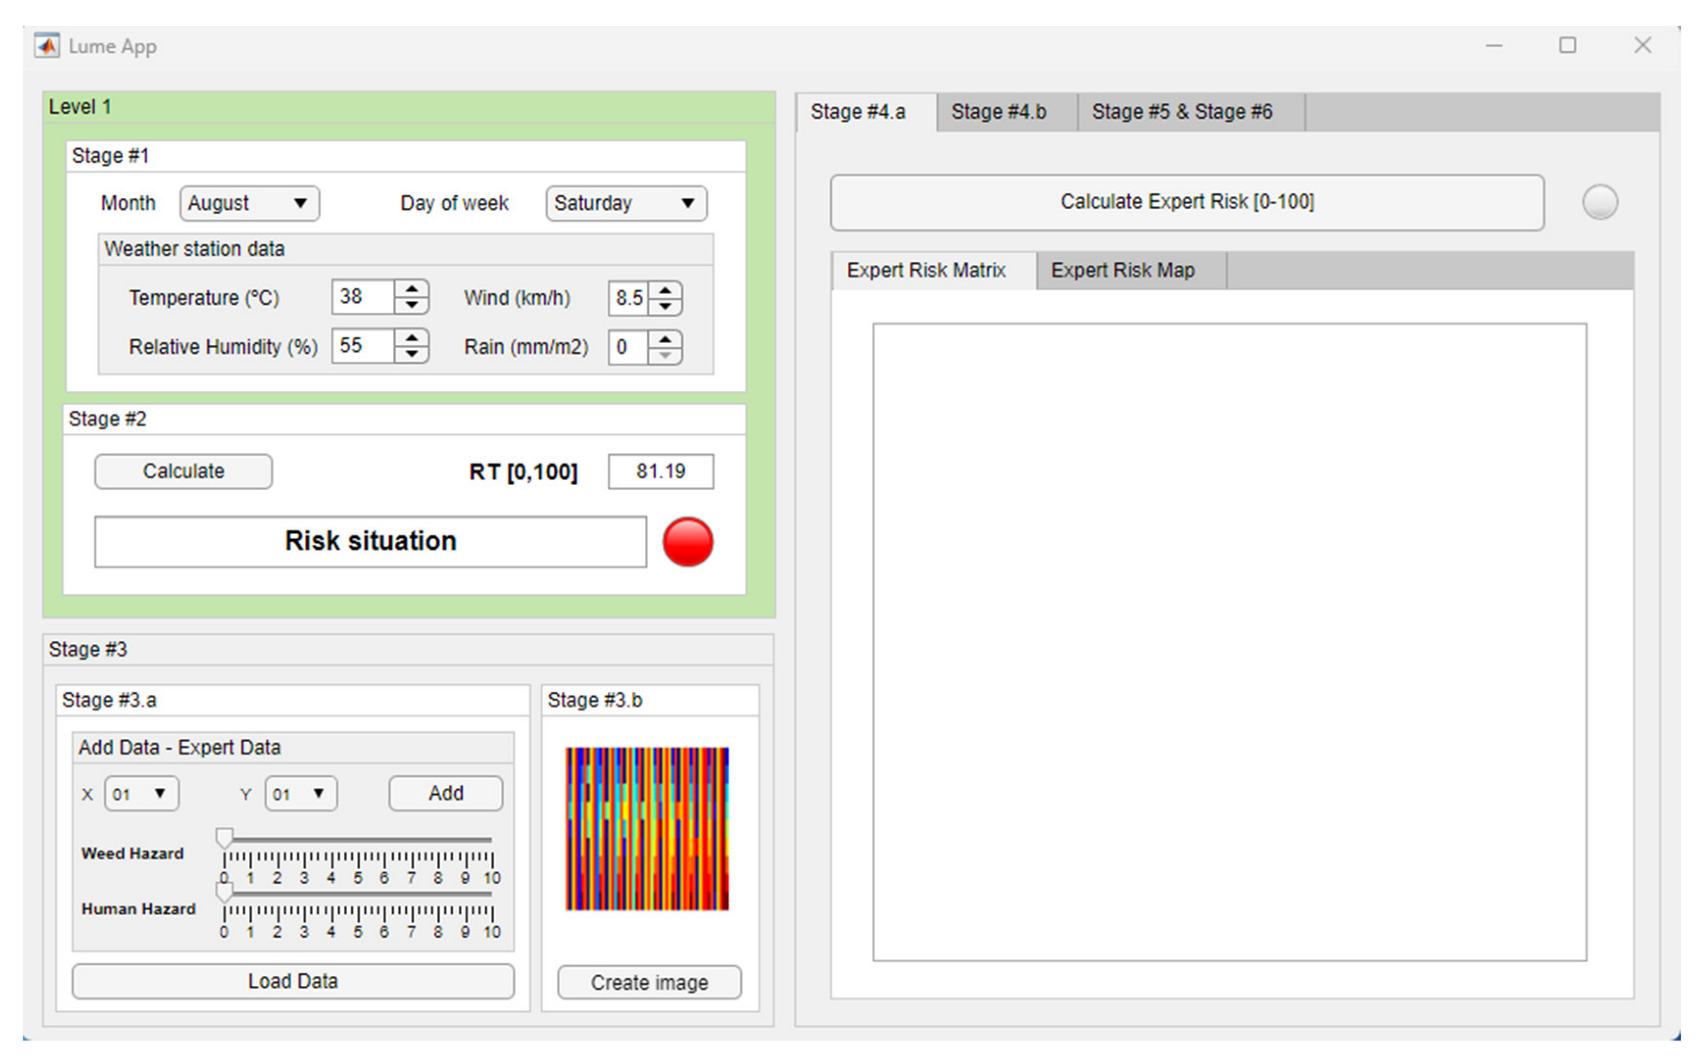
Stage 3.b—Image generation: In this sub-stage, images are composed that are characteristic and representative of the objective data. In the previous stage, a knowledge base was created from the experience, training, and intuition of the forest fire expert. Undoubtedly, this is a way of limiting the uncertainty present in multivariate problems [32,33] such as this one without addressing them in the way argued above. However, there is a fact associated with knowledge bases that conditions their validity, and it is none other than the presence of false witnesses in the construction of logical constructs. How is the veracity of the expert’s reasoning evaluated? It is not a matter, in this case, of questioning the reliability of the data or environments being analyzed but of evaluating the degree of certainty, replicability, and formalization of the expert’s knowledge in order to avoid false judgments and therefore imprecise syllogisms. For this reason, at the same time as the knowledge base discussed in Stage 3.a is constructed, Stage 3.b sees the construction of an image that represents a fire risk situation in each of the areas being analyzed in the study.
Using an image instead of a series of variables to characterize a specific region accepts the assumption of the existence of numerous hidden variables, underlying the ones given, which may have an influence on the fire risk. Due to their nature, it is not feasible to carry out factor analyses that would allow us to group the initial data statistically, nor is it feasible to identify a casual dependence between them. If we add to this the difficulty of making all the initial data uniform, given the heterogeneity of their measurements, and the influence that the lie of the land may have on the fire, which cannot be ruled out, it is reasonable to estimate that an image of the area, derived from the zenithal plane and enriched with additional data, may constitute a very useful starting dataset to complement the previous one. In this case, the images created serve precisely to detect inherent distributions between the explanatory and explained variables, identified through machine learning processes. Therefore, each of the quadrants on the map will be characterized by a series of values (the risk determined at the first level, the frequency of historical events in each quadrant, the day of the week, the month, and the coordinates of the quadrant), rescaled and expressed in grayscale (0–255). After that, a color map is applied on each grayscale image, providing an image in RGB format.
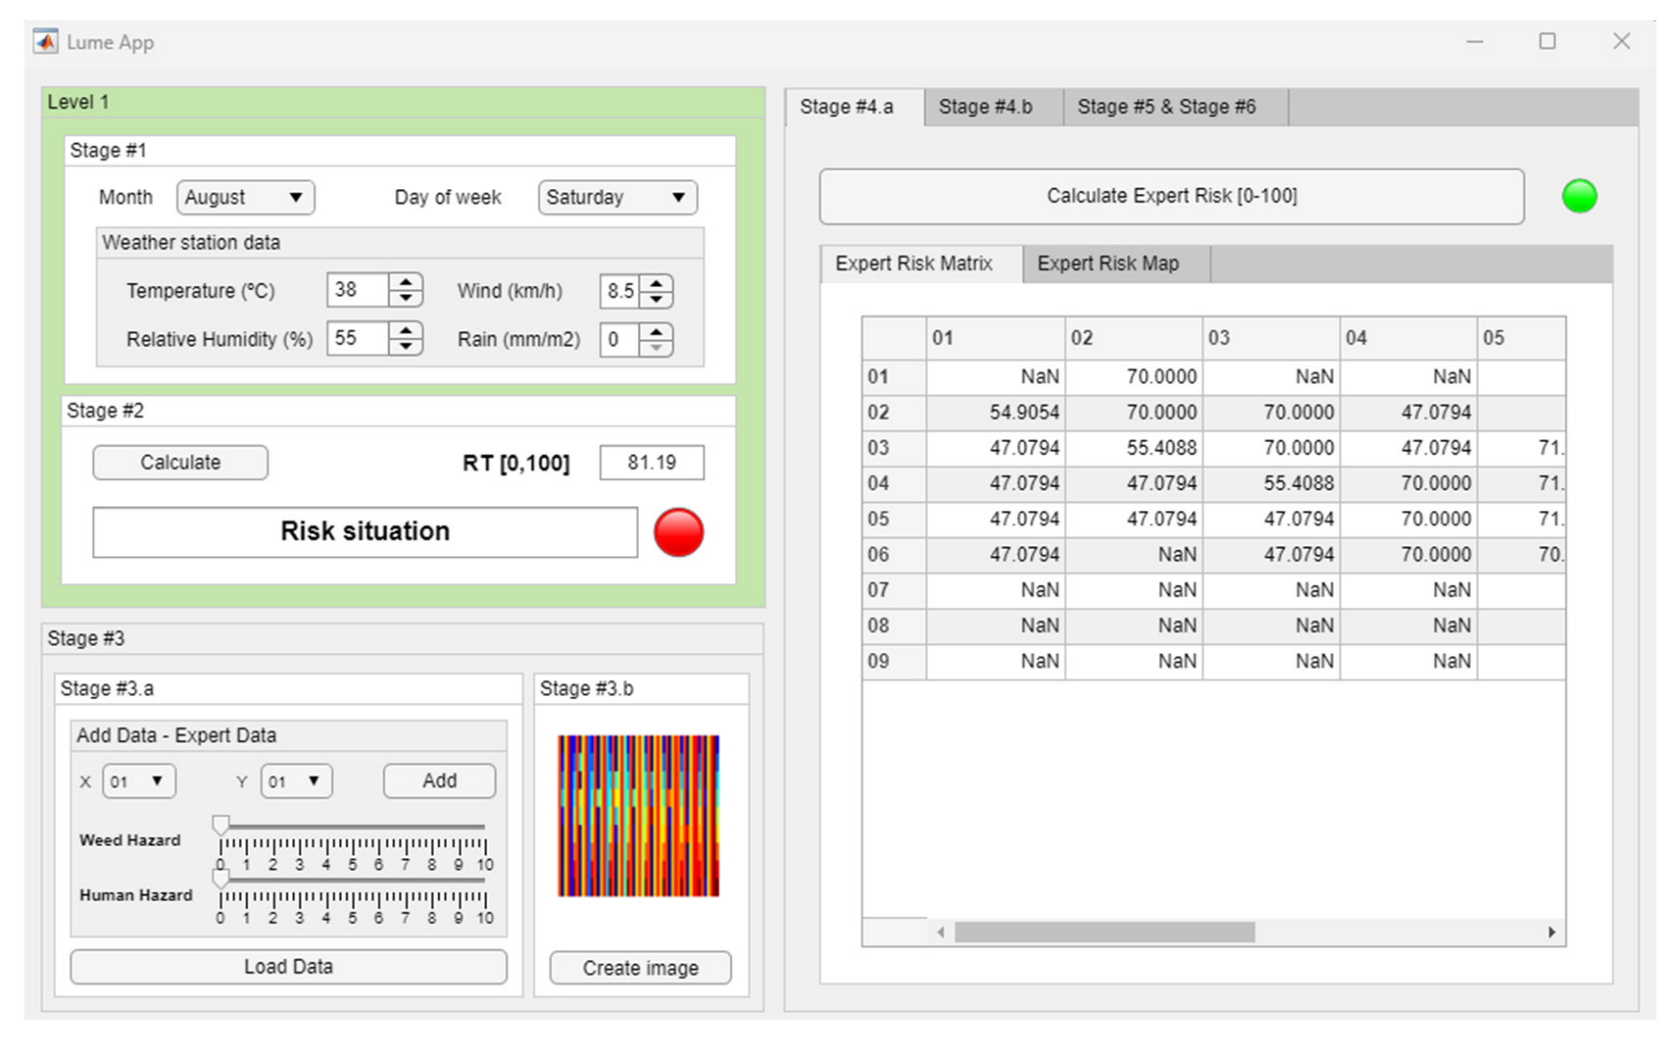
  • Stage 4—Determination of risk matrices: Once the information has been collected and the images have been generated, which constitute the knowledge bases of the problem, the next step is to process the information, which is done through two sub-stages running concurrently [23,24,25,26]. In this stage, the concept of risk matrix is introduced, understood to be a representation of the set of fire risks associated with each zone of the study map represented in the form of a matrix. Taking the knowledge bases created above, two types of matrices associated with their respective resolution approaches will be determined.
Stage 4.a—Determination of the Expert Risk Matrix: The expert’s opinions and assessments collected in Stage 3.a will be processed by an expert system based on fuzzy logic, which allows a risk value for each zone to be determined and represented in each quadrant, giving rise to the Expert Risk Matrix. The choice of expert system is no trivial matter. In this case, given the nature of the knowledge base, it is not a question of finding distributions, relationships, or patterns that relate fire risk with variables that could be defined to describe undergrowth or human presence. The problem is reduced to analyzing the syllogisms that make up the knowledge base and, from them, inferring an explicit and deductive reasoning, in accordance with the expert’s experience.
Therefore, a knowledge base is needed that reflects the expert’s knowledge based on experience and intuition of why a fire occurs in a given area. This knowledge must be expressed in the form of syllogisms and will serve as a basis for subsequent processing. In this case, it is not a matter of finding more or less relevant relationships between the explanatory variables and the explained variables, but of defining an ontological knowledge base that allows the elaboration of chains of reasoning with logical structures of statements and predicates represented through rules expressed both in the form of inference and implication syllogisms.
As already mentioned in Stage 3.a, the expert knowledge base will be elaborated taking undergrowth and human presence as explanatory variables, while the explained variable will be Expert Risk. The set of declarative rules that form the knowledge base will be a series of syllogisms that represent the cause-and-effect relationship between the different degrees evaluated by the experts of undergrowth and human presence and the degree of fire expressed as the aforementioned Expert Risk value. The knowledge base developed for the proof of concept of the intelligent hybrid system is made up of 21 syllogisms that combine, through logical conjunctions, the antecedents (explanatory variables) implying the consequent (explained variable), in this case the Expert Risk. Thus, the intention is to elaborate a structured, defined, and explained knowledge base which not only aims to find statistically significant relationships between the explained variables but also to elucidate the chain of cause and effects. This combination, therefore, as mentioned in Stage 3.a, is a complex problem which includes uncertainty.
There are numerous approaches in the literature that try to provide an answer to this type of problem. Evidently, conceiving uncertainty as a probability is one of them, and this links to the whole family of probabilistic inference algorithms [34]. Classical multivariate analysis techniques could be used to obtain a predictive model [35]. Others include deep learning approaches based on neural networks. Similarly, there are statistical inferential approaches based on reducing the dimensionality of the problem and finding meaningful relationships. All are equally valid but share a common link: they start from the inherent truthfulness of the data. However, data are usually unreliable, contain errors, and are conditioned by multiple variables, all the way from their collection to the filtering processes. All this increases the uncertainty to be dealt with in the problem, which can no longer only be attributed to lack of knowledge but also to other sources such as interaction, ambiguity, or behavior.
To deal with this uncertainty, this work uses symbolic inference models, which have been proven as sufficiently capable of dealing with the different sources of uncertainty using logical structures of knowledge supported by particular inferential models that are not probabilistic, such as fuzzy logic. This not only makes it possible to control the uncertainty of the problem but, even better, to model and explain it. A brief example can be seen if we were to quantify the undergrowth of an area in terms of a discrete number of descriptive variables. It would then probably be possible to find relationships between these variables and the fires, but with the same probability, we would lose the influence of other unidentified, underlying variables with equal or greater relationships but perhaps no formal relationship with the variables already defined. In other words, we would be creating a stochastic model of the problem where there is an obvious influence of chance.
However, if the value of hazardousness was explained through logical constructs, then we would be defining knowledge that precisely contrasts experience in direct response to chance. The expert—whose answers are based on experience, on knowledge, or on intuition—is able to warn of the danger and to represent it in the form of syllogisms, thus reducing the uncertainty of the complex problem. Of course, all this will be possible if that experience and that knowledge exist. The difficulty of modeling knowledge and representing it in syllogisms is enormous, but it is a way to diversify and formalize knowledge itself. In this way, the expert will be able to quantify the danger without probabilistic training or models.
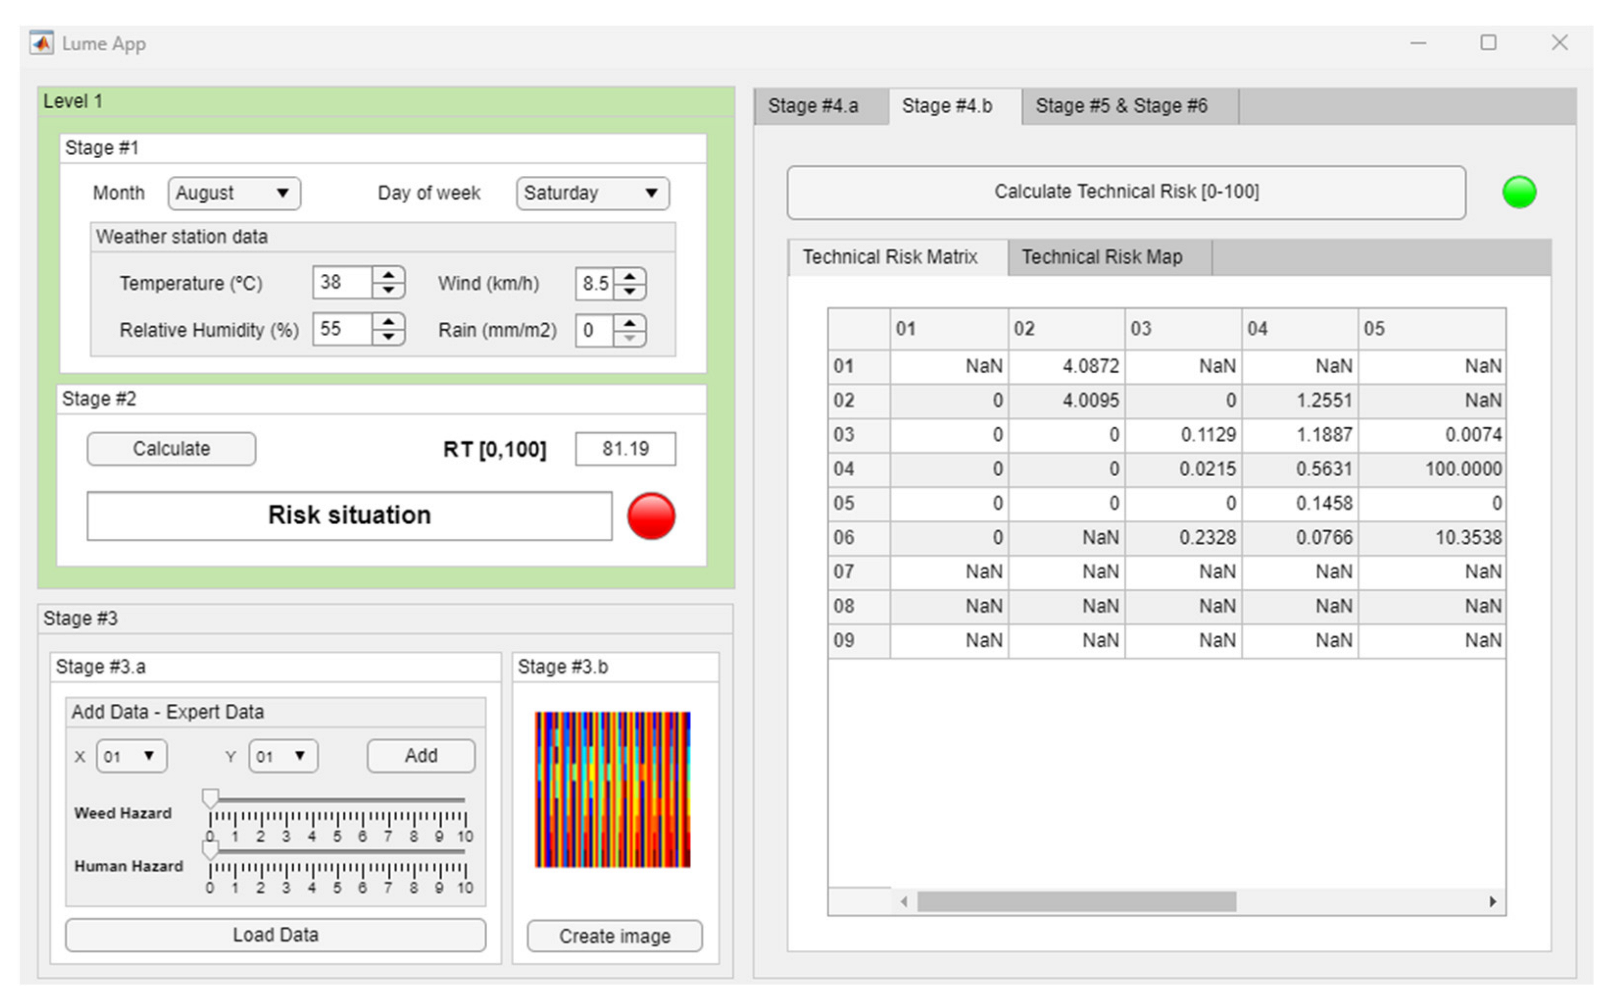
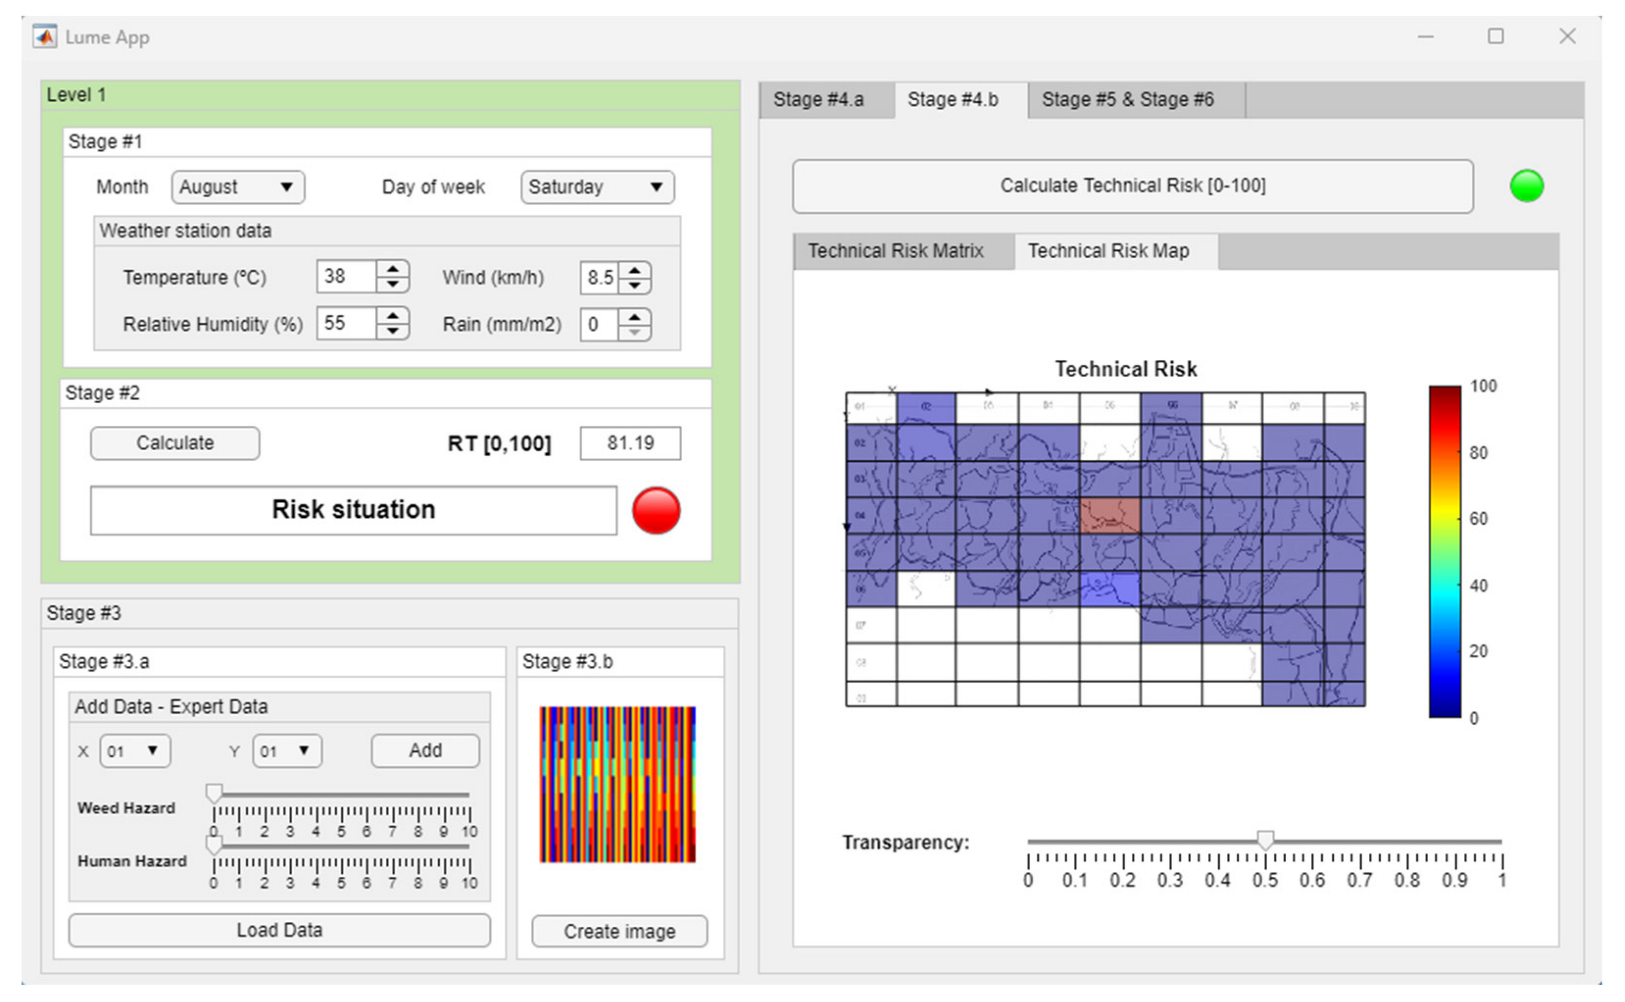
Stage 4.b—Determination of the Technical Risk Matrix: Concurrently to Stage 4.a, in Stage 4.b, the image is processed by a convolutional neural network through which it is possible to determine a series of scores that make it possible to point towards those areas in which, based on the historical data, it is plausible that a fire may occur. From these scores, it is possible to build a matrix that collects them, called the Technical Risk Matrix, associating each position to each of the zones or quadrants of the map. As before, the choice of a convolutional neural network is not arbitrary. When the knowledge base can be understood as a grouping of data arrays, which is, in essence, what the image represents, the identification of distributions of the explained variables is a process implicit to supervised learning algorithms.
However, it is necessary, as argued in the explanation of Stage 2, to assume the veracity of the data—not only of the data themselves but also of the rules that explain them. In environments of great uncertainty such as the one contemplated by this methodology, it is therefore necessary to have effective management of uncertainty from different perspectives. With expert systems, the uncertainty associated with the interaction and collection of data is controlled and the epistemological uncertainty is certainly limited. The declarative rules of symbolic engines have served to formalize and diversify knowledge, but as argued in Stage 3.b, they do not prevent the definition of false rules. In essence, the expert system itself, which gives programming support to symbolic inference, can detect and reduce false information by discarding, in a significant number of stages, false syllogisms.
Experience, expert knowledge, and intuition are reproducible within an expert system, which means that unreplicated explanations will be the result of chance and thus will not constitute an ontology of knowledge as previously stated, deactivating those rules that make the fuzzy logic residing in its inference engine work. However, in addition to the control offered by the expert system itself, in this work we propose to use a model that, again using learning, can insert an additional layer of control to the veracity of the expert judgments. In the hybrid system presented here, the intention is to control the influence of the expert by comparing their reasoning with that derived from a more direct analysis, linked to that proposed in Stage 1 of this section but obtained in a deeper and more contrasted way.
Although different statistical reasoning models could be used, in this case we have chosen to use the connectionist paradigm of artificial intelligence, i.e., artificial neural networks. It is important not to forget the limitations associated with this type of approach, already mentioned in the description of Stage 3.a, and its dependence on the certainty of the training data. By using neural networks, the aim is to emulate the chain of reasoning within a structure divided into neurons whose collective action will advance through a framework of layers so that, finally, they have the capacity to determine a variable that categorizes, classifies, or distributes the input variables. There are numerous network topologies, some of them already used in the treatment of forest fires as seen in Section 1.1. In this work, we have opted to use a convolutional neural network. This type of network, which potentially dates back in its initial development to the work of Yan Lecun in the 1990s [36], has evolved, especially since the early 2000s, in the detection, segmentation, and identification of objects and regions in images, a field in which it has achieved an enormous degree of evolution and sophistication.
The essential operation of such networks relies on an internal architecture that combines convolution layers, where areas with joint features within the image are identified, and pooling layers, where similar features are merged, to finally obtain a hierarchical representation of the input data [37,38]. They employ a type of supervised training that characterizes each data input, and this allows them, after employing classification layers, to return an output variable value that characterizes the input image. Convolutional networks present unquestionable advantages when applied to data structures expressed in the form of multiple arrays, which allows the number and significance of the starting variables to be increased.
Taking advantage of the presence of local connections, shared weights, grouping, and using multiple layers [37], convolutional networks can treat and classify data clusters more simply and reliably, and these can then, for example, be represented in the form of an image. Thus, this type of network typology allows a whole series of starting data to be grouped into an image and their dimensionality reduced without losing the characteristics that group and classify those data, therefore increasing the reliability of learning in applications of this type. Likewise, as will be discussed later, this constitutes a formalization of knowledge and therefore increases its representativeness in the issue being addressed. When contrasting the results obtained by means of the expert system with those obtained with the convolutional network, two different measures of risk are obtained which, however, measure exactly the same thing: the prevalence of a fire in a given area.
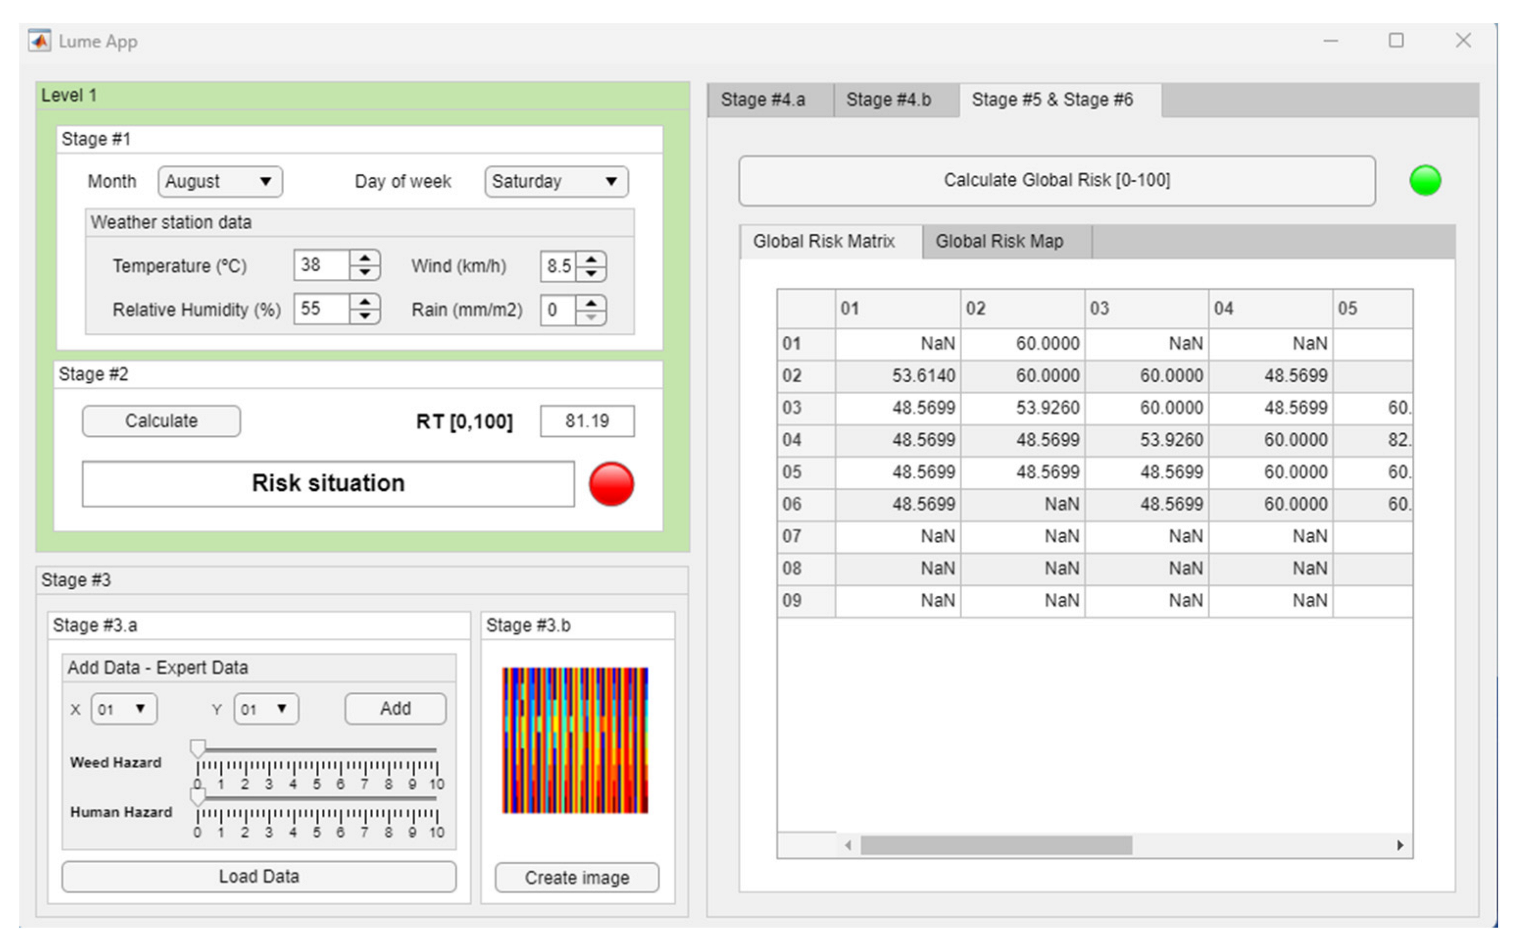
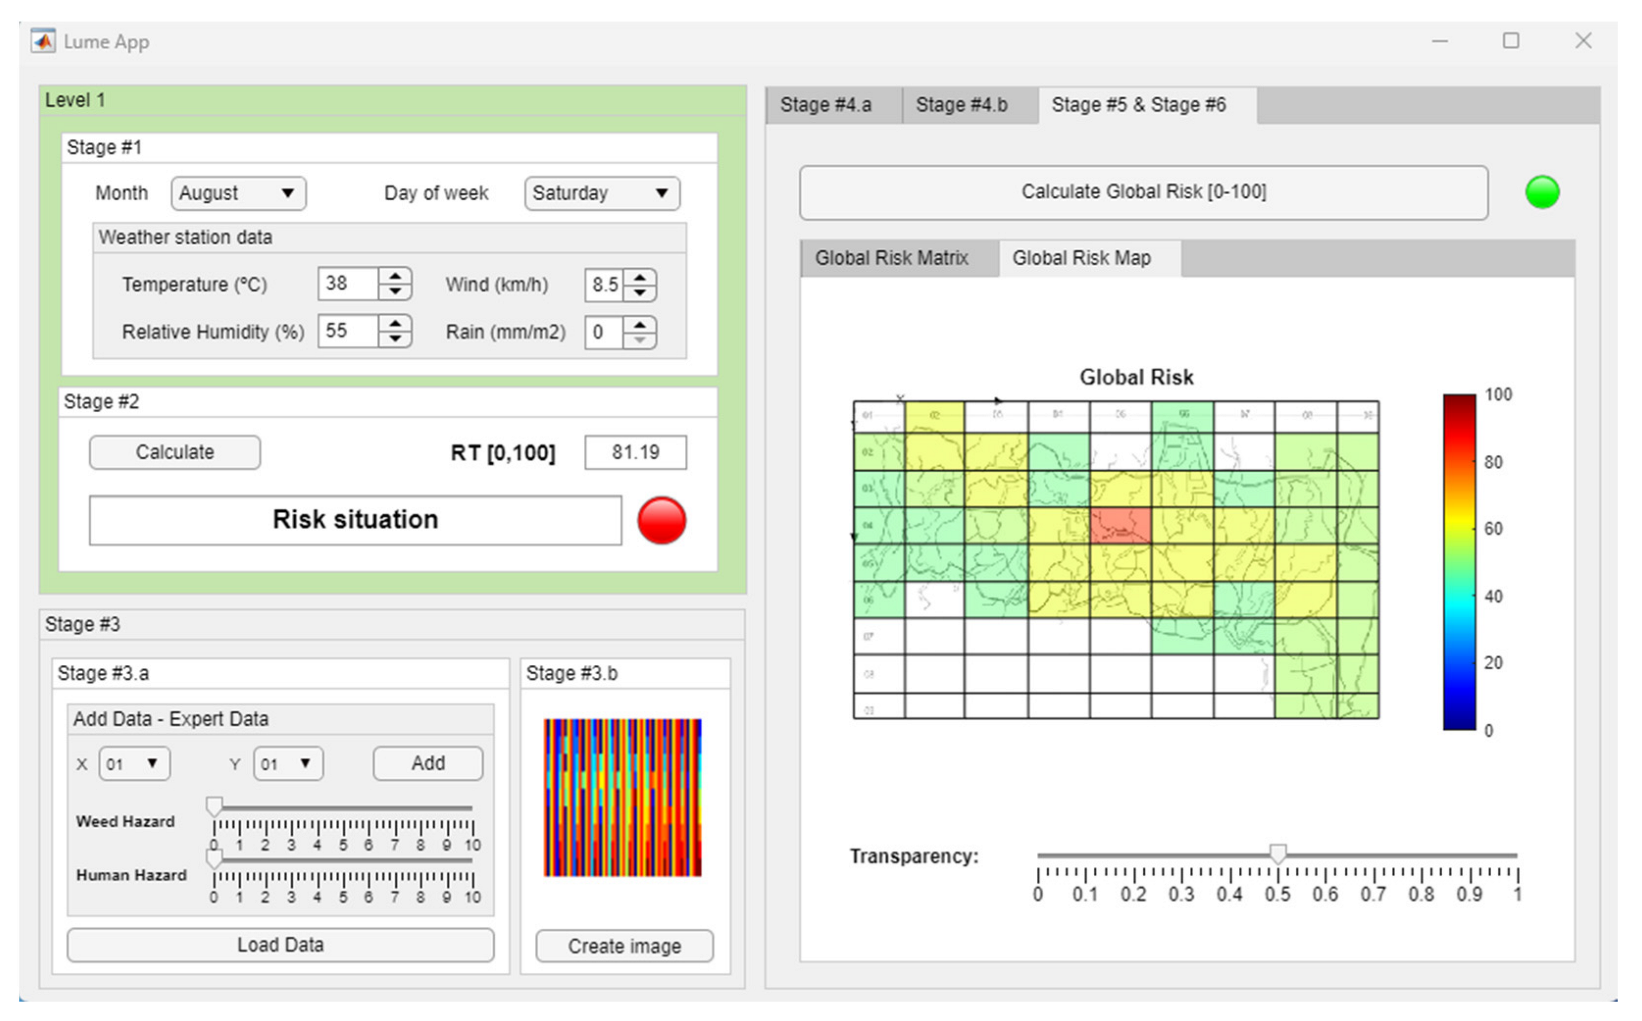
  • Stage 5—Determination of the Global Risk Matrix: Once the risk matrices associated with the opinions and assessments of the expert and the image have been determined, they are then aggregated using an expert system based on fuzzy logic that makes it possible to determine a third matrix, called the Global Risk Matrix. It is significant that both the Expert and Technical Risk refer to the same prevention problem and therefore make use of joint knowledge that has been expressed, even though this expression uses different grounds. Joining the two allows effective and complete control of the different sources of uncertainty present to detect not only imprecision or vagueness in the starting data and the creation of the image, but also false or incorrect judgments in the wording of the rules in the expert systems. This control is exemplified by risk linking or aggregation.
Of course, there are many ways to link these two already quantified variables ranging from simple weighted sums to approaches that specifically take into account their significance. In this methodology, aggregation is provided by a new expert system based on fuzzy inferential engines. The difficulty of analytically linking both risks arises from their conceptualization since they are values derived from two concurrent inferential processes, and therefore their definition is subsidiary to those. Establishing numerical aggregation criteria, equations, or any other numerical model would mean adding additional uncertainty in the determination of the Global Risk, which is exactly what the whole process sought to limit. This is why it was decided to use a symbolic system.
In the absence of tangible, quantifiable, and discrete knowledge, it will be the experience of the professionals in charge of fire identification that will determine the best way to link these risks. Thus, as in Stage 3.a, they will have to define a series of syllogisms that will make it possible to establish rules for linking the two risks and relating them to an objective classification of the concept of Global Risk. It is, therefore, a question of elaborating a new expert knowledge base; however, in this case, it does not refer to the analysis of the causes of fire but rather to the way in which the two measures of risk, expert and technical, are combined. Therefore, this knowledge base should not, and cannot, be defined before the determination of the risks and the joint presentation of all the data used by the methodology.
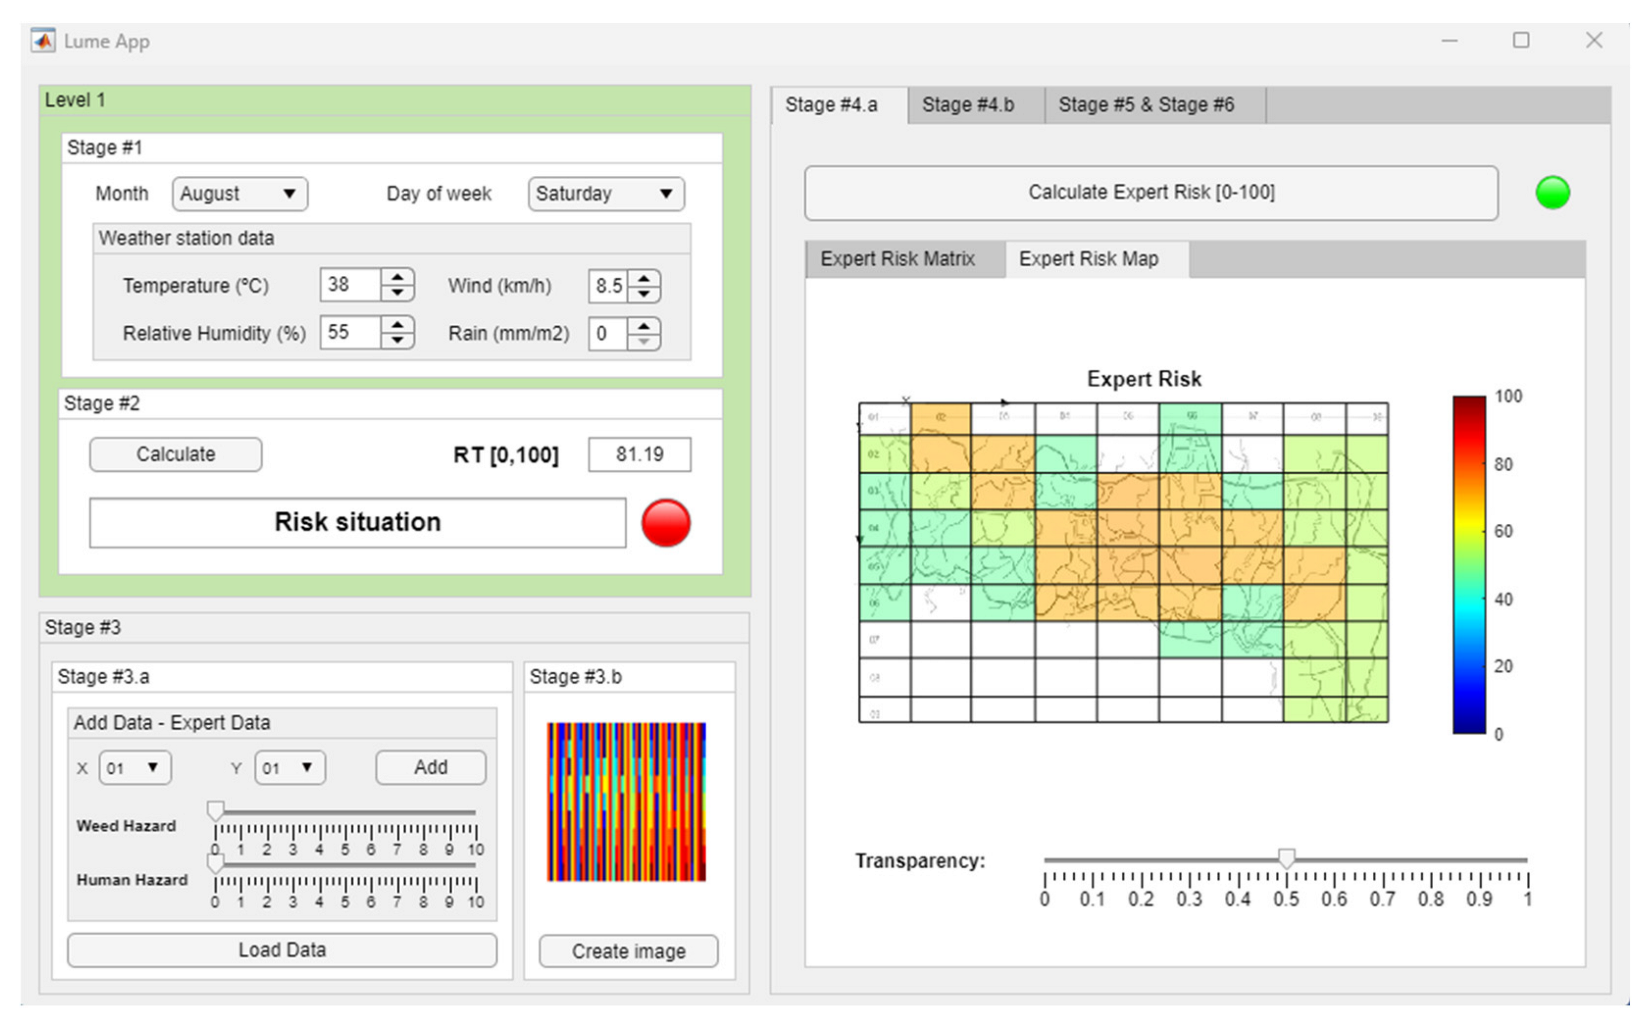
  • Stage 6—Alert Generation and Decision Making: Taking the Global Risk Matrix, it is possible to build a color map, which, when superimposed on the study region map, makes it possible to determine those places where a fire could occur on that day. This makes it easier for those responsible for that region to define strategies for surveillance, prevention, and action. In this case, the color scale is subjective and is used as a graphic support for the previously calculated Global Risk values. This scale does not introduce apparent subjectivity in the methodology or in its results since it only affects the way they are shown, serving as a support for decision making.

2.2. Implementation of the System

Now that the internal architecture of the hybrid methodology presented in this work has been described and argued, this section will describe its implementation through a software artifact so that it can be used both in isolation and integrated into information systems. Picking up from previous section, the methodology includes a series of stages, arranged on two large sequential levels of action, which could be grouped according to their objectives as follows:
  • Collection and adaptation of the information, which would cover Stages 1, 3.a and 3.b;
  • Processing of this information, covering Stage 2;
  • Inferential determination of risks, covering Stages 4.a, 4.b and 5;
  • Generation of alerts, covered in Stage 6.
Next, the implementation of the designed software artifact will be described, which will be limited only to the adaptation and processing of the information once it has been collected in Stage 1. Various screenshots of the graphical user interface are provided for this. As a programming tool, MATLAB© software (Version R2021B, Natick, MA, USA) has been used, employing the App Designer module [39] for the development of a functional user interface, the Fuzzy Logic Toolbox [40] for the programming and use of fuzzy inference systems, the App Classification Learner [41] for the adjustment and validation of classification models based on machine learning, in addition to the Deep Learning Toolbox for the design and implementation of deep neural networks [42]. For dataset balancing, the Imbalanced-learn library [43] in the Python language was used. The choice of this software was based on criteria of availability, relevance, and dissemination of results.
The construction and training of the models was carried out in a computer with the following characteristics: Intel® Core™ i9-10980HK CPU @ 2.40 GHz, NVIDIA GeForce RTX 3070 Laptop GPU, and 32 GB RAM.
Figure 2 shows the main screen of the developed software artifact. Two areas can be observed. The one with a green background refers to the first level of the application, where Stage 2 is implemented, while the other boxes refer to the second level of the application, where the following stages, 3 to 5, are developed. Stage 1 takes place before using the software and is not therefore included.

2.2.1. First Level of the Methodology

Data Preparation: Data Normalization and Augmentation

To use the proposed methodology and to be able to trust the conclusions provided by it initially on the first level, the statistical classification algorithm must undergo the training process for which it is essential to have a consistent labeled dataset. This process is also vital for the second level of the methodology in which two knowledge bases of analogous meaning but different nature must be created. On the one hand, there would be the knowledge bases to be used with the expert systems, both for the determination of the Expert Risk Matrix and the Global Risk Matrix, and on the other, the knowledge base made up of a robust and wide-ranging set of images that allows the training of a convolutional neuronal network that can identify the Technical Risk Matrix. In all cases, the data must avoid including sources of uncertainty from outside the process.
Then, the set of raw data, taken from the meteorological station (temperature, relative humidity, wind speed, and precipitation), is first normalized. This normalization seeks to standardize their quantitative scale and therefore facilitate their interpretation and comparison for use in both statistical and symbolic models. This task is done using the Z-score normalization method, which is expressed mathematically in Equation (1), where x is the value of the variable to be studied, while μ and σ are the mean value and standard deviation of each of the variables, respectively.
Z S c o r e = x μ σ
In addition to the aforementioned data, the initial dataset also contains the day of the week and month, as well as the coordinates of the area or quadrant in which the fire occurred, which are treated as categorical variables. All these variables will form the set of independent or explanatory variables. The dependent or explained variable in this case is associated with the burnt area, from which the label ‘fire’ is established when the area burnt is greater than zero and ‘no fire’ when the area burnt is zero.
Data normalization is a necessary step prior to the dataset preparation process. As already mentioned, the intelligent hybrid system described in this article combines two different inferential models: on the one hand, a statistical model and on the other, a symbolic one. The former, widely known in the field of machine learning, uses a statistical reasoning approach in which explicit and explained knowledge of the starting data is not required, unlike the latter, where prior logical knowledge is always required, usually represented through sets of declarative rules. In our case, the initial numerical data, which will determine the objective Technical Risk and, finally, the Technical Risk, will not be formalized as rules but will be fed as numerical data into the classification algorithm and as images, formalized from those same numbers, into the convolutional network. To do this, we must not only have these numbers available but also a label that classifies them and allows us to understand what is precisely intended to be predicted, even though there is no coherent logic that allows us to explain why a sequence of numbers has one label or another. However, in addition to this, since it is not possible a priori to explain the data, it will be necessary to have a significant amount of them that allows the algorithm to find underlying and significant statistical reasoning patterns avoiding bias due to imbalances in the labels or a small number of data. In analogy with symbolic reasoning, it is a question of creating a set of unexplained knowledge that makes it possible to formalize the largest possible number of relationships between numbers and labels and with this, increase the reliability of the classifier. Thus, in this case, and given the characteristics of the starting dataset, it will be necessary, on the one hand, to considerably increase the number of data and, on the other, to suitably balance this new data.
The first column of Table 3 shows the grouped variables of the starting dataset once it has been normalized. After normalization, the starting data is augmented, without the X-coordinate and Y-coordinate variables, using the Synthetic Minority Over-sampling Technique for Nominal and Continuous (SMOTE-NC), an extension of SMOTE [44] that allows synthetic data to be generated when there are also non-numeric data in the dataset, by using a number of neighbors in the minority class equal to 4 (k = 4). This synthetic dataset will be used to train the classification algorithm based on statistical inference. It goes from 247 ‘non-fire’ and 270 ‘fire’ cases to 1000 cases of each of the classes. Synthetic data is widely used, discussed, and validated in the field of artificial intelligence. It solves the problem of data imbalance and although it can cause particular recurrences in the results, the use of algorithms such as SMOTE-NC considerably reduces these possible negative effects, improving the results in the binary classifiers [26,44,45].
At the same time, the construction of the dataset to be used for the subsequent construction of the image database is also undertaken. For this purpose, the normalized dataset, the first column of Table 3, is taken and filtered, considering only the fire cases; this classification variable is then dispensed with. After this, a new variable is defined, which identifies the quadrant in which the fire occurs, grouping together the variables X-coordinate and Y-coordinate, the third column of Table 3. It is important to note that in some of the quadrants there had only been one or two fires in the historical data, which is why this record is replicated until there are at least five records per quadrant. Once this is done, synthetic data is generated by again applying SMOTE-NC with k = 4, in order to solve the possible imbalances between quadrants and provide a sufficient corpus of data to subsequently build the image database that will be used to adjust the convolutional neural network. A total of 32 observations for each of the zones/quadrants in which there was at least one fire in the historical data were obtained. Due to the complexity elaborating this image database, a more detailed description is included in Section 2.2.2 under Image Construction.
Regarding the construction of the knowledge base needed for the implementation of the symbolic inference models, it will be necessary to differentiate, on the one hand, those used in the determination of the Expert Risk Matrix, and on the other hand, those used to quantify the Global Risk. In this stage, only the former can be defined, derived from the joint analysis of the initial data, both raw and processed, using the experience, knowledge, and intuition of a team of experts in forest fire identification and eradication. In this case, the knowledge base will be composed of a series of declarative rules expressed in the form of an inference syllogism with a structure of the following type:
If A is a Qualifier of A and B is a Qualifier of B, then C is a Qualifier of C.
In this case, A and B are the explanatory variables of the problem, as shown in the fourth column of Table 3. They correspond to the presence of undergrowth and the assessment of human activity, respectively. C will be the explained variable, in this case the Expert Fire Risk. The team of experts, taking into account all the data collected and analyzing the previously created databases, must formalize their knowledge by elaborating a list of rules covering a plausible and causal explanation of the presence of a fire in an area, taking the explanatory variables into consideration. The determination of undergrowth and human activity as causes of a fire or, at least, an increase in the risk of its occurrence is not simple. As mentioned in Sections related to Stages 3.a and 4.a, there is no inductive or deductive logic to ensure a relationship or distribution between a quantification of these variables and fire risk. However, neither is it possible to affirm the opposite, namely, the complete absence of a relationship. If, as has been done, we reserve quantifiable (and easily augmentable) variables for statistical inference, we must reserve those more subjective variables for symbolic inference and derive their chains of reasoning through the creation of rules that must, of course, recognize those quantifiable data in their construction. That is why these two variables are used in the expert judgment since they are sufficiently significant and group so many relations in them that they allow knowledge to be structured, which is of great value for the methodology. The following rule can be used as an example:
IF (Undergrowth is Low) AND (Human Activity is Medium) THEN (Expert Risk is 70).
Here, the experts recognize that human activity is a significant fire vector. This activity occurs mostly in the summer season in wooded areas, in areas with public services and near vehicle accesses, roads, and trails. It is clear that the season of the year, the presence of roads, or the location of public amenities are factors that are understood in the experts’ experience and knowledge as increasing the risk of a fire even more than a build-up of undergrowth. Likewise, this empirical belief is supported by data collected by weather stations and fire history data in the region. If we assume that the expert judgment is truthful and unconditioned, the above rule and the whole set of rules can be used to model the knowledge, experience, and even the intuition of the group of experts, which adds enormous and differential value to the methodology.
The declarative rules representing the explained knowledge of a fuzzy inference system must accurately represent the experience of the team of experts that define them and therefore collect situations that are possible and certain. This is the process of formalizing expert knowledge and it must be as diverse and complete as possible since otherwise it could be the case that another expert could not identify their knowledge with any of the exposed rules, hence the inherent difficulty in the elaboration of a knowledge base based on sets of symbolic and logical rules: it must be guaranteed that all the knowledge is being formalized (represented) and diversified (expressed) in such a way that all the experts involved can consider it as certain. Thus, could two rules with the same antecedents have different consequents? Yes, of course, since each rule represents an explanation of reality that is, in itself, valid but not immutable and true but not always. For example, expressed in terms of probability, low undergrowth and medium human activity could pose a fire risk of 0.3. This implies that the same causes have a probability of 0.7 of implying a different risk value, even zero or the maximum. The power of fuzzy reasoning is that these differences between causes and effects are smoothed out and more predictable. If low undergrowth and medium human activity imply a risk of 30 out of 100, it is plausible to think that another expert has considered this risk 50 out of 100 since this will be their experience and therefore their knowledge explained and applied. Fuzzy logic allows establishing declarative rules that with the same causes explain different effects, thus formalizing a vaster knowledge and diversifying it in a better way. This should always be considered when creating the rules and establishing a consistent number of them.

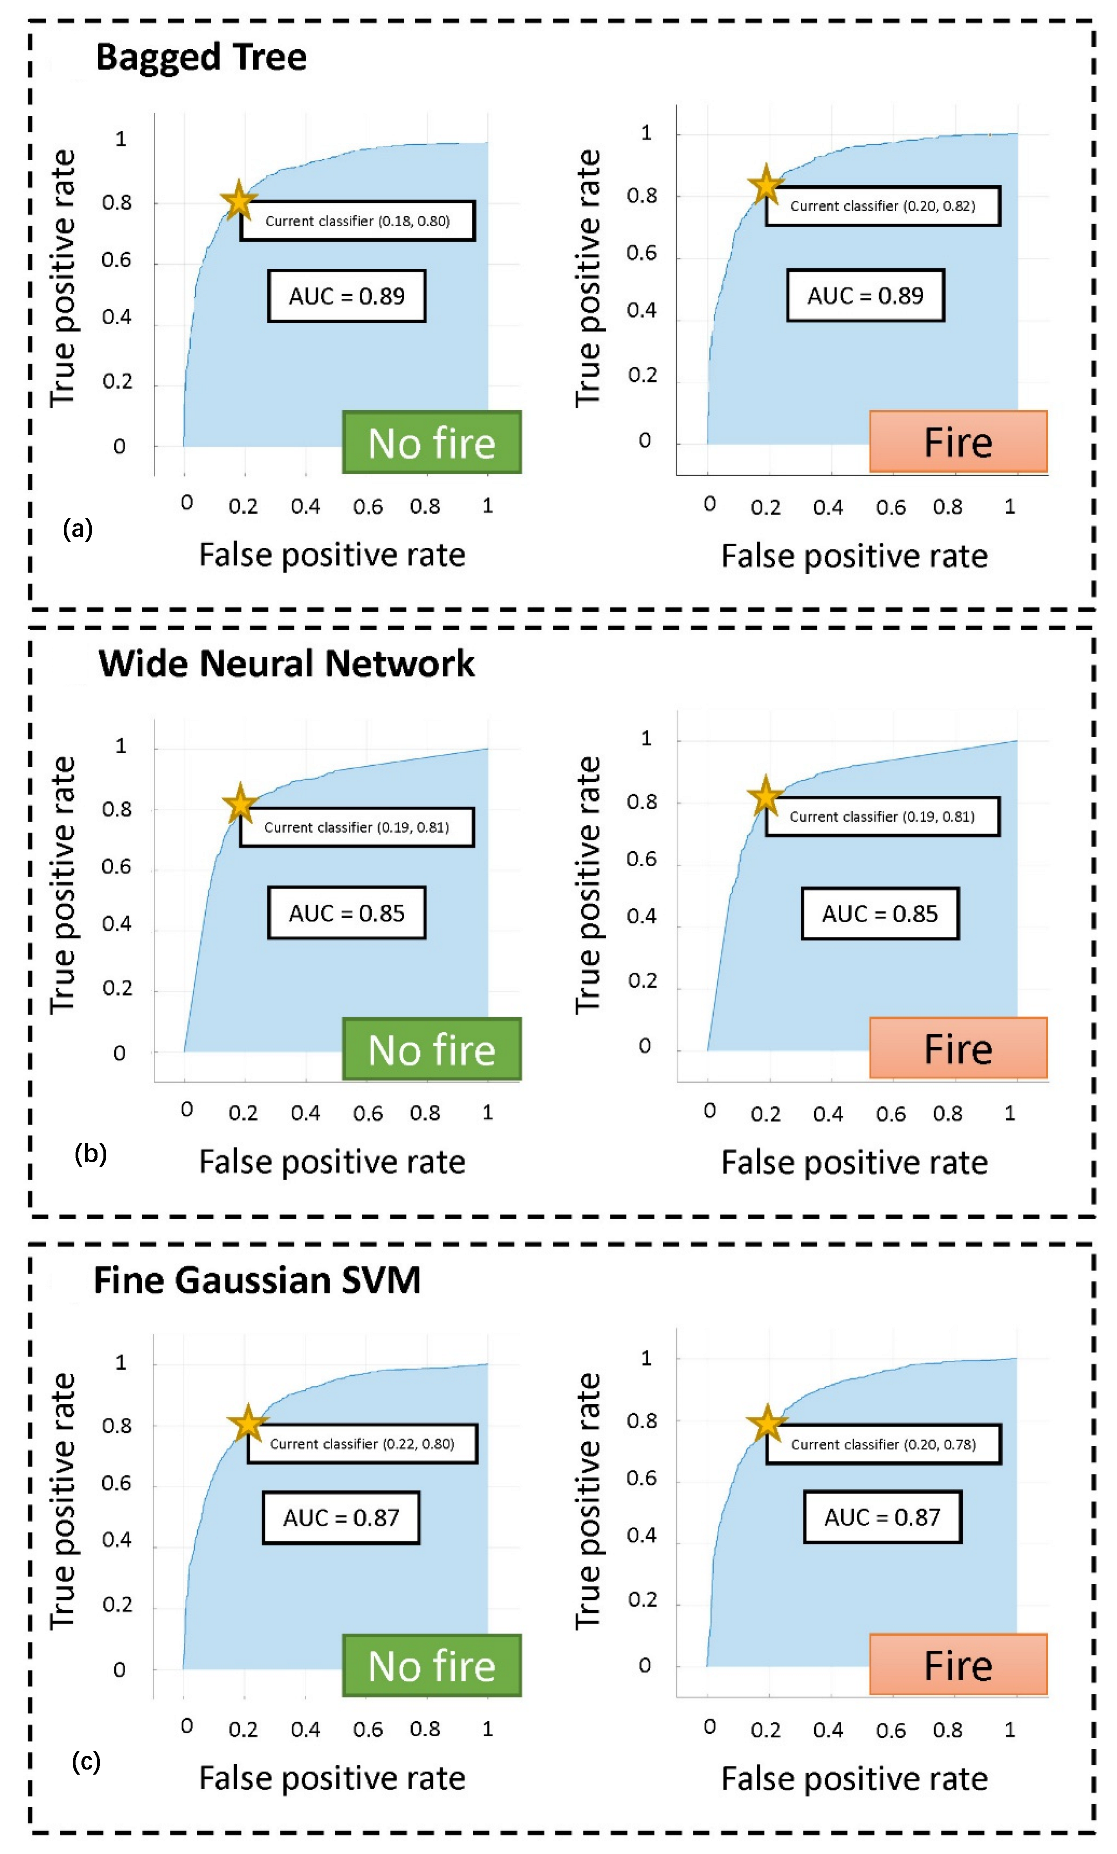
Classification Algorithm Based on Machine Learning

As mentioned above, the objective of the first level of the methodology is to determine whether a fire could occur in some areas of the study region. Therefore, once the dataset just described has been prepared, the training of a classification algorithm begins, in order to be able to make predictions with new data (the information collected by the meteorological station, the day of the week, and the month).
In order to perform a broader analysis of the different possibilities, multiple trials were performed using the App Classification Learner [41], which allows multiple learning algorithms to be trained simultaneously.
To validate the different algorithms, we opted to use cross-validation techniques, more specifically k-fold cross validation, with 7 folds.
The following models available in the Classification Learner App were chosen for training [41]:
  • Decision Tree (Fine, Medium, and Coarse Tree models);
  • Logistic Regression;
  • Naïve Bayes (Gaussian and Kernel models);
  • Support Vector Machine (Linear, Quadratic, Cubic, Fine Gaussian, Medium Gaussian, and Coarse Gaussian Support Vector Machine models);
  • Bagged Trees;
  • RUSBoosted Trees;
  • Neural Network (Narrow, Medium, Wide, Bilayered, and Trilayered Neural Networks models).
Of the different models evaluated, the best result was obtained from Bagged Trees, with an accuracy of 81%, closely followed by the Wide Neural Network and the Fine Gaussian Support Vector Machine, with precision values of 80.9% and 78.9%, respectively. Its parameters are summarized in Table 4. In addition, Figure 3 shows the ROC curves [46,47] for the three best models in terms of precision, a parameter which describes the accuracy of a binary classifier such as this one, associated with the model for both classes, with values of area under the curve close to 0.90. In this case, the classes for training correspond to the explained variable, Fire Risk, but distributed in 0 and 1 when it was known from the dataset used that a fire actually occurred.
The use of a binary classifier [46,47] is common practice when comparing machine learning-based classification algorithms. In essence, it is about determining the relationships between the success and failure cases in the classification of a dataset labeled with two unique and usually antagonistic labels, determining four basic factors: true positive (TP), true negative (TN), false positive (FP), and false negative (FN) cases. From these values, relationship factors are determined, such as sensitivity, specificity, prevalence (recall), or precision (accuracy), the latter used in this case representing the ratio TP/(TP + FP). In the same way, the results can be plotted in the form of the aforementioned ROC curves, precisely evaluating the area under their respective curves. The definition of the ROC curve [46,47], acronym from ‘receiver operating characteristic’, is a graphical representation of two characteristic factors of a binary classifier, such as on the abscissa axis, the rate of false positives (or prevalence), and on the ordinates axis, the ratio of true positives (or sensitivity). The determination of the area under the curve varies between 0.5 and 1, indicating this value, and the proximity of the area to it, having an excellent probability of successful or positive classification.
After training, when the algorithm is provided with new data, it will return a series of scores associated with both classes. In this case, considering the score associated to the fire class, which moves in the range (0, 1), rescaled between 0 and 100, it will be referred to as Objective Technical Fire Risk (RT).
The proposed conversion is actually straightforward and easy to understand. Considering that 0 represents the null probability of fire while 1 represents the maximum probability of fire, any value between 0 and 1 will be associated with an analogous and corresponding probability of fire. To express this probability as a percentage, we just proceed to multiply the probability value by 100, i.e., to express such probability using a base 100 scale.
Once the Objective Technical Fire Risk has been determined, it is evaluated because its value conditions the passage to the second level. In this case, the following thresholds are proposed to advance to the second level:
  • If RT < 40, it is considered that there is no risk of fire, which means that in principle there is no need to advance to the second level of the methodology.
  • If RT ϵ [40, 60], it is considered that there is a situation of doubt, which means the responsibility for deciding falls to the user of the methodology who must assess whether to generate the map of risks associated with the second level of the methodology.
  • If RT > 60, it is considered that there is a risk, and so there is a move to the second level of the methodology to generate the risk map.
As can be seen, the identification of these thresholds is subjective and is conditioned by the reliability of the classifier of this first level. The methodology always allows an advance to the second, more precise level, independently of the risk initially obtained. It is not possible to find any way of guaranteeing that the Objective Technical Risk is a reliable measure of the fire risk—its value is reduced to an estimated measure that must always be checked by experts.

2.2.2. Second Level of the Methodology

As mentioned above, if the level of risk calculated in the first level, the Objective Technical Fire Risk, is higher than a threshold value or, in all events, if the expert team operating the software decides, the second level of the methodology is undertaken. This level aims to identify those areas/quadrants of the map in which a fire is more likely to occur. To achieve this, two large blocks that act concurrently are used: an expert system based on fuzzy logic and a convolutional neural network. From these, it is possible to determine two risk matrices, the Expert Risk Matrix and the Technical Risk Matrix, whose values are associated with each of the quadrants of the map. These matrices are then combined in a second expert system to determine the Global Risk Matrix, from which it is possible to create a color map to aid the decision maker. The map points out those quadrants in which surveillance and prevention tasks should be intensified.
The following is a detailed step-by-step description of the methodology’s process.

First Expert System: Expert Risk Matrix
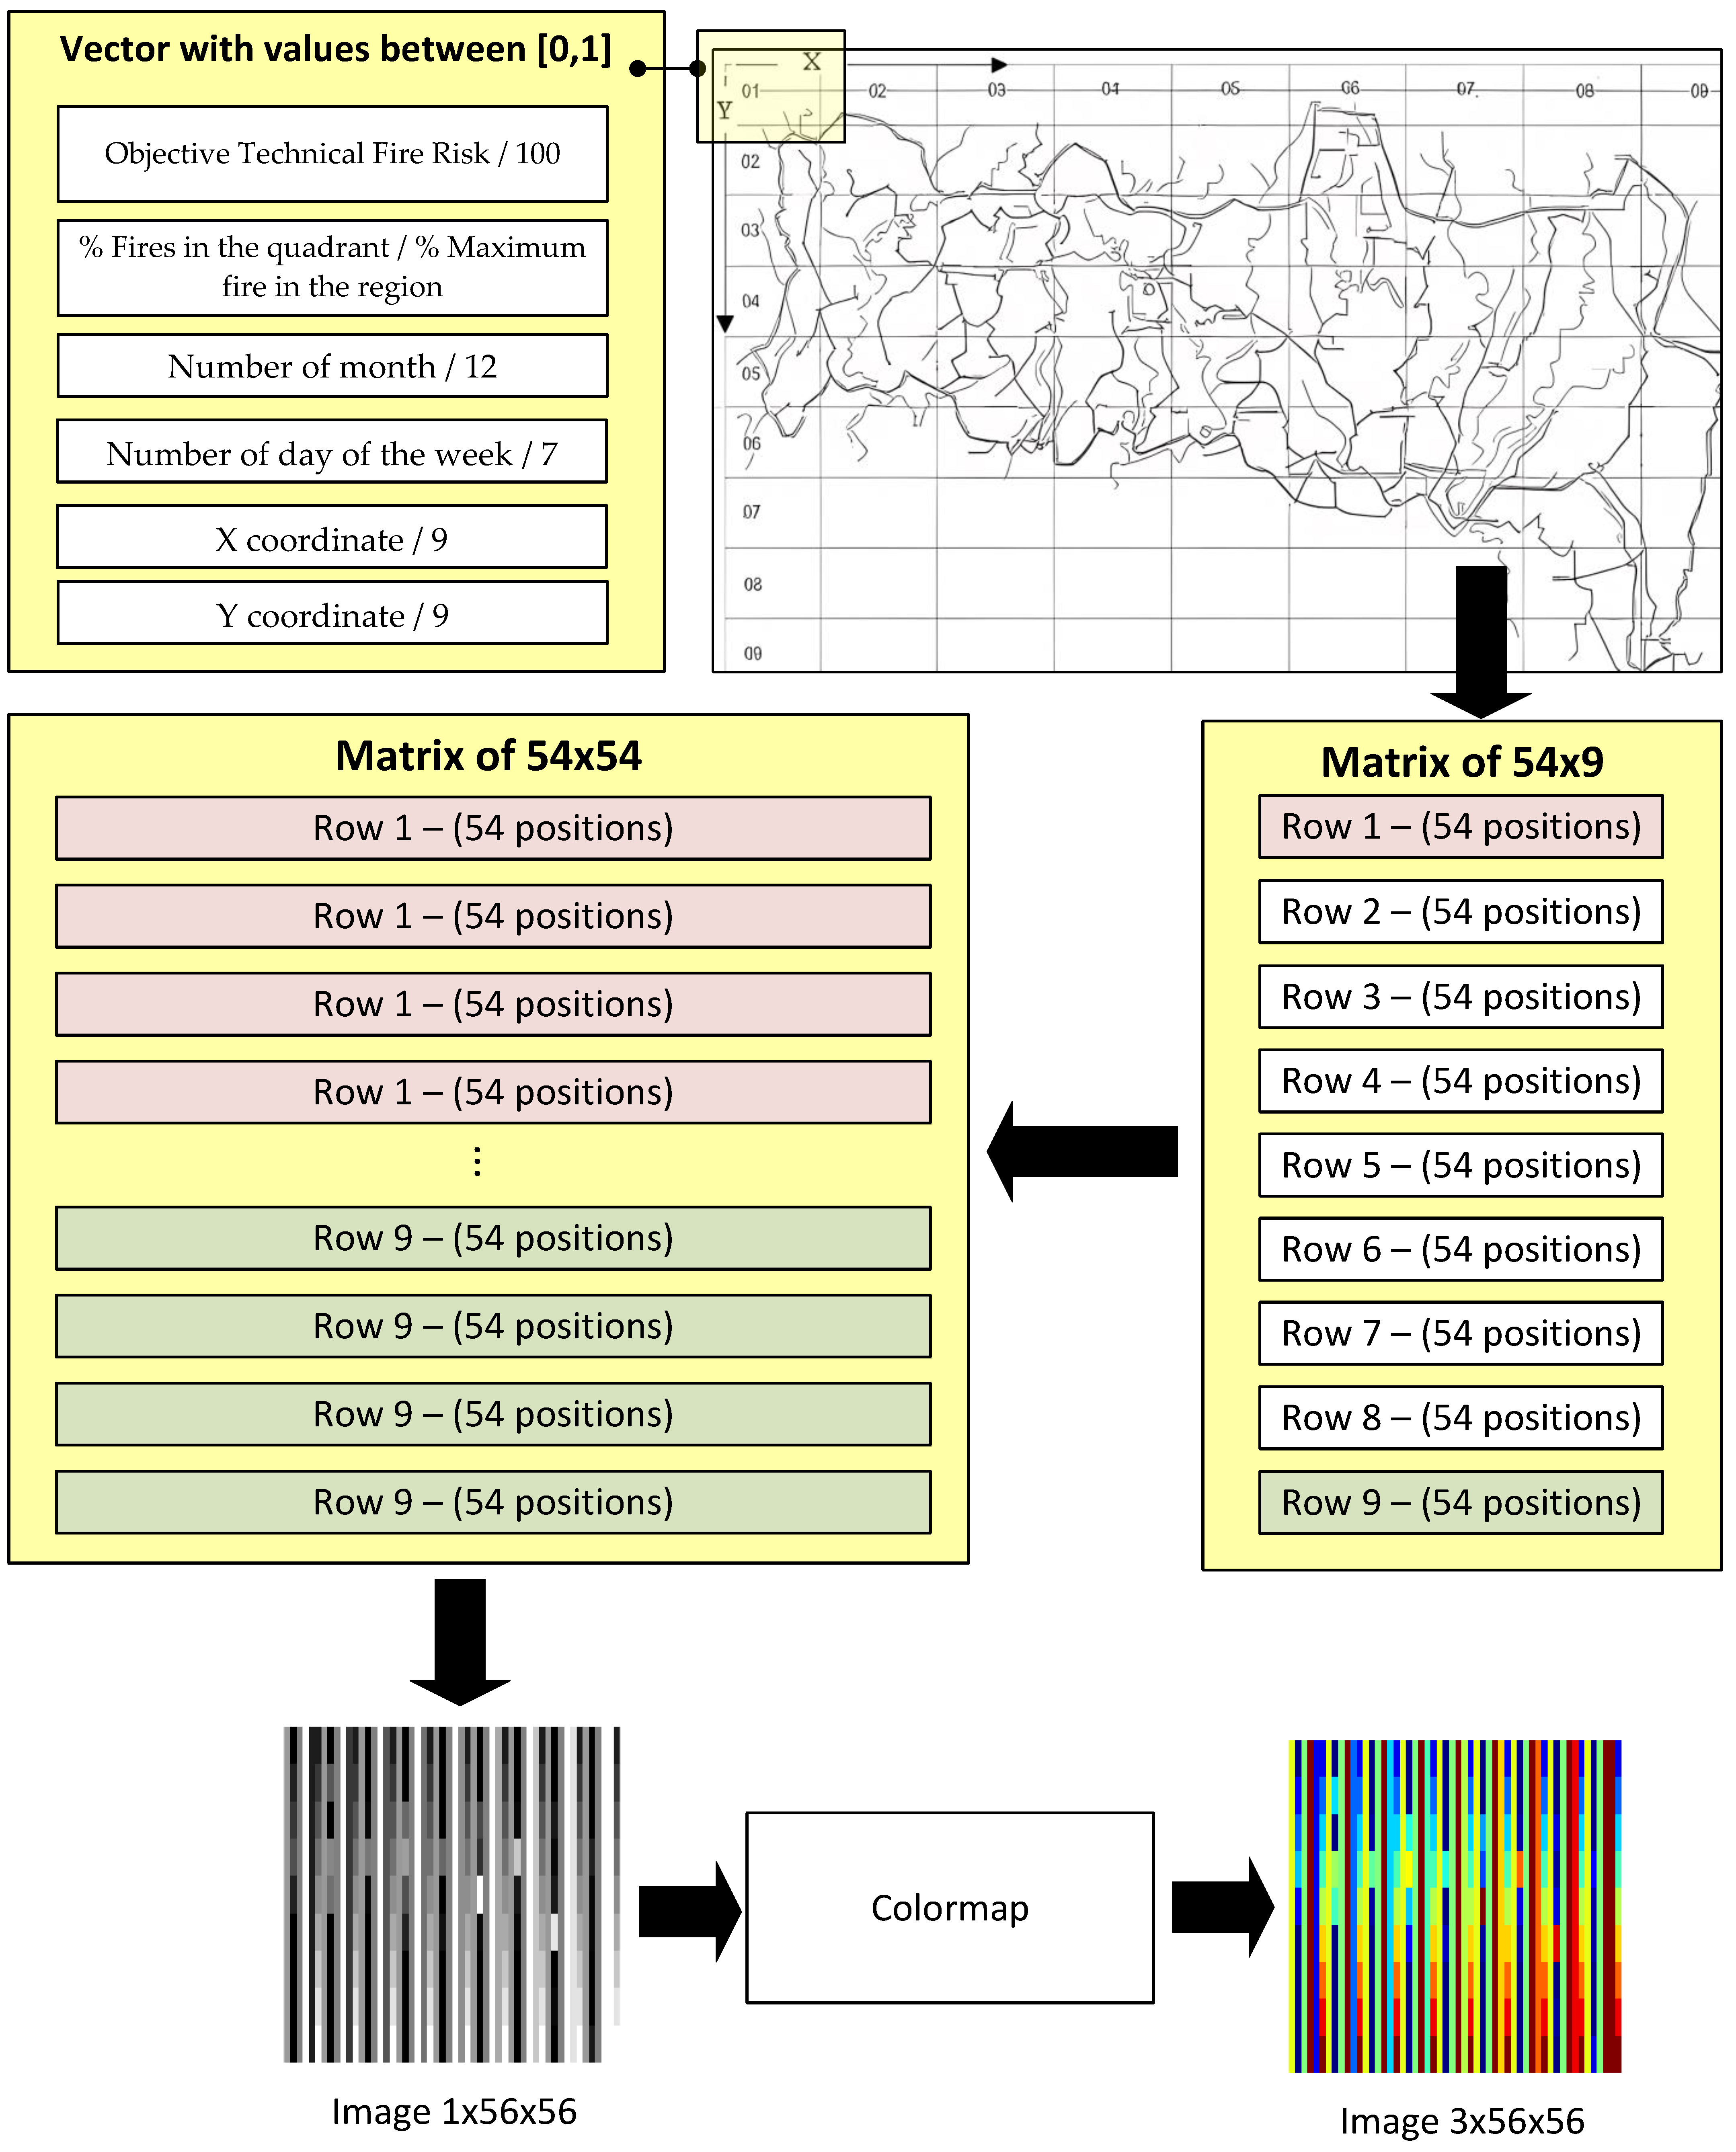
In the second level, the risk matrices are determined by using the knowledge bases created. First, the opinions and assessments of the team of experts in detecting and dealing with fires are processed using an expert system based on fuzzy logic and associated to each of the quadrants on the map of the study region. These opinions were previously collected during the construction of the expert knowledge base. This first expert system associates a risk indicator to each of the quadrants of the map, and arranges them in a matrix, the so-called Expert Risk Matrix.
Thus, once the knowledge base has been identified, it is necessary to define and configure the inference engine, which, together with the interface, constitutes the formal implementation of an expert system. In this methodology, the expert system will have a fuzzy inferential engine following Mamdani’s arrangement. Inferential systems of this type have many advantages, are widely used, simple to implement, and have been validated in many studies [48,49,50,51]. Figure 4 shows the generic scheme for this type of inference system. Prior to the inference process, the membership functions are defined, both for the explained variables, the antecedents, in this case the undergrowth and the presence of human activity, and the consequents, in this case the Expert Risk of fire. The general recommendation in this type of inferential system is to develop functions that are normal, convex, and symmetrical [51], which means the most commonly chosen are triangular, trapezoidal, or Gaussian functions. The final choice of the membership function will depend on the nature and characteristics of the data to be represented. When determining the Expert Risk, undergrowth and human presence are used as antecedents. The fuzzification of these implies the consideration that the absolute membership to any common language qualifier that classifies them (e.g., little, medium, much, or abundant undergrowth) will not have a single quantifiable value associated with the maximum membership in each classification. This suggests abandoning triangular functions and taking trapezoidal functions, with a total membership interval and a slope in increments. In the case of the consequents, the Expert Risk itself, the characteristics of its variable, on the contrary, do lead us to think that there is only one point where the maximum belonging to a qualifier exists. This is so because the consequent will be analyzed quantitatively and not qualitatively, so that each segment does not represent a qualifier but a value, a percentage of risk. There will only be, therefore, one point where, for example, the risk is 50%, not a segment as is evident. Gaussian functions could also be used, but the definition of their growth segments is more difficult without providing greater precision in the inference. Once the antecedent and consequent functions have been defined, the process continues by combining the antecedents of each declarative rule derived from the knowledge base using the AND operator since the antecedents must be considered together to determine the consequents. After this, the consequent is calculated, in this case the Expert Risk, of each of the rules using a graphical implication method that truncates the membership function of the consequent starting from the minimum value determined after the evaluation of the antecedents. After that comes the aggregation of the consequents of each of the rules using the maximum operator, which superimposes the previously truncated consequents, determining the graphical output of the inference system. The final value of each risk indicator is obtained after the process of defuzzification of the aggregated consequent using the centroid method [51] and evaluated in a range from 0 to 100.
Table 5 shows the initial configuration of the inference system used to calculate the Expert Risk Matrix. It is important to point out that this is an initial configuration and that, if necessary and advisable, it could be safely modified, adapting the membership functions and modifying the rules.

Image Construction

The Technical Risk Matrix is calculated concurrently [23,24,25,26] to the expert system stage in which the Expert Risk Matrix was determined. The first step will be to determine the knowledge base associated to this inferential process. This knowledge base must be constructed previously and will be made up of a set of images that include all the information related to the observable variables that have an incidence on fire risk. Although it is constructed previously, for the sake of clarity and proximity in the explanations, this section describes how it is made.
Figure 5 helps to describe this process in detail. It gives a summary of the flow diagram followed to construct the images. It starts from the second dataset augmented in the first section, whose variables are shown in the third column of Table 3. Prior to image construction, the Objective Technical Fire Risk is determined for each of the observations of the new augmented dataset. In addition to this, the percentage of fires per quadrant will be determined based on the historical and current data collected.
Once this is done, it will be possible to construct the images. To achieve this, starting from the dataset and the map of the study region, with n × m quadrants, a vector of six elements will be associated to each of the quadrants (X-coordinate, Y-coordinate), whose values will range between 0 and 1:
  • Objective Technical Fire Risk/100;
  • % Fires in the quadrant/Maximum % of fires in the region;
  • Number of month/12;
  • Number of day of the week/7;
  • X-coordinate/n;
  • Y-coordinate/m.
If this procedure is applied to a 9 × 9 map, such as the one used in the case study, the result will be a 54 × 9 matrix. However, this matrix is not square, which is why each of the rows will be replicated 6 times, thus creating a 54 × 54 square matrix.
If this matrix is transformed into an image, there is only one channel with a grayscale image, which would be totally valid. However, this work envisages images with three channels so that a color map will be applied to each of the images, more specifically the Jet Colormap [52]. This is done because of how convolutional networks and their convolution cycles operate.
In the process of building the image database, each of these images is labelled with the quadrant in which fire occurred. This is because a supervised learning approach [53,54] will be used.

Convolutional Neuronal Network: Technical Risk Matrix

Once the knowledge base formed by a set of coherent and balanced images has been built, the convolutional neural network is used. First, it is trained. The objective is that the network, fed with a new image, makes it possible to determine in which area of the study region it is more plausible that a fire will occur. For this purpose, a set of 1056 images has been used, which has been divided into two subsets: the training subset, with 957 images (90% of the dataset), and the validation subset, with 99 images (10% of the dataset). These percentages are determined taking into account, in those two cases, both the total size of the dataset and the data oversampling strategy followed. In this case, the proposed division in the initial dataset between training and validation sets is made considering that the validation set is used to measure the accuracy of the network compared to the training set but does not perform explicit modification of the hyperparameters. That is why a percentage of data is not reserved for testing, but the validation set is taken to a similar end.
In this work, we have chosen to use GoogleNet [55]. However, it is important to point out that any other network that the user considers appropriate could be used as long as the results are satisfactory.
The network has been trained using Deep Learning Toolbox [42], obtaining a validation accuracy of 85.86%. Table 6 shows the training parameters.
Once trained, the network will be used to determine the Technical Risk Matrix. Each of the positions in this matrix is related to each of the quadrants on the map of the study region. Fed with a new image, the network will provide a vector with the scores—risk indicators—associated with each of the quadrants on the map. Each of the values of the Technical Risk Matrix will be equal to the score associated with each grid divided by the maximum score. In addition, the scores will move in the range (0, 100). Equation (2) shows the calculation that allows the Technical Risk value associated to each quadrant to be determined.
A n m = S c o r e n m S c o r e   m a x i m u m · 100

Second Expert System: Global Risk Matrix

Once the Expert Risk Matrix and the Technical Risk Matrix have been determined, they are aggregated using a second expert system, also based on fuzzy logic, as discussed in Section 2.1.2. This second expert system makes it possible to determine a third matrix, called the Global Risk Matrix. Each of the positions of this new matrix is related to each of the quadrants on the map of the study region.
As usual, the essential definition of the expert system in its software layer will be determined when the knowledge base, inference engine, and user interface are defined. The knowledge base in this case must analyze how the variables inherent to the concepts of Technical Risk and Expert Risk must be combined in a reasoned way. Unlike the other knowledge bases in this methodology, it is not possible to derive the creation of inference or implication syllogisms from deterministic knowledge or the experience of the expert team. There is clearly uncertain knowledge in the creation of this base, which implies that the rules probably (in the sense of incorporating uncertainty) can be false or at least partially incorrect. There is no valid experience, and the data which previously served to validate the rules is not useful now. Experts must evaluate the meaning of each risk matrix and perform an exercise of heuristic intuition and insight to model the knowledge to link the risks. This work will necessarily have to be ongoing, and the rules will have to be similarly revised on a continual basis until a proven and reliable corpus of certainty is created. For example, a rule such as:
IF (Technical Risk is Low) AND (Expert Risk is Medium) THEN (Global Risk is 50).
Will this always be true? The answer does not have a high degree of certainty. It is the opinion of an expert, or a team of them, which leads to determine that a low Technical Risk and a medium Expert Risk imply an overall risk of 50. Yet, why 50 and not 45 or 55? It is the knowledge model proposed by the experts that determines these values, and it will be the validation of the methodology and, in particular, of this final expert system that will determine if these rules are frequently activated and if, in reality, they fit both real situations and the behavior of fires. The disadvantage of uncertainty is inevitable in this sense, but the versatility of the system and, of course, its use only as an element to link risks reduces its incidence and undoubtedly makes it useful. A clear improvement, which would solve part of this problem, would start from data triads—formed by the Expert, Technical, and Global Risks—and have the capacity to generate declarative rules. This approach, already described by Wang and Mendel [56], will undoubtedly be one of the lines for future exploration and improvement of this methodology.
Once the knowledge base is defined, the inference engine will be similar to the one used in the first expert system, in this case taking into account that there are two antecedents—Expert Risk and Technical Risk—and a consequent—Global Risk. Both the union of them, with AND logics, the implication of minima in consequents, and the aggregation of their maxima are analogous to those already described. Similarly, the membership functions of antecedents and consequents are established as trapezoidal and triangular, respectively, for the reasons given above. There is a difference in the consideration as a fuzzy number of the Expert and Technical Risks when these are used as antecedents. When acting in this way, it is no longer possible to understand risk as a whole measure, i.e., a value that indicates a total belonging at a point to the sections of its function when these sections are understood as percentages. On the contrary, the conception of risk within a language qualifier (low, medium, high) necessarily makes it advisable to blur them as trapezoidal functions. The configuration of this second expert system is described in Table 7.

Color Map Generation and Decision Making

Once the Global Risk Matrix has been calculated, and for illustrative purposes only, a color map is determined. This is superimposed on the map of the study region in order to show the risk level in each quadrant. There is then an evaluation of the state of the system, analyzing the risk level present in each quadrant and determining pertinent actions. This is done bearing in mind that the methodology, in addition to being inferential, is essentially a traditional decision support system, which makes data available in a way that eases decision making. In reality, the decision is already taken and inferred by the hybrid system, but it is the team of experts implementing the methodology that must decide what happens next. In this sense, graphing the solution helps in this process, although it has no implication in either the calculation of the results or, of course, in the inferential process described above.

3. Case Study

This section presents a practical application case for the proposed methodology. The purpose of this example is not to validate the system or to compare it with others but to present an example application that, as a proof of concept, will make it possible to determine its viability and potential for use. The complete and final validation of the methodology should be associated with its use in a real application environment where the accuracy of its predictions in real fire events can be assessed. Given that the methodology is still at the conceptual testing phase, as mentioned above, its design and development are still evolving and improving, so its transfer to production environments has not yet been considered.
Therefore, this proof of concept will start from a simulation of the readings provided by the weather station located in the center of the Montesinho Natural Park, which are shown in Table 8.

3.1. First Level

Figure 6 shows, in the green box, the first level panel of the proposed methodology. The data from the meteorological station are entered in the Stage#1 box.
After data input, the Objective Technical Fire Risk is calculated, which in this case, has a value of 81.19. Given that this risk value is over the threshold value of 60, an alert is generated, and the second level of the methodology ensues because a fire could occur in the natural park in these situations.

3.2. Second Level

Given that there is a risk situation, the second level of the methodology determines those areas that present the greatest danger.

3.2.1. Generation of the Image and Compilation of the Expert’s Assessments

First, in the second level of the methodology, the expert’s opinions on each of the quadrants are entered. This procedure can be done manually in the Stage #3.a panel or by loading the data from a *.CSV file, by clicking on the Load Data button. In this case, we choose to load the data from a *.CSV file. It is important to remember that the available map of Montesinho Natural Park has 9 × 9 quadrants. Table 9 shows the experts’ assessments associated on undergrowth with each of the quadrants, while Table 10 shows the assessments on human activity.
Table 9 and Table 10 allow the group of experts to evaluate the state of the vegetation and human activity in each region of the study map. As already mentioned in Section 2.1.2, the experts must carry out an evaluation of the status of these factors based on their own knowledge and experience, answering a series of questions that are evaluated through a 10-point Likert scale. The result of these evaluations for each region is shown as the value of each cell in those tables.
Then, the starting image is generated, and the expert’s assessments are collected.
Image construction will be carried out starting from the data collected at the first level, following the procedure shown in the subsection Image Construction in Section 2.2.2.
In Figure 7, clicking on Create image in the Stage #3.b panel generates the image.

3.2.2. Calculation of Matrices and Risk Maps

Once the image has been generated and the expert’s opinions have been gathered, the risk matrices are determined, and the risk maps are calculated.
First, the Technical Risk and Expert Risk Matrices will be calculated. Then, the Global Risk Matrix will be determined.

Expert Risk Matrix

Clicking on the Calculate Expert Risk button on the interface shown in Figure 8 generates the corresponding matrix. Figure 9 shows the Expert Risk Map indicating several zones that could be considered to be of higher risk.
The system determines an Expert Risk value for each of the zones in the region under study.

Technical Risk

Clicking on the Calculate Technical Risk button in the Stage #4.b box of the interface shown in Figure 10 generates the corresponding matrix. In this panel, two tabs are presented. In the first, in Figure 10, the Technical Risk tab presents the Technical Risk Matrix. The second tab, in Figure 11, shows the Technical Risk Map. As can be seen, the X = 5 Y = 4 quadrant appears to be the most hazardous.

Global Risk

Once the Technical Risk Matrix and the Expert Risk Matrix have been determined, they are aggregated using an expert system to determine the Global Risk Matrix. This is done by clicking on the Calculate Global Risk button on the interface shown in Figure 12. The same figure shows that the Global Risk Matrix can be seen in its own tab.
Finally, the color map associated with the Global Risk Matrix is calculated and overlaid on the map of the natural park. The system determines a Global Risk value for each of the zones in the region under study. Once the risks for all the zones have been determined, then the Global Risk Matrix is created to be used for coloring the region map. This map can be consulted in Figure 13. As can be seen, the area where the greatest effort should be made is near the X-coordinate = 5, Y-coordinate = 4 quadrant. On this basis, the person in charge of surveillance at the natural park must establish the appropriate surveillance and prevention strategies, which should be focused on the indicated area.

4. Discussion

This paper has presented a novel methodology using a hybrid artificial intelligence system for the early detection of possible fire outbreaks in forest reserves. Due to the high recurrence of these fires and the terrible environmental, economic, and social consequences they entail, the development of predictive systems based on software with inferential capabilities has been significant. However, such systems all point towards the use of single inferential models, either statistical or symbolic, framed within commonplace information systems. They all share the goal of reducing the enormous dimensionality of the problem and limiting uncertainty in the data. However, this is not a simple task. A multivariate problem such as fire detection—where the aim is to develop a prediction model considering multiple study variables and even determine their causal relationships—involves using tools that help to find relationships between these variables, usually employing dependence, interdependence, or structural approaches [35]. However, it is also possible to approach multivariance with different inferential models [57,58,59,60,61], which allow these underlying relationships of the data to be found using a knowledge-based approach, considering both learning as a statistical inference tool and fuzzy logic as symbolic inference. In this regard, the key is in the knowledge bases that feed both approaches because, although formally and functionally different, they actually represent the same starting reality on which to perform reasoning. Defining these knowledge bases, the data to train the learning model, or sets of syllogisms to imply consequents in the fuzzy model thus constitutes the differential value of the intelligent system that includes one or two of the models. This knowledge generation and representation always involves uncertainty, both in its ambiguity, epistemic, random, and interaction modes, in addition to having to deal with a large volume of data. This, therefore, is where all approaches to solving the problem converge: reducing dimensionality and limiting uncertainty. Therefore, an intelligent hybrid system, such as the one this methodology underpins, must differentiate itself by fulfilling these two essential features.
The problem described above lies in the very conceptualization of contextual computing [62]. The use of data in statistical processes starts from an essential premise that implies that all the data must refer to the same context. However, this is not always true. The context of these data must be analyzed to really value their meaning and to establish their belonging in the set, which will really determine their representativeness in the knowledge. The absence of a context increases uncertainty in all its variants and does not allow the volume of initial data to be preprocessed effectively. Nothing can be discarded because, in principle, everything is relevant to the problem. This article seeks to solve this by introducing and presenting a methodology that makes use of hybrid intelligent systems, i.e., those that combine diverse inferential processes seeking to reduce the stated negative factors. How is this achieved? On the one hand, it is achieved by assessing the context of the variables through the reasoned knowledge of the experts, expressed in the form of inference and implication syllogisms and, on the other hand, by using this same knowledge, elaborated in another context, to synthesize all the information in structures that can be analyzed through automatic learning. It is the union of these different inference models that improves their performance and makes hybrid intelligent systems stand out as inference and reasoning mechanisms. The following detailed explanation of the main proposals presented in this methodology will more clearly demonstrate how it is both an improvement and a novelty.
  • Creation of knowledge bases: In this case, two actions are proposed: on the one hand, preparing the initial data and, on the other, creating the expert and technical knowledge bases. In the former, the use of SMOTE-NC allows the binary categories of the data to be balanced, while the Z-score normalizes their representation. This combination makes it possible to have a coherent and adequate data set, which guarantees the subsequent adjustment of robust statistical classifiers. Based on these data, an image is elaborated which, acting in a structural way, allows the incorporation of not only the reflected data but also other additional data and even intrinsic data not identified at the beginning. Although in the preprocessing of data neither the dimensionality was reduced nor the uncertainty restricted—indeed, it was necessary to rely on these data to create the image—in the creation of the image there is an effective and clear reduction. Images are defined that group the features of the data, which, moreover, are related to the classification of each image into ‘fire’/’no-fire’. The data are no longer statistically linked to the categories; it is now the features implicit in them, enriched within the image, that are so linked. Dimensions are reduced in the problem but also uncertainty is reduced by not having to define, identify, or name these features. Finally, the expert knowledge base contemplates the context not only of all the data but also of new variables that directly or indirectly include those same data. The dimensionality of the data here is represented by common language structures, syllogisms, which shape causality and deductive reasoning. The problem is bounded by the knowledge required for its solution. Formal logic, of statements and predicates, is used to understand the way to solve the problem, not the problem itself, and thus, in turn, the uncertainty of the resolution is restricted since the term becomes part of the reasoned explanation. It is not necessary then to quantify the uncertainty by indicating its probability, although that would be possible, but rather to evaluate to which qualifier of the language a variable belongs to a greater extent. The creation and definition of knowledge bases, data, and syllogisms is one of the crucial steps of a hybrid system and constitutes a quantitative and qualitative difference from other intelligent systems.
  • Determination of fire risks: Three different risks are defined and calculated in the methodology. On the one hand, the Objective Technical Risk is derived from the application of a machine learning algorithm taking the initial data, preprocessed with Z-score and SMOTE-NC. Its relevance is questionable as it is based on assumptions that are not always true. However, it is useful as a first discriminator. As already mentioned, the limitations of this approach are clear, but within a hybrid model, it serves as a scale to assess the steps to be followed, in general terms and taking into account the distributions identified by the algorithm among variables. From this first risk, the Expert Risk Matrix is determined, on the one hand, using expert systems, and on the other, the Technical Risk Matrix is determined using convolutional neural networks. Both start from knowledge bases that represent the same reality, the same context, but are formally very different. Expert systems have increased the applicability of decision support systems and incorporated formal logic and deductive and inductive reasoning in the field of artificial intelligence. Their structure allows them to diversify knowledge since the rules that compose their knowledge bases allow the chain of reasoning to be understood and formalized in a common language. This usually employs some kind of logical approach, both probabilistic, such as Bayesian networks, and non-probabilistic, such as fuzzy systems. The Expert Risk derived from these expert systems is calculated taking into consideration a formal representation of knowledge and therefore is a measure of the experience and even the intuition of the experts in fire detection. At the same time, convolutional neural networks have a proven ability to find features in arrays of data, such as images. This allows them to see underlying relationships between large volumes of data as long as these volumes can be represented as an image without any loss of information in the process. The idea then is to reduce the dimensionality of the starting data not by finding groupings or common factors but through the arrangement of that data. It is, as can be seen, a new formalization of the data, a link between both inferences which are, in fact, two sides of the same coin since both decide on the basis of analogous knowledge. Therefore, both risks, expert and technical, skillfully complement each other. Both are formal representations of the fire hazard. Both are calculated using tools that reduce the initial dimension of the problem and limit the uncertainty, either by reasoning or by repositioning the data. Both, when compared, increase the decision-support capability of the system. The only thing left to do is to unite them, which is proposed with a new expert system. However, this is not a potential differentiator of the current methodology, as argued in the description of Stage 5 in Section 2.1.2, but a linking mechanism for the purpose of determining a Global Risk that allows a fire map to be shown over the area being studied. Its relevance and usefulness are limited to this, so the linkage is, in reality, meaningless.
Therefore, from a conceptual perspective, this methodology envisages a hybrid intelligent system that augments the traditional capabilities of the usual intelligent systems. The results obtained in the proof-of-concept case study both give a measure of its applicability and versatility and precisely value the use of this type of systems. The combination of different inferential models, the definition of the knowledge bases, and the calculation fundamentals used in the determination of risks give the methodology a unique and innovative character, completely different from current approaches. With this new approach, the potential of a hybrid system does not lie in the tools it uses but in its internal topology, in the way its knowledge bases are set up, and the way risks are calculated following these bases. It is the process that is technically relevant in the field of study, not the engines feeding that process. In this regard, one could use another machine learning algorithm, propose other convolutional network models, or change the fuzzy inference engines for Bayesian rules, and the system would still have coherence and determine a plausible risk value. It would obviously be affected by the nature of the data and the computational approach, but these variations would be compensated for by the overall performance of the system. In essence, it would be possible to propose, design, and develop an intelligent hybrid system and, while respecting the theoretical arguments outlined in this discussion, ensure optimal system performance. The coherence of its logical data structure and its capacity to incorporate any inferential tool transform the systems into ones that can be validated in two parts: one associated with reasoning and one associated with accuracy. Predictive accuracy can always be enhanced by improving the data or changing the inference tools, but the fact that the system has reasoning capacity, that it formally manages uncertainty, and that it respects and accepts knowledge ontologies is a value that resides in its own definition and conceptualization, as this work has attempted to demonstrate. This, and no other, is the true value of intelligent hybrid systems.
However, despite the obvious advantages that hybrid systems present and that have just been discussed, there are inherent limitations to their own definition that, although they have already been outlined throughout this section, it is convenient to mention. The first and most obvious, without a doubt, refers to the capabilities for formalizing the knowledge necessary both for inferential statistical models and especially for symbolic ones. An incorrect formalization of knowledge could not be representative of reality, and therefore it must be sought that this process is absent of interpretability and vagueness in its definition. It is evident that the pretreatment of the data prior to the execution of the machine learning algorithms depends on that formalization of such data, and therefore the labeling, normalization, and oversampling of the data depend directly on this formalization. A separate question would be that one referring to the logical integration of the different algorithms and to the conservation of coherence in the data flow, all of which depends on the ontology under which the system is created. Other implicit limitations are common to any predictive algorithm, i.e., the nature of the data, its veracity, its quantity, the training algorithms, the validation structure, the optimization of hyperparameters, etc., are cross-cutting issues that affect any predictive intelligent system.

Relevance in the Field of Study

If, after the conceptual discussion of the methodology, the data derived from the concept test are reviewed, precision values close to 85–90% will be observed. With this, it will be possible to make a quantitative as well as qualitative comparison of the methodology presented with others applied in the field of study. In this regard, Table 11 presents a comparison of different approaches present in the current literature versus the proposed methodology, considering a series of criteria [26,63]:
  • Internal architecture: it aims to assess the reliability of the results, based on the management of uncertainty and the percentages of accuracy obtained.
  • Scalability: it assesses the ability to add or remove computational blocks from the system.
  • Inference: it assesses the system’s ability to use symbolic reasoning approaches.
  • Learning: it tries to evaluate the capacity of the system to incorporate approaches based on machine learning.
After the analysis shown in Table 11, it can be seen that most of the approaches used are single approaches, with the exception of two, which use ANFIS, where the symbolic approach and the computational approach are used in a hybrid way. The proposed methodology is linked to the latter but adds—highlighting only the main aspects—a greater and more efficient management of uncertainty and an explicit formalization of knowledge, which is undoubtedly a novelty in the field of study.

5. Conclusions

The methodology designed and presented in this work, developed through an intelligent hybrid system, allows the early detection of fires in forest parks and many other types of wooded areas. It predicts, by using a statistical classifier, whether fire risk situations are present in the study region, and if so, a convolutional neural network and expert systems are used jointly to determine those areas with a higher risk of fire through the generation of a color map which facilitates prevention and surveillance tasks.
The proposed methodology has been applied in a proof-of-concept case study, which has validated its implementation in a software artifact and has shown excellent predictive capabilities in such a complex environment as a forest fire, which is conditioned by multiple factors. The conclusions of this analysis, and its subsequent discussion, are promising and show that this methodology could be used in fire detection. Furthermore, they identify hybrid intelligent systems as fundamental tools in the development of inferential applications within artificial intelligence.
In the future, pilot trials should be carried out to validate its use and usefulness in real environments so that practical application of the methodology developed and presented here can be demonstrated, making it possible to assess its effectiveness in fire reduction and associated economic savings. Similarly, from a theoretical perspective, progress should be made in improving the data flow in the methodology, in the development of more relevant knowledge bases, and more specifically, in the definition of a model that combines both expert and technical risks that have greater and deeper meaning derived, in turn, from a knowledge base with less indetermination. The use of variants of the Wang–Mendel algorithm could be of great help in this task. On the other hand, the precision of the system could be increased by using a machine learning assembly strategy so that it would not be necessary to select a specific algorithm but rather a specific assembly method. This, together with the use of the rule generators mentioned above, certainly deserves further in-depth research.

Author Contributions

Conceptualization, M.C.-G. and A.C.-C.; methodology, A.C.-C. and J.-B.B.-R.; software, M.C.-G.; validation, M.C.-G., A.C.-C., J.-B.B.-R. and J.C.-P.; investigation, M.C.-G., A.C.-C., J.-B.B.-R. and J.C.-P.; resources, M.C.-G.; writing—original draft preparation, M.C.-G. and A.C.-C.; writing—review and editing, M.C.-G., J.-B.B.-R., J.C.-P. and A.C.-C.; supervision, J.-B.B.-R. and J.C.-P. All authors have read and agreed to the published version of the manuscript.

Funding

This research received no external funding.

Institutional Review Board Statement

Not applicable.

Informed Consent Statement

Not applicable.

Data Availability Statement

Not applicable.

Acknowledgments

M.C.-G. is grateful to Consellería de Educación, Universidade e Formación Profesional e Consellería de Economía, Emprego e Industria da Xunta de Galicia (ED481A-2020/038) for his pre-doctoral fellowship.

Conflicts of Interest

The authors declare no conflict of interest.

References

  1. Goldammer, J.; Mitsopoulos, I.; Mallinis, G.; Woolf, M. Wildfire Hazard and Risk Assessment. In Words into Action Guidelines-National Disaster Risk Assessment; United Nations Office for Disaster Risk Reduction: Geneva, Switzerland, 2017. [Google Scholar]
  2. San-Miguel-Ayanz, J.; Durrant, T.; Boca, R.; Maianti, P.; Libertá, G.; Artés-Vivancos, T.; Oom, D.; Branco, A.; de Rigo, D.; Ferrari, D.; et al. Forest Fires in Europe Middle East and North Africa 2020; Publications Office of the European Union: Luxembourg, 2021; ISBN 978-92-76-42351-5. [Google Scholar]
  3. Abid, F. A Survey of Machine Learning Algorithms Based Forest Fires Prediction and Detection Systems. Fire Technol. 2021, 57, 559–590. [Google Scholar] [CrossRef]
  4. Woźniak, M.; Graña, M.; Corchado, E. A Survey of Multiple Classifier Systems as Hybrid Systems. Inf. Fusion 2014, 16, 3–17. [Google Scholar] [CrossRef] [Green Version]
  5. Da Silva, S.S.; Fearnside, P.M.; de Graça, P.M.L.A.; Brown, I.F.; Alencar, A.; de Melo, A.W.F. Dynamics of Forest Fires in the Southwestern Amazon. For. Ecol. Manag. 2018, 424, 312–322. [Google Scholar] [CrossRef]
  6. Korovin, G.N. Analysis of the Distribution of Forest Fires in Russia; Springer: Dordrecht, The Netherlands, 1996; pp. 112–128. [Google Scholar] [CrossRef]
  7. Fiorucci, P.; Gaetani, F.; Minciardi, R.; Trasforini, E. Forest fire dynamic hazard assessment and pre-operational resource allocation. IFAC Proc. Vol. 2005, 38, 91–96. [Google Scholar] [CrossRef] [Green Version]
  8. Liu, Z.; Kim, A.K. A Review of Water Mist Fire Suppression Systems—Fundamental Studies. J. Fire Prot. Eng. 1999, 10, 32–50. [Google Scholar] [CrossRef] [Green Version]
  9. Mawhinney, J.R.; Back, G.G. Water Mist Fire Suppression Systems. In SFPE Handbook of Fire Protection Engineering, 5th ed.; Hurley, M.J., Ed.; Springer: New York, NY, USA, 2016. [Google Scholar]
  10. Martin, D.; Tomida, M.; Meacham, B. Environmental Impact of Fire. Fire Sci. Rev. 2016, 5, 1. [Google Scholar] [CrossRef] [Green Version]
  11. Giménez, A.; Pastor, E.; Zárate, L.; Planas, E.; Arnaldos, J.; Giménez, A.; Pastor, E.; Zárate, L.; Planas, E.; Arnaldos, J. Long-Term Forest Fire Retardants: A Review of Quality, Effectiveness, Application and Environmental Considerations. Int. J. Wildl. Fire 2004, 13, 1–15. [Google Scholar] [CrossRef]
  12. Fowler, C.T. Human Health Impacts of Forest Fires in the Southern United States: A Literature Review. J. Ecol. Anthropol. 2003, 7, 39–63. [Google Scholar] [CrossRef] [Green Version]
  13. Finlay, S.E.; Moffat, A.; Gazzard, R.; Baker, D.; Murray, V. Health Impacts of Wildfires. PLoS Curr. 2012, 4, e4f959951cce2c. [Google Scholar] [CrossRef]
  14. House of Representatives Committee on Science, Space, and Technology. Science and Technology. From the Lab Bench to the Marketplace: Improving Technology Transfer: Hearing Charter; U.S. House of Representatives Committee on Science and Technology, Subcommittee on Research and Science Education: Washington, DC, USA, 2010. [Google Scholar]
  15. Alonso-Betanzos, A.; Fontenla-Romero, O.; Guijarro-Berdiñas, B.; Hernández-Pereira, E.; Paz Andrade, M.I.; Jiménez, E.; Soto, J.L.L.; Carballas, T. An Intelligent System for Forest Fire Risk Prediction and Fire Fighting Management in Galicia. Expert Syst. Appl. 2003, 25, 545–554. [Google Scholar] [CrossRef]
  16. Bisquert, M.; Caselles, E.; Sánchez, J.M.; Caselles, V.; Bisquert, M.; Caselles, E.; Sánchez, J.M.; Caselles, V. Application of Artificial Neural Networks and Logistic Regression to the Prediction of Forest Fire Danger in Galicia Using MODIS Data. Int. J. Wildl. Fire 2012, 21, 1025–1029. [Google Scholar] [CrossRef]
  17. Cortez, P.; Morais, A. A Data Mining Approach to Predict Forest Fires Using Meteorological Data. In Proceedings of the 13th Portuguese Conference on Artificial Intelligence, Guimarães, Portugal, 3–7 December 2007; pp. 512–523. [Google Scholar]
  18. Pham, B.T.; Jaafari, A.; Avand, M.; Al-Ansari, N.; Du, T.D.; Hai Yen, H.P.; van Phong, T.; Nguyen, D.H.; van Le, H.; Mafi-Gholami, D.; et al. Performance Evaluation of Machine Learning Methods for Forest Fire Modeling and Prediction. Symmetry 2020, 12, 1022. [Google Scholar] [CrossRef]
  19. Nebot, À.; Mugica, F. Forest Fire Forecasting Using Fuzzy Logic Models. Forests 2021, 12, 1005. [Google Scholar] [CrossRef]
  20. Jaafari, A.; Razavi Termeh, S.V.; Bui, D.T. Genetic and Firefly Metaheuristic Algorithms for an Optimized Neuro-Fuzzy Prediction Modeling of Wildfire Probability. J. Environ. Manag. 2019, 243, 358–369. [Google Scholar] [CrossRef]
  21. Lai, C.; Zeng, S.; Guo, W.; Liu, X.; Li, Y.; Liao, B. Forest Fire Prediction with Imbalanced Data Using a Deep Neural Network Method. Forests 2022, 13, 1129. [Google Scholar] [CrossRef]
  22. Wasserman, L. All of Statistics: A Concise Course in Statistical Inference; Springer: New York, NY, USA, 2004; Volume 26, ISBN 978-0-387-21736-9. [Google Scholar]
  23. Casal-Guisande, M.; Comesaña-Campos, A.; Cerqueiro-Pequeño, J.; Bouza-Rodríguez, J.-B. Design and Development of a Methodology Based on Expert Systems, Applied to the Treatment of Pressure Ulcers. Diagnostics 2020, 10, 614. [Google Scholar] [CrossRef]
  24. Comesaña-Campos, A.; Casal-Guisande, M.; Cerqueiro-Pequeño, J.; Bouza-Rodríguez, J.B. A Methodology Based on Expert Systems for the Early Detection and Prevention of Hypoxemic Clinical Cases. Int. J. Environ. Res. Public Health 2020, 17, 8644. [Google Scholar] [CrossRef] [PubMed]
  25. Cerqueiro-Pequeño, J.; Comesaña-Campos, A.; Casal-Guisande, M.; Bouza-Rodríguez, J.-B. Design and Development of a New Methodology Based on Expert Systems Applied to the Prevention of Indoor Radon Gas Exposition Risks. Int. J. Environ. Res. Public Health 2020, 18, 269. [Google Scholar] [CrossRef] [PubMed]
  26. Casal-Guisande, M.; Comesaña-Campos, A.; Dutra, I.; Cerqueiro-Pequeño, J.; Bouza-Rodríguez, J.-B. Design and Development of an Intelligent Clinical Decision Support System Applied to the Evaluation of Breast Cancer Risk. J. Pers. Med. 2022, 12, 169. [Google Scholar] [CrossRef] [PubMed]
  27. UCI Machine Learning Repository: Forest Fires Data Set. Available online: http://archive.ics.uci.edu/ml/datasets/Forest+Fires (accessed on 16 March 2022).
  28. Gruber, T.R. Ontolingua: A Mechanism to Support Portable Ontologies; Technical report KSL-91-66; Stanford University: Stanford, CA, USA, 1992. [Google Scholar]
  29. Gruber, T.R. A Translation Approach to Portable Ontology Specifications. Knowl. Acquis. 1993, 5, 199–220. [Google Scholar] [CrossRef]
  30. Grüninger, M.; Fox, M.S. Methodology for the Design and Evaluation of Ontologies. In Proceedings of the IJCAI95 Workshop on Basic Ontological Issues in Knowledge, Montreal, Canada, 13 April 1995. Montreal, QC, Canada, 13 April 1995; pp. 6.1–6.10. [Google Scholar]
  31. Lenat, D.B.; Guha, R.V. Building Large Knowledge-Based Systems; Representation and Inference in the Cyc Project; Addison-Wesley Longman Publishing Co., Inc.: Boston, MA, USA, 1989. [Google Scholar]
  32. Tabachnick, B.G.; Fidell, L.S.; Ullman, J.B. Using Multivariate Statistics; Pearson: Boston, MA, USA, 2007; Volume 5. [Google Scholar]
  33. Harris, R.J. A Primer of Multivariate Statistics; Psychology Press: London, UK, 2001. [Google Scholar]
  34. Castillo, E.; Gutiérrez, J.M.; Hadi, A.S. Expert Systems and Probabilistic Network Models; Monographs in Computer Science; Springer Science & Business Media: Berlin/Heidelberg, Germany, 2012. [Google Scholar]
  35. Hair, J.F.; Black, W.C.; Babin, B.J.; Anderson, R.E. Multivariate Data Analysis; Prentice Hall: Upper Saddle River, NJ, USA, 2009; Volume 87, ISBN 9780138132637. [Google Scholar]
  36. LeCun, Y.; Bottou, L.; Bengio, Y.; Haffner, P. Gradient-Based Learning Applied to Document Recognition. Proc. IEEE 1998, 86, 2278–2323. [Google Scholar] [CrossRef] [Green Version]
  37. Lecun, Y.; Bengio, Y.; Hinton, G. Deep Learning. Nature 2015, 521, 436–444. [Google Scholar] [CrossRef] [PubMed]
  38. Conneau, A.; Schwenk, H.; le Cun, Y.; Barrault, L. Very Deep Convolutional Networks for Text Classification. In Proceedings of the 15th Conference of the European Chapter of the Association for Computational Linguistics: Volume 1, Long Papers, Valencia, Spain, 3–7 April 2017; pp. 1107–1116. [Google Scholar] [CrossRef]
  39. MATLAB App Designer—MATLAB & Simulink. Available online: https://es.mathworks.com/products/matlab/app-designer.html (accessed on 10 August 2022).
  40. Fuzzy Logic Toolbox—MATLAB. Available online: https://es.mathworks.com/products/fuzzy-logic.html (accessed on 10 August 2022).
  41. App Classification Learner—MATLAB & Simulink—MathWorks España. Available online: https://es.mathworks.com/help/stats/classification-learner-app.html (accessed on 10 August 2022).
  42. Deep Learning Toolbox—MATLAB. Available online: https://es.mathworks.com/products/deep-learning.html (accessed on 10 August 2022).
  43. Imbalanced-Learn Documentation—Version 0.9.1. Available online: https://imbalanced-learn.org/stable/ (accessed on 10 August 2022).
  44. Chawla, N.V.; Bowyer, K.W.; Hall, L.O.; Kegelmeyer, W.P. SMOTE: Synthetic Minority over-Sampling Technique. J. Artif. Intell. Res. 2002, 16, 321–357. [Google Scholar] [CrossRef]
  45. Mohammed, A.J.; Hassan, M.M.; Kadir, D.H. Improving Classification Performance for a Novel Imbalanced Medical Dataset Using Smote Method. Int. J. Adv. Trends Comput. Sci. Eng. 2020, 9, 3161–3172. [Google Scholar] [CrossRef]
  46. Kumari, R.; Srivastava, S. Machine Learning: A Review on Binary Classification. Int. J. Comput. Appl. 2017, 160, 11–15. [Google Scholar] [CrossRef]
  47. Duda, R.O.; Hart, P.E.; Stork, D.G. Pattern Classification; Wiley: Hoboken, NJ, USA, 2000. [Google Scholar]
  48. Mamdani, E.H. Advances in the Linguistic Synthesis of Fuzzy Controllers. Int. J. Man Mach. Stud. 1976, 8, 669–678. [Google Scholar] [CrossRef]
  49. Mamdani, E.H. Application of Fuzzy Logic to Approximate Reasoning Using Linguistic Synthesis. IEEE Trans. Comput. 1977, C–26, 1182–1191. [Google Scholar] [CrossRef]
  50. Mamdani, E.H.; Assilian, S. An Experiment in Linguistic Synthesis with a Fuzzy Logic Controller. Int. J. Man Mach. Stud. 1975, 7, 1–13. [Google Scholar] [CrossRef]
  51. Ross, T.J. Fuzzy Logic with Engineering Applications, 3rd ed.; John Wiley & Sons, Ltd.: Chichester, UK, 2010; ISBN 9781119994374. [Google Scholar]
  52. Jet Colormap Array—MATLAB Jet—MathWorks España. Available online: https://es.mathworks.com/help/matlab/ref/jet.html (accessed on 12 August 2022).
  53. Goodfellow, I.; Bengio, Y.; Courville, A. Deep Learning; MIT Press: Cambridge, MA, USA, 2016. [Google Scholar]
  54. Rodriguez, A. Deep Learning Systems: Algorithms, Compilers, and Processors for Large-Scale Production. In Synthesis Lectures on Computer Architecture; Morgan & Claypool Publishers: San Rafael, CA, USA, 2021; Volume 15, pp. 1–265. [Google Scholar] [CrossRef]
  55. Szegedy, C.; Liu, W.; Jia, Y.; Sermanet, P.; Reed, S.; Anguelov, D.; Erhan, D.; Vanhoucke, V.; Rabinovich, A. Going Deeper with Convolutions. In Proceedings of the IEEE Computer Society Conference on Computer Vision and Pattern Recognition, Boston, MA, USA, 7–12 June 2015; pp. 1–9. [Google Scholar] [CrossRef]
  56. Wang, L.X.; Mendel, J.M. Generating Fuzzy Rules by Learning from Examples. IEEE Trans. Syst. Man Cybern. 1992, 22, 1414–1427. [Google Scholar] [CrossRef] [Green Version]
  57. Cooper, J.C.B. Artificial Neural Networks versus Multivariate Statistics: An Application from Economics. J. Appl. Stat. 2010, 26, 909–921. [Google Scholar] [CrossRef]
  58. Wang, C.Y.; Lee, T.F.; Fang, C.H.; Chou, J.H. Fuzzy Logic-Based Prognostic Score for Outcome Prediction in Esophageal Cancer. IEEE Trans. Inf. Technol. Biomed. 2012, 16, 1224–1230. [Google Scholar] [CrossRef] [PubMed]
  59. Yazdanbakhsh, O.; Dick, S. Forecasting of Multivariate Time Series via Complex Fuzzy Logic. IEEE Trans. Syst. Man Cybern. Syst. 2017, 47, 2160–2171. [Google Scholar] [CrossRef]
  60. Egrioglu, E.; Aladag, C.H.; Yolcu, U.; Uslu, V.R.; Basaran, M.A. A New Approach Based on Artificial Neural Networks for High Order Multivariate Fuzzy Time Series. Expert Syst. Appl. 2009, 36, 10589–10594. [Google Scholar] [CrossRef]
  61. Smithson, M. Multivariate Analysis Using ‘and’ and ‘Or’. Math. Soc. Sci. 1984, 7, 231–251. [Google Scholar] [CrossRef]
  62. Porzel, R. Contextual Computing: Models and Applications; Springer Science & Business Media: Berlin/Heidelberg, Germany, 2010. [Google Scholar]
  63. Casal-Guisande, M.; Comesaña-Campos, A.; Pereira, A.; Bouza-Rodríguez, J.-B.; Cerqueiro-Pequeño, J. A Decision-Making Methodology Based on Expert Systems Applied to Machining Tools Condition Monitoring. Mathematics 2022, 10, 520. [Google Scholar] [CrossRef]
Figure 1. Flow diagram of the methodology based on intelligent systems. The green blocks refer to Level 1 of the methodology, while the gray blocks refer to Level 2.
Forests 14 00172 g001
Figure 2. Shot of the application’s main screen.
Forests 14 00172 g002
Figure 3. ROC curves for (a) Bagged Tree (b) Wide Neural Network and (c) Fine Gaussian SVM.
Forests 14 00172 g003
Figure 4. Diagram of the inference systems.
Forests 14 00172 g004
Figure 5. Image construction process.
Forests 14 00172 g005
Figure 6. Entering weather station data and determining the Objective Technical Risk.
Forests 14 00172 g006
Figure 7. Image generation.
Forests 14 00172 g007
Figure 8. Expert Risk Matrix.
Forests 14 00172 g008
Figure 9. Expert Risk Map.
Forests 14 00172 g009
Figure 10. Technical Risk Matrix.
Forests 14 00172 g010
Figure 11. Technical Risk Map.
Forests 14 00172 g011
Figure 12. Global Risk Matrix.
Forests 14 00172 g012
Figure 13. Global Risk Map.
Forests 14 00172 g013
Table 1. Summary of the variables.
Variables
Data collected by the warden responsible for the natural parkMonth
Day of the week
X-coordinate
Y-coordinate
Burnt area
Data come from a weather stationTemperature (°C)
Relative humidity (%)
Wind speed (km/h)
Precipitation (mm/m2)
Table 2. Summary of the questions for the expert.
Explanatory Variable-AntecedentValuation Scale (0–10)
Assess the hazard associated with undergrowth in quadrant (X,Y).0-1-2-3-4-5-6-7-8-9-10
The expert must assess the presence of undergrowth in the study region, as well as how this situation might affect the potential beginning of a fire.
Assess the hazard associated with the presence of humans in quadrant (X,Y)0-1-2-3-4-5-6-7-8-9-10
The expert must assess the human presence and activity in the study region, as well as how these might affect the potential beginning of a fire.
Table 3. Summary of the dataset variables.
Independent Variables of the Starting DatasetIndependent Variables of the Machine Learning DatasetIndependent Variables of the Deep Learning DatasetIndependent Variables of the Expert System Dataset
TemperatureTemperatureTemperatureUndergrowth
Relative humidityRelative humidityRelative humidityHuman activity
Wind speedWind speedWind speed
RainfallRainfallRainfall
MonthMonthMonth
Day of the weekDay of the weekDay of the week
X-coordinate-
Y-coordinate-
Dependent Variable of the Initial DatasetDependent Variable of the Machine Learning DatasetDependent Variable of the Deep Learning DatasetDependent Variable of the Expert System Dataset
Burnt area per quadrantObjective Technical Fire Risk in the zoneObjective Technical Fire Risk per quadrantExpert Risk of fire per quadrant
Table 4. Summary of classification algorithm data.
Summary of the Classification Algorithm
Bagged Trees Model
Ensemble aggregation method: Bag
Number of ensemble learning cycles: 130
Learners: Decision tree
Maximum number of splits: 1316
Number of learners: 237
Table 5. Initial configuration of the inference system for the calculation of the Expert Risk Matrix.
Inference System for the Calculation of the Expert Risk Matrix
Input DataRangeOutput DataRange
Undergrowth0–10Expert Risk0–100
Forests 14 00172 i001Forests 14 00172 i002
Human activity0–10Initial configuration
Forests 14 00172 i003Fuzzy structure: Mamdani-type.
Membership function type: trapezoidal.
Defuzzification method: centroid.
Implication method: MIN.
Aggregation method: MAX.
Number of fuzzy rules: 21
21 rules of the system
  • IF (Undergrowth is Low) AND (Human activity is Low) THEN (Expert Risk is 0).
  • IF (Undergrowth is Low) AND (Human activity is Medium) THEN (Expert Risk is 30).
  • IF (Undergrowth is Low) AND (Human activity is Medium) THEN (Expert Risk is 50).
  • IF (Undergrowth is Low) AND (Human activity is Medium) THEN (Expert Risk is 70).
  • IF (Undergrowth is Low) AND (Human activity is High) THEN (Expert Risk is 50).
  • IF (Undergrowth is Low) AND (Human activity is High) THEN (Expert Risk is 70).
  • IF (Undergrowth is Low) AND (Human activity is High) THEN (Expert Risk is 90).
  • IF (Undergrowth is Medium) AND (Human activity is Low) THEN (Expert Risk is 30).
  • IF (Undergrowth is Medium) AND (Human activity is Low) THEN (Expert Risk is 50).
  • IF (Undergrowth is Medium) AND (Human activity is Low) THEN (Expert Risk is 70).
  • IF (Undergrowth is Medium) AND (Human activity is Medium) THEN (Expert Risk is 50).
  • IF (Undergrowth is Medium) AND (Human activity is Medium) THEN (Expert Risk is 70).
  • IF (Undergrowth is Medium) AND (Human activity is Medium) THEN (Expert Risk is 90).
  • IF (Undergrowth is Medium) AND (Human activity is High) THEN (Expert Risk is 90).
  • IF (Undergrowth is Medium) AND (Human activity is High) THEN (Expert Risk is 100).
  • IF (Undergrowth is High) AND (Human activity is Low) THEN (Expert Risk is 70).
  • IF (Undergrowth is High) AND (Human activity is Low) THEN (Expert Risk is 90).
  • IF (Undergrowth is High) AND (Human activity is Low) THEN (Expert Risk is 100).
  • IF (Undergrowth is High) AND (Human activity is Medium) THEN (Expert Risk is 70).
  • IF (Undergrowth is High) AND (Human activity is Medium) THEN (Expert Risk is 90).
  • IF (Undergrowth is High) AND (Human activity is High) THEN (Expert Risk is 100).
Surface
Forests 14 00172 i004
Table 6. Network training parameters.
ParameterValue
Mini-Batch Size10
Epochs297
Learning Rate0.0001
Validation frequency3 epochs
Total time160 min
Table 7. Initial configuration of the inference system for calculating the Global Risk Matrix.
Inference System for the Calculation of the Global Risk
Input DataRangeOutput DataRange
Technical Risk0–100Global Risk0–100
Forests 14 00172 i005Forests 14 00172 i006
Expert Risk0–100Initial configuration
Forests 14 00172 i007Fuzzy structure: Mamdani-type.
Membership function type: trapezoidal.
Defuzzification method: centroid.
Implication method: MIN.
Aggregation method: MAX.
Number of fuzzy rules: 21
21 rules of the system
  • IF (Technical Risk is Low) AND (Expert Risk is Low) THEN (Global Risk is 0).
  • IF (Technical Risk is Low) AND (Expert Risk is Medium) THEN (Global Risk is 30).
  • IF (Technical Risk is Low) AND (Expert Risk is Medium) THEN (Global Risk is 50).
  • IF (Technical Risk is Low) AND (Expert Risk is Medium) THEN (Global Risk is 70).
  • IF (Technical Risk is Low) AND (Expert Risk is High) THEN (Global Risk is 50).
  • IF (Technical Risk is Low) AND (Expert Risk is High) THEN (Global Risk is 70).
  • IF (Technical Risk is Low) AND (Expert Risk is High) THEN (Global Risk is 90).
  • IF (Technical Risk is Medium) AND (Expert Risk is Low) THEN (Global Risk is 30).
  • IF (Technical Risk is Medium) AND (Expert Risk is Low) THEN (Global Risk is 50).
  • IF (Technical Risk is Medium) AND (Expert Risk is Low) THEN (Global Risk is 70).
  • IF (Technical Risk is Medium) AND (Expert Risk is Medium) THEN (Global Risk is 50).
  • IF (Technical Risk is Medium) AND (Expert Risk is Medium) THEN (Global Risk is 70).
  • IF (Technical Risk is Medium) AND (Expert Risk is Medium) THEN (Global Risk is 90).
  • IF (Technical Risk is Medium) AND (Expert Risk is High) THEN (Global Risk is 90).
  • IF (Technical Risk is Medium) AND (Expert Risk is High) THEN (Global Risk is 100).
  • IF (Technical Risk is High) AND (Expert Risk is Low) THEN (Global Risk is 70).
  • IF (Technical Risk is High) AND (Expert Risk is Low) THEN (Global Risk is 90).
  • IF (Technical Risk is High) AND (Expert Risk is Low) THEN (Global Risk is 100).
  • IF (Technical Risk is High) AND (Expert Risk is Medium) THEN (Global Risk is 70).
  • IF (Technical Risk is High) AND (Expert Risk is Medium) THEN (Global Risk is 90).
  • IF (Technical Risk is High) AND (Expert Risk is High) THEN (Global Risk is 100).
Surface
Forests 14 00172 i008
Table 8. Starting data.
VariablesValues
MonthAugust
Day of the weekSaturday
Temperature (°C)38
Relative humidity (%)55%
Wind speed (km/h)8.5
Rainfall (mm/m2)0
Table 9. Expert assessments on undergrowth in each quadrant.
X/Y123456789
1070002000
2364202033
3246264233
4225576533
5222577443
6202675243
7000002233
8000000033
9000000033
Table 10. Expert assessments on human activity in each quadrant.
X/Y123456789
1040002000
2354202033
3224274233
4222576533
5222577443
6202565243
7000002233
8000000033
9000000033
Table 11. Benchmarking.
Method/SystemInternal ArchitectureScalabilityInferenceLearning
Amparo Alonso-Betanzos et al. [15]The proposed system has several modules. The module aimed for the prevention of fires is based in the use of a neural network that manages the uncertainty with a probabilistic approach. The system includes other modules aimed to the extinction and recuperation of burnt areas which will not be taken in consideration for this comparison. The system is not
scalable.
The system uses
statistical inference
instead of symbolic
reasoning.
The system incorporates new
knowledge in the process of
training the architecture
----
Mar Bisquert et al. [16]The system uses models based on logistic regression and neural networks. It manages the uncertainty with a probabilistic approach.The system is not
scalable.
The system uses
statistical inference
instead of symbolic
reasoning.
The system incorporates new
knowledge in the process of
training the architecture.
--=-
Paulo Cortez y Aníbal Morais [17]The authors propose the use of support vector machines for the prediction of the burnt area. A
probabilistic approach
is applied to uncertainty
control.
The system is not
scalable.
The system uses
statistical inference
instead of symbolic
reasoning.
The system incorporates
knowledge in a subsidiary
way to its classification
process.
----
Binh Thai Pham et al. [18]The authors use different approaches of machine learning for the prediction of fire, obtaining the best results using a Bayes network. An implicit management of uncertainty is used, based in the calculation of probabilities. The system is not scalable, as it is associated to the network model.Statistical inference is used instead of symbolic reasoning.The system incorporates knowledge in a way that is subsidiary to the Bayesian network.
----
Àngela Nebot y Francisco Mugica [19]The authors use a
neuro-fuzzy system,
which does manage
uncertainty.
The system is not
scalable.
It uses statistical
inference and
symbolic
reasoning.
The system incorporates
knowledge by means of a
training process.
=-=-
Abolfazl Jaafari et al. [20]The authors use a
neuro-fuzzy system,
which does manage
uncertainty.
The system is not
scalable.
It uses statistical
inference and
symbolic
reasoning.
The system incorporates
knowledge by means of a
training process.
=-=-
Can Lai et al. [21]The authors use a sparse autoencoder-based deep neural network, so a probabilistic management of uncertainty is used. The system is not
scalable.
The system uses
statistical inference
instead of symbolic
reasoning.
The system incorporates new
knowledge in the process of
training the architecture.
----
Proposed systemThe proposed system manages the uncertainty using probabilistic and non-probabilistic approaches.The proposed
system is scalable. It is possible to
modify the
calculation and
inference modules.
The system uses deductive symbolic reasoning methods and statistical inference models.The system has capabilities to model and incorporate new knowledge and to learn across the process.
Disclaimer/Publisher’s Note: The statements, opinions and data contained in all publications are solely those of the individual author(s) and contributor(s) and not of MDPI and/or the editor(s). MDPI and/or the editor(s) disclaim responsibility for any injury to people or property resulting from any ideas, methods, instructions or products referred to in the content.

