Article

Different Environmental and Phylogenetic Controls over the Altitudinal Variation in Leaf N and P Resorption Traits between Woody and Herbaceous Plants

1
College of Forestry, Northwest A&F University, Yangling, Xianyang 712100, China
2
Qinling National Forest Ecosystem Research Station, Huoditang, Ningshan, Ankang 711600, China
*
Authors to whom correspondence should be addressed.
Forests 2023, 14(1), 5; https://doi.org/10.3390/f14010005
Submission received: 24 November 2022 / Revised: 13 December 2022 / Accepted: 14 December 2022 / Published: 20 December 2022
(This article belongs to the Topic Plants Nutrients)

Abstract

:
Leaf nutrient resorption traits are regarded as important indicators reflecting the strategy of plant nutrient conservation, yet the mechanism underlying the variation of resorption traits in different plant growth forms (PGFs) remains unclear. In order to untangle the phylogenetic and environmental influences on leaf nitrogen (N) and phosphorus (P) resorption traits between woody and herbaceous plants, we investigated N and P contents of green and senesced leaves in 53 species along an altitudinal gradient (1374–3649 m) in the Taibai Mountain of central China and estimated leaf N and P resorption efficiency and proficiency. Our results show that leaf N and P resorption efficiency (NRE and PRE) had significant positive trends with altitude in both woody and herbaceous plants (all p < 0.05); however, their altitudinal patterns of N and P resorption proficiency (NRP and PRP) were different. For woody plants, leaf NRP and NRE:PRE first decreased and then increased with altitude (p < 0.05), while NRP:PRP had the opposite trend (p < 0.05). In herbaceous plants, leaf NRP and PRP decreased but NRP:PRP increased with altitude (p < 0.05). Climatic factors exerted the major influences on the variation in leaf NRE and PRE (18.5–24.8% explained variation). However, phylogenetic taxonomy mainly affected the variation of leaf PRP and NRP:PRP (45.2% and 41.4% explained variation) in all species, NRP:PRP in woody plants (37.8% explained variation), and NRE:PRE in herbaceous plants (49.7% explained variation). In addition, leaf NRP:PRP showed a significant phylogenetic signal (Blomberg’s p < 0.05). These results highlight the importance of taking PGFs and phylogenetic information into consideration when examining the interspecies variation in leaf resorption under environmental changes, which can advance our knowledge of plant nutrient utilization strategies in response to fluctuating environments and lay the groundwork for the development of complex element biogeochemical models.

1. Instruction

Leaf nutrient resorption is a process of resorbing nutrient from senescing leaves to other organs or issues [1,2], which is known as an important nutrient conservation strategy, especially when root uptake become costly [3,4,5]. The capacity of leaf nutrient resorption is usually represented by two parameters, nutrient resorption proficiency (NuRP), and nutrient resorption efficiency (NuRE). NuRP is estimated by the nutrient content in senesced leaves, indicating a potential nutrient pool and the completion degree of resorption [6]. Lower NuRP shows a lower biochemical limit and a higher completion degree of resorption [6]. In contrast, leaf NuRE is the percent reduction of nutrients between green and senesced leaves, which indicates the proportion and efficiency of nutrient recycling [7]. Higher NuRE means a higher proportion of resorption nutrients from green leaves. These two kinds of resorption traits can reflect the importance and preference for nutrient recycling of plants, which are associated with environmental adaptation in various species. Nitrogen (N) and phosphorus (P) are key limiting nutrients for plant growth, and N and P limitation could be examined by the ratios of leaf N and P resorption efficiencies (NRE:PRE) of the dominant species in a recent study [8]. Thus, it is crucial to uncover the variation mechanisms of leaf N and P resorption traits for a better understanding plants’ nutrient strategies in fluctuating environments.
Leaf nutrient resorption traits are influenced by environmental gradients. At the global and regional scales, leaf N resorption efficiency (NRE) increased, and N resorption proficiency (NRP) decreased with increasing latitude [3,4,9], while leaf P resorption efficiency (PRE) and P resorption proficiency (PRP) showed the opposite or similar trends [3,4,10,11]. Soil nutrient availability is usually regarded as the most essential environmental factor in the variation of leaf NuRE and NuRP. Under infertile environments, plants generally tend to improve their nutrient resorption capacity in order to reduce the dependence on root uptake [11,12,13,14]. With regard to leaf NRE:PRE, soil N and P limitation status was the key factor in the study of Du et al. (2020) [8]. In addition, climatic factors (temperature and precipitation) could indirectly influence resorption traits by affecting the nutrient contents in green and senesced leaves, soil nutrient availability, phenology, and other factors [2,3,4]. In studies of leaf resorption patterns, leaf NRP increased with the increasing mean annual temperature and precipitation (MAT and MAP), while PRP had the opposite trend [4,9]. Meanwhile, leaf NRE decreased with the increasing MAT and MAP, and PRE had the opposite trends to NRE [3,9]. In addition, some studies showed different results. For example, both leaf NRE and PRE had negative correlation relationships with MAT [10,14] and MAP [14]. Accordingly, further studies were needed to reveal the environmental adaptation mechanism of resorption.
Furthermore, leaf nutrient resorption traits may be controlled by phylogenetic effects to some extent. In previous studies, both phylogenetic and environmental factors were proved to have considerable influences on leaf nutrient elements, especially macroelements [15,16]. However, it remains unclear how plant phylogeny influences leaf resorption traits. In the limited studies, Killingbeck (1996) [6] found that leaf NuRP had similarities among some closely related phylogenetic taxa, and Lang et al. (2014) [17] reported that leaf NuRE was tightly related to the evolution of conducting tissues in subarctic cryptogams and seed plants. However, the results from Zhang et al. (2015) [18] found that the phylogenetic signals of leaf NuRE were insignificant in woody plants. Moreover, previous studies found that a strong linkage occurred between nutrient content in senesced and green leaves [19], but the relationships between NuRE and nutrients in green leaves were uncertain, which may be negative [20] or positive [21]. Therefore, we hypothesize that the nutrient concentration in senesced leaves, i.e., NuRP, will show phylogenetic conservatism to some extent. However, as a trait plastic to environmental changes, NuRE would be influenced by environmental factors more than phylogenetic information (Hypothesis 1).
In addition, plant growth form (PGF) is also an important factor of variation in leaf nutrient resorption [1,22]. Woody plants generally have higher NRE than herbaceous plants [23], due to the more developed nutrient transport and reserve issues of woody plants [23]. Differently, herbaceous plants prefer to resorb P than woody plants from the senescent leaves to reduce their dependence on the P uptake of roots [22]. So far, however, few studies simultaneously focus on and compare the variation and spatial pattern in leaf resorption of both woody and herbaceous species. Altitudinal gradients include large environmental changes in a small spatial range [24], which offers a natural laboratory for proving ecological theories. With the increased altitude, the vegetation types gradually change from forests to shrubs and meadows [25,26]. At the same time, the environment becomes more stressful for plants to acquire nutrients and grow with the increased altitude, which makes the process of nutrient resorption more important. Therefore, we hypothesize that leaf NuRP would increase and NuRE would decrease with altitude in all species (Hypothesis 2). However, since the P element plays a key role in herbaceous plants’ adaptation to the external environment [22], we hypothesize herbs would resorb more P with the increasing altitude, thus leaf NRP:PRP would increase and NRE:PRE would decrease with altitude (Hypothesis 3).
In order to test these hypotheses, we collected green and senesced leaves of 57 species along a 2300-m altitudinal gradient in Taibai Mountain of central China and obtained their N and P resorption traits. These selected species encompassed broad phylogenetic lineages, which allowed the trait variation and its potential drivers to be investigated from a phylogenetic perspective.

2. Methods

2.1. Study Site

Our study was carried out in the Taibai Mountain Nature Reserve (33°49′ N–34°10′ N, 107°19′ E–107°58′ E, 3767 m a.s.l.), Shaanxi Province, central China. As the highest peak of the Qinling Mountains, Taibai Mountain is the highest mountain in eastern mainland China. With the increased altitude of the northern slope of Taibai Mountain, there are deciduous broadleaved forest dominated by Quercus spp. (below 2300 m), temperate birch forests dominated by Betula albosinensis and B. utilis (2300–2800 m), fir (Abies fargesii) forest (2600–3000 m), larch (Larix potaninii var. chinensis) forest (3000–3350 m), alpine shrubland dominated by Rhododendron capitatum (3400–3700 m), and alpine meadow dominated by Polygonum viviparum (>3500 m) [25,26].

2.2. Field Sampling and Chemical Analyses

Our sampling sites were set at 1374 m, 2483 m, 2934 m, 3180 m, 3375 m, and 3649 m, corresponding to the six major vegetation types on the northern slope of the Taibai Mountain. Four 20 m × 20 m experimental plots were established at each site, and geographic information such as the longitude, latitude, and altitude of each site in each plot was recorded. Types of bedrock are mainly adamellite and mixed rocks in our sites (rock and soil types in the six sampling sites were in Table S1). In July 2017, 30 green leaves of each plant species were collected from more than three healthy individuals in every plot. At the same time, soil samples were collected in five locations of each plot, which were taken in the 0–10 cm soil layer. Senesced leaves were collected during the period of October and November in 2017. For trees, we laid a plastic cloth on the ground to collect senesced leaves by using a high branch scissor to tap branches. For shrubs and herbs, we picked or cut off senesced leaves from living plant individuals directly. The herbaceous species collected are all perennial. In total, 57 species from 13 clades, 19 orders, and 32 families were sampled. The species lists of each site were in Table S2.
The total N concentrations of leaf and soil samples were determined by dry combustion using an elemental analyser (Vario MAX CN Elemental Analyzer, Elementar, Germany). Total P concentrations were measured by the ammonium molybdate method using a continuous-flow analyser (AutoAnalyzer3 Continuous-Flow Analyzer; Bran Luebbe, Germany) after H2SO4-HCLO4 digestion for leaves and H2SO4-H2O2-HF digestion for soil. Air-dried soil was extracted in K2SO4 and analysed for NH4 by the salicylate method and for NO3 by the cadmium, soil inorganic N (SIN) is the sum of NO3 + NH4. To measure soil available P (SAP), fresh soil samples were extracted using 0.5 mol L−1 NaHCO3, and the P concentration of the extract was determined by the ammonium molybdate method.

2.3. Calculations of Leaf Nutrient Resorption

Nutrient resorption proficiency was expressed by nutrient element concentration of senesced leaves on a mass basis [6]. It should be noted that a lower value of NuRP means a higher nutrient resorption proficiency. Nutrient resorption efficiency was calculated by using the mass loss correction factors (MLCF) of Vergutz et al. (2012) [10]. MLCF had been used widely to avoid underestimating NuRE for mass loss during leaf senescing in previous studies [8,27,28].
Nutrient resorption efficiency = (1 − MLCF × Nus/Nug) × 100%
where Nus is the element concentration of senesced leaves on a mass basis; Nug—element concentration of green leaves on a mass basis; MLCF—mass loss correction factor. According to the study of Vergutz et al. (2012) [10], MLCF of forbs = 0.640, MLCF of graminoids = 0.713, MLCF of conifers = 0.745, and MLCF of deciduous woody angiosperms = 0.784.

2.4. Species Phylogeny

The species names were checked using ‘The Plant List’ (http://www.theplantlist.org/ (accessed on 3 August 2022)). A total of 53 species were included in the subsequent phylogenetic analyses. Angiosperm order and family assignments were based on the Angiosperm Phylogeny Group IV classification (APG, 2016) [29]. A phylogenetic tree was constructed using the comprehensive species-level angiosperm phylogeny [30] in phylomatic version 3 (http://phylodiversity.net/phylomatic/ (accessed on 3 August 2022)). The tree of life was optimized by ITOL (https://itol.embl.de/itol.cgi (accessed on 3 August 2022)) (Figure S1).

2.5. Climatic Data

We chose mean annual temperature (MAT), mean annual precipitation (MAP), and values of aridity index (AI) as climatic variables in the subsequent analyses. Values of MAT and MAP of each sampling site were collected from the WorldClim global database with a spatial resolution of about 1 km2 (http://www.worldclim.org (accessed on 3 August 2022)). Values of aridity index (AI) are downloaded from Global Aridity Index and Potential Evapotranspiration (ET0) Climate Database v2 (https://cgiarcsi.community/2019/01/24/global-aridity-index-and-potential-evapotranspiration-climate-database-v2/ (accessed on 3 August 2022)). Lower values of AI indicate a dry climate.

2.6. Data Analysis

Differences in leaf nutrient resorption traits between herbaceous and woody plants were assessed using the nonparametric multiple test procedure for all-pair two sample tests (npar.t.test function in the R package of nparcomp [31], which is widely used to compare two-independent samples whose distribution is uncertain). The altitudinal patterns of nutrient resorption traits were performed using general linear regressions or quadratic regressions. The higher R2 and lower Akaike information criterion (AIC) was used to select the most appropriate model.
To assess the phylogenetic conservatism of each trait, we calculated the phylogenetic signal of all traits by performing Blomberg’s K statistic [32] in the R package ‘phytools’. Larger values in K indicate a greater phylogenetic conservatism for the given trait. Significance was tested via comparison of the variance of standardized contrasts to random values obtained by shuffling trait data across the tips of the tree 999 times. Some species occurred at more than one site among different altitudes, we used the average values of these species uniformly.
To determine the effects of phylogenetic and environmental variables on leaf nutrient resorption traits of all species and different PGFs, the variance components were first partitioned into taxonomic, environmental (site), and residual components by using residual maximum likelihood (REML) procedures. The phylogenetic effect was defined as a hierarchically nested structure ‘(clade/order/family)’. The overall random term within the variance components model was (site + (clade/family/species)), and no fixed factors were defined. Thus, the variation in NRP, PRP, NRE, PRE, NRP:PRP, and NRE:PRE caused by environmental variables was assigned to the ‘site’ component of the model, while the variation resulted from sampling error was assigned to the ‘residual’ term [33].
Due to the collinearity between environmental factors, we used Lasso regression to the selected environmental factors (lars function in the R package of lars) (Table S3). The relationships between selected environmental factors and nutrient resorption traits were performed using general linear regressions or quadratic regressions. Subsequently, we quantified the influences of the most influential environmental variables (the relatively insignificant factor was eliminated (Table S4)) and PGF on resorption traits, using a linear mixed effect model with the REML method in the R package ‘lme4′. In these models, environmental factors, PGF, and their interaction were treated as fixed effects, and site as a random effect. Due to the unbalanced data, the variance explained by the model was calculated using type III sums of squares and conservatively partitioned among fixed factors by calculating the variance explained by adding the focal factor after other factors had been included in the model. The sums of squares explained by random effect and their significance were estimated using the ‘r.squaredGLMM’ function and ‘exactRLRT’ function in R package ‘MuMIn’ and ‘RLRsim’, respectively [34].
The data were analyzed by R 4.2.0 (R Core Development Team, http://www.r-project.org/ (accessed on 16 July 2022)), and plots were made by SigmaPlot 12.5 (Systat Software Inc., San Jose, CA, USA).

3. Results

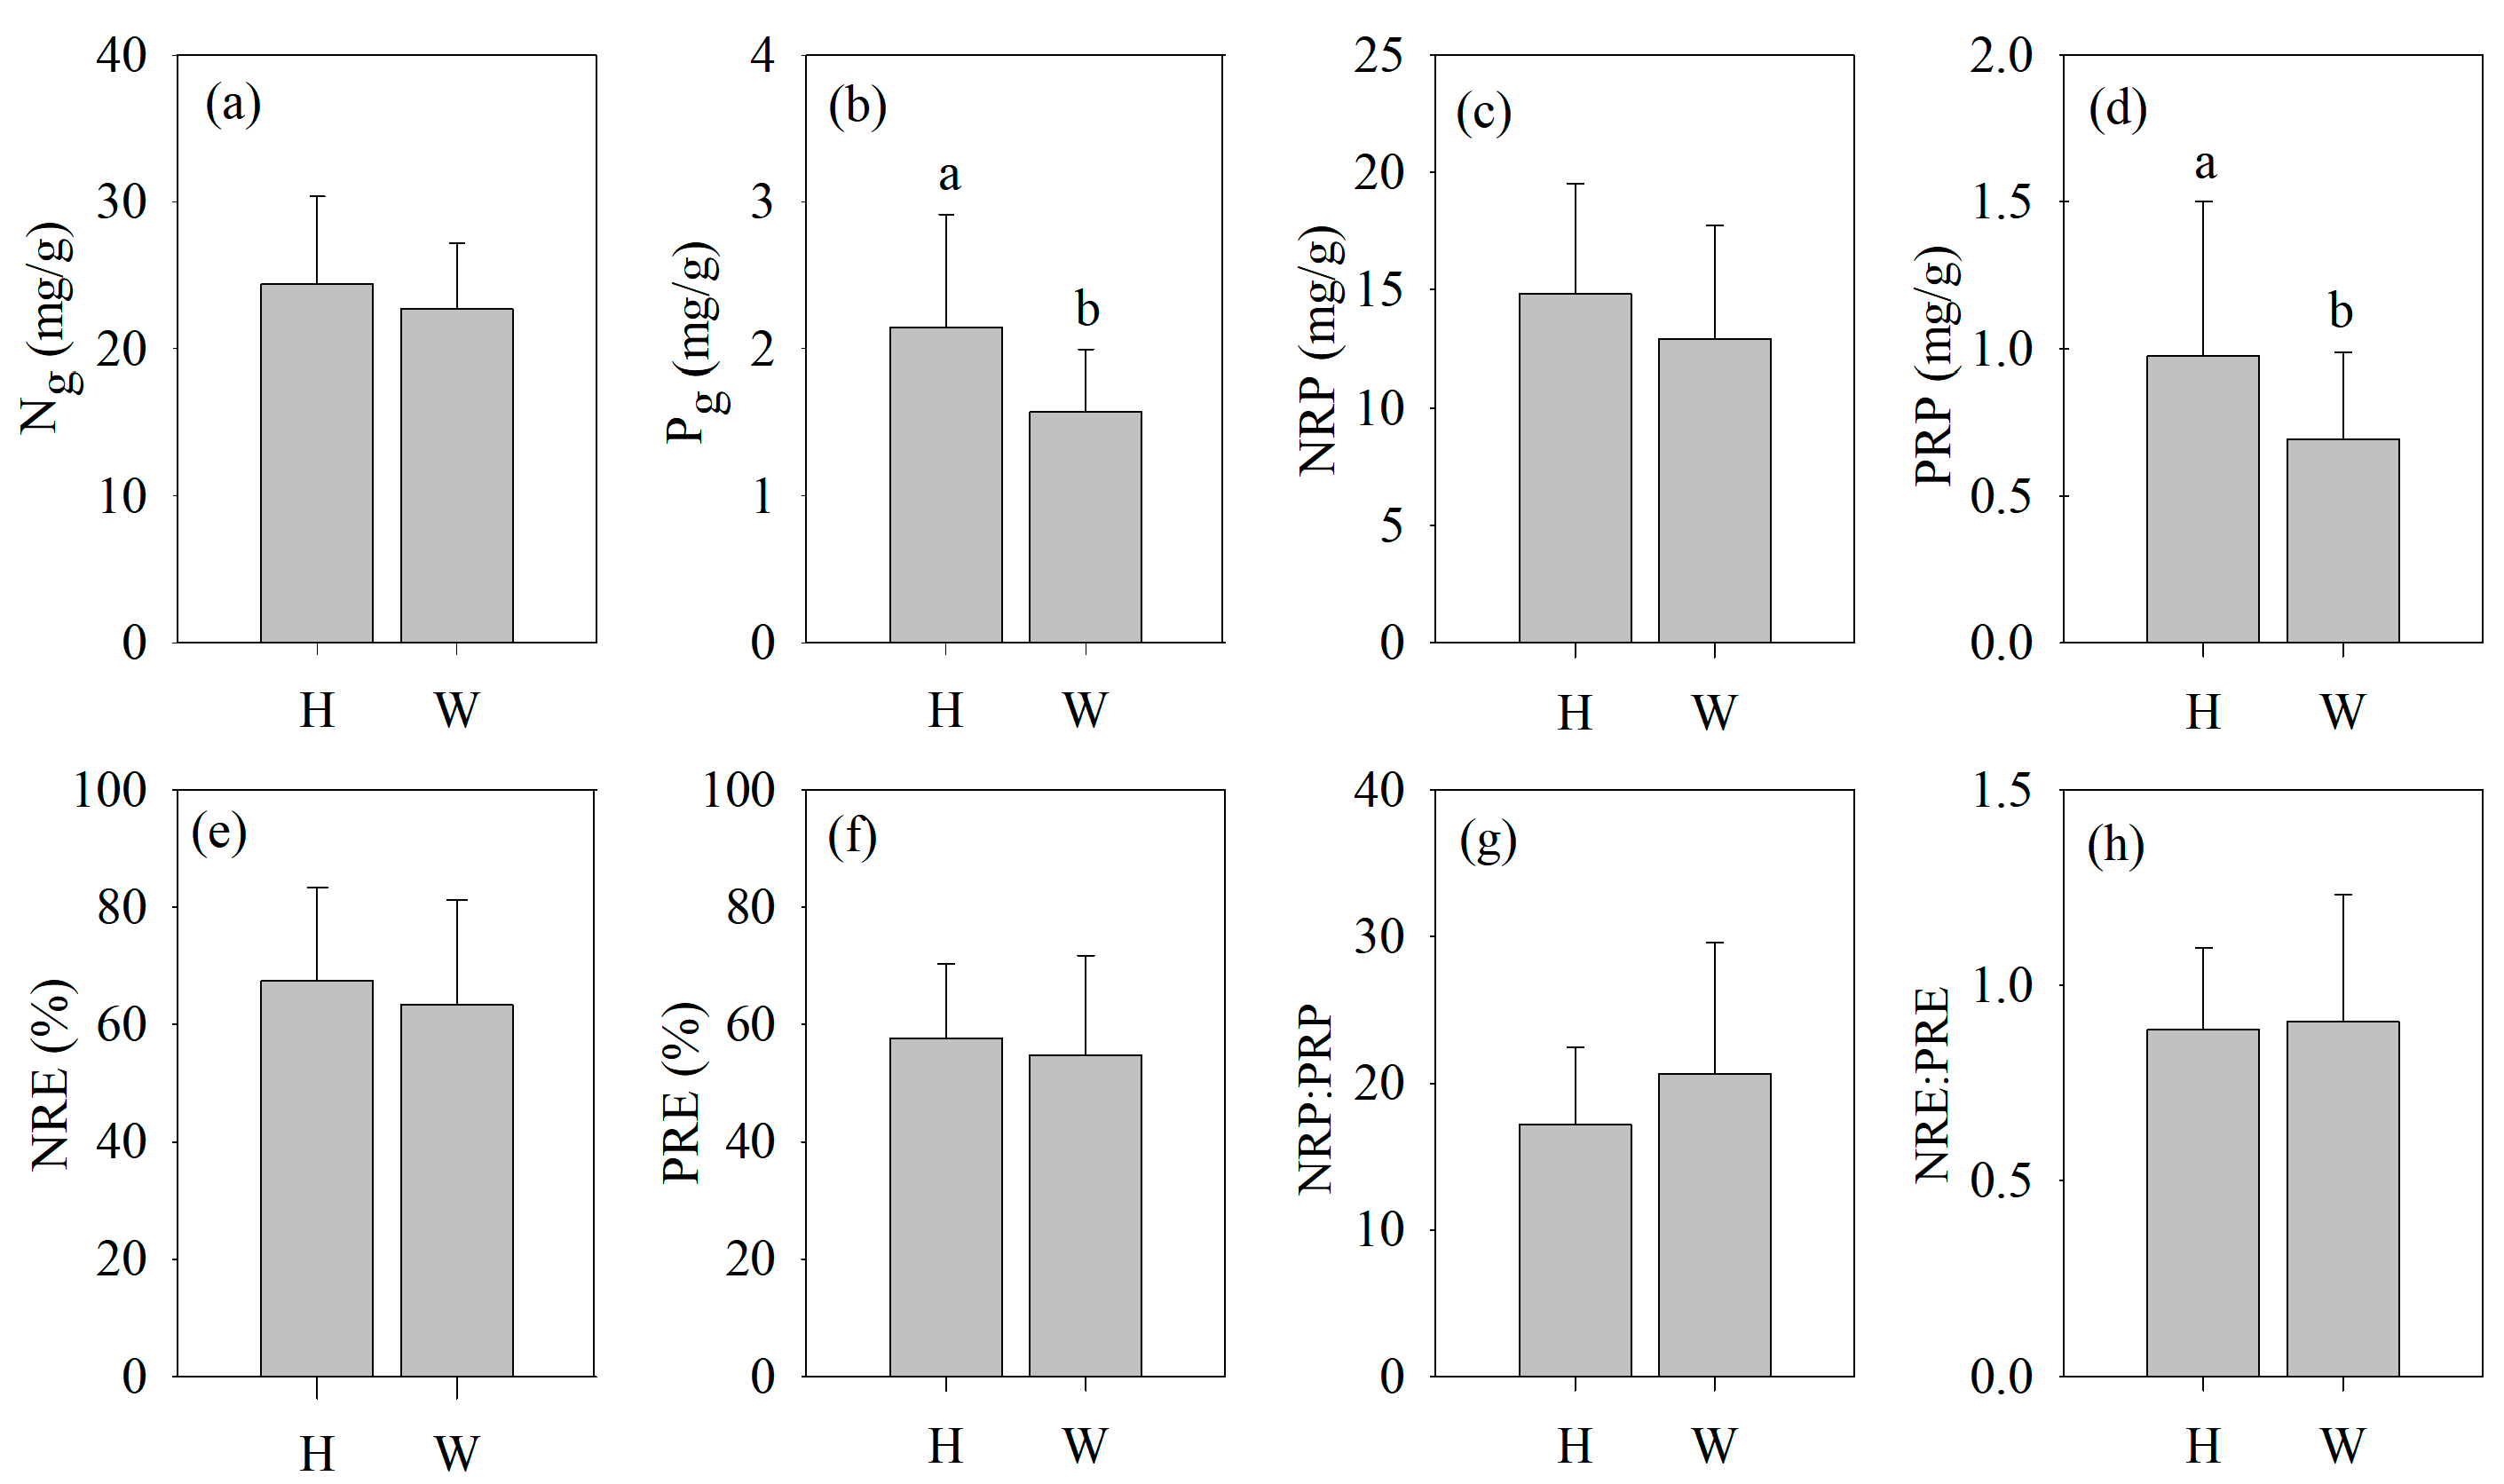
3.1. Variation in Leaf N and P Nutrient Traits and Resorption Traits

In total data, the mean values of leaf NRP and PRP were 13.57 and 0.79 mg/g (CV = 0.36 and 0.52), respectively, and the average values of leaf NRE and PRE were 55.89% and 64.92% (CV = 0.28 and 0.26), respectively (Table S5). For the ratio values of leaf N and P resorption traits, NRP:NRP and NRE:PRE of total species were 19.37 and 0.90 (CV = 0.41 and 0.31), respectively (Table S5). Moreover, significant differences in P content in green leaves (Pg) and PRP were found between different PGFs, with higher values in herbaceous species (p < 0.05, Figure 1b,d).

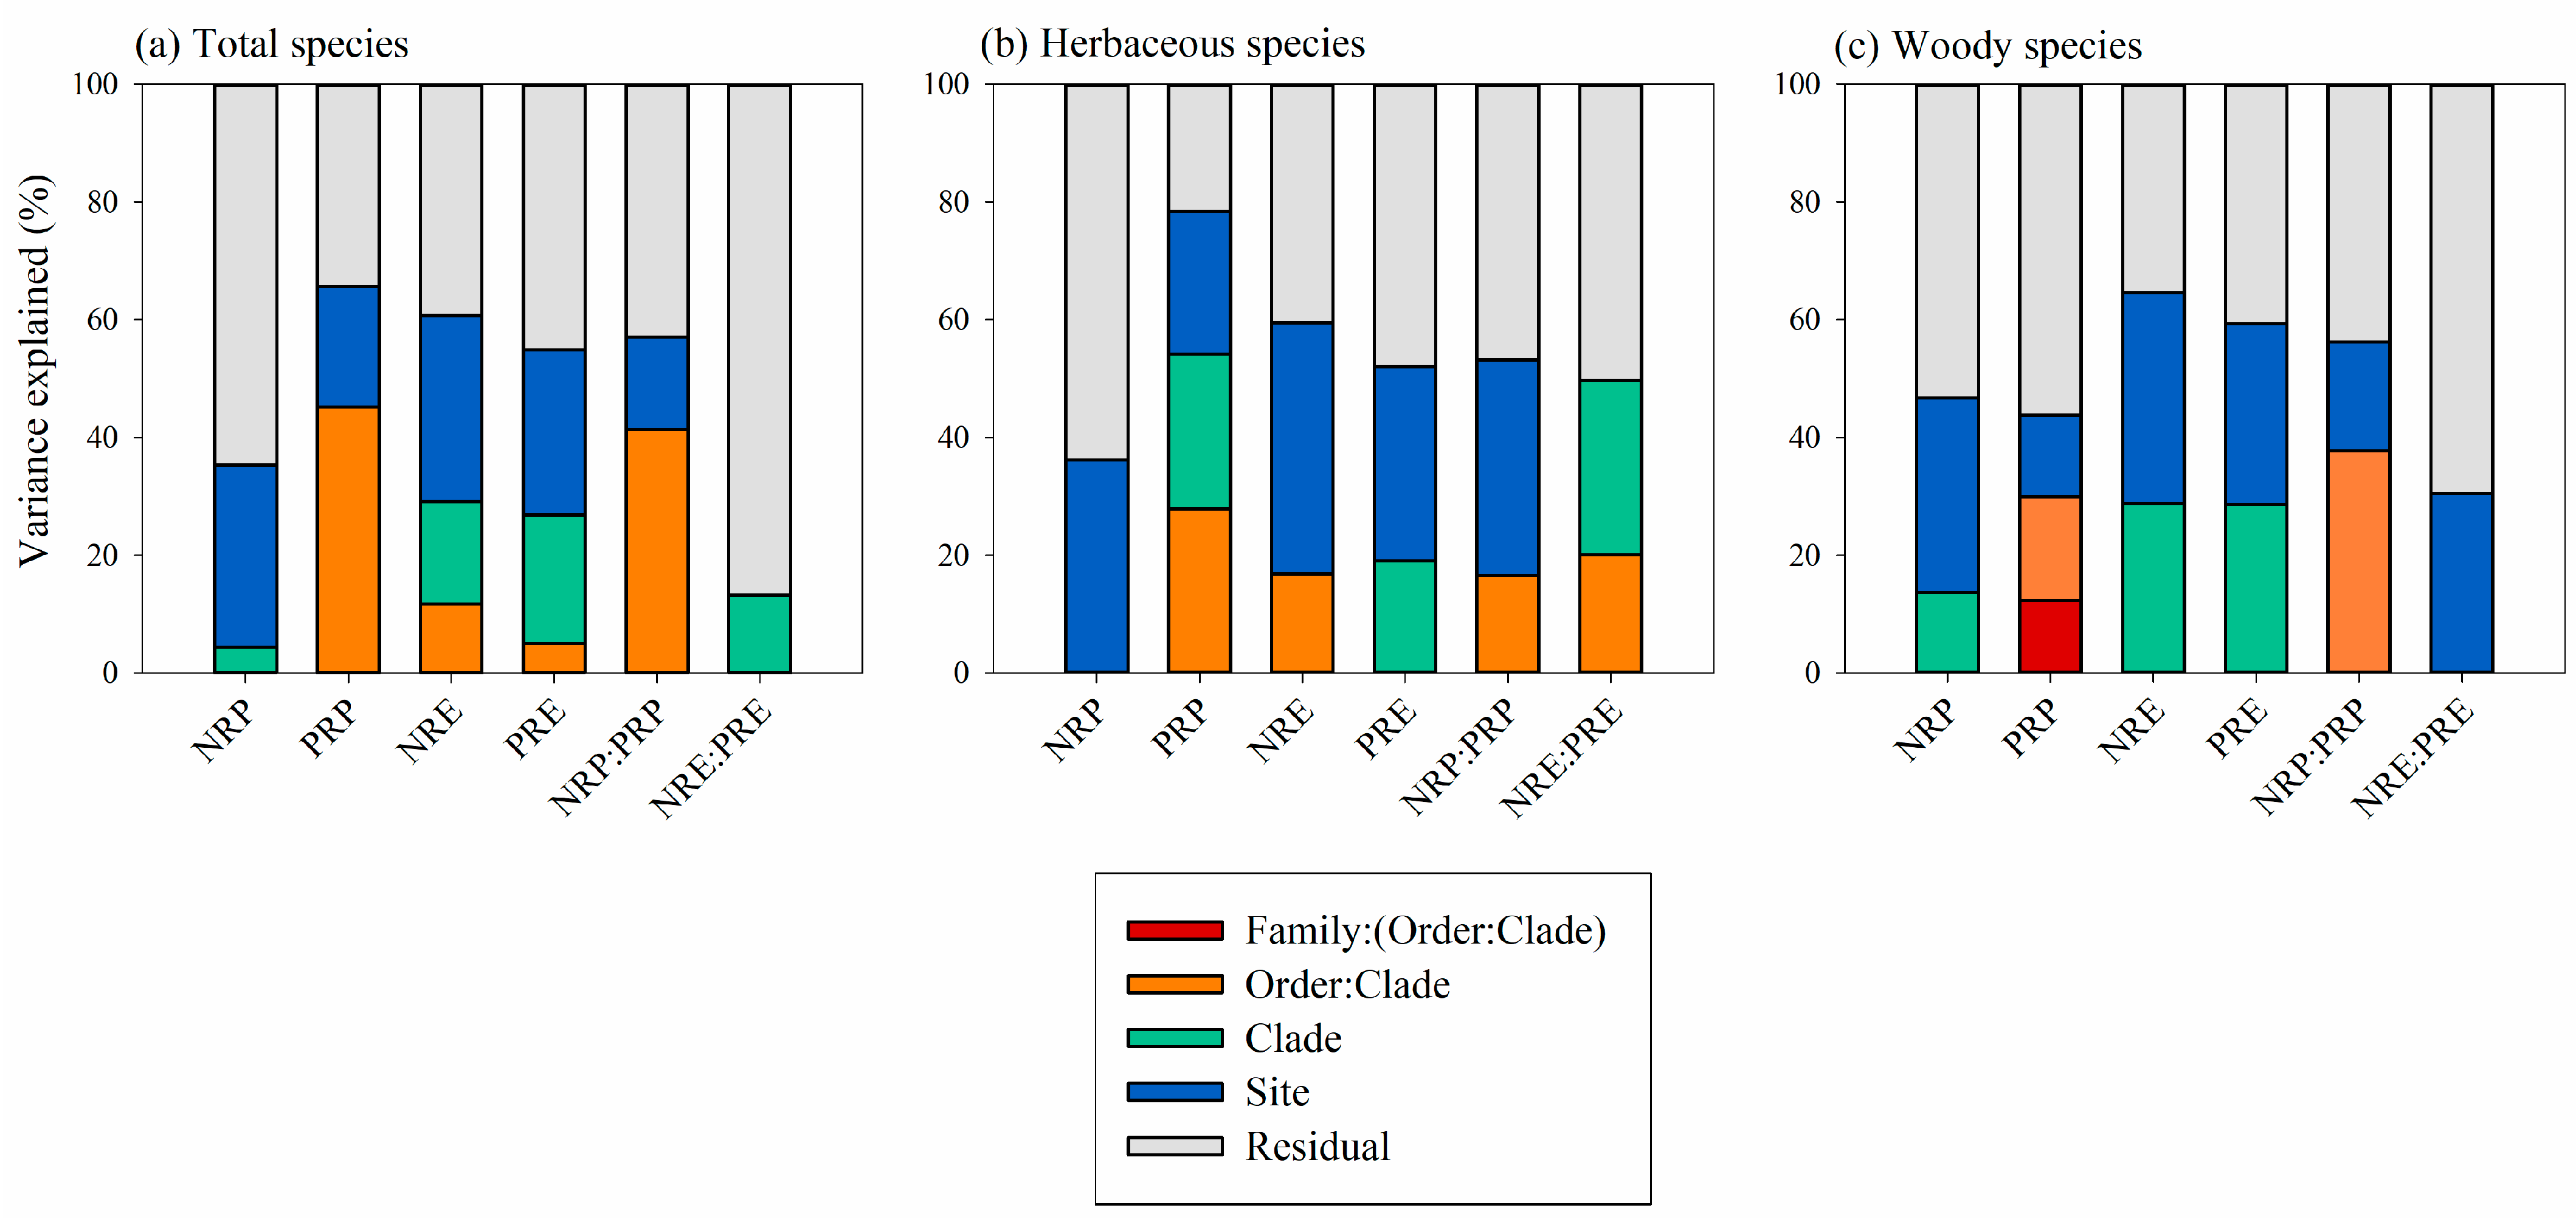
3.2. Phylogenetic Effects on the Variation in Leaf Resorption Traits

Among six leaf nutrient resorption traits, only leaf NRP:PRP had a significant phylogenetic signal (Blomberg’s K = 0.49, p = 0.04, Table 1). Moreover, neither leaf resorption traits had a significant correlation with the evolution times (Figure S3, p > 0.05). When woody and herbaceous species were analyzed separately, the phylogenetic signals of six resorption traits were all insignificant (Blomberg’s K = 0.28–0.70, all p > 0.05, Table 1).
In phylogenetically nested random models, taxonomic effects were mostly at the clade and order levels. Across all species, the results of the nested random model revealed that the variation explained by taxonomy accounted for 45.2% and 41.4% (mostly at the order level) of the variation in leaf PRP and NRP:PRP, respectively (Figure 2a). Moreover, taxonomic effects, respectively, explained 29.1% and 26.9% of the total variation in leaf NRE and PRE (at the clade and order levels), which were slightly smaller than the effects of the site (31.6% and 28.1%, respectively). By contrast, phylogenetic taxonomy exerted relatively minor effects on variation in leaf NRP and NRE:PRE, with only 4.4% and 12.2% of the total variation explained by clade. With regard to the difference in the nested random models of two PGFs, phylogenetic taxonomy exerted major effects on variation in the NRE:PRE of herbaceous (49.7%, Figure 2b) and NRP:PRP of woody species (37.8%, Figure 2c).

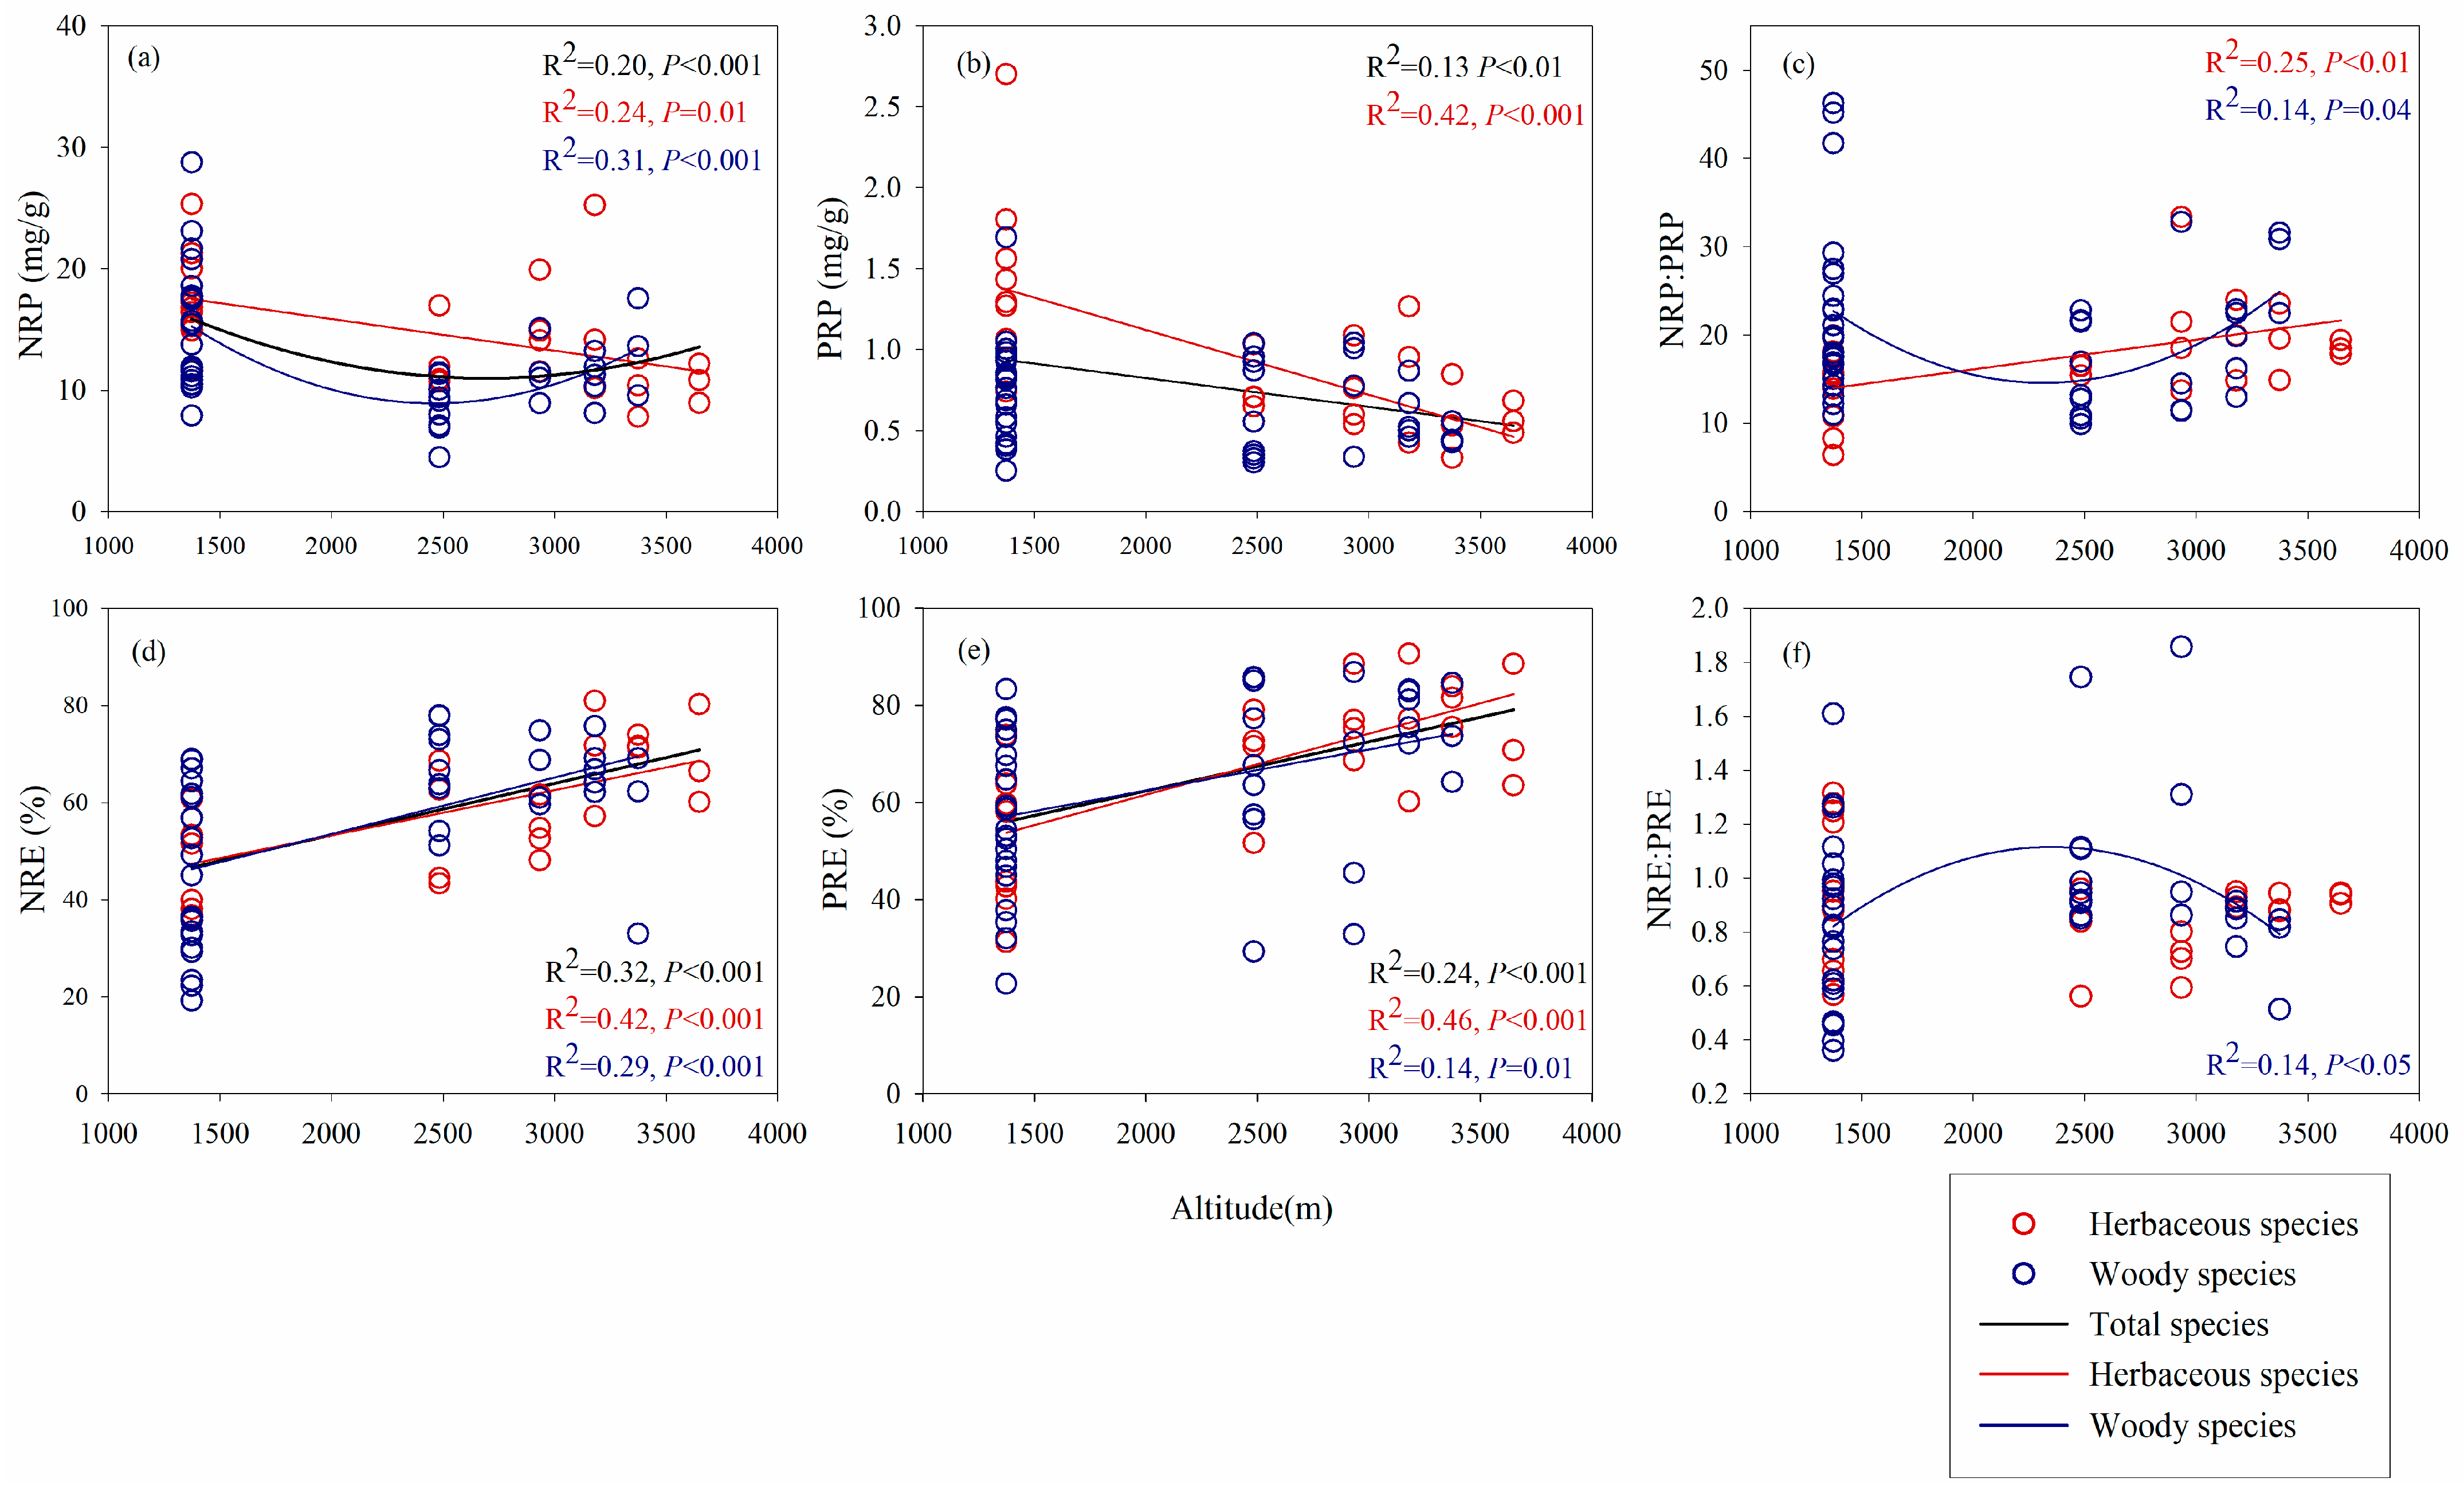
3.3. Altitudinal Patterns of Leaf N and P Resorption Traits

Different altitudinal patterns were found in leaf N and P resorption traits (all p < 0.05, Figure 3). Across all species, NRP showed a significant concave quadratic relationship with altitude (R2 = 0.20, p < 0.001, Figure 3a), with the lowest value at 2483 m. However, PRP decreased with altitude significantly (R2 = 0.13, p < 0.01, Figure 3b). Both NRE and PRE showed significant positive trends with altitude in total species and two PGFs (R2 = 0.14–0.46, all p < 0.05, Figure 3d,e).
The altitudinal patterns of NuRP, NRP:PRP, and NRE:PRE differed between different PGFs (Figure 3). In woody species, NRP and NRP:PRP showed concave quadratic relationships with altitude, first decreasing first and then increasing at a higher altitude (R2 = 0.31 and 0.14, both p < 0.05, Figure 3a,c). However, in the herbaceous species, both leaf NRP and PRP significantly decreased with altitude (R2 = 0.24 and 0.42, both p < 0.05, Figure 3a,b), but NRP:PRP increased with altitude significantly (R2 = 0.25, p < 0.01, Figure 3c). As for NRE:PRE, only woody species showed a significant convex quadratic relationship with altitude (R2 = 0.14, p < 0.05, Figure 3f), which first increased and then decreased with altitude.

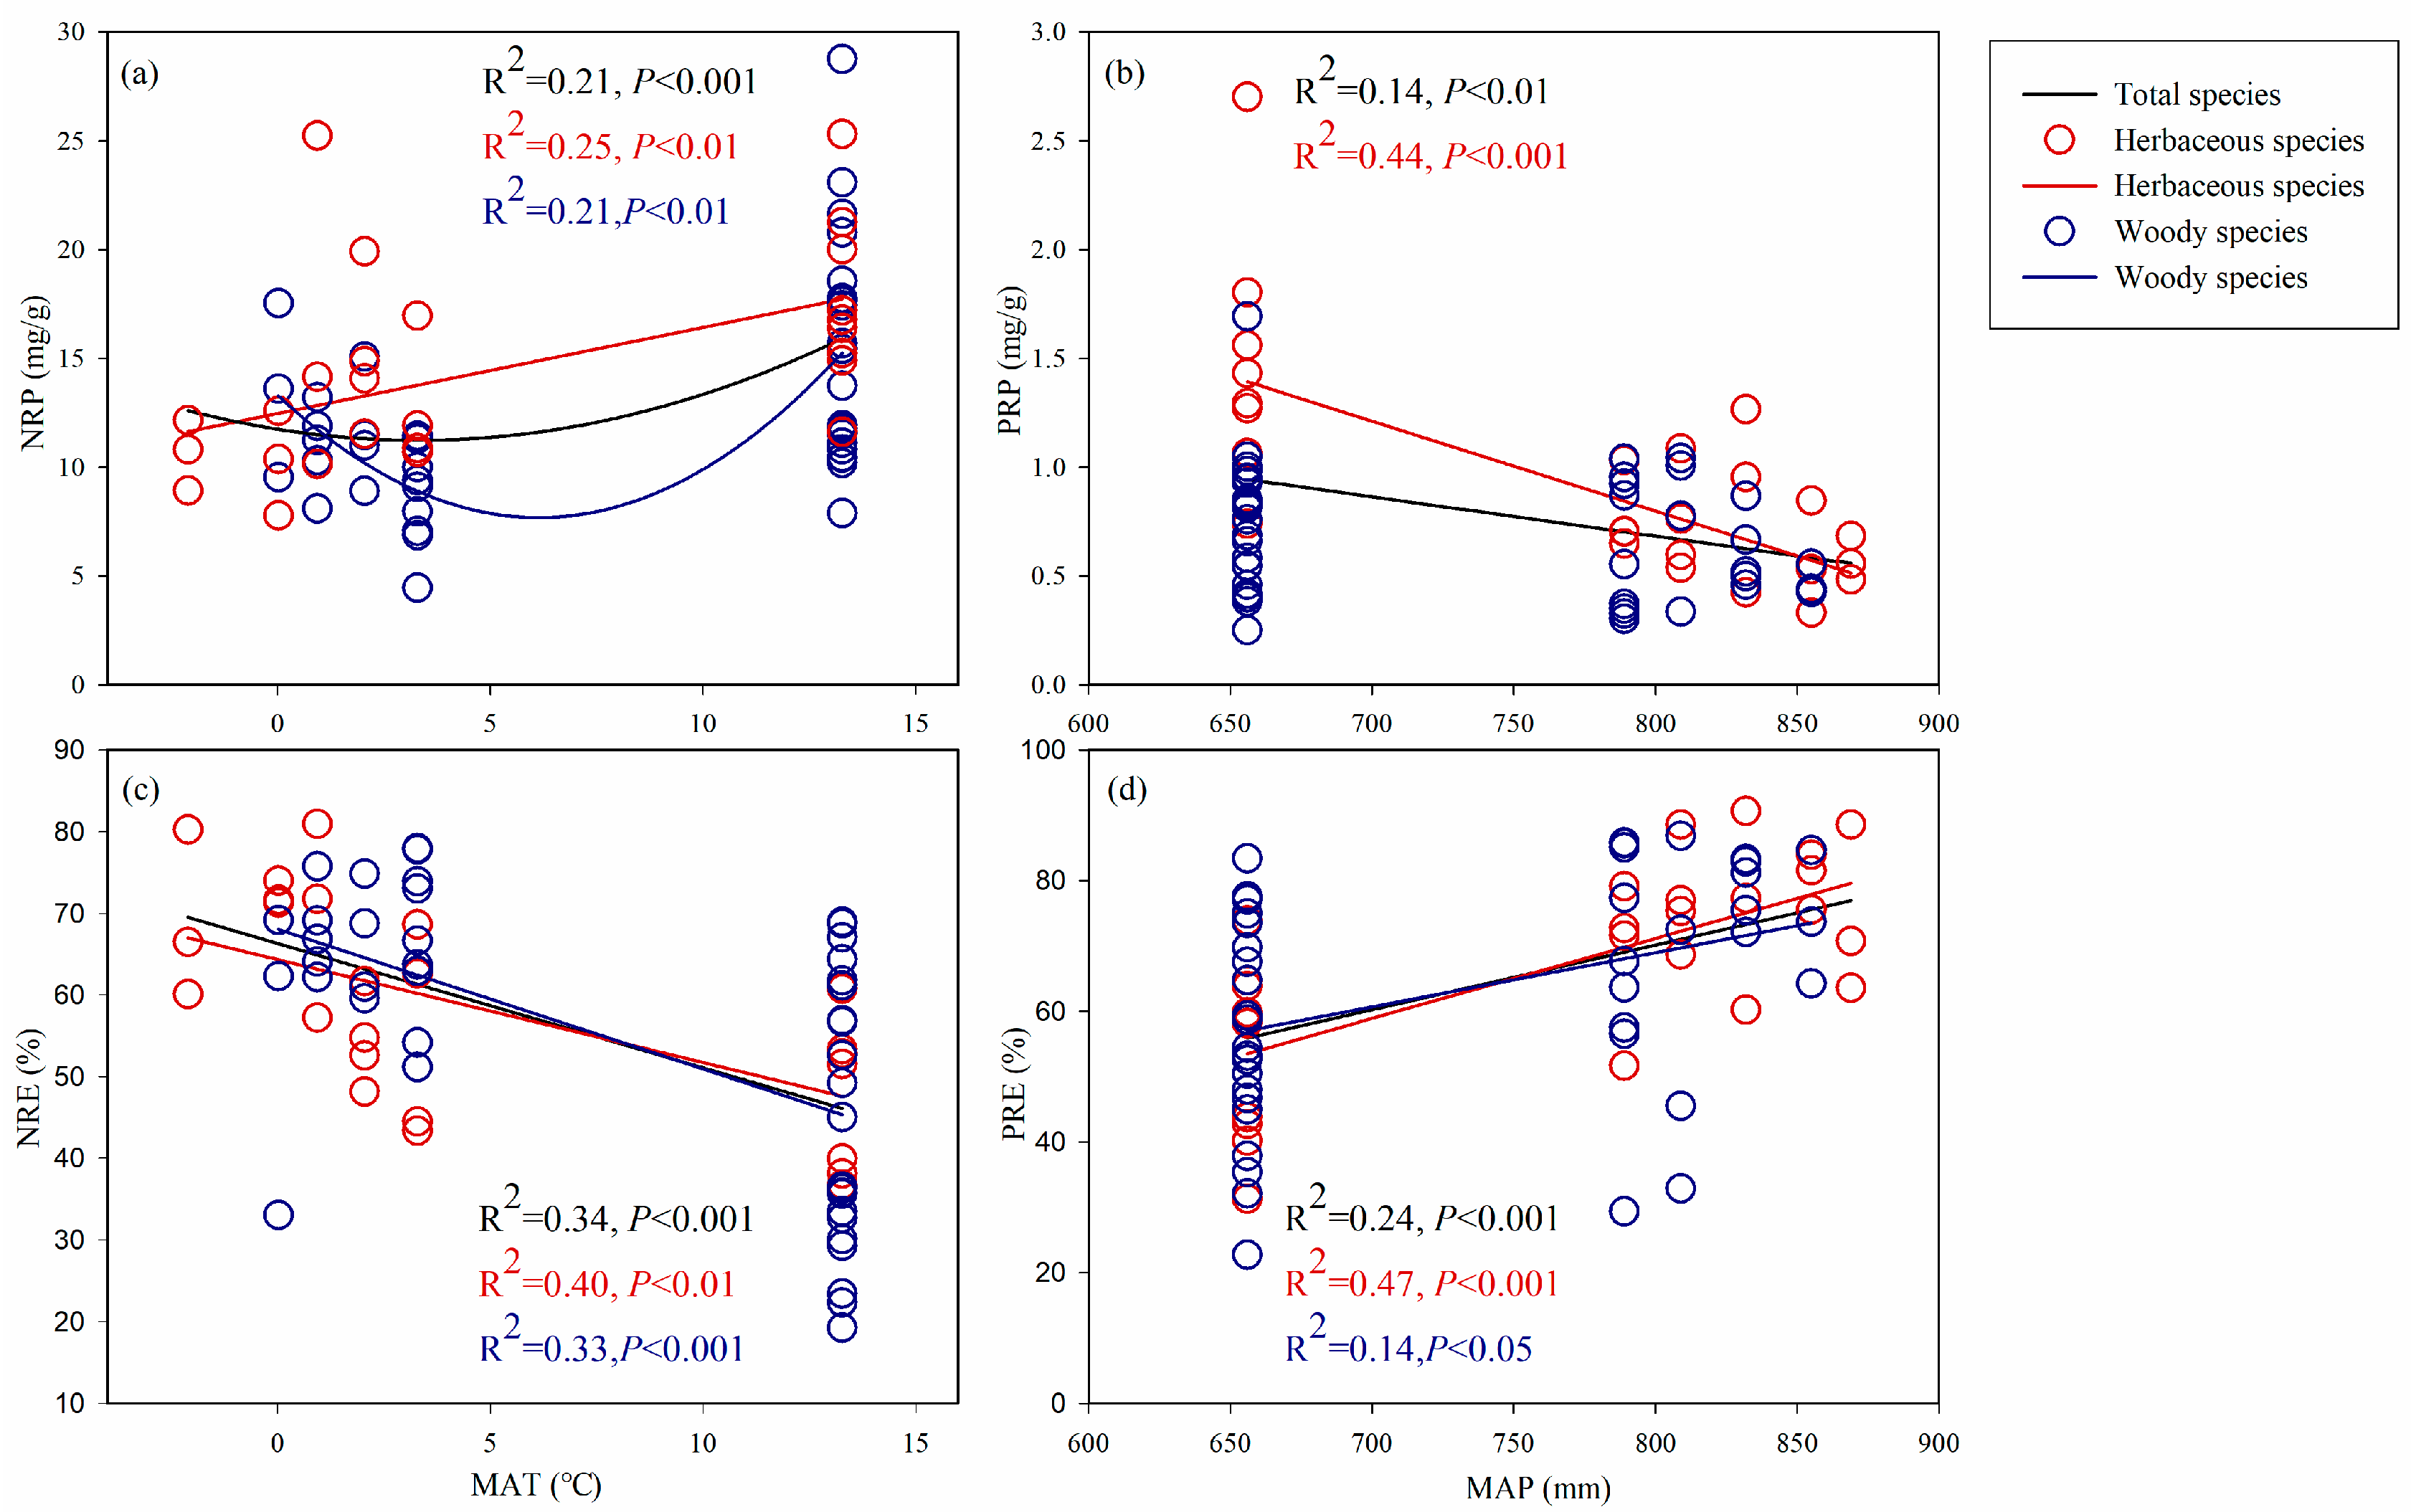
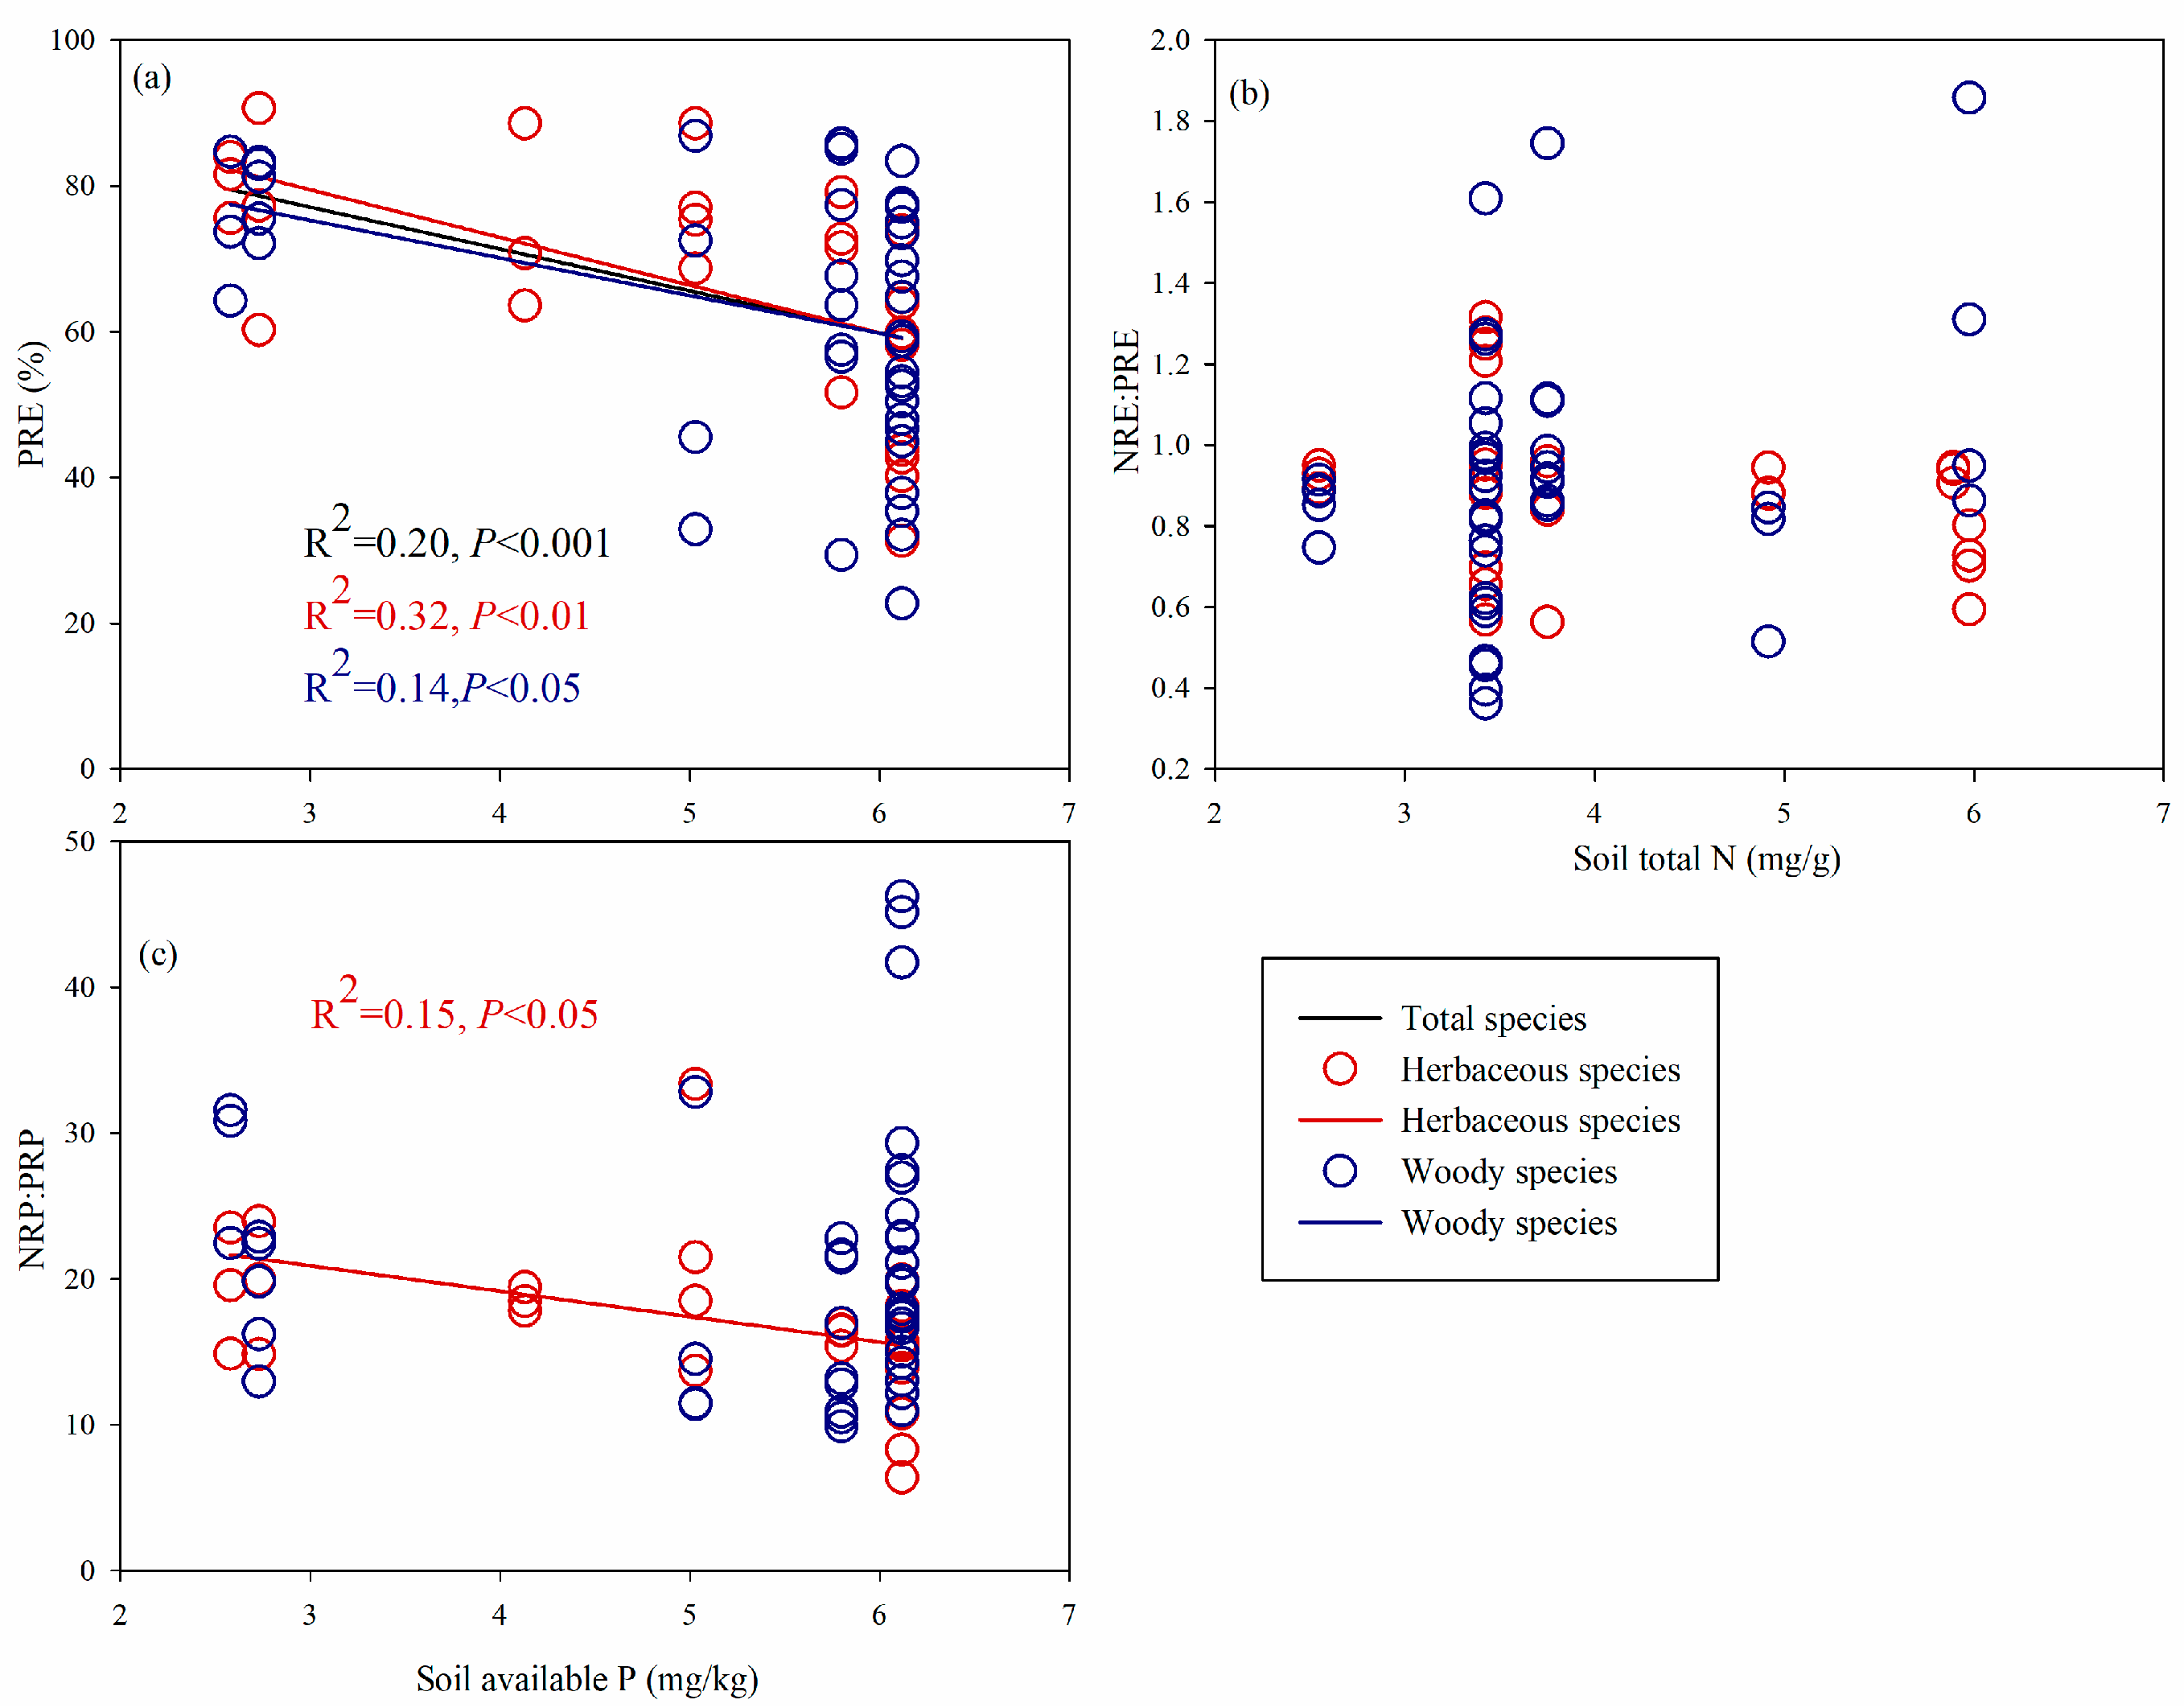
3.4. Environmental Effects on the Variation in Leaf Resorption Traits

Results of mixed-effect models indicate that both fixed and random factors (i.e., R2c) could explain 7–37% of the variation in six leaf resorption traits (Table 2). MAP, PGF, and their interaction significantly affected the variation in leaf PRP (p < 0.01), with 10.25%, 10.23%, and 29.13% of the total variance explained (Table 2). Additionally, the variation in leaf NRE and PRE were significantly influenced by MAT and MAP, respectively (24.75% and 18.54% of the total variance explained, both p < 0.01, Table 2). As for NRE:PRE, the interaction between STN and PGF had a significant but minor influence (7.15% of the total variance explained, p < 0.01, Table 2).
Except for leaf NRE:PRE, significant relationships were found between selected environmental factors and leaf resorption traits (Figure 4 and Figure 5). With respect to climatic factors, leaf NRP first decreased and then increased with MAT in total species and woody species, and leaf PRP decreased with MAP in total species and herbaceous species (all p < 0.05, Figure 4a,b). In light of the soil factors, leaf PRE significantly decreased with the increasing SAP in total species and different PGFs (Figure 5a, R2 = 0.14–0.32, all p < 0.05), and NRP:PRP in herbaceous species also significantly decreased with the increasing SAP (R2 = 0.15, p < 0.05, Figure 5c).

4. Discussion

4.1. Phylogenetic Influence on Leaf Resorption Traits

In this study, the results show that only leaf NRP:PRP had significant phylogenetic signals across total species (Table 1). Moreover, phylogenetic taxonomy was the dominant factor influencing the variation in leaf PRP and NRP:PRP rather than NRE and PRE (Figure 3), which partly supported our first hypothesis. However, leaf NRP was almost unaffected by phylogenetic influence, which was inconsistent with our first hypothesis.
The results also indicate that leaf NRE and PRE mainly reflected the environmental adaptability in different species. As a trait of efficiency for nutrient conservation, leaf NuRE exhibited more environmental plasticity to relieve environmental nutrient limitations, which may contribute to the insignificant influence of phylogeny on NuRE [18,32]. However, the results of leaf PRP and NRP:PRP indicate the considerable influence of phylogeny and phylogenetic taxonomy. Killingbeck (1996) [6] found that it had some similarities in leaf NuRP of species with close phylogenetic relationships, which was partly similar to the result of PRP in our study. Significant phylogenetic influence on PRP may be associated with the biochemical limit of resorption [6] and nutrient transport capacity [17] of different orders. For example, we found that the PRP were low in Sapindales (Figure S2) partly because the senesced leaves were red in species of Sapindales (e.g., Acer davidii and Cotinus coggygria). Wang et al. (2022) [35] found similar results that red senesced leaves had the lowest P contents among plant groups with different autumnal color leaves. In the process of leaf senescing, anthocyanins perform better at photoinhibition than carotenoids according to the photoprotection hypothesis [36], and the removal of chlorophyll can improve the degradation of chlorophyll-associated proteins [37]. This mechanism may promote the transport of P nutrients in the process of resorption, and the transitional period of the leaf color may make leaf nutrient resorption more complete. Unexpectedly, leaf NRP was mainly influenced by environmental gradient rather than phylogenetic taxa, which suggested that the variation in NRP was mainly influenced by environmental factors, and phylogenetic effects could be different among leaf NuRP of different elements.
Phylogenetic taxonomy had different effects on leaf nutrient traits between woody and herbaceous species, which exerted major influences on NRP:PRP of woody species and NRE:PRE of herbaceous species, respectively. Through comparing leaf NRP:PRP of different orders in woody species, we found that leaf NRP:PRP became stable in relatively modern orders. For instance, NRP:PRP values were about 22 in four modern orders (including Fagales, Dipsacales, Sapindales, and Malpighiales), whereas NRP:PRP of relatively older orders had a large variation (Figure S3). These results demonstrate that resorption biochemical limit became more balanced between N and P with evolutionary time in woody species, which probably related to leaf nutrient constitution and transport capacity [17], and woody species had more developed nutrient transport system than herbs [10]. Moreover, NRE:PRE of herbs was mainly influenced by phylogenetic taxa of the clade and order levels rather than environmental factors, which indicates that different clades and orders may have different N or P preferences. For example, Commelinids and Lamiids had relatively lower and higher NRE:PRE, respectively (Figure S4), which indicated that Commelinids preferred to resorb leaf P than N, and Lamiids had the opposite preference. Lamiids species, e.g., Isodon amethystoides and Rubia cordifolia, grow at the warmer sites with lower altitude (1374m), and Commelinids species, e.g., Carex taipaishanica and Carex capilliformis, had wider altitudinal growth range (collection scope 1374–3375 m). At a higher altitude, plants had shorter growth time, which made the growth rate more important for environmental adaptation. Thus, herbs turned the N preference to the P preference due to the tight association between the P element and growth rate [22,38].

4.2. Environmental Influence on the Variation in Leaf Resorption Traits

Our results show that both leaf NRE and PRE increased with increasing altitude across total species and two PGFs, which was similar to Gerdol et al. (2019) [28]. Moreover, MAT was the major effect on the variation in leaf NRE, whereas MAP acted as the main environmental factors of PRE (Table 2). With the increase in altitude, MAT decrease dramatically and growth period of plants becomes shorter, thus plants must accomplish the development of new leaves and the corresponding nutrient uptake and transport in a shorter time [2,39]. Additionally, plants at a higher altitude are confronted with more stress of frost and cold (Table S6) impacting on root uptake. Therefore, the utilization of stored nutrient is a more economic approach than root uptake, especially at the beginning of the following spring [39]. These caused the increasing trend of leaf NRE with the increased altitude and decreasing MAT. In contrast, leaf PRE was mainly affected by MAP. The increasing rainfall could improve NuRE [21,40]. In addition, rainfall could increase the leaching of soil P [41], especially in a mountain environment [42], and then lead to P limitation in soils. It should be noted that a significant collinearity was existed between MAT and MAP (Figure S5), because higher altitude areas have lower MAT and higher MAP than lower altitude (Tables S6 and S7, Figure S5). Thus, MAT and MAP jointly resulted in higher leaf NRE and PRE of plants lived at higher altitudes.
In contast to leaf NuRE, the altitudinal patterns of NuRP had differences between woody and herbaceous species. In herbaceous species, leaf NRP and PRP decreased but NRP:PRP increased with altitude, which partly proved our second hypothesis. Generally, herbaceous species had faster growth rate than woody species, which demonstrated that the P element was the key nutrient of herbs due to the close association between P demand and growth rate [22,38,43]. Leaf NRP:PRP of herbs increased with increasing altitude, which indicated that PRP decreased more dramatically and rapidly with altitude than NRP. Thus, the altitudinal pattern of NRP:PRP suggested that herbs needed more P element at a higher altitude. Accordingly, P element is crucial to the environmental adaptation of herbaceous species, and herbs tend to have the nutrient strategy of P preference to resist negative environmental conditions.
For woody species, the altitudinal trend of leaf PRP was insignificant in woody species and mainly influenced by phylogenetic taxa (Figure 3), which indicated that PRP of woody species was more conservative and less sensitive to environmental change than PRP of herbs. Moreover, leaf NRP of woody plants showed a U-shaped curve with the increased altitude. In a low altitude range (1374–2483 m), NRP decreased with the increased altitude, which was consistent with the altitudinal strategy of leaf NRE that plants increased N conservation with increasing altitude in order to adapt lower MAT as discussed above. However, at higher altitude, it is unexpected that NRP of woody plants increased with the increasing altitude. The possible explanation was that higher NRP probably related to the amounts of N immobilized in the greater amount of cell wall in order to resist lower winter temperatures [44,45]. Therefore, the cold at high altitude forced plants to improve the structure of cell wall, which made higher woody leaf NRP. Both the high leaf NRE and NRP in high altitude indicate that woody plants adopted strategies of high N investment and conservation to the harsh habitats.
In previous studies, soil nutrient was an important factor influencing NuRE. However, we only found that SAP had significant negative effects on PRE and herbaceous leaf NRP:PRP, which was similar to the findings of Lü et al. (2013) [46] that showed that plants tended to improve P resorption when SAP decreased. Furthermore, the response of PRP:NRP to SAP stressed the importance and sensibility of P nutrient in herbaceous species. These results may result from the P limitation in this study, because the leaf NRE:PRE was <1 in most sites (Table S5), which made the parameter of soil P a significant factor rather than soil N.

5. Conclusions

In this study, we quantified the influences of environmental and phylogenetic factors on leaf N and P resorption traits of 57 woody and herbaceous species across an altitudinal gradient.
Our results show that phylogeny had a considerable and dominant influence on the variation in leaf PRP and NRP:PRP. With regard to altitudinal patterns of resorption, leaf NuRE increased with altitude across all the species, which were mainly influenced by MAT and MAP. However, the altitudinal patterns of leaf NuRP were affected by different PGFs, which indicated that the nutrient strategies for environmental adaptation were different in herbaceous and woody plants. Herbaceous plants tended to have the nutrient strategy of P preference with environmental change, while woody plants adopted two nutrient strategies of N conservation and N investment at different ranges of altitude.
These results highlight the influences of growth types and phylogenetic factors on the variation in plant nutrient cycling, which is helpful to predict how nutrient status varies among different plant species under future climate changes.

Supplementary Materials

The following supporting information can be downloaded at: https://www.mdpi.com/article/10.3390/f14010005/s1, Figure S1: Variation in leaf N, P resorption traits with plant phylogeny; Figure S2: Variation in leaf PRP and NRP:PRP of all species in different orders, ranking by evolution time; Figure S3: Variation in leaf NRP:PRP of woody species in different orders, ranking by evolution time; Figure S4: Variation in leaf PRP and NRE:PRE of herbaceous species in different clades and orders, ranking by evolution time; Figure S5: Relationships between altitude and two climatic factors in sampling sites; Table S1: Information of geography, rock and soil in six sampling sites; Table S2: Species lists of six sampling sites; Table S3: Results of LASSO regressions of environmental factors and leaf N and P resorption traits; Table S4: Results of preliminary linear mixed-effects model of leaf PRE and selected environmental factors; Table S5: Leaf N and P nutrient traits and resorption traits in two plant growth forms in six sampling sites; Table S6: Average temperature (°C) of month in sampling sites; Table S7: Average precipitation (mm) of month in sampling sites. Ref. [47] are cited in the Supplementary Materials.

Author Contributions

Conceptualization, H.C., S.C., and X.W. (Xiaochun Wang); Methodology, H.C., S.C., and X.W. (Xiaochun Wang); Software, R.Z. and W.M.; Formal Analysis, H.C., S.C., and W.M.; Investigation, H.C., X.L., and X.W. (Xue Wang); Resources, R.W. and S.Z.; Data Curation, H.C.; Writing—Original Draft Preparation, H.C.; Writing—Review & Editing, H.C., R.W. and S.Z.; Visualization, X.W. (Xiaochun Wang); Supervision, R.W. and S.Z.; Project Administration, R.W. and S.Z.; Funding Acquisition, R.W. and S.Z. All authors have read and agreed to the published version of the manuscript.

Funding

This work was supported by the National Natural Science Foundation of China (32271611), Youth Talent Support Project of Science and Technology Association in Shaanxi Province (20200203) and Operation Services of Qinling National Forest Ecosystem Research Station financed by Ministry of Science and Technology of China and Ministry of Education of China.

Institutional Review Board Statement

Our collection of plant material complied with the Convention on Biological Diversity and the Convention on the Trade in Endangered Species of Wild Fauna and Flora.

Informed Consent Statement

Not applicable.

Data Availability Statement

The data presented in this study are available on request from the corresponding author.

Conflicts of Interest

The authors declare no conflict of interest.

Abbreviations

NuRPnutrient resorption proficiency
NuREnutrient resorption efficiency
NRPnitrogen resorption proficiency
PRPphosphorus resorption proficiency
NREnitrogen resorption efficiency
PREphosphorus resorption efficiency

References

  1. Brant, A.N.; Chen, H.Y.H. Patterns and mechanisms of nutrient resorption in plants. Crit. Rev. Plant Sci. 2015, 34, 471–486. [Google Scholar] [CrossRef]
  2. Estiarte, M.; Penuelas, J. Alteration of the phenology of leaf senescence and fall in winter deciduous species by climate change: Effects on nutrient proficiency. Glob. Chang. Biol. 2015, 21, 1005–1017. [Google Scholar] [CrossRef] [PubMed] [Green Version]
  3. Yuan, Z.Y.; Chen, H.Y.H. Global-scale patterns of nutrient resorption associated with latitude, temperature and precipitation. Glob. Ecol. Biogeogr. 2009, 18, 11–18. [Google Scholar] [CrossRef]
  4. Yuan, Z.Y.Y.; Chen, H.Y.H. Global trends in senesced-leaf nitrogen and phosphorus. Glob. Ecol. Biogeogr. 2009, 18, 532–542. [Google Scholar] [CrossRef]
  5. Yuan, Z.Y.; Chen, H.Y.H. Negative effects of fertilization on plant nutrient resorption. Ecology 2015, 96, 373–380. [Google Scholar] [CrossRef]
  6. Killingbeck, K.T. Nutrients in senesced leaves: Keys to the search for potential resorption and resorption proficiency. Ecology 1996, 77, 1716–1727. [Google Scholar] [CrossRef]
  7. Aerts, R.; Chapin, F.S. The mineral nutrition of wild plants revisited: A re-evaluation of processes and patterns. Adv. Ecol. Res. 2000, 30, 1–67. [Google Scholar]
  8. Du, E.Z.; Terrer, C.; Pellegrini, A.F.A.; Ahlstrom, A.; van Lissa, C.J.; Zhao, X.; Xia, N.; Wu, X.H.; Jackson, R.B. Global patterns of terrestrial nitrogen and phosphorus limitation. Nat. Geosci. 2020, 13, 221–226. [Google Scholar] [CrossRef]
  9. Tang, L.Y.; Han, W.X.; Chen, Y.H.; Fang, J.Y. Resorption proficiency and efficiency of leaf nutrients in woody plants in eastern China. J. Plant Ecol. 2013, 6, 408–417. [Google Scholar] [CrossRef] [Green Version]
  10. Vergutz, L.; Manzoni, S.; Porporato, A.; Novais, R.F.; Jackson, R.B. Global resorption efficiencies and concentrations of carbon and nutrients in leaves of terrestrial plants. Ecol. Monogr. 2012, 82, 205–220. [Google Scholar] [CrossRef] [Green Version]
  11. Yan, T.; Zhu, J.J.; Yang, K. Leaf nitrogen and phosphorus resorption of woody species in response to climatic conditions and soil nutrients: A meta-analysis. J. For. Res. 2018, 29, 905–913. [Google Scholar] [CrossRef]
  12. Sun, X.; Kang, H.; Chen, H.Y.H.; Bjorn, B.; Samuel, B.F.; Liu, C. Biogeographic patterns of nutrient resorption from Quercus variabilis Blume leaves across China. Plant Biol. 2016, 18, 505–513. [Google Scholar] [CrossRef] [PubMed]
  13. Zhao, G.S.; Shi, P.L.; Wu, J.S.; Xiong, D.P.; Zong, N.; Zhang, X.Z. Foliar nutrient resorption patterns of four functional plants along a precipitation gradient on the Tibetan Changtang Plateau. Ecol. Evol. 2017, 7, 7201–7212. [Google Scholar] [CrossRef] [PubMed]
  14. Xu, M.P.; Zhu, Y.F.; Zhang, S.H.; Feng, Y.Z.; Zhang, W.; Han, X.H. Global scaling the leaf nitrogen and phosphorus resorption of woody species: Revisiting some commonly held views. Sci. Total Environ. 2021, 788, 147807. [Google Scholar] [CrossRef]
  15. Hao, Z.; Kuang, Y.W.; Kang, M. Untangling the influence of phylogeny, soil and climate on leaf element concentrations in a biodiversity hotspot. Funct. Ecol. 2015, 29, 165–176. [Google Scholar] [CrossRef]
  16. Zhao, N.; Yu, G.R.; He, N.P.; Wang, Q.F.; Guo, D.L.; Zhang, X.Y.; Wang, R.L.; Xu, Z.W.; Jiao, C.C.; Li, N.N.; et al. Coordinated pattern of multi-element variability in leaves and roots across Chinese forest biomes. Glob. Ecol. Biogeogr. 2016, 25, 359–367. [Google Scholar] [CrossRef]
  17. Lang, S.I.; Aerts, R.; van Logtestijn, R.S.P.; Schweikert, W.; Klahn, T.; Quested, H.M.; van Hal, J.R.; Cornelissen, J.H.C. Mapping nutrient resorption efficiencies of subarctic cryptogams and seed plants onto the Tree of Life. Ecol. Evol. 2014, 4, 2217–2227. [Google Scholar] [CrossRef]
  18. Zhang, J.H.; Tang, Z.Y.; Luo, Y.K.; Chi, X.L.; Chen, Y.H.; Fang, J.Y.; Shen, H.H. Resorption efficiency of leaf nutrients in woody plants on Mt. Dongling of Beijing, North China. J. Plant Ecol. 2015, 8, 530–538. [Google Scholar] [CrossRef] [Green Version]
  19. Kobe, R.K.; Lepczyk, C.A.; Iyer, M. Resorption efficiency decreases with increasing green leaf nutrients in a global data set. Ecology 2005, 86, 2780–2792. [Google Scholar] [CrossRef] [Green Version]
  20. Han, W.X.; Tang, L.Y.; Chen, Y.H.; Fang, J.Y. Relationship between the relative limitation and resorption efficiency of nitrogen vs phosphorus in woody plants. PLoS ONE 2013, 8, e83366. [Google Scholar] [CrossRef]
  21. Prieto, I.; Querejeta, J.I. Simulated climate change decreases nutrient resorption from senescing leaves. Glob. Chang. Biol. 2020, 26, 1795–1807. [Google Scholar] [CrossRef] [PubMed]
  22. He, M.S.; Yan, Z.B.; Cui, X.Q.; Gong, Y.M.; Li, K.H.; Han, W.X. Scaling the leaf nutrient resorption efficiency: Nitrogen vs phosphorus in global plants. Sci. Total Environ. 2020, 729, 138920. [Google Scholar] [CrossRef] [PubMed]
  23. Freschet, G.T.; Cornelissen, J.H.; van Logtestijn, R.S.; Aerts, R. Substantial nutrient resorption from leaves, stems and roots in a subarctic flora: What is the link with other resource economics traits? New Phytol. 2010, 186, 879–889. [Google Scholar] [CrossRef] [PubMed]
  24. Körner, C. The use of ‘altitude’ in ecological research. Trends Ecol. Evol. 2007, 22, 569–574. [Google Scholar] [CrossRef]
  25. Wang, R.; Chen, H.; Liu, X.; Wang, Z.; Wen, J.; Zhang, S. Plant phylogeny and growth form as drivers of the altitudinal variation in woody leaf vein traits. Front. Plant Sci. 2020, 10, 1735. [Google Scholar] [CrossRef] [Green Version]
  26. Tang, Z.; Fang, J. Temperature variation along the northern and southern slopes of Mt. Taibai, China. Agric. For. Meteorol. 2006, 139, 200–207. [Google Scholar] [CrossRef]
  27. Du, B.M.; Ji, H.W.; Peng, C.; Liu, X.J.; Liu, C.J. Altitudinal patterns of leaf stoichiometry and nutrient resorption in Quercus variabilis in the Baotianman Mountains, China. Plant Soil 2017, 413, 193–202. [Google Scholar] [CrossRef]
  28. Gerdol, R.; Iacumin, P.; Brancaleoni, L. Differential effects of soil chemistry on the foliar resorption of nitrogen and phosphorus across altitudinal gradients. Funct. Ecol. 2019, 33, 1351–1361. [Google Scholar] [CrossRef]
  29. Chase, M.W.; Byng, J.; Christenhusz, M.; Fay, M.; Judd, W.; Mabberley, D.; Sennikov, A.; Soltis, D.; Soltis, P.S.; Stevens, P.F.J. An update of the Angiosperm Phylogeny Group classification for the orders and families of flowering plants: APG IV. Bot. J. Linn. Soc. 2016, 181, 1–20. [Google Scholar]
  30. Zanne, A.E.; Tank, D.C.; Cornwell, W.K.; Eastman, J.M.; Smith, S.A.; FitzJohn, R.G.; McGlinn, D.J.; O’Meara, B.C.; Moles, A.T.; Reich, P.B. Three keys to the radiation of angiosperms into freezing environments. Nature 2014, 506, 89–92. [Google Scholar] [CrossRef]
  31. Konietschke, F.; Placzek, M.; Schaarschmidt, F.; Hothorn, L.A. nparcomp: An R software package for nonparametric multiple comparisons and simultaneous confidence intervals. J. Stat. Softw. 2015, 64, 1–17. [Google Scholar] [CrossRef] [Green Version]
  32. Blomberg, S.P.; Garland, T.; Ives, A.R. Testing for phylogenetic signal in comparative data: Behavioral traits are more labile. Evolution 2003, 57, 717–745. [Google Scholar] [PubMed]
  33. Watanabe, T.; Broadley, M.R.; Jansen, S.; White, P.J.; Takada, J.; Satake, K.; Takamatsu, T.; Tuah, S.J.; Osaki, M. Evolutionary control of leaf element composition in plants. New Phytol. 2007, 174, 516–523. [Google Scholar] [CrossRef] [PubMed]
  34. Johnson, P.C.D. Extension of Nakagawa & Schielzeth’s R-GLMM(2) to random slopes models. Methods Ecol. Evol. 2014, 5, 944–946. [Google Scholar] [PubMed] [Green Version]
  35. Wang, X.C.; Wang, Q.; Chen, Y.; Zhao, R.; Zhang, J.H.; Quan, X.K.; Liu, F.; Wang, C.K. Coloration and phenology manifest nutrient variability in senesced leaves of 46 temperate deciduous woody species. J. Plant Ecol. 2022, 15, 700–710. [Google Scholar] [CrossRef]
  36. Hoch, W.A.; Singsaas, E.L.; McCown, B.H. Resorption protection. Anthocyanins facilitate nutrient recovery in autumn by shielding leaves from potentially damaging light levels. Plant Physiol. 2003, 133, 1296–1305. [Google Scholar] [CrossRef] [Green Version]
  37. Hörtensteiner, S. Chlorophyll degradation during senescence. Annu. Rev. Plant Biol. 2006, 57, 55–77. [Google Scholar] [CrossRef]
  38. Sterner, R.W.; Elser, J.J. Ecological Stoichiometry: The Biology of Elements from Molecules to the Biosphere; Press Princeton University Press: Princeton, NJ, USA, 2002. [Google Scholar]
  39. Veneklaas, E.J.; Lambers, H.; Bragg, J.; Finnegan, P.M.; Lovelock, C.E.; Plaxton, W.C.; Price, C.A.; Scheible, W.R.; Shane, M.W.; White, P.J.; et al. Opportunities for improving phosphorus-use efficiency in crop plants. New Phytol. 2012, 195, 306–320. [Google Scholar] [CrossRef]
  40. Li, C.H.; Yu, H.L.; Xu, Y.X.; Zhu, W.W.; Wang, P.; Huang, J.Y. Close linkages between leaf functional traits and soil and leaf C:N:P stoichiometry under altered precipitation in a desert steppe in northwestern China. Plant Ecol. 2022, 223, 407–421. [Google Scholar] [CrossRef]
  41. Nearing, M.A. The mechanics of soil detachment by raindrops and runoff. Eurasian Soil Sci. 1997, 30, 552–556. [Google Scholar]
  42. Zhang, R.R.; Li, M.; Yuan, X.; Pan, Z.C. Influence of rainfall intensity and slope on suspended solids and phosphorus losses in runoff. Environ. Sci. Pollut. R 2019, 26, 33963–33975. [Google Scholar] [CrossRef] [PubMed]
  43. Elser, J.J.; Fagan, W.F.; Kerkhoff, A.J.; Swenson, N.G.; Enquist, B.J. Biological stoichiometry of plant production: Metabolism, scaling and ecological response to global change. New Phytol. 2010, 186, 593–608. [Google Scholar] [CrossRef] [PubMed] [Green Version]
  44. Niinemets, U.; Tamm, U. Species differences in timing of leaf fall and foliage chemistry modify nutrient resorption efficiency in deciduous temperate forest stands. Tree Physiol. 2005, 25, 1001–1014. [Google Scholar] [CrossRef] [PubMed]
  45. Gonzalez-Zurdo, P.; Escudero, A.; Mediavilla, S. N resorption efficiency and proficiency in response to winter cold in three evergreen species. Plant Soil 2015, 394, 87–98. [Google Scholar] [CrossRef]
  46. Lü, X.T.; Reed, S.; Yu, Q.; He, N.P.; Wang, Z.W.; Han, X.G. Convergent responses of nitrogen and phosphorus resorption to nitrogen inputs in a semiarid grassland. Glob. Chang. Biol. 2013, 19, 2775–2784. [Google Scholar] [CrossRef]
  47. Ren, Y.; Liu, M.; Tian, L.; Tian, X.; Li, Z. Biodiversity, Conservation and Management of Taibaishan Nature Reserve; China Forestry Publishing House: Beijing, China, 2006; pp. 2–26. (In Chinese) [Google Scholar]
Figure 1. Leaf N and P nutrient traits and resorption traits of two plant growth forms (PGFs). (a) Ng (N content of green leaves) of H (herbaceous species) and W (woody species). (b) Pg (P content of green leaves) of H and W. (c) NRP (N resorption proficiency) of H and W. (d) PRP (P resorption proficiency) of H and W. (e) NRE (N resorption efficiency) of H and W. (f) PRE (P resorption efficiency) of H and W. (g) NRP:PRP of H and W. (h) NRE:PRE of H and W. The mean values of all traits are compared between two PGFs, using a nonparametric multiple test procedure. Different lowercase letters (a and b) mean significant difference (p < 0.05).
Forests 14 00005 g001
Figure 2. Variance component analysis of leaf N and P resorption traits using phylogenetic nested analysis of variance. (a) Variance component analysis of leaf N and P resorption traits in total species. (b) Variance component analysis of leaf N and P resorption traits in herbaceous species. (c) Variance component analysis of leaf N and P resorption traits in woody species.
Forests 14 00005 g002
Figure 3. Altitudinal patterns of leaf N and P resorption traits. (a) Altitudinal patterns of leaf NRP. (b) Altitudinal patterns of leaf PRP. (c) Altitudinal patterns of leaf NRP:PRP. (d) Altitudinal patterns of leaf NRE. (e) Altitudinal patterns of leaf PRE. (f) Altitudinal patterns of leaf NRE:PRE. The value of R2 and p of all significant regressions are given in the figures.
Forests 14 00005 g003
Figure 4. Regression relationships between selected climatic factors and leaf nutrient resorption traits. (a) Regression relationships between MAT (mean annual temperature) and NRP. (b) Regression relationships between MAP (mean annual precipitation) and PRP. (c) Regression relationships between MAT and NRE. (d) Regression relationships between MAP and PRE. The value of R2 and p of all significant regressions are given.
Forests 14 00005 g004
Figure 5. Regression relationships between the selected soil factors and three leaf nutrients. (a) Regression relationships between soil available P and PRE. (b) Regression relationships between soil total N and NRE:PRE (There’s no regression line because all regressions are insignificant). (c) Regression relationships between soil available P and NRP:PRP. The value of R2 and p of all significant regressions are given.
Forests 14 00005 g005
Table 1. Blomberg’s K and P in total species and different plant growth forms.
nNgPgNREPRENRPPRPNRP:PRPNRE:PRE
Total species53
Blomberg’s K 0.600.43 0.31 0.34 0.44 0.35 0.490.45
Blomberg’s P 0.03 0.25 0.44 0.69 0.40 0.54 0.04 0.07
herbaceous species16
Blomberg’s K 0.850.960.70 0.32 0.69 0.28 0.35 0.36
Blomberg’s P 0.04 0.02 0.10 0.97 0.20 0.96 0.92 0.92
woody species37
Blomberg’s K 0.43 0.32 0.33 0.39 0.37 0.48 0.57 0.53
Blomberg’s P 0.35 0.81 0.82 0.54 0.68 0.19 0.08 0.15
n, number of samples. Blomberg’s K value was bolded when Blomberg’s p < 0.05.
Table 2. Results of linear mixed-effects models for leaf N and P resorption traits.
NRPPRPNREPRENRP:PRPNRE:PRE
EstimateSS%pEstimateSS%pEstimateSS%pEstimateSS%pEstimateSS%pEstimateSS%p
Intercept12.67 <0.0014.12 <0.00164.39 <0.001−30.89 0.2826.29 <0.0011.12 <0.001
fixed effect
MAT0.3712.380.08 −1.2724.75<0.01
MAP −0.00410.25<0.001 0.1318.54<0.01
SAP −1.811.670.17
STN −0.060.660.3
PGF−2.564.40 0.14−2.8210.23<0.0013.670.010.4733.550.140.35−3.483.510.67−0.570.10 0.06
MAT:PGF−0.0118.20 0.97 −0.4525.270.43
MAP:PGF 0.0129.13<0.01 0.0519.430.34
SAP:PGF 1.376.680.37
STN:PGF 0.157.150.04
ramdom effect
site 4.910.14 01 00.39 00.39 2.940.21 00.38
Total model
R2m0.220.370.340.240.070.07
R2c0.280.370.340.240.10.07
p<0.01<0.001<0.001<0.010.30.4
MAT, mean annual temperature. MAP, mean annual precipitation. STN, total N in soil. SAP, available P in soil. PGF, plant growth form. SS%, percentage of sum of squares explained. Linear mixed-effects model was fit by maximum likelihood. Random effect in model was ‘site’. Marginal R2 (R2m) is concerned with variance explained by fixed factors, and conditional R2 (R2c) is concerned with variance explained by both fixed and random factors. Bold values mean significant effect (p < 0.05).
Disclaimer/Publisher’s Note: The statements, opinions and data contained in all publications are solely those of the individual author(s) and contributor(s) and not of MDPI and/or the editor(s). MDPI and/or the editor(s) disclaim responsibility for any injury to people or property resulting from any ideas, methods, instructions or products referred to in the content.

