Article

Even Samples from the Same Waterlogged Wood Are Hygroscopically and Chemically Different by Simultaneous DVS and 2D COS-IR Spectroscopy

1
Institute of Cultural Heritage and History of Science & Technology, University of Science and Technology Beijing, Beijing 100083, China
2
National Center for Archaeology, Beijing 100013, China
3
Heritage Conservation and Restoration Institute, Chinese Academy of Cultural Heritage, Beijing 100029, China
4
Department of Chemistry, Tsinghua University, Beijing 100084, China
5
Department of Wood Anatomy and Utilisation, Research Institute of Wood Industry, Chinese Academy of Forestry, Beijing 100091, China
*
Authors to whom correspondence should be addressed.
Forests 2023, 14(1), 15; https://doi.org/10.3390/f14010015
Submission received: 3 December 2022 / Revised: 17 December 2022 / Accepted: 18 December 2022 / Published: 22 December 2022
(This article belongs to the Special Issue Advances in Preparation and Modification of Wood-Based Materials)

Abstract

:
Waterlogged archaeological wood samples may degrade during long-term immersion in microbial-activity environments, which causes its biodegradation. Simultaneous dynamic vapor sorption (SDVS) and two-dimensional correlation infrared (2D COS-IR) spectroscopy reveal the degradation inhomogeneity of waterlogged fir wood from the Shengbeiyu shipwreck. The waterlogged and reference wood exhibit type II sorption isotherms. The equilibrium moisture contents of waterlogged archaeological fir wood from a decay region (WFD) were 22.5% higher than those of waterlogged archaeological fir wood from a sound region (WFS). WFD exhibits a higher measurable sorption hysteresis than WFS, implying greater variation in the surface moisture content in the WFD region compared to the WFS region, which may compromise the dimensional stability of the shipwreck. 2D COS-IR spectra confirmed the inhomogeneous degradation of the waterlogged wood via numerous mechanisms. The efficacy of SDVS and 2D COS-IR spectroscopy in the evaluation of the degradation state of waterlogged wood was demonstrated. This study verifies the existence of hygroscopic and chemical differences between visually similar samples from the same shipwreck.

1. Introduction

The protection of shipwrecks has recently garnered significant interest after successful recoveries of shipwrecks in China and elsewhere. Excavated wood from such shipwrecks requires conservation to maintain dimensional stability and prevent further decay [1,2]. The dimensional stability of waterlogged shipwreck wood is closely related to its hygroscopicity [3]; therefore, research into the relationship between waterlogged archaeological wood and water, such as hygroscopicity and other related physical properties before and after consolidation [4,5,6], becomes more common. Research into the protection of cultural relics adheres to the principle of ‘minimum intervention’, which aims to avoid destructive research by, among other measures, the selection of local, small-area samples for the physical evaluation of cultural relics. While this sampling method is suitable for the study of homogeneously degraded materials, in the case of wood—an organic and anisotropic natural polymeric material—this approach has certain limitations. Samples with different physical or chemical properties may be collected from the same material owing to its heterogeneous degradation [4,7], leading to different conclusions on the degree of degradation, which is not conducive to the evaluation and protection of wooden cultural relics. Although there are several studies using different methods to assess the degree of whole wooden artifacts [8,9,10], studies concerning the unevenness degradation from one sample require more attention when assessing the property of waterlogged archaeological wood.
In addition to the issue of the representativeness of the samples, a suitable method for assessing the degree of degradation of relevant artefacts is required. The physical properties of wooden artefacts are commonly evaluated in terms of their maximum water content, basic density, residual density, lost wood substance, dimensional stability, hygroscopicity, etc. [11,12,13,14]. The degradation of the main components of wood affects its water accessibility and hygroscopicity, thereby hindering the protection and conservation of waterlogged archaeological wood [3,15]. Establishing a correlation between hygroscopicity and structural variation in wood is therefore crucial for developing more accurate methods to address these variations [15]. Dynamic vapour sorption (DVS) can be used to determine the hygroscopicity of a material based on its equilibrium moisture content [16,17,18]; however, most DVS systems measure only one or two samples simultaneously. Recently, some scholars studied the interrelationship between wood and moisture using a technique—simultaneous dynamic vapour sorption (SDVS)—that simultaneously measured 11 wood samples, thereby facilitating a comparison of the experimental results by measuring more wood samples under the same conditions [19,20]. Moreover, this technology enables the selection and simultaneous evaluation of samples from different locations on the same piece of waterlogged wood, thereby ensuring a more representative and accurate result.
Detailed information concerning the changes in the main components of waterlogged wood is crucial to determining the preservation state of archaeological wood, defining patterns of decay, and selecting appropriate conservation methods; however, research on this topic is not sufficient enough compared to that concerning sound wood [1,21,22]. The chemical structure of wood is most commonly determined by infrared (IR) spectroscopy. IR spectroscopy is a simple and accurate technique for evaluating the main components of wood [12,15,21,23], examining chemical changes during degradation [15,24,25], dating historical artefacts [26], characterising the molecular structure of waterlogged archaeological wood [9,27,28], and evaluating the consolidating effect of archaeological wood [29,30,31]; however, the IR spectra of complex samples such as waterlogged wood can have a difficult time obtaining accurate and detailed information owing to the superposition of the absorption signals of numerous different components [32]. Two-dimensional correlation IR (2D COS-IR) spectroscopy had been especially successful in the studies of systems stimulated by a small-amplitude mechanical or electrical perturbation after it was first introduced by Noda in 1986 [33]. However, the external perturbations used to produce 2D COS IR spectra were the time-dependent behaviour (i.e., waveform) of dynamic spectral intensity variations, which must be a simple sinusoid in the early days [34]. Noda extended the perturbation methods to any external perturbation that can cause changes in the spectral signal, including the temperature, concentration, mechanical strain, reaction time, etc. [34,35]. Temperature-perturbation 2D COS IR spectroscopy is now a generally accepted method which has been successfully applied in the studies of polymeric materials, biological molecules, and even complex traditional Chinese medicines [33,36]. However, while this technique has been used in the analysis of wood, mainly for the identification of wood species [37,38], heat treatment [39], and bacterial erosion [40], it has not yet been applied to the study of archaeological wood, including waterlogged wood.
In China, the excavation and protection of waterlogged wooden artefacts has improved owing to the rapid progress of archaeological technology and a continued increase in national attention given to the preservation of Chinese cultural relics [29,41,42]. Many major archaeological sites in China, including the Nanhai I shipwreck [41], the Xiaobaijiao No.1 shipwreck [23], and the Hai Menkou archaeological site [43], contain several preserved waterlogged wooden artefacts. The Shengbeiyu shipwreck site is located 28–31 m underwater in an area of the Shengbeiyu Sea to the east of Zhangzhou City, Fujian Province. The shipwreck was first discovered in 2014, and two surveys were conducted in 2016 and 2021. The shipwreck site is currently underwater and contains mainly porcelain and wooden hulls. The wooden hull remains bow northwest stern southeast, approximately along the 310° direction, with a residual length and width of 13.07 and 3.7 m, respectively, and six compartments. Six hundred and ninety-six sets of water relics, mainly Longquan Celadon porcelain, were collected from the wreck in 2021. The characteristics of the recovered relics suggest that they date to the late Yuan Dynasty [42]. In 2022, the archaeological excavation of the Shengbeiyu shipwreck site was included in the ‘14th Five-Year Plan’ announced by the State Administration of Cultural Heritage, which approved the archaeological excavation plan.
The Shengbeiyu shipwreck is a well-preserved late-Yuan Dynasty shipwreck with high research value and is representative of the ships used in China’s maritime trade during the peak of the Maritime Silk Road in the middle- and late-Yuan dynasties [42]. The wooden hull of the shipwreck is an important cultural relic, the excavation and protection of which will provide valuable materials that provide information on the history of navigation, shipbuilding, maritime trade, and the Maritime Silk Road. The physical and mechanical properties of the wooden components of the hull must be evaluated to determine how to best protect and preserve the structure. As part of a series of studies on the Shengbeiyu shipwreck, this study examines a plank retrieved during an underwater survey in 2021. Sorption isotherms and hysteresis of waterlogged archaeological wood were, for the first time, obtained by SDVS, and the classical Hailwood–Horribon (H–H) model was fitted to the sorption isotherm data to analyse the mono/multilayer adsorbed water. Moreover, the chemical composition of the waterlogged archaeological wood samples was, for the first time, investigated by Fourier transform IR (FTIR) and 2D COS-IR Spectroscopy.

2. Materials and Methods

2.1. Materials

The waterlogged wood of the Shengbeiyu shipwreck was selected for analysis by simultaneous dynamic vapour sorption (SDVS) and IR spectroscopy. A waterlogged archaeological wood sample from a visually sound region was named WFS, and waterlogged archaeological wood from a decay region was named WFD. The reference wood (FR) was selected according to the identification result of the waterlogged wood in this study.

2.2. Methods

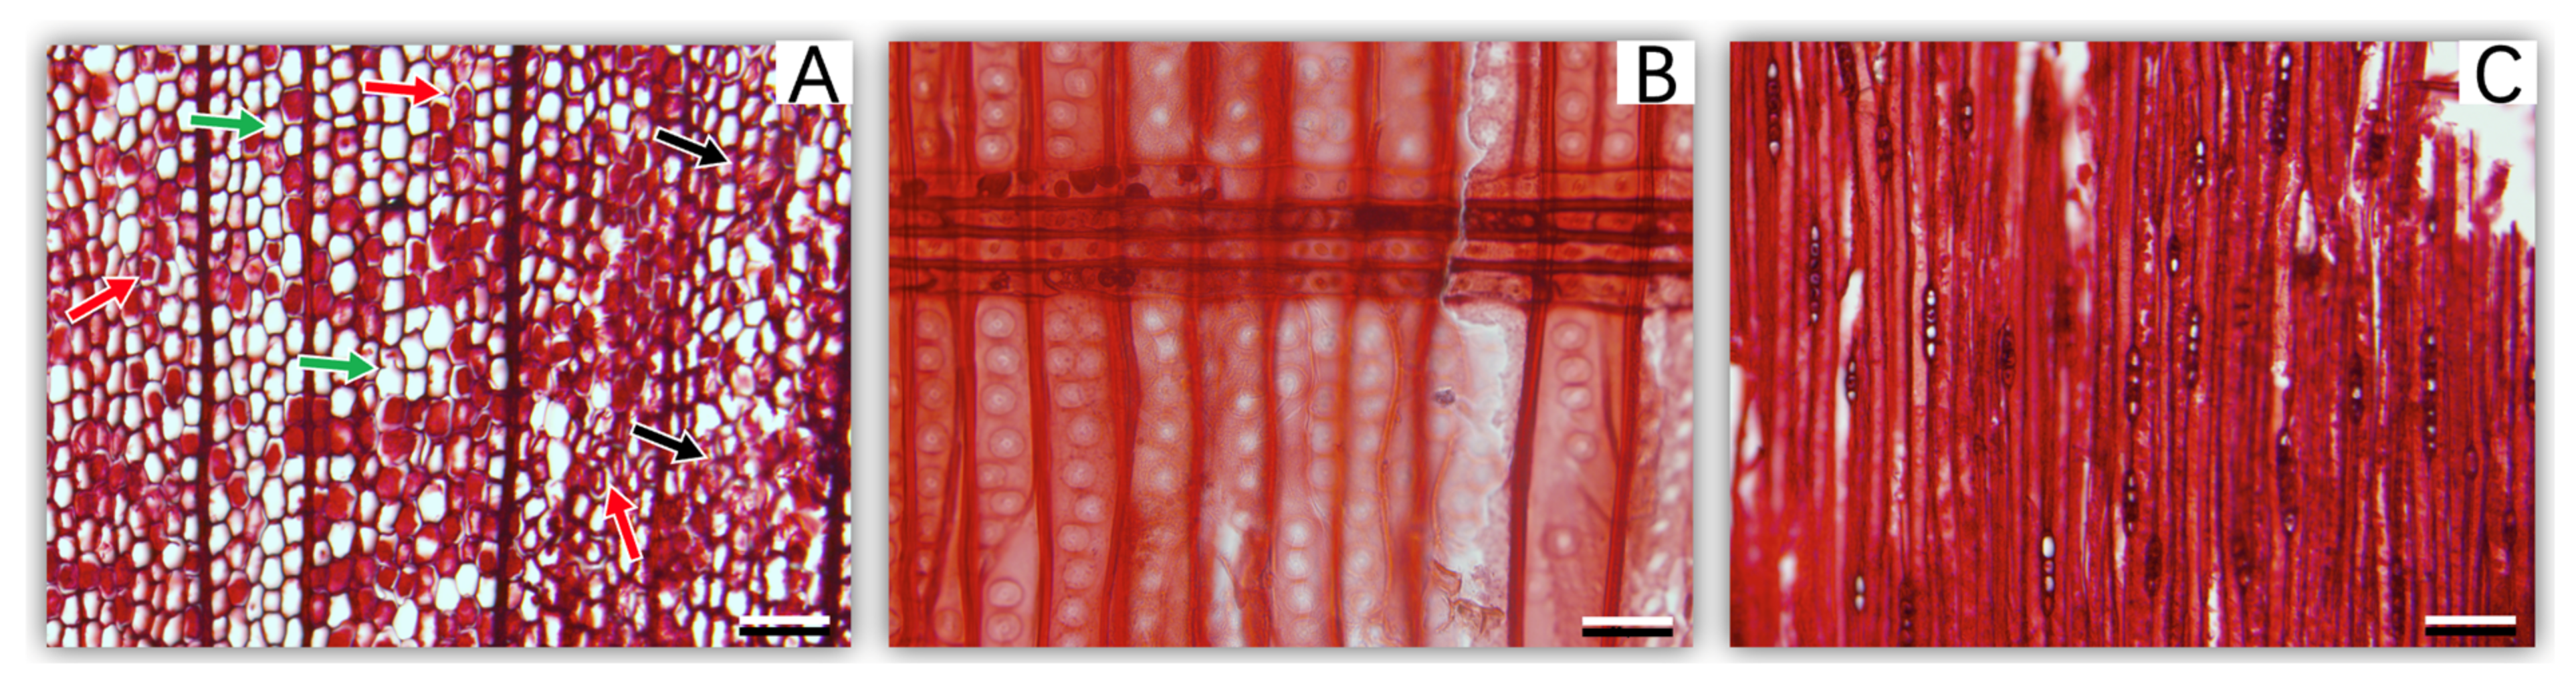
2.2.1. Optical Microscopy

Optical microscopy was applied for wood identification. Wood identification samples measuring at least 0.5 cm in the longitudinal, radial, and tangential directions were cut from the waterlogged archaeological wood. The samples were cut to a thickness of approximately 15–20 μm using a rotary slicer (Leica Autocut, Leica, Nussloch, Germany). Optical microscopic slices were prepared by dyeing, dehydration, making them transparent, and sealing, as described in our previous study [23]. The anatomical structure of the wood was observed using an optical microscope (BX 50; Olympus, Tokyo, Japan). The species of waterlogged archaeological wood was determined by referring to the International Association of Wood Anatomists’ list of wood identification characteristics for softwood and comparing the identified characteristics with the wood specimens and slices officially named in the Wood Collection of the Chinese Academy of Forestry (http://bbg.criwi.org.cn (accessed on 12 December 2021)) [12,23,44].

2.2.2. Basic Density and Maximum Water Content

The basic density and maximum water content of waterlogged archaeological wood samples are commonly used to assess their degradation state [45,46,47]. The masses of waterlogged samples with dimensions of approximately 5 mm3 were measured and recorded as m1 before the samples were dried in an oven at 103 ± 2 °C and reweighed. The mass of the dried sample was recorded as m0. The volume Vb of the waterlogged wood was measured using an established drainage method [12]. The basic density and maximum water content of the waterlogged archaeological wood were then calculated using Equations (1) and (2), respectively:
BD = m 0 V b × 100 %
MWC = m 1 m 0 m 0 × 100 %  
where BD is the basic density and MWC is the maximum water content.

2.2.3. Simultaneous Dynamic Vapour Sorption

The equilibrium moisture contents of waterlogged wood and recent wood were measured in different relative humidity (RH) states by simultaneous dynamic vapour sorption (SDVS) (SPSx-1µ-HighLoad, ProUmid, Ulm, Germany). Measurements were conducted according to the protocol described in our previous study [3], while all the samples in this study can be tested simultaneously in SDVS, which can measure up to 23 samples simultaneously. The samples of FR, WFS, and WFD were cut into one-millimetre-thick stripes using a sharp knife. The waterlogged stripes (totalling 30 mg) were initially dried on a partial plateau for 12 h at an RH of 0% at 25 °C. In sequence, the samples were exposed to ascending RH values ranging from 0% to 95% (in 10% RH intervals from 0% to 90%) to determine the adsorption isotherm. They were subsequently exposed to descending RH values in the same manner to determine the desorption isotherm at 25 °C. Each sample was weighed for about 20 s, and then the balance baseline was corrected for about 60 s before the next sample was tested. The time between weighing cycles was set as 15 min, with the minimum/maximum time per climate cycle being 50/600 min. Equilibrium in each step was considered to be reached at a mass change per time (dm/dt) of less than 0.001%/min, with an equilibrium condition of 0.03% per 45 min. The sorption hysteresis (not absolute sorption hysteresis [48]) parameters were calculated from the difference in the equilibrium moisture content of scanning desorption and adsorption at the same RH [20,49].

2.2.4. H–H Model for Sorption Analysis

The classic Hailwood–Horribon model (H–H model) was applied for fitting the sorption isotherms of the waterlogged wood and recent wood [20,50]. The parameters of the model were calculated by Origin 2022 software (OriginLab Corporation, Northampton, MA, USA) by applying Equation (3):
EMC = M h + M s = 1800 w k 1 k 2 R H 100 + k 1 k 2 R H + 1800 w k 2 R H 100 k 2 R H
where EMC (g/g) is the equilibrium moisture content, RH (%) is the relative humidity, Mh is the monolayer moisture content (%), Ms is the multilayer moisture content (%), w is the molecular weight of wood at each adsorption site, and the parameters k1 and k2 are the equilibrium constants of the sorption process [50].

2.2.5. FTIR

FTIR was applied in this study, considering that the hygroscopic behaviours of samples can be interpreted in a chemical way. The wood powder of FR, WFS, and WFD for the FTIR test was prepared by an EFM Freezer Mill 6770 (SPEX SamplePrep, Metuchen, NJ, USA) using the freeze-grinding method. Then, the powders (about 1 mg for each sample) were blended with KBr (100 mg) and grounded into powder (200 mesh), and then the mixture was further grounded and pressed under 8 tons of pressure to make a thin disk (about 10 mm in diameter) [51]. KBr tabletting samples for FR, WFS, and WFD were tested using a PerkinElmer FTIR spectrometer (PerkinElmer, Massachusetts, MA, USA) with 16 scans and a resolution of 4.000. Five recordings were performed, and the obtained spectra were averaged for each sample [52]. The FTIR data were processed using PE Spectrum Software (PerkinElmer, Massachusetts, MA, USA) and Origin 2022 software (OriginLab Corporation, Northampton, MA, USA) [37]. The correlation coefficients of the waterlogged and reference wood samples were calculated using the PE Spectrum Software of the PerkinElmer FTIR spectrometer.

2.2.6. 2D COS-IR Spectroscopy

To measure the 2D COS-IR spectra, each KBr tabletting sample after the FTIR test in 2.2.5 was connected to the temperature controller in the sample pool, and the temperature was increased at a rate of 2.5 °C/min. The dynamic spectra were collected at 50, 60, 70, 80, 90, 100, 110, and 120 °C.
Under the action of temperature disturbance T, the IR spectrum of the sample was measured at equal temperature intervals, and m data points were measured. The dynamic spectrum can be expressed as in Equation (4):
y v = y v , T 1 y v , T 2 M y v , T m
where y(v, T) is the spectral intensity of the sample at variable v (wavenumber) at a perturbation of T (temperature). According to the cross-correlation analysis, the synchronous correlation intensity Φ v 1 ,   v 2 is calculated using Equation (5):
Φ v 1 , v 2 = 1 m 1 y v 1 T · y v 2
When the dynamic changes at ν1 and ν2 are equal, Φ v 1 , v 2 reaches a positive maximum; when they are orthogonal, Φ v 1 , v 2 is 0; and when they are completely opposite, Φ v 1 , v 2 reaches a minimum (negative maximum) [51]. A series of temperature-dependent dynamic spectra were analysed using the 2D COS-IR software (2D COS software, Tsinghua University, Beijing, China) [37,51]. The auto-peaks on the diagonal line show the self-correlation and sensitivity of some normal vibrations of the functional groups to thermal perturbations. As the functional group becomes more sensitive, the intensity of the auto-peaks increases and the spectra become a deeper red colour [39].

3. Results

3.1. Morphological and Physical Features of Waterlogged Archaeological Wood

Based on typical morphological structure features, the wood block from the shipwreck was anatomically identified as Cunninghamia sp. (fir wood). The following observed anatomical features of the wood block from the shipwreck are characteristic for wood identification (IAWA index: 4, 40, 43, 44, 80, 94, 104, 107) [44] (Figure 1): growth ring (IAWA index 40); early-wood-to-late-wood gradient (IAWA index 43); cross-section of the early wood tracheid of irregular polygons and squares; cross-section of the latewood tracheid of rectangles and polygons (Figure 1A); tracheid bordered pitting in a single row (occasionally two rows) of radial walls (IAWA index 44); ray tracheid absent (IAWA index 80); cross-field pitting taxodioid (IAWA index 94) (Figure 1B); ray width: 1 cell (IAWA index 107); height: 2–8 cells (IAWA index 104) (Figure 1C). The sound wood of Cunninghamia sp. (Nanping City, Fujian Province, China, 27° N, 118° E, 608 m a.s.l., 36 years old, 40 cm in diameter at breast height) was selected as the reference sample, named FR.
Although the samples used for species identification in this study were selected from visually sound regions and were not used for any other purpose, several signs of degradation can be observed in Figure 1. For example, the ‘blurred’ areas indicated by the black arrows show a large number of degraded tracheid walls, while the areas indicated by the red arrows show the cell wall detached from the intercellular layer of the wood (Figure 1A), which is a typical phenomenon of moderately degraded waterlogged archaeological wood [9,23,53]. Almost complete degradation was observed at the position of the green arrow, with only the intercellular layer remaining (Figure 1A). The inhomogeneous degradation of waterlogged archaeological wood can be observed at a morphological level.
The waterlogged wood samples selected in this study exhibited a basic density of 0.217 ± 0.038 g/cm3 and a maximum water content of 390.8% ± 76.9%. The samples were therefore classified as moderately decayed wood (185% < maximum water content < 400%) in accordance with previous studies [3,54].

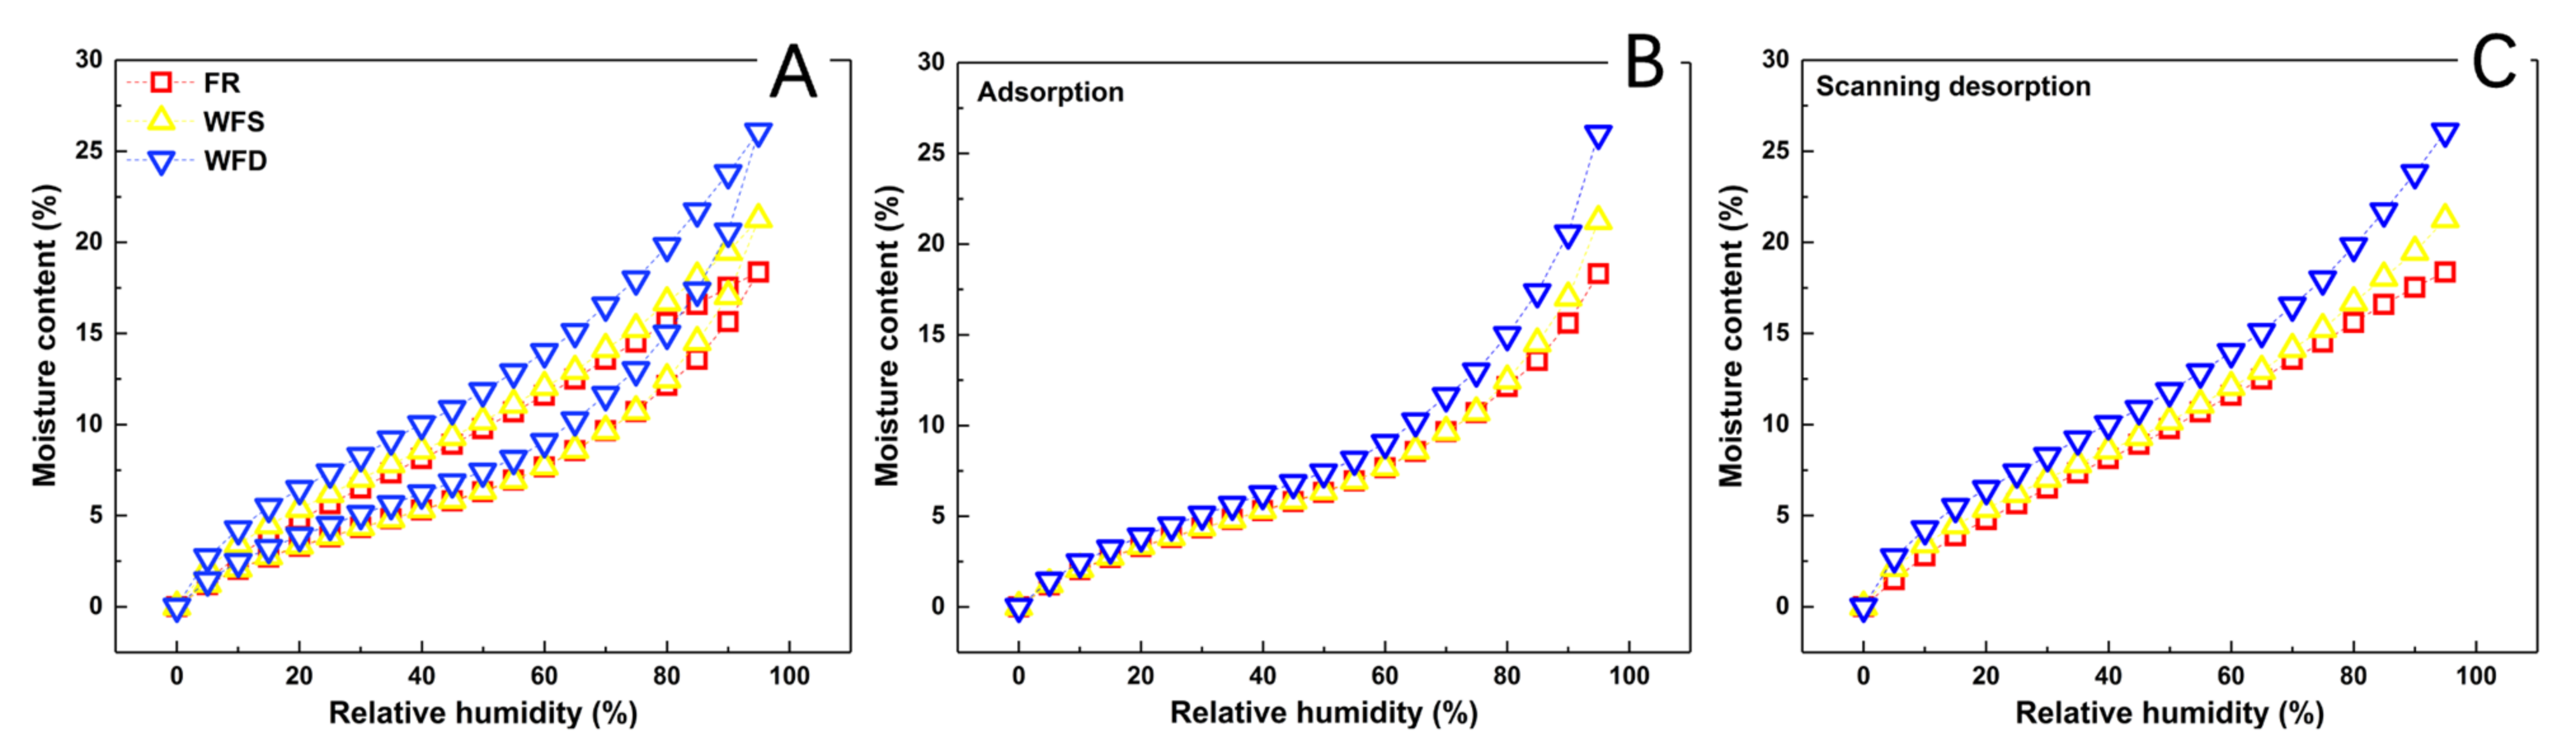
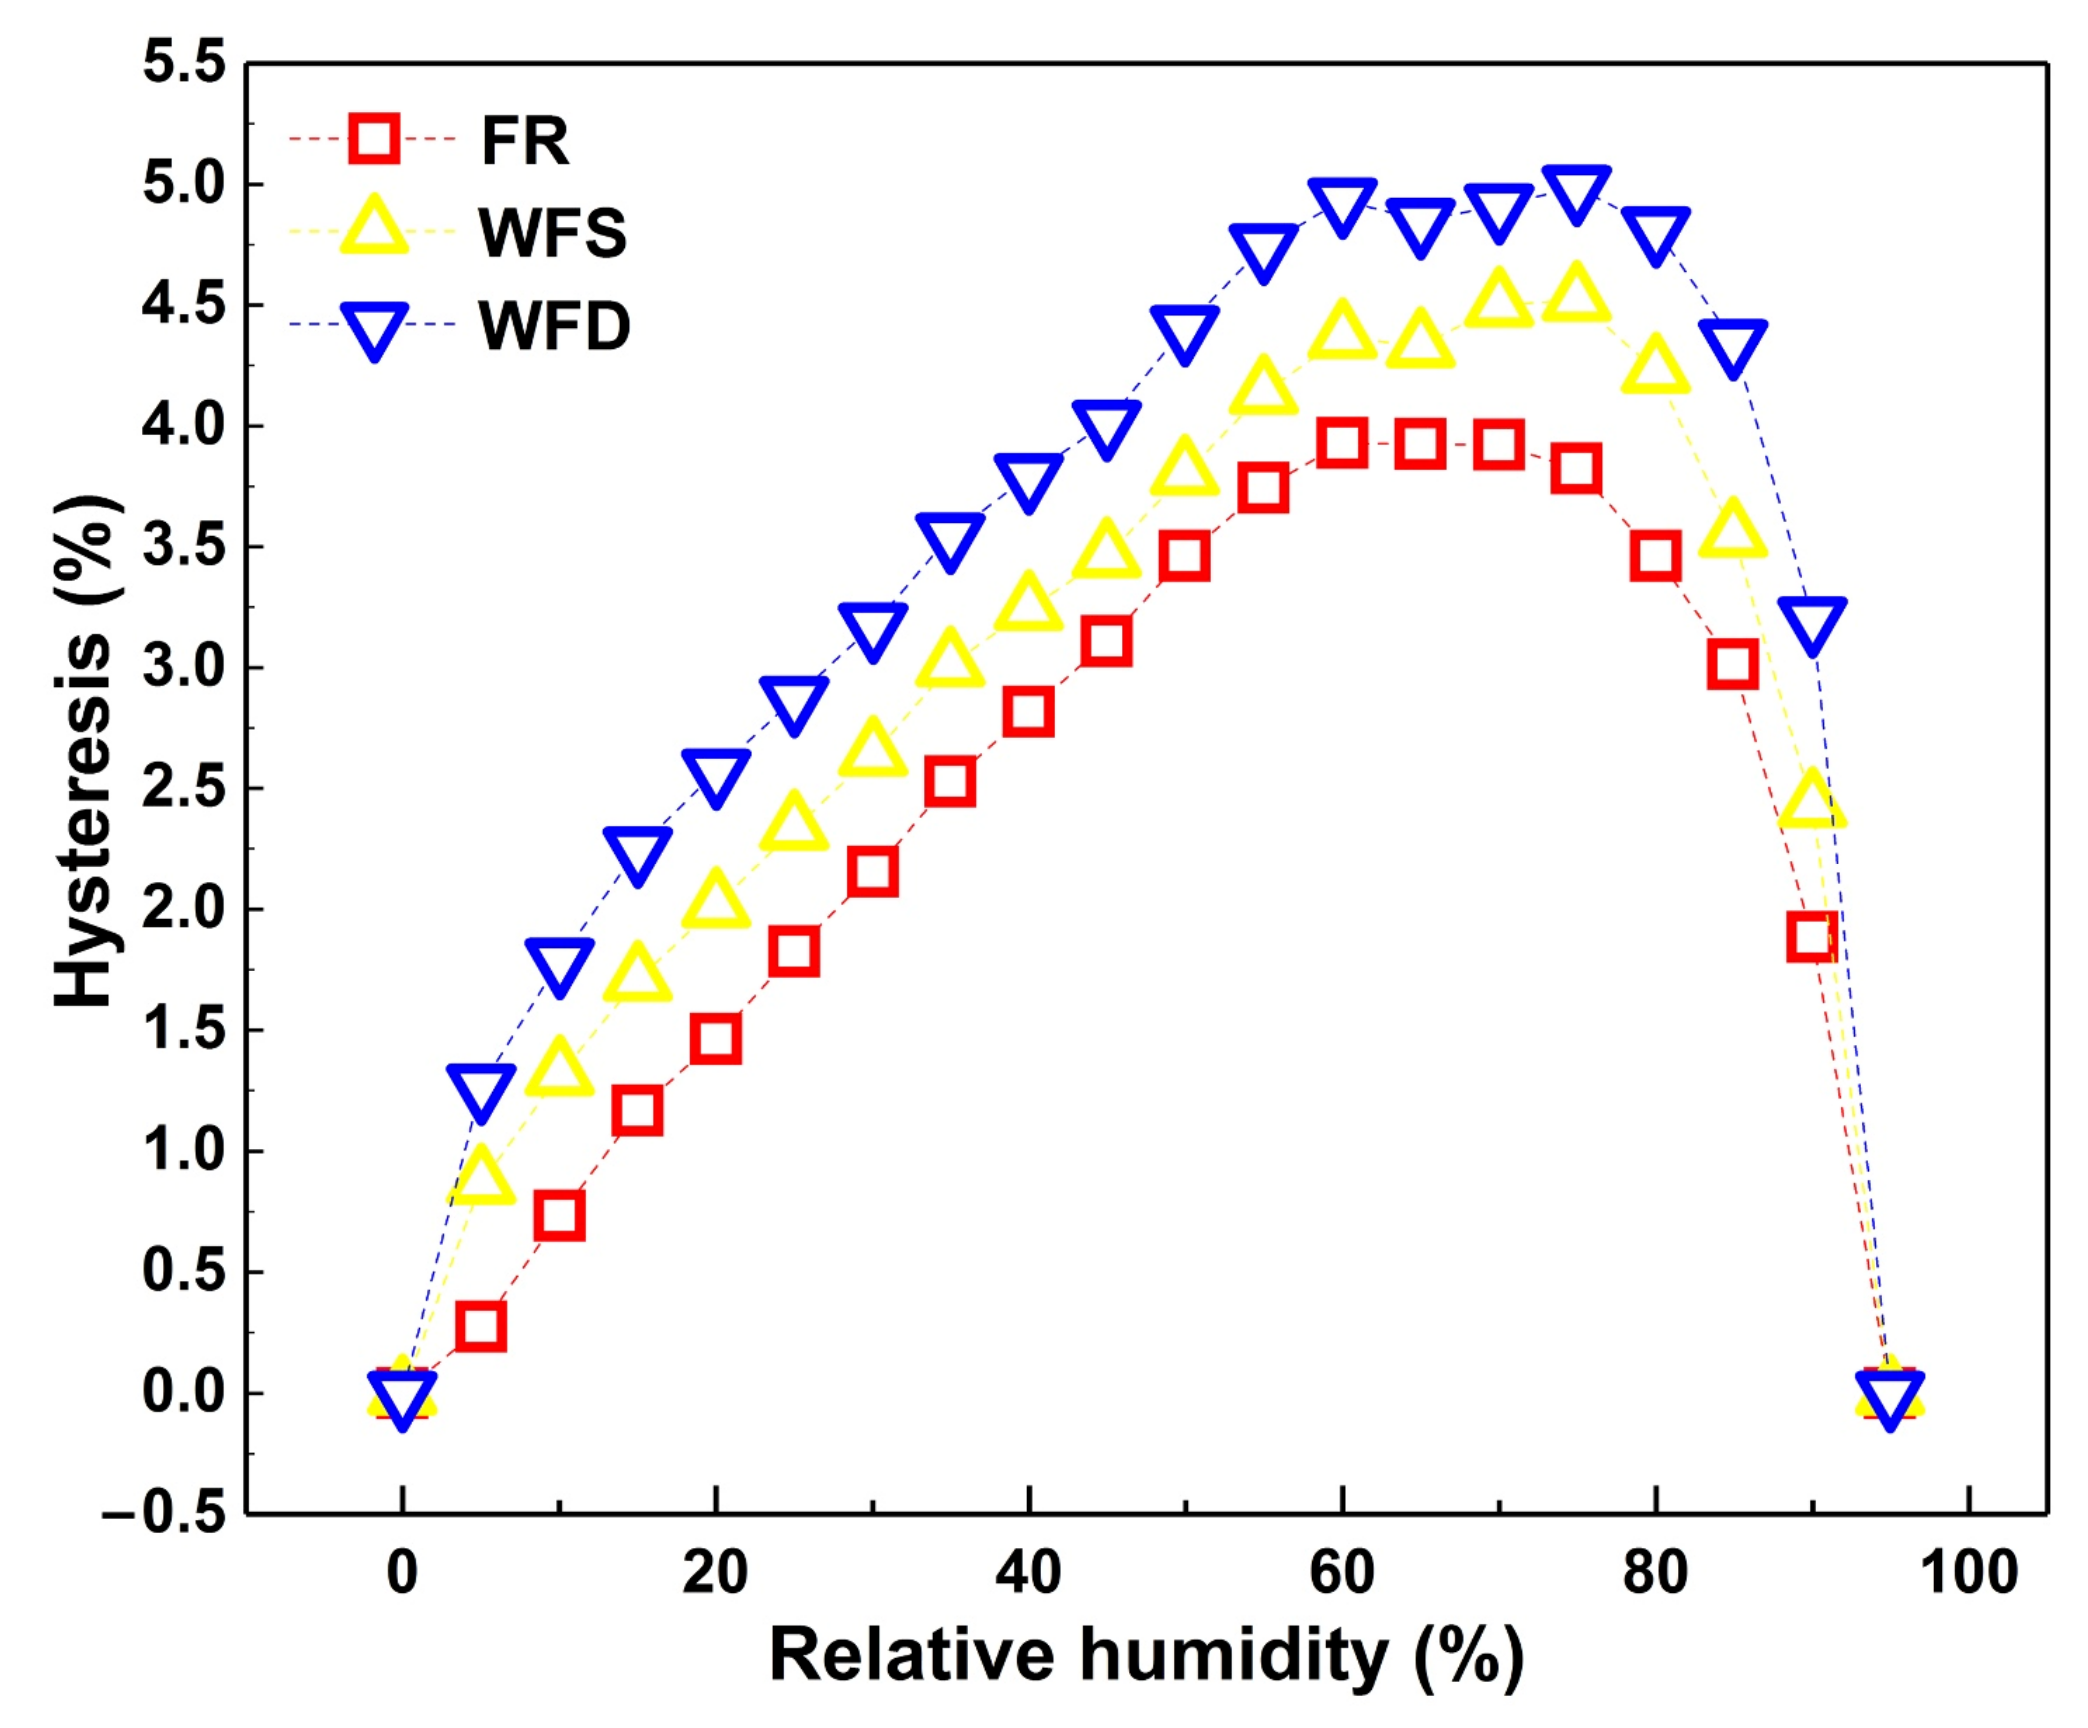
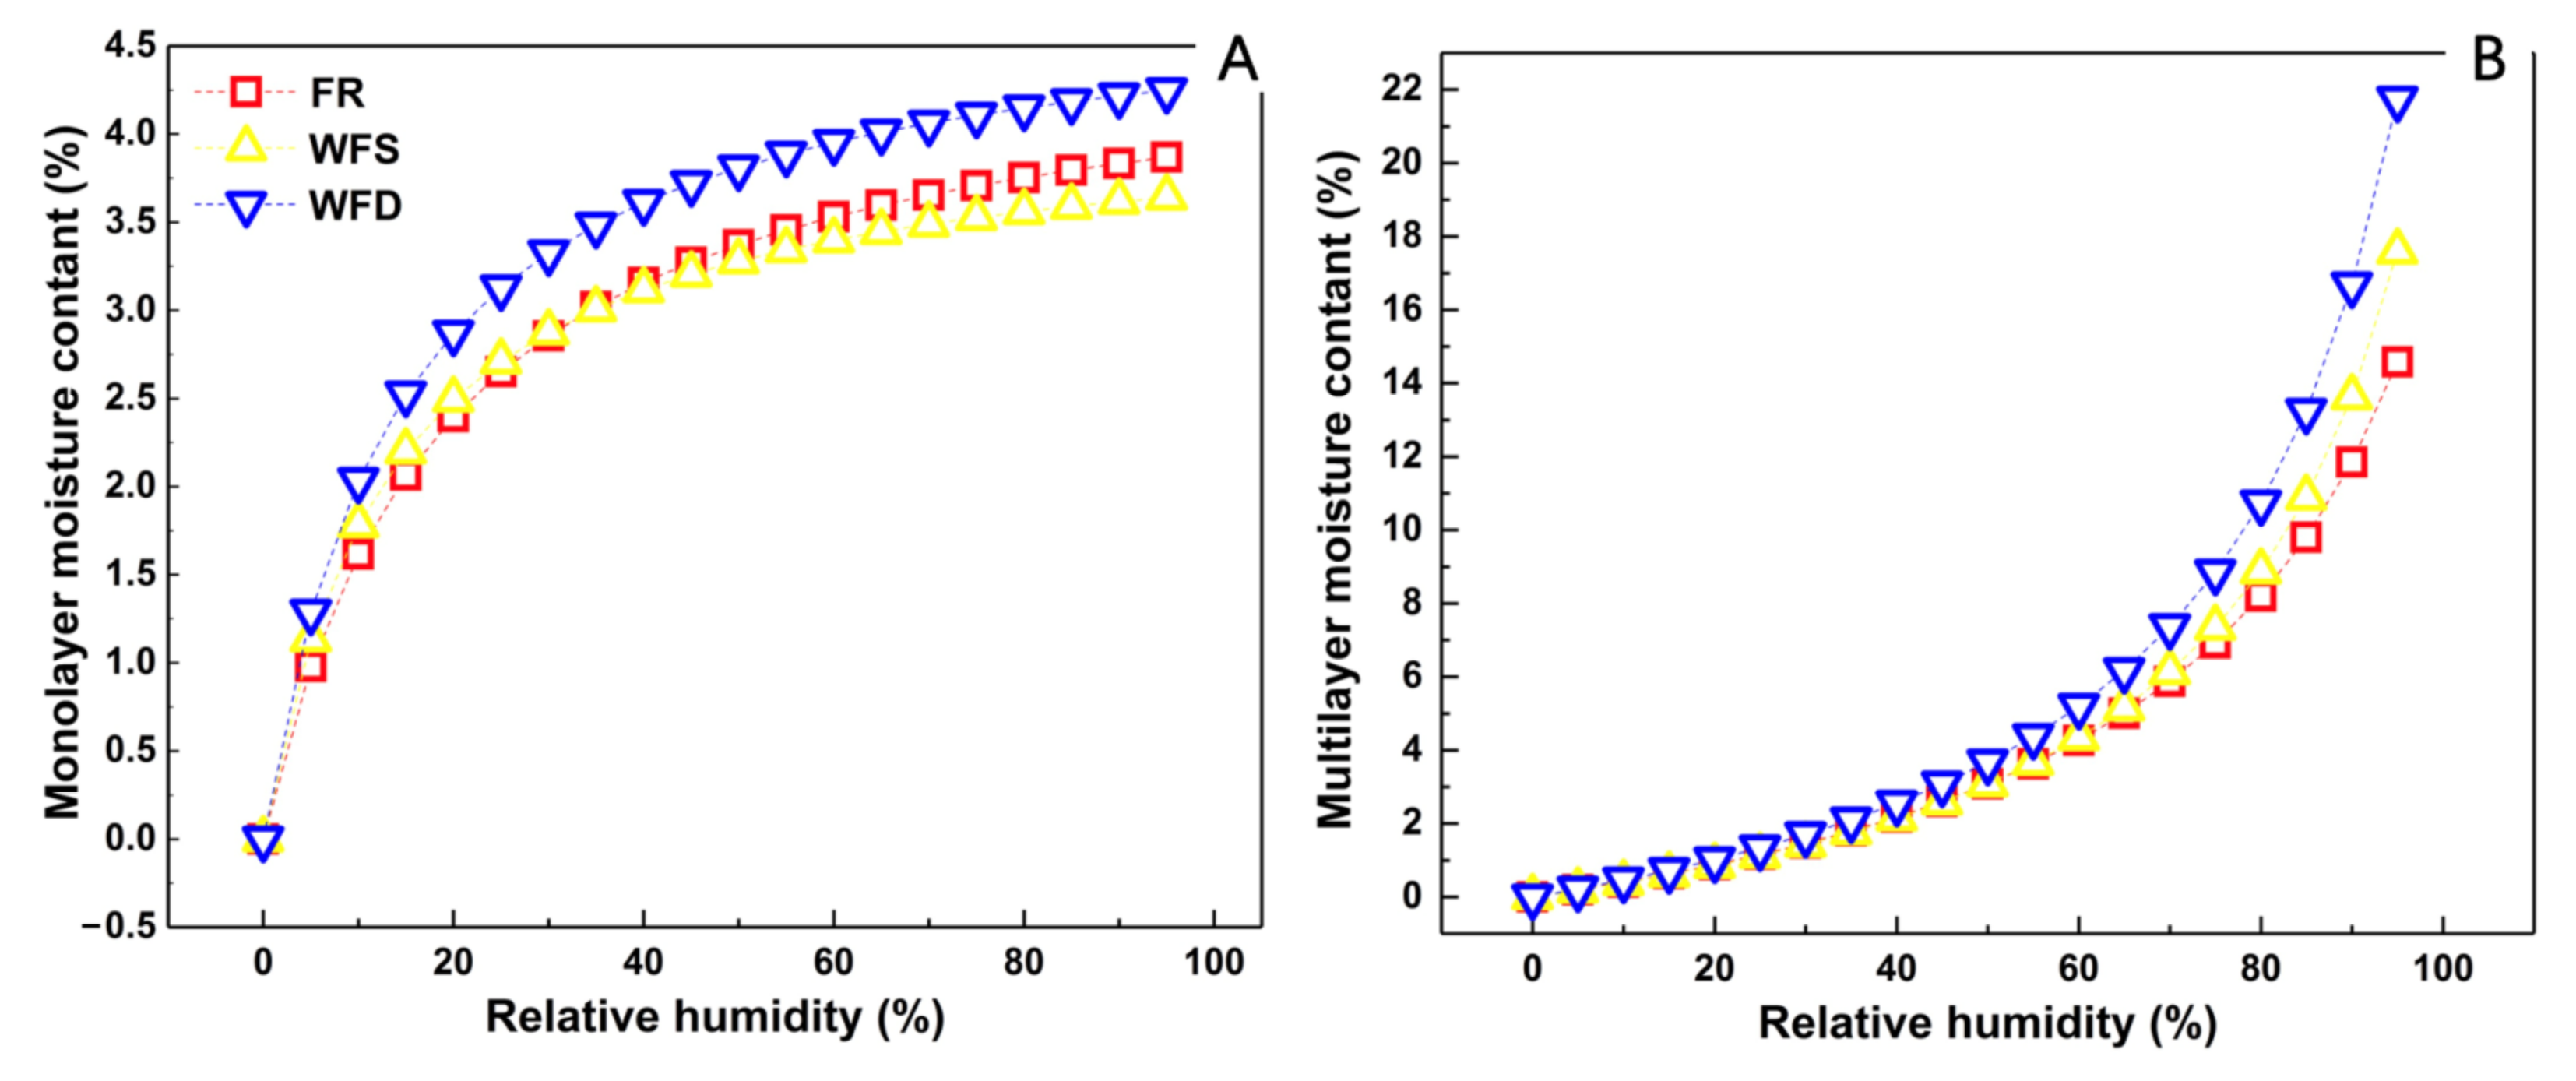
3.2. Hygroscopic Differences of Waterlogged Archaeological Wood in the Same Block and in Different Regions

The sorption isotherms of the recent fir sample and waterlogged archaeological wood fir samples (waterlogged archaeological fir sample from a visually sound region, WFS, and waterlogged archaeological fir sample from a decay region, WFD) obtained from different regions of the same block of wood are shown in Figure 2. S-shapes are visible in all adsorption and scanning desorption isotherms, suggesting that both the waterlogged archaeological wood and the recent fir sorption isotherms can be classified as type II isotherms according to IUPAC [55,56].
The measured isotherms may be type IV or type II, i.e., either mostly monolayer and multilayer adsorption or a mix of the two with capillary condensation in the mesopores of the cell wall, respectively [3]. The isotherms of all specimens exhibit an upward trend from an RH of 60% (Figure 2), which is common in lignocellulosic materials [3,57]. The equilibrium moisture content values of the waterlogged archaeological wood samples at the RH value were all greater than those of the recent wood, which was in line with previous studies [3,58]. The increase in hygroscopicity in more decayed waterlogged archaeological wood could be attributed to changes in the relative contents of the main chemical components in the cell wall [3]. At the highest RH (95% RH), the equilibrium moisture contents of WFS and WFD reached 21.3% and 26.1%, respectively, whereas that of FR reached only 18.3%. WFD and WFS exhibited equilibrium moisture contents 42.6% and 16.4% higher than those of FR. Although the WFS and WFD were selected from the same block of the waterlogged archaeological wood, the maximum equilibrium moisture contents at each RH differed, while the equilibrium moisture contents of WFD were almost 22.5% higher than those of WFS.
In addition to the differences in the equilibrium moisture contents, the sorption hysteresis of WFD and WFS also showed differences. Hysteresis in sorption is usually defined as the difference between the adsorption and desorption (scanning desorption in this work [48]) branches of an isotherm between the highest and lowest RHs (95% and 0% RH, respectively, in this study) [48]. Herein, sorption hysteresis was observed from 0% to 95% RH, whether between waterlogged archaeological wood samples and recent samples or between WFD and WFS. The sorption hysteresis of WFD and WFS was higher than that of recent fir (Figure 3), while the sorption hysteresis of WFD was higher than that of WFS at every RH, which was believed to originate from a potential rearrangement of structural components in cell walls [59]. As previously reported, the observed increase in hysteresis might be a consequence of a more severe deterioration of the wood chemical components for moderately decayed waterlogged archaeological wood compared to that of the less decayed waterlogged archaeological wood [3]. This implies that the extent of decay in the WFD region is higher than that of the WFS region. Since the hysteresis for archaeological wood was a result of alterations in the availability of bonding sites for sorption and the degree of aggregation of a swelling or shrinking of the wood [15,60], the surface moisture content might vary more in the degraded WFD region than in the less degraded WFS region owing to the more significant sorption hysteresis under standard changes in RH [3,59,61], which may compromise the dimensional stability of the shipwreck.
To further illustrate the different degrees of degradation between WFD and WFS at the hygroscopic level, and to elucidate the reasons for the differences in hygroscopic behaviour in regions with different degrees of degradation, the classical H–H model was applied to fit the adsorption and scanning desorption isotherms of WFD and WFS. The fit was considered valid when all the determination coefficient (R2) values were greater than 0.99 [3,50,62]. The parameters calculated by least-squares fitting are listed in Table 1.
During the adsorption process, the monolayer moisture content reflected the amount of monolayer-adsorbed water at each RH [50]. Figure 4A shows the real-time relationship between the monolayer moisture content and the RH of WFD, WFS, and FR. The monolayer moisture contents of WFD and WFS were always higher than that of FR across the entire range of relative humidities, from 0% to 95%, which can indicate that FR had the fewest available sorption sites according to the result of other biomass material [62]; however, WFS had a similar monolayer moisture content to that of FR at RH values over 80%, indicating that the adsorption capacities of WFS and FR were similar (Table 1 and Figure 4A). At each RH, the WFD consistently contained more monolayer-adsorbed water than the WFS. The monolayer moisture content increased significantly in the low-humidity range (<30% RH) and stabilised above 30% RH. At RHs higher than 30%, the monolayer moisture contents of FR and WDS ranged between 2.85% and 3.86% and 2.88% and 3.65%, respectively, which is in line with the regular results of other biomass material [50,62]. The monolayer moisture content of WFD was relatively stable within 3.22–4.25% (Figure 4B), likely owing to the greater sorption strength of monolayer-adsorbed water in WFD relative to that in WFS and FR, according to a previous discussion.
The multilayer moisture content in Hailwood–Horribon’s theory reflects the amount of monolayer-adsorbed water at each RH. The multilayer moisture content continuously increased with increasing RH, while the increase rate of the amount of monolayer-adsorbed water increased with RH from 0% to 95% RH. At RH values below 30%, the multilayer moisture contents of FR, WFS, and WFD were below 1.15%, 1.12%, and 1.33%, respectively. With the RH in the recommended range of storage humidity for wooden artefacts (50–60% RH) [63], the multilayer moisture content of FR ranged from 3.07% to 4.26%, while those of WFS and WFD ranged from 3.07% to 4.34% and 3.67% to 5.19%, respectively. At RH values greater than the recommended 60% RH (from 65% to 95%), the multilayer moisture content of FR ranged from 5.00% to 14.57%, whereas those of WFS and WFD ranged from 5.15% to 7.59% and 6.17% to 21.74%, respectively (Table 1 and Figure 4B), indicating that the multilayer water content may increase exponentially if the environmental humidity is higher than the recommended storage humidity for the wooden artefact. At the highest RH (95% RH), WFD absorbs 23.6% more multilayer-adsorbed water than WFS.
An investigation of the hygroscopicity and H–H model of samples from different regions of the same waterlogged wood object reveals that WFD has a higher moisture content. In comparison, the moisture contents of visually similar parts of the WFS were lower than that of the WFD at each RH. This difference became more pronounced when experimental moisture values exceeded the humidity range recommended for storing wooden artefacts (Figure 2 and Figure 4). Moisture moves across the entire unevenly degraded shipwreck plank from high-humidity positions to low-humidity positions—that is, from severely degraded regions to slightly degraded regions—to reach the equilibrium moisture content. Under equivalent RH conditions, the equilibrium moisture content and the amount of multilayer-adsorbed water of WFD were higher than those of WFS, while those of WFS were higher than those of FR.
WFD and WFS exhibited different amounts of mono/multilayer-adsorbed water at each RH, despite being selected from the same shipwreck plank and being visually similar. The mono/multilayer moisture content in the cell wall is mainly related to the cell structure based on the meaning of the parameter for the H-H models [50], which indicates that WFD may have more dimensional changes than WFS, owing to its high mono/multilayer moisture content.
DVS is known to be highly efficient for the hygroscopic study of degradation inhomogeneity. The hygroscopic difference between different regions in the same block may be a result of the chemically uneven changes in the waterlogged wood; thus, the following IR method was systematically investigated.

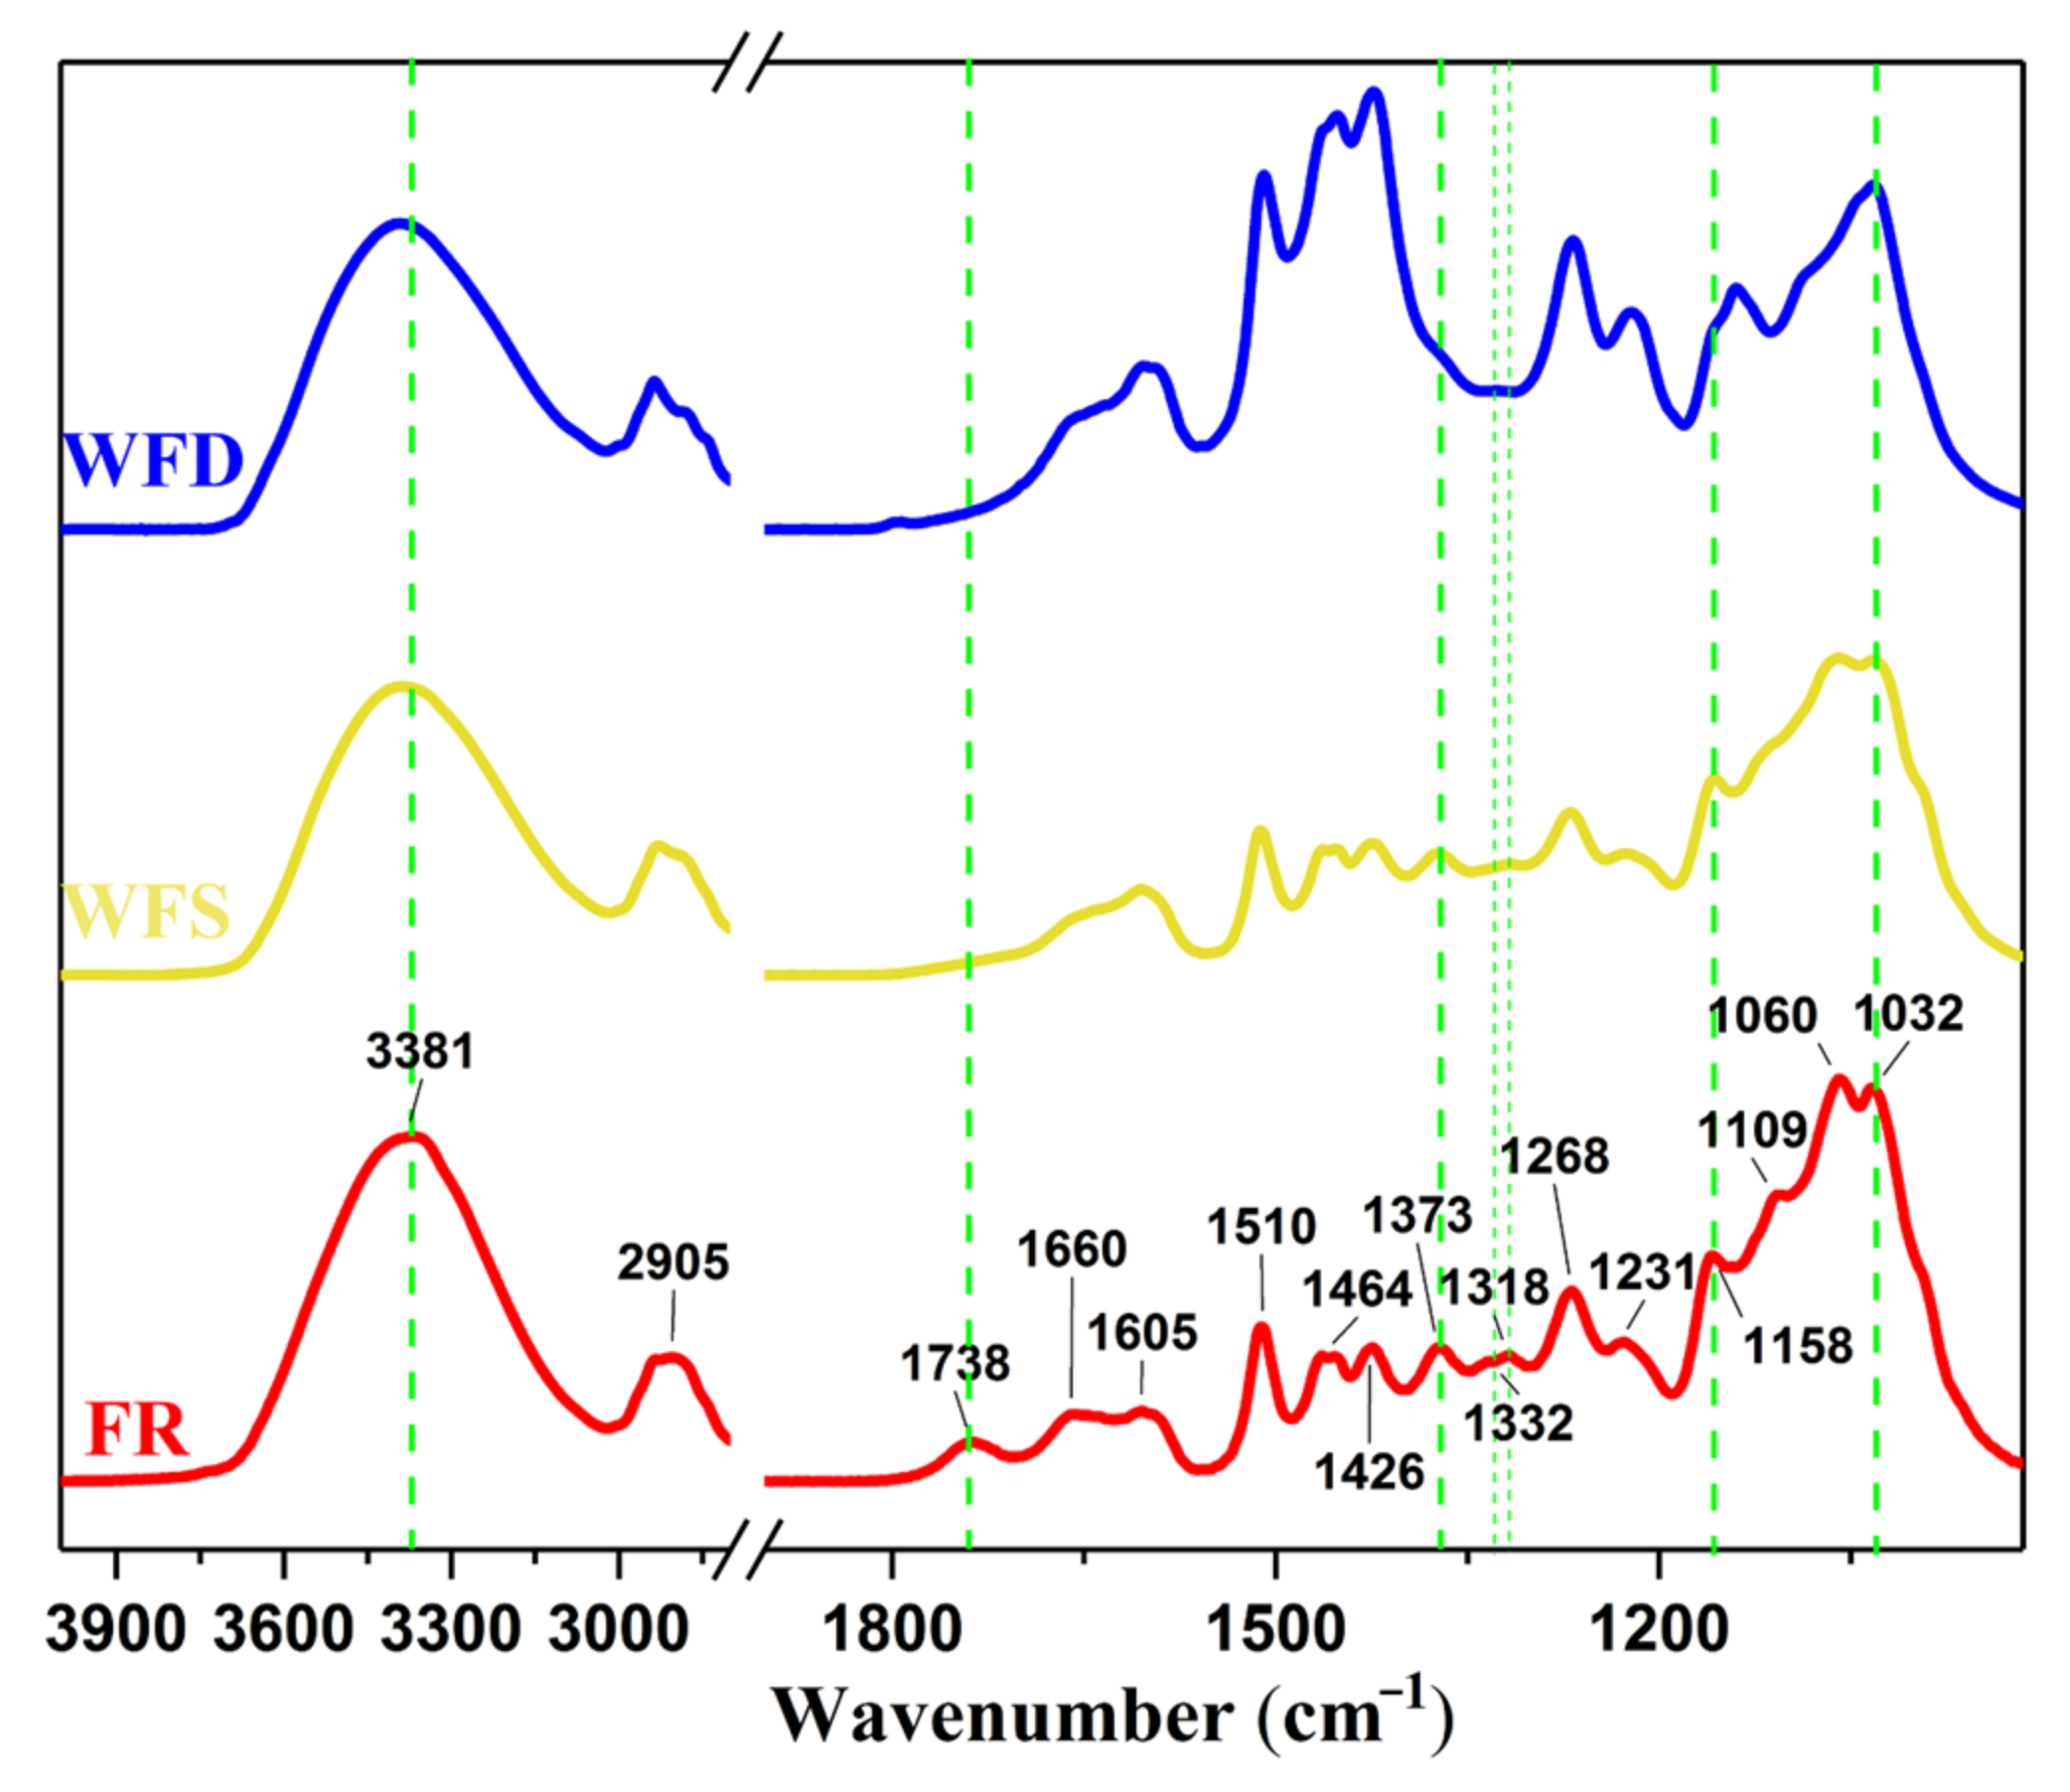
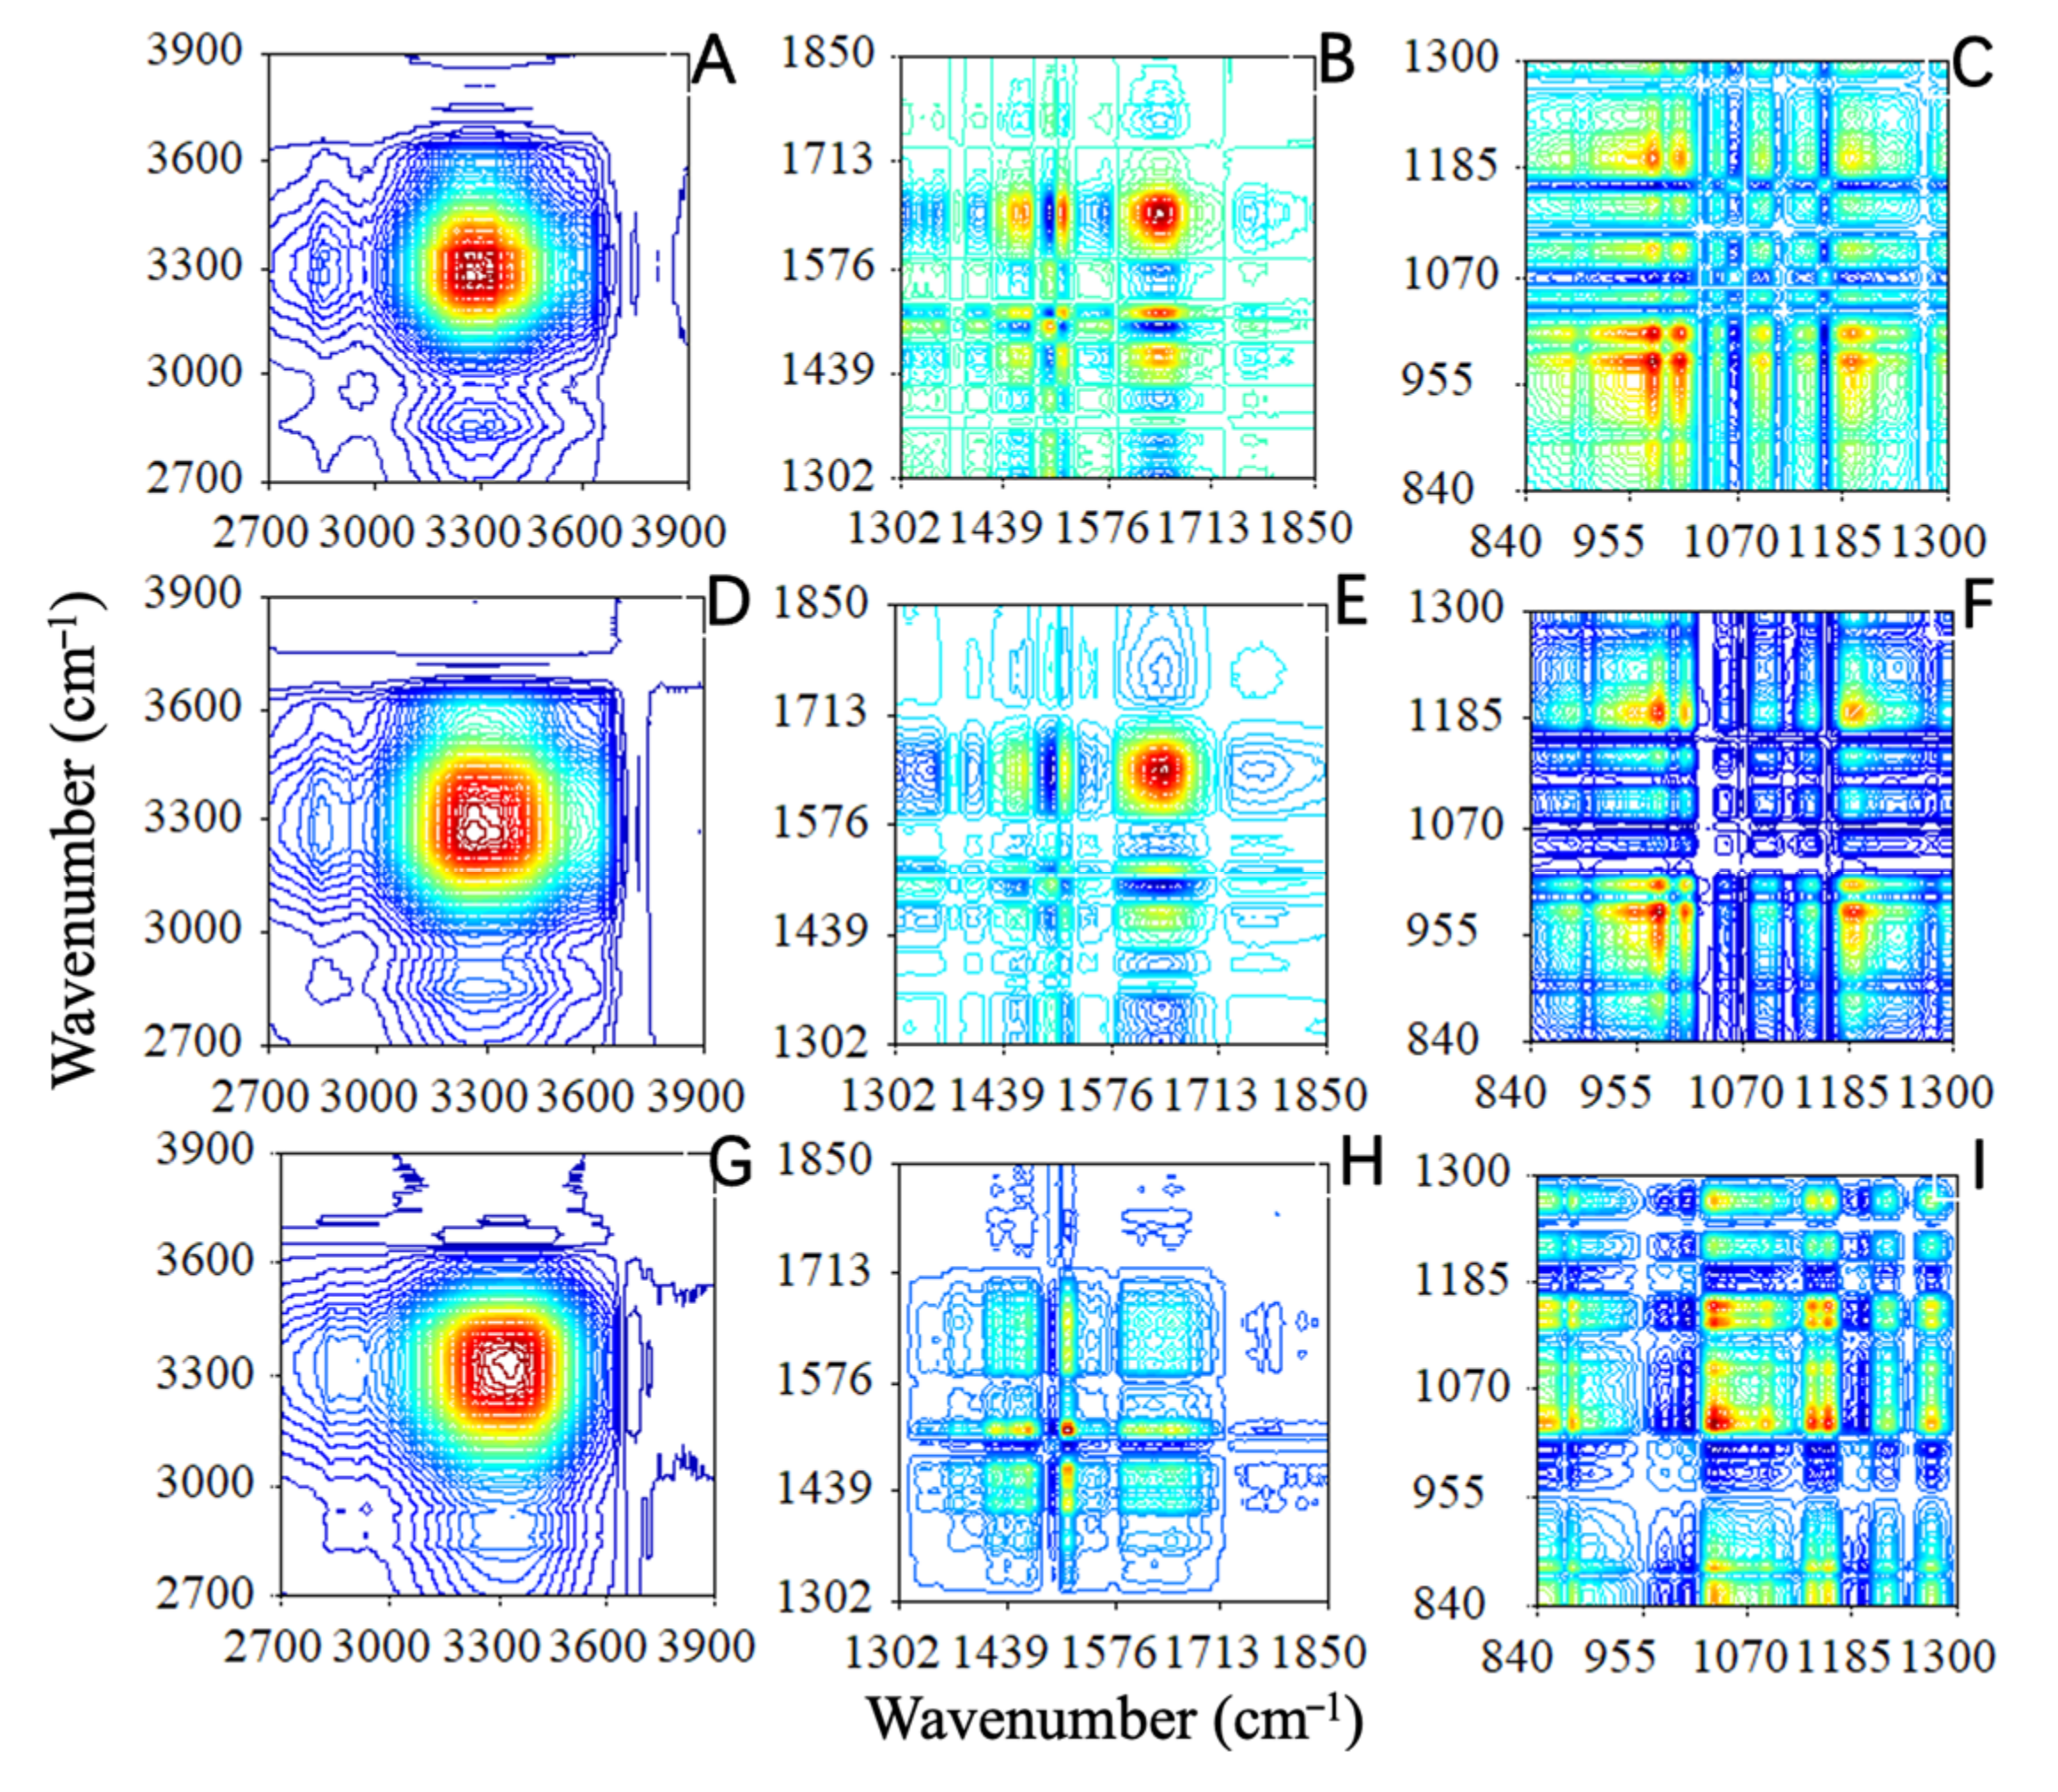
3.3. Chemical Differences of Waterlogged Archaeological Wood in Different Regions

The FTIR spectra of WFD, WFS, and FR are shown in Figure 5. In the WFD (blue dashed line) and WFS (yellow dotted line) spectra, the characteristic band at 1738 cm−1 is indicative of the C=O stretching of hemicellulose, while the characteristic peak at 1318 cm−1 ascribed to the CH2 out-of-plane vibration of cellulose [23] almost disappeared for the waterlogged wood. The assignments of the main peaks in the FTIR spectra of wood are given in Table 2. The intensity of the absorption peaks at 1373—corresponding to the C–H bending in polysaccharides and suggested to be a main factor of the deterioration of hemicellulose for decayed wood [15,64]—in the spectrum of WFS was higher than that of the same peaks in the spectrum of WFD, which meant that WFD has a severer degradation degree compared to WFS. Moreover, the peak at 1158 cm−1 in the spectrum of WFD blueshifted slightly compared to that of the WFS. Although the FTIR spectra of WFD and WFS are similar, their correlation coefficients compared with recent fir are different: 0.9638 and 0.8264 (Table 3), respectively. The differences may be a result of the complexity of the ‘fingerprint’ region at 1800–897 cm−1, where different vibrations of various wood components contribute to many overlapping bands, whereas the significantly different coefficients of WFD and WFS indicate uneven degradation between the WFD and WFS regions, and WFD degraded more severely than WFS, according to the above results.
2D COS-IR spectroscopy has a higher spectral resolution for the discrimination of complex mixtures and gains new information which could not be acquired through conventional IR spectroscopy. 2D COS-IR spectroscopy was therefore applied to better evaluate the degradation inhomogeneity between WFD and WFS. The 2D COS-IR spectra provide helpful information concerning the structure of molecules and interactions among functional groups in the contour maps within the 2700–3900, 1300–1850, and 840–1300 cm−1 regions (Figure 6). In the 2D COS-IR spectra, regions that exhibit higher changes in peak intensity show stronger autopeaks than areas that remain constant [34,66,67]. The various chemical components of waterlogged archaeological wood may react differently to temperature perturbations; thus, differences in the number, position, and intensity of autopeaks among WFD, WFS, and FR reflect the deterioration state of the waterlogged archaeological wood.
Table 4 shows the position and intensity of the autopeaks in the 2D COS-IR spectra of WFD, WFS, and FR from 900 to 3900 cm−1.
Within the range of 2700 to 3900 cm−1, three autopeaks at Φ (3272, 3272) > 0, Φ (3327, 3327) > 0, and Φ (3346, 3346) > 0 and a pair of crosspeaks at Φ (3300, 2856) < 0 are observed in the range of 2700 to 3900 cm−1 (Figure 6A,D and Table 4). In the WFD spectra (Figure 6G), an autopeak at Φ (3346, 3346) > 0 is observed, implying that the bands at approximately 3272 and 3327 cm−1 increase with the degree of decay in WFS and WFD. Accordingly, the O6–H6···O3 intermolecular interaction in cellulose Iβ in WFD disappears while the O5–H5···O3 intramolecular interaction in cellulose occurs (Table 2) [52].
Within the range of 1300–1850 cm−1, the intensity of the autopeaks in the spectrum of waterlogged archaeological wood differed from that of recent wood. The intensities of the autopeaks at approximately Φ (1464, 1464), assigned to the in-plane CH deformation of lignin and hemicellulose, decreased from ‘middle’ to ‘visible’ in the spectra of FR, WFS, and WFD. This may result from the degradation of hemicellulose in waterlogged wood, as the degree of decay of WFD is more severe than that of WFS. The intensity of the autopeak at Φ (1510, 1510), arising from the vibration of the aromatic skeleton of lignin, became more sensitive to the degree of decay, likely because the degradation of carbohydrate components, mainly hemicellulose, is more pronounced than that of lignin, while the cleavage of β-O-4 linkages in lignin-carbohydrate complexes of WFD is more prominent than that of those linkages in the same complexes of WFS.
The 2D COS-IR spectra of the WFD, WFS, and FR show autopeaks between 840 and 1300 cm−1 (Figure 6C,F,I). The sensitivities of waterlogged wood and reference wood to thermal perturbations differ. Waterlogged wood becomes increasingly sensitive to thermal perturbation as it becomes more and more degraded. WFD is more sensitive to thermal perturbation than WFS. The peaks in the region at approximately 1000–1200 cm−1 mainly arise from the C–O stretching vibration of carbohydrates [68], which shows that holocellulose degradation is more pronounced in WFD than it is in WFS.
Waterlogged wood that is moderately decayed showed significant but non-uniform degradation, even in samples selected from visually sound regions of the same waterlogged wood. The degradation of waterlogged woods results from the almost complete elimination of acetyl side chains from the hemicelluloses in the wood [53]. The O6–H6···O3 intermolecular interaction in the cellulose was not observed in samples from severely decayed regions; however, this interaction was found in samples from the sound region of waterlogged wood. In addition, the presence of lignin-carbohydrate complexes reflected the partial depletion of the β-O-4 link and confirmed the inhomogeneous degradation of waterlogged wood from a chemical perspective. The hygroscopic differences between samples obtained from different regions in the same block of waterlogged wood were related to the chemical difference caused by the uneven degradation of wood cell wall components throughout the block [69], as demonstrated by the increased number of lignin-related groups and a corresponding reduction in the number of carbohydrate-related groups (Figure 5 and Figure 6). The difference in hysteresis between the severely decayed and less decayed regions of the same plank from the shipwreck may be the result of alterations in the availability of sorption sites, the degree of aggregation, swelling, shrinking, or the wettability of submicroscopic capillaries within the cell wall [15,60].

4. Conclusions

This study introduced two techniques, i.e., simultaneous DVS and 2D correlation IR spectroscopy, for assessing the degradation of waterlogged wood. SDVS revealed that the degree of decay of the WFD region was higher than that of the WFS region, despite the visual similarity of the two samples. The non-uniform degradation of the shipwreck wood, with different hygroscopic results, was obtained even from the same plank, which confirmed the degradation inhomogeneity in a hygroscopical way. FTIR and 2D COS-IR spectroscopy showed the intermolecular changes in cellulose, an increase in the number of lignin-related groups, and a reduction in the number of carbohydrate-related groups, which demonstrated the causes of these hygroscopic differences in samples from different regions of the same waterlogged archaeological wood. The suitability of SDVS and 2D COS-IR spectroscopy was verified through evaluating the inhomogeneous degradation of waterlogged wood by its hygroscopic properties and chemical structure.
Simultaneous DVS is useful for the degradation evaluation of the hygroscopicity of waterlogged wood by measuring up to 23 samples simultaneously, which greatly improves the test efficiency of cultural heritage research. 2D COS-IR spectroscopy can provide conservation researchers with a new way to obtain and interpret conventional IR data through enhancing the spectral resolution by spreading peaks over the second dimension. Further experiments aiming to clarify the relationship between the hygroscopicity and chemical properties will be continued to enrich the scientific cognition of waterlogged wood and provide basic data for the further protection of waterlogged shipwreck objects.

Author Contributions

Conceptualisation, L.H. and G.X.; methodology, L.H. and H.G.; software, L.H., S.S. and F.M.; validation, L.H., G.X. and H.G.; formal analysis, L.H.; investigation, L.H.; resources, G.L., X.T. and G.X.; data curation, L.H., F.M. and S.S.; writing—original draft preparation, L.H.; writing—review and editing, L.H., Y.Y., H.G. and G.X.; visualisation, L.H.; supervision, X.H., H.G. and G.X.; project administration, L.H., H.G. and G.X.; funding acquisition, L.H., G.X. and L.H. All authors have read and agreed to the published version of the manuscript.

Funding

This research was funded by the National Key Research and Development Program of China (Grant Nos. 2020YFC1521801, 2020YFC1521804), the China Postdoctoral Science Foundation (Grant No. 2020M680337), and fundamental research funds for the central universities (University of Science and Technology Beijing) (Grant No. FRF-TP-20-102A1).

Data Availability Statement

The data presented in this study are available on request from the corresponding author.

Acknowledgments

The authors thank Xiaomei Jiang and Yonggang Zhang from the Chinese Academy of Forestry for the wood identification support.

Conflicts of Interest

The authors declare no conflict of interest.

References

  1. Broda, M.; Hill, C.A.S. Conservation of Waterlogged Wood—Past, Present and Future Perspectives. Forests 2021, 12, 1193. [Google Scholar] [CrossRef]
  2. Håfors, B. Conservation of the Wood of the Swedish Warship Vasa of AD 1628. Evaluation of Polyethylene Glycol Conservation Programmes; Department of Conservation, Gothenburg University: Gothenburg, Sweden, 2010. [Google Scholar]
  3. Han, L.Y.; Guo, J.; Wang, K.; Gronquist, P.; Li, R.; Tian, X.L.; Yin, Y.F. Hygroscopicity of Waterlogged Archaeological Wood from Xiaobaijiao No.1 Shipwreck Related to Its Deterioration State. Polymers 2020, 12, 834. [Google Scholar] [CrossRef] [PubMed] [Green Version]
  4. Capretti, C.; Macchioni, N.; Pizzo, B.; Galotta, G.; Giachi, G.; Giampaola, D. The characterization of waterlogged archaeological wood: The three Roman ships found in Naples (Italy). Archaeometry 2008, 50, 855–876. [Google Scholar] [CrossRef]
  5. Gregory, D.; Jensen, P.; Strætkvern, K. Conservation and in situ preservation of wooden shipwrecks from marine environments. J. Cult. Herit. 2012, 13, S139–S148. [Google Scholar] [CrossRef]
  6. Wagner, L.; Almkvist, G.; Bader, T.K.; Bjurhager, I.; Rautkari, L.; Gamstedt, E.K. The influence of chemical degradation and polyethylene glycol on moisture-dependent cell wall properties of archeological wooden objects: A case study of the Vasa shipwreck. Wood Sci. Technol. 2016, 50, 1103–1123. [Google Scholar] [CrossRef]
  7. Pedersen, N.B.; Gierlinger, N.; Thygesen, L.G. Bacterial and abiotic decay in waterlogged archaeological Picea abies (L.) Karst studied by confocal Raman imaging and ATR-FTIR spectroscopy. Holzforschung 2015, 69, 103–112. [Google Scholar] [CrossRef]
  8. Hocker, E.; Almkvist, G.; Sahlstedt, M. The Vasa experience with polyethylene glycol: A conservator’s perspective. J. Cult. Herit. 2012, 13, S175–S182. [Google Scholar] [CrossRef]
  9. Li, R.; Guo, J.; Macchioni, N.; Pizzo, B.; Xi, G.; Tian, X.; Chen, J.; Sun, J.; Jiang, X.; Cao, J.; et al. Characterisation of waterlogged archaeological wood from Nanhai No. 1 shipwreck by multidisciplinary diagnostic methods. J. Cult. Herit. 2022, 56, 25–35. [Google Scholar] [CrossRef]
  10. Macchioni, N.; Capretti, C.; Sozzi, L.; Pizzo, B. Grading the decay of waterlogged archaeological wood according to anatomical characterisation. The case of the Fiave site (N-E Italy). Int. Biodeterior. Biodegrad. 2013, 84, 54–64. [Google Scholar] [CrossRef]
  11. Jensen, P.; Gregory, D.J. Selected physical parameters to characterize the state of preservation of waterlogged archaeological wood: A practical guide for their determination. J. Archaeol. Sci. 2006, 33, 551–559. [Google Scholar] [CrossRef]
  12. Wu, M.; Han, X.; Qin, Z.; Zhang, Z.; Xi, G.; Han, L. A Quasi-Nondestructive Evaluation Method for Physical-Mechanical Properties of Fragile Archaeological Wood with TMA: A Case Study of an 800-Year-Old Shipwreck. Forests 2022, 13, 38. [Google Scholar] [CrossRef]
  13. Macchioni, N.; Pecoraro, E.; Pizzo, B. The measurement of maximum water content (MWC) on waterlogged archaeological wood: A comparison between three different methodologies. J. Cult. Herit. 2018, 30, 51–56. [Google Scholar] [CrossRef]
  14. Broda, M.; Curling, S.F.; Frankowski, M. The effect of the drying method on the cell wall structure and sorption properties of waterlogged archaeological wood. Wood Sci. Technol. 2021, 55, 971–989. [Google Scholar] [CrossRef]
  15. Guo, J.; Zhou, H.; Stevanic, J.S.; Dong, M.; Yu, M.; Salmén, L.; Yin, Y. Effects of ageing on the cell wall and its hygroscopicity of wood in ancient timber construction. Wood Sci. Technol. 2017, 52, 131–147. [Google Scholar] [CrossRef]
  16. Hill, C.A.S.; Norton, A.J.; Newman, G. The water vapour sorption properties of Sitka spruce determined using a dynamic vapour sorption apparatus. Wood Sci. Technol. 2010, 44, 497–514. [Google Scholar] [CrossRef]
  17. Zhan, T.; Liu, Z.; Peng, H.; Jiang, J.; Zhang, Y.; Lyu, J. Meta-analysis of anti-swelling efficiency (ASE) of heat-treated wood. Eur. J. Wood Wood Prod. 2021, 79, 1031–1034. [Google Scholar] [CrossRef]
  18. Peng, H.; Zhan, T.; Jiang, J.; Zhang, Y.; Cao, J.; Lu, J. Comparison of the time-moisture and time-temperature equivalences in the creep properties of Chinese fir. Wood Mater. Sci. Eng. 2021, 17, 1–7. [Google Scholar] [CrossRef]
  19. Nopens, M.; Riegler, M.; Hansmann, C.; Krause, A. Simultaneous change of wood mass and dimension caused by moisture dynamics. Sci. Rep. 2019, 9, 10309. [Google Scholar] [CrossRef] [Green Version]
  20. Yang, T.; Cao, J.; Mei, C.; Ma, E. Effects of chlorite delignification on dynamic mechanical performances and dynamic sorption behavior of wood. Cellulose 2021, 28, 9461–9474. [Google Scholar] [CrossRef]
  21. Broda, M.; Popescu, C.M. Natural decay of archaeological oak wood versus artificial degradation processes—An FT-IR spectroscopy and X-ray diffraction study. Spectrochim. Acta Part A Mol. Biomol. Spectrosc. 2019, 209, 280–287. [Google Scholar] [CrossRef]
  22. Singh, A.P.; Kim, Y.S.; Chavan, R.R. Advances in Understanding Microbial Deterioration of Buried and Waterlogged Archaeological Woods: A Review. Forests 2022, 13, 394. [Google Scholar] [CrossRef]
  23. Han, L.; Tian, X.; Keplinger, T.; Zhou, H.; Li, R.; Svedstrom, K.; Burgert, I.; Yin, Y.; Guo, J. Even Visually Intact Cell Walls in Waterlogged Archaeological Wood Are Chemically Deteriorated and Mechanically Fragile: A Case of a 170 Year-Old Shipwreck. Molecules 2020, 25, 1113. [Google Scholar] [CrossRef] [PubMed] [Green Version]
  24. Han, L.; Wang, K.; Wang, W.; Guo, J.; Zhou, H. Nanomechanical and Topochemical Changes in Elm Wood from Ancient Timber Constructions in Relation to Natural Aging. Materials 2019, 12, 786. [Google Scholar] [CrossRef] [PubMed] [Green Version]
  25. Zhu, Y.; Li, W.; Meng, D.; Li, X.; Goodell, B. Non-enzymatic modification of the crystalline structure and chemistry of Masson pine in brown-rot decay. Carbohydr. Polym. 2022, 286, 119242. [Google Scholar] [CrossRef] [PubMed]
  26. Macchioni, N.; Pizzo, B.; Bernabei, M.; Visintin, G. Dating trials of wooden historic artefacts through FT-IR spectroscopy. J. Cult. Herit. 2019, 43, 303–310. [Google Scholar] [CrossRef]
  27. Kim, Y. Micromorphology of Degraded Archaeological Pine Wood in Waterlogged Situations. Mater. Org. 1989, 24, 271–286. [Google Scholar]
  28. Cha, M.Y.; Lee, K.H.; Kim, Y.S. Micromorphological and chemical aspects of archaeological bamboos under long-term waterlogged condition. Int. Biodeterior. Biodegrad. 2014, 86, 115–121. [Google Scholar] [CrossRef]
  29. Han, L.; Guo, J.; Tian, X.; Jiang, X.; Yin, Y. Evaluation of PEG and sugars consolidated fragile waterlogged archaeological wood using nanoindentation and ATR-FTIR imaging. Int. Biodeterior. Biodegrad. 2022, 170, 105390. [Google Scholar] [CrossRef]
  30. Yi, Y.H.; Kim, S.C.; Park, Y.M.; Kim, K.S. Experiment on Conservation Treatment Method (PEG, Sucros and Lactitol) and Degree of State-change with RH of Waterlogged Archaeological Wood. Conserv. Sci. Mus. 2000, 2, 19–25. [Google Scholar]
  31. Broda, M.; Dabek, I.; Dutkiewicz, A.; Dutkiewicz, M.; Popescu, C.M.; Mazela, B.; Maciejewski, H. Organosilicons of different molecular size and chemical structure as consolidants for waterlogged archaeological wood—A new reversible and retreatable method. Sci. Rep. 2020, 10, 2188. [Google Scholar] [CrossRef] [Green Version]
  32. Ma, F.; Huang, A.-M.; Zhang, S.-F.; Zhou, Q.; Zhang, Q.-H. Identification of three Diospysros species using FT-IR and 2DCOS-IR. J. Mol. Struct. 2020, 1220, 128709. [Google Scholar] [CrossRef]
  33. Noda, I. Two-dimensional infrared spectroscopy. J. Am. Chem. Soc. 1989, 111, 8116–8118. [Google Scholar] [CrossRef]
  34. Noda, I. Generalized two-dimensional correlation method applicable to infrared, Raman, and other types of spectroscopy. Appl. Spectrosc. 1993, 47, 1329–1336. [Google Scholar] [CrossRef]
  35. Park, Y.; Jin, S.; Noda, I.; Jung, Y.M. Continuing progress in the field of two-dimensional correlation spectroscopy (2D-COS): Part III. Versatile applications. Spectrochim. Acta Part A Mol. Biomol. Spectrosc. 2023, 284, 121636. [Google Scholar] [CrossRef]
  36. Wang, F.; Huang, A.; Yin, X.; Wang, W.; Chen, J. Multilevel profiling and identification of Dalbergia odorifera and Dalbergia stevensonii by FTIR, NMR and GC/MS. Chin. Chem. Lett. 2018, 29, 1395–1398. [Google Scholar] [CrossRef]
  37. Zhang, F.-D.; Xu, C.-H.; Li, M.-Y.; Chen, X.-D.; Zhou, Q.; Huang, A.-M. Identification of Dalbergia cochinchinensis (CITES Appendix II) from other three Dalbergia species using FT-IR and 2D correlation IR spectroscopy. Wood Sci. Technol. 2016, 50, 693–704. [Google Scholar] [CrossRef]
  38. Huang, A.; Zhou, Q.; Liu, J.; Fei, B.; Sun, S. Distinction of three wood species by Fourier transform infrared spectroscopy and two-dimensional correlation IR spectroscopy. J. Mol. Struct. 2008, 883–884, 160–166. [Google Scholar] [CrossRef]
  39. Li, M.-Y.; Cheng, S.-C.; Li, D.; Wang, S.-N.; Huang, A.-M.; Sun, S.-Q. Structural characterization of steam-heat treated Tectona grandis wood analyzed by FT-IR and 2D-IR correlation spectroscopy. Chin. Chem. Lett. 2015, 26, 221–225. [Google Scholar] [CrossRef]
  40. Popescu, C.-M.; Popescu, M.-C.; Vasile, C. Characterization of fungal degraded lime wood by FT-IR and 2D IR correlation spectroscopy. Microchem. J. 2010, 95, 377–387. [Google Scholar] [CrossRef]
  41. Liu, Z.; Fu, T.; Hu, C.; Shen, D.; Macchioni, N.; Sozzi, L.; Chen, Y.; Liu, J.; Tian, X.; Ge, Q.; et al. Microbial community analysis and biodeterioration of waterlogged archaeological wood from the Nanhai No. 1 shipwreck during storage. Sci. Rep. 2018, 8, 7170. [Google Scholar] [CrossRef] [Green Version]
  42. Yang, Z.; Deng, Q.; Liu, M. Ancient Shipwrecks off the Coast of Zhangzhou, Fujian. In Shipwreck Archaeology in China Sea; Springer: Berlin/Heidelberg, Germany, 2022; pp. 135–161. [Google Scholar]
  43. Xia, Y.; Chen, T.Y.; Wen, J.L.; Zhao, Y.L.; Qiu, J.; Sun, R.C. Multi-analysis of chemical transformations of lignin macromolecules from waterlogged archaeological wood. Int. J. Biol. Macromol. 2018, 109, 407–416. [Google Scholar] [CrossRef] [PubMed]
  44. Richter, H.G.; Grosser, D.; Heinz, I.; Gasson, P. IAWA list of microscopic features for softwood identification. IAWA J. 2004, 25, 1–70. [Google Scholar] [CrossRef]
  45. Pizzo, B.; Macchioni, N.; Capretti, C.; Pecoraro, E.; Sozzi, L.; Fiorentino, L. Assessing the wood compressive strength in pile foundations in relation to diagnostic analysis: The example of the Church of Santa Maria Maggiore, Venice. Constr. Build. Mater. 2016, 114, 470–480. [Google Scholar] [CrossRef]
  46. Macchioni, N.; Pizzo, B.; Capretti, C.; Giachi, G. How an integrated diagnostic approach can help in a correct evaluation of the state of preservation of waterlogged archaeological wooden artefacts. J. Archaeol. Sci. 2012, 39, 3255–3263. [Google Scholar] [CrossRef]
  47. Macchioni, N. Physical characteristics of the wood from the excavations of the ancient port of Pisa. J. Cult. Herit. 2003, 4, 85–89. [Google Scholar] [CrossRef]
  48. Fredriksson, M.; Thybring, E.E. Scanning or desorption isotherms? Characterising sorption hysteresis of wood. Cellulose 2018, 25, 4477–4485. [Google Scholar] [CrossRef] [Green Version]
  49. Broda, M.; Spear, M.J.; Curling, S.F.; Dimitriou, A. Effects of Biological and Chemical Degradation on the Properties of Scots Pine—Part II: Wood-Moisture Relations and Viscoelastic Behaviour. Forests 2022, 13, 1390. [Google Scholar] [CrossRef]
  50. Yuan, J.; Chen, Q.; Fei, B. Different characteristics in the hygroscopicity of the graded hierarchical bamboo structure. Ind. Crops Prod. 2022, 176, 114333. [Google Scholar] [CrossRef]
  51. Ma, F.; Huang, A.-m. Rapid identification and quantification three chicken-wing woods of Millettia leucantha, Millettia laurentii and Cassia siamea by FT-IR and 2DCOS-IR. J. Mol. Struct. 2018, 1166, 164–168. [Google Scholar] [CrossRef]
  52. Popescu, C.-M.; Popescu, M.-C.; Vasile, C. Structural analysis of photodegraded lime wood by means of FT-IR and 2D IR correlation spectroscopy. Int. J. Biol. Macromol. 2011, 48, 667–675. [Google Scholar] [CrossRef]
  53. Guo, J.; Xiao, L.; Han, L.; Wu, H.; Yang, T.; Wu, S.; Yin, Y.; Donaldson, L.A. Deterioration of the cell wall in waterlogged wooden archeological artifacts, 2400 years old. IAWA J. 2019, 40, 820–844. [Google Scholar] [CrossRef]
  54. Brorson, C.B.; Christenson, A. The conservation of waterlogged wood in the National Museum of Denmark. Study Conserv. 1970, 15, 27–44. [Google Scholar]
  55. Thommes, M.; Kaneko, K.; Neimark, A.V.; Olivier, J.P.; Rodriguez-Reinoso, F.; Rouquerol, J.; Sing, K.S. Physisorption of gases, with special reference to the evaluation of surface area and pore size distribution (IUPAC Technical Report). Pure Appl. Chem. 2015, 87, 1051–1069. [Google Scholar] [CrossRef]
  56. Majka, J.; Babiński, L.; Olek, W. Sorption isotherms of waterlogged subfossil Scots pine wood impregnated with a lactitol and trehalose mixture. Holzforschung 2017, 71, 813–819. [Google Scholar] [CrossRef]
  57. Popescu, C.-M.; Hill, C.A.; Kennedy, C. Variation in the sorption properties of historic parchment evaluated by dynamic water vapour sorption. J. Cult. Herit. 2016, 17, 87–94. [Google Scholar] [CrossRef]
  58. Popescu, C.-M.; Hill, C.A.S. The water vapour adsorption–desorption behaviour of naturally aged Tilia cordata Mill. wood. Polym. Degrad. Stab. 2013, 98, 1804–1813. [Google Scholar] [CrossRef]
  59. Olek, W.; Majka, J.; Stempin, A.; Sikora, M.; Zborowska, M. Hygroscopic properties of PEG treated archaeological wood from the rampart of the 10th century stronghold as exposed in the Archaeological Reserve Genius loci in Poznań (Poland). J. Cult. Herit. 2016, 18, 299–305. [Google Scholar] [CrossRef]
  60. Chen, C.-M.; Wangaard, F.F. Wettability and the hysteresis effect in the sorption of water vapor by wood. Wood Sci. Technol. 1968, 2, 177–187. [Google Scholar] [CrossRef]
  61. Esteban, L.; De Palacios, P.; Fernández, F.G.; García-Amorena, I. Effects of burial of Quercus spp. wood aged 5910 ± 250 BP on sorption and thermodynamic properties. Int. Biodeterior. Biodegrad. 2010, 64, 371–377. [Google Scholar] [CrossRef]
  62. Zhang, X.; Li, J.; Yu, Y.; Wang, H. Investigating the water vapor sorption behavior of bamboo with two sorption models. J. Mater. Sci. 2018, 53, 8241–8249. [Google Scholar] [CrossRef]
  63. Fang, F.; Yang, T.; Liu, L.; Pan, J.; Xiao, X. Summary of Environmental Influencing Factors and Preventive Control Measures of Waterlogged Wood Lacquerware in Each Stage. Jianghan Archaeol. 2019, S01, 76–80. (In Chinese) [Google Scholar]
  64. Wazny, J. The Present Classification of Wood Degradation Factors; IRG Secretariat: Orlando, FL, USA, 1993. [Google Scholar]
  65. Traore, M.; Kaal, J.; Martinez Cortizas, A. Application of FTIR spectroscopy to the characterization of archeological wood. Spectrochim. Acta A Mol. Biomol. Spectrosc. 2016, 153, 63–70. [Google Scholar] [CrossRef] [PubMed]
  66. Chen, N.D.; Chen, N.F.; Li, J.; Cao, C.Y.; Wang, J.-M. Rapid authentication of different ages of tissue-cultured and wild Dendrobium huoshanense as well as wild Dendrobium henanense using FTIR and 2D-COS IR. J. Mol. Struct. 2015, 1101, 101–108. [Google Scholar] [CrossRef]
  67. Noda, I. Two-dimensional infrared (2D IR) spectroscopy: Theory and applications. Appl. Spectrosc. 1990, 44, 550–561. [Google Scholar] [CrossRef]
  68. Jin, Z.; Cui, W.; Zhang, F.; Wang, F.; Cheng, S.; Fu, Y.; Huang, A. Rapid Identification for the Pterocarpus Bracelet by Three-Step Infrared Spectrum Method. Molecules 2022, 27, 4793. [Google Scholar] [CrossRef]
  69. Gilani, M.S.; Schwarze, F.W. Hygric properties of Norway spruce and sycamore after incubation with two white rot fungi. Holzforschung 2015, 69, 77–86. [Google Scholar] [CrossRef]
Figure 1. Morphological structure of waterlogged archaeological fir wood. (A) Transverse section (arrows display obvious decay patterns indicating decayed fibre cell walls); (B) radial section; and (C) tangential section. Scale bar = 50 μm.
Forests 14 00015 g001
Figure 2. Sorption isotherms of waterlogged archaeological wood and recent wood. (A) Adsorption and desorption isotherm, (B) adsorption isotherm, and (C) scanning desorption isotherm. FR: recent fir wood, WFS: waterlogged archaeological fir wood from a sound region, WFD: waterlogged archaeological fir wood from a decay region.
Forests 14 00015 g002
Figure 3. Sorption hysteresis of recent fir wood (FR), waterlogged archaeological fir wood from a sound region (WFS), and waterlogged archaeological fir wood from a decay region (WFD).
Forests 14 00015 g003
Figure 4. Water content obtained from the H–H model. (A) Histogram of monolayer moisture content. (B) Diagram of multilayer moisture content. FR: recent fir wood, WFS: waterlogged archaeological fir wood from a sound region, WFD: waterlogged archaeological fir wood from a decay region.
Forests 14 00015 g004
Figure 5. FTIR spectra of FR (reference fir sample, red line), WFS (visually sound waterlogged fir sample, yellow line), and WFD (visually degraded waterlogged fir sample, blue line).
Forests 14 00015 g005
Figure 6. Synchronous 2D COS-IR spectra of FR in the ranges of (A) 2700–3900 cm−1, (B) 1300–1850 cm−1, (C) 840–1300 cm−1; WFS spectra ((D) 2700–3900 cm−1, (E) 1300–1850 cm−1, (F) 840–1300 cm−1); and WFD spectra ((G) 2700–3900 cm−1, (H) 1300–1850 cm−1, (I) 840–1300 cm−1) (Red: positive, Φ > 0 ; Blue: negative, Φ < 0 ). FR: recent fir wood, WFS: waterlogged archaeological fir wood from a sound region, WFD: waterlogged archaeological fir wood from a decay region.
Forests 14 00015 g006
Table 1. Coefficients of the H–H model for WFD, WFS, and recent wood.
SampleH–H Model Parameters
k1k2wR2MhMs
FR6.710.799388.90.99973.86814.579
WFS8.830.852433.60.99983.64117.586
WFD8.350.878369.70.99974.24721.739
Note: EMC (g/g) is the equilibrium moisture content; RH (%) is the relative humidity; Mh is the monolayer moisture content (%); Ms is the multilayer moisture content (%); w is the molecular weight of wood at each adsorption site; the parameters k1 and k2 are the equilibrium constants of the sorption process [50]. FR: recent fir wood, WFS: waterlogged archaeological fir wood from a sound region, WFD: waterlogged archaeological fir wood from a decay region.
Table 2. Peak assignments for FTIR spectra of wood [9,15,23,52,65].
Peak Position (cm−1)Peak Assignment
3700~3100the hydroxyl stretching region
3346O5–H5···O3 intramolecular in cellulose
3272O6–H6···O3 intermolecular in cellulose Iβ
2905C–H asymmetric stretching in methylene groups
1738mainly assigned to the C=O stretch in acetyl groups of hemicellulose
1660the relative concentration of aromatic skeletal vibrations, together with the C=O stretch in the lignin
1510the aromatic skeletal vibration in the lignin
1464CH- deformation; asymmetric in the plane for lignin and hemicellulose
1426the CH2 scissoring in cellulose
1373the C–H bending in polysaccharides
1332the O–H in-plane bending of amorphous cellulose
1318the wagging (out of the plane) of the CH2 groups in crystalline cellulose
1268the aromatic C–O stretching vibrations of methoxyl and phenyl propane units in guaiacol rings of lignin
1231mainly assigned to the C–O stretching in the O=C–O group of side chains in hemicellulose
1220the aromatic C–O stretching vibrations in rings of lignin
1158the characteristic of the asymmetric bridge C–O–C stretch mode in polysaccharides
1060C–O stretching vibrations in cellulose and hemicelluloses
Table 3. Correlation coefficients of WFD and WFS compared with that of the reference wood between 1800 and 897 cm−1.
SampleCorrelation Coefficients
FR1.0000
WFS0.9638
WFD0.8264
Table 4. Autopeaks and their intensities Φ for FR, WFS, and WFD in 2D-COS-IR spectra.
Wavenumber/cm−1953977100510971165119012401301134814521464149715121646327233273346
FR+++++++++++++++++++++++++++++-
WFS++++++++++++++++++++++++-
WFD---+++-----+-+++--+++
Intensity of autopeaks: -, invisible; +, visible; ++, middle; +++, strong.
Disclaimer/Publisher’s Note: The statements, opinions and data contained in all publications are solely those of the individual author(s) and contributor(s) and not of MDPI and/or the editor(s). MDPI and/or the editor(s) disclaim responsibility for any injury to people or property resulting from any ideas, methods, instructions or products referred to in the content.

