Article

Mismatch between Annual Tree-Ring Width Growth and NDVI Index in Norway Spruce Stands of Central Europe

1
Faculty of Forestry and Wood Sciences, Czech University of Life Sciences Prague, Kamýcká 129, 165 00 Prague 6—Suchdol, Czech Republic
2
School of Agricultural, Forestry and Environmental Sciences, University of Basilicata, Viale dell’Ateneo Lucano 10, I-85100 Potenza, Italy
3
Faculty of Academy of Fine Arts, University of Florence, Via Ricasoli 66, I-50122 Florence, Italy
*
Author to whom correspondence should be addressed.
Forests 2022, 13(9), 1417; https://doi.org/10.3390/f13091417
Submission received: 21 July 2022 / Revised: 24 August 2022 / Accepted: 29 August 2022 / Published: 2 September 2022
(This article belongs to the Special Issue Forest Dieback and Tree Mortality Risks from Environmental Changes)

Abstract

:
Presently, the forests of one of the most economically important tree species in Europe—Norway spruce [Picea abies (L.) Karst.]—have been disrupted and are in rapid decline due to a combination of several natural factors: extreme drought, heatwaves, and secondary damage caused by bark beetle outbreaks. The vulnerability of these forests has increased considerably over the past decade, and remote sensing methods can theoretically improve the identification of endangered forest stands. The main objective was to determine the relationship between remotely sensed characteristics of vegetation (using the normalized difference vegetation index—NDVI) and annual tree-ring growth in 180 trees through precipitation and air temperature. The research was conducted at six research plots in lowland spruce forests (319–425 m a.s.l.) in the central Czech Republic. No significant correlation between NDVI and annual ring width was observed. The primary factor limiting radial growth was lack of precipitation in the growing season; subsequently, spruce trees reacted negatively to air temperatures. A higher correlation with NDVI was observed on sites susceptible to drought, but overall, NDVI and RWI did not show similarities. This result describes that NDVI is a poor indicator for identifying low radial growth in Norway spruce stands on non-native localities in the studied area.

1. Introduction

The effectiveness of meteorological satellite imagery in studying phenology and the hardiness of vegetation has been demonstrated [1]. Ecologists and researchers believe that satellite images have become a potential “gold mine” [2,3]. In the literature, several vegetation indices are reported and used to describe the properties of vegetation [4] and forests [5]. However, the normalized difference vegetation index (NDVI) remains the most commonly used indicator of vegetation greenness/vitality [1]. This index is used in many ecological studies [6], as well as in monitoring the effects of climatic change and in research on the global environment [7].
Originally, NDVI was used to develop maps, such as the pioneering mapping of vegetation distribution and productivity on the African continent [8]. This index allows us to distinguish between cultivated fields, non-forest, and dense forests [9]. However, when using NDVI, it is not possible to differentiate between forest types with different dominant tree species, for example, because some assembled species can generate similar NDVI values or similar NDVI temporal trends [6]. NDVI has also been used to evaluate negative impacts such as severe drought [10], fire [11], flood [12], and frost [13].
NDVI measures fractional absorbed photosynthetically active radiation [14] and exhibits a strong correlation with Leaf Area Index (LAI) [15] and green biomass [6]. This provides information for estimating the Net Primary Production [16]. However, the relationship between remotely sensed and dendrochronological measurements remains unclear [17]. There are other factors that influence this inequality in NDVI, such as the snow cover that covers the epigeal part of Norway spruce during the beginning of the vegetative period. During the beginning and the end of the growing season, solar radiation is the main factor driving the correlation between the earth’s surface temperature and NDVI [18].
The relationship between NDVI and tree ring growth varies during the growing season; generally, tree rings correlate with NDVI in June and July (there is no correlation between April and May or August–October). This suggests that climate in summer, as measured by its effect on NDVI, may be the main factor controlling ring width. Overall forest reflection depends on the species of trees and the location of sites, because the beginning of the growing season is related to latitude [19]. Analysis of the spatial correlation between NDVI anomaly and temperature or precipitation varies depending on type of territory cover and plant growth environment [20]. In relation to NDVI, copious research has demonstrated a positive relationship between coarse resolution NDVI and tree-ring width [21,22,23]. On the other hand, some authors found no significant correlation between NDVI and the radial growth of trees [17,24].
However, studies on the relationship between NDVI and tree radial growth are lacking in Central Europe, where forest ecosystems are rapidly declining under distress, especially in the case of the most widespread and economically important tree species—Norway spruce [Picea abies (L.) Karst.] [25,26]. Most studies are based on the correlation between the growth of Norway spruce and the thermo-pluviometric trend from meteorological stations [27,28,29]. However, no complex studies link the radial growth of this tree species with remote sensing data from second-generation satellites in Europe.
Norway spruce is a continental climate species. Its optimum conditions for growth are perhumid, where the annual temperature does not exceed 6 °C and annual precipitation exceeds 800 mm [30]. Spruce stands in Central Europe are dominant in mountain regions. However, the Czech Republic—as our site of interest—is among the countries with the heaviest disturbance to spruce, which in the past was due to the air pollution load in mountain areas, and now is because of the negative effect of climate change in the lowlands [31,32].
Currently, in the Czech Republic, spruce is suffering from ongoing climate change, especially via long-term drought, extreme climate events, and secondary effects of bark beetle outbreaks [25]. NDVI estimates photosynthetic activity, and therefore it is possible to measure the impact of biotic (such as bark beetle) and abiotic factors on vegetation. Stress produces a change in the spectral trait, as it affects the biophysical and biochemical properties of the tree. Hence, through the change in the fluorescence of chlorophyll, it is possible to infer the spectral change in the signal associated with the drought or bark beetle damage [33]. In the current context of global warming, an increase in atmospheric CO2 is connected with increased photosynthetic production and subsequent tree growth [34], but drought stress can neutralize this effect [35]. In Central Europe, the relationship between the climate and radial growth in spruce has been explored by many researchers [36,37,38,39], but the impact of climate change on spruce forests has not yet been sufficiently investigated [40].
The Czech Republic is known to be very affected by large-scale calamities. Therefore, spruce, which best represents the decay of forest stands in Central Europe, was chosen for this study. The purpose of this research was to evaluate the trend in NDVI in the endangered spruce lowland forests in the Czech Republic to search for a relationship with thermo-pluviometric data and associate the satellite values of NDVI with the growth of forests. Lowland spruce forests have similar coverage and the same specific composition; for this reason it is important to verify if the remote sensing data reflect the growth data. NDVI is a sensitive indicator of canopy and chemical content, or if there are other factors such as snow phenomena that cover the foliage and could influence the results, and which would require further studies.
Through satellite analysis for the six forest plots of Norway spruce trees, we delimited three further areas with different NDVI values to verify whether NDVI values reflect the values of tree growth or not. The main objective was to determine: (i) dynamics of radial growth in Norway spruce in lowland study areas highly endangered by droughts, (ii) the relationship between NDVI and tree-ring width, and (iii) the effect of climate factors (temperature and precipitation) on radial growth.

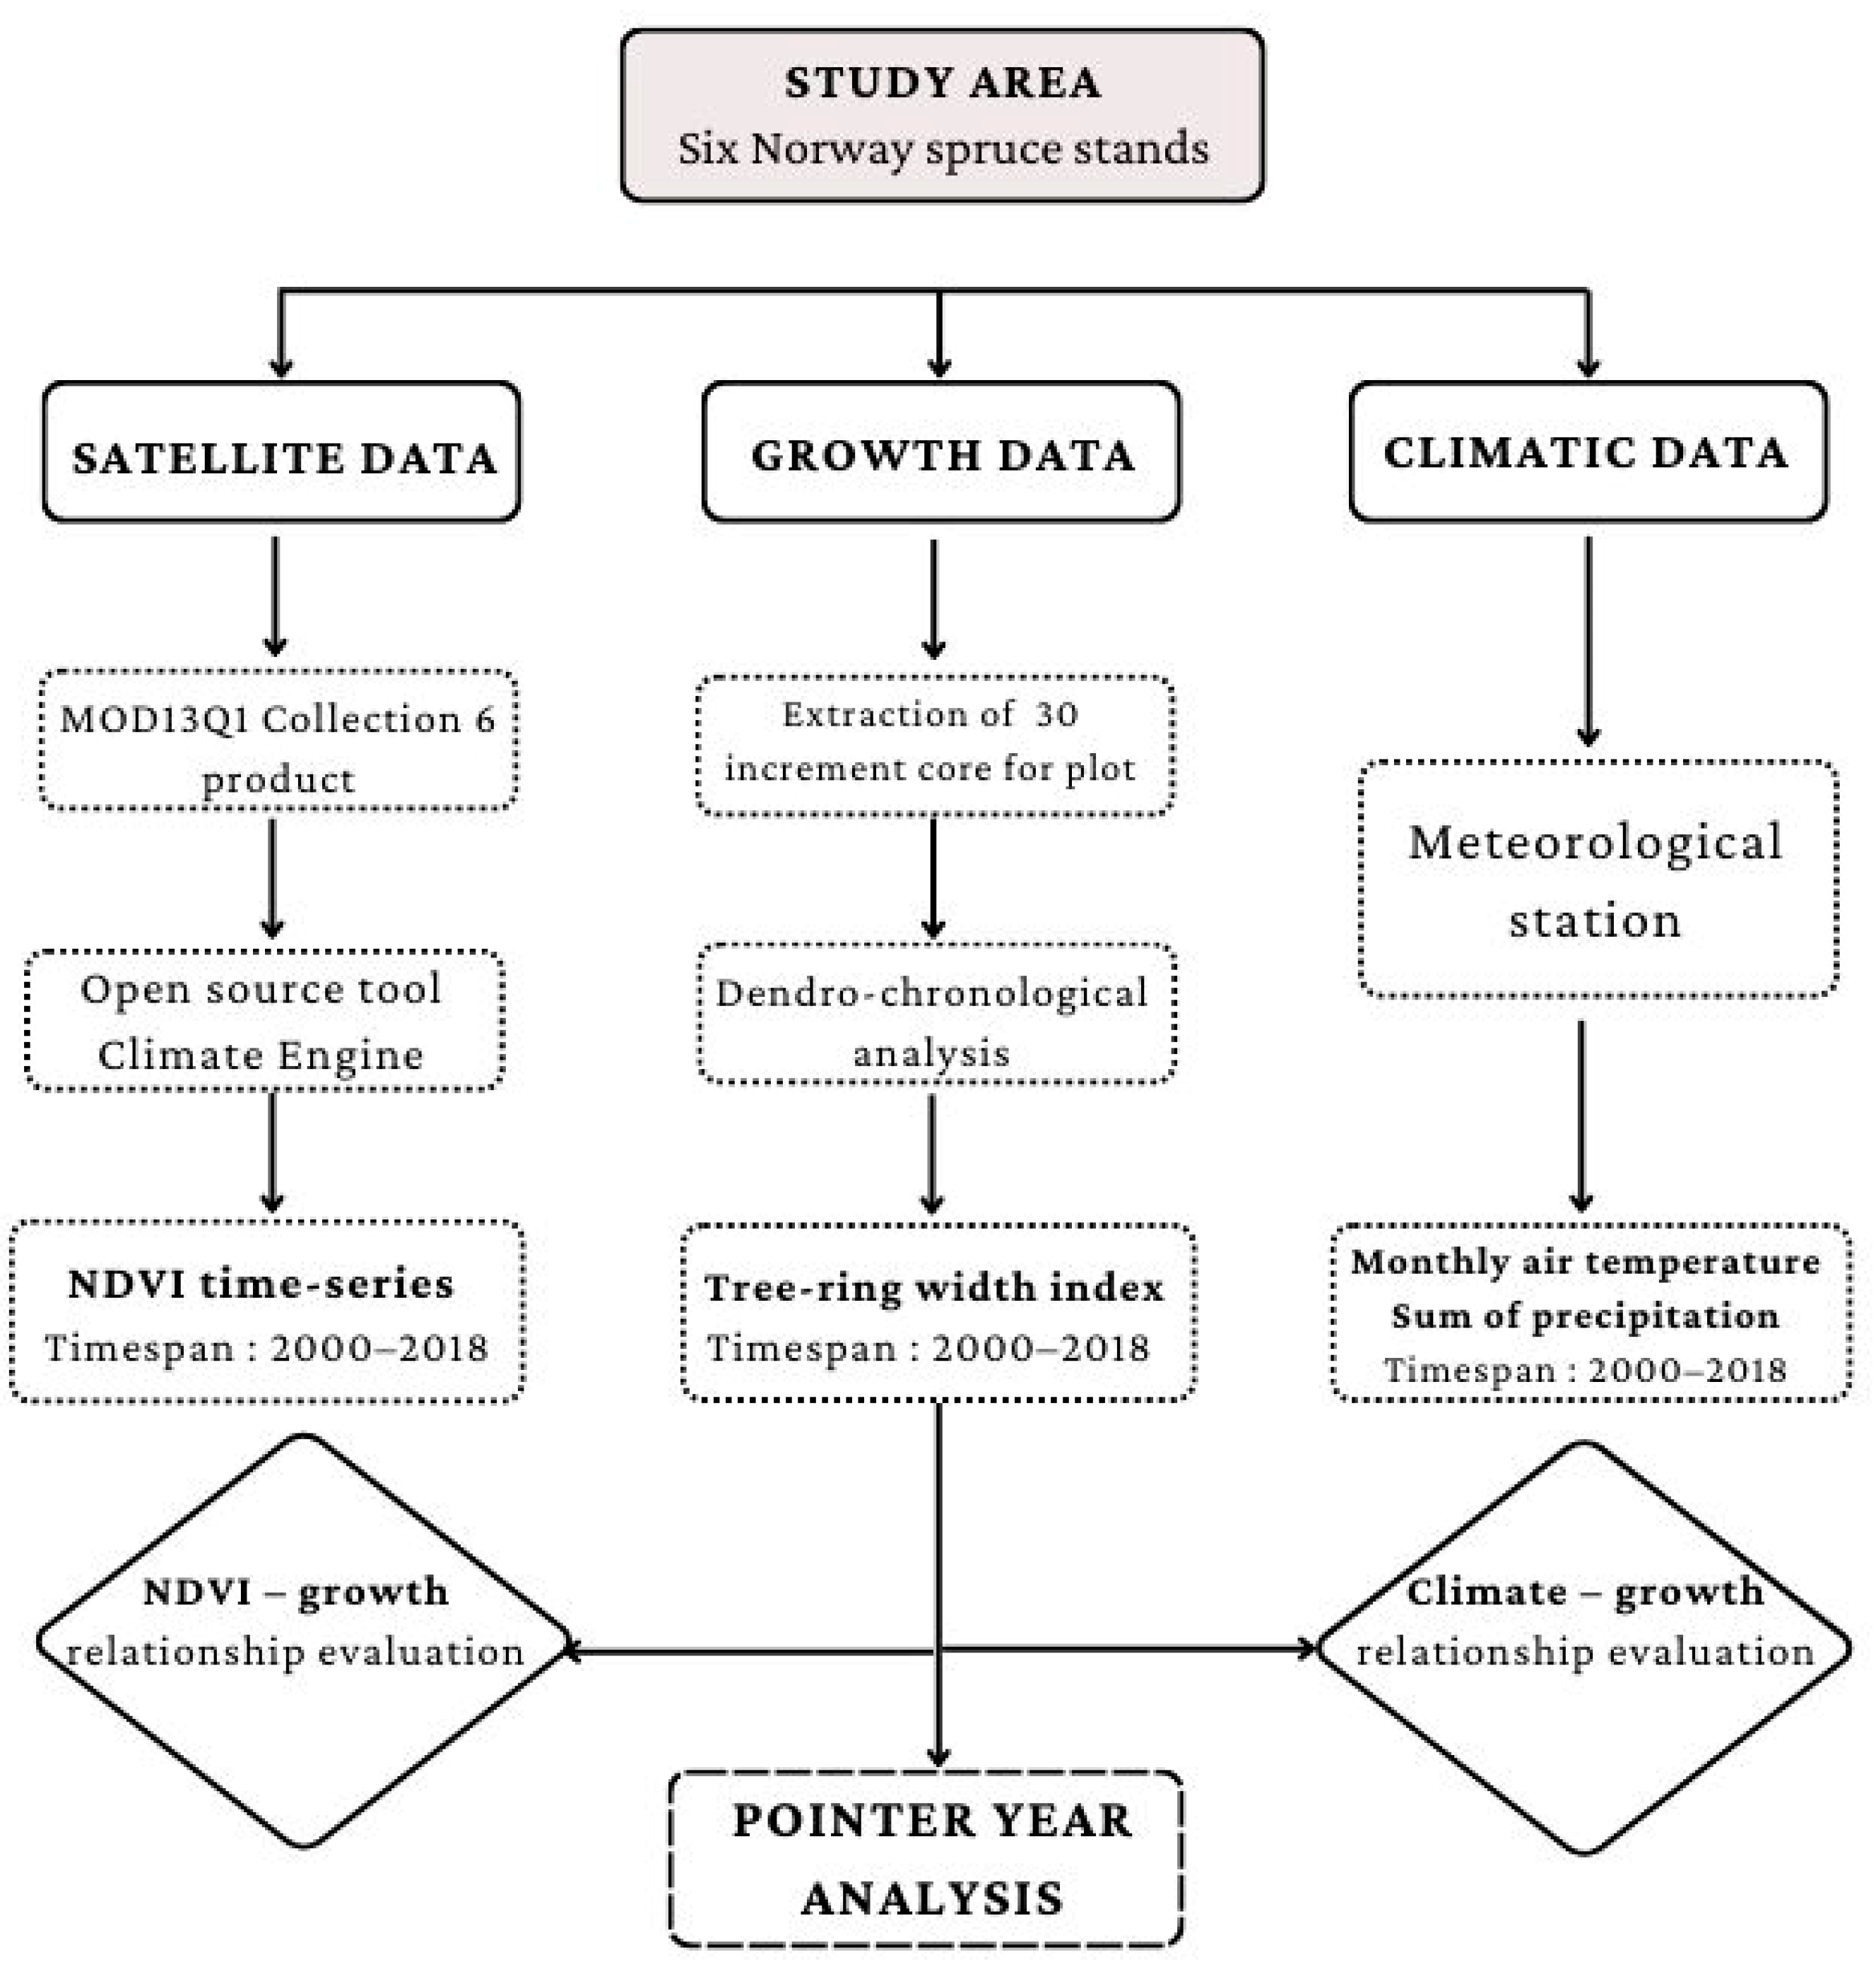
2. Material and Methods

2.1. Study Area

Data were provided from six forest complexes in three regions of the central part of the Czech Republic: Karlstejn (1–2), Cukrak (3–4), and Kostelec (5–6) (Figure 1). All forest complexes grow in lowland hilly areas because of the altitude range of 319–425 m a.s.l. (Table 1). The stands are situated on terrain with a 0–25° slope gradient and prevailing exposure to the northwest. The predominant soil type is cambisol [41], and various sites belong to the edaphic series of nutrient-rich and acidic sites [42]. The territory of the study site is characterized by typically warm, dry summers and cool, dry winters with a narrow annual temperature range (Cfb), according to the Köppen climate classification [43]. The precipitation maximum is from June to August and the minimum is in the winter months [44]. The maximum monthly temperature was reached in July and the minimum in January (with only one month below freezing; Figure 1). The average length of the growing season (Tmax ≥ 10 °C) is 158–165 days [45]. The average number of snow-covered days is 37, the number of ice days (Tmax < 0 °C) 24, the number of arctic days (Tmax < −10 °C) 1, and the number of tropical days (Tmax ≥ 30 °C) 12, according to the Czech Hydrometeorological Institute (CHMU). The age of forest stands ranged from 80 to 129 years (Table 1).
The first study site, “Karlstejn,” is located in the Karlštejn National Nature Reserve (NNR), approximately 22 km SW of Prague, which in turn falls within the Český Kras Protected Landscape Area (PLA) in Central Bohemia [46]. Gray and red limestone form the prevailing geological rock substrate. The average annual temperature range is between 8–9 °C and precipitation is approximately 560 mm [47] (Figure 2). Forest type classification is Fageto-Quercetum illimerosum trophicum and Querceto-Fagetum trophicum [42].
The second study site, “Cukrak,” consists of private forests. The site of interest is located approximately 18 km SW of Prague. The study plots lie on Kopanina hill with a peak altitude of 411 m a.s.l., which occupies the area between the Vltava and Berounka rivers. Thermo-pluviometric data are from the same meteorological station as the first location (Karlštejn) (Figure 2). Forest type classification is Querceto-Fagetum acidophilum and Querceto-Fagetum illimerosum acidophilum [42].
The third study site, “Kostelec,” is situated in the forest complexes managed by the Kostelec nad Černými lesy School Forest Enterprise (Czech University of Life Sciences Prague). The studied plot is located 25–30 km SE of Prague in the Voděradské bučiny NNR. The parent rock is formed by granite of different textures [45]. The climate is mildly warm and arid, the mean annual temperature is 8 °C, and the average annual precipitation is 655 mm [48] (Figure 2). The forest type classification is Querceto-Fagetum mesotrophicum and Querceto-Fagetum illimerosum acidophilum [42].
All research plots were established via artificial regeneration of Norway spruce. These spruce forest stands belong to economically managed forests, which are renewed by clear cutting and replantation.

2.2. Data Collection

We used an open-source tool, Climate Engine [49], to extract collections of MODIS (MOD13Q1 collection 6 product) NDVI time-series from 2000 to 2018 to discuss the possible imbalance in NDVI patterns between several sites. NDVI is calculated as the ratio between the difference and the sum of the reflectance radiated by the vegetation in the near-infrared waveband and the reflectance radiated in the visible red waveband, captured by satellite sensors [6,50].
NDVI is evaluated within the range from −1 to +1 [6]. Higher values correspond to a greater level of photosynthetic activity, with lower values corresponding to an absence of vegetation [14]. Climate Engine uses Google Earth Engine’s cloud-computing platform for on-demand processing of satellite data via a web browser. The MOD13Q1 product (250 × 250 m spatial resolution and 16-day compositing periods) is computed from atmospherically corrected bi-directional surface reflectance masked for water, clouds, heavy aerosols, and cloud shadows. It provides NDVI values on a per-pixel basis. Dataset pre-processing included clipping of images to the study areas and calculating the spatial mean of the NDVI pixel values. NDVI values were averaged for the entire growing season for both maximum and mean values. These NDVI values were used for comparison with annual tree ring growth.
For analysis of radial growth, dendrochronological core samples of 180 spruce trees were taken via Pressler borer (Haglöf, Sweden) for this study, i.e., 30 samples per research plot (Figure 3). At each study site, tree-ring samples were collected at breast height (1.3 m) perpendicular to the slope in spring 2019, following standard dendrochronological procedures [51]. One core each from the predominant and dominant trees, according to the Kraft classification [52], was randomly (RNG function, Excel, Microsoft, Redmond, Washington, United States, ) taken as the significant growth response (compared to subdominant and suppressed trees) [53]. Each core was dried, positioned, glued with vinyl-based glue, and mounted on wooden slats. Wooden slats were pressed with carpenter’s clamps to guarantee affixation and polished with progressively finer sandpaper. The cross-dating procedure was performed using CDendro software [54]. Processed sample cores were measured using the LINTAB measuring table (Rinntech) with an Olympus binocular magnifier. Samples were measured from bark to pith at a scale of 0.01 mm. Measured tree-ring data sets were processed with TSAP-Win software [55].
Climate data (monthly air temperatures and sum of precipitation) were taken from the CHMU Neumětely meteorological station (49°51′00′′ N, 14°02′24′′ E) for the study sites of Karlstejn and Cukrak. The meteorological station is located approximately 16 km from the Karlstejn research areas and approximately 25 km from the Cukrak research areas at an altitude of 322 m a.s.l. For the Kostelec research areas, climate data were taken from the nearest CHMU meteorological station, Ondřejov (49°54′36′′ N, 14°46′48′′ E). The meteorological station is situated approximately 7 km from the research areas at an altitude of 485 m a.s.l. The range of climate data surveyed was set to the period 2000–2018. The growing seasons for the Karlštejn and Cukrak localities are from April to October, and for the Kostelec location from May to October. In Kostelec, the temperature is different due to the geolocation and position of the study sites, and the territory forest area being greater than the forest area at Karlstejn and Cukrak. The mean annual temperature at Kostelec is lower than the average temperature at Karlstejn and Cukrak. The total annual precipitation at Karlstejn and Cukrak is lower than at Kostelec. Furthermore, the locations of Karlstejn and Cukrak are drier due to arid winds and soil characteristics. Therefore, the growing season in Kostelec starts later.

2.3. Data Analysis

Measured tree-ring width series were statistically verified using R software (Team R Core 2018) with the dplR package [56]. Tree-ring chronology data sets were detrended from every sample to remove the age trend. Negative exponential detrending was also used. This detrending removed the age-related trends and preserved low-frequency variations in climate [57].
Each final residual tree-ring series and the standardized one were analyzed against long-term climate series in order to identify the periods where climate significantly influenced radial growth. Climate–growth relationships would evaluate the drivers of growth in site-specific studies. Reverse evolutionary bootstrapped correlations would underscore the change in response functions along with long-term series analysis.
The dendrochronological indicators were calculated in R software with the dplR package instructions [58]. The expressed population signal (EPS) was calculated to indicate the reliability of the chronology [59]. The EPS dendrochronological data set results for every research plot were EPS > 0.85 in order to preserve a strong climatic signal in the used chronology. The signal-to-noise ratio (SNR) indicator was calculated, representing the strength of the chronology. Finally, the R-bar (inter-series correlations) was computed [59].
Spectral analyses for detrended radial growth were calculated with Statistica 13 software [60]. Calculation was performed using the “Single Furier (Spectral) Analysis” function, using the output “Periodogram” plotted by “Period.” This software was also used to calculate correlation coefficients and cross-correlations. Cross-periodograms were used to study a multivariate spatial process between tree-ring width index and NDVI [61].

3. Results

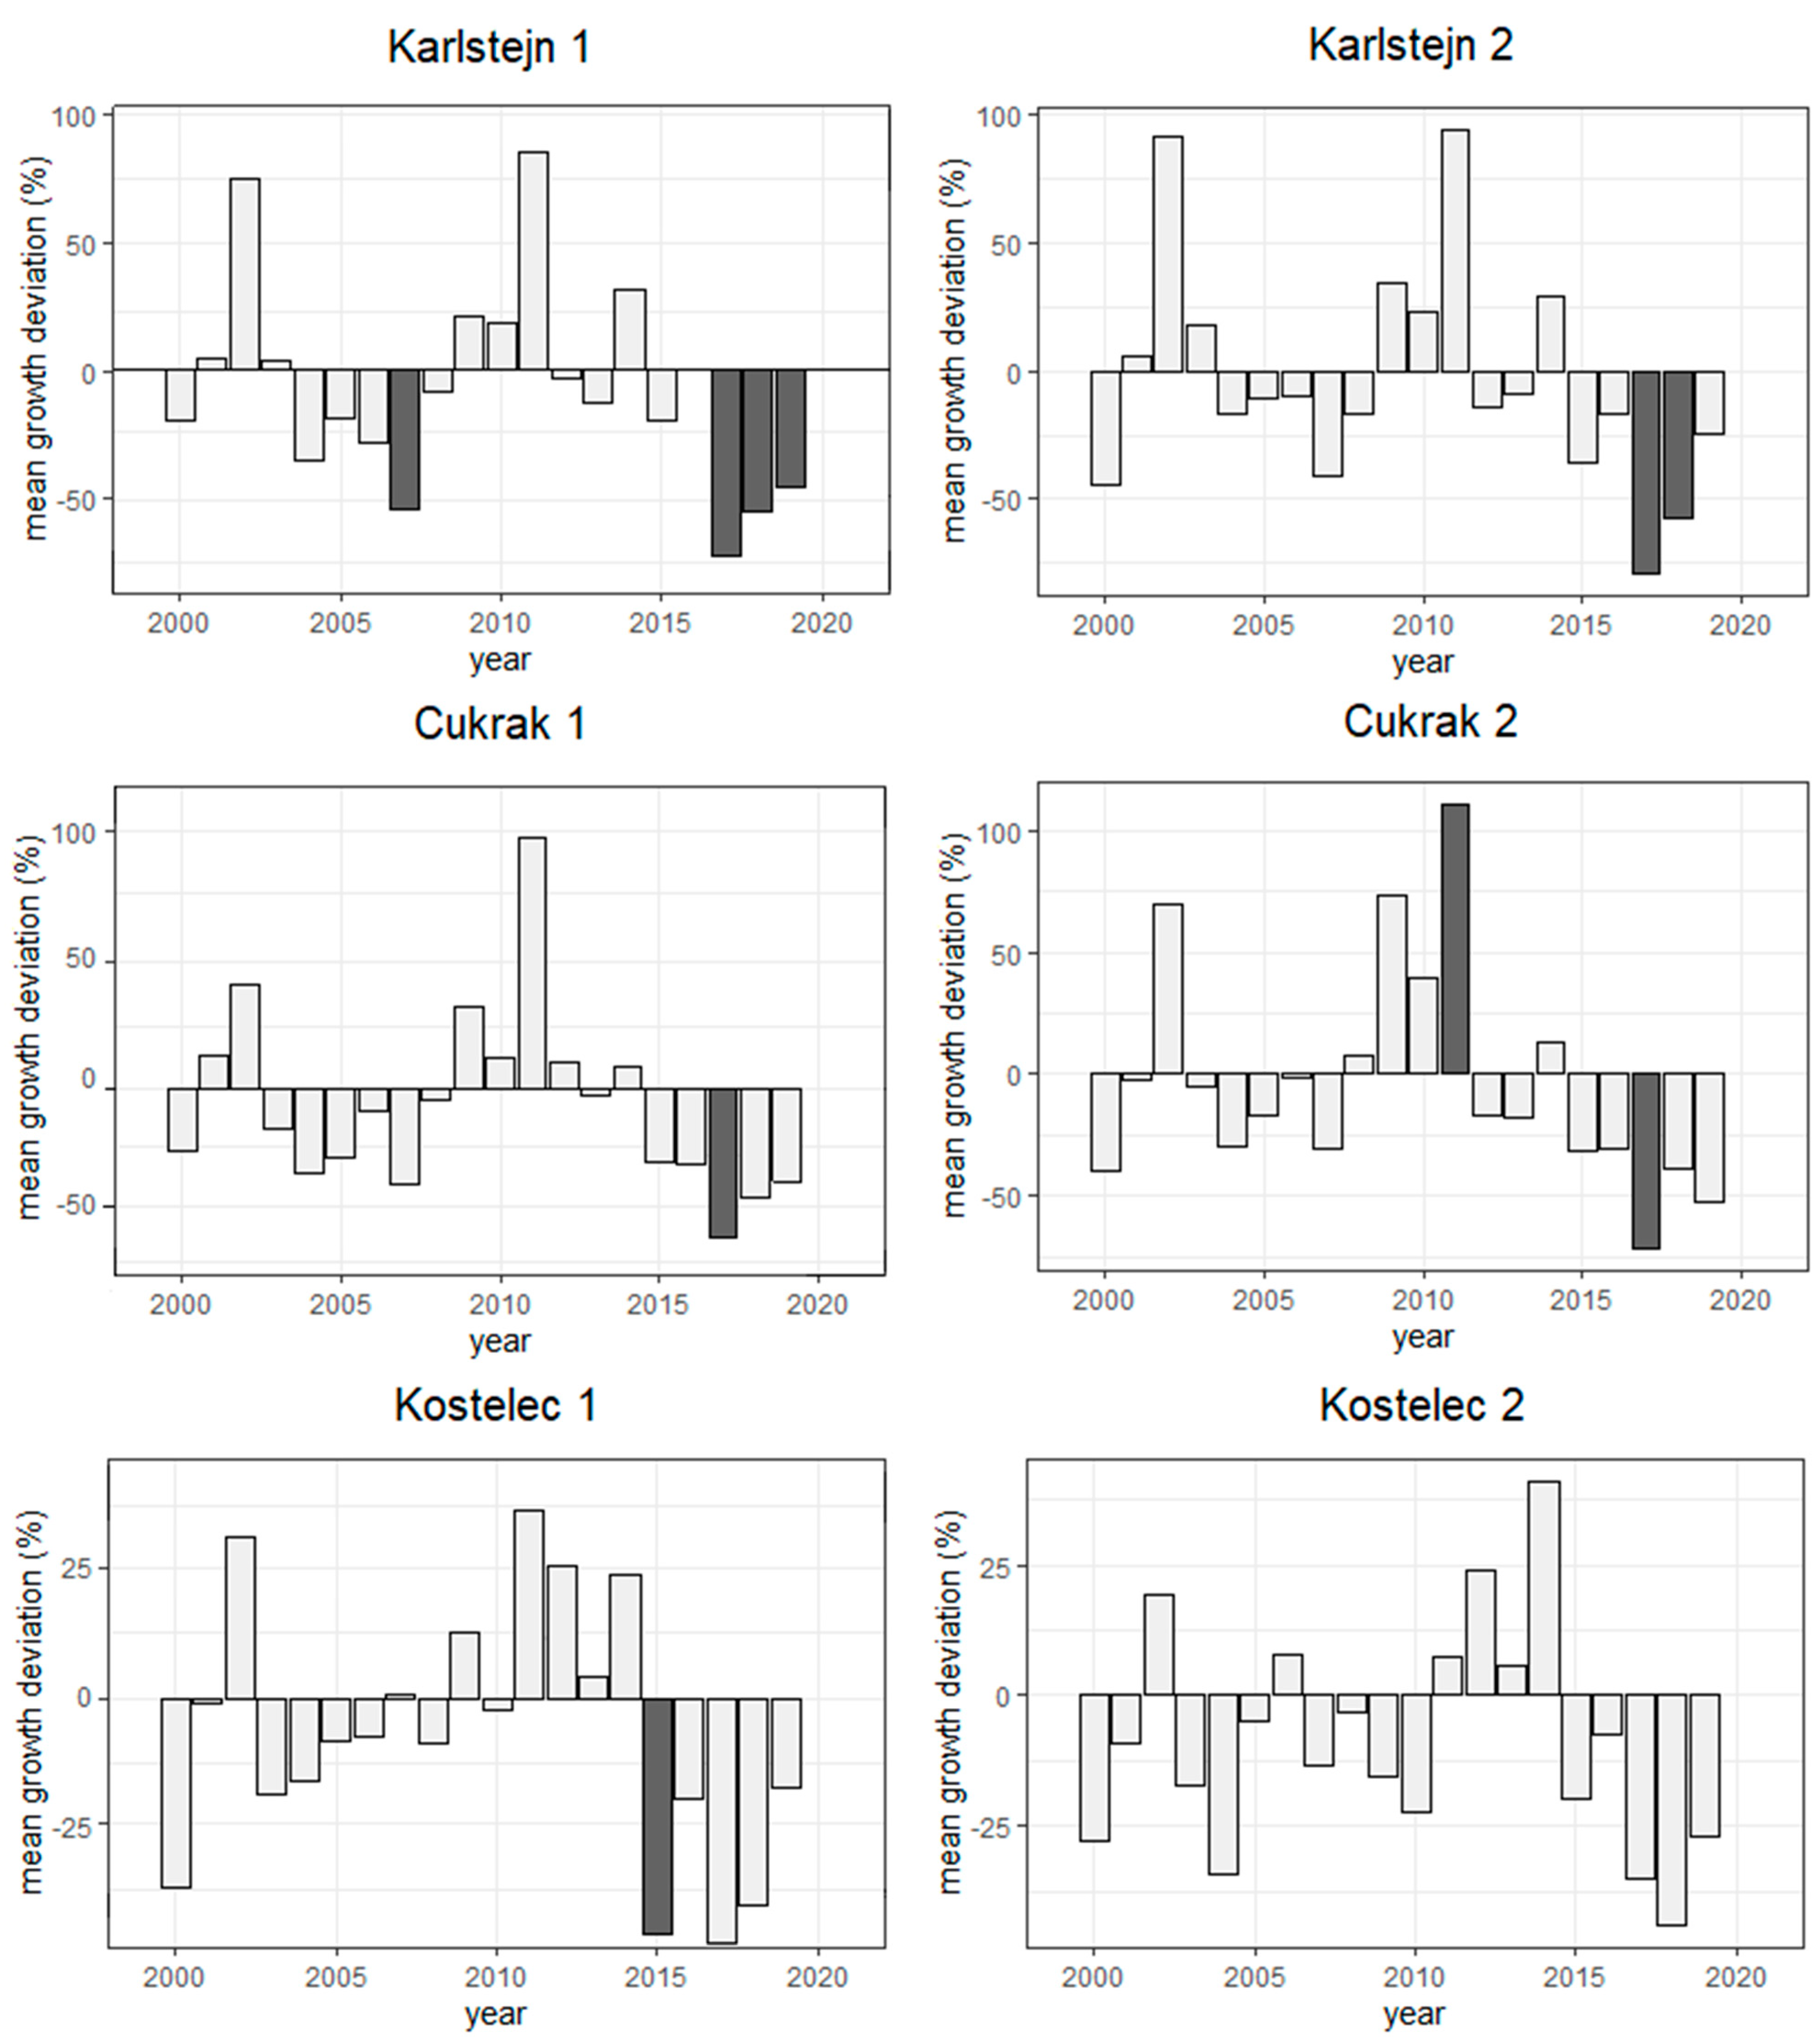
3.1. Trend of Radial Growth

Dendrochronological data showed a significant limit of EPS (≥0.95) for all research plots and indicated high R-bar values (≥0.39; Table 2). The SNR showed that the best dendrochronological pattern (without any noise) was found in Cukrak 2 (40.14), the youngest forest stand, and the poorest was found in Kostelec 2 (17.68), the oldest forest stand. Similarly, the highest and lowest variabilities were observed on the same plots. The largest mean value of tree-ring width was found in Kostelec 1 (2.26 mm), the second oldest research plot, whose site was also nutrient-rich with the highest soil moisture content among all plots compared to the compacted acidic soils on the oldest plot, Kostelec 2 (1.45 mm).
On the one hand, the tree-ring width index (RWI) showed very low increments for the years 2000, 2007, 2017, and 2018 at Karlstejn and Cukrak. At Kostelec, tree-ring chronology documented the highest depression for the years 2000, 2004, 2017, and 2018. On the other hand, the highest RWI was observed in the years 2002, 2012, and 2014 for all plots except Kostelec 2. Regarding the dynamics of RWI, the highest similarity between plots was observed in Karlstejn; the highest variability, in Kostelec.

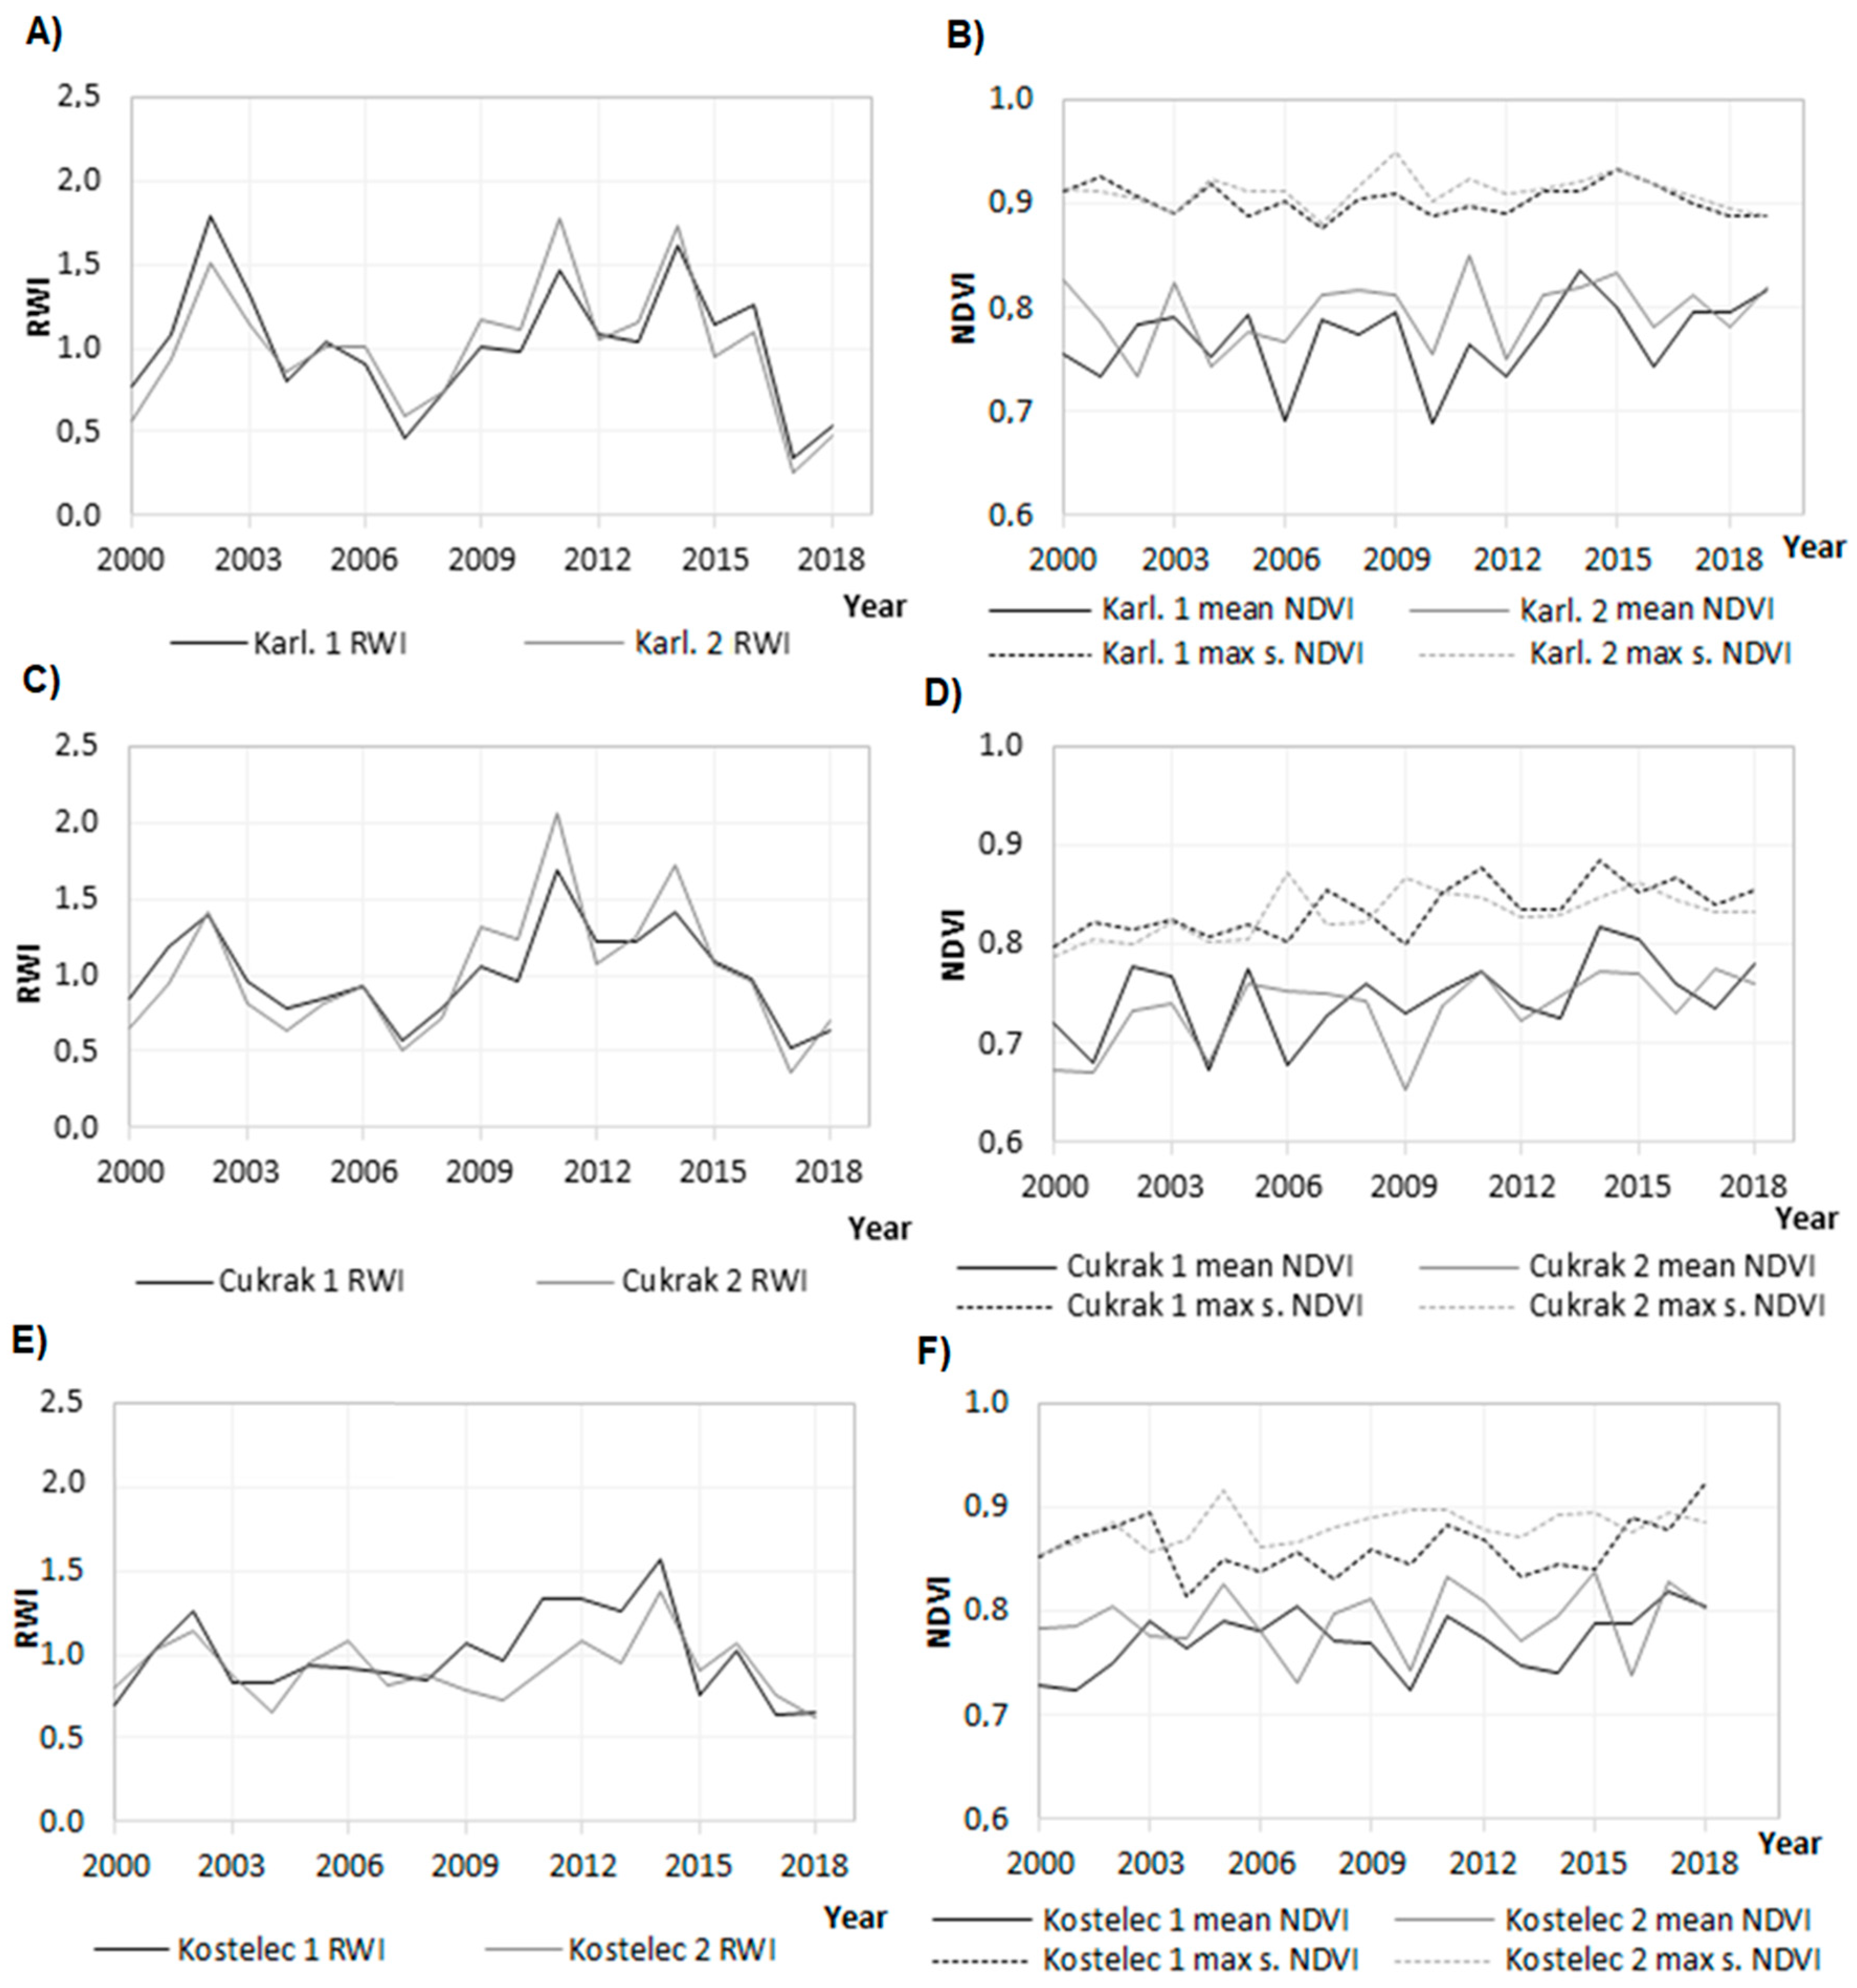
3.2. Relationships between Tree-Ring Growth and NDVI

RWI and NDVI did not show a common trend in the data (Figure 4). Low NDVI values did not occur in the same years between individual research plots and locations, for example, in 2009 or 2012, where low NDVI values were recorded. These NDVI 2009-to-2012 time frame values were completely different from the simultaneous RWI values in the research areas. There was no similarity between NDVI and RWI, although in the case of Cukrak 1 from 2013 to 2018, the mean NDVI and RWI had similar decreasing values. In addition, regarding Cukrak 2, the mean NDVI and RWI had similar values from 2012 to 2014. The differences in the course of NDVI and RWI were greatest in research plot Kostelec 1 from 2008 to 2018, where the maximum NDVI had totally opposite values to RWI.
Regarding the relationship between ring width and NDVI, maximum seasonal NDVI values in the growing season from all sites were more correlated with each other, according to correlation and p-value, than mean NDVI values, but the correlation was not significant (p < 0.05; Table 3). NDVI showed higher p-values that were far from the limit of significance (p < 0.05). Kostelec 1 and Kostelec 2 indicated the lowest correlation coefficients with NDVI. Kostelec 1 showed opposite results (negative correlation coefficients) compared to the other research plots. Maximum seasonal NDVI correlated with higher opposite radial growth values more than with temperatures at the Karlstejn and Cukrak research plots, but these were only four plots out of six. In some cases, correlation coefficients for maximum seasonal NDVI were higher than for temperatures, and the maximum seasonal NDVI had a lower p-value. For this study, cross-correlation variants with +5-year and –5-year lag were also calculated, but the results of this analysis showed no significant relationship between NDVI and RWI at the research plots.

3.3. Effect of Climate on Radial Growth

Generally, when comparing NDVI, temperature, and precipitation, the highest correlation with radial growth was observed for precipitation in the growing season, except for Karlstejn (higher correlation for annual precipitation). Concerning temperature, radial growth showed only one significantly (p < 0.05) negative correlation with temperature during the growing season. According to the significant correlation coefficient values, precipitation had the main effect on radial growth in spruce. Even the correlation coefficients that were not significant had high r and showed low p-values.
Relative changes in the growth of spruce tree rings are recorded in Figure 5. The pointer years indicated fluctuations in the radial growth of spruce. Positive and negative growth periods alternated after four to seven years. The Karlstejn 1 research plot recorded the highest number of pointer years (only negative ones). For Karlstejn 1, 2007, 2017, 2018 and 2019 were the negative pointer years. Karlstejn 2 also showed negative pointer years in 2017 and 2018. The negative pointer year 2018 was historically the warmest growing season since 1941 (10.5 °C; long-term mean annual temperature 8.5 °C) with less precipitation (454 mm; mean 543 mm).
For Cukrak 1, the only negative pointer year was 2017, while for Cukrak 2, the pointer years were 2011 (positive) and 2017 (negative). Cukrak 1′s negative pointer year, 2017, coincided with the same year where there was a similarity between mean NDVI and RWI. Similarly, 2017 was below average in terms of precipitation and above average in terms of temperature (501 mm, 9.6 °C), especially during the growing season.
Kostelec 1 showed only one negative pointer year, 2015. During the year 2015, the second-highest annual temperature since 1941 was observed, along with long-term droughts (10.4 °C, 422 mm). Kostelec 2 was the only research plot that did not record any pointer years.

4. Discussion

4.1. Trend in Radial Growth

The tree-ring width of spruce in the studied lowland areas ranged from 1.45 to 2.26 mm, while the highest radial growth was reached at the site with the best soil water supply (Kostelec 1). For comparison, a significantly higher mean ring width of spruce (mean 2.41 mm) was reached in a mixed stand of similar age in the Krkonoše Mountains with mean annual precipitation of 1200 mm [62]. Norway spruce generally prefer cool and moist climatic conditions [63,64]. Due to its preferences, this economically valuable tree species may become severely affected under ongoing climate change [65].
In most of the studied forest stands, description of the radial growth showed that 2017 (not described in the results section) was the year with the least growth (except for the Kostelec 2 location). This result can be explained by the findings of Rita et al. [66], who documented that, from mid-July 2017, many European countries were affected by prolonged droughts. In the Kostelec 1 location, the year with the least growth was 2003. In Central Europe, 2003 was also the year with the hottest summer in the last 500 years [67,68,69].
A reduction in tree ring growth also occurs in the year following one in which water stress occurred [70]. An example of this situation could be 2004 for the Karlstejn, Cukrak, and Kostelec 2 locations. As previously mentioned, the summer of 2003 was the warmest in over 500 years for Central Europe, which likely brought repercussions for growth in the following year. Moreover, this also coincides with the data provided to us by thermo-pluviometric stations. In fact, in 2003, precipitation reached only 60 percent of normal, which was 334 mm over the whole year and 249 mm over the growing season for Karlstejn and Cukrak, and 472 mm over the entire year and 309 mm over the growing season for Kostelec. These values are well below the optimal amount of precipitation for spruce growth [64].

4.2. Low Similarity between Tree-Ring Growth and NDVI

The relationship between growth and NDVI depends on the time interval. During specific periods in the growing season, radial incrementation—as confirmed by previous works—may display higher correlations [71]. In our case, maximum seasonal NDVI values in the growing season were more correlated than mean NDVI for most sites. However, no significant correlation between NDVI and annual ring width was observed.
As evidenced by several authors, the relationships between the two indicators remain unclear. Vicente-Serrano et al. [72] studied relationships between NDVI and tree-ring growth from 155 sites around the world using data from the “International Tree Ring Data Bank” and GIMMS3g NDVI time series; they found a generally positive correlation but also high site-to-site variability depending on the authors, due to differences in local climate and forest typologies [73]. On the other hand, other authors [74,75] found no significant correlation between NDVI and tree-ring growth.
Our results agree with the findings reported by [66] that the NDVI index allows us to determine the areas most vulnerable to drought. In fact, in our locations most susceptible to drought (Karlstejn and Cukrak), there was arithmetically a higher correlation with NDVI data than in the less arid locations (Kostelec), even if it was not statistically significant.
The NDVI indicator is widely used in phenological works, and some studies reported that it is known to be more sensitive to small increases in the amount of photosynthetic vegetation [76,77]. However, NDVI has its limits; the relatively short-term monitoring of this index since 2000, when data are available from the MOD13Q1, belongs to the major limitations. NDVI itself can be affected by background issues and path radiance and saturation effects, especially in dense canopies [78]. The mentioned differences in surface irradiance and insufficient time series could be one possible explanation for the lack of correlation between NDVI data and tree ring growth data for Norway spruce. Plots in this study have sufficient density, with dense canopies that are appropriate for studying correlations between NDVI values and spruce growth. However, this tree species must be mentioned in comparison to NDVI for its relevance in central European countries. The relationship between RWI and NDVI varies across landscapes and between tree types (coniferous versus deciduous), spatial resolutions, cumulative NDVI periods, and bioclimatic zones [79]. The low correlations between NDVI and annual radial growth could also indicate the unsuitability of this index for this tree species, because it is a coniferous evergreen tree that is stressed for a long time, and thus the differences in the annual reflectance of the tree crowns may not be sufficiently visible. A specific example can be seen with other tree species such as Betula papyrifera, which shows a good correlation between NDVI values and tree ring growth [22].

4.3. Radial Growth and Climatic Conditions

We found the highest correlation between radial growth and precipitation, compared to temperature or NDVI. Precipitation in the growing season had the most significant effect on radial growth in spruce. Water stress causes the formation of narrower tree rings. Insufficient precipitation causes a decrease in net photosynthesis as nutrients transfer slowly, and consequently, the growth and division of cells are also slowed [80,81]. Sufficient precipitation allows trees to use the nutrients utilized in the development of the initial phase of the formation of tree rings. In the spruce’s case, during the growing season, precipitation is more of a limiting factor at lower and middle altitudes than at higher ones [30]. On the other hand, the limiting effect of low temperatures is more significant at higher altitudes [82,83].
In our case, air temperature in the growing season showed a significantly negative correlation with radial growth. High temperatures during the growing season cause moisture stress and therefore reduction in tree ring growth [29,84,85,86]. With high temperatures, increased evapotranspiration causes plants to minimize water losses, close stomata, and reduce net photosynthesis [87]. An increase of more than 3 °C in average monthly temperature during the growing season is risky [88].
The results of spectral analysis of pointer years for spruce also showed that the most negative years were recorded at sites with a low level of water moisture (Karlstejn and, subsequently, Cukrak), while on the Kostelec plots with vertical soil moisture, just one pointer year was observed and recorded. The most negative pointer years were recorded from 2015 to 2018, when the Czech Republic was at the onset of the bark beetle calamity due to increased salvage logging caused by long-term drought with extremely high temperatures [32,89]. Generally, the frequency of negative pointer years increased during the later years of our study. Similarly, an increasing number of negative pointer years with extremely low radial growth was documented for spruce in the Krkonoše Mts. in relation to climate change [62].
Norway spruce is a species with a shallow root system and, therefore, high sensitivity to drought and changes in groundwater [64]. The vitality of the roots consequently depends on the availability of water during the growing season of the previous year [90].

5. Conclusions

The most significant positive correlation to spruce radial growth was observed with precipitation in the growing season, while temperature had a negative effect on growth in the studied lowland forests. For most sites, the maximum NDVI values of the growing season tended to be more correlated than the mean NDVI values, but the correlation was not significant. In conclusion, there was no correlation between NDVI and annual ring width growth despite these being two of the most significant indicators used in climate change; the reason remains unclear. Many times, atmospheric conditions such as aerosols, dust, or cloud cover can degrade NDVI images, so we suggest caution; however, in sites susceptible to drought there are higher correlations with NDVI. This study showed limitations regarding the use of tree-ring data to evaluate NDVI. Finally, an important note worth mentioning is that habitat heterogeneity, age of stand, species composition (monospecific vs. mixed stands), and other significant factors should be considered for the correct interpretation of NDVI results.

Author Contributions

Conceptualization—G.D., V.Š., S.V. and F.R.; methodology—G.D., V.Š., M.C.; investigation—G.D., V.Š., M.C., Z.V., S.V., O.P., R.G.Z. and F.R.; software—G.D., V.Š., M.C. and Z.V.; original draft preparation—G.D., V.Š., M.C., Z.V., S.V. and F.R.; funding acquisition—G.D. All authors have read and agreed to the published version of the manuscript.

Funding

This research was funded by the Czech University of Life Sciences Prague, Faculty of Forestry and Wood Sciences (No. IGA A31/07) and the Ministry of Agriculture of the Czech Republic (No. QK21020371).

Institutional Review Board Statement

Not applicable.

Informed Consent Statement

Not applicable.

Data Availability Statement

Monthly temperature and precipitation data for this study data has been provided from the Czech Hydrometeorological Institute (CHMU). Organization Climate Engine based on Google Earth Engine openly provided NDVI data for this study.

Acknowledgments

We would like to acknowledge the Czech Hydrometeorological Institute for providing the climatic data set. We would like to thank Jitka Šišáková, the expert in the field, and Richard Lee Manore, the native speaker, for checking English.

Conflicts of Interest

The authors declare no conflict of interest.

References

  1. Castellaneta, M.; Rita, A.; Camarero, J.J.; Colangelo, M.; Ripullone, F. Declines in canopy greenness and tree growth are caused by combined climate extremes during drought-induced dieback. Sci. Total Environ. 2022, 813, 152666. [Google Scholar] [CrossRef] [PubMed]
  2. Kerr, J.T.; Ostrovsky, M. From space to species: Ecological applications for remote sensing. Trends Ecol. Evol. 2003, 18, 299–305. [Google Scholar] [CrossRef]
  3. Turner, W.; Spector, S.; Gardiner, N.; Fladeland, M.; Sterling, E.; Steininger, M. Remote sensing for biodiversity science and conservation. Trends Ecol. Evol. 2003, 18, 306–314. [Google Scholar] [CrossRef]
  4. Vescovo, L.; Gianelle, D. Using the MIR bands in vegetation indices for the estimation of grassland biophysical parameters from satellite remote sensing in the Alps region of Trentino (Italy). Adv. Space Res. 2008, 41, 1764–1772. [Google Scholar] [CrossRef]
  5. Pal, S.C.; Chakrabortty, R.; Malik, S.; Das, B. Application of forest canopy density model for forest cover mapping using LISS-IV satellite data: A case study of Sali watershed, West Bengal. Model. Earth Syst. Environ. 2018, 4, 853–865. [Google Scholar] [CrossRef]
  6. Pettorelli, N.; Vik, J.O.; Mysterud, A.; Gaillard, J.-M.; Tucker, C.J.; Stenseth, N.C. Using the satellite-derived NDVI to assess ecological responses to environmental change. Trends Ecol. Evol. 2005, 20, 503–510. [Google Scholar] [CrossRef] [PubMed]
  7. Bhandari, A.; Kumar, A.; Singh, G. Feature Extraction using Normalized Difference Vegetation Index (NDVI): A Case Study of Jabalpur City. Procedia Technol. 2012, 6, 612–621. [Google Scholar] [CrossRef]
  8. Goward, S.N.; Tucker, C.J.; Dye, D.G. North American vegetation patterns observed with the NOAA-7 advanced very high resolution radiometer. Vegetatio 1985, 64, 3–14. [Google Scholar] [CrossRef]
  9. Achard, F.; Estreguil, C. Forest classification of Southeast Asia using NOAA AVHRR data. Remote Sens. Environ. 1995, 54, 198–208. [Google Scholar] [CrossRef]
  10. Wang, S.; Li, R.; Wu, Y.; Zhao, S. Effects of multi-temporal scale drought on vegetation dynamics in Inner Mongolia from 1982 to 2015, China. Ecol. Indic. 2022, 136, 108666. [Google Scholar] [CrossRef]
  11. Morante-Carballo, F.; Bravo-Montero, L.; Carrión-Mero, P.; Velastegui-Montoya, A.; Berrezueta, E. Forest Fire Assessment Using Remote Sensing to Support the Development of an Action Plan Proposal in Ecuador. Remote Sens. 2022, 14, 1783. [Google Scholar] [CrossRef]
  12. Verma, S.; Sharma, A.; Yadava, P.K.; Gupta, P.; Singh, J.; Payra, S. Rapid flash flood calamity in Chamoli, Uttarakhand region during Feb 2021: An analysis based on satellite data. Nat. Hazards 2022, 112, 1379–1393. [Google Scholar] [CrossRef]
  13. Bojórquez, A.; Martínez-Yrízar, A.; Álvarez-Yépiz, J.C. A landscape assessment of frost damage in the northmost Neotropical dry forest. Agric. For. Meteorol. 2021, 308, 108562. [Google Scholar] [CrossRef]
  14. Myneni, R.; Hall, F.; Sellers, P.; Marshak, A. The interpretation of spectral vegetation indexes. IEEE Trans. Geosci. Remote Sens. 1995, 33, 481–486. [Google Scholar] [CrossRef]
  15. Pettorelli, N.; Ryan, S.; Mueller, T.; Bunnefeld, N.; Jedrzejewska, B.; Lima, M.; Kausrud, K. The Normalized Difference Vegetation Index (NDVI): Unforeseen successes in animal ecology. Clim. Res. 2011, 46, 15–27. [Google Scholar] [CrossRef]
  16. Hasenauer, H.; Petritsch, R.; Zhao, M.; Boisvenue, C.; Running, S.W. Reconciling satellite with ground data to estimate forest productivity at national scales. For. Ecol. Manag. 2012, 276, 196–208. [Google Scholar] [CrossRef]
  17. Brehaut, L.; Danby, R.K. Inconsistent relationships between annual tree ring-widths and satellite-measured NDVI in a mountainous subarctic environment. Ecol. Indic. 2018, 91, 698–711. [Google Scholar] [CrossRef]
  18. Karnieli, A.; Agam, N.; Pinker, R.T.; Anderson, M.; Imhoff, M.L.; Gutman, G.G.; Panov, N.; Goldberg, A. Use of NDVI and Land Surface Temperature for Drought Assessment: Merits and Limitations. J. Clim. 2010, 23, 618–633. [Google Scholar] [CrossRef]
  19. Kaufmann, R.K.; D’Arrigo, R.D.; Paletta, L.F.; Tian, H.Q.; Jolly, W.M.; Myneni, R.B. Identifying Climatic Controls on Ring Width: The Timing of Correlations between Tree Rings and NDVI. Earth Interact. 2008, 12, 1–14. [Google Scholar] [CrossRef]
  20. Nanzad, L.; Zhang, J.; Tuvdendorj, B.; Nabil, M.; Zhang, S.; Bai, Y. NDVI anomaly for drought monitoring and its correlation with climate factors over Mongolia from 2000 to 2016. J. Arid Environ. 2019, 164, 69–77. [Google Scholar] [CrossRef]
  21. Wang, Z.; Lyu, L.; Liu, W.; Liang, H.; Huang, J.; Zhang, Q.-B. Topographic patterns of forest decline as detected from tree rings and NDVI. Catena 2021, 198, 105011. [Google Scholar] [CrossRef]
  22. Bumann, E.; Awada, T.; Wardlow, B.; Hayes, M.; Okalebo, J.; Helzer, C.; Mazis, A.; Hiller, J.; Cherubini, P. Assessing responses of Betula papyrifera to climate variability in a remnant population along the Niobrara River Valley in Nebraska, U.S.A., through dendroecological and remote-sensing techniques. Can. J. For. Res. 2019, 49, 423–433. [Google Scholar] [CrossRef]
  23. Decuyper, M.; Chávez, R.O.; Čufar, K.; Estay, S.A.; Clevers, J.G.; Prislan, P.; Gričar, J.; Črepinšek, Z.; Merela, M.; de Luis, M.; et al. Spatio-temporal assessment of beech growth in relation to climate extremes in Slovenia—An integrated approach using remote sensing and tree-ring data. Agric. For. Meteorol. 2020, 287, 107925. [Google Scholar] [CrossRef]
  24. Wen, Y.; Jiang, Y.; Jiao, L.; Hou, C.; Xu, H. Inconsistent relationships between tree ring width and normalized difference vegetation index in montane evergreen coniferous forests in arid regions. Trees 2021, 36, 379–391. [Google Scholar] [CrossRef]
  25. Toth, D.; Maitah, M.; Maitah, K.; Jarolínová, V. The Impacts of Calamity Logging on the Development of Spruce Wood Prices in Czech Forestry. Forests 2020, 11, 283. [Google Scholar] [CrossRef]
  26. Knoke, T.; Gosling, E.; Thom, D.; Chreptun, C.; Rammig, A.; Seidl, R. Economic losses from natural disturbances in Norway spruce forests—A quantification using Monte-Carlo simulations. Ecol. Econ. 2021, 185, 107046. [Google Scholar] [CrossRef]
  27. Mäkinen, H.; Nöjd, P.; Mielikäinen, K. Climatic signal in annual growth variation in damaged and healthy stands of Norway spruce [Picea abies (L.) Karst.] in Southern Finland. Trees 2001, 15, 177–185. [Google Scholar] [CrossRef]
  28. Vitas, A. Tree Rings of Norway Spruce (Picea Abies (L.) Karsten) in Lithuania as Drought Indicators: Dendroecological Approach. Pol. J. Ecol. 2004, 52, 201–210. [Google Scholar]
  29. Aakala, T.; Kuuluvainen, T. Summer droughts depress radial growth of Picea abies in pristine taiga of the Arkhangelsk province, northwestern Russia. Dendrochronologia 2011, 29, 67–75. [Google Scholar] [CrossRef]
  30. Rybníček, M.; Kolář, T.; Čermák, P.; Tomáš, Ž.I.D.; Hadaš, P. Dendrochronological Analysis and Habitual Stress Diagnostic Assessment of Norway Spruce (Picea abies) Stands in the Drahany Highlands. Wood Res. 2012, 57, 189–206. [Google Scholar]
  31. Putalová, T.; Vacek, Z.; Vacek, S.; Štefančík, I.; Bulušek, D.; Král, J. Tree-ring widths as an indicator of air pollution stress and climate conditions in different Norway spruce forest stands in the Krkonoše Mts. Cent. Eur. For. J. 2019, 65, 21–33. [Google Scholar] [CrossRef]
  32. Šimůnek, V.; Vacek, Z.; Vacek, S. Solar Cycles in Salvage Logging: National Data from the Czech Republic Confirm Significant Correlation. Forests 2020, 11, 973. [Google Scholar] [CrossRef]
  33. Gomez, D.; Ritger, H.; Pearce, C.; Eickwort, J.; Hulcr, J. Ability of Remote Sensing Systems to Detect Bark Beetle Spots in the Southeastern US. Forests 2020, 11, 1167. [Google Scholar] [CrossRef]
  34. Ge, Z.-M.; Kellomäki, S.; Peltola, H.; Zhou, X.; Wang, K.-Y.; Väisänen, H. Impacts of changing climate on the productivity of Norway spruce dominant stands with a mixture of Scots pine and birch in relation to water availability in southern and northern Finland. Tree Physiol. 2011, 31, 323–338. [Google Scholar] [CrossRef]
  35. Bergh, J.; Linder, S.; Bergström, J. Potential production of Norway spruce in Sweden. For. Ecol. Manag. 2005, 204, 1–10. [Google Scholar] [CrossRef]
  36. Koprowski, M.; Zielski, A. Dendrochronology of Norway spruce (Picea abies (L.) Karst.) from two range centres in lowland Poland. Trees 2006, 20, 383–390. [Google Scholar] [CrossRef]
  37. Savva, Y.; Oleksyn, J.; Reich, P.B.; Tjoelker, M.G.; Vaganov, E.A.; Modrzynski, J. Interannual growth response of Norway spruce to climate along an altitudinal gradient in the Tatra Mountains, Poland. Trees 2006, 20, 735–746. [Google Scholar] [CrossRef]
  38. Rybníček, M.; Cermak, P.; Kolář, T.; Přemyslovská, E.; Žid, T. Influence of temperatures and precipitation on radial increment of Orlické hory Mts. spruce stands at altitudes over 800 m a.s.l. J. For. Sci. 2009, 55, 257–263. [Google Scholar] [CrossRef]
  39. Gryc, V.; Vavrčík, H.; Vichrová, G. Monitoring of Xylem Formation in Norway Spruce in the Czech Republic 2009. Wood Res. 2011, 56, 467–478. [Google Scholar]
  40. Vacek, Z.; Vacek, S.; Prokůpková, A.; Bulušek, D.; Podrázský, V.; Hůnová, I.; Putalová, T.; Král, J. Long-term effect of climate and air pollution on health status and growth of Picea abies (L.) Karst. peaty forests in the Black Triangle region. Dendrobiology 2020, 83, 1–19. [Google Scholar] [CrossRef]
  41. Němeček, J.; Macků, J.; Vokoun, J.; Vavříček, D.; Novák, P. Taxonomický Klasifikační Systém Půd České Republiky; ČZU: Prague, Czech Republic, 2001. [Google Scholar]
  42. Viewegh, J.; Kusbach, A.; Mikeska, M. Czech Forest Ecosystem Classification. J. For. Sci. 2003, 49, 74–82. [Google Scholar] [CrossRef]
  43. Köppen, W. Das Geographische System Der Klimate, Handbuch Der Klimatologie; Gebrüder Borntraeger: Berlin, Germany, 1936. [Google Scholar]
  44. Pekařová, K. Dyinamics of Threatened Species of the Family Ranunculaceae on the Steppe Localities of Doutnáč Hill in the National Natural Reserve. Sci. Agric. Bohem. 2007, 3, 24–33. [Google Scholar]
  45. Bílek, L.; Remeš, J.; Zahradník, D. Natural Regeneration of Senescent Even-Aged Beech (Fagus Sylvatica L) Stands under the Conditions of Central Bohemia. J. For. Sci. Sci. 2009, 55, 145–155. [Google Scholar] [CrossRef]
  46. Vacek, Z.; Vacek, S.; Bílek, L.; Král, J.; Ulbrichová, I.; Simon, J.; Bulušek, D. Impact of applied silvicultural systems on spatial pattern of hornbeam-oak forests. Cent. Eur. For. J. 2018, 64, 33–45. [Google Scholar] [CrossRef] [Green Version]
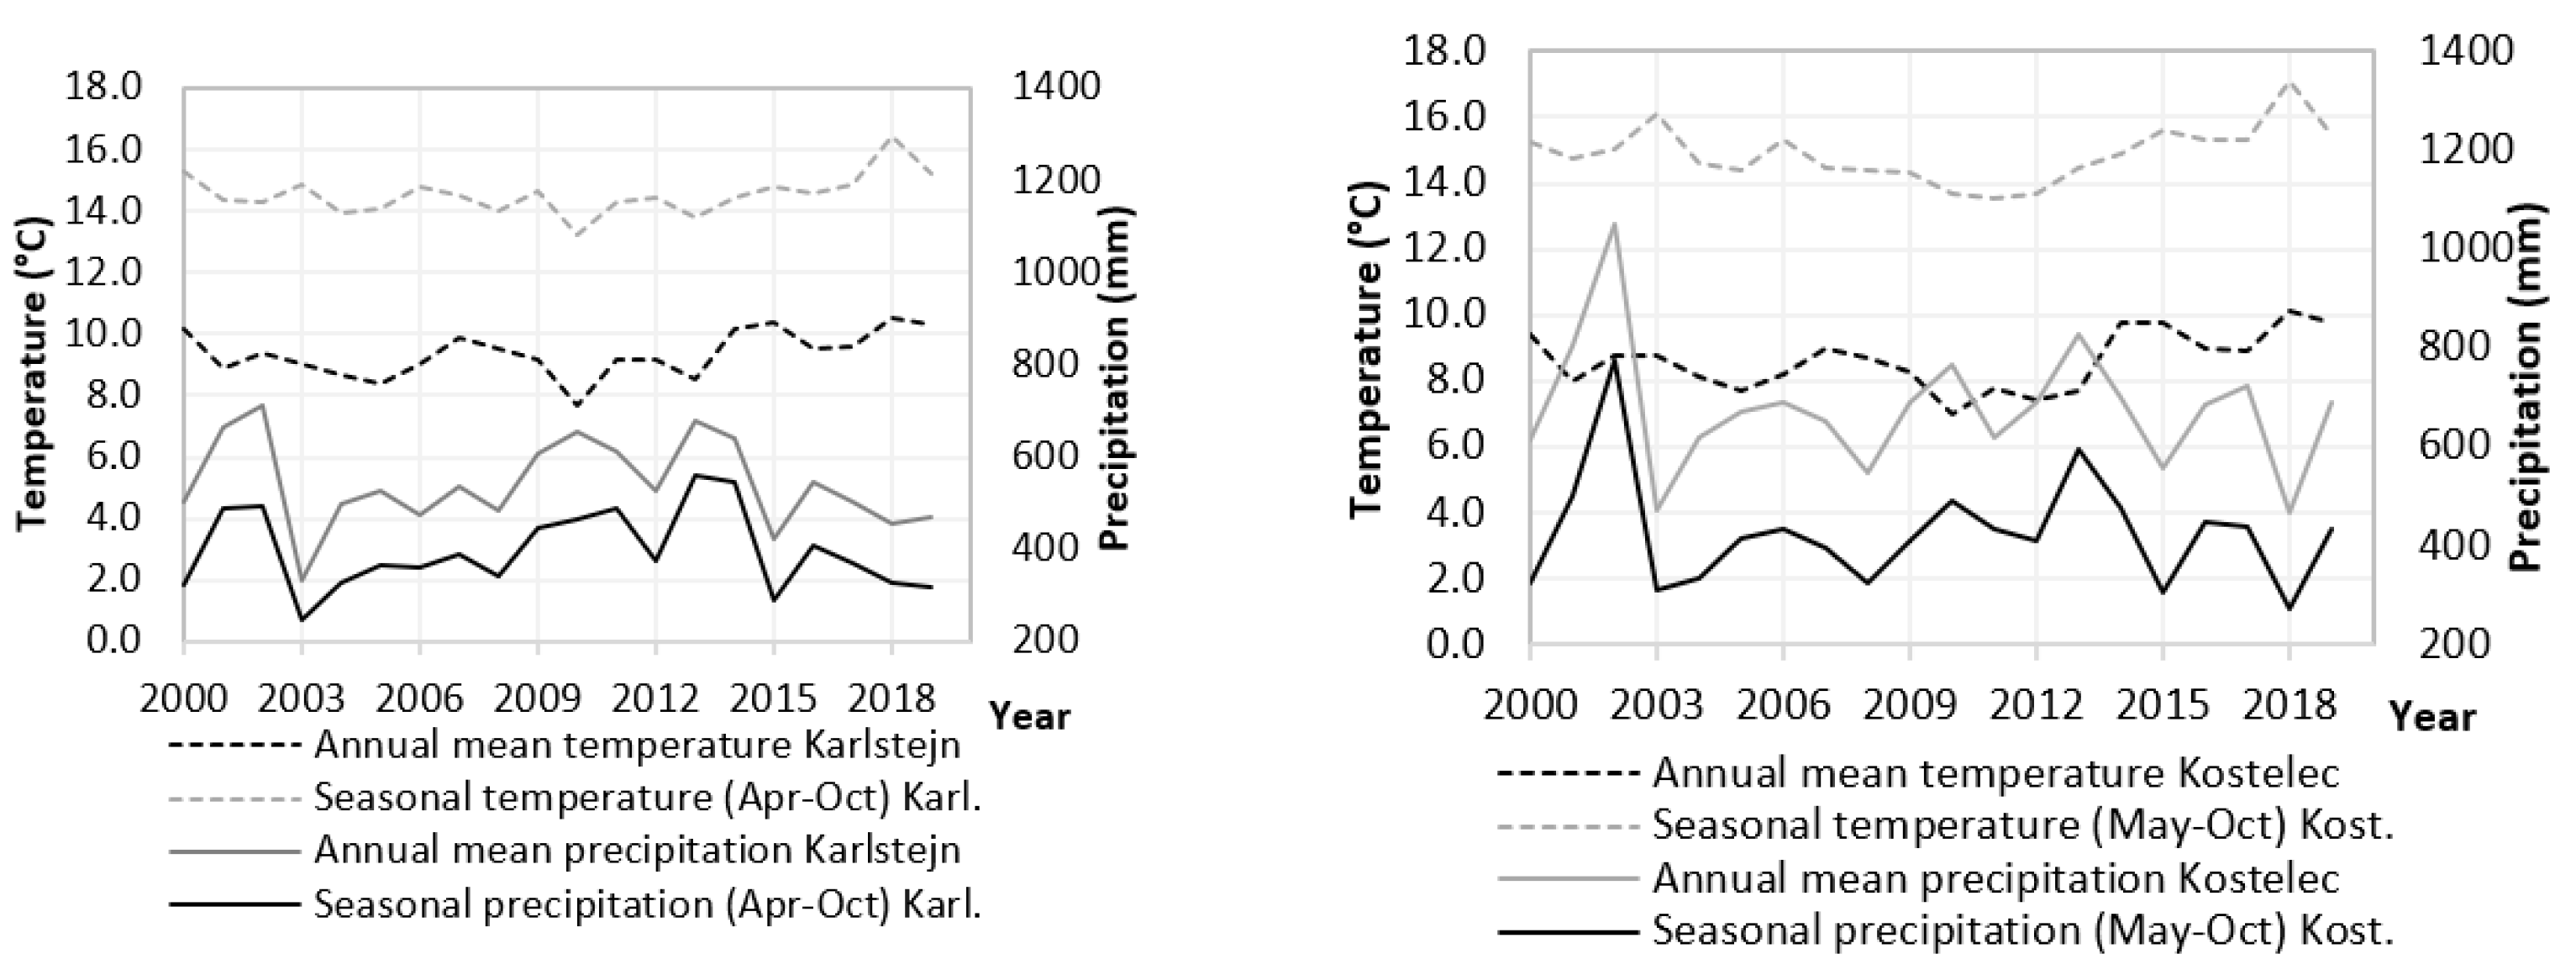
  47. CHMU Czech Hydrometeorological Institute. Available online: http://portal.chmi.cz/historicka-data/pocasi/uzemni-srazky (accessed on 25 June 2020).
  48. Remes, J.; Podrázský, V. Fertilization of spruce monocultures in the territory of Training Forest Enterprise in Kostelec nad Černými lesy. J. For. Sci. 2006, 52, S73–S78. [Google Scholar] [CrossRef]
  49. Huntington, J.L.; Hegewisch, K.C.; Daudert, B.; Morton, C.G.; Abatzoglou, J.T.; McEvoy, D.J.; Erickson, T. Climate Engine: Cloud Computing and Visualization of Climate and Remote Sensing Data for Advanced Natural Resource Monitoring and Process Understanding. Bull. Am. Meteorol. Soc. 2017, 98, 2397–2410. [Google Scholar] [CrossRef]
  50. Justice, C.O.; Townshend, J.R.G.; Holben, B.N.; Tucker, C.J. Analysis of the phenology of global vegetation using meteorological satellite data. Int. J. Remote Sens. 1985, 6, 1271–1318. [Google Scholar] [CrossRef]
  51. Schweingrub, F.H.; Eckstein, D.; Serre-Bachet, F.; Braker, O.U. Identification, Presentation and Interpretation of Event Years and Pointer Years in Dendrochronology. Dendrochronologia 1990, 8, 9–38. [Google Scholar]
  52. Kraft, G. Beiträge Zur Lehre von Den Durchforstungen, Schlagstellungen und Lichtungshieben; Klindworth: Hannover, Germany, 1884. [Google Scholar]
  53. Remes, J.; Bílek, L.; Novák, J.; Vacek, Z.; Vacek, S.; Putalová, T.; Koubek, L. Diameter increment of beech in relation to social position of trees, climate characteristics and thinning intensity. J. For. Sci. 2015, 61, 456–464. [Google Scholar] [CrossRef]
  54. Larsson, L. CooRecorder and Cdendro Programs of the Coorecorder/Cdendropackage Version 7.6. 2013. Available online: http://www.cybis.se/forfun/dendro (accessed on 20 June 2019).
  55. Rinntech. TSAP-Win: Time Series Analysis and Presentation for Dendrochronology and Related Applications; Rinntech: Heidelberg, Germany, 2003; Available online: http://www.rimatech.com (accessed on 20 June 2019).
  56. Zang, C.; Buras, A.; Cecile, J.; Mudelsee, M.; Schulz, M.; Pucha-cofrep, D. Package ‘dplR’ R, Dendrochronology Program Library in R Version 2018. Available online: https://r-forge.r-project.org/projects/dplr/ (accessed on 25 June 2020).
  57. Shumilov, O.; Timonen, M.; Kanatjev, A.G. Palaeovolcanos, Solar Activity and Pine Tree-Rings from the Kola Peninsula (Northwestern Russia) over the Last 560 Years Palaeovolcanos. Int. J. Environ. Res. 2011, 5, 855–864. [Google Scholar]
  58. Bunn, A.; Mikko, K. Chronology Building in DplR; R Foundation for Statistical Computing: Vienna, Austria, 2018; pp. 1–13. [Google Scholar]
  59. Fritts, H.C. Tree Rings and Climate; Academic Press: London, UK, 1976. [Google Scholar]
  60. StatSoft. Statistica Electronic Manual; Statsoft: Tulsa, OK, USA, 2013. [Google Scholar]
  61. Lim, C.Y.; Stein, M. Properties of spatial cross-periodograms using fixed-domain asymptotics. J. Multivar. Anal. 2008, 99, 1962–1984. [Google Scholar] [CrossRef]
  62. Hájek, V.; Vacek, S.; Vacek, Z.; Cukor, J.; Šimůnek, V.; Šimková, M.; Prokůpková, A.; Králíček, I.; Bulušek, D. Effect of Climate Change on the Growth of Endangered Scree Forests in Krkonoše National Park (Czech Republic). Forests 2021, 12, 1127. [Google Scholar] [CrossRef]
  63. Tjoelker, M.G.; Boratyński, A.; Bugala, W. Biology and Ecology of Norway Spruce; Springer Science & Business Media: Dordrecht, The Netherlands, 2007. [Google Scholar]
  64. Caudullo, G.; Tinner, W.; de Rigo, D. Picea Abies in Europe: Distribution, Habitat, Usage and Threats. In European Atlas of Forest Tree Species; Publications Office of the European Union: Luxembourg, 2016. [Google Scholar]
  65. Bugmann, H.; Brang, P. Toward Quantitative Scenarios of Climate Change Impacts in Switzerland; Swiss Federal Institute for Forest: Bern, Switzerland, 2014. [Google Scholar]
  66. Rita, A.; Camarero, J.J.; Nolè, A.; Borghetti, M.; Brunetti, M.; Pergola, N.; Serio, C.; Vicente-Serrano, S.M.; Tramutoli, V.; Ripullone, F. The impact of drought spells on forests depends on site conditions: The case of 2017 summer heat wave in southern Europe. Glob. Change Biol. 2019, 26, 851–863. [Google Scholar] [CrossRef] [PubMed]
  67. Schär, C.; Vidale, P.L.; Lüthi, D.; Frei, C.; Häberli, C.; Liniger, M.A.; Appenzeller, C. The role of increasing temperature variability in European summer heatwaves. Nature 2004, 427, 332–336. [Google Scholar] [CrossRef] [PubMed]
  68. Ciais, P.; Reichstein, M.; Viovy, N.; Granier, A.; Ogée, J.; Allard, V.; Aubinet, M.; Buchmann, N.; Bernhofer, C.; Carrara, A.; et al. Europe-wide reduction in primary productivity caused by the heat and drought in 2003. Nature 2005, 437, 529–533. [Google Scholar] [CrossRef]
  69. García-Herrera, R.; Díaz, J.; Trigo, R.M.; Luterbacher, J.; Fischer, E.M. A Review of the European Summer Heat Wave of 2003. Crit. Rev. Environ. Sci. Technol. 2010, 40, 267–306. [Google Scholar] [CrossRef]
  70. Rybníček, M.; Čermák, P.; Kolář, T.; Žid, T. Growth responses of Norway spruce (Picea abies (L.) Karst.) to the climate in the south-eastern part of the Českomoravská Upland (Czech Republic). Geochronometria 2012, 39, 149–157. [Google Scholar] [CrossRef]
  71. Andreu-Hayles, L.; D’Arrigo, R.; Anchukaitis, K.J.; Beck, P.S.A.; Frank, D.; Goetz, S. Varying boreal forest response to Arctic environmental change at the Firth River, Alaska. Environ. Res. Lett. 2011, 6, 045503. [Google Scholar] [CrossRef]
  72. Vicente-Serrano, S.M.; Camarero, J.J.; Olano, J.M.; Martín-Hernández, N.; Peña-Gallardo, M.; Tomás-Burguera, M.; Gazol, A.; Azorin-Molina, C.; Bhuyan, U.; El Kenawy, A. Diverse relationships between forest growth and the Normalized Difference Vegetation Index at a global scale. Remote Sens. Environ. 2016, 187, 14–29. [Google Scholar] [CrossRef]
  73. D’Arrigo, R.D.; Malmstrom, C.M.; Jacoby, G.C.; Los, S.O.; Bunker, D.E. Correlation between maximum latewood density of annual tree rings and NDVI based estimates of forest productivity. Int. J. Remote Sens. 2000, 21, 2329–2336. [Google Scholar] [CrossRef]
  74. Lawrence, G.B.; Lapenis, A.G.; Berggren, D.; Aparin, B.F.; Smith, K.T.; Shortle, W.C.; Bailey, S.W.; Varlyguin, D.L.; Babikov, B. Climate Dependency of Tree Growth Suppressed by Acid Deposition Effects on Soils in Northwest Russia. Environ. Sci. Technol. 2005, 39, 2004–2010. [Google Scholar] [CrossRef] [PubMed]
  75. Beck, P.S.; Andreu-Hayles, L.; D’Arrigo, R.; Anchukaitis, K.J.; Tucker, C.J.; Pinzón, J.E.; Goetz, S.J. A large-scale coherent signal of canopy status in maximum latewood density of tree rings at arctic treeline in North America. Glob. Planet. Chang. 2013, 100, 109–118. [Google Scholar] [CrossRef]
  76. Berner, L.T.; Beck, P.S.A.; Bunn, A.G.; Goetz, S.J. Plant response to climate change along the forest-tundra ecotone in northeastern Siberia. Glob. Chang. Biol. 2013, 19, 3449–3462. [Google Scholar] [CrossRef] [PubMed]
  77. Soudani, K.; le Maire, G.; Dufrêne, E.; François, C.; Delpierre, N.; Ulrich, E.; Cecchini, S. Evaluation of the onset of green-up in temperate deciduous broadleaf forests derived from Moderate Resolution Imaging Spectroradiometer (MODIS) data. Remote Sens. Environ. 2008, 112, 2643–2655. [Google Scholar] [CrossRef]
  78. Hmimina, G.; Dufrêne, E.; Pontailler, J.-Y.; Delpierre, N.; Aubinet, M.; Caquet, B.; de Grandcourt, A.; Burban, B.; Flechard, C.R.; Granier, A.; et al. Evaluation of the potential of MODIS satellite data to predict vegetation phenology in different biomes: An investigation using ground-based NDVI measurements. Remote Sens. Environ. 2013, 132, 145–158. [Google Scholar] [CrossRef]
  79. Testa, S.; Mondino, E.C.B.; Pedroli, C. Correcting MODIS 16-day composite NDVI time-series with actual acquisition dates. Eur. J. Remote Sens. 2014, 47, 285–305. [Google Scholar] [CrossRef]
  80. Bhuyan, U.; Zang, C.; Vicente-Serrano, S.M.; Menzel, A. Exploring Relationships among Tree-Ring Growth, Climate Variability, and Seasonal Leaf Activity on Varying Timescales and Spatial Resolutions. Remote Sens. 2017, 9, 526. [Google Scholar] [CrossRef]
  81. Fritts, H.C. Growth-Rings of Trees: Their Correlation with Climate. Science 1966, 154, 973–979. [Google Scholar] [CrossRef]
  82. Mäkinen, H.; Nöjd, P.; Kahle, H.-P.; Neumann, U.; Tveite, B.; Mielikäinen, K.; Röhle, H.; Spiecker, H. Radial growth variation of Norway spruce (Picea abies (L.) Karst.) across latitudinal and altitudinal gradients in central and northern Europe. For. Ecol. Manag. 2002, 171, 243–259. [Google Scholar] [CrossRef]
  83. Králíček, I.; Vacek, Z.; Vacek, S.; Remeš, J.; Bulušek, D.; Král, J.; Štefančík, I.; Putalová, T. Dynamics and structure of mountain autochthonous spruce-beech forests: Impact of hilltop phenomenon, air pollutants and climate. Dendrobiology 2017, 77, 119–137. [Google Scholar] [CrossRef]
  84. Barber, V.A.; Juday, G.P.; Finney, B.P. Reduced growth of Alaskan white spruce in the twentieth century from temperature-induced drought stress. Nature 2000, 405, 668–673. [Google Scholar] [CrossRef] [PubMed]
  85. D’Arrigo, R.D.; Kaufmann, R.K.; Davi, N.; Jacoby, G.C.; Laskowski, C.; Myneni, R.B.; Cherubini, P. Thresholds for warming-induced growth decline at elevational tree line in the Yukon Territory, Canada. Glob. Biogeochem. Cycles 2004, 18, GB3021. [Google Scholar] [CrossRef]
  86. Miyamoto, Y.; Griesbauer, H.P.; Green, D.S. Growth responses of three coexisting conifer species to climate across wide geographic and climate ranges in Yukon and British Columbia. For. Ecol. Manag. 2010, 259, 514–523. [Google Scholar] [CrossRef]
  87. Kozlowski, T.T.; Pallardy, S.G. Acclimation and Adaptive Responses of Woody Plants to Environmental Stresses. Bot. Rev. 2002, 68, 270–334. [Google Scholar] [CrossRef]
  88. Grabařová, S.; Martinková, M. Changes of Norway Spruce (Picea Abies [L.] Karst.) Growth Characteristics under the Impact of Drought. Ekológia 2000, 19, 81–103. [Google Scholar]
  89. Vacek, Z.; Řeháček, D.; Cukor, J.; Vacek, S.; Khel, T.; Sharma, R.P.; Kučera, J.; Král, J.; Papaj, V. Windbreak Efficiency in Agricultural Landscape of the Central Europe: Multiple Approaches to Wind Erosion Control. Environ. Manag. 2018, 62, 942–954. [Google Scholar] [CrossRef]
  90. Kolář, T.; Čermák, P.; Trnka, M.; Koňasová, E.; Sochová, I.; Rybníček, M. Dendroclimatic study of a mixed spruce-fir-beech forest in the Czech Republic. Les/Wood 2020, 69, 21–32. [Google Scholar] [CrossRef]
Figure 1. Location of Norway spruce stands on research plots (●) in the study areas of Karlstejn (1–2), Cukrak (3–4) and Kostelec (5–6); meteorological stations (Forests 13 01417 i001
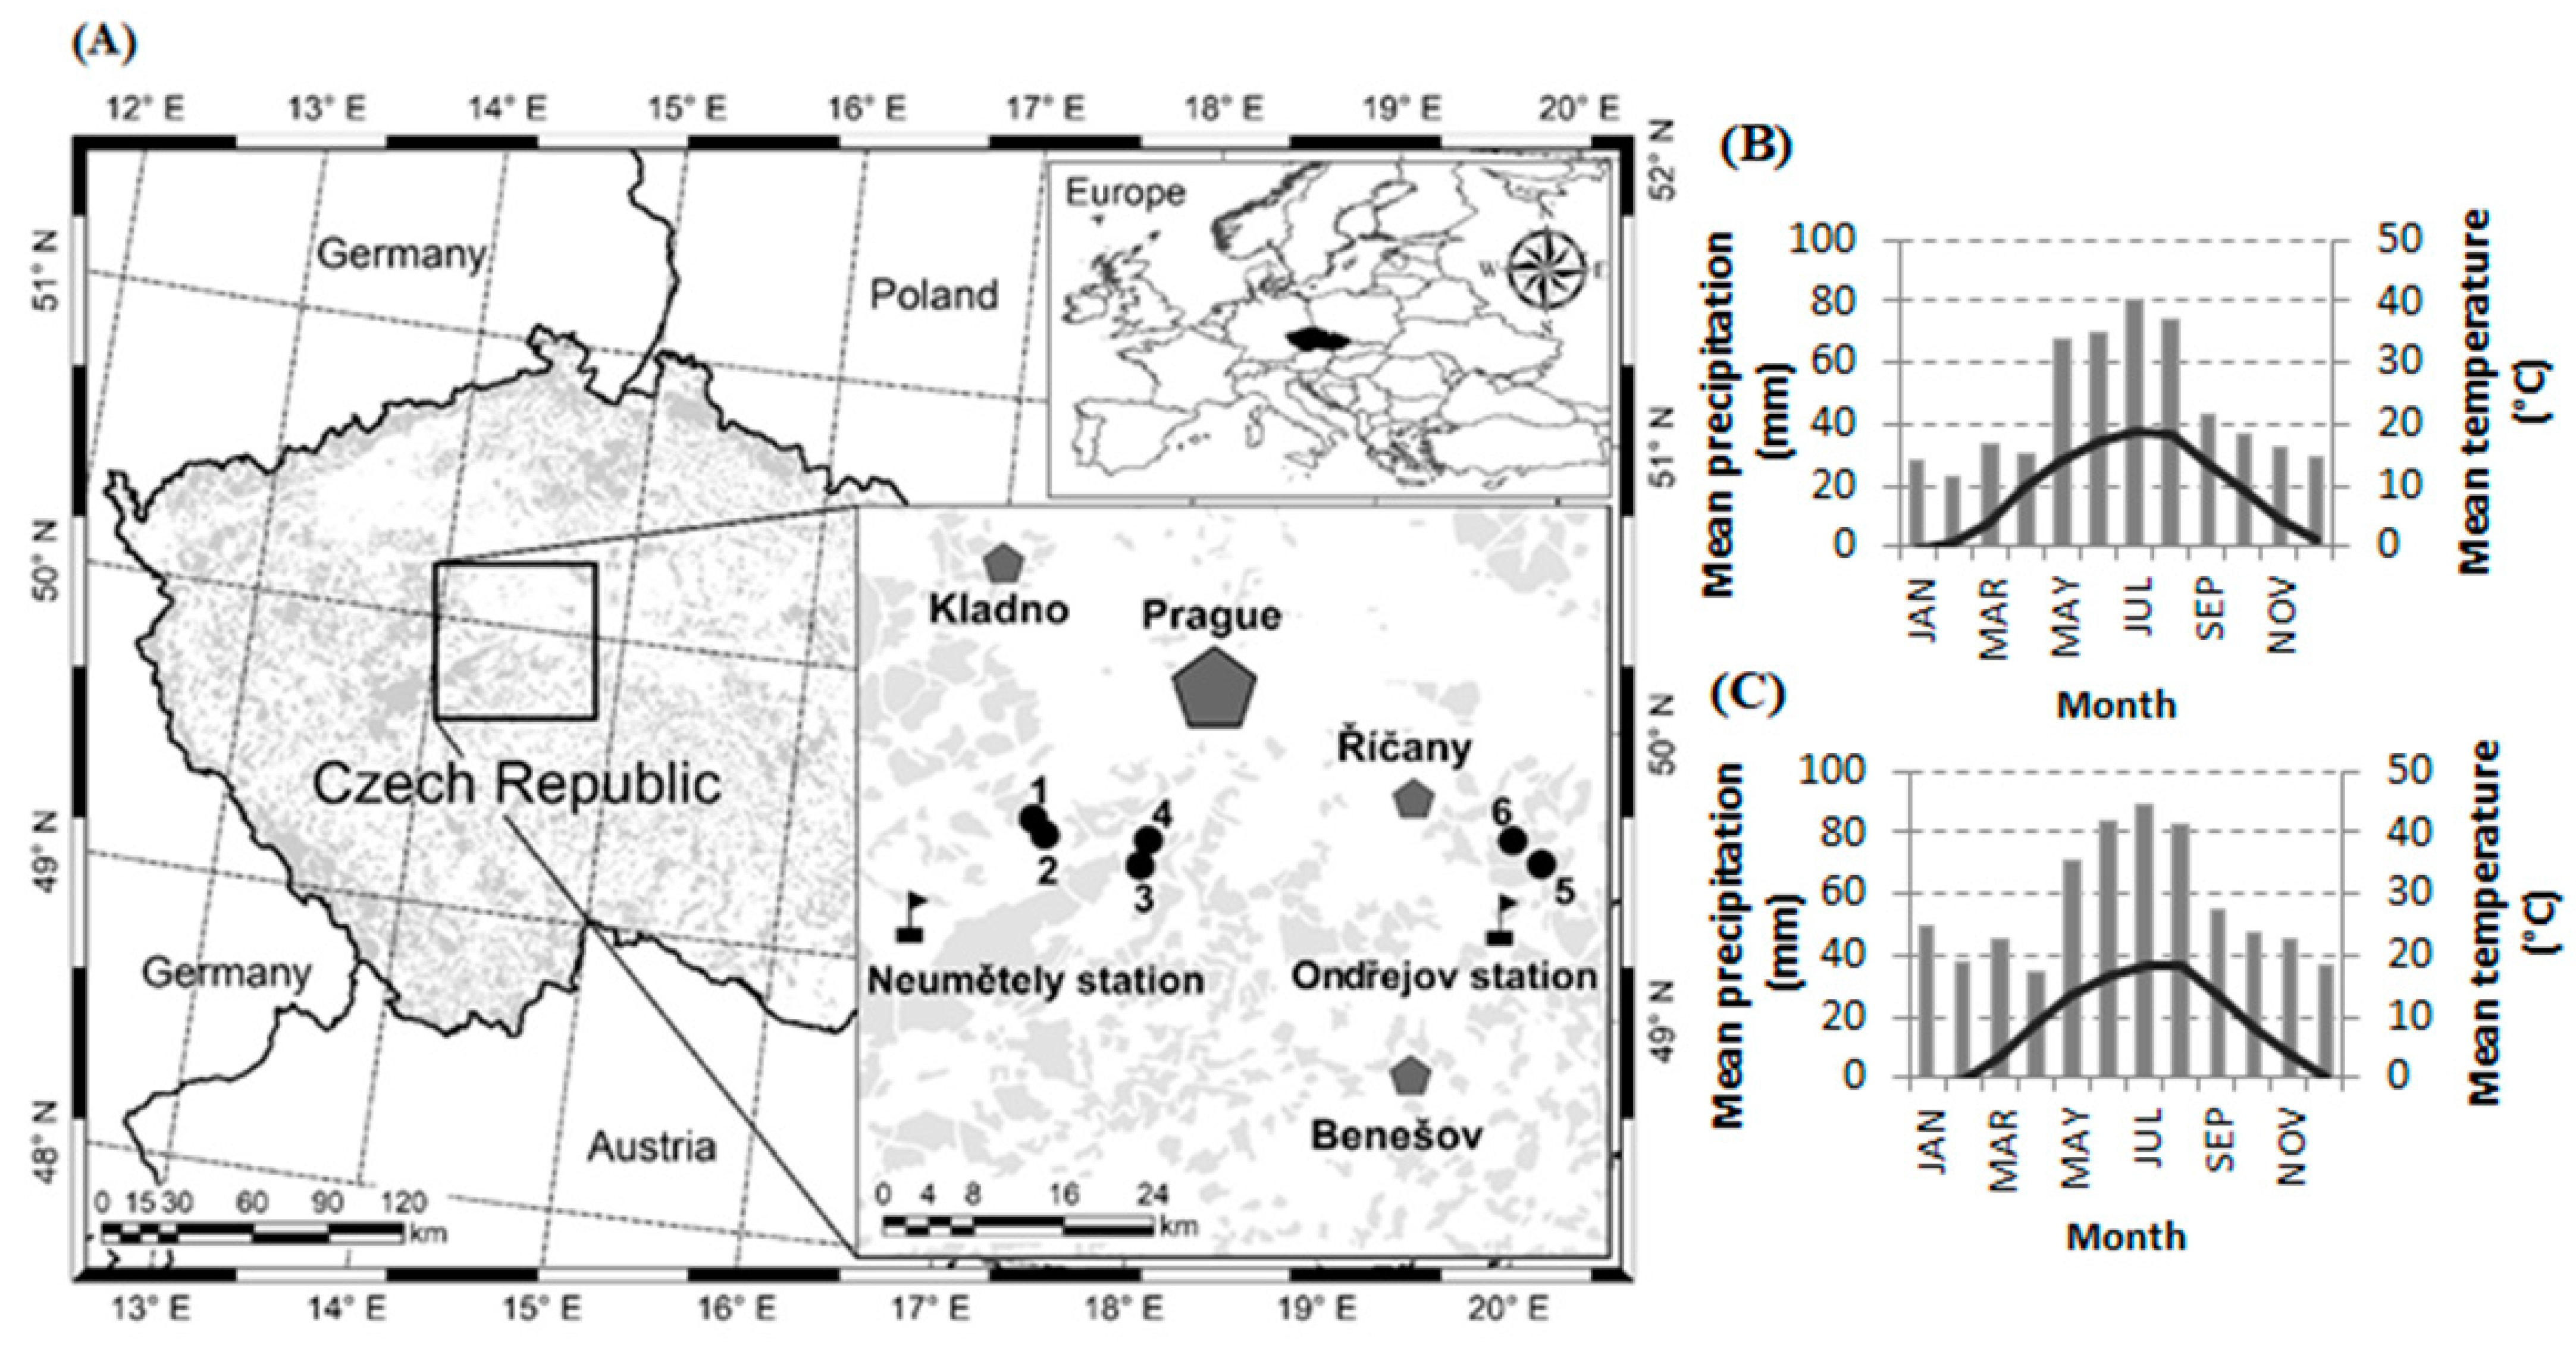
) (A); pentagons mean big cities; the shadowed areas are forested areas; the map was made in ArcGIS 10 software (Esri). Climogram for Karlstejn and Cukrak research plots (B); Climogram for Kostelec research plots (C).
Forests 13 01417 g001
Figure 2. Dynamics of annual and seasonal temperature and seasonal precipitation for the Karlstejn and Cukrak (left) and Kostelec (right) sites, according to nearby meteorological stations, for the period 2000–2018. Note: Karl.—Karlstejn research plot, Kost.—Kostelec research plot.
Forests 13 01417 g002
Figure 3. Flowchart covering methodology.
Forests 13 01417 g003
Figure 4. Description of tree-ring width index (RWI) and normalized difference vegetation index (NDVI) for the period 2000–2018. (A): RWI for 2000–2018, Karlstejn 1 and 2; (B): mean and maximum NDVI values for 2000–2018, Karlstejn 1 and 2. (C): RWI for 2000–2018, Cukrak 1 and 2; (D): mean and maximum NDVI values for 2000–2018, Cukrak 1 and 2. (E): RWI for 2000–2018, Kostelec 1 and 2; (F): mean and maximum NDVI values for 2000–2018, Kostelec 1 and 2. Notes: Karl.—Karlstejn, s.—growing season.
Forests 13 01417 g004
Figure 5. Pointer years (relative growth change) for Norway spruce (2000–2018); dark grey bars—pointer years; light grey bars—mean growth deviation.
Forests 13 01417 g005
Table 1. Overview of the sites and stand characteristics of research plots (according to the Forest Management Plan).
Plot NameGPSAltitudeExposureSlopeAge of Tree LayersHeightDBHForest
Coordinates[m][%][years][m][cm]Type *
Karlstejn 149°56′51.3′′ N, 14°12′05.6′′ E422N–W5–109326363B
Karlstejn 249°56′41.6′′ N, 14°12′19.6′′ E406W<58324322H
Cukrak 149°56′14.2′′ N, 14°21′13.4′′ E402N–W20–258323293K
Cukrak 249°56′51.3′′ N, 14°21′25.1′′ E319N–W5-108026303I
Kostelec 149°57′55.9′′ N, 14°48′58.9′′ E423N–W<59631463S
Kostelec 249°58′33.5′′ N, 14°47′20.9′′ E425N–E10-1512930353I
Notes:* Forest site type classification: 3B—Querceto-Fagetum trophicum, 2H—Fageto-Quercetum illimerosum trophicum, 3K2—Querceto-Fagetum acidophilum, 3I—Querceto-Fagetum illimerosum acidophilum, 3S—Querceto-Fagetum mesotrophicum [42].
Table 2. Characteristics of tree-ring chronologies for Norway spruce in research plots.
Plot NameNo. TreesMean RW (mm)Mean Min—Max RW (mm)Age (Years)Std. (mm)ar1R-BarESPSNR
Karlstejn 1271.791.29–2.58930.870.550.590.9732.75
Karlstejn 2301.610.99–2.25830.940.660.530.9728.90
Cukrak 1311.651.09–2.63830.820.600.460.9622.14
Cukrak 2271.941.15–3.20801.110.570.620.9840.14
Kostelec 1282.261.22–3.34960.960.650.470.9621.29
Kostelec 2301.451.03–2.171290.690.730.390.9517.68
Notes: No. trees—number of trees, Age—age of youngest and oldest sample trees, Mean RW—mean tree-ring width, Std.—standard deviation, ar1—first order autocorrelation, R-bar—inter-series correlation, EPS—expressed population signal, SNR—signal-to-noise ratio.
Table 3. Correlation coefficients for tree-ring width index (RWI) at research plots to NDVI, temperature and precipitation. Significant correlation values are in bold; correlations are significant at p < 0.05.
Plot NameMean NDVIMean Seasonal NDVIMax Seasonal NDVITemperatureSeasonal TemperaturePrecipitationSeasonal Precipitation
Karlstejn 1 RWI0.360.100.29−0.11−0.280.400.44
p-value 0.130.680.230.640.250.090.06
Karlstejn 2 RWI0.010.100.33−0.24−0.400.490.59
p-value 0.950.680.170.330.090.030.08
Cukrak 1 RWI0.290.180.26−0.13−0.300.550.62
p-value 0.230.450.290.610.220.020.01
Cukrak 2 RWI0.160.150.39−0.13−0.300.570.67
p-value 0.550.540.100.600.220.010.01
Kostelec 1 RWI−0.36−0.26−0.08−0.30−0.530.500.59
p-value 0.130.280.750.210.020.030.01
Kostelec 2 RWI0.060.220.010.04−0.150.430.50
p-value 0.800.370.950.870.550.070.03
Publisher’s Note: MDPI stays neutral with regard to jurisdictional claims in published maps and institutional affiliations.

