
The Influence of Plant Community Characteristics in Urban Parks on the Microclimate


Abstract
:1. Introduction
2. Methods
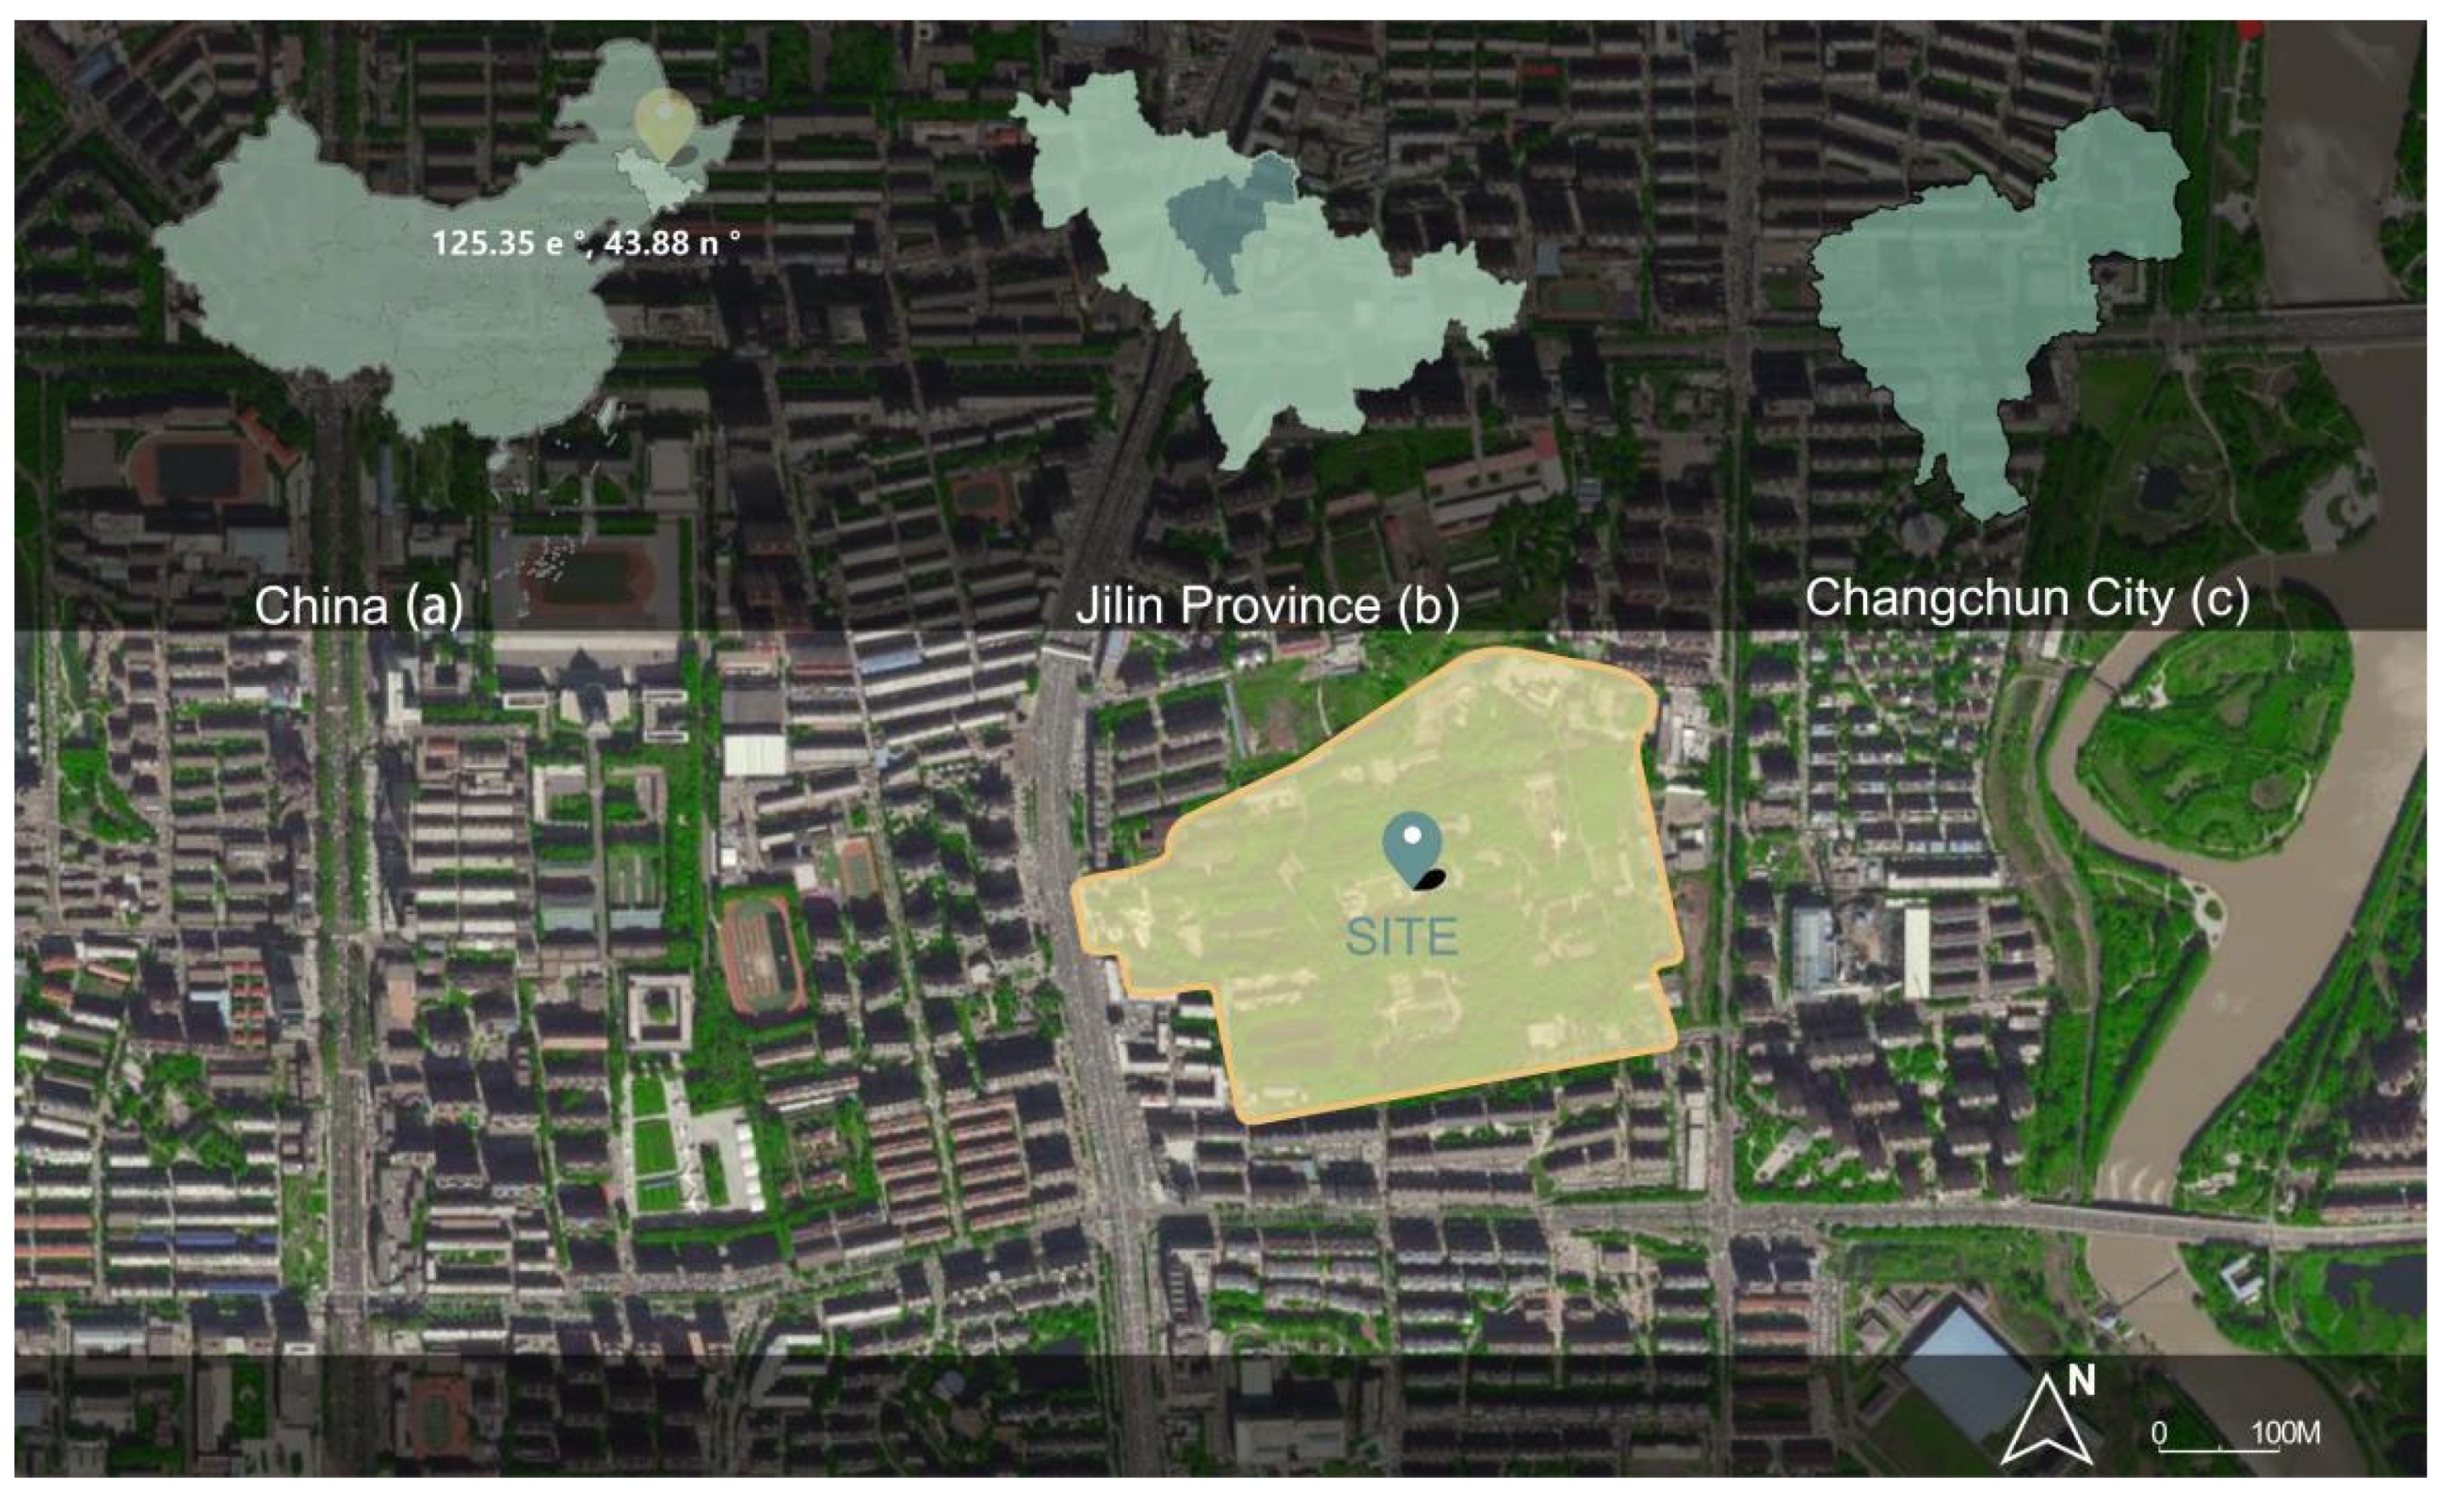
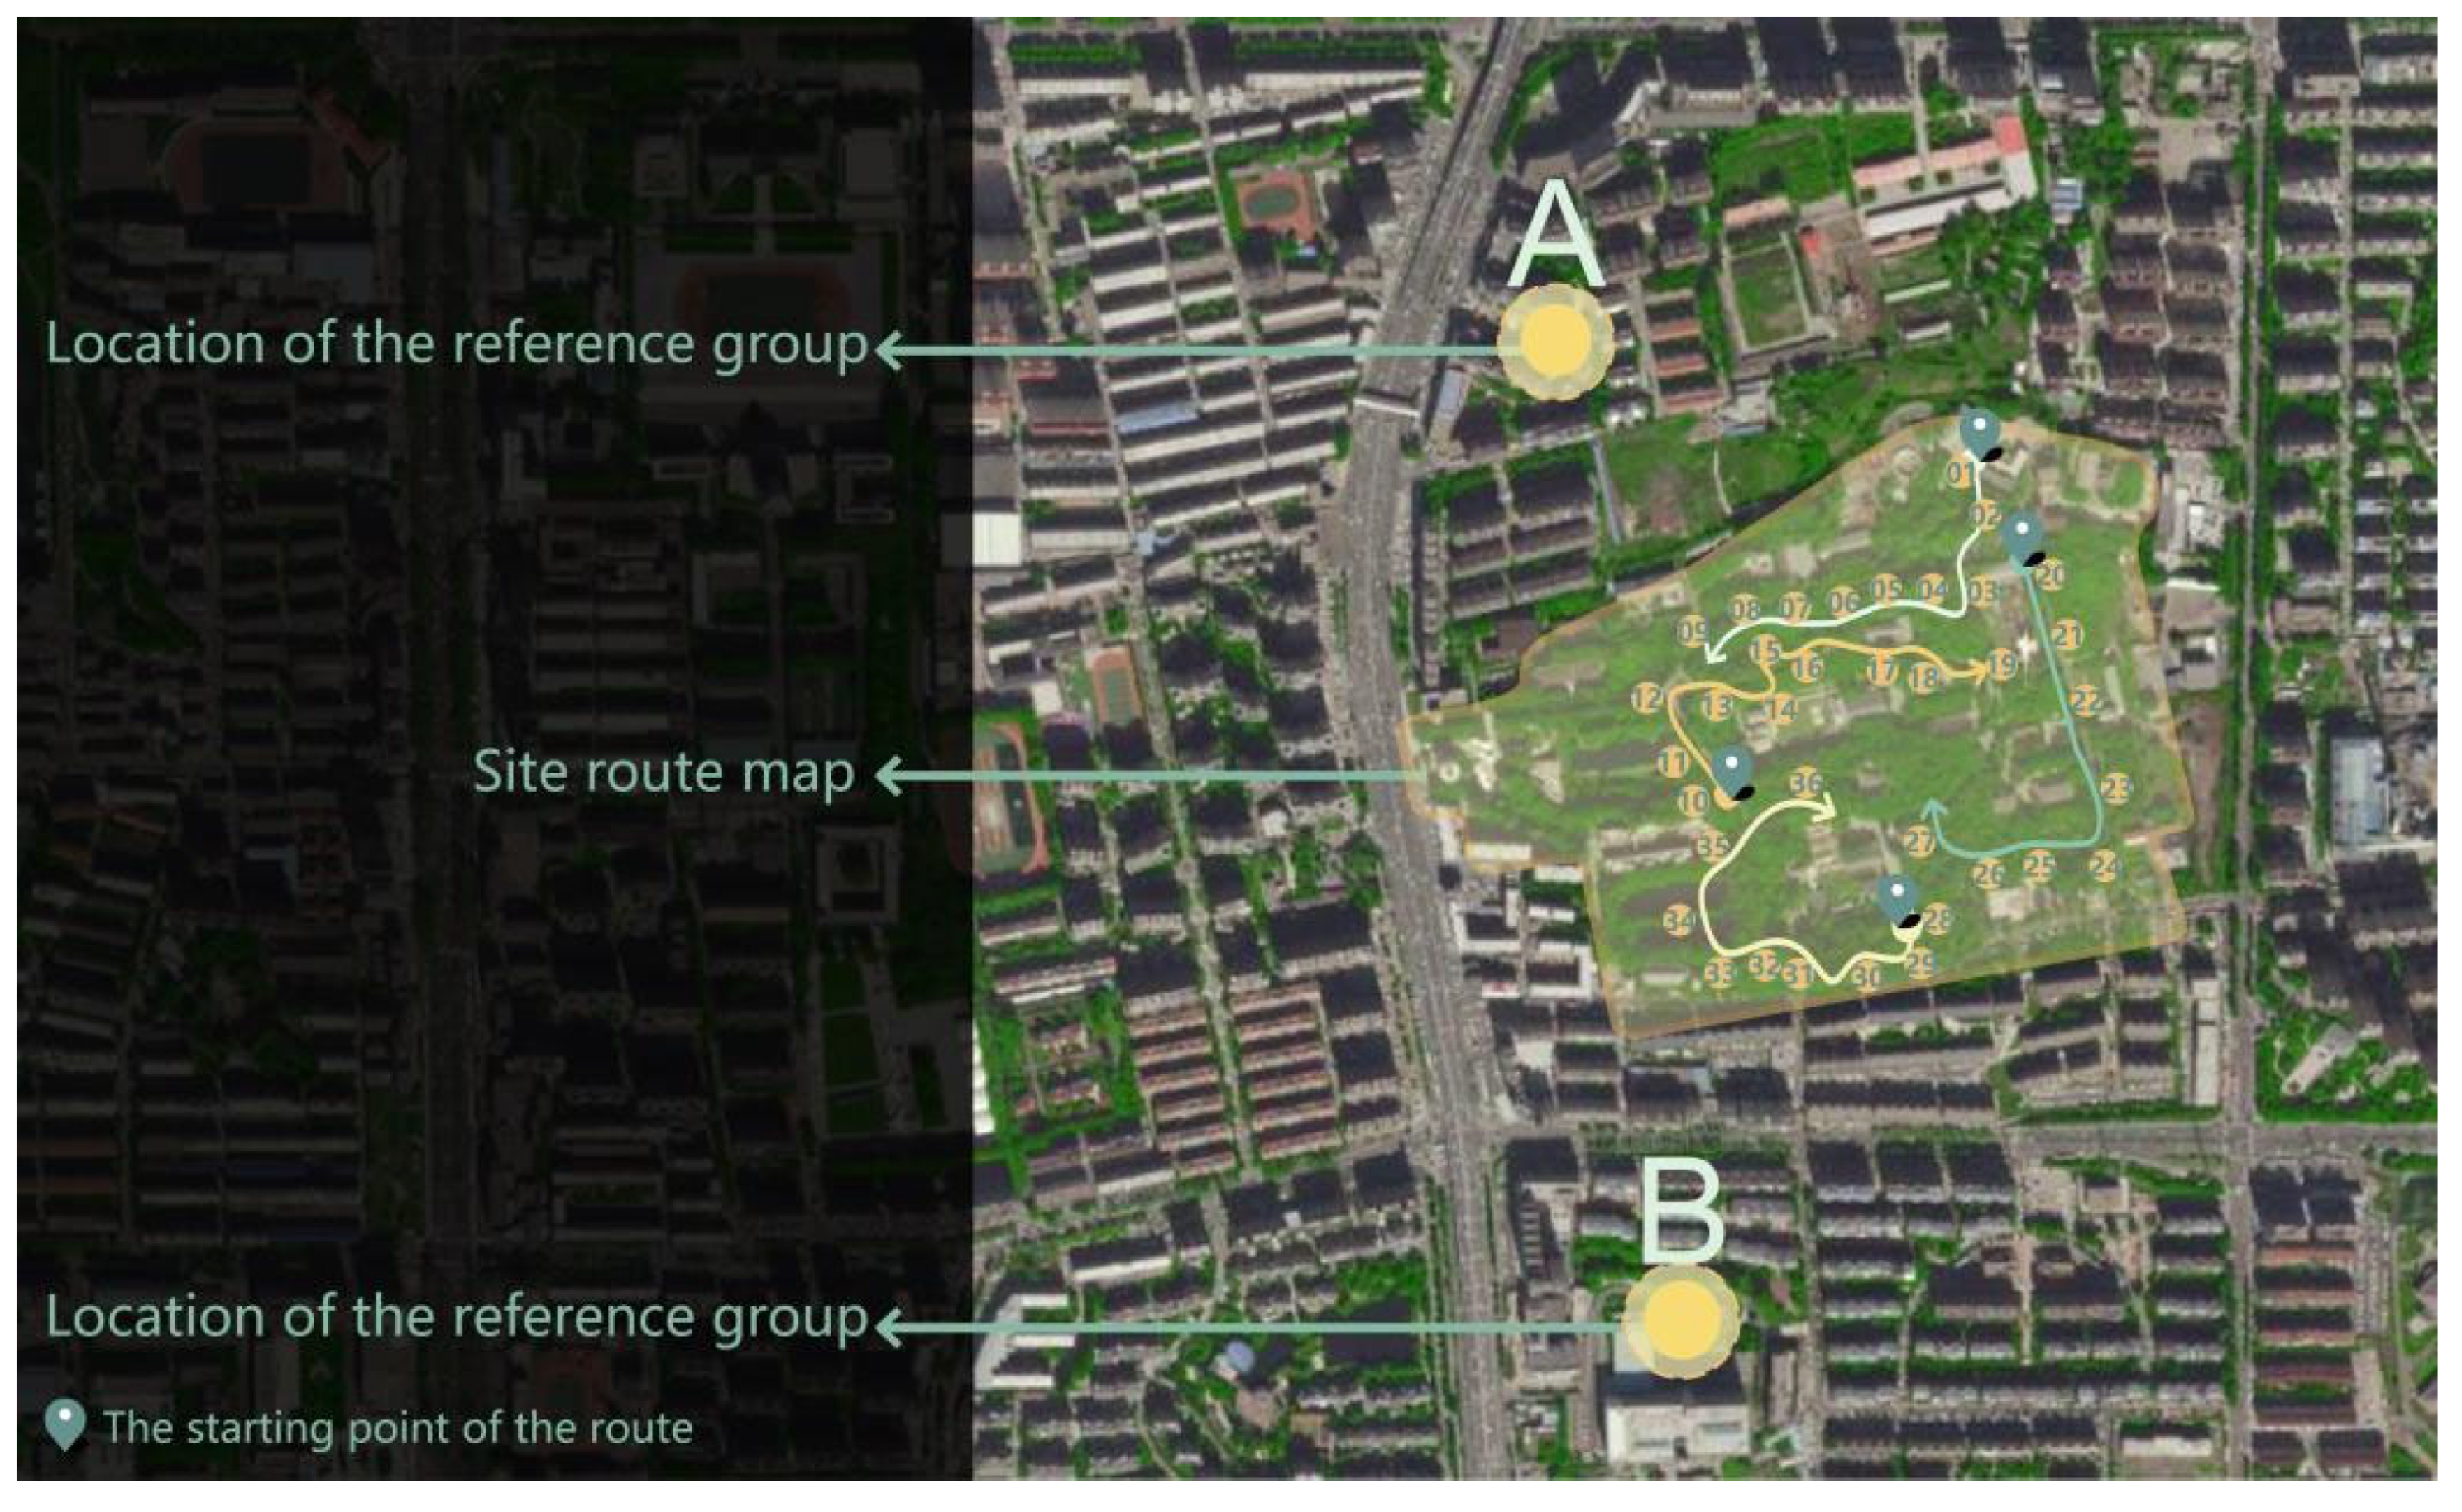
2.1. Study Area
2.2. Data Acquisition
2.2.1. Temperature and Humidity
2.2.2. Canopy Density
2.2.3. Tridimensional Green Biomass
2.3. Data Processing
3. Results
3.1. Influence of Canopy Density on Temperature and Humidity Effect
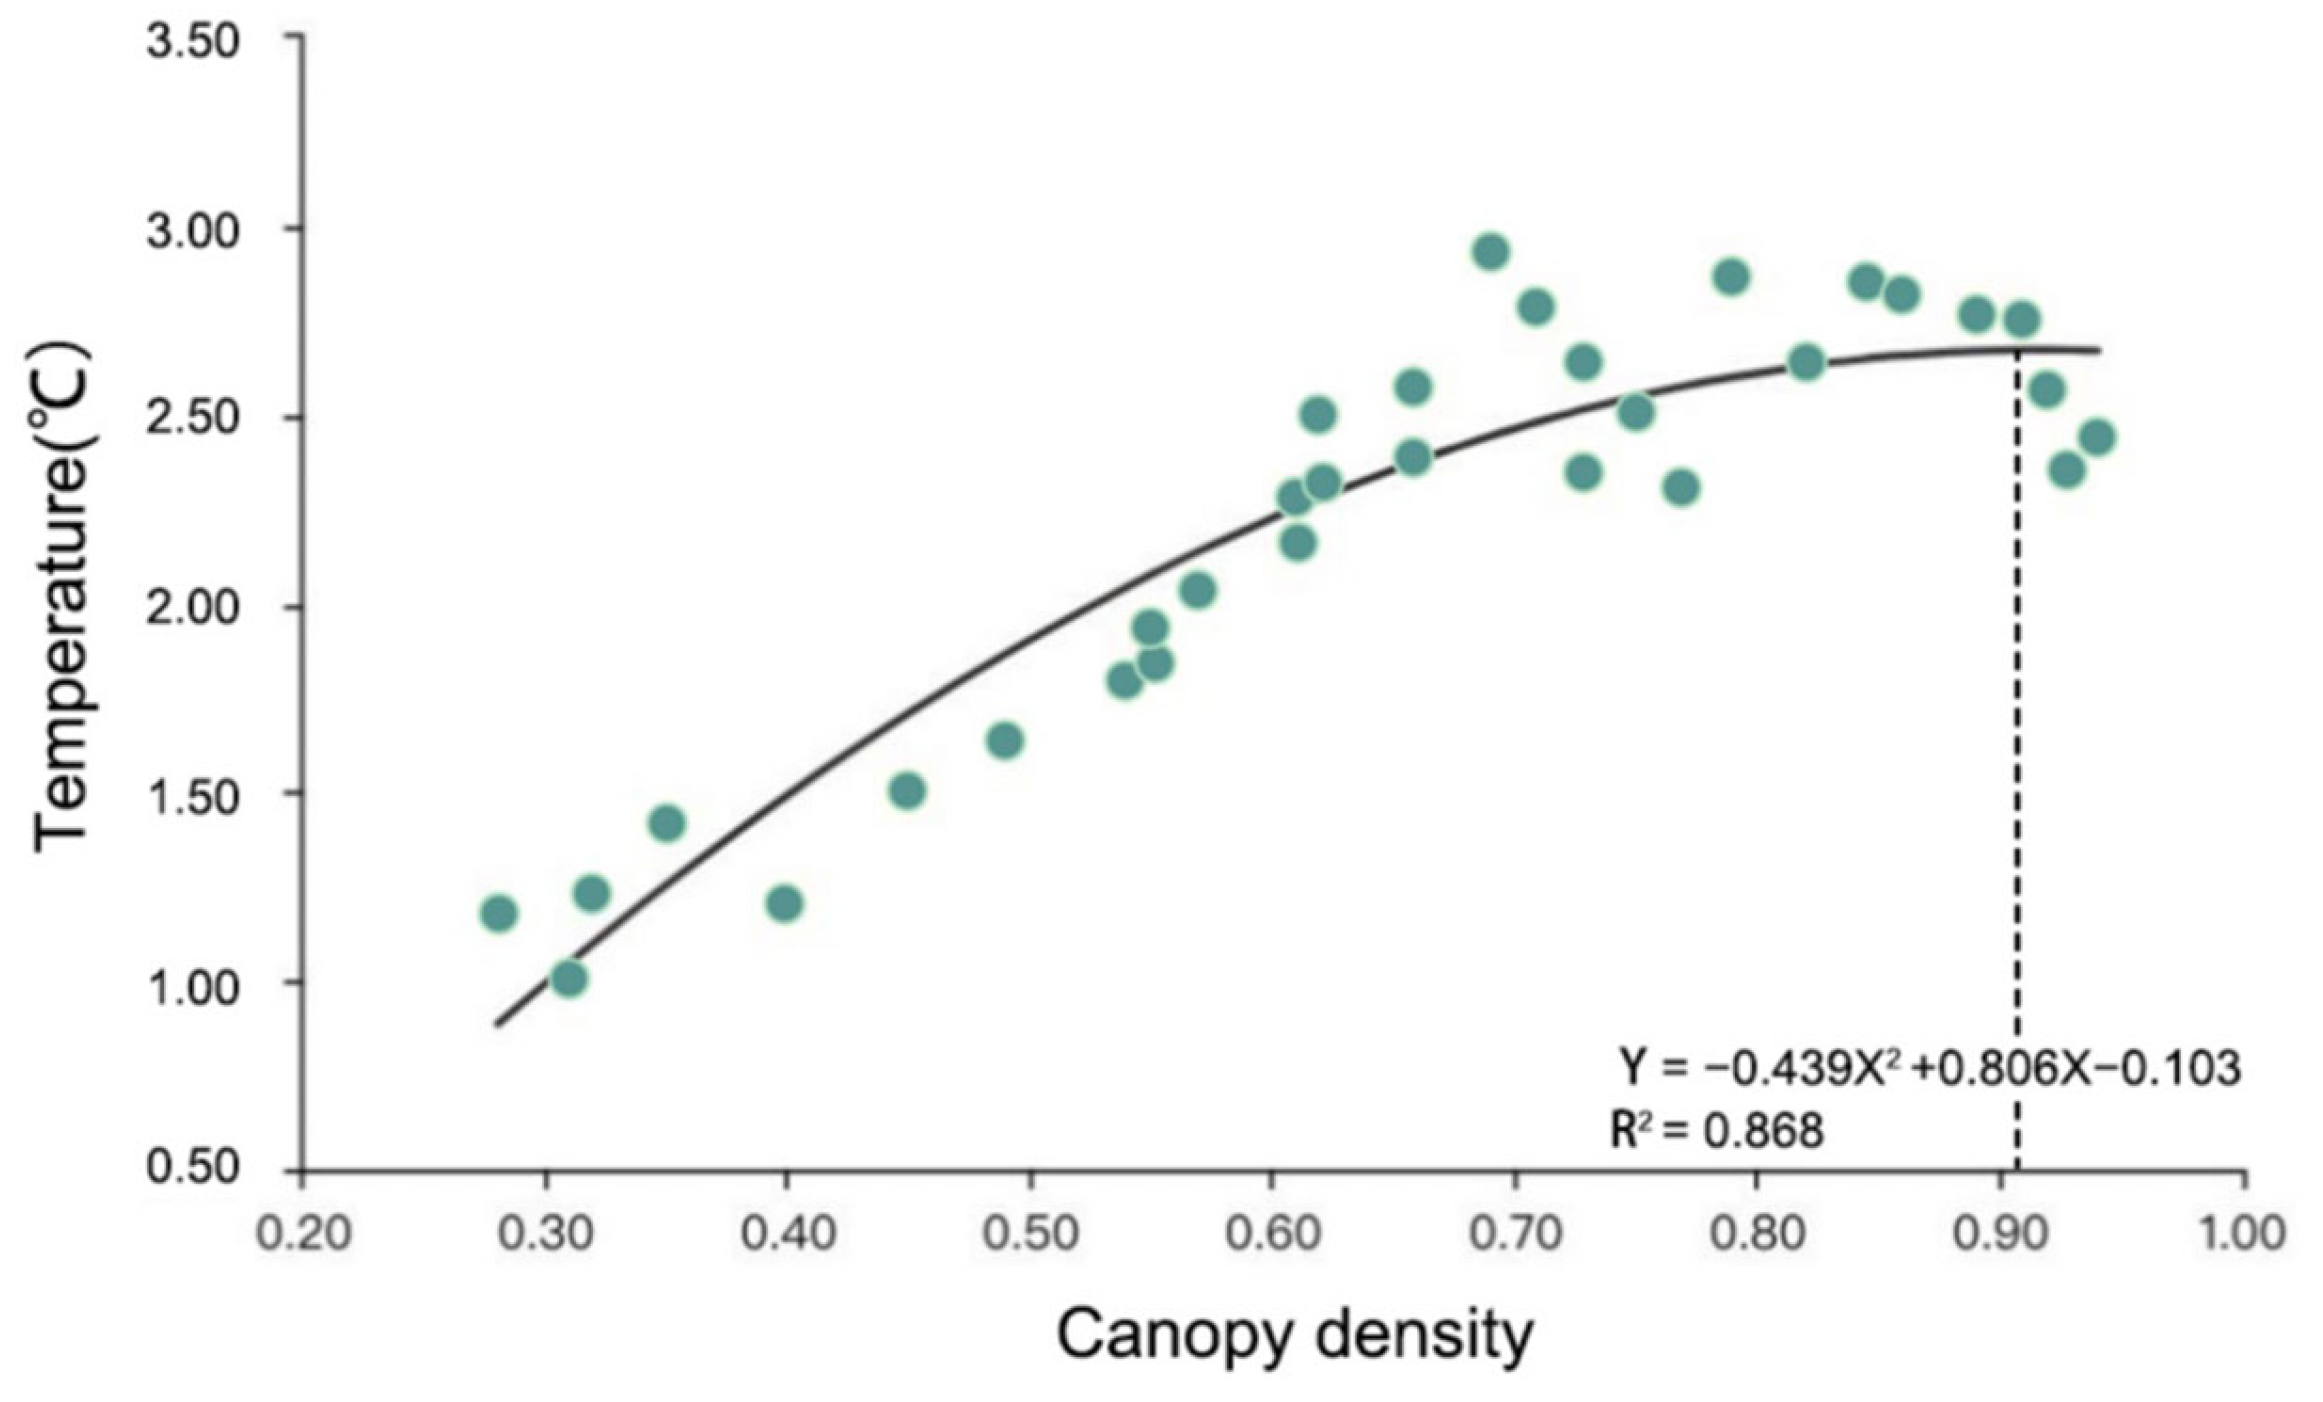
3.1.1. Relationship between Canopy Density and Cooling Effect
3.1.2. Relationship between Canopy Density and Humidification Effect
3.2. Influence of Tridimensional Green Biomass on Temperature and Humidity Effect
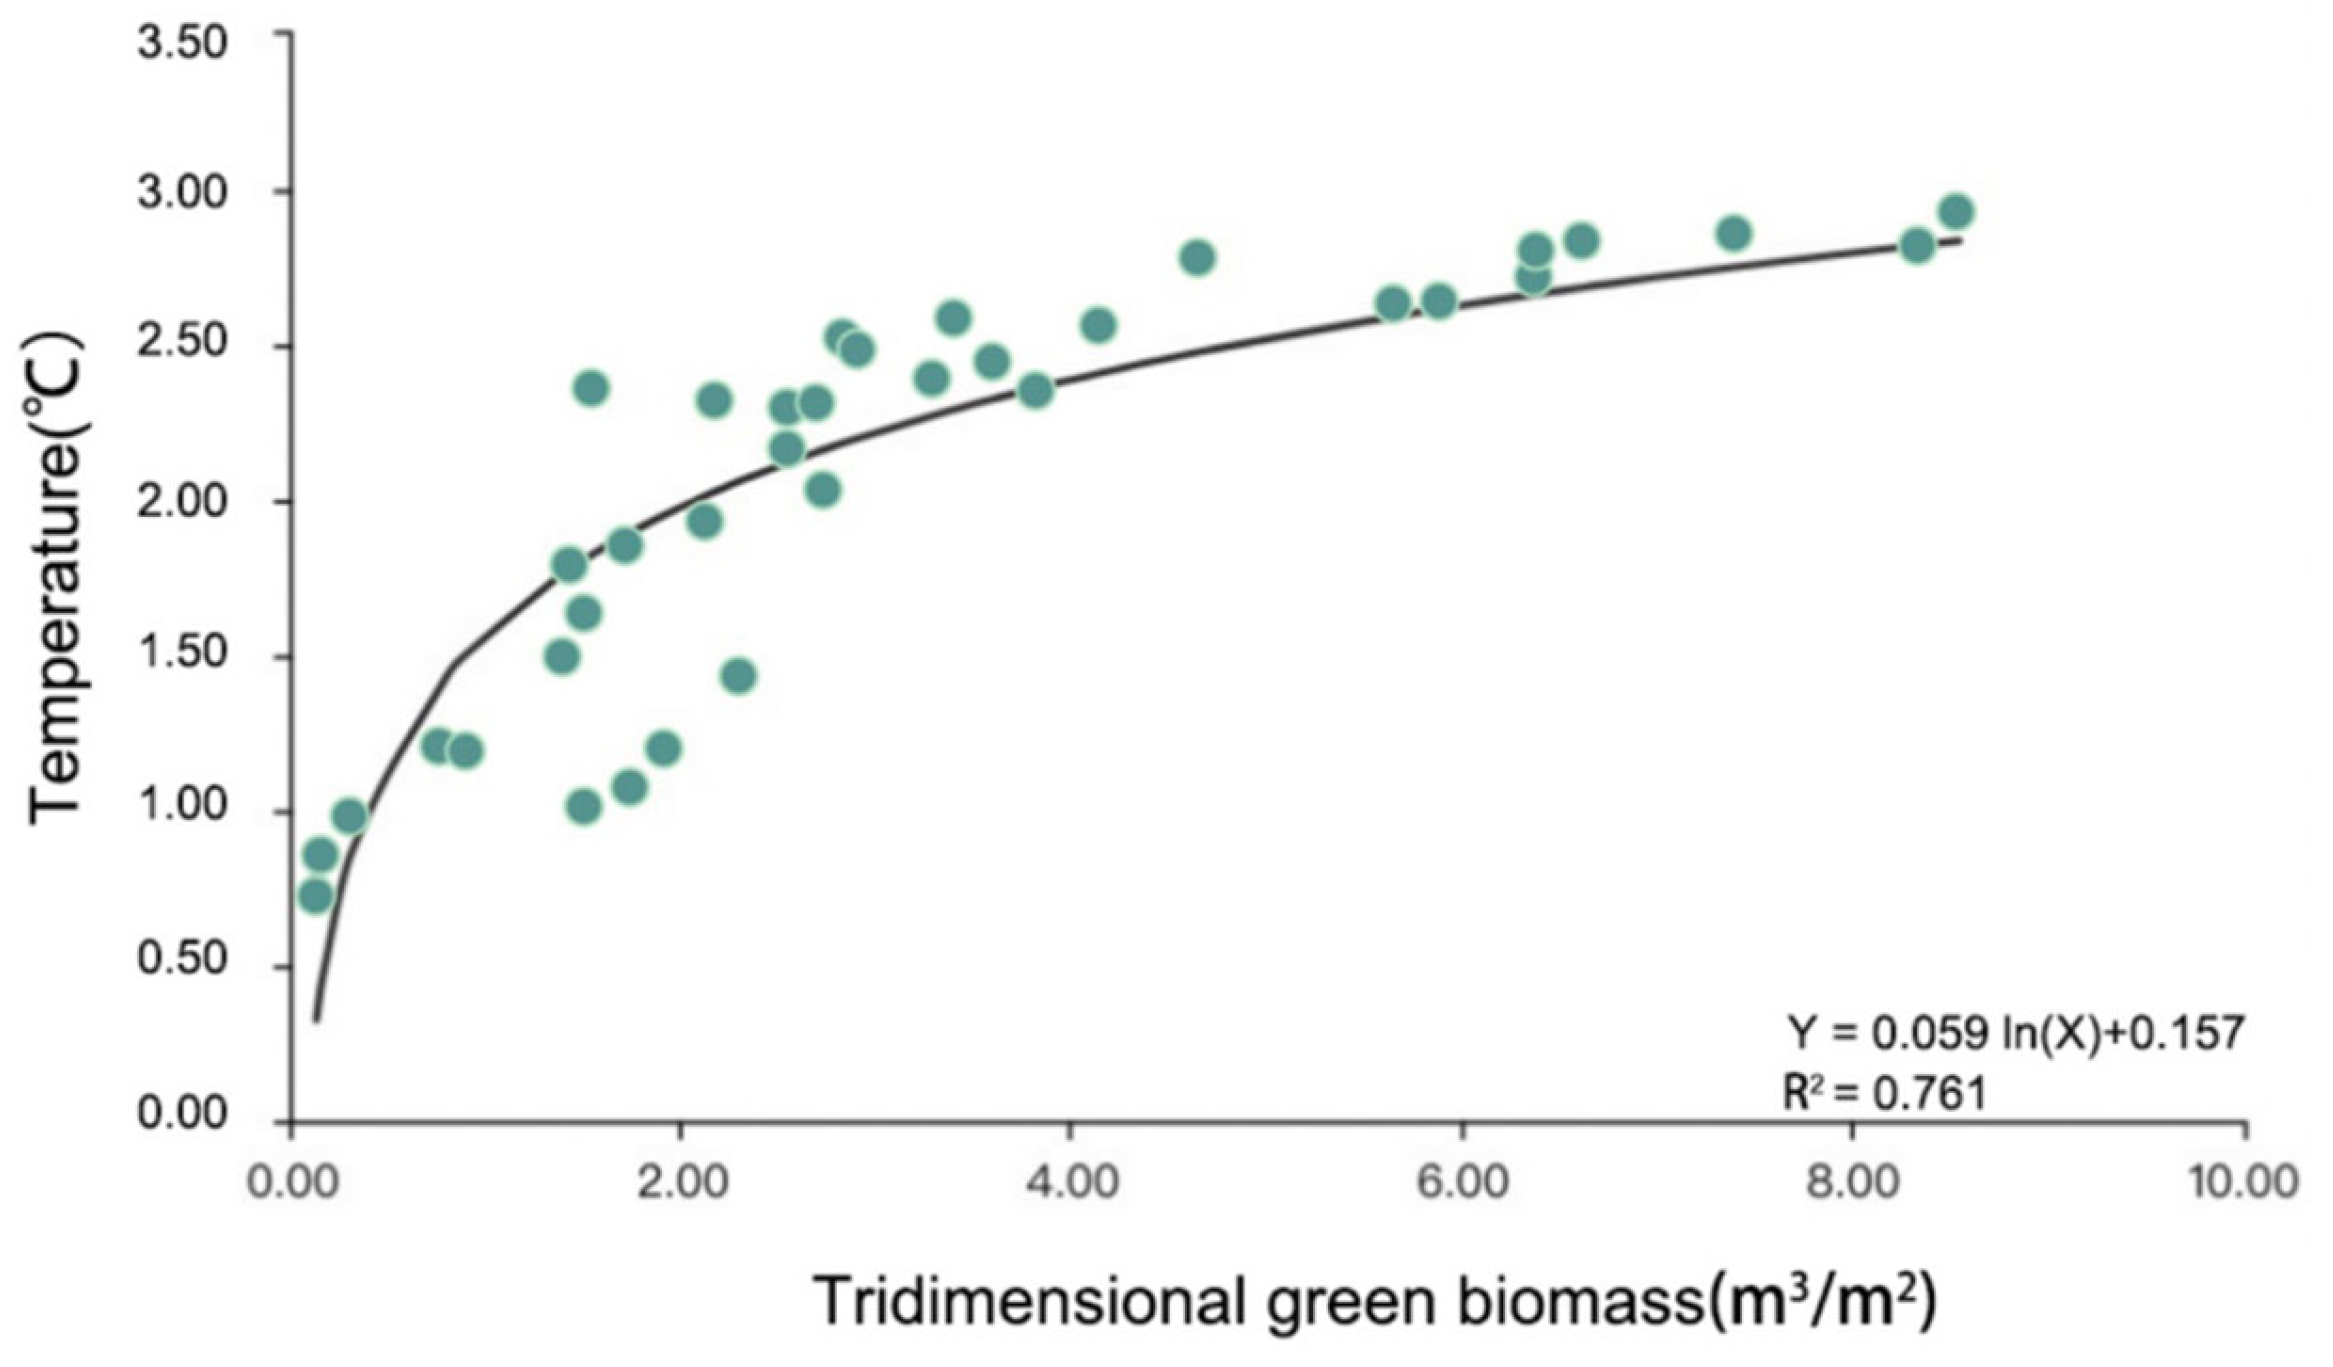
3.2.1. Relationship between Tridimensional Green Biomass and Cooling Effect
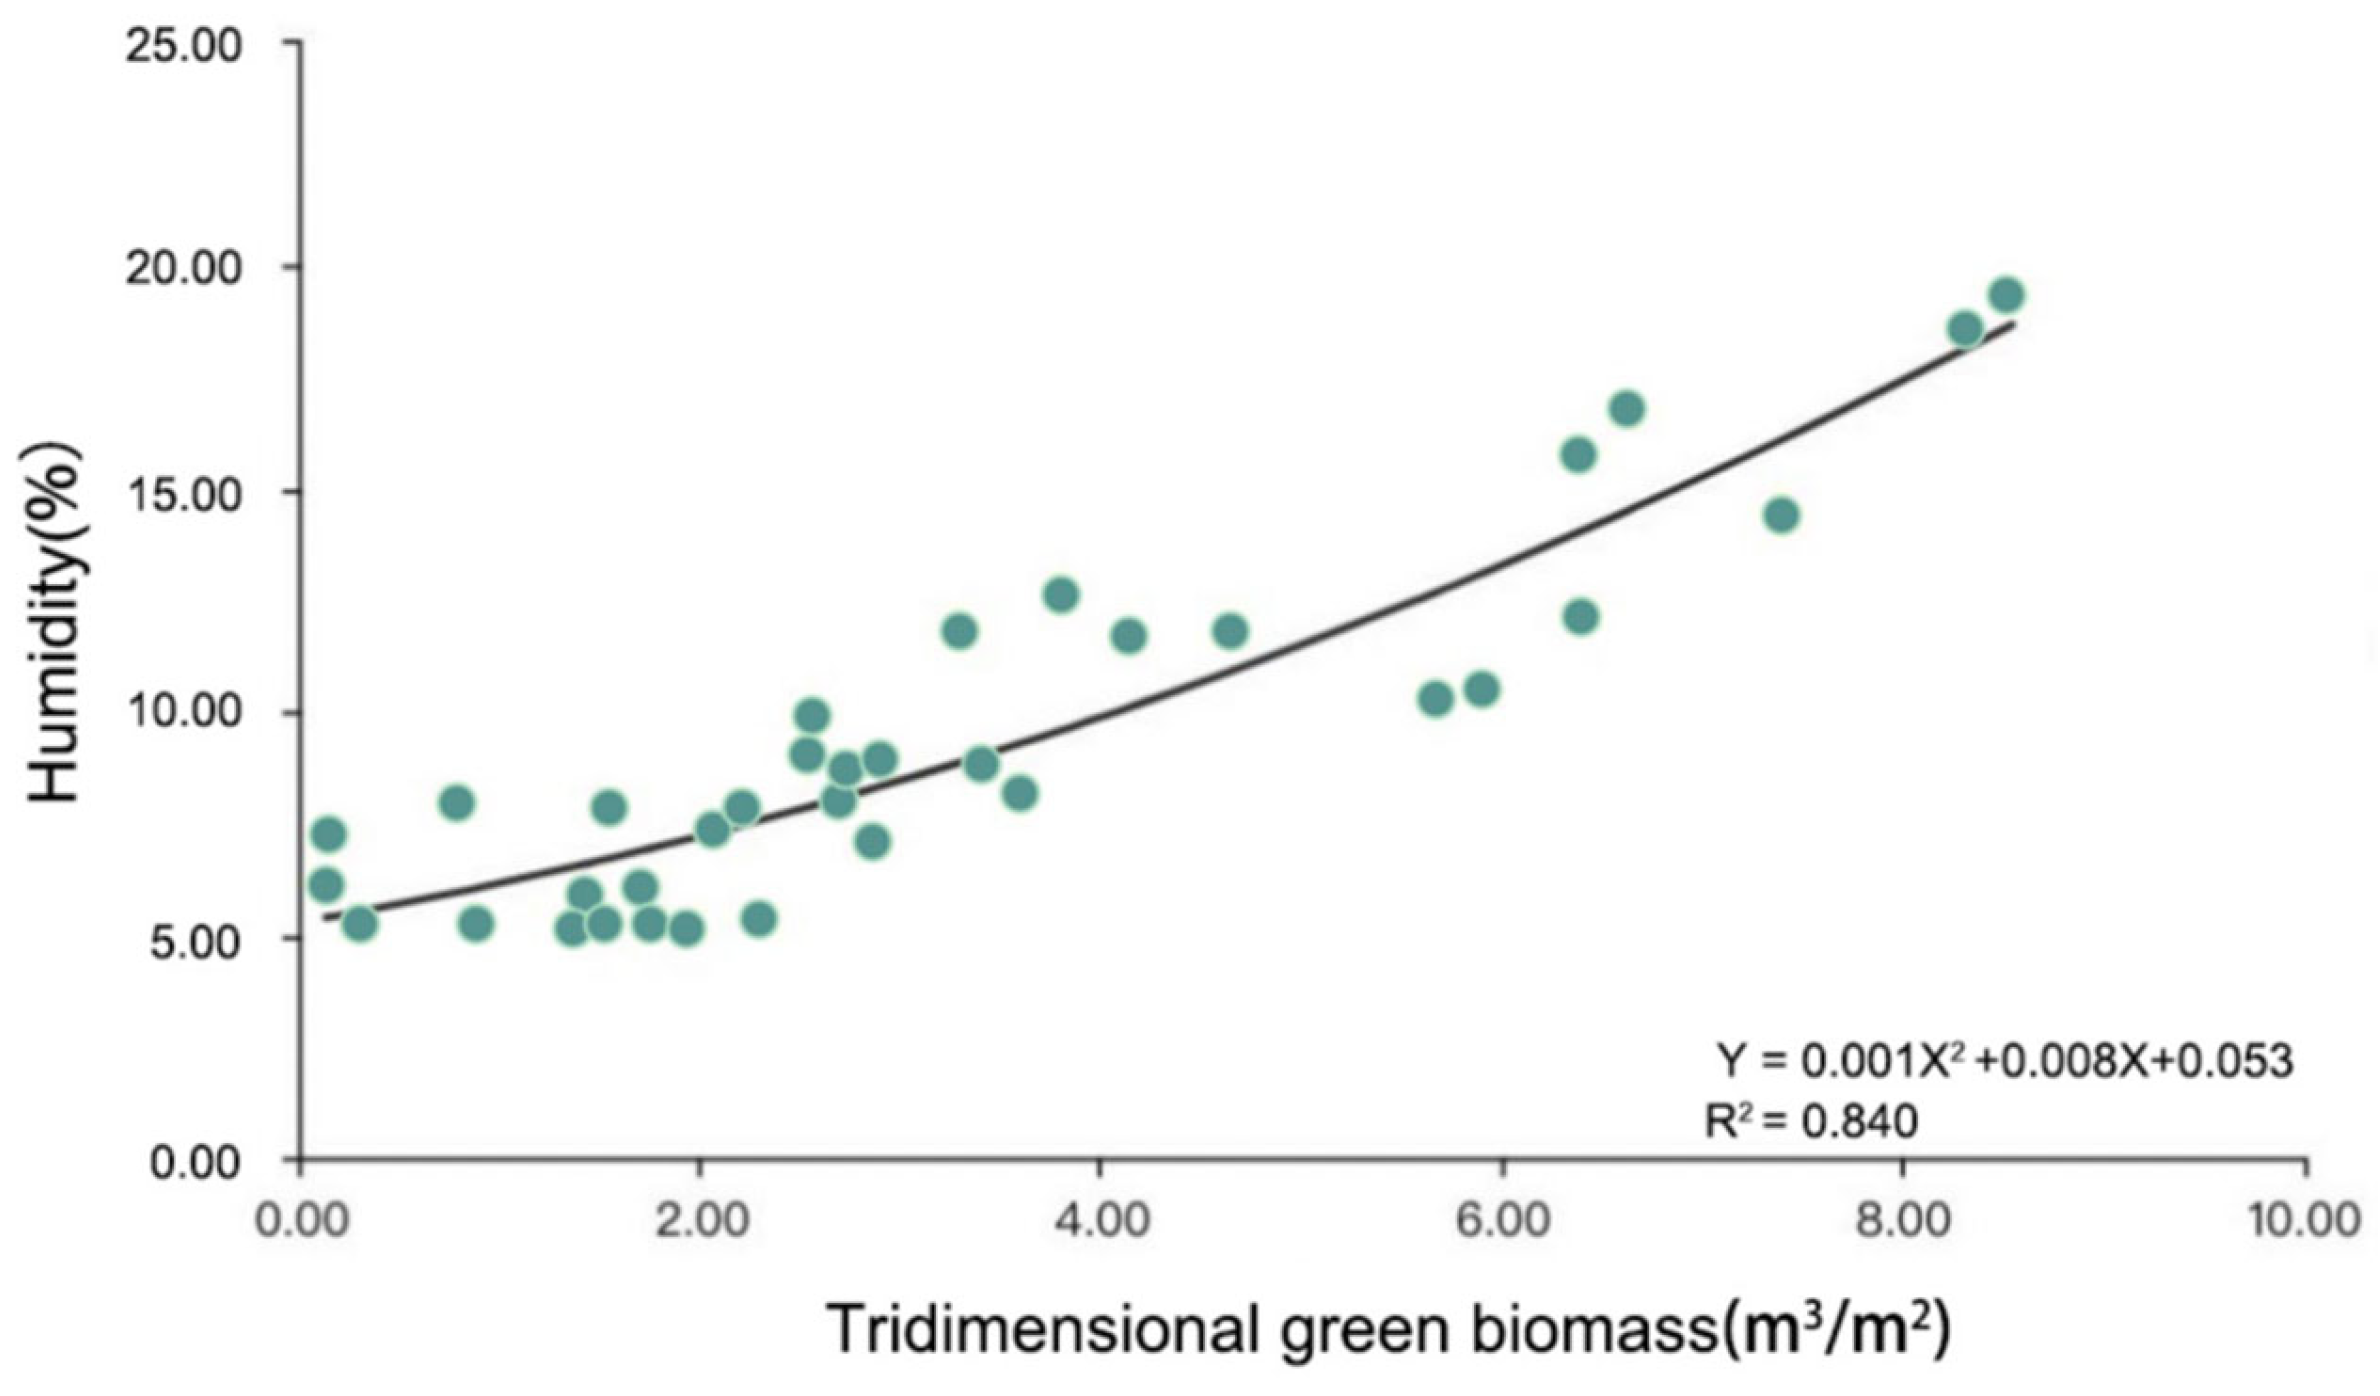
3.2.2. Relationship between Tridimensional Green Biomass and Humidification Effect
3.3. The Relationship between Discomfort and Plant Community Characteristics
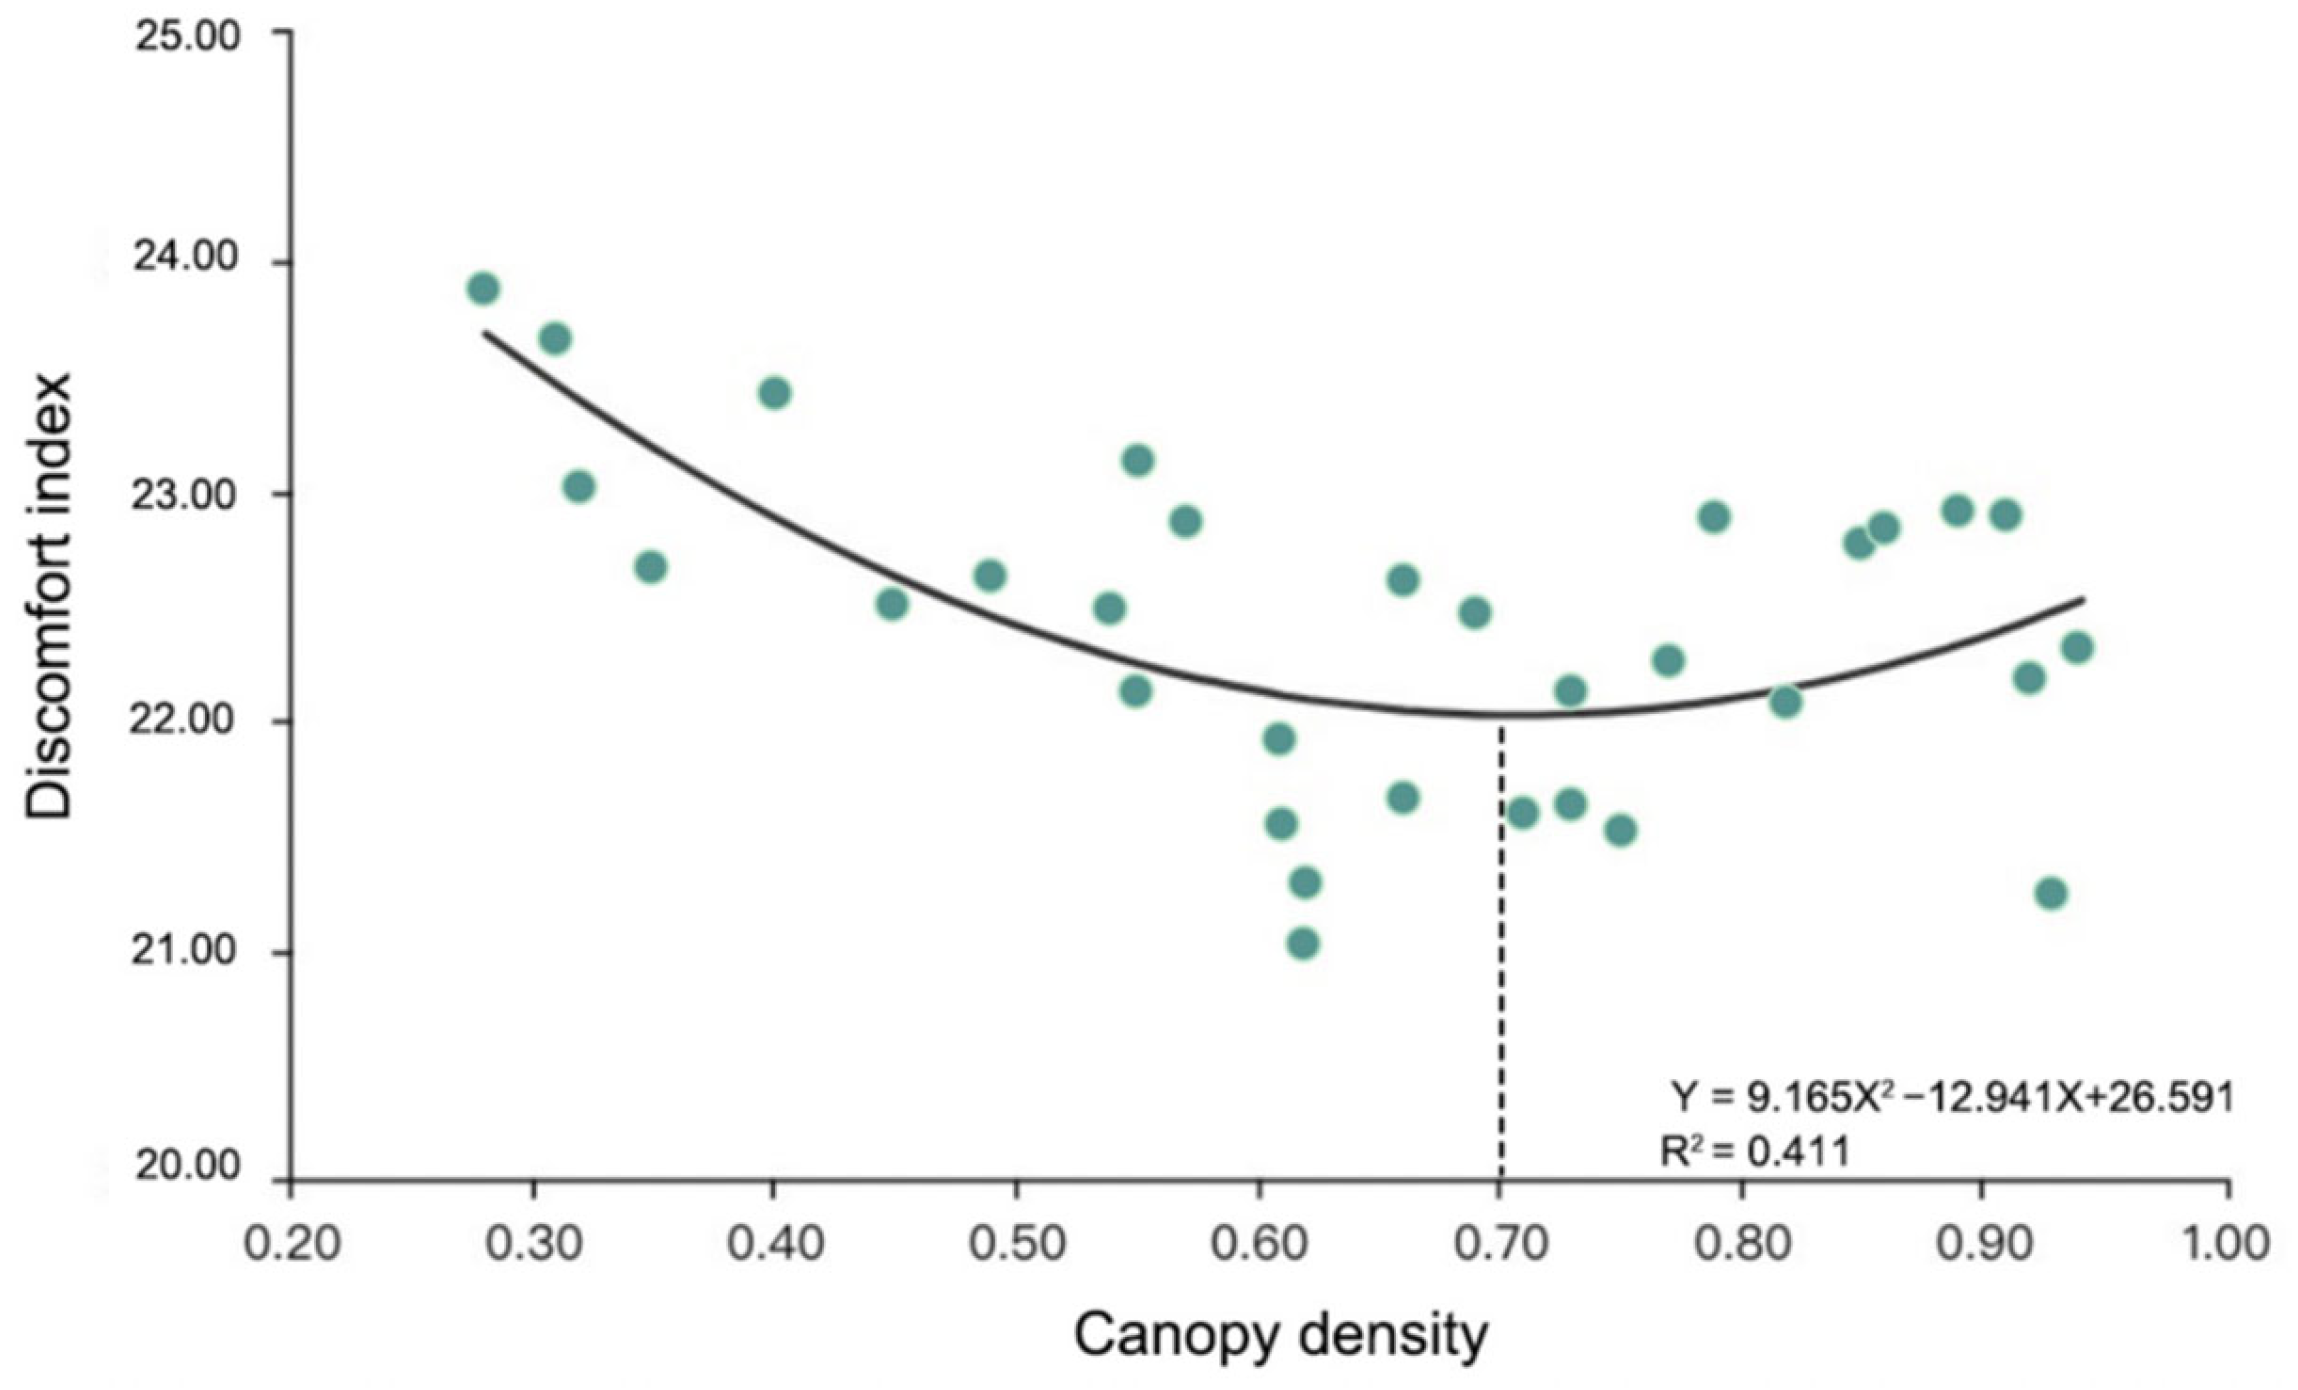
3.3.1. The Relationship between Discomfort and Canopy Density
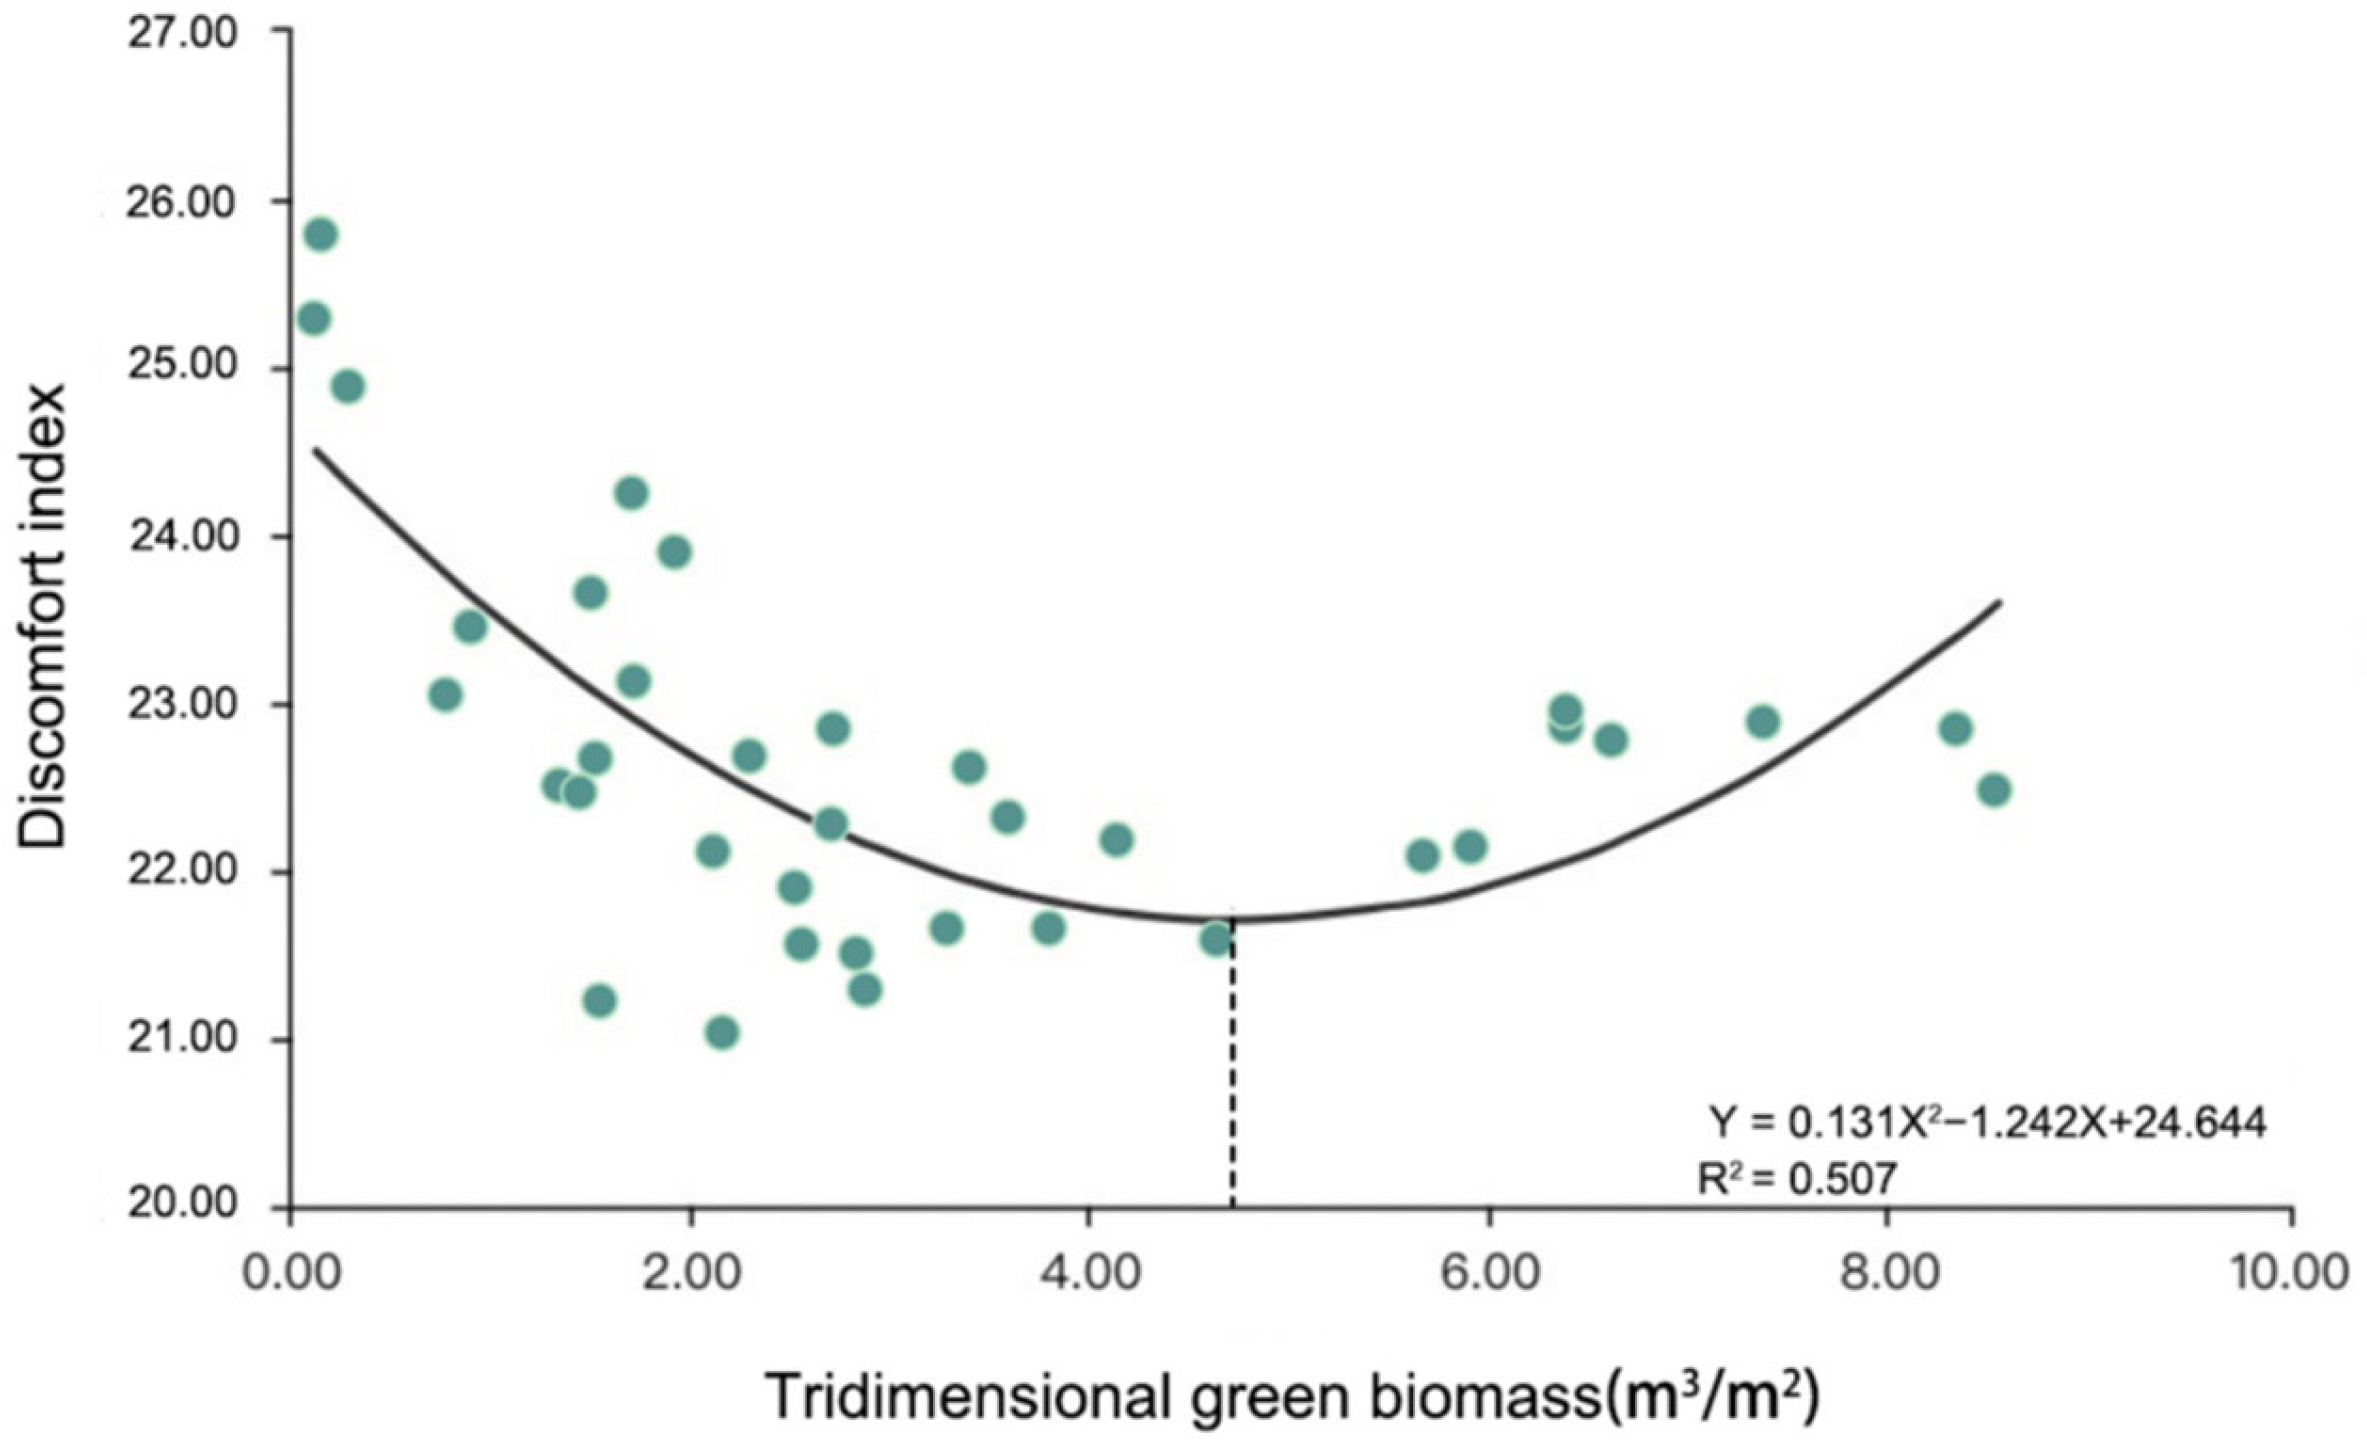
3.3.2. The Relationship between Discomfort and Tridimensional Green Biomass
3.4. The Relationship between Discomfort and Plant Community Structure
3.4.1. Vertical Structure
3.4.2. Plane Layout
4. Discussion
4.1. Temperature and Humidity Effects under the Influence of Plant Characteristics
4.2. Discomfort under the Influence of the Plant Community
4.3. Impact on the Design of the Park’s Climate and Environment
4.4. Limitations and Future Research
5. Conclusions
Author Contributions
Funding
Data Availability Statement
Acknowledgments
Conflicts of Interest
References
- Oke, T.R. The energetic basis of the urban heat island. Q. J. R. Meteorol. Soc. 1982, 108, 1–24. [Google Scholar] [CrossRef]
- Priyadarsini, R. Urban Heat Island and its Impact on Building Energy Consumption. Adv. Build. Energy Res. 2009, 3, 261–270. [Google Scholar] [CrossRef]
- Soga, M.; Gaston, K.J. Extinction of experience: The loss of human–nature interactions. Front. Ecol. Environ. 2016, 14, 94–101. [Google Scholar] [CrossRef] [Green Version]
- Lai, D.; Liu, W.; Gan, T.; Liu, K.; Chen, Q. A review of mitigating strategies to improve the thermal environment and thermal comfort in urban outdoor spaces. Sci. Total Environ. 2019, 661, 337–353. [Google Scholar] [CrossRef] [PubMed]
- Yan, H.; Wu, F.; Dong, L. Influence of a large urban park on the local urban thermal environment. Sci. Total Environ. 2018, 622–623, 882–891. [Google Scholar] [CrossRef]
- Shuhao, L.; Chang, S.; Ruochen, Y.; Jianye, Z.; Kun, L.; Kwangmin, H.; Shiro, T.; Junhua, Z. Using Crowdsourced Big Data to Unravel Urban Green Space Utilization during COVID-19 in Guangzhou, China. Land 2022, 11, 990. [Google Scholar]
- Escobedo, F.J.; Kroeger, T.; Wagner, J.E. Urban forests and pollution mitigation: Analyzing ecosystem services and disservices. Environ. Pollut. 2011, 159, 2078–2087. [Google Scholar] [CrossRef]
- García-Martínez, M.; Vanoye-Eligio, V.; Leyva-Ovalle, O.R.; Zetina-Córdoba, P.; Mejía, M. Diversity of Ants (Hymenoptera: Formicidae) in a Sub-Montane and Sub-Tropical Cityscape of Northeastern Mexico. Sociobiology 2019, 66, 44–47. [Google Scholar] [CrossRef] [Green Version]
- Rosas-Mejía, M.; Llarena-Hernández, C.; Núez-Pastrana, R.; Vanoye-Eligio, V.; García-Martínez, M. Value of a Heterogeneous Urban Green Space for Ant1 Diversity in a Highland City in Central Eastern Mexico. Southwest. Entomol. 2020, 45, 461–474. [Google Scholar] [CrossRef]
- Peters, E.B.; McFadden, J.P.; Montgomery, R.A. Biological and environmental controls on tree transpiration in a suburban landscape. J. Geophys. Res. Biogeosci. 2010, 115, G04006. [Google Scholar] [CrossRef]
- Rötzer, T.; Rahman, M.A.; Moser-Reischl, A.; Pauleit, S.; Pretzsch, H. Process based simulation of tree growth and ecosystem services of urban trees under present and future climate conditions. Sci. Total Environ. 2019, 676, 651–664. [Google Scholar] [CrossRef] [PubMed]
- Moser-Reischl, A.; Rahman, M.A.; Pauleit, S.; Pretzsch, H.; Rötzer, T. Growth patterns and effects of urban micro-climate on two physiologically contrasting urban tree species. Landsc. Urban Plan. 2019, 183, 88–99. [Google Scholar] [CrossRef]
- Rahman, M.A.; Armson, D.; Ennos, A.R. A comparison of the growth and cooling effectiveness of five commonly planted urban tree species. Urban Ecosyst. 2015, 18, 371–389. [Google Scholar] [CrossRef]
- Fung, C.K.W.; Jim, C.Y. Microclimatic resilience of subtropical woodlands and urban-forest benefits. Urban For. Urban Green. 2019, 42, 100–112. [Google Scholar] [CrossRef]
- Lin, B.-S.; Lin, Y.-J. Cooling Effect of Shade Trees with Different Characteristics in a Subtropical Urban Park. HortScience 2010, 45, 83–86. [Google Scholar] [CrossRef] [Green Version]
- Kabisch, N.; Qureshi, S.; Haase, D. Human–environment interactions in urban green spaces—A systematic review of contemporary issues and prospects for future research. Environ. Impact Assess. Rev. 2015, 50, 25–34. [Google Scholar] [CrossRef]
- Escobedo, F.J.; Adams, D.C.; Timilsina, N. Urban forest structure effects on property value. Ecosyst. Serv. 2015, 12, 209–217. [Google Scholar] [CrossRef]
- Morakinyo, T.E.; Kong, L.; Lau, K.L.; Yuan, C.; Ng, E. A study on the impact of shadow-cast and tree species on in-canyon and neighborhood’s thermal comfort. Build. Environ. 2000, 115, 1–17. [Google Scholar] [CrossRef]
- Lai, D.; Guo, D.; Hou, Y.; Lin, C.; Chen, Q. Studies of outdoor thermal comfort in northern China. Build. Environ. 2014, 77, 110–118. [Google Scholar] [CrossRef]
- Gagge, A.P.; Fobelets, A.P.; Berglund, L.G. A standard predictive index of human response to the thermal environment. ASHRAE Trans. 1986, 92, 709–731. [Google Scholar]
- Hadianpour, M.; Mahdavinejad, M.; Bemanian, M.; Nasrollahi, F. Seasonal differences of subjective thermal sensation and neutral temperature in an outdoor shaded space in Tehran, Iran. Sustain. Cities Soc. 2018, 39, 751–764. [Google Scholar] [CrossRef]
- Liu, J.; Yang, X.; Jiang, Q.; Qiu, J.; Liu, Y. Occupants’ thermal comfort and perceived air quality in natural ventilated classrooms during cold days. Build. Environ. 2019, 158, 73–82. [Google Scholar] [CrossRef]
- Shashua-Bar, L.; Pearlmutter, D.; Erell, E. The influence of trees and grass on outdoor thermal comfort in a hot-arid environment. Int. J. Climatol. 2011, 31, 1498–1506. [Google Scholar] [CrossRef]
- Ali-Toudert, F.; Mayer, H. Effects of asymmetry, galleries, overhanging facades and vegetation on thermal comfort in urban street canyons. Sol. Energy 2007, 81, 742–754. [Google Scholar] [CrossRef]
- Streiling, S.; Matzarakis, A. Influence of single and small clusters of trees on the bioclimate of a city: A case study. J. Arboric. 2003, 29, 309–316. [Google Scholar] [CrossRef]
- Matzarakis, A.; Streiling, S. Stadtklimatische Eigenschaften von Bumen. Gefahrst. Reinhalt. Luft 2004, 64, 307–310. [Google Scholar]
- Yang, A.S.; Juan, Y.H.; Wen, C.Y.; Chang, C.J. Numerical simulation of cooling effect of vegetation enhancement in a subtropical urban park. Appl. Energy 2017, 192, 178–200. [Google Scholar] [CrossRef]
- Bowler, D.E.; Buyung-Ali, L.; Knight, T.M.; Pullin, A.S. Urban greening to cool towns and cities: A systematic review of the empirical evidence. Landsc. Urban Plan. 2010, 97, 147–155. [Google Scholar] [CrossRef]
- Cohen, P.; Potchter, O.; Matzarakis, A. Daily and seasonal climatic conditions of green urban open spaces in the Mediterranean climate and their impact on human comfort. Build. Environ. 2012, 51, 285–296. [Google Scholar] [CrossRef]
- Yang, Y.; Zhou, D.; Wang, Y.; Ma, D.; Chen, W.; Xu, D.; Zhu, Z. Economical and outdoor thermal comfort analysis of greening in multistory residential areas in Xi’an. Sustain. Cities Soc. 2019, 51, 101730. [Google Scholar] [CrossRef]
- Georgi, N.J.; Zafiriadis, K. The impact of park trees on microclimate in urban areas. Urban Ecosyst. 2006, 9, 195–209. [Google Scholar] [CrossRef]
- Taleghani, M. Outdoor thermal comfort by different heat mitigation strategies—A review. Energy Rev. 2018, 81, 2011–2018. [Google Scholar] [CrossRef]
- Smithers, R.J.; Doick, K.J.; Burton, A.; Sibille, R.; Steinbach, D.; Harris, R.; Groves, L.; Blicharska, M. Comparing the relative abilities of tree species to cool the urban environment. Urban Ecosyst. 2018, 21, 851–862. [Google Scholar] [CrossRef]
- Wang, Y.; Bakker, F.; de Groot, R.; Wörtche, H.; Leemans, R. Effects of urban green infrastructure (UGI) on local outdoor microclimate during the growing season. Environ. Monit. Assess. 2015, 187, 732. [Google Scholar] [CrossRef] [PubMed] [Green Version]
- Zhang, B.; Xie, G.-D.; Gao, J.-X.; Yang, Y. The cooling effect of urban green spaces as a contribution to energy-saving and emission-reduction: A case study in Beijing, China. Build. Environ. 2014, 76, 37–43. [Google Scholar] [CrossRef]
- Oke, T.R.; Mills, G.; Christen, A.; Voogt, J.A. Urban Climates; Cambridge University Press: Cambridge, UK, 2017. [Google Scholar]
- Taha, H.; Akbari, H.; Rosenfeld, A.; Huang, J. Residential cooling loads and the urban heat island—The effects of albedo. Build. Environ. 1988, 23, 271–283. [Google Scholar] [CrossRef]
- Ss, A.; Ja, B. Role of geospatial technology in understanding urban green space of Kalaburagi city for sustainable planning. Urban For. Urban Green. 2019, 46, 126450. [Google Scholar]
- Makhelouf, A. The effect of green spaces on urban climate and pollution. J. Environ. Health Sci. Eng. 2009, 6, 35–40. [Google Scholar]
- Zhang, Z.; Lv, Y.; Pan, H. Cooling and humidifying effect of plant communities in subtropical urban parks. Urban For. Urban Green. 2013, 12, 323–329. [Google Scholar] [CrossRef]
- Amani-Beni, M.; Zhang, B.; Xie, G.-D.; Xu, J. Impact of urban park’s tree, grass and waterbody on microclimate in hot summer days: A case study of Olympic Park in Beijing, China. Urban For. Urban Green. 2018, 32, 1–6. [Google Scholar] [CrossRef]


| Measurement Date | Temperature Condition | Weather Condition | Wind Direction |
|---|---|---|---|
| 21 August 2020 | 26 °C/14 °C | Sunny | Northeasterly wind, levels 1–2 |
| 22 August 2020 | 27 °C/ 17 °C | Sunny/cloudy | Southwesterly wind, levels 1–2 |
| 23 August 2020 | 27 °C/17 °C | Sunny/cloudy | Southwesterly wind, level 3 |
| Instrument Name | Model and Origin | Experimental Use | Parameter Range |
|---|---|---|---|
| Aerial unmanned aerial vehicle (UAV) | Phantom 4 Pro/China | Takes photos of the sample to obtain the real picture | Maximum altitude: 6000 m Fov84° 20 megapixels Photo resolution: 5472 × 3648/4864 × 3648/5472 × 3078 |
| Temperature and humidity recorder | Tes-1361c/Taiwan | Measures the temperature and humidity of the sample | Measurement range: Humidity: 10%–95% R.H Temperature: −2–20 °C −60 °C/−4 ° F − + 140 ° f Measurement accuracy: Humidity: ±3% R.H − ±5% R.H Temperature: ±0.8 °C, ±1.5° f |
| Grade | Temperature Humidity Effect on Discomfort Index (DI) | Sensory Level |
|---|---|---|
| 1 | <21.0 | No discomfort. |
| 2 | 21.0–23.9 | A small number of people felt uncomfortable. Discomfort expressed by <50% of the population. |
| 3 | 24.0–26.9 | Most people did not feel comfortable. Discomfort expressed by >50% of the population. |
| 4 | 27.0–28.9 | Most people did not feel comfortable. Discomfort expressed by the majority of the population. |
| 5 | 29.0–31.9 | Almost everyone felt uncomfortable. Discomfort expressed by all. |
| 6 | >32.0 | Risk of heatstroke. Stages of medical alarm. |
| Community Type (Mean ± SD) | F | p | |||||
|---|---|---|---|---|---|---|---|
| Arbor Type (n = 6) | Arbor–Shrub–Grass Type (n = 20) | Arbor–Grassland Type (n = 3) | Shrub–Grass Type (n = 3) | Grassland Type (n = 4) | |||
| Discomfort index | 22.89 ± 0.35 | 22.07 ± 0.61 | 22.28 ± 0.31 | 23.52 ± 0.45 | 25.04 ± 0.65 | 26.323 | 0.000 ** |
| Item | Schematic Diagram of Plane Layout | Real-Life Example | Average Discomfort Index |
|---|---|---|---|
| Adaptive type |  |  | 22.49 |
| Encircling type |  |  | 21.93 |
| Grass type |  | 24.70 | |
| Encircling type |  |  | 21.91 |
| Determinant type |  |  | 22.47 |
Publisher’s Note: MDPI stays neutral with regard to jurisdictional claims in published maps and institutional affiliations. |
© 2022 by the authors. Licensee MDPI, Basel, Switzerland. This article is an open access article distributed under the terms and conditions of the Creative Commons Attribution (CC BY) license (https://creativecommons.org/licenses/by/4.0/).
Share and Cite
Bao, Y.; Gao, M.; Luo, D.; Zhou, X. The Influence of Plant Community Characteristics in Urban Parks on the Microclimate. Forests 2022, 13, 1342. https://doi.org/10.3390/f13091342
Bao Y, Gao M, Luo D, Zhou X. The Influence of Plant Community Characteristics in Urban Parks on the Microclimate. Forests. 2022; 13(9):1342. https://doi.org/10.3390/f13091342
Chicago/Turabian StyleBao, Yu, Ming Gao, Dan Luo, and Xudan Zhou. 2022. "The Influence of Plant Community Characteristics in Urban Parks on the Microclimate" Forests 13, no. 9: 1342. https://doi.org/10.3390/f13091342