
Spatiotemporal Distribution Patterns of Climbers along an Abiotic Gradient in Jhelum District, Punjab, Pakistan


 , ,
, ,  , , ,
, , ,  ,
,  and
and
Abstract
:1. Introduction
2. Materials and Methods
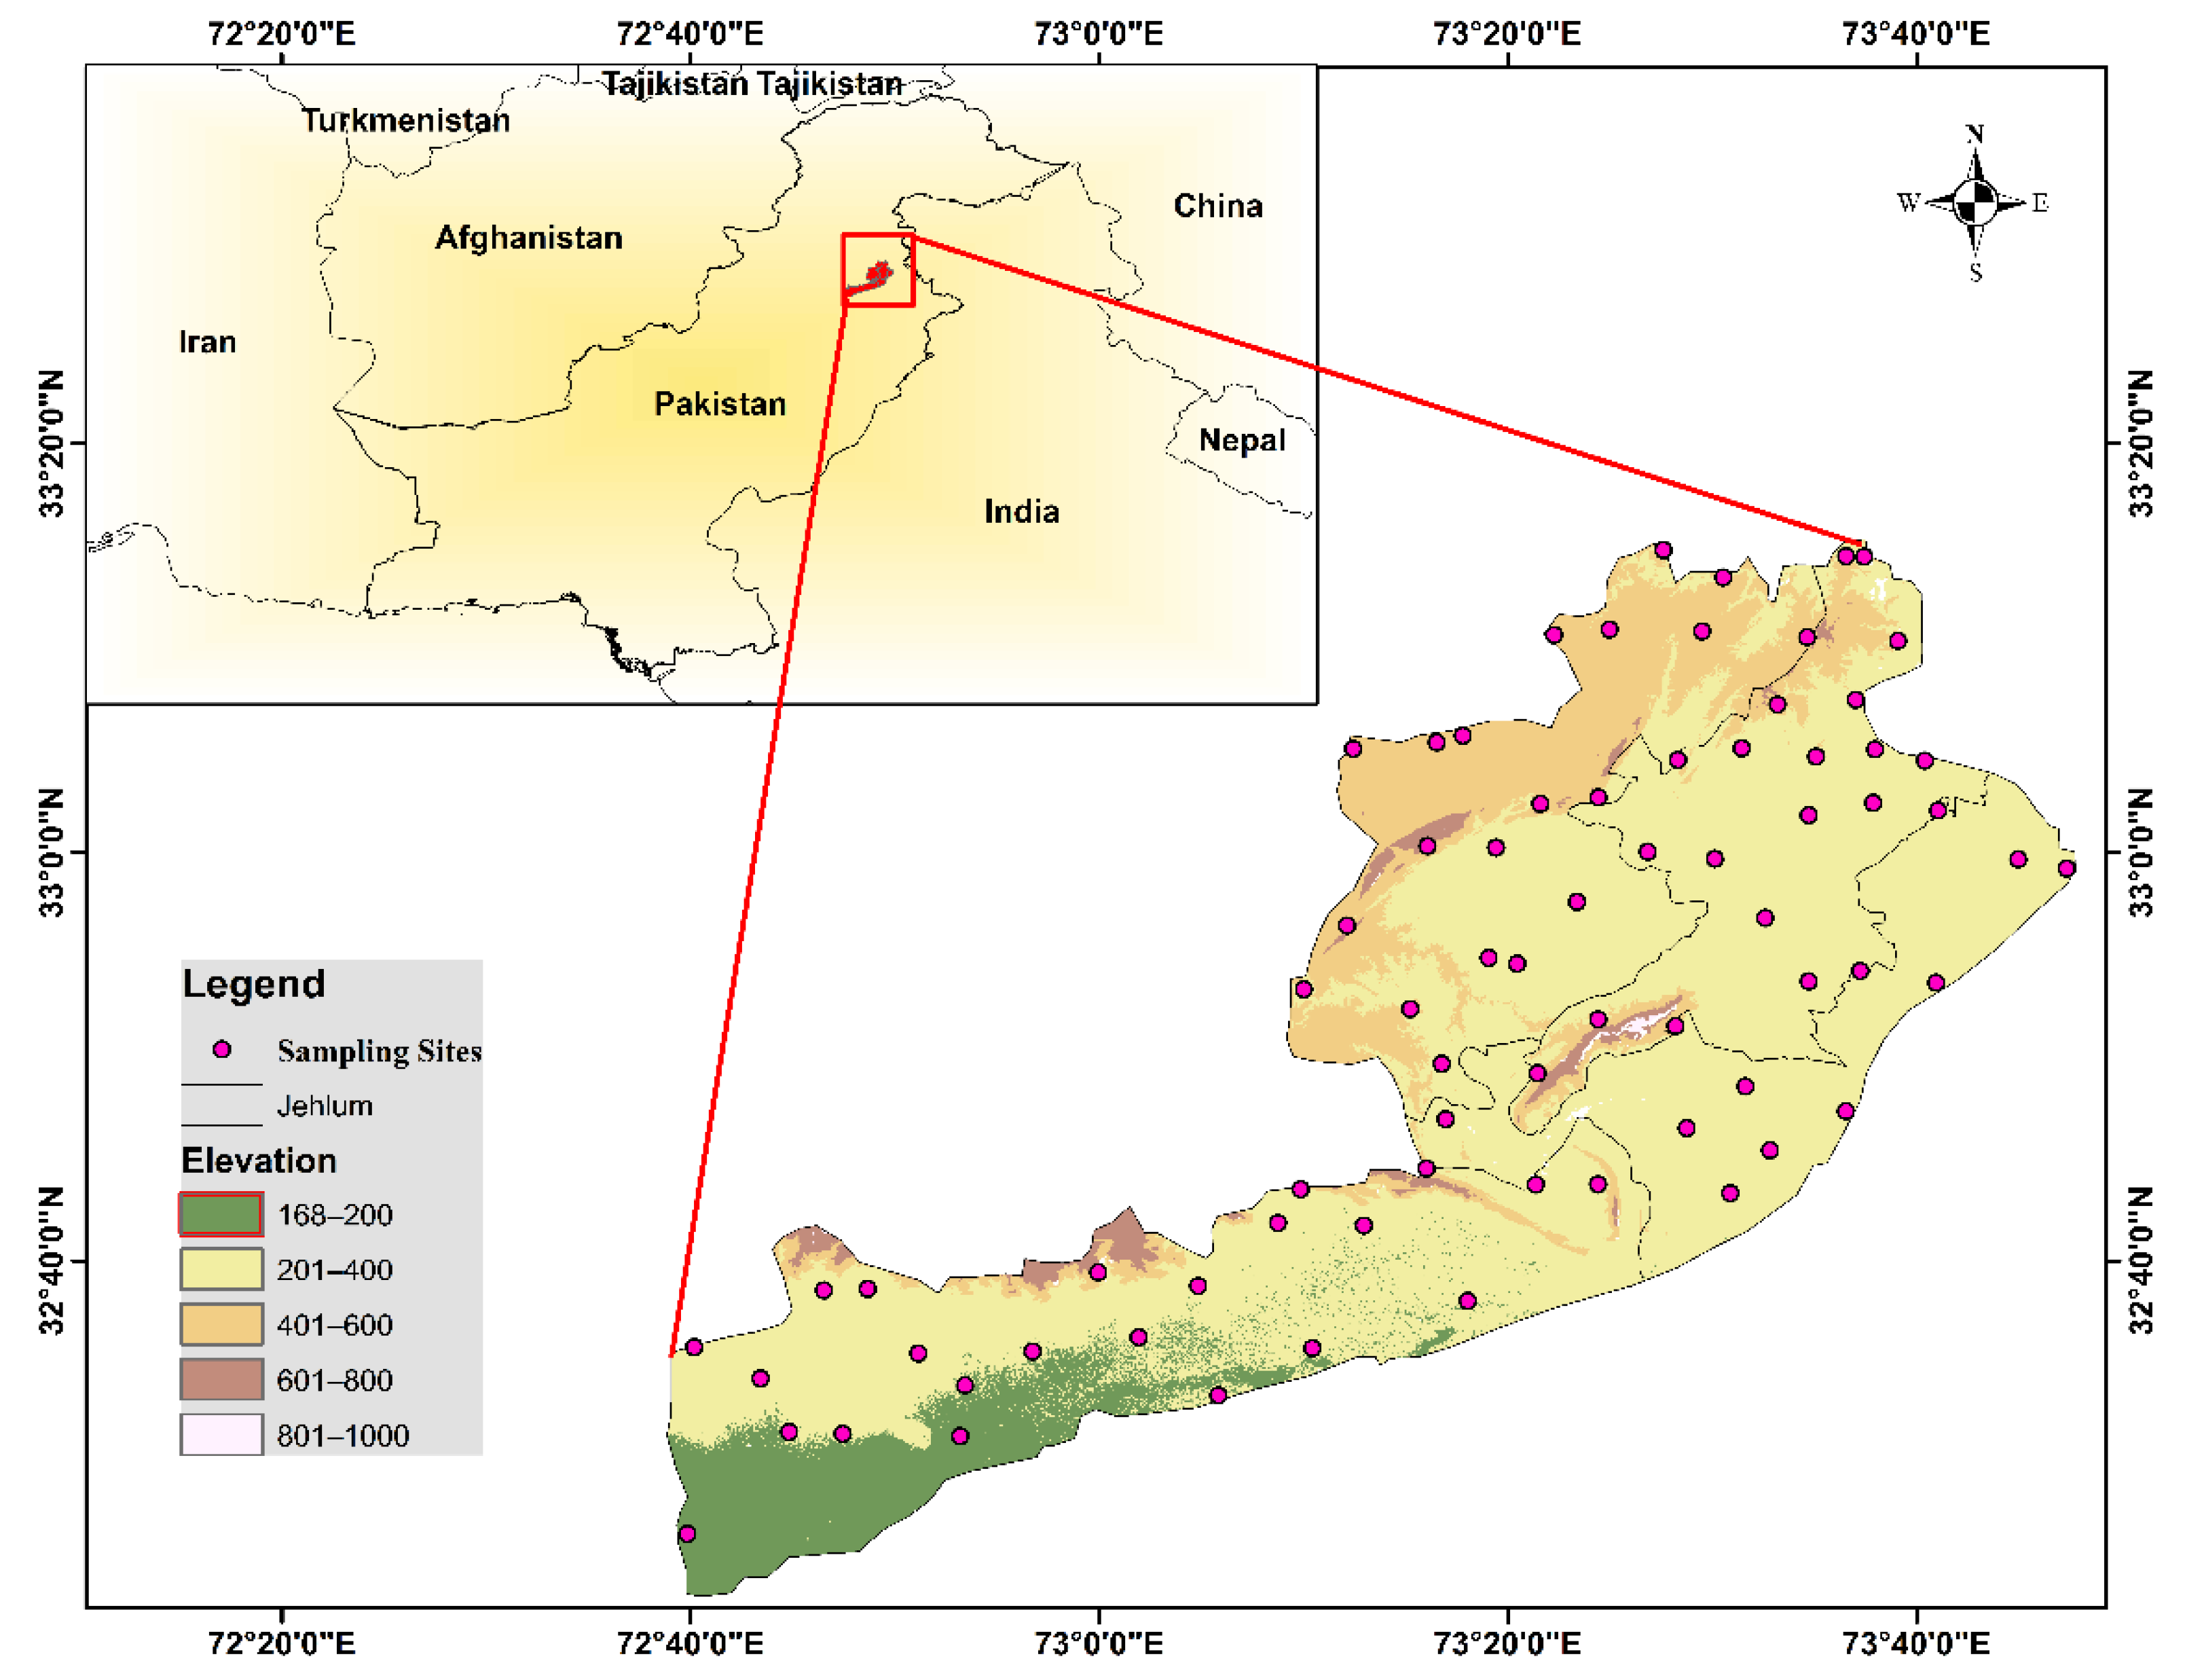
2.1. Study Area
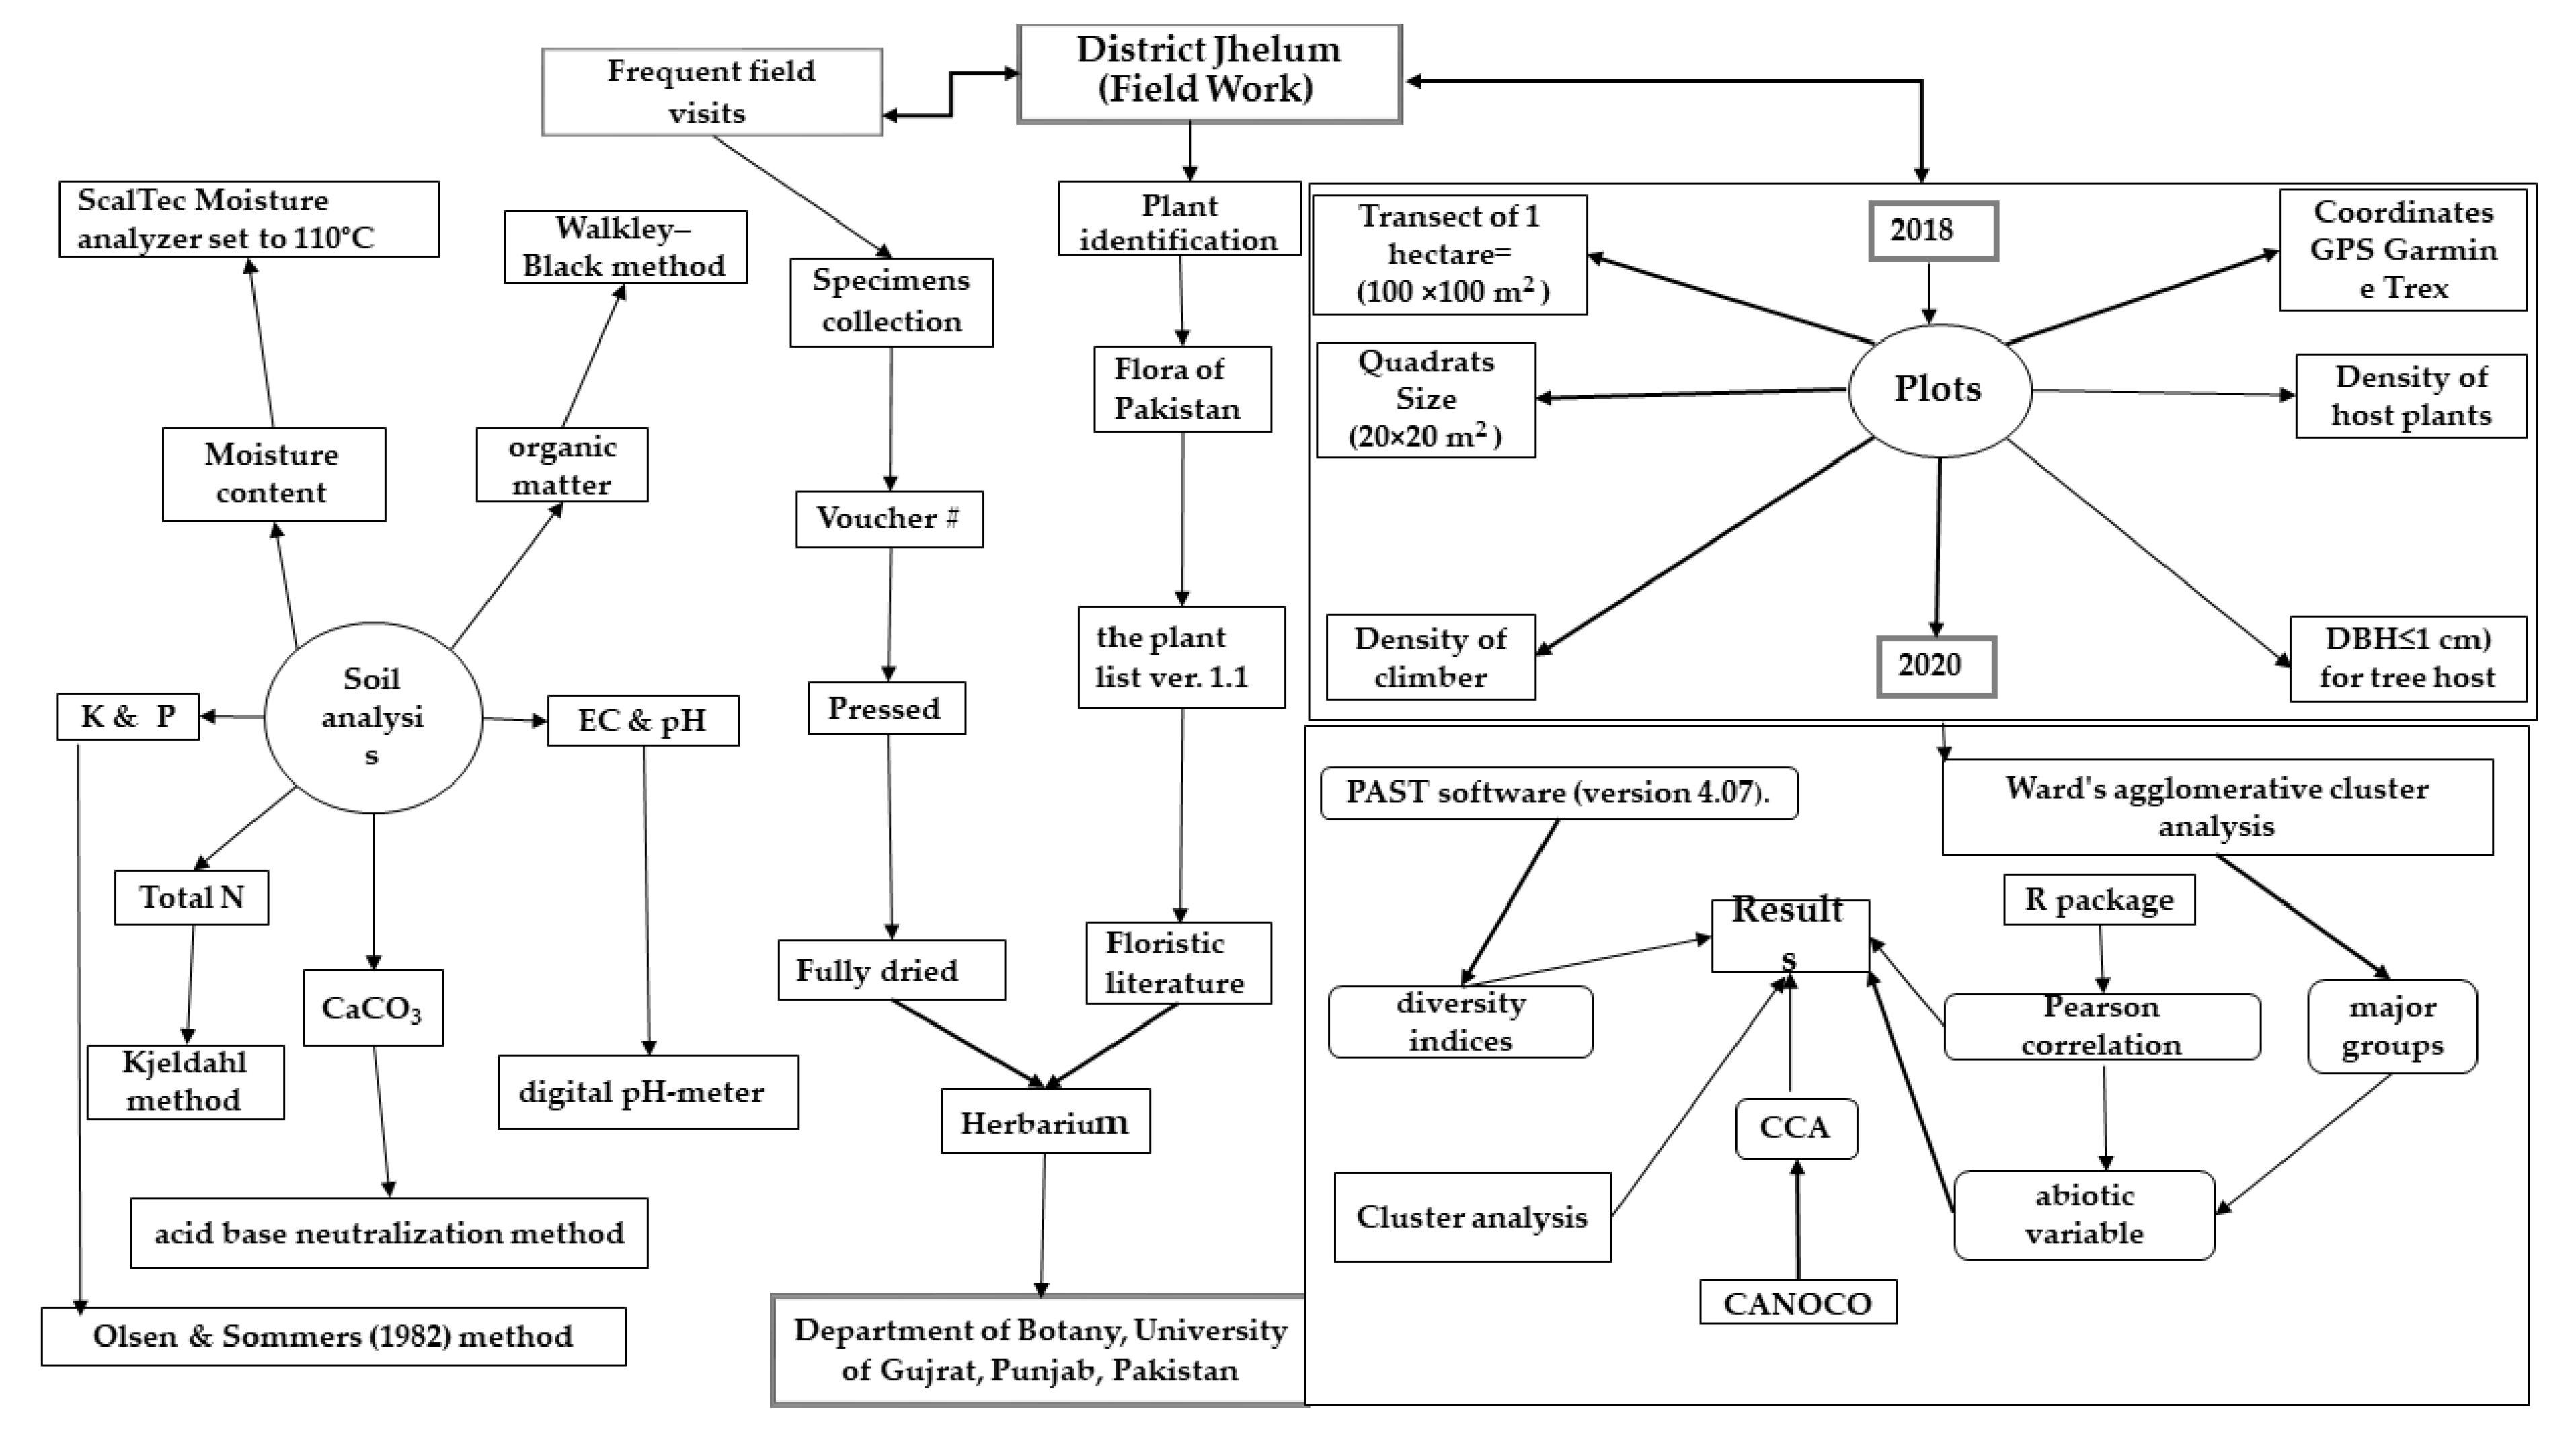
2.2. Fieldwork
2.3. Plant Sampling
2.4. Soil Sampling
2.5. Data Analysis
3. Results and Discussion
3.1. Composition and Diversity
3.2. Functional Traits
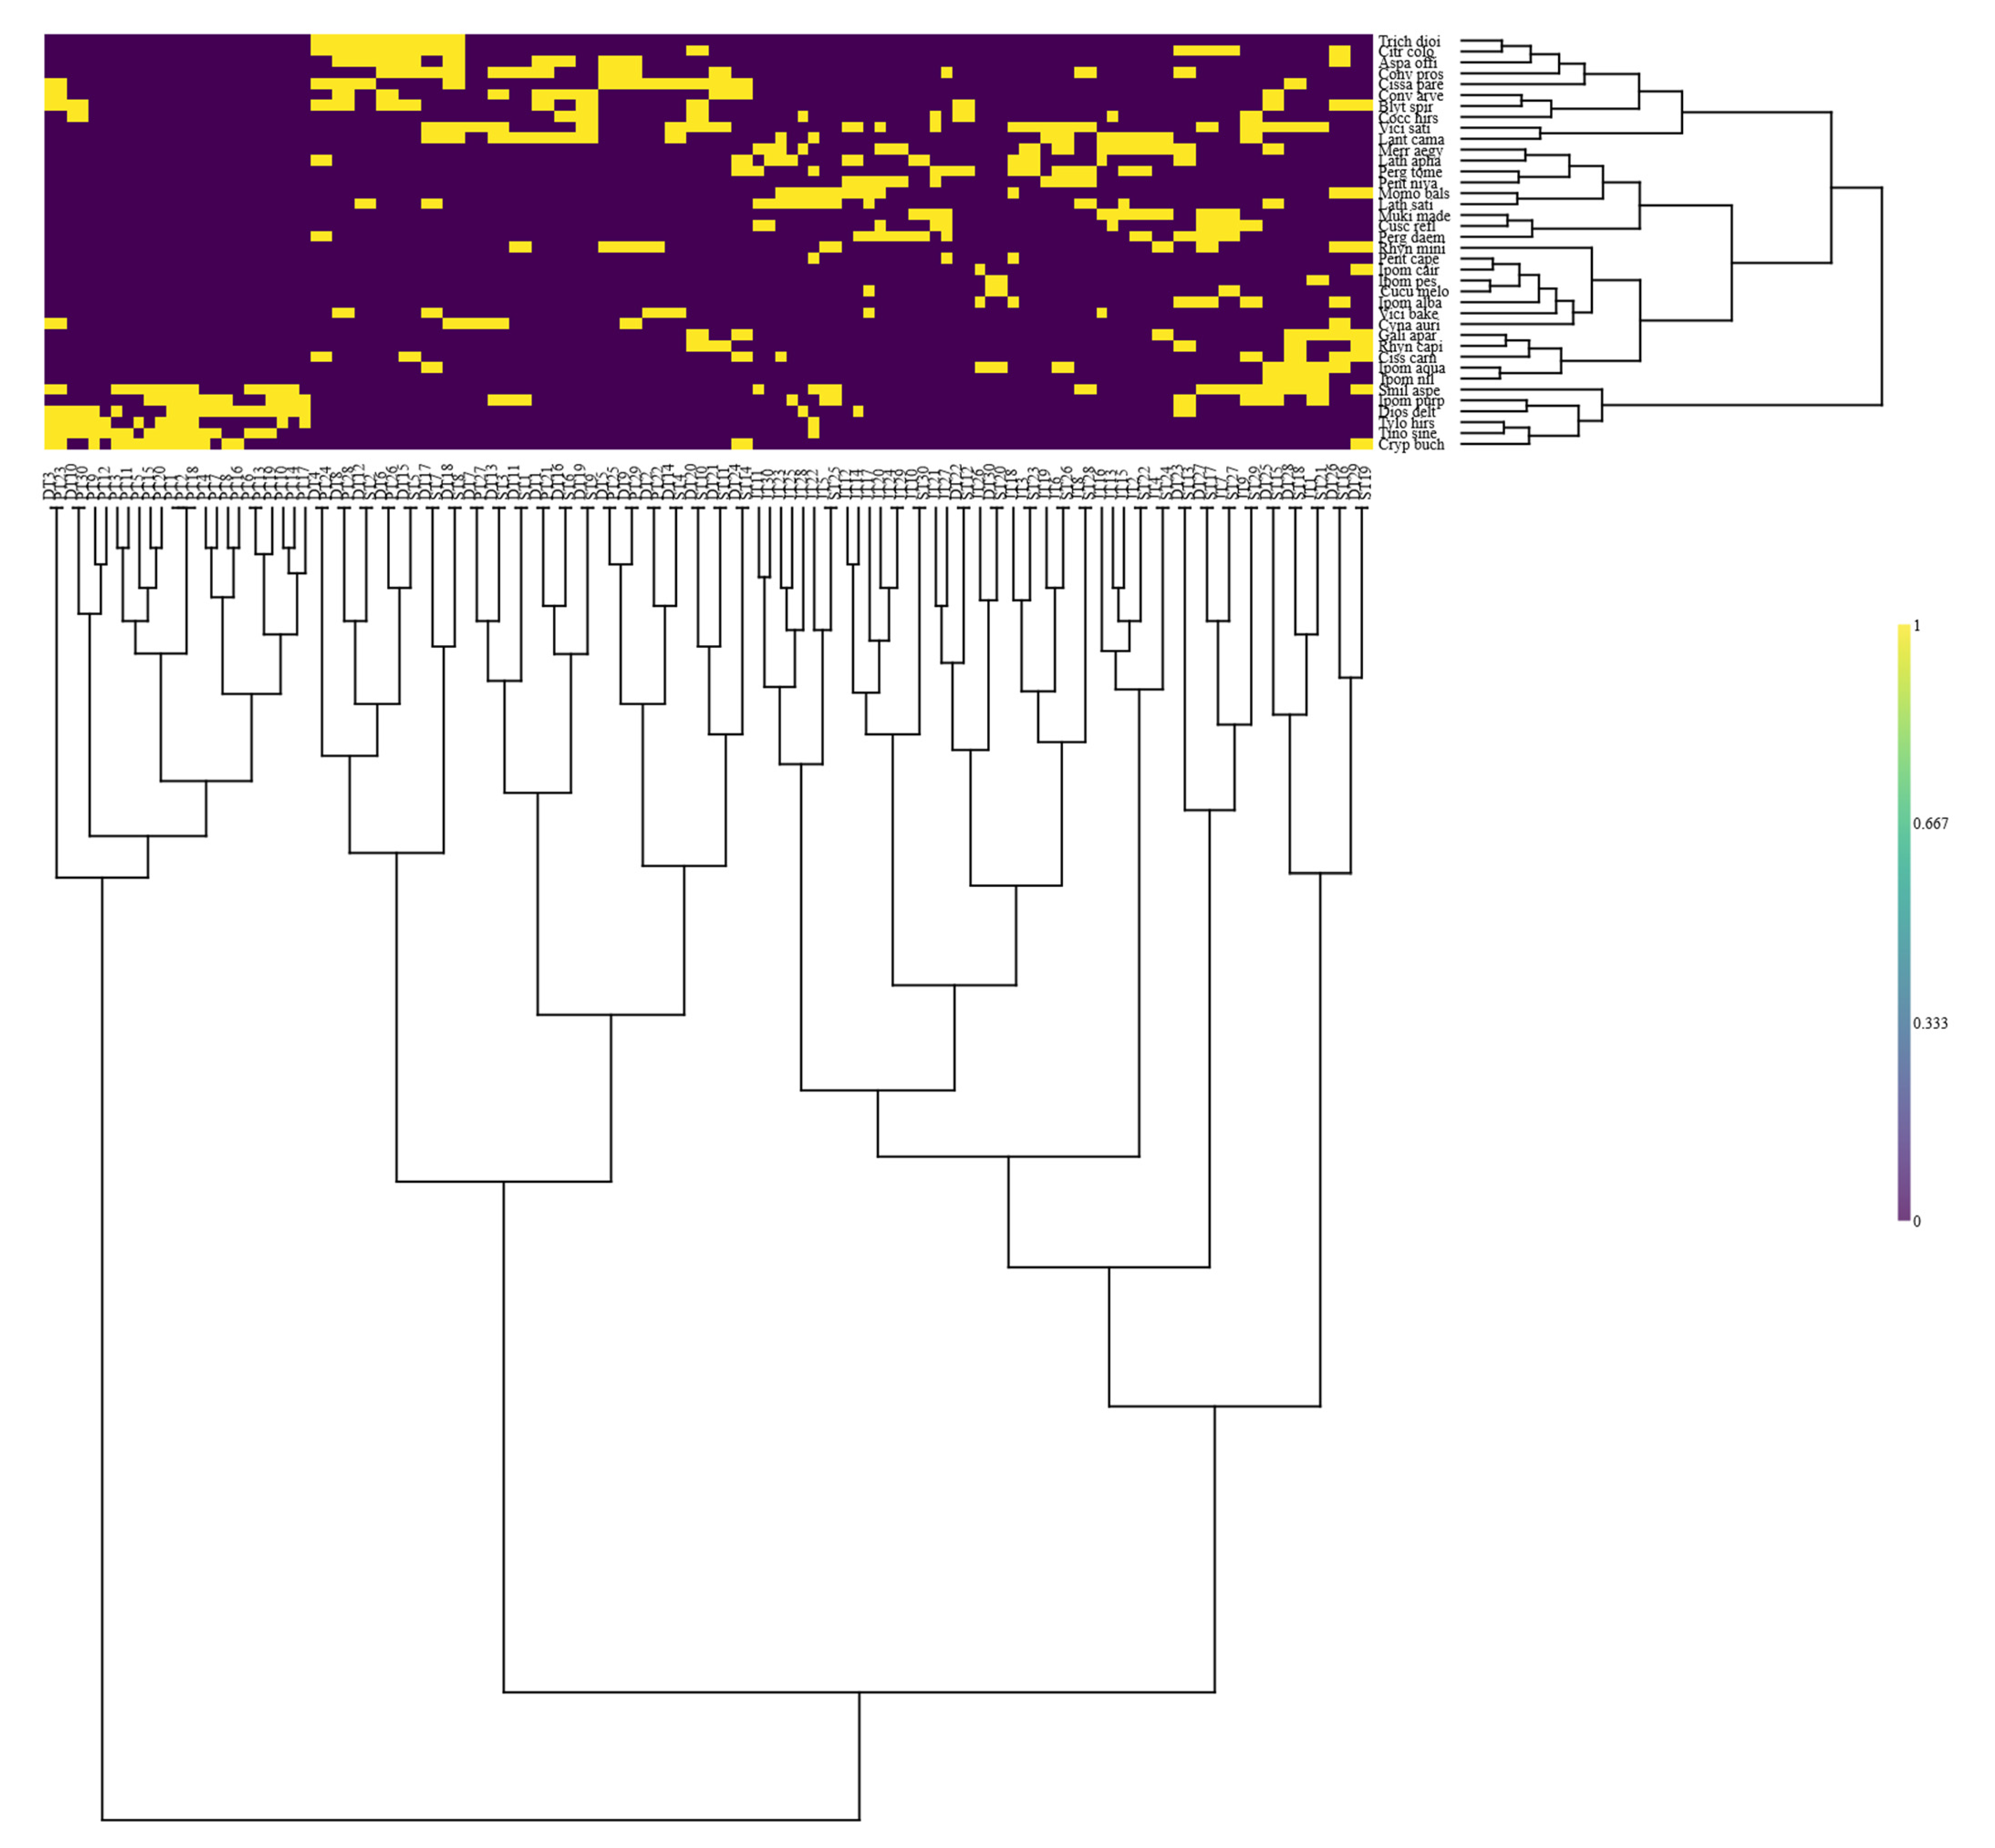
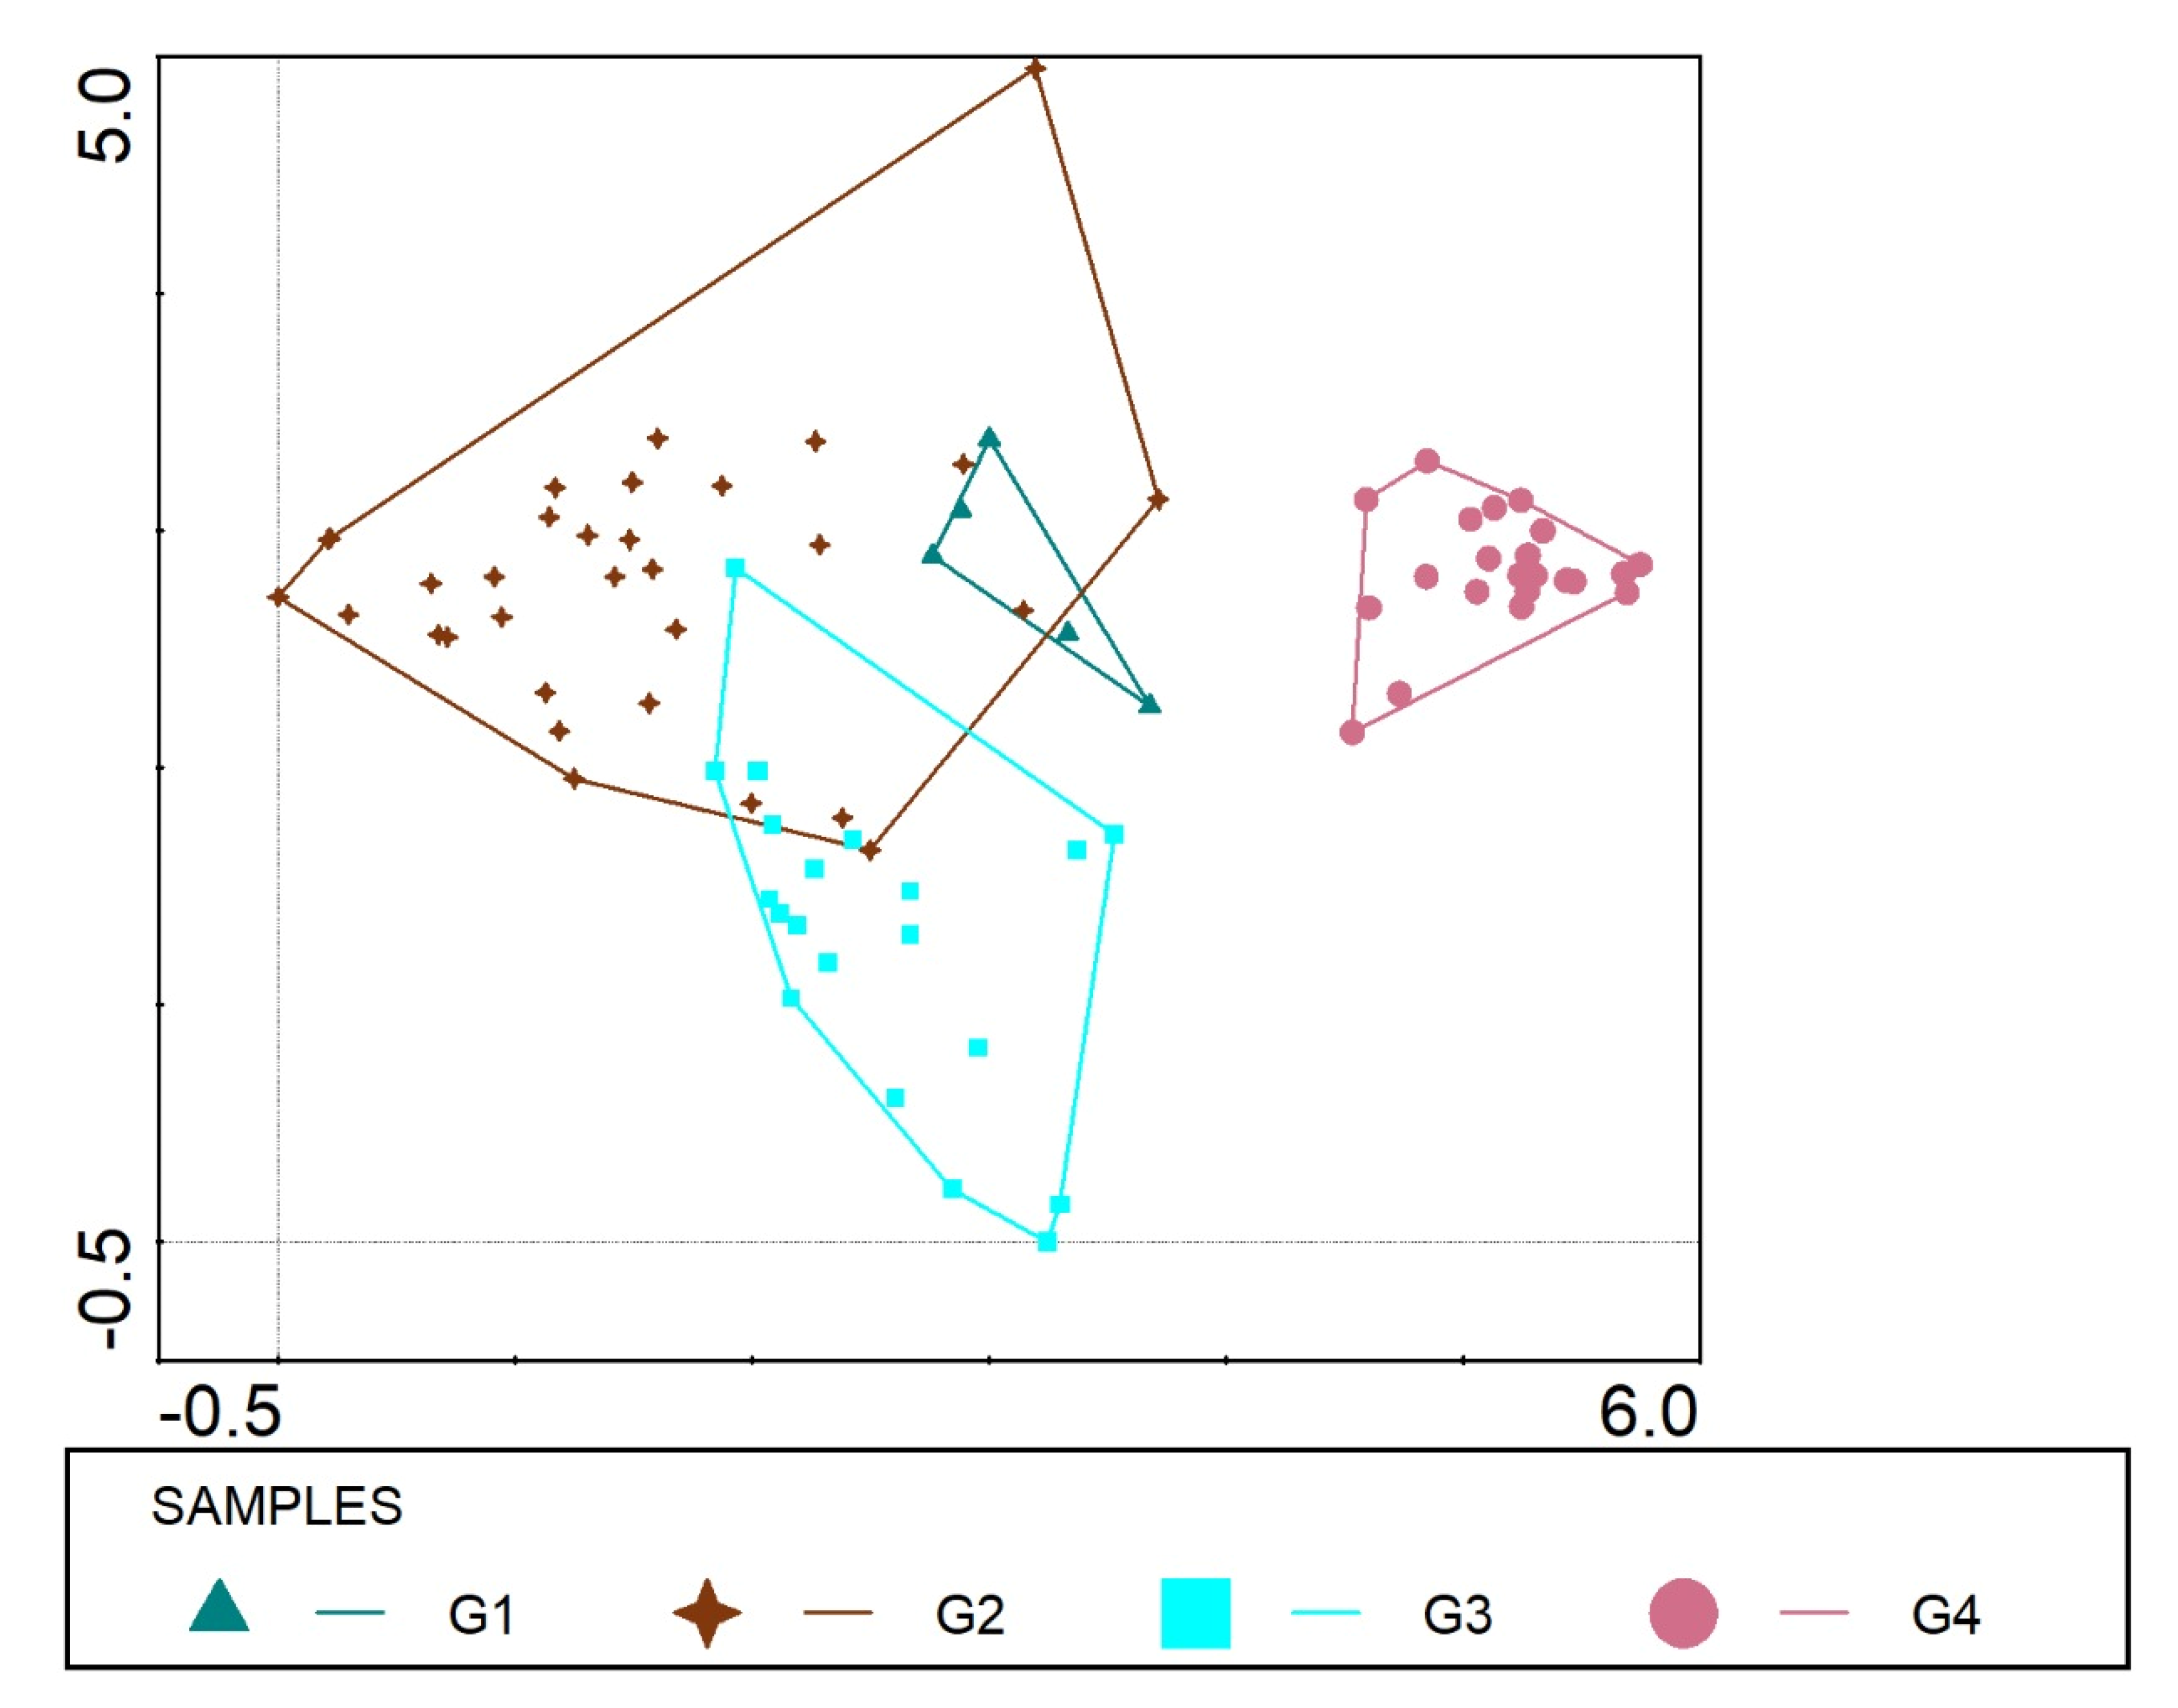
3.3. Classification and Ordination of Climber Plants
3.3.1. Group I
3.3.2. Group II
3.3.3. Group III
3.3.4. Group IV
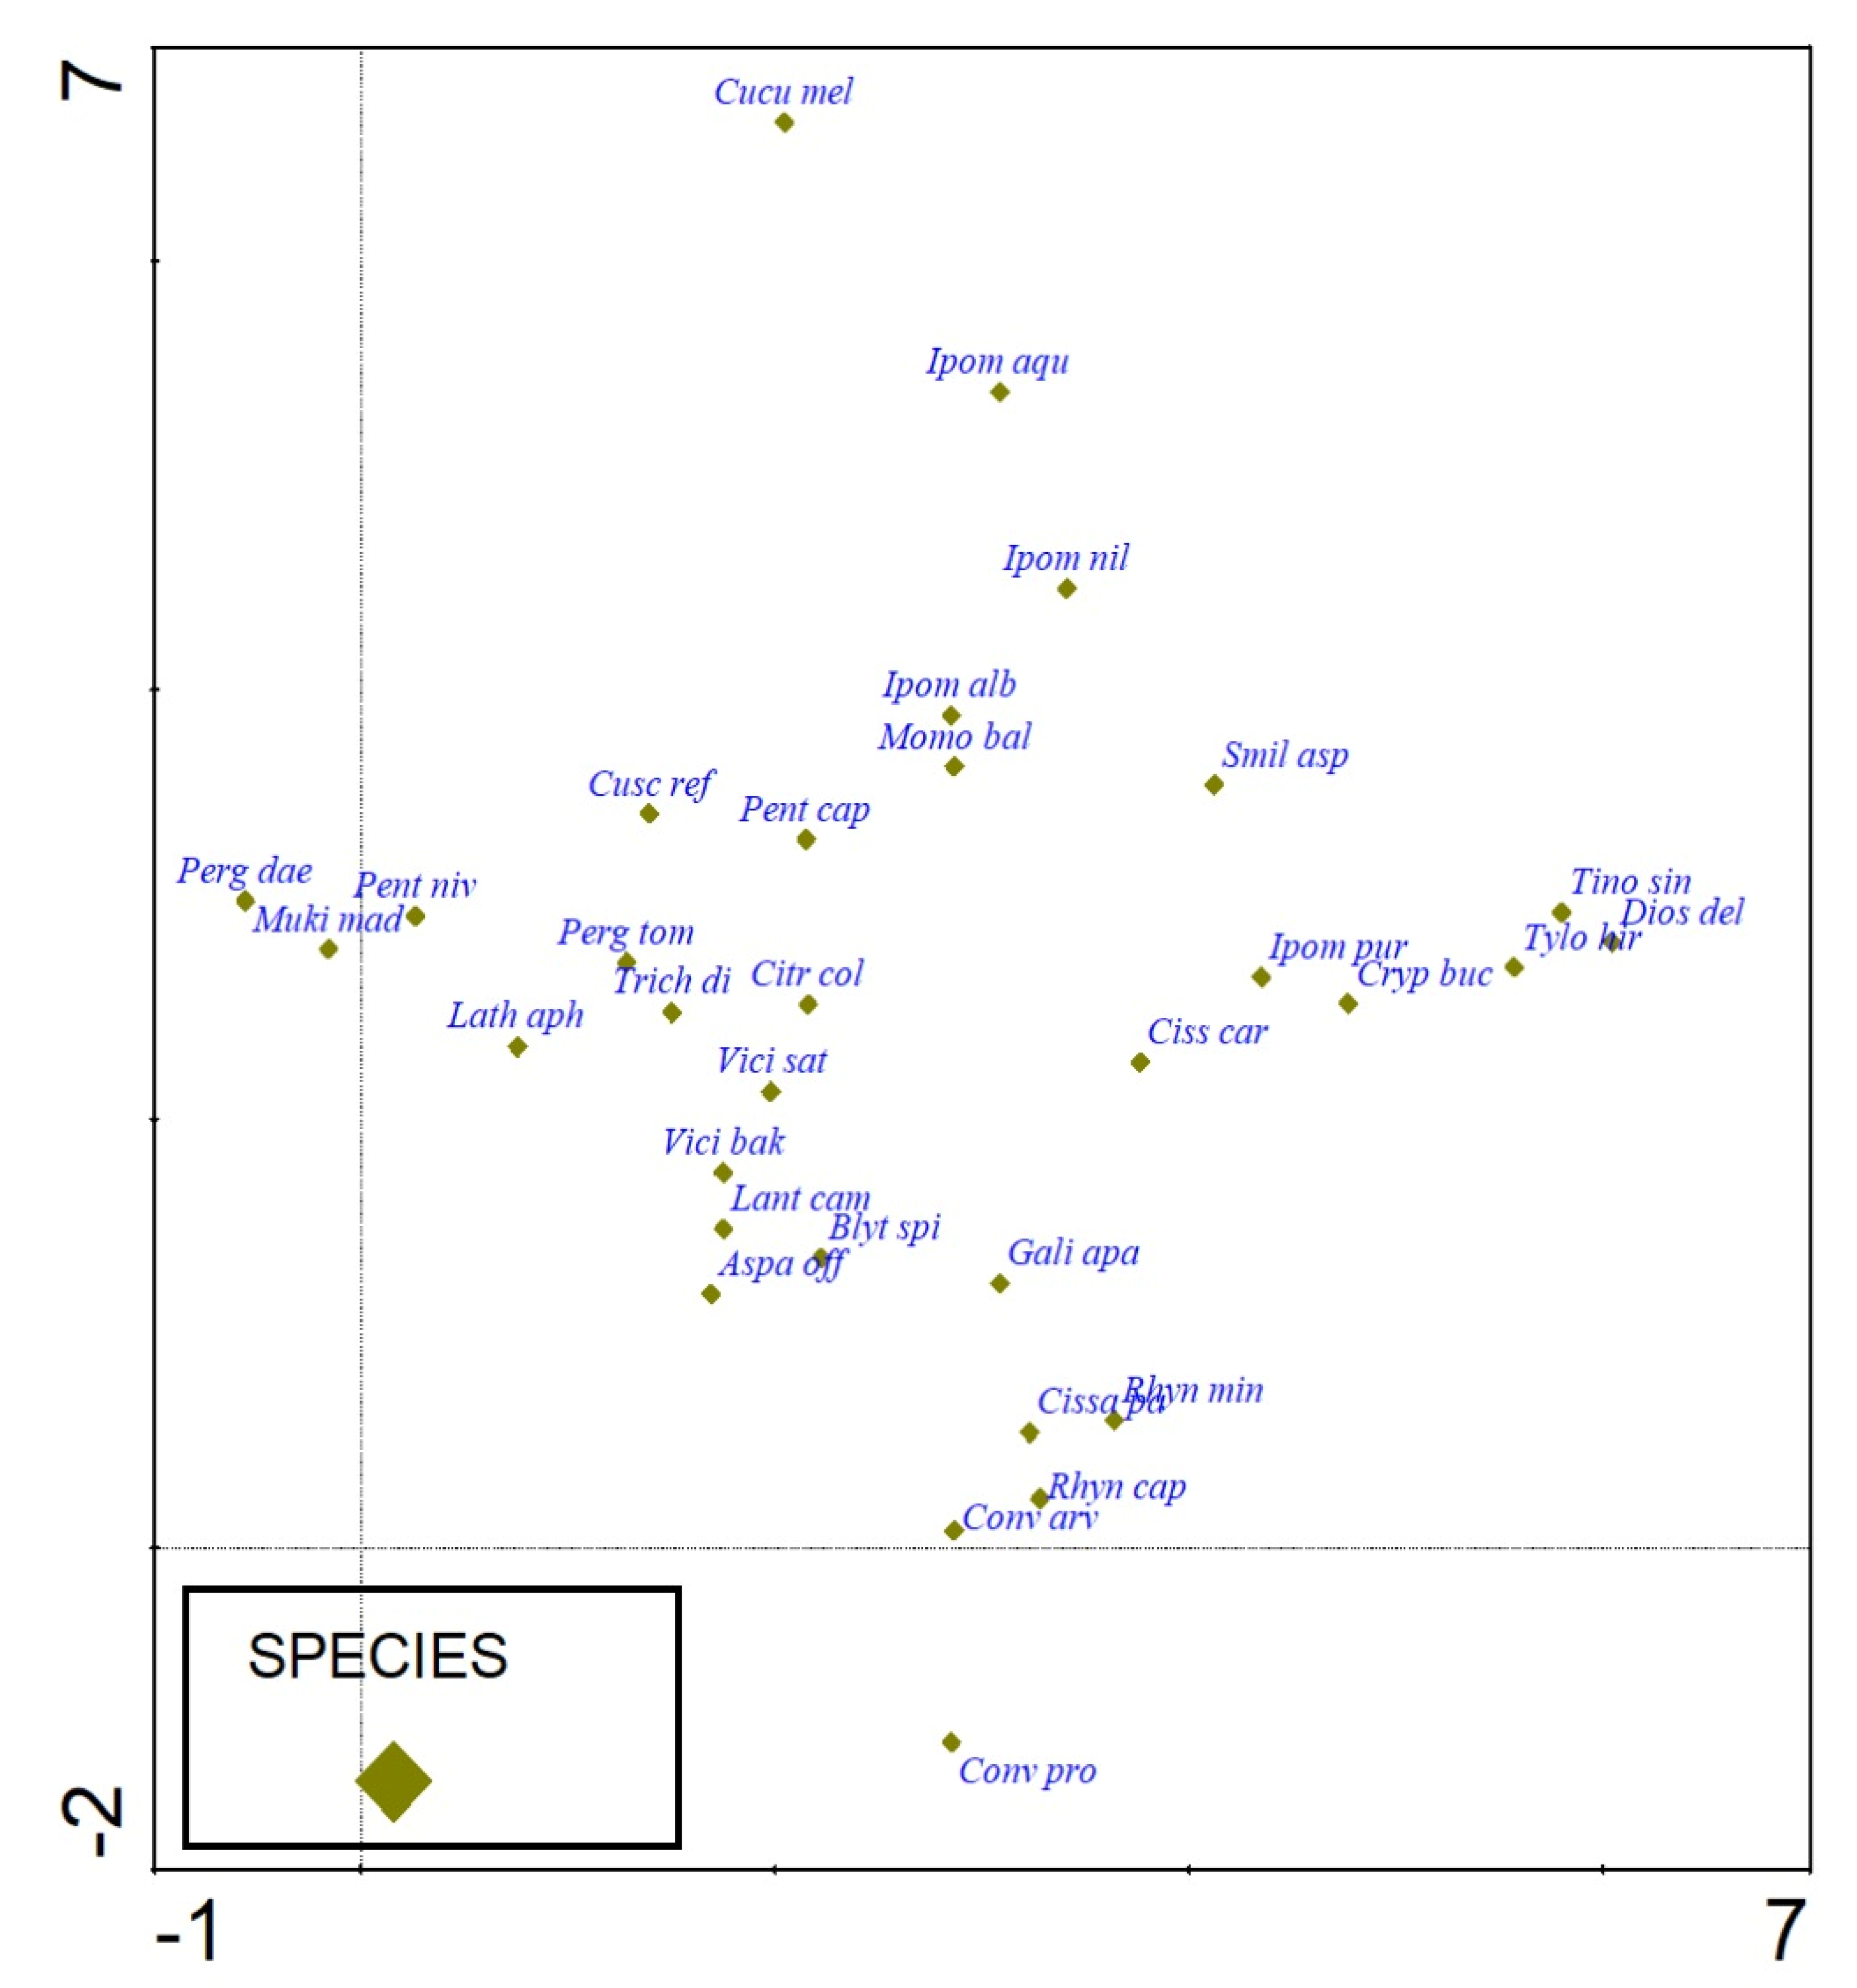
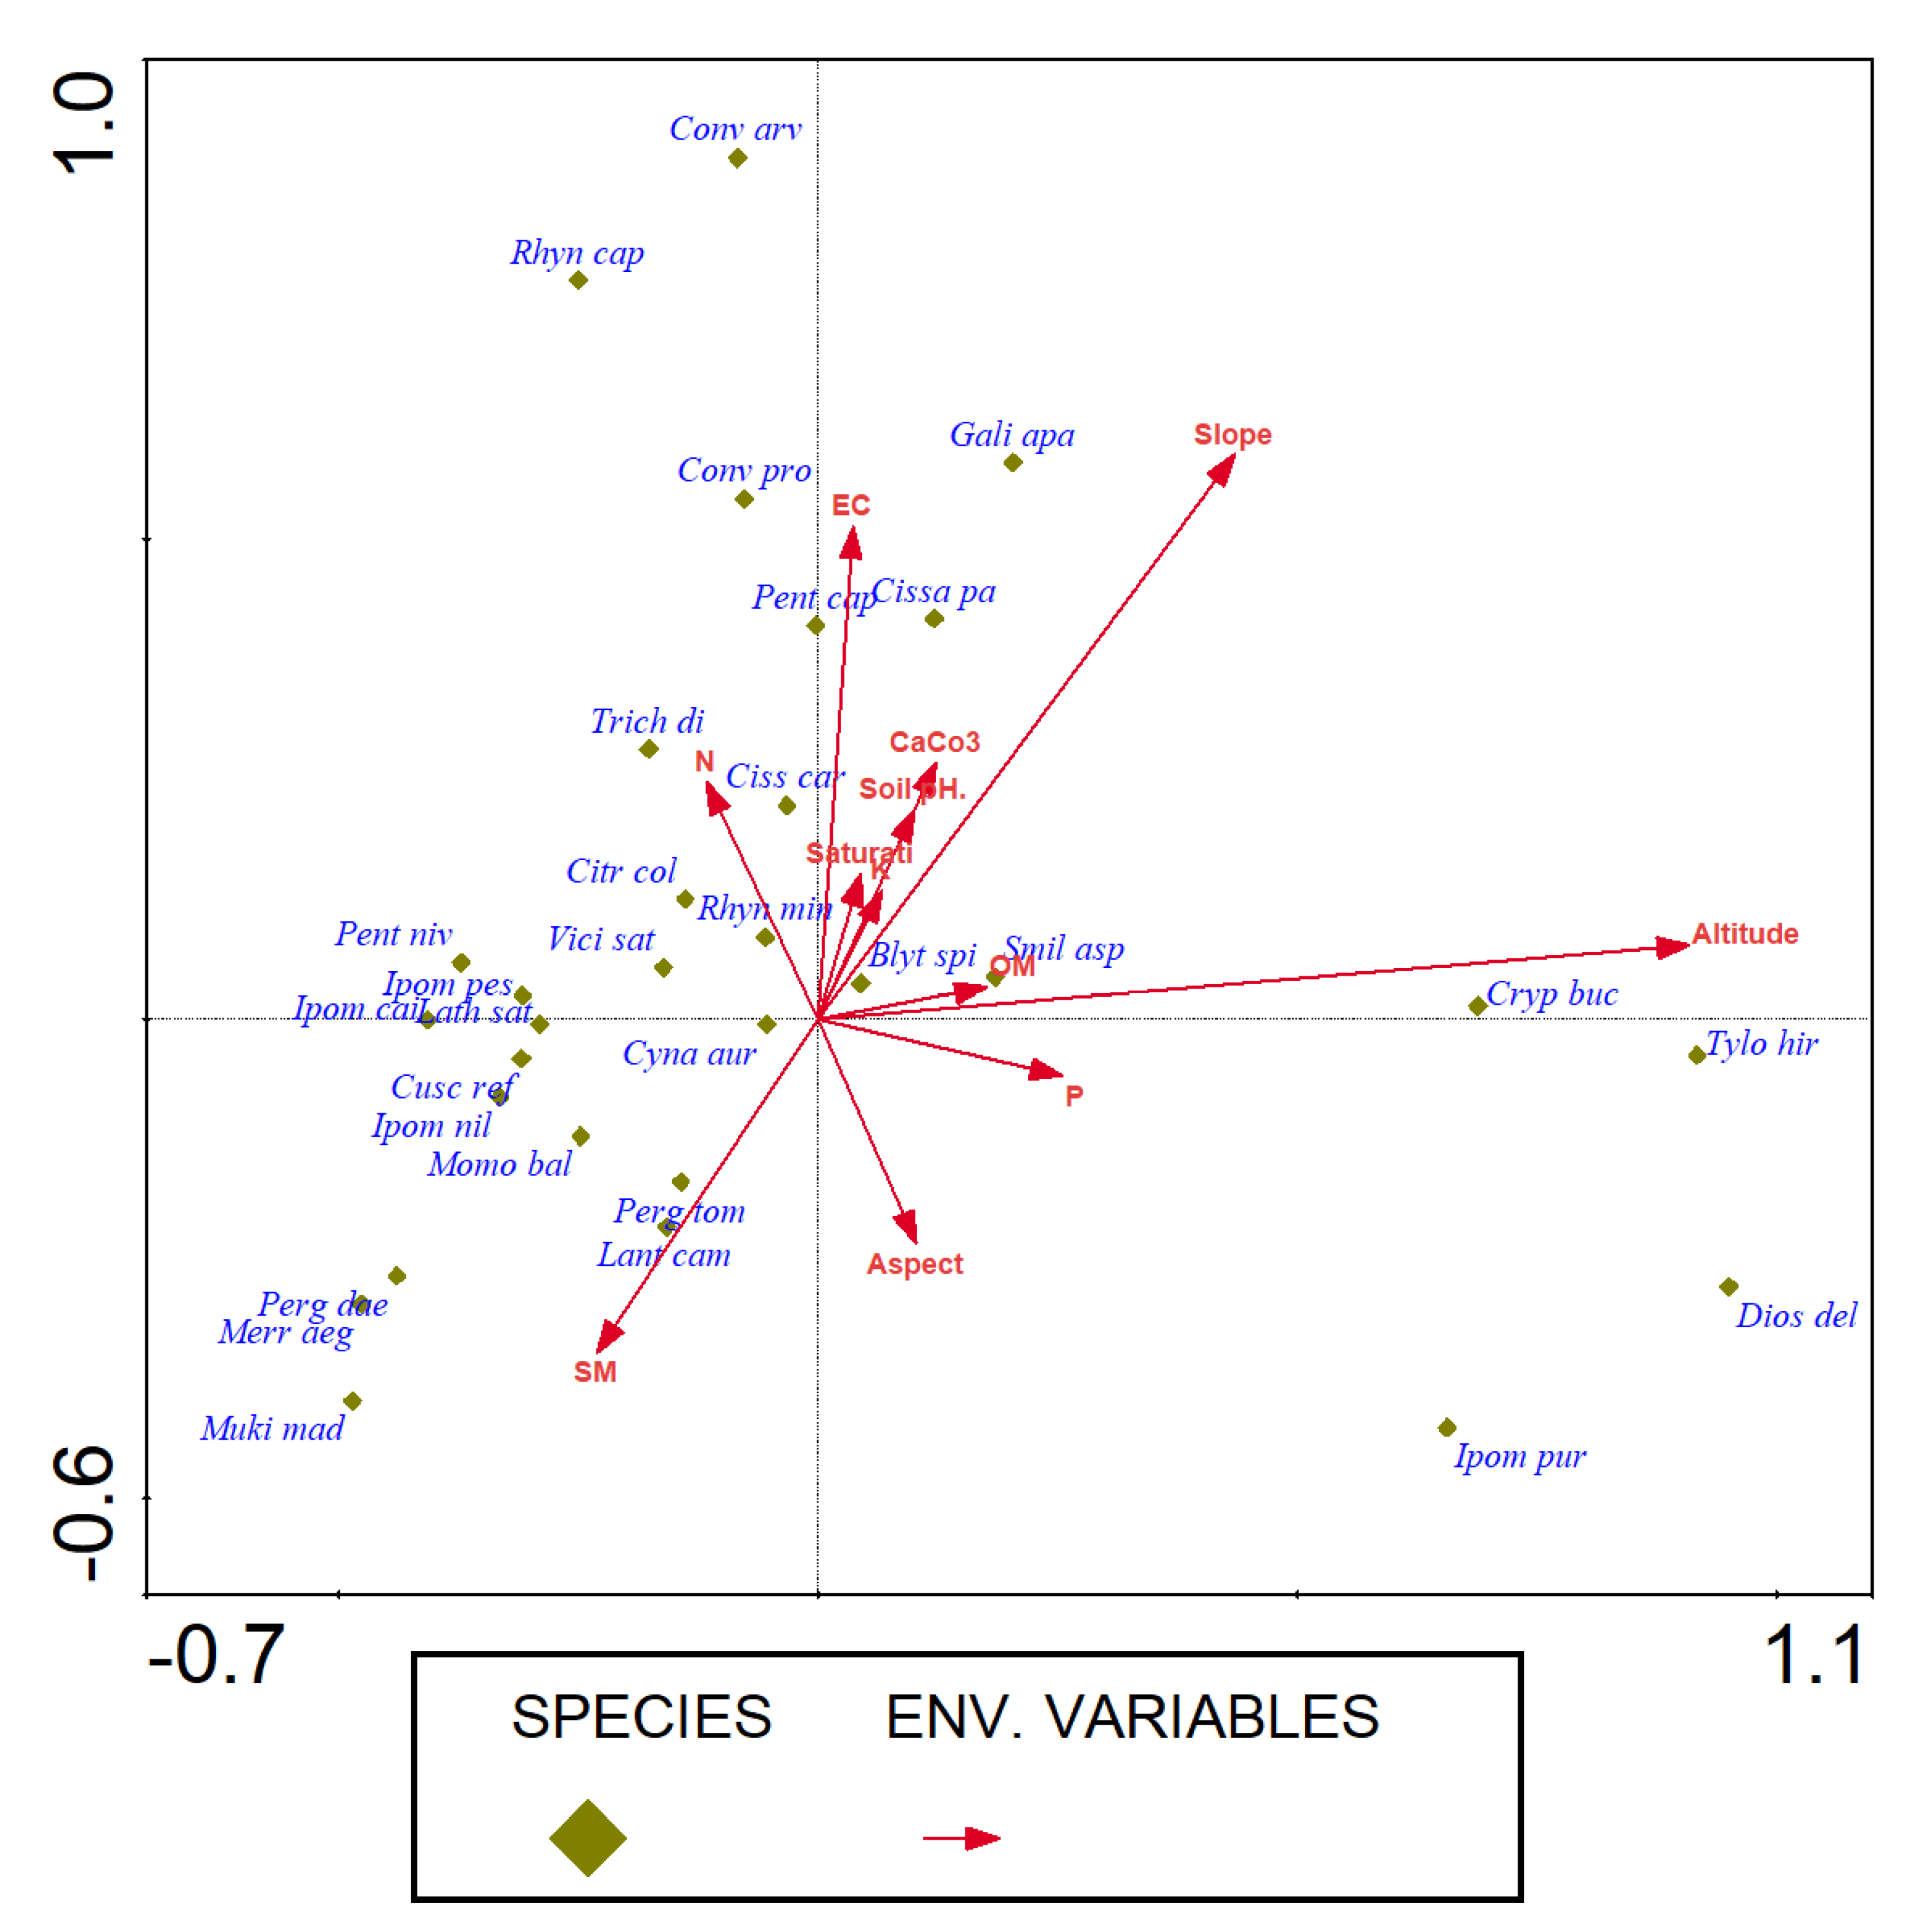
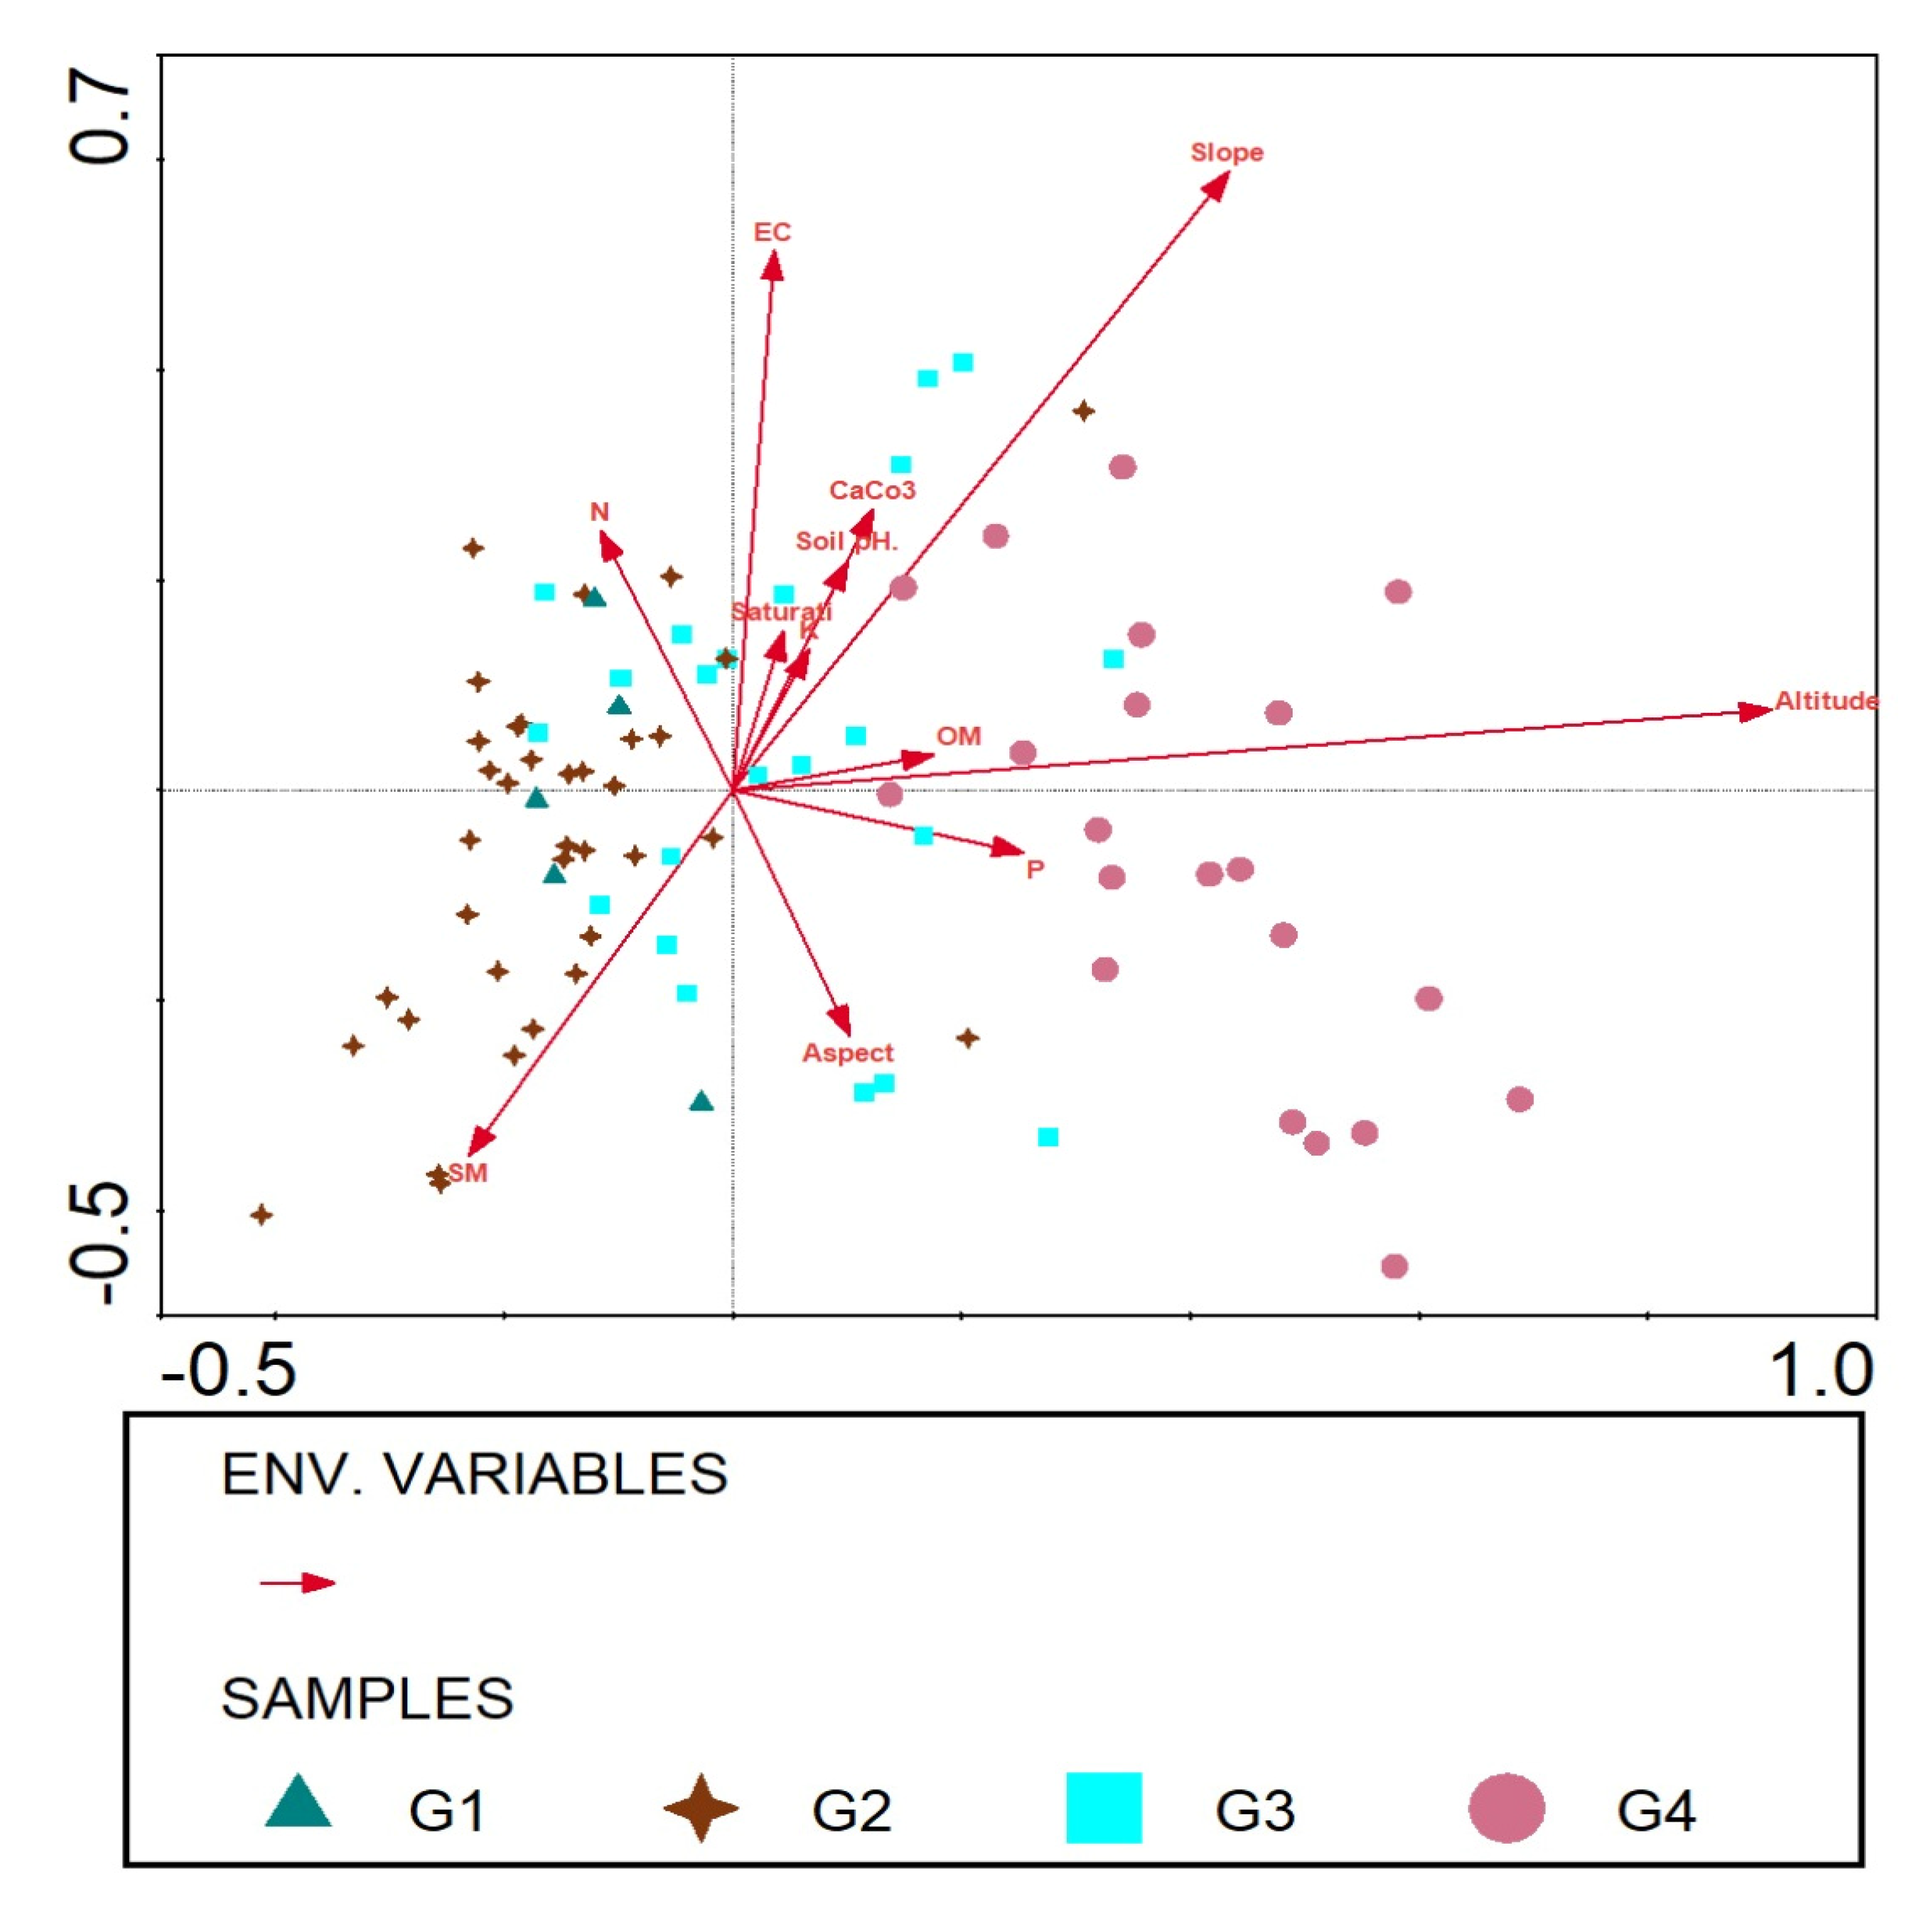
3.4. DCA Ordination of Climbers
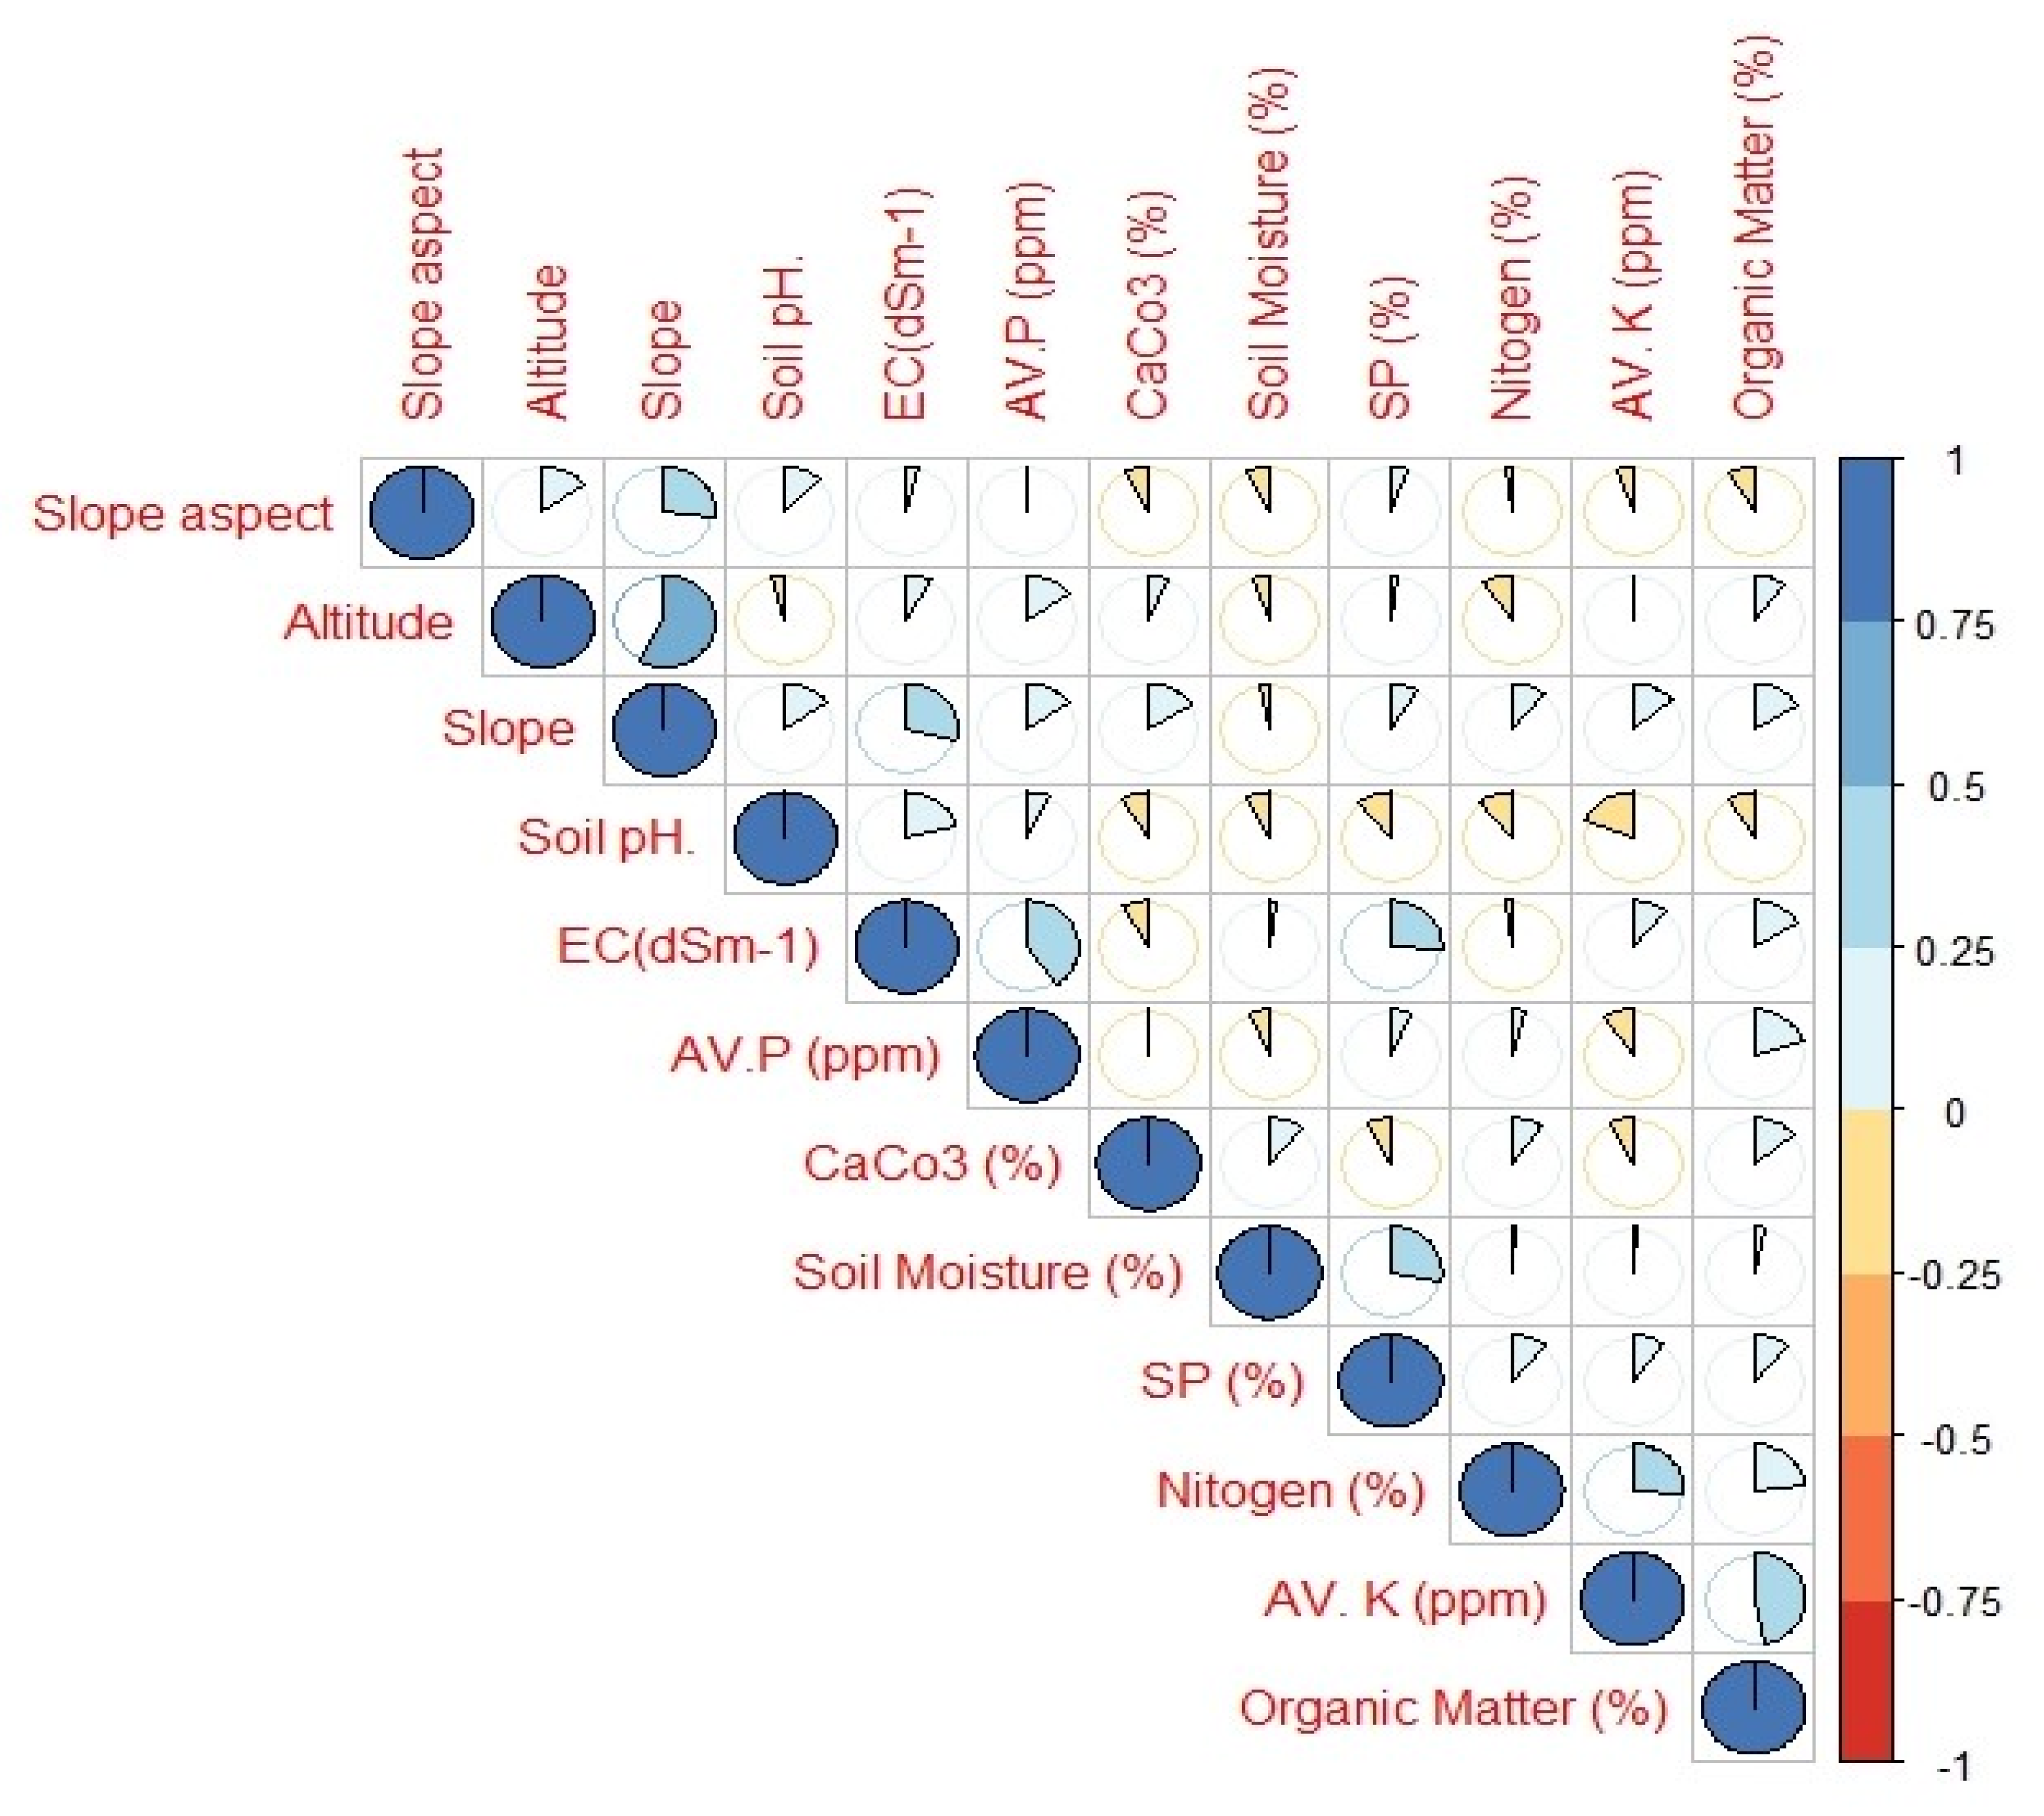
3.5. Role of Abiotic Variables on Species Distribution
4. Conclusions
Supplementary Materials
Author Contributions
Funding
Data Availability Statement
Acknowledgments
Conflicts of Interest
References
- Rahman, A.U.; Khan, S.M.; Saqib, Z.; Ullah, Z.; Ahmad, Z.; Ekercin, S.; Mumtaz, A.S.; Ahmad, H. Diversity and abundance of climbers in relation to their hosts and elevation in the monsoon forests of murree in the himalayas. Pak. J. Bot. 2020, 52, 601–612. [Google Scholar] [CrossRef]
- Lü, X.T.; Tang, J.W.; Feng, Z.L.; Li, M.H. Diversity and aboveground biomass of lianas in the tropical seasonal rain forests of Xishuangbanna, SW China. Rev. Biol. Trop. 2009, 57, 211–222. [Google Scholar] [CrossRef] [PubMed] [Green Version]
- Leicht-Young, S.A.; Pavlovic, N.B.; Frohnapple, K.J.; Grundel, R. Liana habitat and host preferences in northern temperate forests. For. Ecol. Manag. 2010, 260, 1467–1477. [Google Scholar] [CrossRef]
- Tariq, A.; Shu, H.; Siddiqui, S.; Imran, M.; Farhan, M. Monitoring Land Use and Land Cover Changes Using Geospatial Techniques, A Case Study of Fateh Jang, Attock, Pakistan. Geogr. Environ. Sustain. 2021, 14, 41–52. [Google Scholar] [CrossRef]
- Tariq, A.; Riaz, I.; Ahmad, Z. Land surface temperature relation with normalized satellite indices for the estimation of spatio-temporal trends in temperature among various land use land cover classes of an arid Potohar region using Landsat data. Environ. Earth Sci. 2020, 79, 40. [Google Scholar] [CrossRef]
- Schnitzer, S.A.; Bongers, F. The ecology of lianas and their role in forests. Trends Ecol. Evol. 2002, 17, 223–230. [Google Scholar] [CrossRef] [Green Version]
- Durigon, J.; Miotto, S.T.S.; Gianoli, E. Distribution and traits of climbing plants in subtropical and temperate South America. J. Veg. Sci. 2014, 25, 1484–1492. [Google Scholar] [CrossRef]
- Vivek, P.; Parthasarathy, N. Liana community and functional trait analysis in tropical dry evergreen forest of India. J. Plant Ecol. 2014, 8, 501–512. [Google Scholar] [CrossRef] [Green Version]
- Reddy, M.S.; Parthasarathy, N. Liana diversity and distribution on host trees in four inland tropical dry evergreen forests of peninsular India. Trop. Ecol. 2006, 47, 109–123. [Google Scholar]
- Tariq, A.; Shu, H. CA-Markov Chain Analysis of Seasonal Land Surface Temperature and Land Use Land Cover Change Using Optical Multi-Temporal Satellite Data of Faisalabad, Pakistan. Remote Sens. 2020, 12, 3402. [Google Scholar] [CrossRef]
- Tariq, A.; Shu, H.; Saddiqui, S.; Mousa, B.G.; Munir, I.; Nasri, A.; Waqas, H.; Baqa, M.F.; Lu, L. Forest fire Monitoring using spatial-statistical and Geo-spatial analysis of factors determining Forest fire in Margalla Hills, Islamabad, Pakistan. Geomat. Nat. Hazards Risk 2021, 12, 1212–1233. [Google Scholar] [CrossRef]
- Zellweger, F.; Braunisch, V.; Morsdorf, F.; Baltensweiler, A.; Abegg, M.; Roth, T.; Bugmann, H.; Bollmann, K. Disentangling the effects of climate, topography, soil and vegetation on stand-scale species richness in temperate forests. For. Ecol. Manag. 2015, 349, 36–44. [Google Scholar] [CrossRef]
- Putz, F.E.; Chai, P. Ecological Studies of Lianas in Lambir National Park, Sarawak, Malaysia. J. Ecol. 1987, 75, 523. [Google Scholar] [CrossRef]
- Nabe-Nielsen, J. Diversity and distribution of lianas in a neotropical rain forest, Yasuní National Park, Ecuador. J. Trop. Ecol. 2001, 17, 1–19. [Google Scholar] [CrossRef]
- Ding, Y.; Zang, R. Effects of logging on the diversity of lianas in a lowland tropical rain forest in Hainan Island, South China. Biotropica 2009, 41, 618–624. [Google Scholar] [CrossRef]
- Pandian, E.; Ravichandran, P. Diversity and Threatened Climber Plants in Tropical Forests of Courtallam Hills, Southern Western Ghats, India. J. Trop. For. Environ. 2020, 9, 12–20. [Google Scholar] [CrossRef]
- Majeed, M.; Tariq, A.; Haq, S.M.; Waheed, M.; Anwar, M.M.; Li, Q.; Aslam, M.; Abbasi, S.; Mousa, B.G. A Detailed Ecological Exploration of the Distribution Patterns of Wild Poaceae from the Jhelum District (Punjab), Pakistan. Sustainability 2022, 14, 3786. [Google Scholar] [CrossRef]
- Majeed, M.; Bhatti, K.H.; Pieroni, A.; Renata, S.; Bussmann, R.W.; Khan, A.M.; Chaudhari, S.K.; Aziz, M.A.; Amjad, M.S. Gathered Wild Food Plants among Diverse Religious Groups in Jhelum District, Punjab, Pakistan. Foods 2021, 10, 594. [Google Scholar] [CrossRef]
- Majeed, M.; Tariq, A.; Anwar, M.M.; Khan, A.M.; Arshad, F.; Mumtaz, F.; Farhan, M.; Zhang, L.; Zafar, A.; Aziz, M.; et al. Monitoring of Land Use–Land Cover Change and Potential Causal Factors of Climate Change in Jhelum District, Punjab, Pakistan, through GIS and Multi-Temporal Satellite Data. Land 2021, 10, 1026. [Google Scholar] [CrossRef]
- Majeed, M.; Bhatti, K.H.; Amjad, M.S. Impact of climatic variations on the flowering phenology of plant species in Jhelum district, Punjab, Pakistan. Appl. Ecol. Environ. Res. 2021, 19, 3343–3376. [Google Scholar] [CrossRef]
- Majeed, M.; Bhatti, K.H.; Amjad, M.S.; Abbasi, A.M.; Bussmann, R.W.; Nawaz, F.; Rashid, A.; Mehmood, A.; Mahmood, M.; Khan, W.M.; et al. Ethno-veterinary uses of Poaceae in Punjab, Pakistan. PLoS ONE 2020, 15, e0241705. [Google Scholar] [CrossRef] [PubMed]
- Tariq, A.; Shu, H.; Siddiqui, S.; Munir, I.; Sharifi, A.; Li, Q.; Lu, L. Spatio-temporal analysis of forest fire events in the Margalla Hills, Islamabad, Pakistan using socio-economic and environmental variable data with machine learning methods. J. For. Res. 2021, 13, 12. [Google Scholar] [CrossRef]
- Ali, S.I.; Qaiser, M. A phytogeographical analysis of the phanerogams of Pakistan and Kashmir. Proc. R. Soc. Edinb. Sect. B Biol. Sci. 1986, 89, 89–101. [Google Scholar] [CrossRef]
- Mujtaba, G.; Hussain, M.; Allah, E.F.A. Life forms, leaf size spectra, regeneration capacity and diversity of plant species grown in the Thandiani forests, district Abbottabad, Khyber Pakhtunkhwa, Pakistan. Saudi J. Biol. Sci. 2018, 25, 94–100. [Google Scholar] [CrossRef] [Green Version]
- Abbas, Z.; Khan, S.M.; Alam, J.A.N.; Abideen, Z.; Ullah, Z. Plant communities and anthropo-natural threats in the shigar valley, (Central karakorum) Baltistan-Pakistan. Pak. J. Bot. 2020, 52, 987–994. [Google Scholar] [CrossRef]
- Carrasco-Urra, F.; Gianoli, E. Abundance of climbing plants in a southern temperate rain forest: Host tree characteristics or light availability? J. Veg. Sci. 2009, 20, 1155–1162. [Google Scholar] [CrossRef]
- Tariq, A.; Shu, H.; Li, Q.; Altan, O.; Khan, M.R.; Baqa, M.F.; Lu, L. Quantitative analysis of forest fires in southeastern Australia using SAR data. Remote Sens. 2021, 13, 2386. [Google Scholar] [CrossRef]
- Hussain, M.; Khan, S.M.; Ab-Allah, E.F.; Ul Haq, Z.; Alshahrani, T.S.; Alqarawi, A.A.; Ur Rahman, I.; Iqbal, M.; Abdullah; Ahmad, H. Assessment of plant communities and identification of indicator species of an ecotonal forest zone at durand line, District Kurram, Pakistan. Appl. Ecol. Environ. Res. 2019, 17, 6375–6396. [Google Scholar] [CrossRef]
- Carter, G.A.; Teramura, A.H. Vine Photosynthesis and Relationships To Climbing Mechanics in a Forest Understory. Am. J. Bot. 1988, 75, 1011–1018. [Google Scholar] [CrossRef]
- Tariq, A.; Shu, H.; Gagnon, A.S.; Li, Q.; Mumtaz, F.; Hysa, A.; Siddique, M.A.; Munir, I. Assessing Burned Areas in Wildfires and Prescribed Fires with Spectral Indices and SAR Images in the Margalla Hills of Pakistan. Forests 2021, 12, 1371. [Google Scholar] [CrossRef]
- Khan, S.A.; Khan, S.M.; Ullah, Z.; Ahmad, Z.; Alam, N.; Shah, S.N.; Khan, R.; Zada, M. Phytogeographic classification using multivariate approach; a case study from the Jambil valley swat, Pakistan. Pak. J. Bot. 2020, 52, 279–290. [Google Scholar] [CrossRef]
- Uwalaka, N.O.; Khapugin, A.A.; Muoghalu, J.I. Effect of some environmental factors on liana abundance in a regenerating secondary lowland rainforest in Nigeria three decades after a ground fire. Ecol. Quest. 2020, 31, 27–38. [Google Scholar] [CrossRef] [Green Version]
- Bano, A.; Ahmad, M.; Hadda, T.B.; Saboor, A.; Sultana, S.; Zafar, M.; Khan, M.P.Z.; Arshad, M.; Ashraf, M.A. Quantitative ethnomedicinal study of plants used in the skardu valley at high altitude of Karakoram-Himalayan range, Pakistan. J. Ethnobiol. Ethnomed. 2014, 10, 43. [Google Scholar] [CrossRef] [PubMed] [Green Version]
- Ilyas, M. Phytosociological and Ethnobotanical Appraisal of Kabal Valley Swat with Especial Reference to Plant Biodiversity Conservation. Ph.D. Thesis, Pir Mehr Ali Shah Arid Agriculture University, Rawalpindi, Pakistan, 2015. [Google Scholar]
- Shaheen, H.; Qureshi, R.A.; Shinwari, Z.K. Structural diversity, vegetation dynamics and anthropogenic impact on lesser Himalayan subtropical forests of Bagh district, Kashmir. Pak. J. Bot. 2011, 43, 1861–1866. [Google Scholar]
- Rahman, A.U.; Khan, S.M.; Khan, S.; Hussain, A.; Rahman, I.U.; Iqbal, Z.; Ijaz, F. Ecological Assessment of Plant Communities and Associated Edaphic and Topographic Variables in the Peochar Valley of the Hindu Kush Mountains. Mt. Res. Dev. 2016, 36, 332–341. [Google Scholar] [CrossRef] [Green Version]
- Tariq, A.; Siddiqui, S.; Sharifi, A.; Hassan, S.; Ahmad, I. Impact of spatio-temporal land surface temperature on cropping pattern and land use and land cover changes using satellite imagery, Hafizabad District, Punjab, Province of Pakistan. Arab. J. Geosci. 2022, 15, 1045. [Google Scholar] [CrossRef]
- Muoghalu, J.I.; Okeesan, O.O. Climber species composition, abundance and relationship with trees in a Nigerian secondary forest. Afr. J. Ecol. 2005, 43, 258–266. [Google Scholar] [CrossRef]
- Muthumperumal, C.; Parthasarathy, N. Angiosperms, climbing plants in tropical forests of southern Eastern Ghats, Tamil Nadu, India. Check List 2009, 5, 092–111. [Google Scholar] [CrossRef]
- Dewalt, S.J.; Schnitzer, S.A.; Denslow, J.S. Density and diversity of lianas along a chronosequence in a central Panamanian lowland forest. J. Trop. Ecol. 2000, 16, 1–19. [Google Scholar] [CrossRef] [Green Version]
- Tariq, A.; Mumtaz, F.; Zeng, X.; Baloch, M.Y.J.; Moazzam, M.F.U. Spatio-temporal variation of seasonal heat islands mapping of Pakistan during 2000–2019, using day-time and night-time land surface temperatures MODIS and meteorological stations data. Remote Sens. Appl. Soc. Environ. 2022, 27, 100779. [Google Scholar] [CrossRef]
- Sher, H.; Alyemeni, M. Economically and ecologically important plant communities in high altitude coniferous forest of Malam Jabba, Swat, Pakistan. Saudi J. Biol. Sci. 2011, 18, 53–61. [Google Scholar] [CrossRef] [PubMed] [Green Version]
- Mir, A.Y.; Yaqoob, U.; Hassan, M.; Bashir, F.; Zanit, S.B.; Haq, S.M.; Bussmann, R.W. Ethnopharmacology and phenology of high-altitude medicinal plants in kashmir, northern himalaya. Ethnobot. Res. Appl. 2021, 22, 1–15. [Google Scholar] [CrossRef]
- Haq, S.M.; Calixto, E.S.; Rashid, I.; Khuroo, A.A. Human-driven disturbances change the vegetation characteristics of temperate forest stands: A case study from Pir Panchal mountain range in Kashmir Himalaya. Trees For. People 2021, 6, 100134. [Google Scholar] [CrossRef]
- Haq, S.M.; Hamid, M.; Lone, F.A.; Singh, B. Himalayan Hotspot with Alien Weeds: A Case Study of Biological Spectrum, Phenology, and Diversity of Weedy Plants of High Altitude Mountains in District Kupwara of J&K Himalaya, India. Proc. Natl. Acad. Sci. India Sect. B Biol. Sci. 2021, 91, 139–152. [Google Scholar] [CrossRef]
- Altaf, A.; Haq, S.M.; Shabnum, N.; Jan, H.A. Comparative assessment of Phyto diversity in Tangmarg Forest division in Kashmir Himalaya, India. Acta Ecol. Sin. 2022, 11, 1–18. [Google Scholar] [CrossRef]
- Sajad, S.; Haq, S.M.; Yaqoob, U.; Calixto, E.S.; Hassan, M. Tree composition and standing biomass in forests of the northern part of Kashmir Himalaya. Vegetos 2021, 34, 857–866. [Google Scholar] [CrossRef]
- Haq, S.M.; Singh, B.; Bashir, F.; Farooq, A.J.; Singh, B.; Calixto, E.S. Exploring and understanding the floristic richness, life-form, leaf-size spectra and phenology of plants in protected forests: A case study of Dachigam National Park in Himalaya, Asia. Acta Ecol. Sin. 2021, 41, 479–490. [Google Scholar] [CrossRef]
- Iqbal, M.; Khan, S.M.; Ahmad, Z.; Hussain, M.; Shah, S.N.; Kamran, S.; Manan, F.; Haq, Z.U.; Ullah, S. Vegetation classification of the margalla foothills, islamabad under the influence of edaphic factors and anthropogenic activities using modern ecological tools. Pak. J. Bot. 2021, 53, 1831–1843. [Google Scholar] [CrossRef]
- Kammesheidt, L.; Berhaman, A.; Tay, J.; Abdullah, G.; Azwal, M. Liana abundance, diversity and tree infestation in the Imbak Canyon conservation area, Sabah, Malaysia. J. Trop. For. Sci. 2009, 21, 265–271. [Google Scholar] [CrossRef]
- Liu, Y.; Mu, X.; Wang, H.; Yan, G. A novel method for extracting green fractional vegetation cover from digital images. J. Veg. Sci. 2012, 23, 406–418. [Google Scholar] [CrossRef]


| Plant Name | Family | Climbing Mode | Phenology | Relative Density | |||
|---|---|---|---|---|---|---|---|
| G1 | G2 | G3 | G4 | ||||
| Asparagus officinalis L. | Asparagaceae | Scrambler | August–September | 2 | 0 | 66 | 0 |
| Vincetoxicum spirale (Forssk.) Meve & Liede | Apocynaceae | Twiner | March–April | 36 | 38 | 166 | 6 |
| Cissampelos pareira L. | Menispermaceae | Tendril | July–August | 36 | 47 | 161 | 12 |
| Causonis trifolia (L.) Mabb. & J. Wen | Vitaceae | Tendril | August–September | 68 | 32 | 46 | 0 |
| Citrullus colocynthis (L.) Schrad. | Cucurbitaceae | Scrambler | May–June | 8 | 115 | 73 | 0 |
| Cocculus hirsutus (L.) W. Theob. | Menispermaceae | Scrambler | July–August | 0 | 133 | 60 | 24 |
| Convolvulus arvensis L. | Convolvulaceae | Scrambler | March–April | 24 | 31 | 81 | 8 |
| Convolvulus prostratus Forssk. | Convolvulaceae | Scrambler | February–April | 0 | 64 | 119 | 0 |
| Cryptolepis buchananii Roem. & Schult. | Apocynaceae | Twiner | March–April | 26 | 0 | 13 | 181 |
| Cucumis melo L. | Cucurbitaceae | Scrambler | June–July | 0 | 22 | 0 | 0 |
| Cuscuta reflexa Roxb. | Convolvulaceae | Twiner | December–January | 0 | 122 | 0 | 0 |
| Cynanchum auriculatum Royle ex Wight | Apocynaceae | Twiner | March–April | 6 | 12 | 56 | 20 |
| Dioscorea deltoidea Wall. ex Griseb. | Dioscoriaceae | Twiner | August–September | 0 | 10 | 3 | 255 |
| Galium aparine L | Rubiaceae | Scrambler | June–July | 36 | 21 | 103 | 0 |
| Ipomoea alba L. | Convolvulaceae | Twiner | March–April | 4 | 16 | 0 | 0 |
| Ipomoea aquatica Forssk. | Convolvulaceae | Scrambler | February–April | 126 | 42 | 4 | 0 |
| Ipomoea cairica (L.) Sweet | Convolvulaceae | Twiner | July–August | 36 | 3 | 0 | 0 |
| Ipomoea nil (L.) Roth | Convolvulaceae | Twiner | May–June | 32 | 0 | 0 | 0 |
| Ipomoea pes-tigridis L. | Convolvulaceae | Twiner | August–September | 2 | 24 | 0 | 0 |
| Ipomoea purpurea (L.) Roth | Convolvulaceae | Twiner | August–September | 28 | 0 | 68 | 160 |
| Lantana camara L. | Verbenaceae | Scrambler | August–September | 0 | 256 | 208 | 0 |
| Lathyrus aphaca L. | Leguminosae | Tendril | September–October | 0 | 218 | 6 | 0 |
| Lathyrus sativus L | Leguminosae | Tendril | March–April | 24 | 306 | 51 | 0 |
| Distimake aegyptius (L.) A.R. Simoes & Staples | Convolvulaceae | Twiner | August–September | 12 | 224 | 0 | 0 |
| Momordica balsamina L. | Cucurbitaceae | Tendril | May–June | 98 | 299 | 0 | 0 |
| Mukia maderaspatana (L.) M. Roem. | Cucurbitaceae | Scrambler | August–September | 0 | 304 | 0 | 0 |
| Pentatropis capensis (L. f.) Bullock | Apocynaceae | Twiner | March–April | 0 | 7 | 0 | 0 |
| Pentatropis nivalis (J.F. Gmel.) D.V. Field & J.R.I. Wood | Apocynaceae | Twiner | July–August | 0 | 358 | 0 | 0 |
| Pergularia daemia (Forssk.) Chiov. | Apocynaceae | Twiner | February–April | 0 | 216 | 4 | 0 |
| Pergularia tomentosa L. | Apocynaceae | Twiner | February–April | 0 | 232 | 2 | 0 |
| Rhynchosia capitata (Roth) DC | Leguminosae | Scrambler | March–April | 28 | 45 | 17 | 0 |
| Rhynchosia minima (L.) DC. | Leguminosae | Scrambler | March–April | 40 | 93 | 81 | 0 |
| Smilax aspera L. | Smilacaceae | Hook climber | August–September | 102 | 193 | 26 | 184 |
| Tinospora sinensis (Lour.) Merr. | Menispermaceae | Woody Climber | April–May | 0 | 0 | 16 | 251 |
| Trichosanthes dioica Roxb. | Cucurbitaceae | Tendril | July–September | 0 | 27 | 97 | 0 |
| Vincetoxicum hirsutum (Wall.) Kuntze | Apocynaceae | Twiner | March–April | 0 | 18 | 0 | 212 |
| Vicia bakeri Ali | Leguminosae | Scrambler | August–September | 0 | 0 | 42 | 0 |
| Vicia sativa L. | Leguminosae | Scrambler | March–April | 128 | 207 | 283 | 0 |
| Diversity Indices | Group I | Group II | Group III | Group IV | Mean |
|---|---|---|---|---|---|
| Species Number | 22 | 32 | 26 | 11 | 22.75 |
| Dominance_D | 0.08301 | 0.05618 | 0.0733 | 0.1539 | 0.091598 |
| Simpson_1-D | 0.917 | 0.9438 | 0.9267 | 0.8461 | 0.9084 |
| Shannon_H | 2.712 | 3.091 | 2.836 | 1.973 | 2.653 |
| Evenness_e^H/S | 0.6843 | 0.5947 | 0.6557 | 0.6541 | 0.6472 |
| Brillouin | 2.643 | 3.06 | 2.793 | 1.948 | 2.611 |
| Menhinick | 0.7325 | 0.5993 | 0.6042 | 0.3036 | 0.5599 |
| Margalef | 3.086 | 4.366 | 3.323 | 1.393 | 3.042 |
| Axes | 1 | 2 | 3 | 4 | Total Inertia |
|---|---|---|---|---|---|
| Eigenvalues | 0.746 | 0.538 | 0.389 | 0.249 | 6.207 |
| Lengths of gradient | 4.827 | 4.317 | 5.136 | 2.924 | |
| Cumulative percentage variance of species data | 12 | 20.7 | 27 | 31 |
| Summary | |||||
|---|---|---|---|---|---|
| Axes | 1 | 2 | 3 | 4 | Total Inertia |
| Eigenvalues | 0.599 | 0.161 | 0.109 | 0.092 | 6.207 |
| Species–environment correlations | 0.912 | 0.668 | 0.675 | 0.672 | |
| Cumulative percentage variance of species data: | 9.7 | 12.3 | 14 | 15.5 | |
| Cumulative percentage of species-environment relation: | 46.3 | 58.8 | 67.2 | 74.3 | |
| Sum of all eigenvalues | 6.207 | ||||
| Sum of all canonical eigenvalues | 1.294 | ||||
| Summary of Monte Carlo test | |||||
| Test of significance of first canonical axis: eigenvalue = 0.599 | |||||
| F-ratio = 7.159 | |||||
| p-value = 0.0020 | |||||
| Test of significance of all canonical axes Trace = 1.294 | |||||
| F-ratio = 1.471 | |||||
| p-value = 0.0020 | |||||
Publisher’s Note: MDPI stays neutral with regard to jurisdictional claims in published maps and institutional affiliations. |
© 2022 by the authors. Licensee MDPI, Basel, Switzerland. This article is an open access article distributed under the terms and conditions of the Creative Commons Attribution (CC BY) license (https://creativecommons.org/licenses/by/4.0/).
Share and Cite
Majeed, M.; Lu, L.; Haq, S.M.; Waheed, M.; Sahito, H.A.; Fatima, S.; Aziz, R.; Bussmann, R.W.; Tariq, A.; Ullah, I.; et al. Spatiotemporal Distribution Patterns of Climbers along an Abiotic Gradient in Jhelum District, Punjab, Pakistan. Forests 2022, 13, 1244. https://doi.org/10.3390/f13081244
Majeed M, Lu L, Haq SM, Waheed M, Sahito HA, Fatima S, Aziz R, Bussmann RW, Tariq A, Ullah I, et al. Spatiotemporal Distribution Patterns of Climbers along an Abiotic Gradient in Jhelum District, Punjab, Pakistan. Forests. 2022; 13(8):1244. https://doi.org/10.3390/f13081244
Chicago/Turabian StyleMajeed, Muhammad, Linlin Lu, Sheikh Marifatul Haq, Muhammad Waheed, Hakim Ali Sahito, Sammer Fatima, Robina Aziz, Rainer W. Bussmann, Aqil Tariq, Israr Ullah, and et al. 2022. "Spatiotemporal Distribution Patterns of Climbers along an Abiotic Gradient in Jhelum District, Punjab, Pakistan" Forests 13, no. 8: 1244. https://doi.org/10.3390/f13081244