Article

Interkingdom Plant–Soil Microbial Ecological Network Analysis under Different Anthropogenic Impacts in a Tropical Rainforest

1
Ecology and Nature Conservation Institute, Chinese Academy of Forestry, Key Laboratory of Biological Conservation of National Forestry and Grassland Administration, Beijing 100091, China
2
College of Marine Science and Biological Engineering, Qingdao University of Science and Technology, Qingdao 266042, China
*
Authors to whom correspondence should be addressed.
Forests 2022, 13(8), 1167; https://doi.org/10.3390/f13081167
Submission received: 21 April 2022 / Revised: 12 June 2022 / Accepted: 20 July 2022 / Published: 23 July 2022

Abstract

:
Plants and their associated soil microorganisms interact with each other and form complex relationships. The effects of slash-and-burn agriculture and logging on aboveground plants and belowground microorganisms have been extensively studied, but research on plant–microbial interkingdom ecological networks is lacking. In this study, using old growth forest as a control, we used metagenomic data (ITS and 16S rRNA gene amplified sequences) and plant data to obtain interdomain species association patterns for three different soil disturbance types (slash-and-burn, clear cutting and selective cutting) in a tropical rainforest based on interdomain ecological network (IDEN) analysis. Results showed that the soil bacterial–fungal and plant–microbe ecological networks had different topological properties among the three forest disturbance types compared to old growth forest. More nodes, links, higher modularity and negative proportion were found in the selective cutting stand, indicating higher stability with increasing antagonistic relationships and niche differentiation. However, the area of slash-and-burn forest yield opposite results. Network module analysis indicated that different keystone species were found in the four forest types, suggesting alternative stable states among them. Different plant species had more preferential associations with specific fungal taxa than bacterial taxa at the genus level and plant–microbe associations lagged behind bacterial–fungal associations. Overall, compared with old growth forests, the bacterial–fungal and plant–microbe ecological networks in the slash-and-burn and clear cutting stands were simpler, while the network in the selective cutting stand was more complex. Understanding the relationships between aboveground plants and belowground microorganisms under differing disturbance patterns in natural ecosystems will help in better understanding the surrounding ecosystem functions of ecological networks.

1. Introduction

Human activities, such as slash-and-burn agriculture and logging, have severely damaged tropical rainforest ecosystems and biodiversity [1,2]. Some restored forests look superficially like mature rainforests, yet are still greatly lacking biodiversity, which could take centuries to fully recover [3]. In recent years, a plethora of research has been conducted on the restoration of aboveground plant diversity and underground microorganisms. Studies have found that the plant species composition [4,5] and soil microbial communities [6,7] of secondary forests were significantly different from that of old growth forest. Han et al. [8] showed that logging disturbance significantly changed the ecological strategy spectrum, and that the strategy number increased with logging intensity. Chen et al. [7] found that the ecological network structure of the microbial community in landscapes with selective logging was more complex than those with clear cutting. Despite such work, there are few studies on interkingdom plant–microbial ecological networks during the restoration period of secondary forests.
Plants and their associated diverse soil microorganisms, such as bacteria, fungi, archaea and protists, as well as microbe–microbe pairs, interact with each other (competitive, mutualistic, neutral, commensal) and form complex relationships [9,10]. Microorganisms can protect host plants from the invasion of pathogenic microorganisms [11], boost the growth of host plants [12] and help host plants adapt to salt, drought and other adverse environments [13,14]. In exchange, the large amount of sugars, amino acids and organic acids secreted by plants in the rhizosphere are nutrient sources for soil microorganisms [15]. The structure and function of soil microbial communities is generated by the complex interactions among host plants, the surrounding plant community, the soil environment and microbial co-associations with the microbiome [9]. Interactions between these species change with the environment [16]. In this study, we took samples in non-rhizosphere soil loci. The composition of the rhizosphere microbiome is extremely different from the structure of the native soil microbiome [17], but the plant rhizosphere-specific fungal mycelia may extend into the bulk soil, affecting the non-rhizosphere microbial community [18]. Understanding the relationships between aboveground plants and belowground microorganisms under different disturbance types in natural ecosystems will aid in better understanding of the ecosystem functions of ecological networks.
With the rapid development of high-throughput technologies, microbiologists increasingly recognize that species interactions are more important than species richness in complex ecosystems [19,20]. These interactions can be visualized as a series of ecological networks in which species are directly or indirectly linked [19]. The ecological network of microbial communities has been extensively studied. For example, Deng et al. [21] constructed molecular ecological networks using Random Matrix Theory methods to provide better understanding of network interactions in microbial communities and their responses to environmental changes. Ecosystem functions of ecological networks can be identified based on network topology [20]. In order to better understand the associations between aboveground plants and belowground microorganisms, Feng et al. [22] proposed a workflow to construct interdomain ecological networks between plants and microbes. Chen et al. [23] demonstrated that interdomain ecological networks between plants and microbes can reflect changes in tree composition and soil nutrients during forest restoration.
Hainan Island hosts the largest tropical forest in China and is one of the world’s biodiversity hotspots. Due to the interference of human activities, such as slash-and-burn agriculture and logging, a variety of secondary forests have been formed during the natural recovery process, making the composition of plant species significantly different from that of old growth forests [
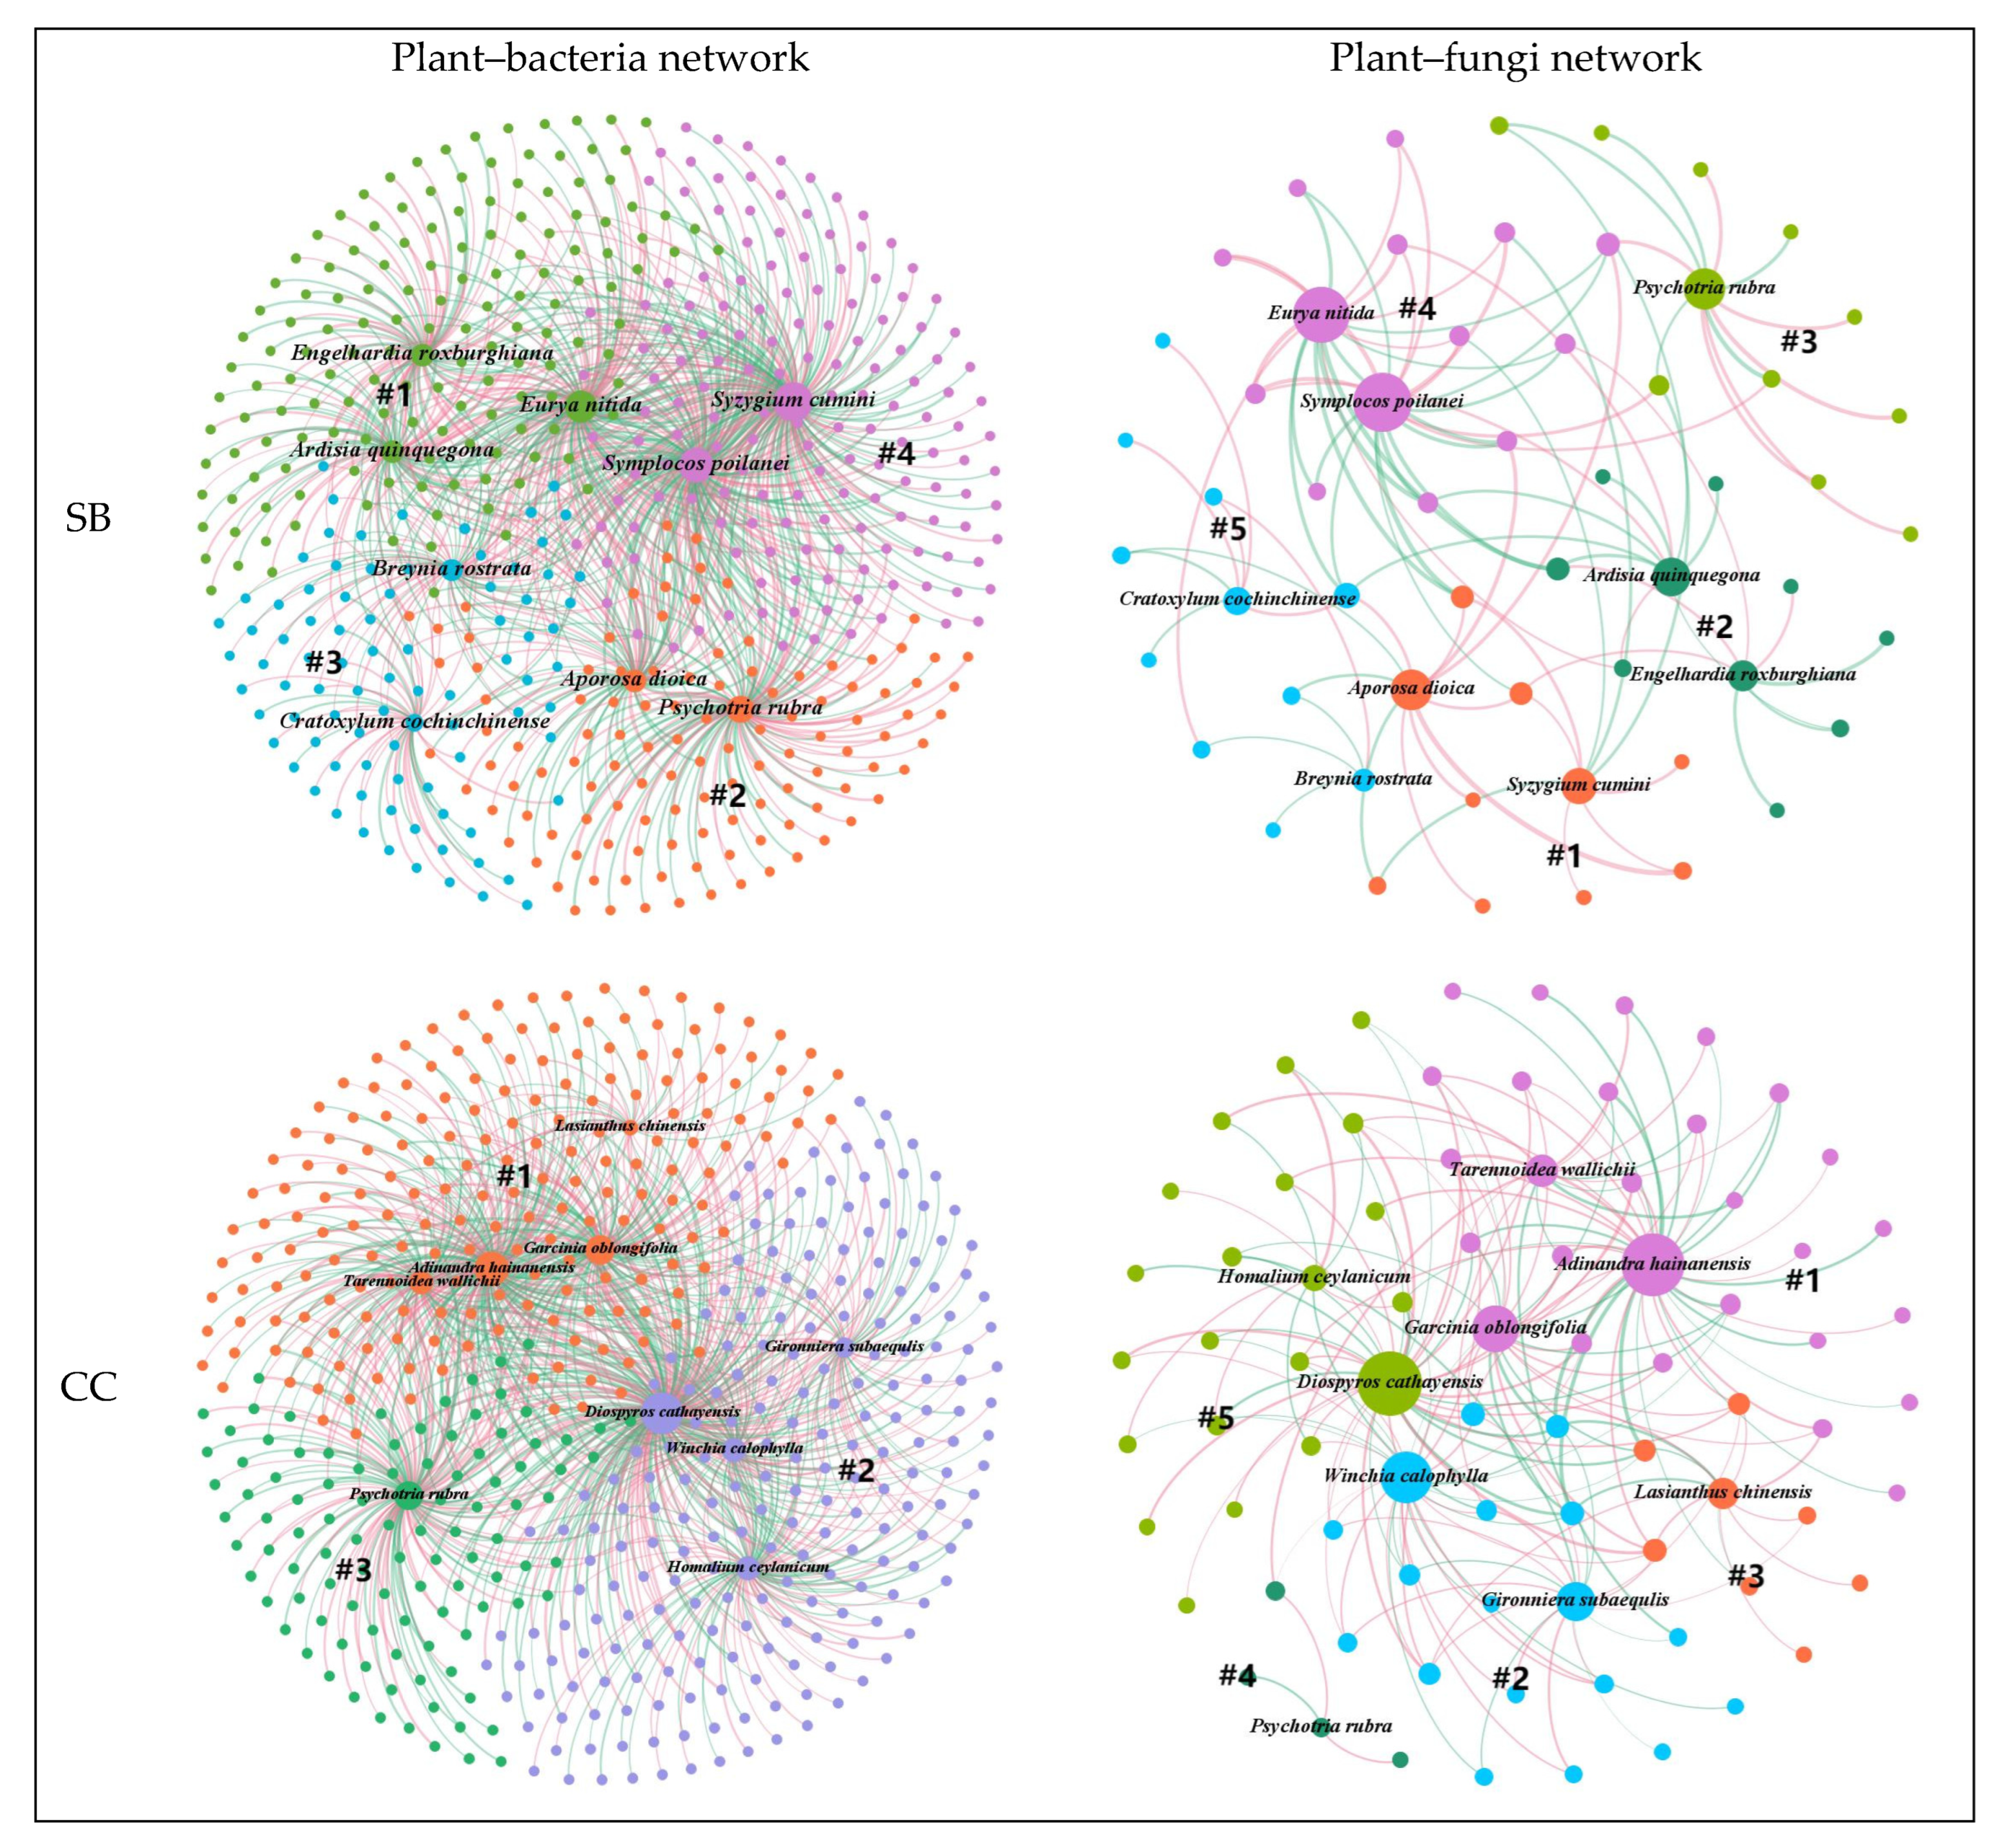
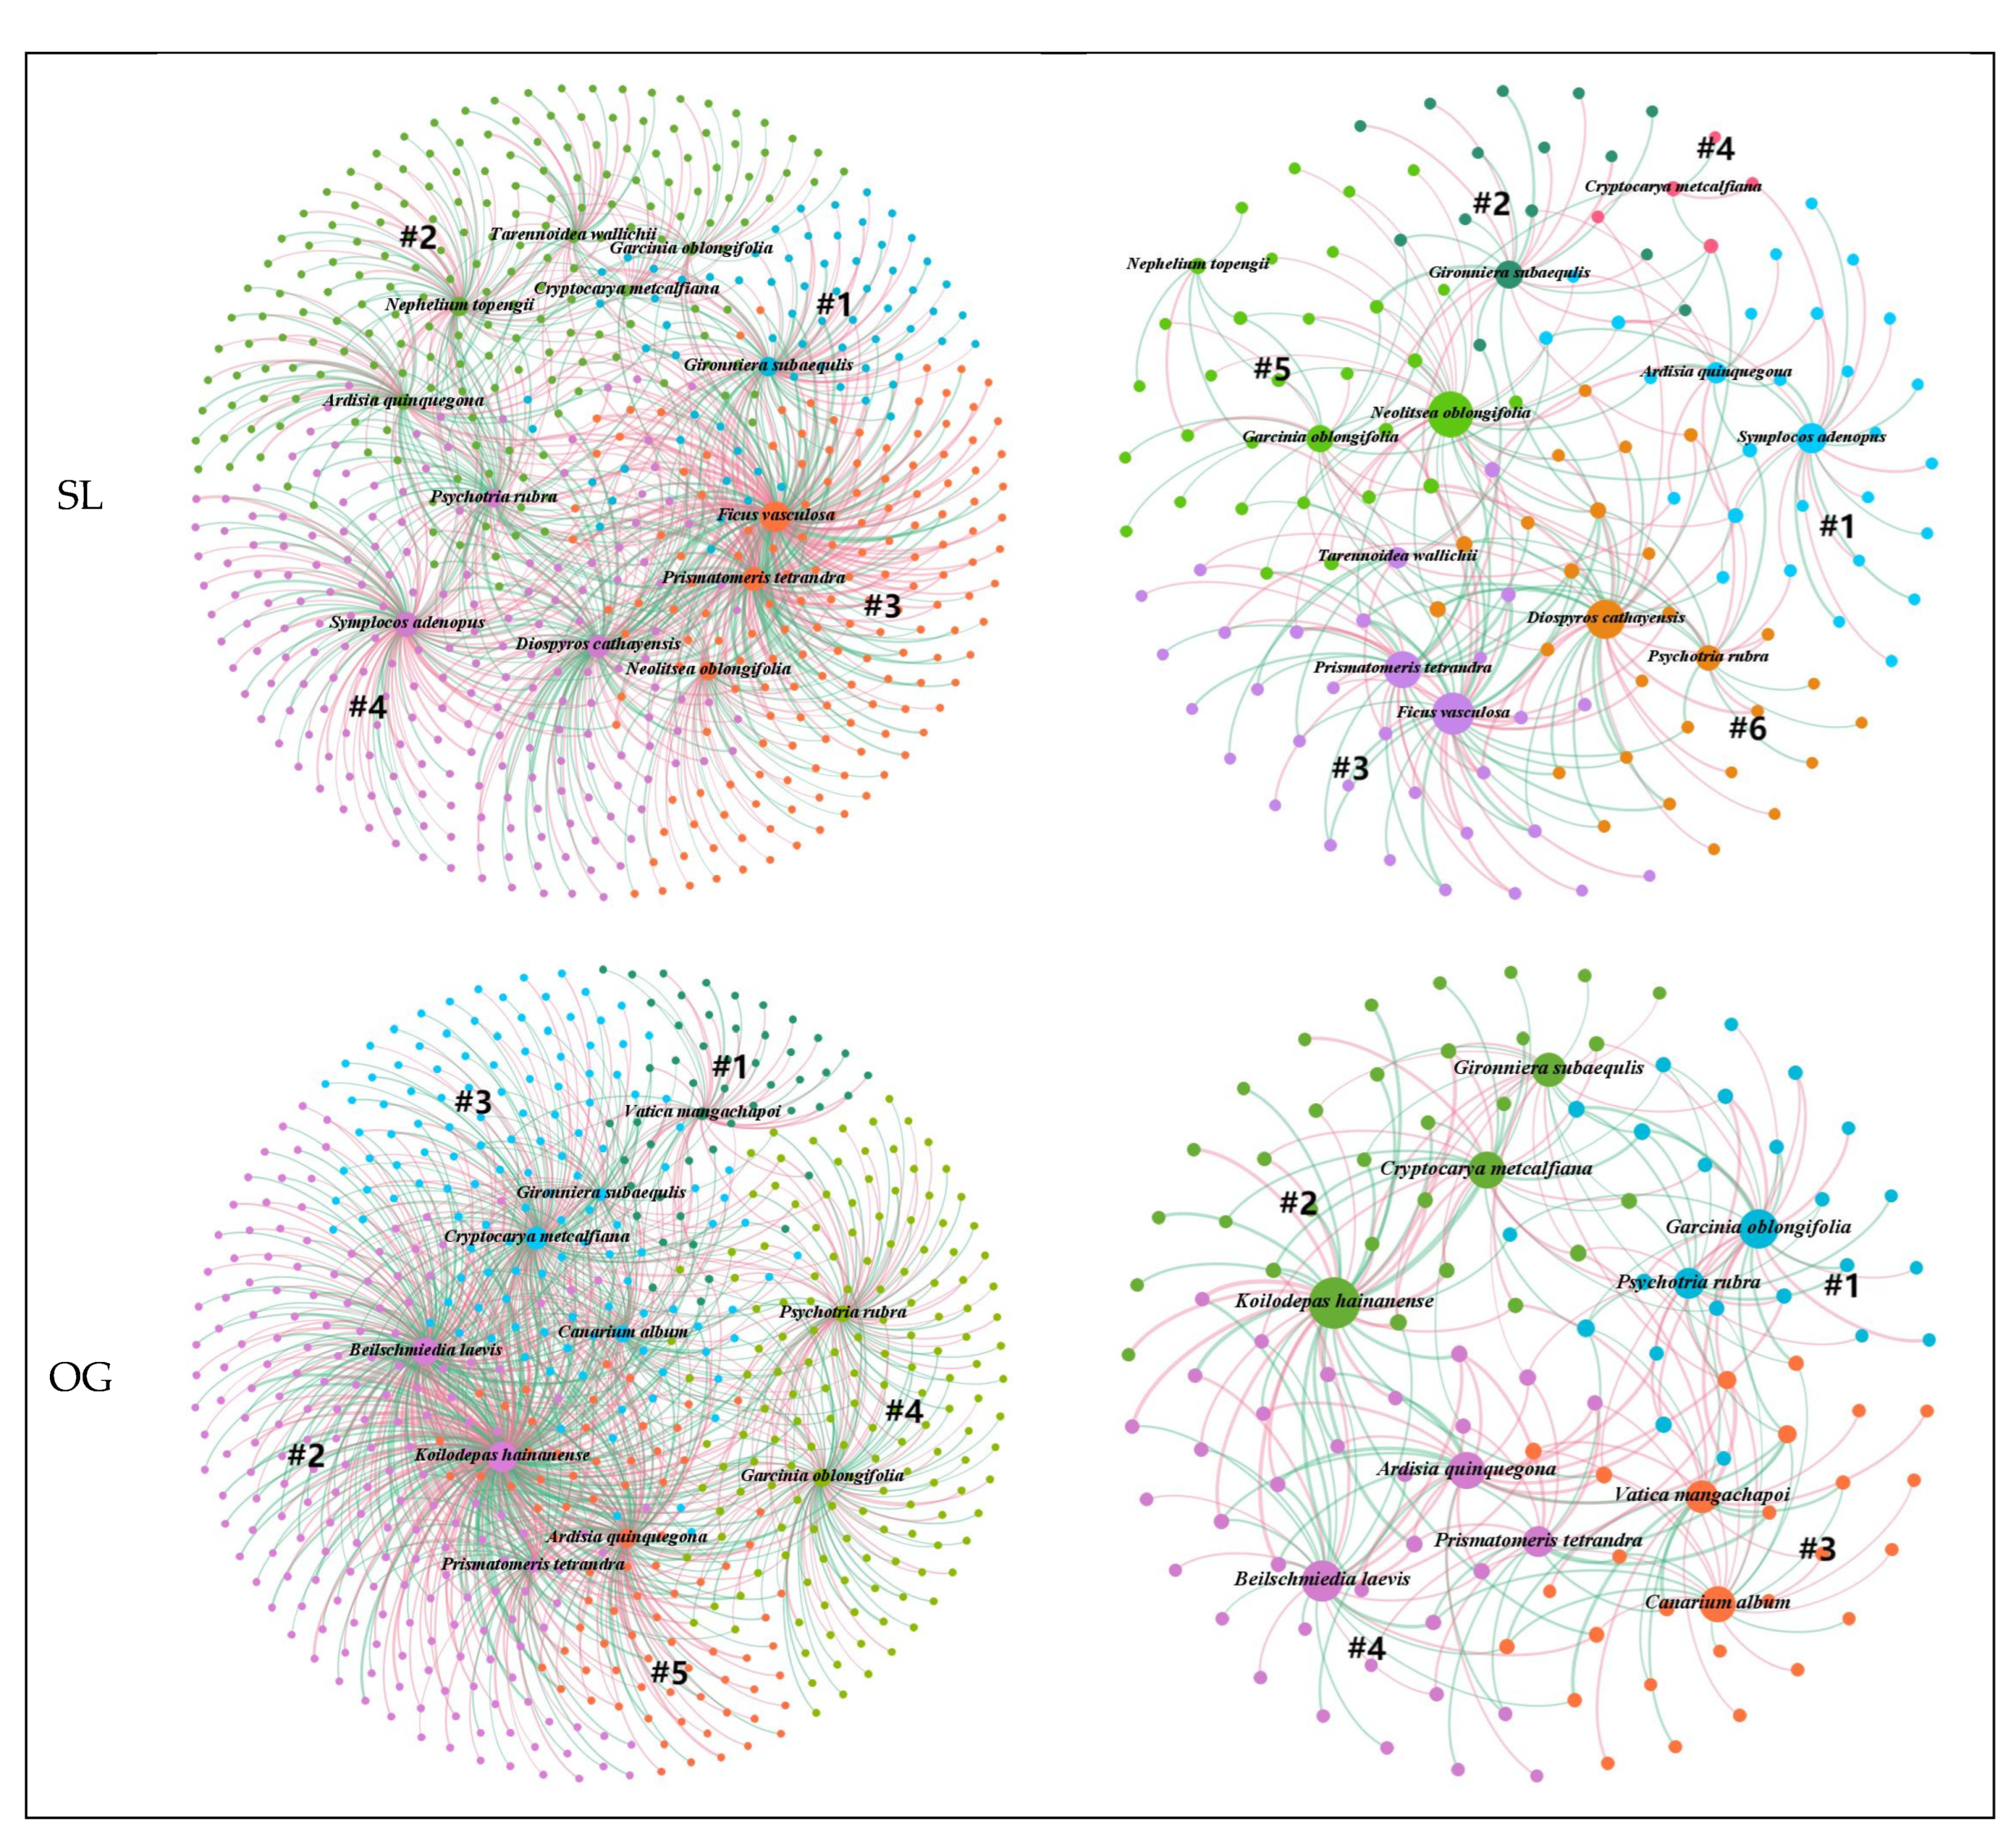
5], which provides an ideal experimental platform for our research. In this study, using old growth forest (OG) as a control, three types of disturbed forest land (slash-and-burn (SB), clear cutting (CC) and selective cutting (SL)) were used to construct ecological networks between bacteria and fungi as well as plants and microbes to address the response of soil bacterial–fungal and plant–microbe ecological networks to different disturbance types.

2. Materials and Methods

2.1. Study Area and Soil Sampling

The study area is located in a tropical lowland rain forest in the Bawangling Nature Reserve (BNR), which is in southwest Hainan Province, China (19°04′~19°08′ N, 109°07′~109°10′ E). The study area is mountainous, with elevations ranging from 100 m to 1654 m a.s.l., having a tropical monsoon climate with the dry season from November to April and wet season from May to October. The mean annual temperature (MAT) is 22.3 °C and mean annual precipitation (MAP) is 2422.7 mm (average from 2012 to 2018 (years)) [24]. There are currently four types of forest stands in BNR: the old growth forest stand (OG), without logging history, and the secondary forest stand, which has naturally regenerated for 60 years (at most) after slash-and-burn (SB) agricultural practices and 40 years after clear cutting (CC) and selective cutting (SL) practices.
The samples were collected from October to December, 2018. Twelve 20 m × 20 m quadrats per forest stand were established at intervals of approximately 20 m. A soil drill with a diameter of 3 cm was used to collect 16 soil samples with a depth of 0–10 cm according to the diagonal principle. The specific site information was shown in Table A1. After removing fine roots, debris and litter, the soil was sieved through 2 mm mesh and brought back to the laboratory for further analysis. Part of soil sample was stored at −20 °C for soil DNA extraction, and the other part was stored at 4 °C for soil physicochemical analyses.

2.2. Soil Physicochemical Parameters and Plant Survey

Soil physicochemical parameters were measured as previously described [25]. Soil pH was measured at a mass ratio of 1:2.5 (soil:water) using a pH meter with a calibrated combined glass electrode. Soil organic carbon (SOC) was measured using the potassium dichromate volumetric and external heating. Total nitrogen (TN) was measured using the modified Kjeldahl procedure. Total phosphorus (TP) and total potassium (TK) were measured using automatic digestion apparatus and plasma emission spectrometer. Available phosphorus (AP) was measured at ammonium fluoride (0.03 mol·L−1)-hydrochloric acid (0.025 mol·L−1) extraction solution using continuous flow analyzer. Available potassium (AK) was measured at 1 mol·L−1 ammonium acetate extraction using plasma emission spectrometer. Soil NH4+-N and NO3-N were measured at 2 mol·L−1 potassium chloride extraction using continuous flow analyzer. The soil physicochemical parameters were significantly by different anthropogenic impacts (Table A2).
All woody plants with a diameter at breast height (DBH) ≥ 1 cm were recorded and identified to species. Height, DBH, coordinates and other information were recorded. Compared with the OG, the plant Shannon and richness indexes of SB were significantly decreased, while that of the CC and SL were significantly increased (p < 0.05) (Table A2). The important value index (IVI = (relative frequency + relative density + relative basal area)/3) of species was calculated to detect the dominant species. Koildepas hainanense, Castanopsis tonkinensis, Vatica mangachapoi and Cyclobalanopsis patelliformis are the most dominant species in OG forest. While SB is dominated by Engelhardia roxburghina, Psychotria rubra and Liquidambar formosana, CC is dominated by P. rubra, Castanopsis carlesii var. spinulosa and Adinandra hainanensis, and SL is dominated by Koilodepas hainanense, C. tonkinensis and Canarium album (Table A3).

2.3. Soil DNA Extraction, Illumina Sequencing and Data Processing

Genomic DNA representative of the soil’s microbial community was extracted from each of the 0.25 g soil samples using the PowerSoil kit (Qiagen, Germany). Extracted DNA was checked on a 2% agarose gel, and DNA concentration and purity were determined using a NanoDrop 2000 spectrophotometer (Thermo Fisher Scientific, Waltham, MA, USA). The hypervariable segment V3-V4 of the bacterial 16S rRNA gene was amplified with forward primer pairs 338F (5′-ACTCCTACGGGAGGCAGCA-3′) and reverse primer 806R (5′-GGACTACHVGGGTWTCTAAT-3′) [26], and the ITS1 segment of the fungi ITS amplified with forward primer ITS1F (5′-CTTGGTCATTTAGAGGAAGTAA-3′) and reverse primer TIS2R (5′-GCTGCGTTCTTCATCGATGC-3′) [27] using a thermocycler (ABI, Carlsbad, CA, USA). The PCR amplification was performed in 20-μL reactions and in triplicate. PCR products were extracted from the 2% agarose gel and purified using the AxyPrep DNA Gel Extraction Kit (Axygen Biosciences, Union City, CA, USA) according to manufacturer’s instructions. Purified amplicons were pooled in equimolar ratios and sequenced on an Illumina MiSeq PE300 platform (Illumina, San Diego, CA, USA) using paired-end sequencing according to the standard protocols.
Raw sequences were demultiplexed, quality-filtered using fastp version 0.20.0 [28] and merged using FLASH version 1.2.7 [29]. Operational taxonomic units (OTUs) with a 97% similarity cutoff [30,31] were clustered using UPARSE version 7.1 [31]. Chimeric sequences were identified and removed. The taxonomy of each representative OTU sequence was analyzed using RDP Classifier version 2.2 with a confidence threshold of 0.7 [32].

2.4. Network Construction

Bacterial–fungal networks were constructed based on the Random Matrix Theory (RMT) algorithm using the Molecular Ecological Network Analyses Pipeline (MENA) (http://ieg4.rccc.ou.edu/mena/, accessed on 5 April 2022) [20,21]. The OTU tables of bacteria and fungi for each forest type were combined into one table. A total of 50% of OTUs from all samples were kept to construct the network. The same threshold was selected to compare network topology characteristics among different forest types. Network connections were randomly re-wired to calculate random network properties and make comparisons to the empirical network.
The plant–bacteria and plant–fungi interdomain ecological networks (IDEN) were constructed based on data from Sparse Correlations for Compositional data (SparCC) using a Galaxy-based analysis pipeline (integrated Network Analysis Pipeline, iNAP, http://mem.rcees.ac.cn:8081, accessed on 5 April 2022) [22] with three main steps. (1) IDEN construction: 80% of the sample numbers were kept to filter plant species or OTUs that were less detectable among all samples. The SparCC method was used to calculate the pairwise correlation value for plants and microorganisms [33]. The threshold value was set to 0.3 to filter noncorrelated associations. The finally resulting adjacent matrix consisted of values of 1 or 0, indicating the presence or absence of a plant–microbe association. (2) Network properties and visualization. The network properties included connectance, web asymmetry, cluster coefficient, nestedness and modularity. The simulated annealing (slow) method was also used for module separation and module hubs. The topological function of each node was evaluated using among-module connectivity (Pi) and within-module connectivity (Zi) [34]. Each node can be divided into four functional groups [21], namely, peripherals (Zi ≤ 2.5 and Pi ≤ 0.62), connectors (Zi ≤ 2.5 and Pi > 0.62), module hubs (Zi > 2.5 and Pi ≤ 0.62) and network hubs (Zi > 2.5 and Pi > 0.62). Module separation was visualized using Gephi (0.9.2). (3) calculating the random network properties, and measuring significance of the observed networks using a one-sample Student’s t-test.

3. Results

3.1. Topological Characteristics for Soil Bacterial–Fungal Ecological Networks

Soil bacterial–fungal ecological networks showed clearly different topological properties among the three forest stands when compared to old growth forest (Table 1). Compared to the OG network, CC and SL networks were more complex with differing bacterial–fungal interactions, and a more modular structure, while the SB network was simpler. For example, SB had 17% fewer nodes and 46% fewer links than OG, while CC had 2 times the number of nodes and 1 to 2 times the number of links, and SL had 15 times the number of nodes and 5 to 6 times the number of links, which comparted to OG. A higher positive proportion of bacterial–fungal interactions were found in SB (93.75%) and CC (69.43%), while a lower positive proportion was found in SL (51.14%) relative to OG (56.80%). The modularity of SB (0.390) was lower than OG (0.526), while a higher modularity was observed in CC (0.722) and SL (0.897).

3.2. Topological Characteristics for Plant–Microbe Ecological Networks

Through the IDEN construction process, an average of 10 plants and 557 bacterial OTUs were chosen to construct the plant–bacteria network, and an average of 10 fungal plants and 90 OTUs were chosen to construct the plant–fungi network (Table 2). The plant–bacteria and plant–fungi networks of SL showed more complexity than OG, including more plants (12) and microbes (bacteria:612; fungi:256), while SB and CC networks were simpler. Different disturbances had a greater impact on plant–fungi networks and the recovery process was slower in comparison to plant–bacteria networks.
There were some basic topological characteristics in the plant–microbe networks, such as connectance, web asymmetry, specialization asymmetry and modularity. The plant–microbe networks showed a non-nested structure. The average web asymmetry of the plant–bacteria and plant–fungi networks were −0.965 and −0.779, illustrating a more skewed pattern for plant–bacteria than plant–fungi. The specialization asymmetry of plant–bacteria networks was generally higher than plant–fungi networks in the four forests, and the specialization asymmetry of plant–bacteria networks increased, while that of the plant–fungi networks decreased after disturbance, suggesting that fungi had a higher preference to specific plant species than bacteria. Comparison of the observed and random networks indicated that the observed topological characteristics of the plant–microbe had nonrandom features in the four forests (Table A4). For example, there was a significant difference for non-nested structure and modularity (p < 0.001).

3.3. Plant–Microbe Module Separation Analysis

Module separation analysis showed plant–microbe specific modules in the four forests (Figure 1). The nodes of the plant–bacteria and plant–fungi networks were relatively evenly distributed in the four forest types. For example, in the plant–bacteria network, SB had four modules, of which module #1 contained 3 plants and 149 OTUs, module #2 contained 2 plants and 115 OTUs, module #3 contained 2 plants and 86 OTUs and module 4 contained 2 plants and 156 OTUs. In the plant–fungi network, SB had five modules, of which module #1 contained 2 plants and 8 OTUs, module #2 contained 2 plants and 8 OTUs, module #3 contained 1 plant and 10 OTUs, module #4 contained 2 plants and 12 OTUs and module #5 contained 2 plants and 9 OTUs.
Most plants in the plant–microbe networks were dominant species (Figure 1, Table A3), suggesting that these plant species were more important. For example, Engelhardia roxburghiana (IVI = 0.133), P. rubra (IVI = 0.083), Cratoxylum cochinchinense (IVI = 0.029) and Aporosa dioica (IVI = 0.027) were the dominant species in the plant–microbe network of SB. P. rubra (IVI = 0.056), A. hainanensis (IVI = 0.030), Diospyros cathayensis (IVI = 0.029) and Lasianthus chinensis (IVI = 0.026) were the dominant species in the plant–microbe network of CC. D. cathayensis (IVI = 0.019), Nephelium topengii (IVI = 0.018), Ficus vasculosa (IVI = 0.017) and Gironniera subaequlis (IVI = 0.015) were the dominant species in the plant–microbe network of SL. K. hainanense (IVI = 0.090), V. mangachapoi (IVI = 0.036), Ardisia quinquegona (IVI = 0.029) and C. album (IVI = 0.019) were the dominant species in the plant–microbe network of OG.
Further analysis of modular roles indicated that plant species were classified as module hubs in the plant–bacteria network after different disturbances (Figure 2a–d), while most plant species were classified as peripherals in the plant–fungi network of SB and CC (Figure 2e,f), suggesting that these plant species were less important in plant–fungi networks. More plant species were classified as module hubs in the SL plant–fungi network (Figure 2g), suggesting that these plant species were important in plant–fungi network. This proves that different disturbances can have greater impact on plant–fungi networks than plant–bacteria networks. In addition, while SB and CC showed decreased plant–microbe network complexity, SL increased in complexity.

3.4. Plant–Microbe Genera Associations

In the four forest stands, an average of eight bacterial phyla were associated with plants, mainly consisting of two phyla (Proteobacteria and Acidobacteria) (Figure 3). There were three fungal phyla associated with plants, mainly Ascomycota (Figure 4). The plants classified as hubs (module hubs and network hubs) showed associations with more microorganisms. In the plant–bacteria network, most plants were classified as module hubs or network hubs in the four forest stands (Figure 2a–d), and each plant was associated with microorganisms (Figure 3). In the plant–fungi network, A. hainanensis, D. cathayensis, Winchia calophylla and G. subaequlis were classified as module hubs or network hubs in the CC forest stand (Figure 2f), most plants were classified as module hubs or network hubs in the SL and OG forest stands (Figure 2g,h), and these plants was associated with most microorganisms (Figure 4).
Different plant species had preferential associations with specific fungal taxa over bacterial taxa at the genus level. In the plant–bacteria network, there were 13 bacteria genera that generally showed consistent associations with most plant species in the four forest types, including Proteobacteria (Stella, Rhizomicrobium and Kofleria), Acidobacteria (Gp1, Gp2, Gp3, Gp6 and Candidatus solibacter), Actinobacteria (Mycobacterium, Gaiella and Aciditerrimonas), Planctomycetes (Gemmata and Aquisphaera), Chloroflexi (Ktedonobacter) and Candidate division WPS−2 (WPS−2 genera incertae sedis). In the plant–fungi network, the genera Sphaerostilbella and Metarhizium were only associated with A. dioica, Aspergillus was only associated with Breynia rostrata, and Talaromyces, Clitopilus and Chaetosphaeria were only associated with P. rubra in the SB forest stand (Figure 4a). The genera Pestalotiopsis and Cladophialophora were only associated with A. hainanensis, Phialocephala, Metacordyceps and Archaeorhizomyces were only associated with D. cathayensis, and Humicola and Gliocephalotrichum were only associated with L. chinensis in the CC forest stand (Figure 4b). The genera Metacordyceps was only associated with Neolitsea oblongifolia, and Trichosporon, Ilyonectria and Cylindrocladium were only associated with Symplocos adenopus in the SL forest stand (Figure 4c). The genera Geminibasidium was only associated with Beilschmiedia laevis, and Clavaria was only associated with Cryptocarya metcalfiana in the OG forest stand (Figure 4d).

4. Discussion

Molecular ecological network analysis simplifies the complex process of analyzing large amounts of data and aids in better understanding the relationships between microorganisms. The stability of a molecular network is closely related to the complexity of the network—the more complex the microbial community, the more stable the microbial community [35,36]. Diversity of interaction types (moderate mixture of antagonistic and mutualistic interactions) can stabilize population dynamics [35], indicating that soil microbial community stability is higher in the selective cutting and clear cutting stands than in old growth forest. In contrast, the stability of the soil microbial community was lower in the slash and burn stands than in old growth forest. In this study, the positive proportion of bacterial–fungal networks in slash-and-burn stands was as high as 93%, indicating an increased mutualism between bacteria and fungi. The increased proportion of negative correlation in selective cutting stands indicates an increase in antagonistic interactions between bacteria and fungi, which reflect the competition between soil bacteria and fungi for limited resources within a unique environmental niche [36]. Modularity prevailed in the molecular ecological network [21]. A network module is a group of species that are highly associated with each other, but had much fewer associations with other modules species [21], which could be perceived as niches [37]. In the bacterial–fungal networks, a higher modularity was observed in the clear cutting and selective cutting stands, suggesting niche differentiation (i.e., the microbial community segregated into finer niches and functional units). Such niche differentiation is an important factor in shaping interactive species and maintaining biodiversity at different scales [38].
Different from bacterial–fungal networks, the plant–bacteria and plant–fungi ecological networks of the clear cutting stand was relatively simple. Clear cutting drastically changes the stand structure and removes the forest canopy [39], leading to the plant community’s slow recovery, suggesting that plant–microbe associations lag behind bacterial–fungal associations. Coexistence of nested and modularity properties is crucial for the resilience and structural stability of ecosystem communities [40]. Nestedness depends on the neutral theory of community construction, while modularity depends on local adaptation and competition [41]. Studies have found that modularity is strong in trophic networks, while nested structures are strong in mutualistic networks [42]. Low nestedness is very important for resilience and structural stability of ecological communities [43]. Non-nested structures have been observed both in plant–bacteria and plant–fungi ecological networks, which may be due to the both plant–bacteria and plant–fungi ecological network belonging to trophic networks [42], and this may be a typical feature of interdomain ecological networks [22], indicating that species preferences are divided to avoid competition and thus favor system-wide resource allocation [44].
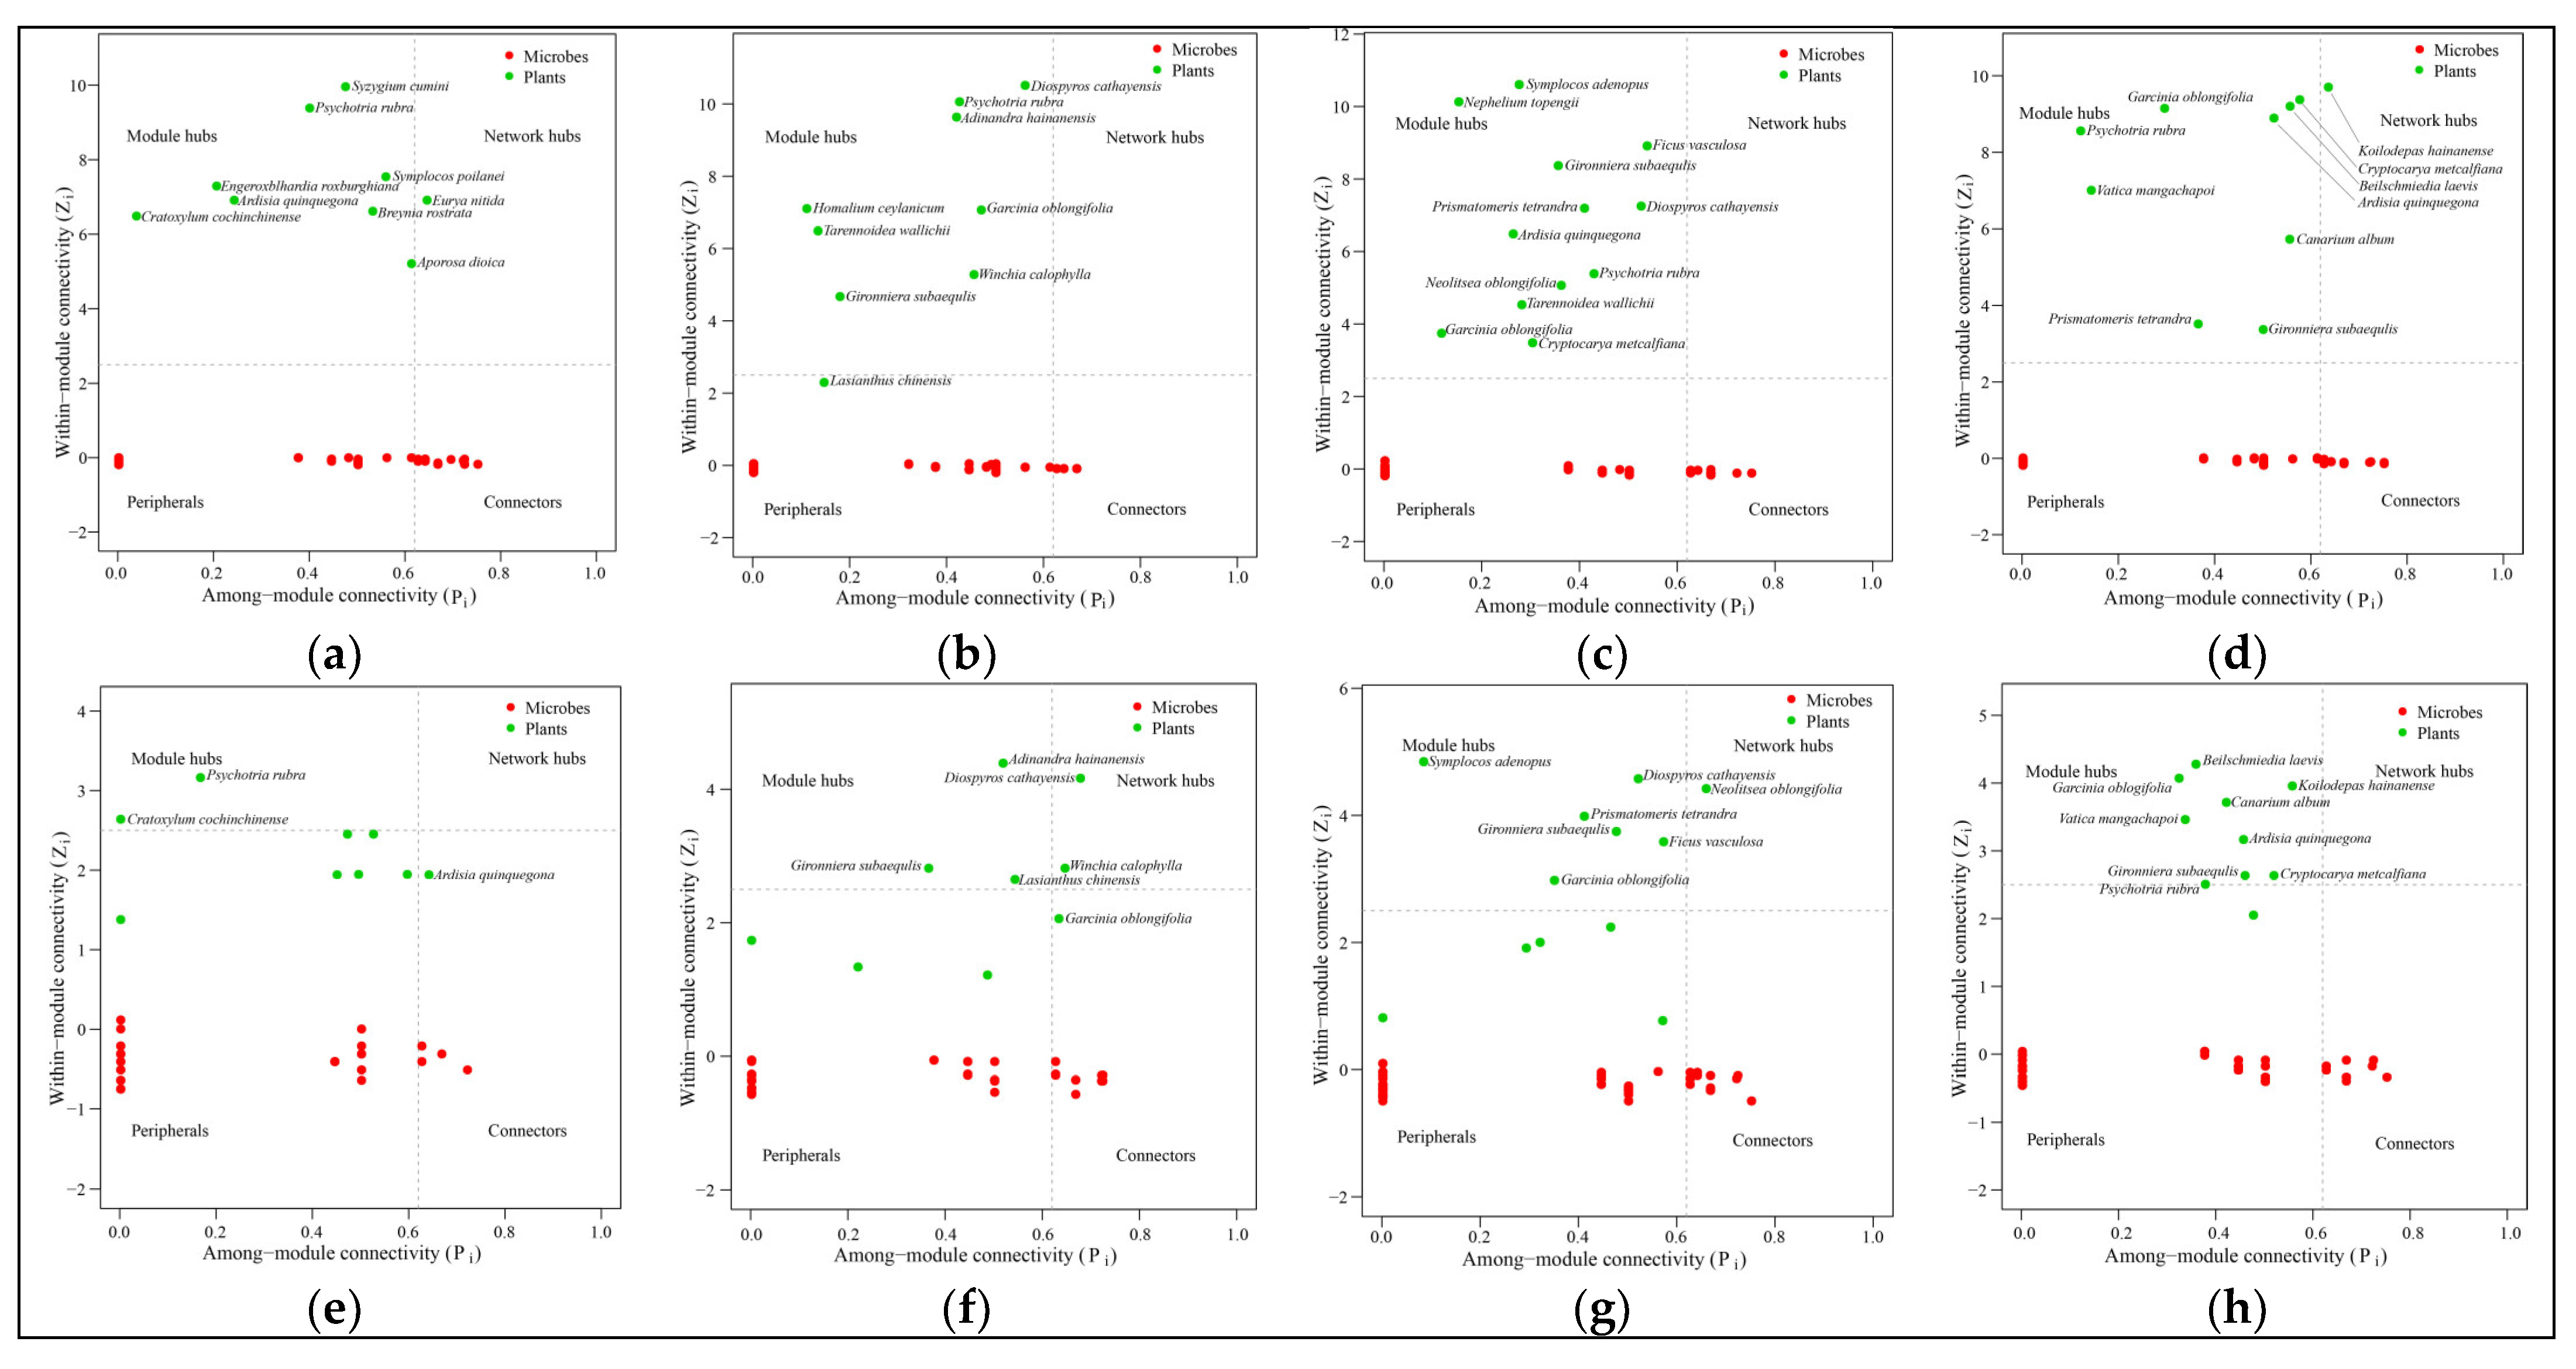
Ecological networks are usually divided into modules of closely interacting species, which are connected by some supergeneralist that serves as a hub or connector species [45]. Most microorganisms are within plant-related modules rather than across modules, suggesting a specialized association between plants and microorganisms [22]. A species defined as a hub is highly associated with other species and has a strong influence on community structures [21]. Removing the hub (keystone species/taxa) can cause drastic changes in community structure and function [46]. The loss of a keystone species leads to a loss of function, and in the case of functional redundancy, observed differences in the taxonomic composition of microbial communities do not imply a loss of function [47]. In this study, different keystone species were found in four forest stands, suggesting that there may be functional redundancy, leading to an alternative stable state [46]. The significant reduction in plant species and the change in dominant species will drastically change the relationship between plants and microorganisms [
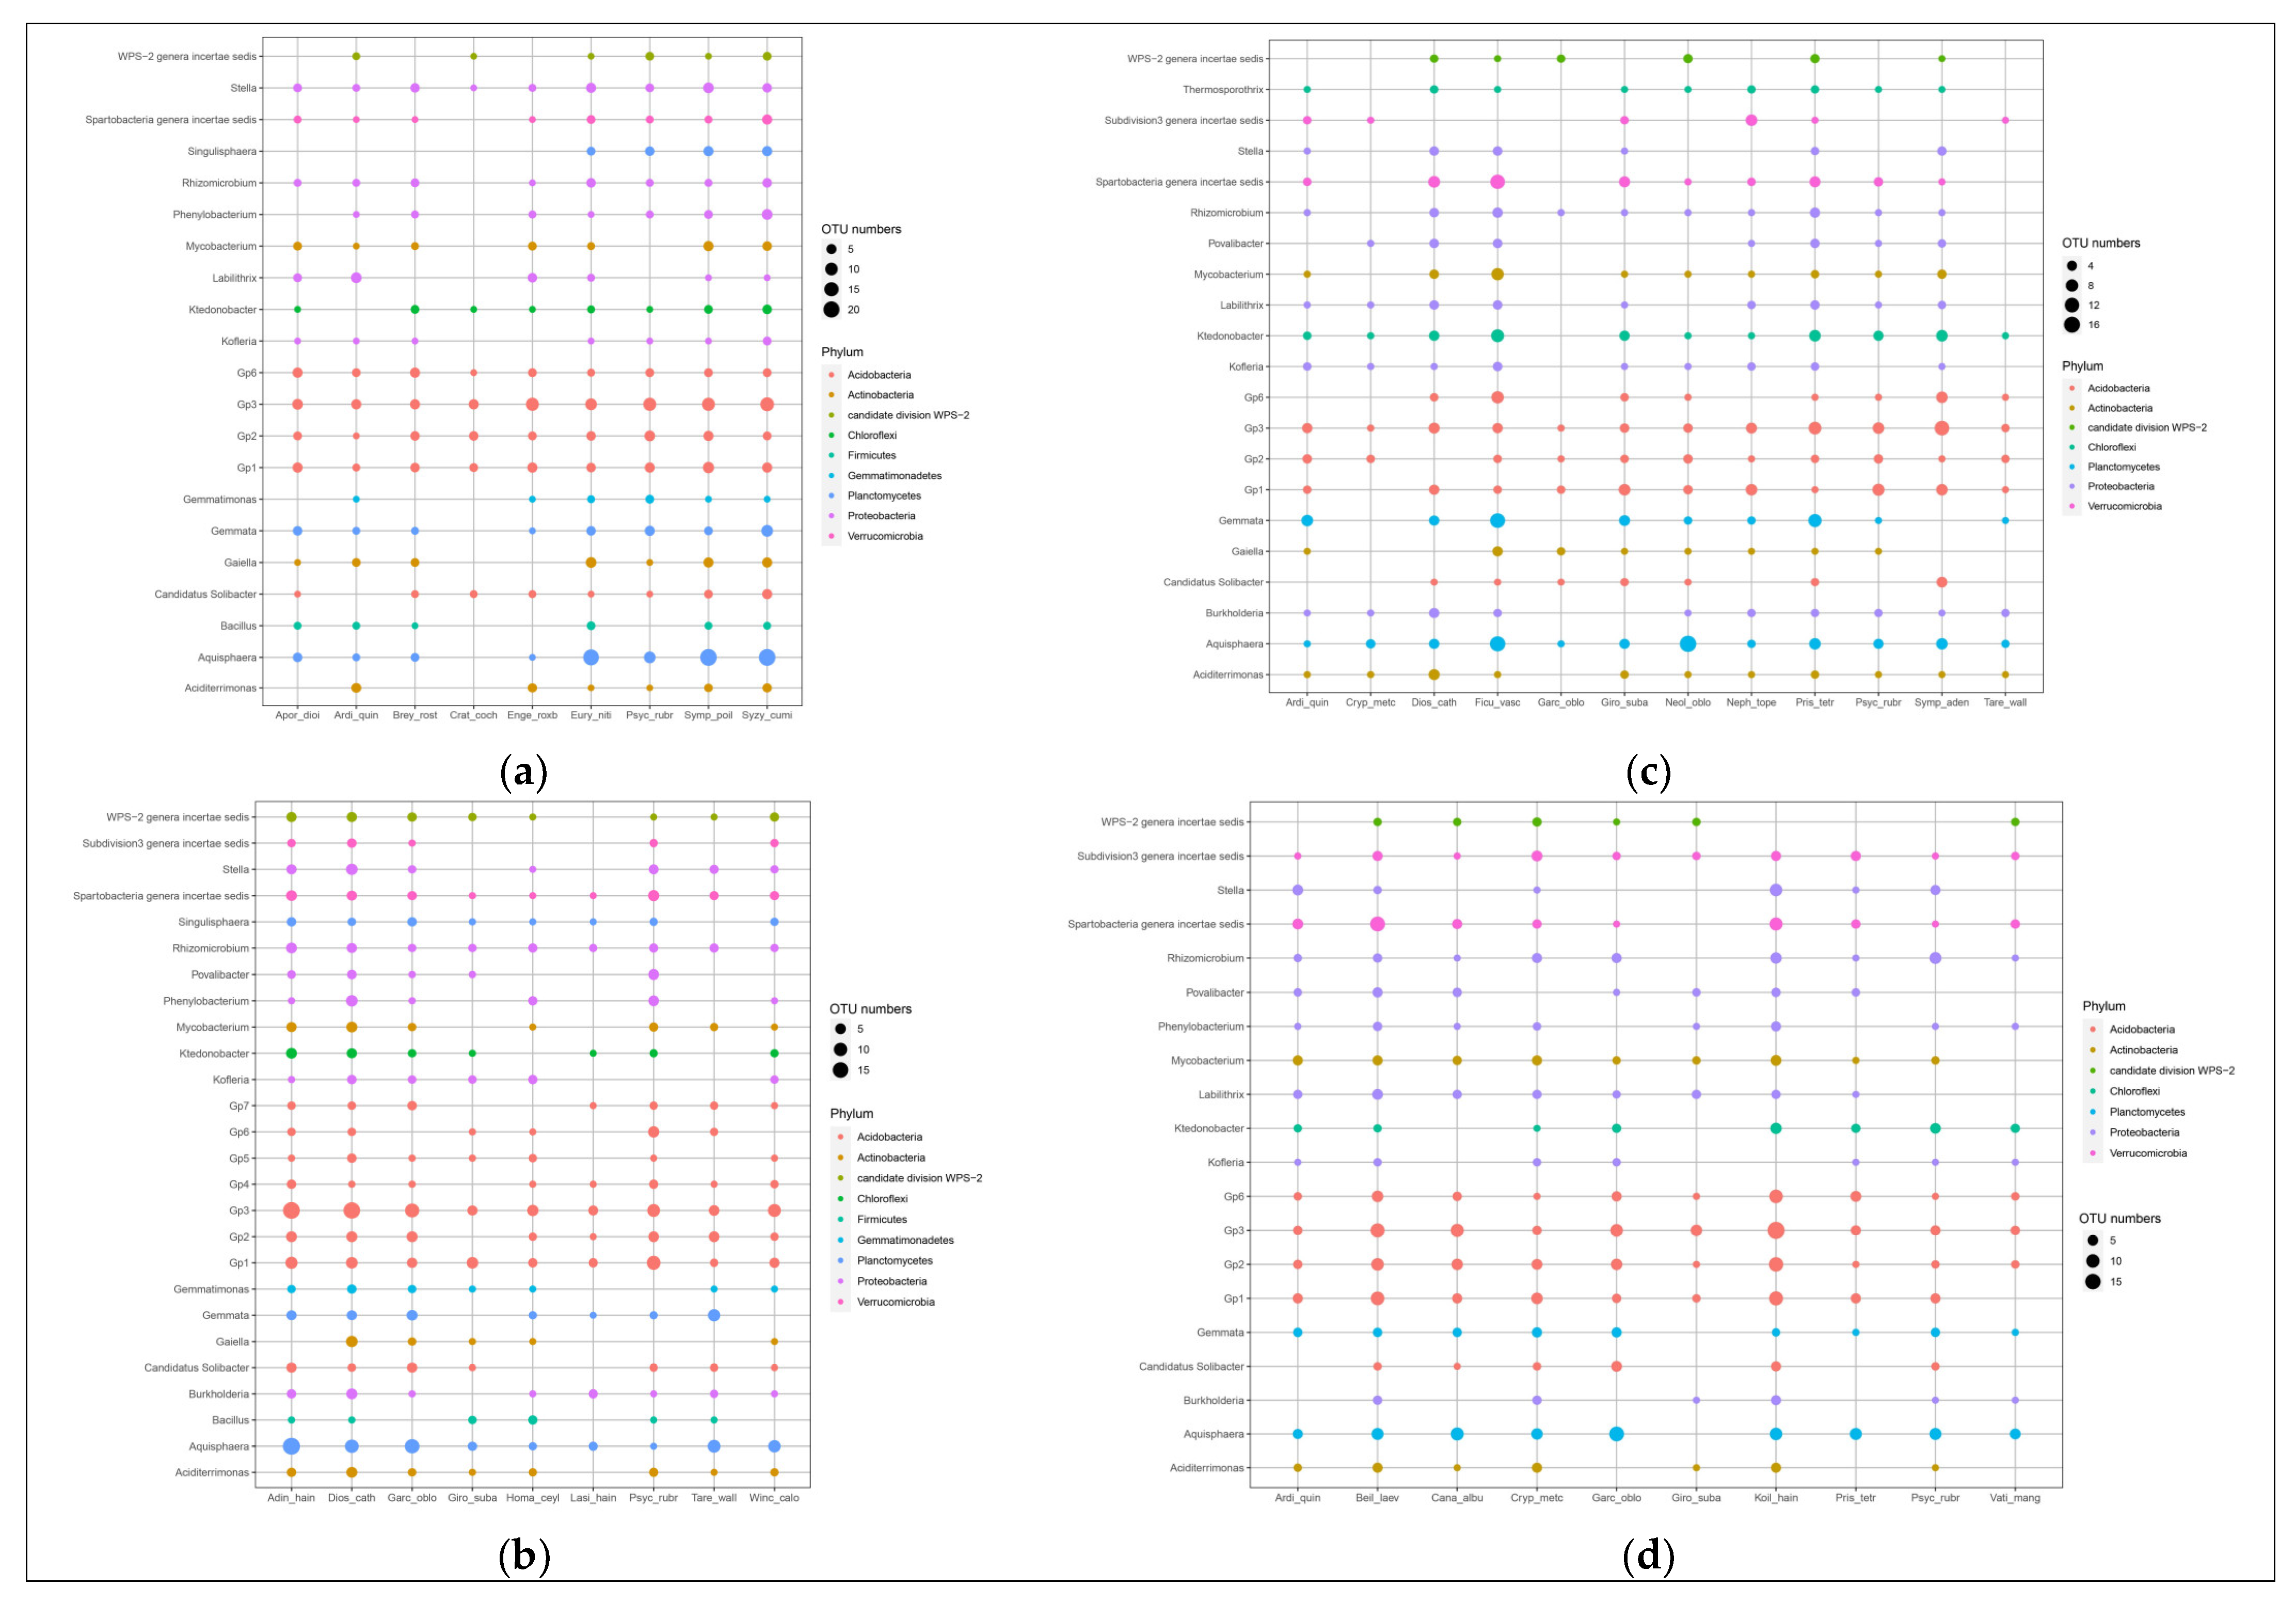
48]. Some different plant species are associated with different microbial genera in the four different forest stands, suggesting that plants adapt dynamically by regulating their microbiomes. In addition, it appears that keystone species can use differing strategies to shape their microbiomes to their advantage [46,47]. Different plant species had more preferential associations with specific fungal genera than bacterial genera, suggesting that bacteria may also have functional redundancy.
The genera of bacteria associated with plants belonged primarily to Proteobacteria and Acidobacteria, while the genera of fungi mainly belonged to Ascomycota, which are dominant phyla in forest soils [49,50,51], indicating that these taxa are widely involved in ecological processes. The relationship between different plants and specific fungal communities are stronger than that between different plants and bacterial communities, which may be because the soil bacterial community structure is influenced by time (succession), and the characteristics of plant species and functional groups are the driving factors affecting soil fungal community structure, which can explain the large proportion of changes in fungal community composition [52]. Urbanová et al. [53] showed that 35–37% of fungal OTUs showed a preference for specific plant species, while 80% of bacterial OTUs shared multiple plant species, which was consistent with our results, indicating that different plants have a preference for fungi over bacteria. Ectomycorrhizal fungi OTUs usually show strong host preference [53]. Chen et al. [23] found that the dominant plant species (Cyclobalanopsis, Lithocarpus and Castanopsis) characterized by ectomycorrhizal fungi increased after clear cutting and selective cutting, indicating that the accumulation of mycorrhizal fungi are beneficial to plant community restoration. Genre et al. [54] showed that mycorrhizal is one of the most important biosphere interactions, providing host plants with mineral nutrients, such as phosphorus and nitrogen, important nutrients to consider for forest management after forest fire disturbance and restoration of mining areas. However, in this study, the genera of fungi associated with plants mainly belonged to Ascomycota, which may be because most ectomycorrhizal plants associate with many unrelated ectomycorrhizal fungi, and many unrelated ectomycorrhizal fungi associate with different plant hosts [55]. For example, Morris et al. [56] found that Ascomycota were more frequent and diverse on Quercus douglasii, which can increases the habitats in which the plants can live, because seedlings dispersing will not be limited in new settings, and may find compatible unrelated ectomycorrhizal fungi [57].

5. Conclusions

Based on the analysis of interdomain ecological network, taking the undisturbed old growth forest as a control, this study constructed plant–microbial interdomain species association patterns for different disturbance types (slash-and-burn, clear cutting and selective cutting). Compared to old growth forest, the ecological network stability of slash and burn and clear cutting decreased, while the ecological network stability of selective cutting increased and showed evidence of niche differentiation. The recovery of the plant–microbial ecological network lagged behind that of microorganisms. The associations between different plants and specific fungal groups were stronger than those between plants and bacterial groups.

Author Contributions

Conceptualization, J.C. and Y.Z.; methodology, J.Y., W.C., Y.D. and Y.Z.; software, J.Y. and W.C.; validation, Y.Z.; formal analysis, J.Y., W.C. and L.J.; investigation, J.Y., W.C., Y.D., L.J. and Y.Z.; data curation, J.Y.; writing—original draft preparation, J.Y.; writing—review and editing, J.Y., W.C., J.C. and Y.Z.; visualization, J.Y.; supervision, Y.Z.; project administration, Y.Z.; funding acquisition, Y.Z. All authors have read and agreed to the published version of the manuscript.

Funding

This research was funded by the Public Welfare Project of the National Scientific Research Institution, grant number CAFYBB2018SZ005 and the National Natural Science Foundation of China, grant number 31670614.

Institutional Review Board Statement

Not applicable.

Informed Consent Statement

Not applicable.

Data Availability Statement

The 16S rRNA and ITS gene sequencing data have been deposited in Sequence Read Archive (SRA) database with accession number of PRJNA832492 (https://www.ncbi.nlm.nih.gov/sra/PRJNA832492), accessed on 27 April 2022.

Acknowledgments

We would like to thank Liangjin Yao, Pengcheng Liu, and Wei Ren for field sampling and soil samplings collection, and Ye Deng provided the data analyses pipeline. We would also like to thank Charlotte Hacker for editing the English text of this manuscript.

Conflicts of Interest

The authors declare no conflict of interest.

Appendix A

Table A1. Descriptions about community sample plots in the four forest stands.
Sampling SiteLatitude-LongitudeElevation/mDisturbance TypeRecovery Time (years)
Nanchahe109°10′47.9″ E, 19°08′31.8″ N470Slash-and-Burn (SB)60
Nanchahe109°10′48.2″ E, 19°08′19.1″ N439Slash-and-Burn (SB)60
East main line 8 km109°07′06.4″ E, 19°06′47.3″ N497Slash-and-Burn (SB)60
Wuliqiao109°07′11.9″ E, 19°06′58.3″ N502Slash-and-Burn (SB)60
Yajia109°07′28.9″ E, 19°04′30.6″ N687Clear cutting (CC)40
Yajia109°07′40.7″ E, 19°04′18″ N716Clear cutting (CC)40
yajia109°07′45.5″ E, 19°04′15.6″ N800Selective cutting (SL)40
Yajia109°07′07.3″ E, 19°04′22.9″ N751Selective cutting (SL)40
Wuliqiao109°07′13.4″ E, 19°06′52.7″ N577Old growth forest (OG)/
Wuliqiao109°07′06.4″ E, 19°06′47.2″ N594Old growth forest (OG)/
Yajia109°08′20″ E, 19°06′19″ N680Old growth forest (OG)/
Yajia109°08′10″ E, 19°06′13.4″ N682Old growth forest (OG)/
Table A2. Comparison of physicochemical and plant indexes in the four forest stands.
IndexesSBCCSLOG
Physicochemical index
Soil pH4.8 ± 0.2 a4.8 ± 0.3 ab4.5 ± 0.3 b4.5 ± 0.1 b
Soil organic carbon (g·kg−1)27.37 ± 5.38 ab30.51 ± 2.79 a26.37 ± 4.68 ab23.28 ± 4.54 b
Total nitrogen (g·kg−1)2.0 ± 0.3 ab2.4 ± 0.3 a2.3 ± 0.4 a1.8 ± 0.3 b
Total phosphorus (g·kg−1)0.2 ± 0.1 a0.1 ± 0.1 ab0.1 ± 0.0 ab0.07 ± 0.0 b
Total potassium (g·kg−1)32.6 ± 12.0 b34.2 ± 4.9 ab31.4 ± 10.4 b42.6 ± 6.6 a
Available phosphorus (mg·kg−1)1.97 ± 0.65 a1.46 ± 0.49 b1.38 ± 0.36 b0.87 ± 0.12 c
Available potassium (mg·kg−1)113.70 ± 38.50 ab127.40 ± 47.50 a119.80 ± 36.30 a79.69 ± 14.23 b
NH4+-N (mg·kg−1)10.76 ± 3.69 ab12.07 ± 10.23 ab14.75 ± 12.51 a5.54 ± 2.50 b
NO3-N (mg·kg−1)3.60 ± 2.36 b11.33 ± 8.05 a15.79 ± 9.08 a10.81 ± 4.39 a
Plant index
Plant Shannon index2.6 ± 0.3 c3.3 ± 0.3 a3.4 ± 0.3 a3.0 ± 0.4 b
Plant richness index30.17 ± 4.63 c57.83 ± 11.16 a55.67 ± 6.60 a47.00 ± 6.11 b
SB: slash-and-burn. CC: clear cutting. SL: selective cutting. OG: old growth forests. Data presents the mean value ± standard deviation, different letters next to values indicate significant different (p < 0.05, one-way ANOVA with Tukey HSD) in the four forest stands.
Table A3. Importance value index (IVI) of the top 15 species in the four forest stands.
Topological CharacteristicsSpeciesImportant Value Index (IVI)
SB
Engelhardia roxburghiana0.133
Psychotria rubra0.083
Liquidambar formosana0.067
Castanopsis carlesii var. spinulosa0.062
Schima superba0.045
Cyclobalanopsis kerrii0.033
Cratoxylum cochinchinense0.029
Aporosa dioica0.027
Adinandra hainanensis0.026
Symplocos poilanei0.023
Ardisia quinquegona0.022
Lithocarpus corneus0.021
Eurya nitida0.018
Canthium horridum0.018
Castanopsis hystrix0.017
CC
Psychotria rubra0.056
Castanopsis carlesii var. spinulosa0.052
Adinandra hainanensis0.030
Diospyros cathayensis0.029
Lasianthus chinensis0.026
Tarennoidea wallichii0.023
Itea macrophylla0.019
Homalium ceylanicum0.0185
Schima superba0.018
Ficus vasculosa0.018
Engelhardia roxburghiana0.018
Castanopsis hystrix0.017
Glochidion wrightii0.014
Machilus gamblei0.014
Blastus cochinchinensis0.014
SL
Koilodepas hainanense0.064
Castanopsis tonkinensis0.039
Canarium album0.030
Cyclobalanopsis patelliformis0.024
Maclurodendron oligophlebium0.021
Diospyros cathayensis0.019
Nephelium topengii0.018
Tarennoidea wallichii0.018
Polyalthia laui0.018
Ficus vasculosa0.017
Engelhardia roxburghiana0.016
Gironniera subaequalis0.015
Triadica cochinchinensis0.015
Xanthophyllum hainanense0.015
Castanopsis hystrix0.014
OG
Koilodepas hainanense0.090
Castanopsis tonkinensis0.040
Vatica mangachapoi0.036
Cyclobalanopsis patelliformis0.035
Ardisia quinquegona0.029
Alstonia rostrata0.027
Hancea hookeriana0.026
Lithocarpus fenzelianus0.023
Sindora glabra0.022
Canarium album0.019
Cryptocarya metcalfiana0.019
Garcinia oblongifolia0.016
Beilschmiedia laevis0.016
Castanopsis hystrix0.015
Machilus gamblei0.014
SB: slash-and-burn. CC: clear cutting. SL: selective cutting. OG: old growth forests.
Table A4. Comparison of observed and random network topological characteristics in the four forest stands.
Plant–Bacteria NetworkPlant–Fungi Network
Observed NetworkRewiring NetworktpObserved NetworkRewiring Networktp
SB
nestedness44.83042.979 ± 0.960−19.290<0.00144.83143.553 ± 2.903−4.402<0.001
weighted nestedness0.1890.259 ± 0.01351.871<0.0010.0020.136 ± 0.04132.836<0.001
specialization asymmetry0.6660.670 ± 0.00152.325<0.0010.4350.447 ± 0.00343.465<0.001
C.score.HL0.6240.584 ± 0.004−101.787<0.0010.7100.664 ± 0.012−39.209<0.001
C.score.LL0.6380.612 ± 0.002−123.511<0.0010.6700.653 ± 0.007−68.104<0.001
modularity0.4110.363 ± 0.011−44.098<0.0010.4730.436 ± 0.008−47.228<0.001
CC
nestedness38.61438.132 ± 0.774−6.221<0.00129.04828.630 ± 1.498−2.789<0.05
weighted nestedness0.2870.322 ± 0.01229.981<0.0010.3430.405 ± 0.02921.154<0.001
specialization asymmetry0.6370.639 ± 0.00129.721<0.0010.4250.428 ± 0.00311.638<0.001
C.score.HL0.5840.558 ± 0.004−59.482<0.0010.5580.486 ± 0.021−35.127<0.001
C.score.LL0.5760.563 ± 0.002−57.795<0.0010.4750.455 ± 0.007−27.998<0.001
modularity0.3680.334 ± 0.009−36.485<0.0010.3280.311 ± 0.006−26.466<0.001
SL
nestedness38.06635.071 ± 0.850−35.253<0.00135.35731.261 ± 1.562−26.215<0.01
weighted nestedness0.2160.256 ± 0.01040.028<0.0010.2220.278 ± 0.02423.233<0.001
specialization asymmetry0.6530.656 ± 0.00150.846<0.0010.5190.526 ± 0.00231.260<0.001
C.score.HL0.8150.797 ± 0.003−58.507<0.0010.7440.711 ± 0.011−29.679<0.001
C.score.LL0.7730.761 ± 0.001−124.889<0.0010.7200.701 ± 0.003−54.947<0.001
modularity0.4900.473 ± 0.015−11.219<0.0010.4750.444 ± 0.005−62.551<0.001
OG
nestedness41.88837.941 ± 0.670−58.902<0.00153.21254.224 ± 2.0055.047<0.001
weighted nestedness0.2470.327 ± 0.00987.560<0.0010.0860.062 ± 0.027−8.591<0.001
specialization asymmetry0.6080.615 ± 0.00183.837<0.0010.6370.636 ± 0.000−16.147<0.001
C.score.HL0.6860.655 ± 0.003−100.222<0.0010.6530.645 ± 0.003−22.335<0.001
C.score.LL0.5480.636 ± 0.002501.858<0.0010.6830.677 ± 0.002−24.625<0.001
modularity0.4200.378 ± 0.010−42.209<0.0010.4500.409 ± 0.006−67.648<0.001
SB: slash-and-burn. CC: clear cutting. SL: selective cutting. OG: old growth forests.

References

  1. Enuoh, O.O.O.; Ogogo, A.U. Assessing tropical deforestation and biodiversity loss in the cross river rainforest of nigeria. Open J. For. 2018, 8, 393–408. [Google Scholar] [CrossRef] [Green Version]
  2. Hauser, S.; Norgrove, L. Slash-and-burn agriculture, effects of. Encycl. Biodivers. 2013, 6, 551–562. [Google Scholar] [CrossRef]
  3. Hunter, P. Restoring tropical rain forests. EMBO Rep. 2017, 18, 523–525. [Google Scholar] [CrossRef]
  4. Tamura, A.; Yamane, M. Response of understory vegetation over 10 years after thinning in an old-growth cedar and cypress plantation overgrazed by sika deer in eastern japan. For. Ecosyst. 2017, 4, 1. [Google Scholar] [CrossRef] [Green Version]
  5. Ding, Y.; Zang, R. Vegetation recovery dynamics of tropical lowland rain forest in bawangling of hainan island, south china. Chin. J. Plant Ecol. 2011, 35, 577–586. [Google Scholar] [CrossRef]
  6. Song, P.; Ren, H.; Jia, Q.; Guo, J.; Zhang, N.; Ma, K. Effects of historical logging on soil microbial communities in a subtropical forest in southern china. Plant Soil 2015, 397, 115–126. [Google Scholar] [CrossRef]
  7. Chen, J.; Xu, H.; He, D.; Li, Y.; Luo, T.; Yang, H.; Lin, M. Historical logging alters soil fungal community composition and network in a tropical rainforest. For. Ecol. Manag. 2019, 433, 228–239. [Google Scholar] [CrossRef]
  8. Han, X.; Huang, J.; Yao, J.; Xu, Y.; Ding, Y.; Zang, R. Effects of logging on the ecological strategy spectrum of a tropical montane rain forest. Ecol. Indic. 2021, 128, 107812. [Google Scholar] [CrossRef]
  9. Bakker, M.G.; Schlatter, D.C.; Otto-Hanson, L.; Kinkel, L.L. Diffuse symbioses: Roles of plant-plant, plant-microbe and microbe-microbe interactions in structuring the soil microbiome. Mol. Ecol. 2014, 23, 1571–1583. [Google Scholar] [CrossRef]
  10. Hassani, M.A.; Durán, P.; Hacquard, S. Microbial interactions within the plant holobiont. Microbiome 2018, 6, 58. [Google Scholar] [CrossRef]
  11. Ritpitakphong, U.; Falquet, L.; Vimoltust, A.; Berger, A.; Métraux, J.P.; L’haridon, F. The microbiome of the leaf surface of arabidopsis protects against a fungal pathogen. New Phytol. 2016, 210, 1033–1043. [Google Scholar] [CrossRef] [Green Version]
  12. van der Heijden, M.G.; de Bruin, S.; Luckerhoff, L.; Van Logtestijn, R.S.; Schlaeppi, K. A widespread plant-fungal-bacterial symbiosis promotes plant biodiversity, plant nutrition and seedling recruitment. ISME J. 2016, 10, 389–399. [Google Scholar] [CrossRef] [PubMed] [Green Version]
  13. Trivedi, P.; Leach, J.E.; Tringe, S.G.; Sa, T.; Singh, B.K. Plant-microbiome interactions: From community assembly to plant health. Nat. Rev. Microbiol. 2020, 18, 607–621. [Google Scholar] [CrossRef] [PubMed]
  14. Nikitin, D.A.; Semenov, M.V.; Chernov, T.I.; Ksenofontova, N.A.; Zhelezova, A.D.; Ivanova, E.A.; Khitrov, N.B.; Stepanov, A.L. Microbiological indicators of soil ecological functions: A review. Eurasian Soil Sci. 2022, 55, 221–234. [Google Scholar] [CrossRef]
  15. Bais, H.P.; Weir, T.L.; Perry, L.G.; Gilroy, S.; Vivanco, J.M. The role of root exudates in rhizosphere interactions with plants and other organisms. Annu. Rev. Plant Biol. 2006, 57, 233–266. [Google Scholar] [CrossRef] [Green Version]
  16. Chamberlain, S.A.; Bronstein, J.L.; Rudgers, J.A. How context dependent are species interactions? Ecol. Lett. 2014, 17, 881–890. [Google Scholar] [CrossRef]
  17. Semenov, M.V.; Nikitin, D.A.; Stepanov, A.L.; Semenov, V.M. The structure of bacterial and fungal communities in the rhizosphere and root-free loci of gray forest soil. Eurasian Soil Sci. 2019, 52, 319–332. [Google Scholar] [CrossRef]
  18. Koide, R.T.; Xu, B.; Sharda, J. Contrasting below-ground views of an ectomycorrhizal fungal community. New Phytol. 2005, 166, 251–262. [Google Scholar] [CrossRef]
  19. Montoya, J.M.; Pimm, S.L.; Solé, R.V. Ecological networks and their fragility. Nature 2006, 442, 259–264. [Google Scholar] [CrossRef]
  20. Zhou, J.; Deng, Y.; Luo, F.; He, Z.; Yang, Y. Phylogenetic molecular ecological network of soil microbial communities in response to elevated CO2. mBio 2011, 2, e00122-11. [Google Scholar] [CrossRef] [Green Version]
  21. Deng, Y.; Jiang, Y.; He, Z.; Luo, F.; Zhou, J. Molecular ecological network analyses. BMC Bioinform. 2012, 13, 113. [Google Scholar] [CrossRef] [PubMed] [Green Version]
  22. Feng, K.; Zhang, Y.; He, Z.; Ning, D.; Deng, Y. Interdomain ecological networks between plants and microbes. Mol. Ecol. Resour. 2019, 19, 1565–1577. [Google Scholar] [CrossRef]
  23. Chen, J.; Feng, K.; Hannula, S.E.; Kuzyakov, Y.; Li, Y.; Xu, H. Interkingdom plant-microbial ecological networks under selective and clear cutting of tropical rainforest. For. Ecol. Manag. 2021, 491, 119182. [Google Scholar] [CrossRef]
  24. Tian, L.; Letcher, S.G.; Ding, Y.; Zang, R. A ten-year record reveals the importance of tree species’ habitat specialization in driving successional trajectories on hainan island, china. For. Ecol. Manag. 2022, 507, 120027. [Google Scholar] [CrossRef]
  25. Bao, S.D. Soil and Agricultural Chemistry Analysis, 3rd ed.; Agriculture Publication: Beijing, China, 2000. [Google Scholar]
  26. Xu, N.; Tan, G.; Wang, H.; Gai, X. Effect of biochar additions to soil on nitrogen leaching, microbial biomass and bacterial community structure. Eur. J. Soil Biol. 2016, 74, 1–8. [Google Scholar] [CrossRef]
  27. Adams, R.I.; Miletto, M.; Taylor, J.W.; Bruns, T.D. Dispersal in microbes: Fungi in indoor air are dominated by outdoor air and show dispersal limitation at short distances. ISME J. 2013, 7, 1262–1273. [Google Scholar] [CrossRef] [Green Version]
  28. Chen, S.; Zhou, Y.; Chen, Y.; Gu, J. fastp: An ultra-fast all-in-one fastq preprocessor. Bioinformatics 2018, 34, i884–i890. [Google Scholar] [CrossRef]
  29. Magoč, T.; Salzberg, S.L. FLASH: Fast length adjustment of short reads to improve genome assemblies. Bioinformatics 2011, 27, 2957–2963. [Google Scholar] [CrossRef]
  30. Stackebrandt, E.; Goebel, B.M. Taxonomic note: A place for DNA-DNA reassociation and 16s rrna sequence analysis in the present species definition in bacteriology. Int. J. Syst. Evol. Microbiol. 1994, 44, 846–849. [Google Scholar] [CrossRef] [Green Version]
  31. Edgar, R.C. UPARSE: Highly accurate otu sequences from microbial amplicon reads. Nat. Methods 2013, 10, 996–998. [Google Scholar] [CrossRef]
  32. Wang, Q.; Garrity, G.M.; Tiedje, J.M.; Cole, J.R. Naïve bayesian classifier for rapid assignment of rrna sequences into the new bacterial taxonomy. Appl. Environ. Microbiol. 2007, 73, 5261–5267. [Google Scholar] [CrossRef] [PubMed] [Green Version]
  33. Friedman, J.; Alm, E.J. Inferring correlation networks from genomic survey data. PLoS Comput. Biol. 2012, 8, e1002687. [Google Scholar] [CrossRef] [Green Version]
  34. Guimerà, R.; Nunes Amaral, L.A. Functional cartography of complex metabolic networks. Nature 2005, 433, 895–900. [Google Scholar] [CrossRef] [Green Version]
  35. Mougi, A.; Kondoh, M. Diversity of interaction types and ecological community stability. Science 2012, 337, 349–351. [Google Scholar] [CrossRef] [PubMed]
  36. Yuan, M.; Guo, X.; Wu, L.; Zhang, Y.; Xiao, N.; Ning, D.; Shi, Z.; Zhou, X.; Wu, L.; Yang, Y.; et al. Climate warming enhances microbial network complexity and stability. Nat. Clim. Chang. 2021, 11, 343–348. [Google Scholar] [CrossRef]
  37. Eiler, A.; Heinrich, F.; Bertilsson, S. Coherent dynamics and association networks among lake bacterioplankton taxa. ISME J. 2012, 6, 330–342. [Google Scholar] [CrossRef] [Green Version]
  38. Leibold, M.A.; Mcpeek, M.A. Coexistence of the niche and neutral perspectives in community ecology. Ecology 2006, 87, 1339–1410. [Google Scholar] [CrossRef]
  39. Zhang, H.; Tang, S. Review on the study of ecology-based forest harvesting. Sci. Silvae Sin. 2007, 43, 83–97. [Google Scholar] [CrossRef]
  40. Fortuna, M.A.; Stouffer, D.B.; Olesen, J.M.; Jordano, P.; Mouillot, D.; Krasnov, B.R.; Poulin, R.; Bascompte, J. Nestedness versus modularity in ecological networks: Two sides of the same coin? J. Anim. Ecol. 2010, 79, 811–817. [Google Scholar] [CrossRef]
  41. Valverde, S.; Vidiella, B.; Montañez, R.; Fraile, A.; Sacristán, S.; García-Arenal, F. Coexistence of nestedness and modularity in host-pathogen infection networks. Nat. Ecol. Evol. 2020, 4, 568–577. [Google Scholar] [CrossRef]
  42. Thébault, E.; Fontaine, C. Stability of ecological communities and the architecture of mutualistic and trophic networks. Science 2010, 329, 853–856. [Google Scholar] [CrossRef] [PubMed]
  43. Allesina, S.; Tang, S. Stability criteria for complex ecosystems. Nature 2012, 483, 205–208. [Google Scholar] [CrossRef] [PubMed] [Green Version]
  44. Staniczenko, P.P.; Kopp, J.C.; Allesina, S. The ghost of nestedness in ecological networks. Nat. Commun. 2013, 4, 1391. [Google Scholar] [CrossRef] [PubMed]
  45. Olesen, J.M.; Bascompte, J.; Dupont, Y.L.; Jordano, P. The modularity of pollination networks. Proc. Natl. Acad. Sci. USA 2007, 104, 19891–19896. [Google Scholar] [CrossRef] [Green Version]
  46. Banerjee, S.; Schlaeppi, K.; van der Heijden, M.G.A. Keystone taxa as drivers of microbiome structure and functioning. Nat. Rev. Microbiol. 2018, 16, 567–576. [Google Scholar] [CrossRef]
  47. Vandenkoornhuyse, P.; Quaiser, A.; Duhamel, M.; Le Van, A.; Dufresne, A. The importance of the microbiome of the plant holobiont. New Phytol. 2015, 206, 1196–1206. [Google Scholar] [CrossRef]
  48. Huang, R.; McGrath, S.P.; Hirsch, P.R.; Clark, I.M.; Storkey, J.; Wu, L.; Zhou, J.; Liang, Y. Plant-microbe networks in soil are weakened by century-long use of inorganic fertilizers. Microb. Biotechnol. 2019, 12, 1464–1475. [Google Scholar] [CrossRef] [Green Version]
  49. Cong, J.; Yang, Y.; Liu, X.; Lu, H.; Liu, X.; Zhou, J.; Li, D.; Yin, H.; Ding, J.; Zhang, Y. Analyses of soil microbial community compositions and functional genes reveal potential consequences of natural forest succession. Sci. Rep. 2015, 5, 10007. [Google Scholar] [CrossRef] [Green Version]
  50. Sheng, Y.; Cong, W.; Yang, L.; Liu, Q.; Zhang, Y. Forest soil fungal community elevational distribution pattern and their ecological assembly processes. Front. Microbiol. 2019, 10, 2226. [Google Scholar] [CrossRef]
  51. Qu, Z.; Liu, B.; Ma, Y.; Sun, H. Differences in bacterial community structure and potential functions among eucalyptus plantations with different ages and species of trees. Appl. Soil Ecol. 2020, 149, 103515. [Google Scholar] [CrossRef]
  52. Hannula, S.E.; Kielak, A.M.; Steinauer, K.; Huberty, M.; Jongen, R.; De Long, J.R.; Heinen, R.; Bezemer, T.M.; Peay, K.; Taylor, J.W. Time after time: Temporal variation in the effects of grass and forb species on soil bacterial and fungal communities. mBio 2019, 10, e02635-19. [Google Scholar] [CrossRef] [PubMed] [Green Version]
  53. Urbanová, M.; Šnajdr, J.; Baldrian, P. Composition of fungal and bacterial communities in forest litter and soil is largely determined by dominant trees. Soil Biol. Biochem. 2015, 84, 53–64. [Google Scholar] [CrossRef]
  54. Genre, A.; Lanfranco, L.; Perotto, S.; Bonfante, P. Unique and common traits in mycorrhizal symbioses. Nat. Rev.Microbiol. 2020, 18, 649–660. [Google Scholar] [CrossRef] [PubMed]
  55. Kennedy, P.G.; Izzo, A.D.; Bruns, T.D. There is high potential for the formation of common mycorrhizal networks between understorey and canopy trees in a mixed evergreen forest. J. Ecol. 2003, 91, 1071–1080. [Google Scholar] [CrossRef] [Green Version]
  56. Morris, M.H.; Smith, M.E.; Rizzo, D.M.; Rejmánek, M.; Bledsoe, C.S. Contrasting ectomycorrhizal fungal communities on the roots of co-occurring oaks (Quercus spp.) in a california woodland. New Phytol. 2008, 178, 167–176. [Google Scholar] [CrossRef] [PubMed]
  57. Bruns, T.D.; Bidartondo, M.I.; Taylor, D.L. Host specificity in ectomycorrhizal communities: What do the exceptions tell us? Integr. Comp. Biol. 2002, 42, 352–359. [Google Scholar] [CrossRef] [PubMed] [Green Version]
Figure 1. The plant–microbe module separation results. Different colors represent different modules and are represented by # numbers. The node size represents the node degree. SB: slash-and-burn. CC: clear cutting. SL: selective cutting. OG: old growth forests.
Forests 13 01167 g001aForests 13 01167 g001b
Figure 2. Modular roles of plant species and microorganisms based on Z-P value. (ad) and (eh) were Z-P plot of the plant–bacteria and plant–fungi networks of SB (slash-and-burn), CC (clear cutting), SL (selective cutting) and OG (old growth forests), respectively.
Forests 13 01167 g002
Figure 3. Bacteria genera associated with plants. The different colors indicate bacterial taxonomy at phylum level. (ad) represent SB (slash-and-burn), CC (clear cutting), SL (selective cutting) and OG (old growth forests) forest stands, respectively.
Forests 13 01167 g003
Figure 4. Fungi genera associated with plants. The different colors indicate fungal taxonomy at phylum level. (ad) represent SB (slash-and-burn), CC (clear cutting), SL (selective cutting) and OG (old growth forests) forest stands, respectively.
Forests 13 01167 g004
Table 1. Soil bacterial–fungal topological characteristics in the four forest stands.
Topological CharacteristicsSBCCSLOG
Empirical network
Threshold0.8900.8900.8900.890
Total nodes57139106769
Total links1122291187206
Positive interactions proportion93.75%69.43%51.14%56.80%
R2 of power-law0.4060.8840.9610.601
Average degree (avgK)3.9303.2952.2255.971
Average clustering coefficient0.0270.1890.0530.385
Average path distance 2.9236.0688.4242.246
Average geodesic distance2.3284.5356.7561.838
Modularity0.3900.7220.8970.526
Random network
Average clustering coefficient0.099 ± 0.0220.033 ± 0.0110.002 ± 0.0010.177 ± 0.022
Average path distance2.930 ± 0.0933.958 ± 0.1016.622 ± 0.1202.590 ± 0.057
Average geodesic distance2.477 ± 0.0613.408 ± 0.0625.914 ± 0.0872.251 ± 0.030
Modularity (fast greedy)0.381 ± 0.0140.536 ± 0.0090.794 ± 0.0050.295 ± 0.010
SB: slash-and-burn. CC: clear cutting. SL: selective cutting. OG: old growth forests.
Table 2. IDEN topological characteristics for plant–microbe ecological networks.
Topological CharacteristicsPlant–Bacteria NetworkPlant–Fungi Network
SBCCSLOGSBCCSLOG
No. plants991210991210
No. microbes5065026126084770129112
Total links106011211051122193178256240
Links per species2.0582.1941.6841.9761.6612.2531.8161.967
Linkage density69.79376.68054.23778.4777.38714.83115.08214.042
Connectance0.2320.2480.1430.2010.2200.2830.1650.214
Web asymmetry−0.965−0.965−0.962−0.968−0.679−0.772−0.830−0.836
Cluster coefficient0.1780.2050.1390.1740.2130.2570.1510.210
Nestedness44.83038.61438.06641.88844.83129.04835.35753.212
Weighted nestedness0.1890.2870.2160.2470.0020.3430.2220.086
Specialization asymmetry0.6660.6370.6530.6080.4350.4250.5190.637
Modularity0.4110.3680.4900.4200.4730.3280.4750.450
No. of modules43455564
SB: slash-and-burn. CC: clear cutting. SL: selective cutting. OG: old growth forests.
Publisher’s Note: MDPI stays neutral with regard to jurisdictional claims in published maps and institutional affiliations.

