Article

A National Map of Snag Hazard to Reduce Risk to Wildland Fire Responders

by
Karin L. Riley
1,*,
Christopher D. O’Connor
2,
Christopher J. Dunn
3,
Jessica R. Haas
4,
Richard D. Stratton
5 and
Benjamin Gannon
6
1
Fire Sciences Laboratory, Rocky Mountain Research Station, U.S. Forest Service, Missoula, MT 59808, USA
2
Forestry Sciences Laboratory, Rocky Mountain Research Station, U.S. Forest Service, Missoula, MT 59801, USA
3
College of Forestry, Oregon State University, Corvallis, OR 97333, USA
4
Business Operations Enterprise Program, U.S. Forest Service, Washington Office, Bozeman, MT 59717, USA
5
National Office, Fire and Aviation Management, U.S. Forest Service, Washington, DC 20250, USA
6
Department of Forest and Rangeland Stewardship, Colorado State University, Fort Collins, CO 80523, USA
*
Author to whom correspondence should be addressed.
Forests 2022, 13(8), 1160; https://doi.org/10.3390/f13081160
Submission received: 15 June 2022 / Revised: 12 July 2022 / Accepted: 19 July 2022 / Published: 22 July 2022
(This article belongs to the Special Issue Decision Support System Development of Wildland Fire)

Abstract

:
Falling trees and tree fragments are one of the top five causes of fatalities for wildland fire responders. In six out of ten recent years, at least one fatality from a tree strike has occurred while a fire responder was on duty, and others were injured. We used TreeMap, a national map of forest characteristics, including individual tree height, diameter, and status (live or dead), to generate a map of snag hazard for forested areas of the continental U.S. at 30 × 30 m resolution. Snag hazard was classified into categories of low, moderate, high, or extreme based on snag density and height. Within-class accuracy was as high at 86%, suggesting that the Snag Hazard map can help wildland fire managers identify and avoid exposing fire responders to hazardous conditions. Accuracy was higher outside recently disturbed areas (88%) than inside (79%), perhaps reflecting strong spatial patterns and heterogeneity of mortality within disturbed areas. The Snag Hazard map is a frequently requested product from the Forest Service’sRisk Management Assistance Group. The goal of RMA is to provide analytics to decision makers and fire leadership to facilitate risk-informed decision-making to improve safety, effectiveness, and outcomes. We present a case study showing how the Snag Hazard 2016 map was used to inform fire responders during an active wildfire incident in California during the 2020 fire season.

1. Introduction

Increased tree mortality from multiple disturbance agents in the western U.S. has increased the abundance of dead standing trees, or snags, in many forests [1]. Some of the major contributing causes include a rapidly changing climate and historical forest and fire management practices that have led to increasing fire extent across western U.S. forests [2,3]. Following fire, disease, and insect infestation, a pulse of snags persists for decades, often across broad landscapes [4]. These disruptive events lead to opportunities and challenges, as fires and insect infestation are natural ecosystem processes, and snags are an important habitat element for many wildlife species, but the outcomes of these disturbances can challenge forest and fire management objectives now and for decades into the future. For example, snags have the potential to injure or kill fire responders as they approach work sites and engage in suppression activities. In response to widespread tree mortality in some landscapes, wildfire managers are increasingly considering snag hazard at the strategic planning level to avoid placing firefighters in risky locations, which is a notable departure from the traditional reliance on field personnel to mitigate the risk with situational awareness and felling. Accurate, high-resolution mapping of snag hazard is key to incorporating responder safety concerns into wildland fire suppression strategies.
One of the most common hazards encountered by fire responders comes from hazardous trees, especially snags, which lead to serious injuries and death each year [5,6,7,8,9,10,11,12,13,14]. Snags, either through falling or fragmentation of their tops, pose a hazard to fire responders as they weaken and are exposed to wind, when they burn at the base, or during the process of felling them to mitigate the hazard. Eighteen wildland firefighter fatalities were attributed to hazardous trees between 1990 and 2014, the fifth most common cause [15]. Snags account for a higher proportion of firefighter deaths in areas of the country that are more heavily forested; for example, they are likely to cause more deaths in the Idaho Panhandle than the Angeles National Forest (Brett Rogers, U.S. Forest Service, Kamiah, ID, USA, personal communication, 17 December 2021). In FEMA’s annual Firefighter Fatality Reports, we identified 13 wildland firefighter fatalities from falling limbs or trees between 2009 and 2018, but in most cases not enough detail is provided to tell whether the trees were alive or dead at the time of the accident [5,6,7,8,9,10,11,12,13,14]. Consultation with Forest Service experts provided the information that 6–8 of these deaths were caused by snags (Table 1 and Table 2) and that snags likely account for approximately 50% of tree-related deaths in any given year (Brett Rogers, personal communication 17 December 2021).
Although snags are typically present throughout the forest environment, reducing exposure of firefighters to snags, especially in areas with high snag density, can reduce or prevent injuries and fatalities. Snags are a hazard not only during wildfire management operations, but also during other activities, such as timber harvest planning and recreation (Brett Rogers, U.S. Forest Service, personal communication, 17 December 2021).
To support safer decisions about where to place fire responders, we developed a national-scale map of snag hazard condition based on the density of snags and their height (i.e., reach) [4]. The Snag Hazard map is derived from the TreeMap 2016 [16], a national tree-level model of the forests of the conterminous U.S. The TreeMap uses machine learning to match a set of forest plot data from the Forest Service’s Forest Inventory and Analysis (FIA) program to a set of landscape maps of vegetation, disturbance, and biophysical characteristics from the LANDFIRE project at 30 × 30 m spatial resolution [17,18,19].
During the 2019 fire season, a prototype Snag Hazard map that leveraged outputs from TreeMap 2014 [17] was used by the Forest Service’s Risk Management Assistance (RMA) Program during active fire incidents to help apprise firefighters of the spatial distribution of snag hazard across the landscape. RMA provides strategic decision support to land managers and other decision makers engaged in wildfires, many of which are long-duration and complex to manage [20]. The team informs the decision space around wildfire response, with goals of protecting human life by minimizing fire responder exposure in a hazardous environment, mitigating risk to homes and infrastructure, and meeting objectives for land and resource management [21]. Fire managers reported that RMA processes and products helped them communicate the rationale for their decision-making to diverse stakeholders [22]. Based on feedback from this prototype, the TreeMap 2016 methodology was updated to improve the accuracy with which disturbed areas were mapped from 90.3% in TreeMap 2014 to 99.98% [18]. Here, we present a Snag Hazard map in raster (gridded) format at 30 × 30 m resolution. The map exhibits four hazard classes ranging from Low to Extreme, as well as a custom class that maps areas recently affected by fire or insects and disease. Users can also access a map of the number of dead trees per acre in the TreeMap 2016 repository [16].
In addition to describing the methods used to derive the dataset, we present a summary comparison of the 2014 and 2016 TreeMap Snag Hazard outputs demonstrating classification improvements, visualizations of the dataset, and a case study demonstrating how the Snag Hazard product is being used during active fire incidents.

2. Materials and Methods

The Snag Hazard map derives from the density and height of trees per pixel in the TreeMap 2016, a national map of forest stand characteristics of the conterminous U.S. for the year 2016 [16]. The TreeMap 2016 was based on two datasets: (1) a set of forest plot data from Forest Inventory and Analysis (FIA) and (2) gridded maps that provide location coordinates for each pixel, vegetation (forest cover, height, and group), topography (slope, aspect, and elevation), biophysical variables (maximum and minimum temperature, relative humidity, precipitation, vapor pressure deficit, and photosynthetically active radiation), and disturbance (years since disturbance and disturbance type) [16,18]. The TreeMap uses a random forests machine learning algorithm to assign the best-matching forest plot based on these variables to each pixel of the gridded landscape data to produce a seamless tree-level model of the forests of the continental U.S. Each pixel in the TreeMap has a corresponding list of trees measured on the plot that was assigned, including their height, species, diameter at breast height (DBH), and status (live or dead).
We assigned pixels into four categories of snag hazard following the classification system of [4] (Figure 1). The classification is based on the median height and density of snags greater than or equal to 20 cm DBH, with taller trees and higher densities corresponding to higher hazard. We calculated the median snag height and density for each pixel in the TreeMap 2016 to yield a hazard class for each of the 2,699,430,013 pixels. Classes include Low, Moderate, High, Extreme, and Previous Severely Disturbed Forest (1999–2016). The Guarded, Elevated, and Severe classes from Dunn et al. (2019) [4] were renamed “Low”, “Moderate”, and “High”, respectively, to better reflect hazard terminology used by the wildland fire community. The TreeMap does not include pixels where live tree cover was less than 10% in 2016, as these areas did not fit the project’s definition of forested. This filter excludes some areas that were severely disturbed in years prior to 2016. Because these areas likely have many snags, we added a class for disturbed areas not included in the TreeMap. The category “Previous Severely Disturbed Forest (1999–2016)” was created by identifying areas that LANDFIRE originally mapped as forested in the 2001 National Dataset that are no longer mapped as forested in LANDFIRE Remap 2016 [23]. We further screened these areas using LANDFIRE’s disturbance rasters to identify only areas that had burned or were affected by insects or disease between 1999 and 2016. The “Previous Severely Disturbed Forest (1999–2016)” class also includes pixels that fall into LANDFIRE Remap 2016′s “Recently burned—tree cover” existing vegetation type [23]; these pixels were not mapped by TreeMap, as they are lacking information on vegetation type, a required parameter for the random forests algorithm. Snag hazard in previously disturbed areas without forest stand characteristics should be field verified by local personnel. Because this map is current for the landscape only through 2016 and it was released in 2021, users may wish to update it to reflect recent fires since 2016 and include a “Recently Burned Forest (2017–current year)” class where there is potential for snags to be present due to the recent disturbance.
We validated the Snag Hazard map by comparing it to 2889 multi-condition FIA forest plots that were not used to build the decision trees used in the imputation. Plots were located across the continental U.S. and were measured during 2016, the same vintage as the gridded LANDFIRE data used to generate the Snag Hazard map. Each FIA forest plot consists of four circular subplots of radius 7.3 m, with three of the subplots arrayed around the center one at a distance of 36.3 m between subplot centers [24]; the footprint of each plot is approximately 44 m in radius. Thus, we buffered the centroid of each plot by 44 m and then compared the snag hazard class of each pixel within the plot radius to the classes in the Snag Hazard map. The Snag Hazard map was considered correct if any of the pixels within the plot radius (typically 4–9 pixels) had the same class. We also classified the median snag height into the five classes shown in Figure 1 (e.g., <5 m, 5 to <14 m, 14 m to <20 m, 2 to <30 m, ≥30 m) and did the same for snag density (e.g., <10/ha, 10 to <30/ha, 30 to <50/ha, 50 to <100 ha, ≥100/ha). We then repeated the analysis above, comparing the values of each pixel within the radius of a validation plot to these classified values for snag height and density.
We calculated the accuracy of the Snag Hazard map for disturbed versus undisturbed portions of the landscape, to see if the map performed better inside or outside disturbed areas. We tagged plots that appeared in the validation set as disturbed or undisturbed based on the disturbance codes in the FIA databases, specifically, if DSTRBCD1, DSTRBCD2, or DSTRBCD3 in the CONDITION table was coded with one of the values in Table 3, then the plot was considered disturbed [24]. Pixels in the TreeMap 2016 were tagged as disturbed if LANDFIRE had mapped them as affected by fire or insect and disease during the time period 1999–2016 [17,23]. We compared classification accuracy inside and outside disturbed areas in the TreeMap by calculating the percent of plots that had at least one correct hazard class assigned within their radius as above.
TreeMap 2016 includes methodological changes designed to improve the accuracy with which disturbed plots were matched to disturbed areas. We compared the Snag Hazard 2014 and 2016 datasets to determine whether these changes indeed translated to better classification accuracy in the Snag Hazard 2016 product. We compared the number of Snag Hazard pixels in each of the four hazard classes (excluding recently disturbed pixels that were not spatially coincident between TreeMap versions) for the continental western United States to identify any systematic differences in snag hazard classification. The geographic constraint of the western United States (defined as U.S. Forest Service Regions 1–6) was designed to focus analysis on the primary area of use for wildfire incident support. Additionally, we compared class counts within mapped disturbances (1999–2014) to determine differences in snag hazard distribution by spatial designation (disturbed, undisturbed), and by Snag Hazard version (2014, 2016).

3. Results

3.1. Validation

Applying the classification rubric in Figure 1 [4] to the tree data that accompany the TreeMap 2014 and 2016, we generated national maps of snag hazard at 30 × 30 m resolution for the conterminous U.S. The dataset may be accessed in and downloaded from the Forest Service Research Data Archive [16]. We show a subset of the 2016 map below for the Bitterroot Mountains of Montana (Figure 2). In addition, the median snag height and snag density classes are shown for the same area (Figure 3 and Figure 4). A view of the same area but with larger extent is shown as it appears in the Risk Management Assistance (RMA) dashboard, to illustrate how the map appears to users of the dashboard (Figure 5) [25]. In this area, snag hazard class is driven by variation in both snag height and density.
Results of the spatial validation process indicated that in 2497 out of 2889 cases (86.4%), the hazard class assigned to the plot matched that of at least one pixel within the plot footprint (Table 4). Of the 2889 plots, 442 were disturbed by insects, disease, or fire (15.2%). Of the disturbed plots, 79.2% had at least one pixel within the plot radius that matched the hazard class of the plot, as a measure of accuracy. Of the 2447 undisturbed plots, 2147 or 87.7% had the hazard class assigned to the plot present in at least one pixel within the plot radius. By this measure, the performance of the Snag Hazard product was moderate to high in both disturbed and non-disturbed areas, but it was approximately 8.6% more accurate in undisturbed areas. Disturbance severity would be expected to have a strong effect on hazard class, but disturbance severity is not a parameter in the random forests model that creates TreeMap. Accuracy within disturbed areas was moderate nonetheless.
When median snag height was classified into the five classes of Dunn et al. [4], the hazard class assigned to the validation plot matched at least one pixel within the plot radius in 2211 out of 2889 cases, translating into an accuracy of 76.5% (Table 4). Similarly, the median snag density class of the validation plot matched that of at least one pixel within plot radius in 2150 out of 2889 cases (74.4%). The snag hazard classification was more accurate than those for the two factors that comprise it (snag height or density) by approximately 10–12%. Based on these results, we conclude that the Snag Hazard product effectively maps the broad landscape patterns in snag conditions needed for strategic planning.
The west-wide assessment of snag hazard class counts between TreeMap 2014 and TreeMap 2016 leveraged more than eight hundred million pixel values classified by snag hazard rating. The general trends between TreeMap 2014 and TreeMap 2016 snag hazard classifications were an increase in area classified as “low” hazard (4%) and coincident decreases in “moderate” (2%), “high” (1%), and “extreme” classes (1%). Changes in the magnitude of higher-level hazard classes were small in the context of total modeled area but represent larger differences when calculated as a percentage of their 2014 value, for example, the moderate class decreased by 14% of its 2014 value (Table 5).
Snag hazard classification differences were clearer within known disturbed areas. Approximately 71 million spatially coincident pixels were classified as disturbed in both products. The trend in snag hazard classifications from TreeMap 2014 to TreeMap 2016 in disturbed areas were the opposite of that observed west-wide. The number of pixels classified as “low” hazard decreased (15%), coincident with increases in “moderate” (2%), “high” (3%), and “extreme” classes (10%). Using the same methodology above to compare 2016 Snag Hazard class counts to their counterparts in 2014, the reduction in “low” hazard and increases to all higher snag hazard classes become more pronounced (Table 5).
The distribution of snag hazard classes from TreeMap 2014 in disturbed areas (1999–2014) was indistinguishable from the west-wide distribution of classes. Conversely, in the 2016 TreeMap product, the snag hazard class distributions in disturbed areas demonstrated large reduction (19%) in the “low” hazard class, modest increases in “moderate” (4%) and “high” (3%) classes, and a large (12%) increase in “extreme” snag hazard. The proportion of disturbed pixels in the TreeMap 2014 that had a disturbed plot assigned to them was approximately 0.19, meaning that the majority of disturbed pixels had an undisturbed plot assigned to them [17]. In the TreeMap 2016, the proportion of disturbed pixels with a disturbed plot assigned increased to 0.996 due to the inclusion of disturbance as a response variable in the random forests model [18]. The increase in accuracy had the expected effect of moving disturbed pixels in the “low” snag hazard class in the 2014 version to the “moderate”, “high”, and especially “extreme” classes in the 2016 version.
Taken together, these changes indicate that by increasing the accuracy with which disturbed plots were matched to disturbed areas, plots with higher levels of mortality were matched to disturbed areas, increasing the prevalence of the “moderate”, “high”, and “extreme” classes within disturbed areas; increasing the accuracy with which undisturbed plots were matched to undisturbed areas increased the prevalence of the “low” category in these areas. The Snag Hazard 2016 dataset is therefore expected to reflect the higher tree mortality and higher snag hazard levels within disturbed areas more accurately than the 2014 version.

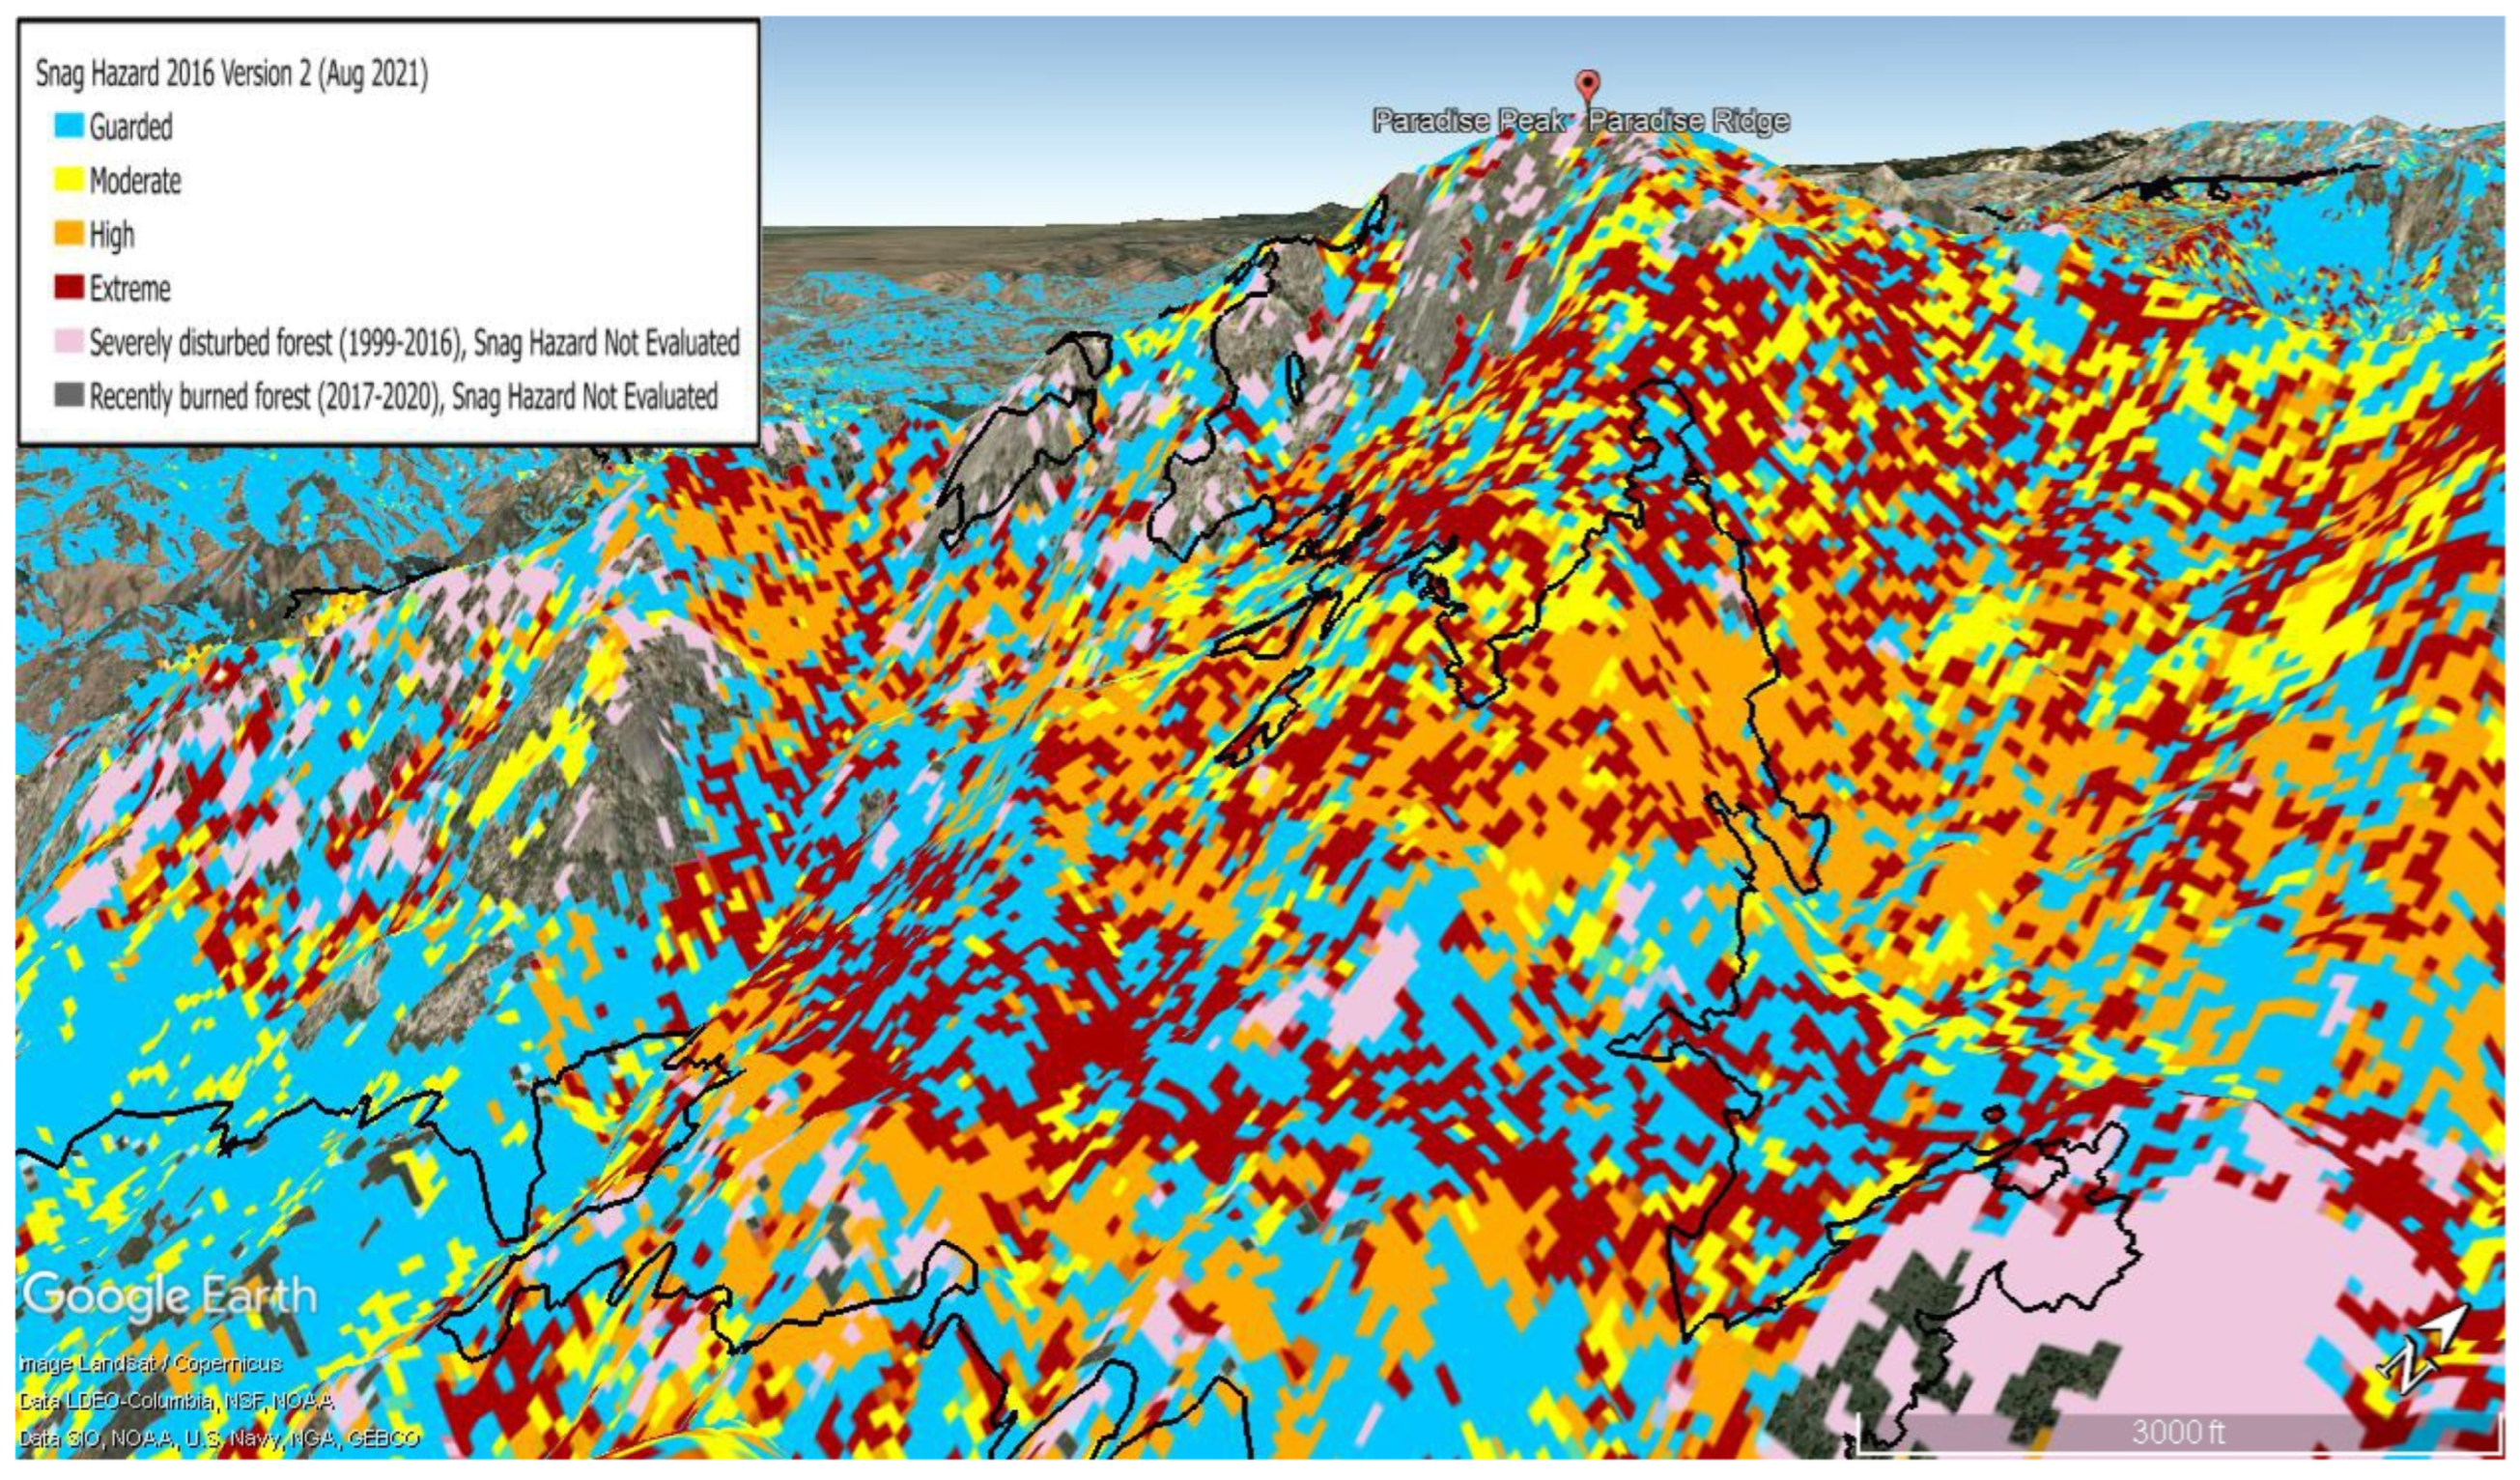
3.2. Application of the Snag Hazard Map

The Snag Hazard 2016 map was used to assist fire managers with strategic decision-making regarding firefighter safety during the 2021 fire season. Areas that had experienced fires since 2016 were updated with another class showing the burned areas, as in Figure 5 above, to apprise firefighters that these areas may have additional tree mortality not captured in the Snag Hazard 2016 map.
A case study demonstrates how the product was used on a selected incident. On 9 September 2021, lightning started three fires in the Sequoia and Kings Canyon National Parks. The Cabin fire was quickly contained, but the Colony and Paradise fires presented serious challenges to firefighting efforts due to heavy fuels, rugged terrain, and inaccessibility. The fires grew considerably the following week, merging on 17 September at approximately 18,000 acres. Multiple highly valued resources and assets were at risk, including National Park infrastructure, communication sites, private property and communities, cultural resources, and several giant sequoia (Sequoiadendron giganteum) groves.
The fire presented several hazards to fire responders, including rapid fire growth and high intensities with prolific spotting, steep slopes, and many trees that were dead prior to the fire’s arrival (Figure 6). Snags were of particular concern to firefighters and National Park Service staff, as two local firefighters had lost their lives due to snags.
An area of heightened concern for snags was the Paradise Peak vicinity (Figure 6), where recent insect and disease impacts and drought resulted in numerous dead trees. Among other products, the Snag Hazard map was made available by RMA analysts in PDF format as well as GIS layers to National Park employees and incident management teams (as a 3D GE jpeg). These data were used in briefings to incident management teams and fire responders to spatially depict the threat of snags to safety (Figure 7). The Snag Hazard map was used by line officers and fire managers for incident documentation, public outreach, and to inform strategic planning and operations.

4. Discussion

The Snag Hazard map uses methodology distinct from other datasets that track tree mortality. For example, the Aerial Detection Survey (ADS) of the Forest Service and state partners utilizes expert opinion from an analyst in an airplane to annually estimate the number of trees and tree mortality [26]. Accuracy of snag counts in ADS was found to be 3–44% in two recent studies [26,27]. Maps of area affected by recent mortality can be obtained from the Ecosystem Disturbance and Recovery Tracker system (eDaRT), although this program does not provide estimates of the number or density of dead trees [28]. The eDaRT system uses satellite-based measurements from LANDSAT to demarcate disturbed areas based on changes in reflectance. The area affected by mortality differed sharply between eDaRT and ADS surveys in a recent study in California [27]. Both eDaRT and LANDFIRE (upon which TreeMap and Snag Hazard are based) use LANDSAT imagery, although LANDFIRE produces maps of estimated live tree cover rather than flagging disturbances [23,29]. Although the Snag Hazard map has not been systematically compared to ADS or eDaRT, the method of validation using field plots is similar across the studies noted above and the methodology presented here.
To our knowledge, global maps of tree mortality patterns are not yet in existence, although a group of researchers recently made a call for such a dataset [30]. The rough framework proposed by these researchers would incorporate in situ measurements with remotely sensed data to produce complete coverage. The framework proposed is similar to that used by the Snag Hazard map, with in situ measurements at a sparse network of FIA forest plots and remotely sensed data from the Landsat satellite processed by LANDFIRE used to generate maps of characteristics such as forest cover.
The Snag Hazard 2016 map provides firefighters and other forest users with a spatial snag hazard classification at 30 × 30 m resolution across the continental U.S. High within-class accuracy (86%) suggests that the map can provide valuable spatial information on snag distribution across the landscape. Inclusion of disturbance as a response variable in the random forest algorithm used to create TreeMap 2016 increased the accuracy with which disturbed and undisturbed forest plots were mapped to disturbed and undisturbed areas, respectively [17,18], from 90.3% in the TreeMap 2014 to 99.98% in the TreeMap 2016. This increase in accuracy occurred both inside and outside disturbed areas; although the percent increase in accuracy within disturbed areas was much greater, the much higher number of pixels in undisturbed areas (approximately 2.6 billion versus 142 million in undisturbed areas) meant that a relatively small increase (~5%) in accuracy translated to a large number of pixels [17]. Due to this increase in accuracy, pixels within disturbed areas in the Snag Hazard 2016 were classified as “moderate”, “high”, or “extreme” at higher rates than in the Snag Hazard 2014 map, likely capturing the true hazard within disturbed areas more accurately. However, using a subset of forest plot locations as a check, the accuracy of mapping disturbed areas in the TreeMap appears to have declined slightly by about 3% on the ground, to 87.4%, likely due to additional areas being affected by insect and disease infestation, and these areas not being mapped in the LANDFIRE disturbance rasters upon which the TreeMap is built [18]. In future versions of the TreeMap, we hope to include new techniques for mapping insect and disease affected areas to increase our accuracy in capturing these disturbance types. The Landscape Change Monitoring System (LCMS) has promise for this endeavor, as it includes an ensemble of forest disturbance maps to identify areas of recent change [31].
Accuracy both inside (79%) and outside (88%) disturbed areas was moderate to high, but it was higher outside disturbed areas. Accuracy within disturbed areas was likely affected by the fact that disturbance severity is not included as a variable in the random forests model that selects which forest plot represents each pixel [18]. Accuracy inside disturbed areas was moderate to high nonetheless, which suggests that the variables included in the random forests model are predictive of percent tree mortality. These include the percent live cover after the disturbance, the forest height, and the forest type, as well as a flag for recent disturbance [17,18,19]. Salvage logging activities likely would not be accounted for in the current implementation of this dataset, as tree mortality estimates proceed from the variables listed above rather than post-disturbance management.
The TreeMap and Snag Hazard datasets use LANDFIRE maps as inputs, meaning that TreeMap and Snag Hazard maps are compatible with fire modeling outputs from software such as FlamMap, FARSITE, and FSim. LANDFIRE places some severely disturbed pixels into an Existing Vegetation Type (EVT) category called recently disturbed forest. TreeMap and therefore Snag Hazard did not map pixels in the recently disturbed forest EVT due to the lack of information on forest type in these pixels, a required variable. Feedback from users of the Snag Hazard map indicates that inclusion of these recently disturbed pixels is important, as these areas are likely to include high snag hazard. We plan to map these areas in future versions of the Snag Hazard and TreeMap datasets by drawing the forest type from previous LANDFIRE versions. In the interim, we have added two classes to the Snag Hazard 2016 map to inform users of areas of recent disturbance where ground truthing is recommended.
This manuscript appears in a special issue of Forests related to decision support, so we have focused on the applications of the Snag Hazard dataset to that end. However, it is important to note that tree mortality also has important temporal dimensions related to climate change, which may cause increasing tree mortality (1) through increased drought and vapor pressure deficit [32], (2) by creating conditions more conducive to some mortality-causing insects [33,34], and (3) via increases in area burned under hotter and drier conditions [2,35]. Increasing tree mortality can cause conversion of carbon from live to dead pools, where additional carbon will be released over time due to decomposition, creating a positive feedback with climate change by contributing to greenhouse gas emissions [36]. Quantifying such trends and feedback is critical to understanding terrestrial carbon contributions to climate change as well as impacts to forest habitats and water resources. We hope to incorporate temporal trends as we release future editions of the Snag Hazard map by tracking disturbances via LANDFIRE disturbance maps, the LCMS, or a similar system. Updates to the Snag Hazard map require new national vegetation maps from LANDFIRE, as well as an updated TreeMap; the 2016 Snag Hazard map is the most current as of this writing, as TreeMap 2016 is the most recent vintage available. However, during the 2022 fire season, the 2016 Snag Hazard map is expected to be updated to model tree mortality within recently burned areas via a new algorithm. As tree mortality levels are expected to change more quickly in recently burned areas than undisturbed areas, this update will help to keep the Snag Hazard map current.

5. Conclusions

The Snag Hazard map gives a hazard rating (low, moderate, high, or extreme) to forested areas of the continental U.S. at 30 × 30 m resolution for landscape conditions circa 2016. Within-class accuracy was as high at 86%, suggesting that the Snag Hazard map can help inform decision making during active wildfire incidents where reduction of firefighter exposure is desired. Updated versions of the Snag Hazard map are being produced to keep pace with landscape conditions.

Author Contributions

K.L.R. and J.R.H. wrote and ran code to perform the classification of TreeMap pixels into Snag Hazard rating. K.L.R. performed the spatial validation. C.D.O. performed spatial summaries of Snag Hazard 2014 and 2016 by disturbed and undisturbed classes. K.L.R. took the lead on writing the manuscript with contributions from C.D.O., C.J.D., J.R.H., R.D.S. and B.G. All authors have read and agreed to the published version of the manuscript.

Funding

This research received no external funding.

Data Availability Statement

As noted in the text, the TreeMap 2016 and Snag Hazard 2016 datasets can be found at [16]. The Snag Hazard 2016 dataset can be viewed at [25]. Code used to generate and validate the Snag Hazard map can be found in K.L.R.’s USDA github repository at https://github.com/karinriley/TreeMap_SnagHazard2016 and https://github.com/USDAForestService/TreeMap2014_scripts.

Acknowledgments

We thank Brett Rogers of the USDA Forest Service for reviewing reports of firefighter mortality and providing details on incident name and tree status. We thank Leif Mathiesen and John Zeigler of the National Park Service for providing details used in the case study. This research was supported by the USDA Forest Service Fire Sciences Lab.

Conflicts of Interest

The authors declare no conflict of interest. The funders had no role in the design of the study; in the collection, analyses, or interpretation of data; in the writing of the manuscript, or in the decision to publish the results.

References

  1. van Mantgem, P.J.; Stephenson, N.L.; Byrne, J.C.; Daniels, L.D.; Franklin, J.F.; Fulé, P.Z.; Harmon, M.E.; Larson, A.J.; Smith, J.M.; Taylor, A.H.; et al. Widespread Increase of Tree Mortality Rates in the Western United States. Science 2009, 323, 521–524. [Google Scholar] [CrossRef] [PubMed] [Green Version]
  2. Abatzoglou, J.T.; Williams, A.P. Impact of anthropogenic climate change on wildfire across western US forests. Proc. Natl. Acad. Sci. USA 2016, 113, 11770–11775. [Google Scholar] [CrossRef] [PubMed] [Green Version]
  3. Naficy, C.; Sala, A.; Keeling, E.G.; Graham, J.; DeLuca, T.H. Interactive effects of historical logging and fire exclusion on ponderosa pine forest structure in the northern Rockies. Ecol. Appl. 2010, 20, 1851–1864. [Google Scholar] [CrossRef] [PubMed]
  4. Dunn, C.J.; O’Connor, C.D.; Reilly, M.J.; Calkin, D.E.; Thompson, M.P. Spatial and temporal assessment of responder exposure to snag hazards in post-fire environments. For. Ecol. Manag. 2019, 441, 202–214. [Google Scholar] [CrossRef]
  5. F.E.M.A. U.S. Fire Administration, Firefighter Fatalities in the United States in 2009. 2010. Available online: https://www.usfa.fema.gov/downloads/pdf/publications/ff_fat09.pdf (accessed on 2 December 2021).
  6. F.E.M.A. U.S. Fire Administration, Firefighter Fatalities in the United States in 2010. 2011. Available online: https://www.usfa.fema.gov/downloads/pdf/publications/ff_fat10.pdf (accessed on 2 December 2021).
  7. F.E.M.A. U.S. Fire Administration, Firefighter Fatalities in the United States in 2011. 2012. Available online: https://www.usfa.fema.gov/downloads/pdf/publications/ff_fat11.pdf (accessed on 2 December 2021).
  8. F.E.M.A. U.S. Fire Administration, Firefighter Fatalities in the United States in 2012. 2013. Available online: https://www.usfa.fema.gov/downloads/pdf/publications/ff_fat12.pdf (accessed on 2 December 2021).
  9. F.E.M.A. U.S. Fire Administration, Firefighter Fatalities in the United States in 2013. 2014. Available online: https://www.usfa.fema.gov/downloads/pdf/publications/ff_fat13.pdf (accessed on 2 December 2021).
  10. F.E.M.A. U.S. Fire Administration, Firefighter Fatalities in the United States in 2014. 2015. Available online: https://www.usfa.fema.gov/downloads/pdf/publications/ff_fat14.pdf (accessed on 2 December 2021).
  11. F.E.M.A. U.S. Fire Administration, Firefighter Fatalities in the United States in 2015. 2016. Available online: https://www.usfa.fema.gov/downloads/pdf/publications/ff_fat15.pdf (accessed on 2 December 2021).
  12. F.E.M.A. U.S. Fire Administration, Firefighter Fatalities in the United States in 2016. 2017. Available online: https://www.usfa.fema.gov/downloads/pdf/publications/ff_fat16.pdf (accessed on 2 December 2021).
  13. F.E.M.A. U.S. Fire Administration, Firefighter Fatalities in the United States in 2017. 2018. Available online: https://www.usfa.fema.gov/downloads/pdf/publications/ff_fat17.pdf (accessed on 2 December 2021).
  14. F.E.M.A. U.S. Fire Administration, Firefighter Fatalities in the United States in 2018. 2019. Available online: https://www.usfa.fema.gov/downloads/pdf/publications/ff_fat18.pdf (accessed on 2 December 2021).
  15. Gabbert, B. Entrapments is the Fourth Leading Cause of Wildland Firefighter Fatalities. Wildfire Today. 2016. Available online: https://wildfiretoday.com/2016/01/19/entrapments-is-the-fourth-leading-cause-of-wildland-firefighter-fatalities/ (accessed on 29 April 2022).
  16. Riley, K.L.; Grenfell, I.C.; Finney, M.A.; Shaw, J.D. TreeMap 2016: A tree-Level Model of the Forests of the Conterminous United States Circa 2016; U.S. Department of Agriculture: Fort Collins, CO, USA, 2021. [Google Scholar] [CrossRef]
  17. Riley, K.L.; Grenfell, I.C.; Finney, M.A.; Wiener, J.M. TreeMap, a tree-level model of conterminous US forests circa 2014 produced by imputation of FIA plot data. Sci. Data 2021, 8, 1–14. [Google Scholar] [CrossRef] [PubMed]
  18. Riley, K.L.; Grenfell, I.C.; Shaw, J.D.; Finney, M.A. TreeMap 2016 dataset generates CONUS-wide maps of forest characteristics including live basal area, aboveground carbon, and number of trees per acre. J. For. 2022, in press.
  19. Riley, K.L.; Grenfell, I.C.; Finney, M.A. Mapping forest vegetation for the western United States using modified random forests imputation of FIA forest plots. Ecosphere 2016, 7, e01472. [Google Scholar] [CrossRef]
  20. Calkin, D.E.; O’Connor, C.D.; Thompson, M.P.; Stratton, R.D. Strategic Wildfire Response Decision Support and the Risk Management Assistance Program. Forests 2021, 12, 1407. [Google Scholar] [CrossRef]
  21. Risk Management Assistance. Available online: https://wfmrda.nwcg.gov/rma (accessed on 29 April 2022).
  22. Schultz, C.A.; Miller, L.F.; Greiner, S.M.; Kooistra, C. A Qualitative Study on the US Forest Service’s Risk Management Assistance Efforts to Improve Wildfire Decision-Making. Forests 2021, 12, 344. [Google Scholar] [CrossRef]
  23. LANDFIRE Data Versions. Available online: https://www.landfire.gov/version_comparison.php (accessed on 2 December 2021).
  24. Burrill, E.A.; Wilson, A.M.; Turner, J.A.; Pugh, S.A.; Menlove, J.; Christiansen, G.; Conkling, B.L.; David, W. The Forest Inventory and Analysis Database: Database Description and User Guide Version 8.0 for Phase 2; U.S. Department of Agriculture, Forest Service: Washington, DC, USA, 2018; Available online: http://www.fia.fs.fed.us/library/database-documentation/ (accessed on 2 December 2021).
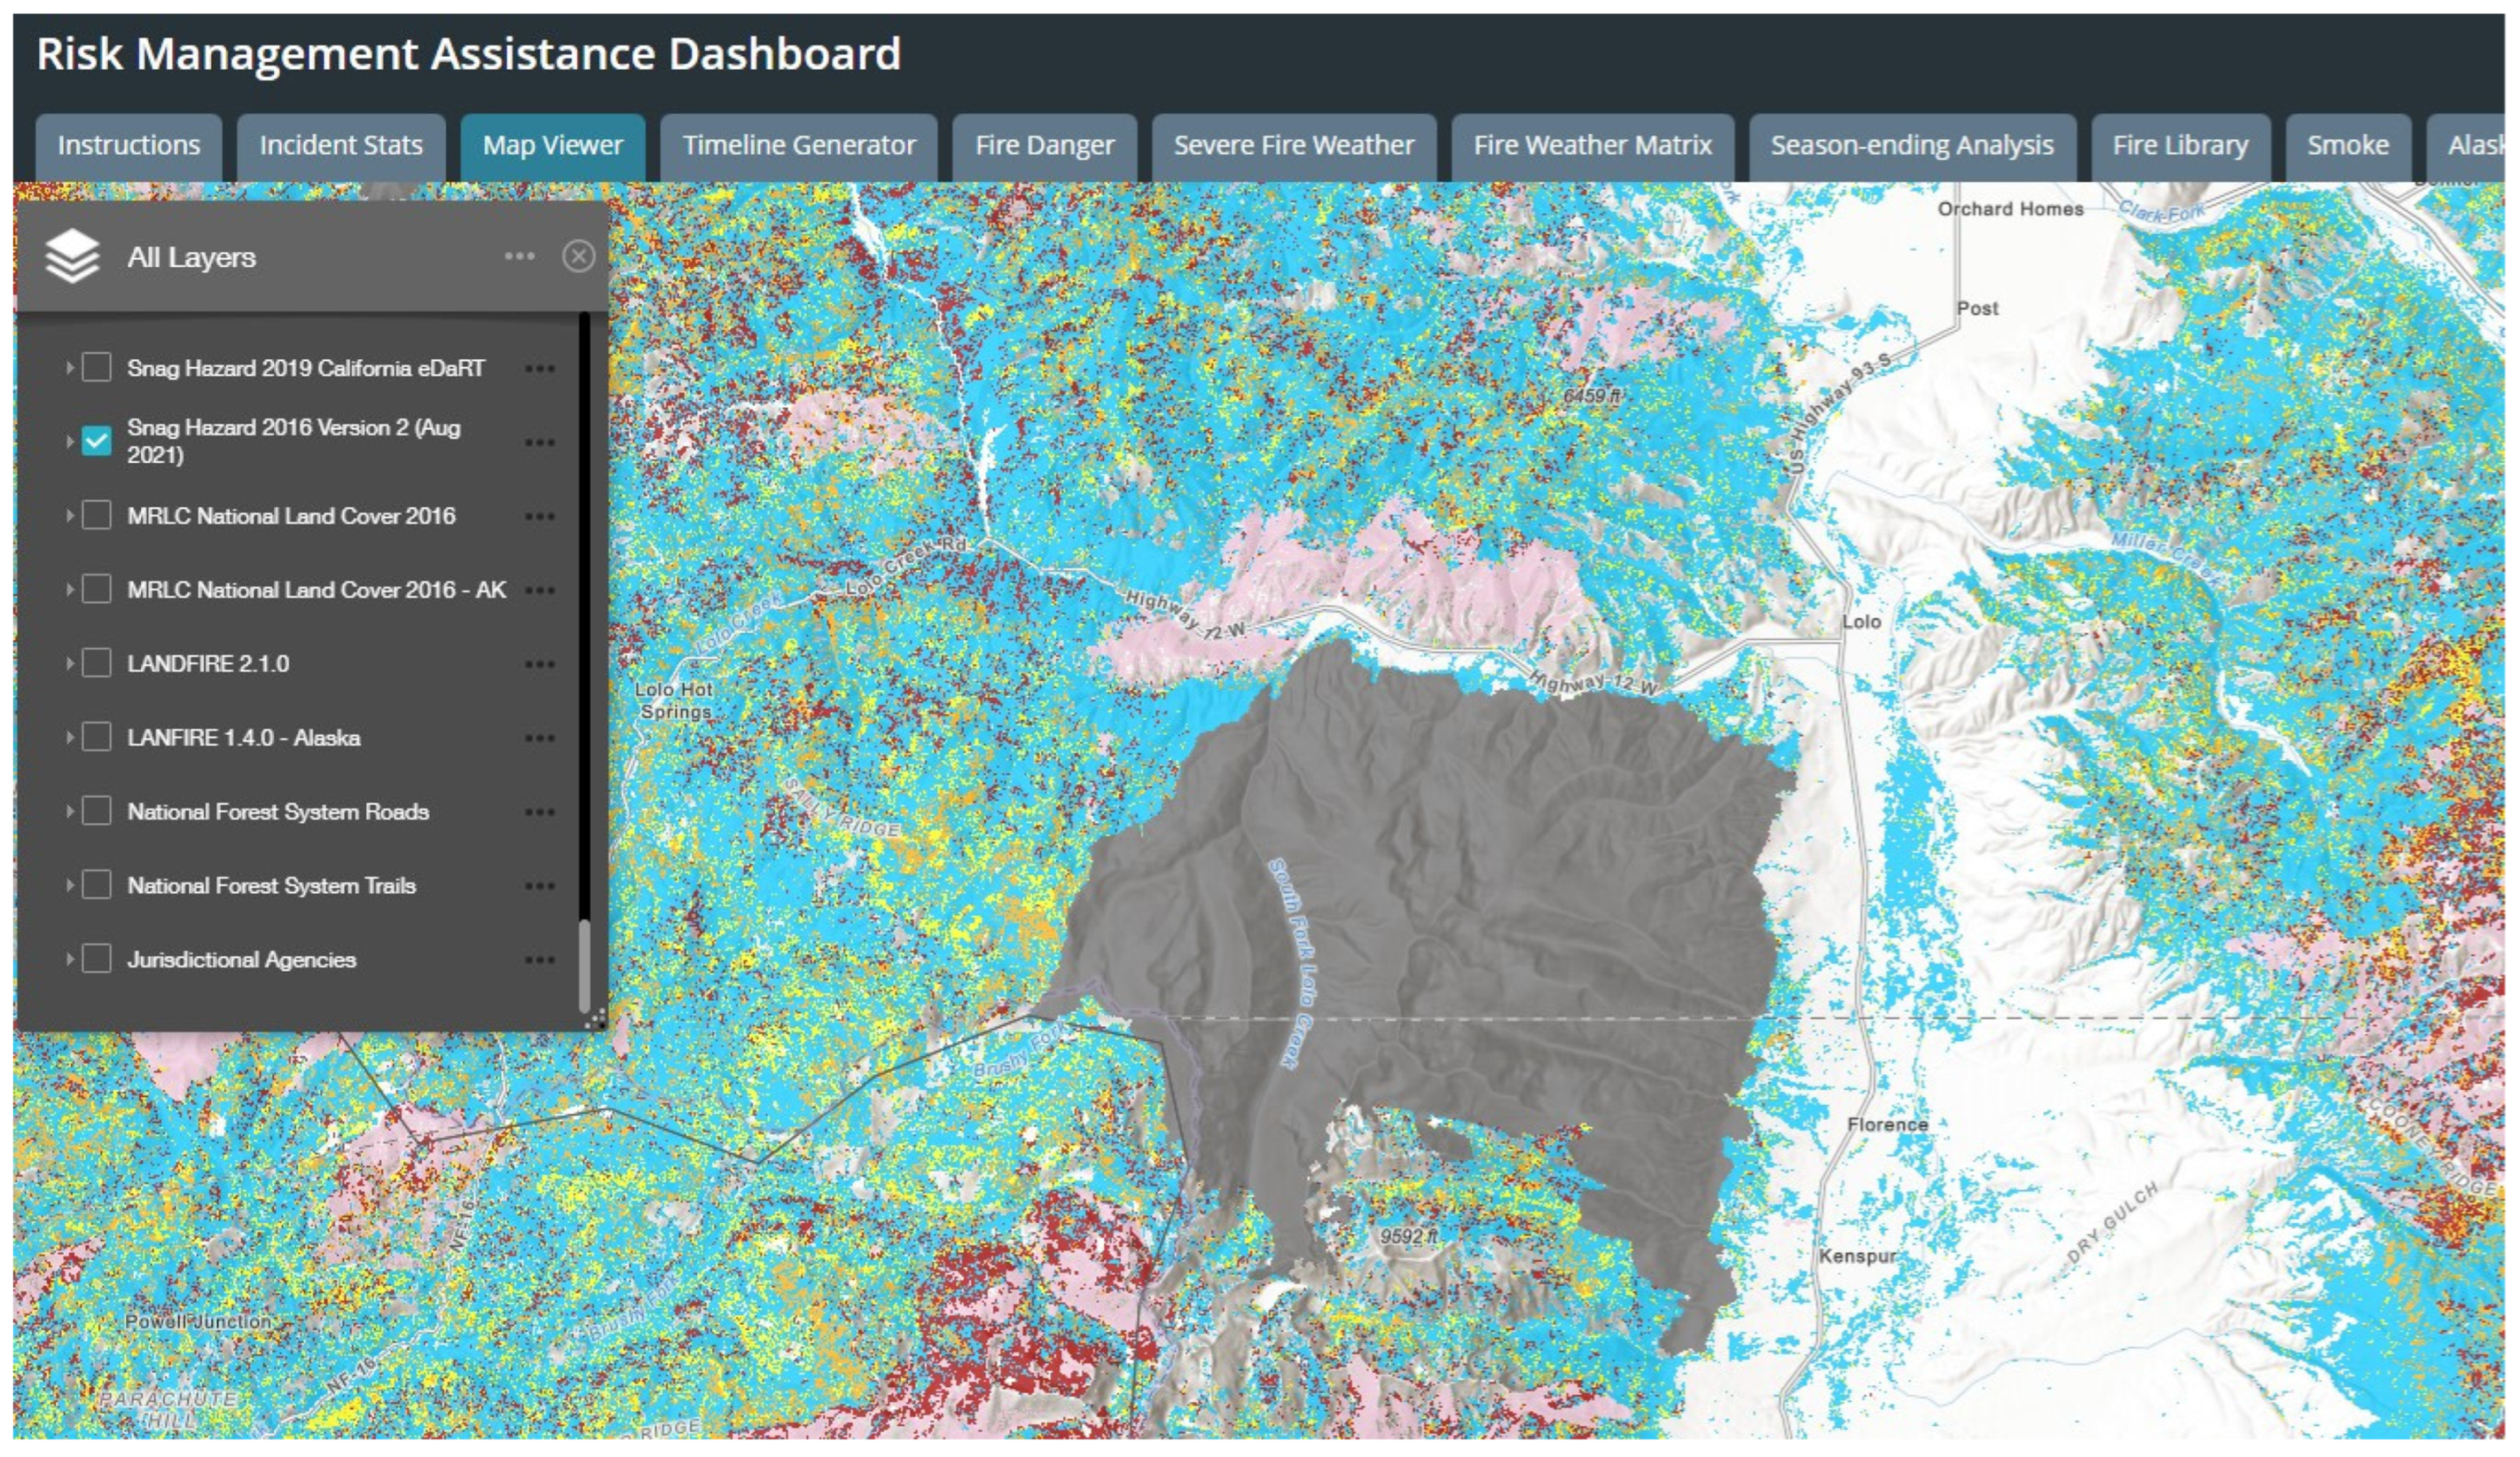
  25. Risk Management Assistance Risk Management Assistance Dashboard. Available online: https://nifc.maps.arcgis.com/apps/MapSeries/index.html?appid=c5bc811ee22e4da0bde8abec7c20b8b4. (accessed on 1 April 2022).
  26. Coleman, T.W.; Graves, A.D.; Heath, Z.; Flowers, R.W.; Hanavan, R.P.; Cluck, D.R.; Ryerson, D. Accuracy of aerial detection surveys for mapping insect and disease disturbances in the United States. For. Ecol. Manag. 2018, 430, 321–336. [Google Scholar] [CrossRef]
  27. Slaton, M.R.; Warren, K.; Koltunov, A.; Smith, S. Chapter 12—Accuracy assessment of Insect and Disease Survey and eDaRT for monitoring forest health. In Forest Health Monitoring: National Status, Trends, and Analysis 2020; Gen. Tech. Rep. SRS-261; U.S. Department of Agriculture Forest Service, Southern Research Station: Asheville, NC, USA, 2021; pp. 187–195. [Google Scholar]
  28. Koltunov, A.; Ramirez, C.M.; Ustin, S.L.; Slaton, M.; Haunreiter, E. eDaRT: The Ecosystem Disturbance and Recovery Tracker system for monitoring landscape disturbances and their cumulative effects. Remote Sens. Environ. 2020, 238, 111482. [Google Scholar] [CrossRef]
  29. Rollins, M.G. LANDFIRE: A nationally consistent vegetation, wildland fire, and fuel assessment. Int. J. Wildland Fire 2009, 18, 235–249. [Google Scholar] [CrossRef] [Green Version]
  30. Hartmann, H.; Schuldt, B.; Sanders, T.G.M.; Macinnis-Ng, C.; Boehmer, H.J.; Allen, C.D.; Bolte, A.; Crowther, T.W.; Hansen, M.C.; Medlyn, B.E.; et al. Monitoring global tree mortality patterns and trends. Report from the VW symposium ‘Crossing scales and disciplines to identify global trends of tree mortality as indicators of forest health. New Phytol. 2018, 217, 984–987. [Google Scholar] [CrossRef] [PubMed] [Green Version]
  31. Healey, S.P.; Cohen, W.B.; Zhiqiang, Y.; Brewer, K.; Brooks, E.; Gorelick, N.; Gregory, M.; Hernandez, A.; Huang, C.; Hughes, J.; et al. Next-generation forest change mapping across the United States: The landscape change monitoring system (LCMS). In Proceedings of the Pushing Boundaries: New Directions in Inventory Techniques and Applications: Forest Inventory and Analysis (FIA) Symposium 2015, Portland, OR, USA, 8–10 December 2015; Stanton, S.M., Christensen, G.A., Eds.; General Technical Report PNW-GTR-931; U.S. Department of Agriculture, Forest Service, Pacific Northwest Research Station: Portland, Oregon, 2016. [Google Scholar]
  32. Hartmann, H.; Moura, C.F.; Anderegg, W.R.L.; Ruehr, N.K.; Salmon, Y.; Allen, C.D.; Arndt, S.K.; Breshears, D.D.; Davi, H.; Galbraith, D.; et al. Research frontiers for improving our understanding of drought-induced tree and forest mortality. New Phytol. 2018, 218, 15–28. [Google Scholar] [CrossRef] [PubMed] [Green Version]
  33. Carroll, A.L.; Taylor, S.W.; Régnière, J.; Safranyik, L. Impacts of climate change on range expansion by the mountain pine beetle. In The Bark Beetles, Fuels, and Fire Bibliography; Paper 195; Canadian Forest Service: Victoria, BC, Canada, 2003. [Google Scholar]
  34. Bentz, B.J.; Régnière, J.; Fettig, C.J.; Hansen, E.M.; Hayes, J.L.; Hicke, J.A.; Kelsey, R.G.; Negrón, J.F.; Seybold, S.J. Climate Change and Bark Beetles of the Western United States and Canada: Direct and Indirect Effects. BioScience 2010, 60, 602–613. [Google Scholar] [CrossRef]
  35. Riley, K.L.; Loehman, R.A. Mid-21st-century climate changes increase predicted fire occurrence and fire season length, Northern Rocky Mountains, United States. Ecosphere 2016, 7, e01543. [Google Scholar] [CrossRef]
  36. Loehman, R.A.; Reinhardt, E.; Riley, K.L. Wildland fire emissions, carbon, and climate: Seeing the forest and the trees—A cross-scale assessment of wildfire and carbon dynamics in fire-prone, forested ecosystems. For. Ecol. Manag. 2014, 317, 9–19. [Google Scholar] [CrossRef]
Figure 1. Snag hazard was based on snag density and median snag height.
Forests 13 01160 g001
Figure 2. Snag hazard rating class for a subset of the Bitterroot Mountains of Montana.
Forests 13 01160 g002
Figure 3. Median snag height for a subset of the Bitterroot Mountains of Montana.
Forests 13 01160 g003
Figure 4. Number of snags per hectare for a subset of the Bitterroot Mountains of Montana.
Forests 13 01160 g004
Figure 5. A view of the same area but with larger spatial extent as the product appears in the Risk Management Assistance dashboard [25] at the time of the writing of this manuscript. The grey area shows a fire that burned after 2016 in order to update users to recent events. In the future, the RMA dashboard may be updated with newer versions of the Snag Hazard map.
Forests 13 01160 g005
Figure 6. Photograph of the Paradise Peak vicinity looking west-northwest. Brown conifers signify pockets of high tree mortality on the east-southeast aspect. Paradise Peak is in the top right.
Forests 13 01160 g006
Figure 7. The Snag Hazard map was draped over topographic imagery in Google Earth to provide a 3D representation, looking northwest at the southeast aspect of Paradise Ridge. Areas in red and orange indicate high to extreme snag hazard. The final fire perimeter is shown in black.
Forests 13 01160 g007
Table 1. Annual number of fire responder deaths and number attributed to falling snags or pieces of snags, 2009–2018, drawn from FEMA annual Firefighter Fatality Reports [5,6,7,8,9,10,11,12,13,14] and personal communication with Brett Rogers, U.S. Forest Service, 17 December 2021. Of 142 deaths, 6–8 were from snags (4–6%). In one year, snags accounted for as much as 20–30% of deaths.
YearTotal Number of Fire
Responder Deaths
Deaths from Snags
2009161
2010111
2011100
2012160
2013310 or 1 (tree status unknown in one case)
2014110
2015120
2016151
2017102 or 3 (tree status unknown in one case)
2018101
Table 2. Fire responder fatalities in the U.S. from falling snags between 2009 and 2018. Descriptions are from annual FEMA Firefighter Fatality Reports [5,6,7,8,9,10,11,12,13,14]. Tree status and incident name provided by the Forest Service (Brett Rogers, personal communication, 17 December 2021).
YearIncident NameDescription
2009Freeman Reservoir, COOne firefighter was struck and killed by a tree while working a hazard tree abatement project.
2010Scott’s Chapel Road Fire, KYOne firefighter was clearing a fire break for containment at the base of a bluff when a burning snag broke loose on top and rolled downhill over a small bluff, striking him from behind. The firefighter sustained a serious head injury, fractured hip, bruises, and second-degree burns on his calves. The impact left him unconscious and with serious injuries, including the burns from which he did not recover.
2013Electrocution, WA. Unknown whether tree was green or snag.One inmate firefighter was struck and killed by a falling tree while working as a member of a Washington Department of Natural Resources firefighting crew.
2016Strawberry Fire, NVOne firefighter was engaged in tree felling operations on a wildland fire. He was struck by a falling tree as he worked. Firefighters provided treatment, and he was extracted from the scene by helicopter. Upon his arrival at a helibase, he was assessed by paramedics and pronounced deceased.
2017Location unknown. Unknown whether tree was green or snag.One firefighter was leading a crew to clear brush to contain a fire when a 120-foot tree uprooted and fell on him. The firefighter suffered major head, neck, and back injuries. The remote location of the incident posed challenges for medical responders and before aeromedical crews could get to him, the firefighter passed away.
2017Florence Fire, MT (later consumed by Rice Ridge Fire)While part of a 20-person crew that was staging an initial attack on a forest fire in Montana, one firefighter was struck by a falling tree. He was flown to a hospital for treatment, but he passed away from the injuries he sustained when struck by the tree.
2017Lolo Peak Fire, MTOne firefighter was struck and killed by a falling tree while working on the Lolo Peak Fire in western Montana. The firefighter was given CPR and other emergency medical aid by fellow firefighters before being airlifted to a hospital. Despite all efforts, the firefighter passed away as a result of his injuries.
2018Ferguson Fire, CAFirefighters were assigned to a wildland fire on the edge of a spot fire. They were in the process of felling a high-hazard tree, a 105-foot tall ponderosa pine that was burning about 10 feet from its top and producing a steady stream of embers. The tree fell in an unexpected manner, and a captain was fatally struck. He was treated by firefighters and emergency medical responders, but he was pronounced dead as he was flown to the helibase.
Table 3. Plots in the FIA database were tagged as disturbed when they had one of these codes in the disturbance fields (field names DSTRBCD1, DSTRBCD2, or DSTRBCD3 in the CONDITION table).
CodeDescription
10Insect damage
12Insect damage to trees, including seedlings and saplings
20Disease damage
22Disease damage to trees, including seedlings and saplings
30Fire damage from crown and ground fire, either prescribed or natural
31Ground fire damage
32Crown fire damage
Table 4. Summary of snag hazard accuracy statistics.
CharacteristicAccuracy
Hazard class86.4%
Hazard class within disturbed areas79.2%
Hazard class outside disturbed areas87.7%
Snag height class76.5%
Snag density class74.4%
Table 5. Class counts for TreeMap-derived snag hazard using (a) all coincident pixels between 2014 and 2016 products and (b) all pixels that were marked as disturbed in both the 2014 and 2016 products.
(a)
Pixel Count (all)% of Pixels
Snag Hazard Class2014201620142016Difference% of 2014 Value
Low (1)549,891,348583,978,60168%73%+4%+6%
Moderate (2)87,201,00774,700,09111%9%−2%−14%
High (3)86,178,26176,152,40211%9%−1%−12%
Extreme (4)81,537,59969,977,12110%9%−1%−14%
(b)
Pixel Count (disturbed)% of Pixels
Snag Hazard Class2014201620142016Difference% of 2014 Value
Low (1)48,417,786.0038,079,050.0068%54%−15%−21%
Moderate (2)7,960,232.009,488,766.0011%13%+2%+19%
High (3)6,917,520.008,924,158.0010%13%+3%+29%
Extreme (4)7,759,094.0014,562,658.0011%20%+10%+88%
Publisher’s Note: MDPI stays neutral with regard to jurisdictional claims in published maps and institutional affiliations.

