
Income and Insurability as Factors in Wildfire Risk


School of Public and International Affairs, University of Georgia, 204 Candler Hall, 202 Herty Drive, Athens, GA 30602, USA
*
Author to whom correspondence should be addressed.
Forests 2022, 13(7), 1130; https://doi.org/10.3390/f13071130
Submission received: 26 May 2022
/
Revised: 12 July 2022
/
Accepted: 15 July 2022
/
Published: 18 July 2022
(This article belongs to the Special Issue New Challenges in Framework for Forest Fire Control)
Abstract
:The increasing frequency of destructive wildfire incidents in the United States, particularly in the West, is well-documented, and the key causal variables are increasingly well understood. Among stakeholders with heightened concerns about risks from destructive wildfire are insurance companies and the homeowners they insure. The cancellation and nonrenewal of insurance due to wildfire risk has received media attention in the wake of major wildfire seasons, particularly in California. However, less attention has been directed to wildfire-related risks borne by lower-income policy holders, specifically. For example, the probability of maintaining or replacing an at-risk policy increases when a homeowner invests in fire protection measures. However, these investments are comparatively costly for lower-income homeowners. The present research aims to identify regions in the lower 48 states where moderate and high wildfire risk, lower income, and insurability are coterminous risks. The concentration of at-risk homes in counties with comparatively high wildfire hazard potential and comparatively higher poverty rates are considered. This paper also considers how the concentrated market share of insurance underwriting may pose a risk to lower income homeowners, considering the overlap between highly concentrated insurance markets and states with high wildfire risk and higher poverty rates.
1. Introduction
Numerous destructive and deadly wildfires, particularly in the American West, have garnered national attention over several years. In the ten-year period ending 2021, undesirable and erratic wildfire (as opposed to fire managed intentionally for forest health and for the safety of nearby communities) burned an average of 7.36 million acres per annum in the United States, representing a 37.4 percent increase in acres burned annually over the prior 20-year period [1]. Memorably, cataclysmic fires are often associated with California including the deadly 2018 Camp Fire that largely destroyed the town of Paradise and the massive 2021 Dixie and Caldor Fires. However, in the early months of 2022, destructive blazes beyond the Pacific coastal region received national attention, including in Arizona, Colorado, and Texas. New Mexico confronted the largest wildfire in that state’s modern recorded history.
Climate change is an overarching driver of increased wildfire activity, magnifying the effects of other variables, including persistent drought, mild winters, increased days of scorching summertime temperatures, earlier snowmelt timing, increased vapor pressure deficit and wind speeds, increased length of rain-free intervals, the geographical expansion of forest-killing pests and pathogens, and the build-up of forest fuels—the latter partly resulting from a prior era of faulty forest management practices [2,3,4,5]. Communities’ capacities to plan for, endure, and recover from wildfire differ across wildfire-prone regions of the country. Increasingly urgent is the need for stakeholders, including federal, state, and local officials, to support communities that are most at-risk, including lower-income and minoritized communities—many of which are outside of California [6,7].
One manifestation of disproportionate, wildfire-related risk for lower-income people is the problem of property insurance nonrenewal and cancellation. Discontinuance of homeowners’ policies due to wildfire risk increased substantially in California in 2018 and 2019 as insurance companies incurred major losses on policies in wildfire-prone regions. Many homeowners were resigned to adopt “last resort” insurance through California’s FAIR Plan which generally entails expensive premiums and more limited coverage. For homeowners whose policies are suspended, securing replacement insurance, including FAIR Plan insurance, may require homeowners to retrofit homes with fire-resistant technologies and/or create defensible space in and around insured properties. Adopting these measures, out of pocket, poses comparatively higher economic burdens on lower-income households ([7,8]). The present article triangulates data on poverty, wildfire risk, and insurability risk to identify the most at-risk counties in the coterminous U.S. We consider county-level data, recognizing that counties, in collaboration with states, are especially important in mustering resources to prepare for, withstand, and recover from wildfire.
2. Income and Insurability as Factors in Wildfire
Over the past several years, multiple studies have documented disadvantages for lower-income or minority communities in their abilities to prepare for, respond to, and recover from destructive wildfire including in California [9], Florida [10], and Oregon [11]. Nationwide, Davies et al. [6] found that the vulnerability to wildfire increased as the proportion of Native Americans and Black individuals increased in a given community. Using census tract data, the authors estimate that majority Native American, Black, or Hispanic communities experienced around 50 percent greater vulnerability to wildfire compared to other census tracts. More recently, using wildfire risk data generated by the First Street Foundation, the Washington Post predicted that by 2052, around 44 percent of all Native Americans and one in four Hispanic people will live in areas with significant probability of wildfire [8].
Ability to recover from destructive fires is affected by the reliability of property insurance [8]. Insurance insecurity is of particular interest in the present research, inspired by a recent surge in wildfire-related insurance claims as well as insurance nonrenewal and cancellation in California [12,13]. In that state, a major increase in claims by policy owners in 2017 and 2018 led to large numbers of nonrenewed or suspended policies. Coverage by California’s FAIR Plan—last-resort insurance for properties deemed high-risk—jumped from 140,000 in 2018 to 200,000 in 2019. Since 2018, multiple moratoria have been issued in California, prohibiting the cancellation or nonrenewal of policies in or adjacent to areas that have been subject to fire-related state-of-emergency orders.
In 2021, California unveiled the “Safer from Wildfires” framework that aims to attract insurers back to wildfire-prone areas as homeowners undertake fire safety measures. The latter include interventions such installing fire-resistant vents and eaves, upgrading windows, creating defensible space around the home, and coordinating with neighbors to establish wildfire evacuation routes. Safer from Wildfires responds to complaints that insurance companies too often fail to account for out-of-pocket fire-protection measures taken by homeowners. The new program requires insurance carriers to recognize fire safety efforts through “wildfire risk scores” that rate individual and commercial properties. Safer from Wildfires includes a partnership with the Federal Emergency Management Agency to make USD 100 million available to qualifying property owners in wildfire-prone areas who adopt home-hardening and defensible-space measures.
Safer from Wildfires or comparable programs could be models for wildfire-prone areas outside of California. We assume that direct, governmental aid programs—comparable to Safer from Wildfires—will be needed to assist lower-income homeowners, considering the intersection of areas with high wildfire hazard potential and higher poverty rates. We examine data on wildfire risk and poverty at the county level, recognizing that counties are major participants in wildfire planning, response, and recovery efforts. In addition, counties are vital service-providers for rural and unincorporated areas, including sparsely populated, lower-income areas that receive few or no municipal services.
3. Materials and Methods
Wildfire risk data are derived from the Wildfire Risk to Communities datasets of the U.S. Forest Service [14] and from the First Street Foundation Wildfire Model [15] Wildfire Risk to Communities features multiple raster geospatial data sets on wildfire risk, depicting relative risk for communities at 270 m horizonal resolution. We adopted the Wildfire Hazard Potential (WHP) dataset—an index that quantifies the relative potential for wildfire that may be difficult to control [16]. WHP is derived from Large Fire Simulator (FSim) data developed by the US Forest Service Missoula Fire Sciences Laboratory, and includes modules for weather generation, wildfire occurrence, fire growth, and fire suppression, in addition to weather data from the National Weather Service and demographic data from the U.S. Census Bureau. FSim models the probability of the occurrence and growth of wildfire under tens of thousands of hypothetical contemporary fire seasons so as to estimate the probability of uncontrolled wildfire in a given area [17]. WHP is also informed by point locations of past fires (circa 1992–2005), and data on spatial fuels and vegetation provided by the public–private collaborative, LANDFIRE [18]. We adopted Mean WHP which is the housing-unit weighted mean of the WHP raster within each summary polygon [19].
The Forest Service notes that WHP “is not a forecast or wildfire outlook for any particular season, as it does not include any information on current or forecasted weather or fuel moisture conditions [19]”. Other recently developed data sets offer more refined predictions of wildfire risk at the neighborhood and individual-property level [20]. The First Street Foundation Wildfire Model (FSFWM), released in May 2022, uses a 30 m spatial resolution approach to predict wildfire exposure for any location in the United States. The great strength of FSFWM over the Forest Service’s Wildfire Risk to Communities’ model is the ability to compare risk within communities, rather than across sets of communities [15] (p. 6). FSFWM incorporates data from the Forest Service on wildfire fuels, probable ignition location based on historic fires, data from the National Oceanic and Atmospheric Administration on past weather patterns that impact fuels, and data on the probabilistic spread of fires [21]. In addition, FSFWM includes a 10-point (and elsewhere, 5-point) “Fire Factor” (or “Risk Factor”) scale that measures the cumulative likelihood of a specific property being affected by wildfire over a 30-year period [21]. First Street Foundation catalogued properties by triangulating public real estate and tax assessor records, data from the U.S. Geological Survey, and data from the U.S. Department of Agriculture. We compared FSFWM and the Forest Service’s Wildfire Risk to Communities model to identify discrepancies in the designation of counties with moderate-to-high wildfire risk.
The 14 states among the lower 48 with highest wildfire risk were identified by comparing the average annual acres burned by wildfire, by state, across the coterminous U.S. between 2016 and 2020, according to data from the National Interagency Fire Center [1]. Those states are Arizona, California, Colorado, Florida, Idaho, Montana, Nevada, New Mexico, Oklahoma, Oregon, Texas, Utah, Washington, and Wyoming. Among the 14 states with high wildfire risk, we isolated counties with moderate-to-high WHP combined with a poverty rate at or above the national average. WHP is a continuous variable with five categories: very low (1), low (2), moderate (3), high (4), and very high (5). After Davies et al. [6], we adopted WHP ≥ 3 as the lower boundary for identifying counties with comparatively higher risk of destructive wildfire. From First Street Foundation’s 10-point Fire Factor scale, we identified all counties with Fire Factor scores of moderate or higher in the 14 states with the highest wildfire risk. The goal of the comparison of the Forest Service and First Street Foundation data was to identify differences in the two models’ designation of counties combining comparatively high wildfire risk and higher poverty rates. Poverty rate data are derived from the American Community Survey data of the U.S. Census Bureau [22]. In 2019, the national poverty rate was 12.3 percent. We propose that among counties with WHP of 3 or greater, it is counties with comparatively higher poverty rates, i.e., equal to or greater than 12.3 percent, that are especially vulnerable to the safety and economic risks posed by destructive wildfire.
Other materials include archival research on reportage of nonrenewal and cancellation of homeowners’ insurance in the United States due to wildfire risk. More so than in any other state, homeowners in California have grappled with the suspension of policies, as insurance companies attempt to contain wildfire-related losses and avoid future liabilities. In the absence of moratoria, it is fair to expect increased incidence of insurance discontinuance in other states with elevated wildfire risk [23]. We consider which counties in the top wildfire-prone states are especially vulnerable considering the prevalence of lower-income households.
4. Results
4.1. Geography of Wildfire Hazard and Poverty
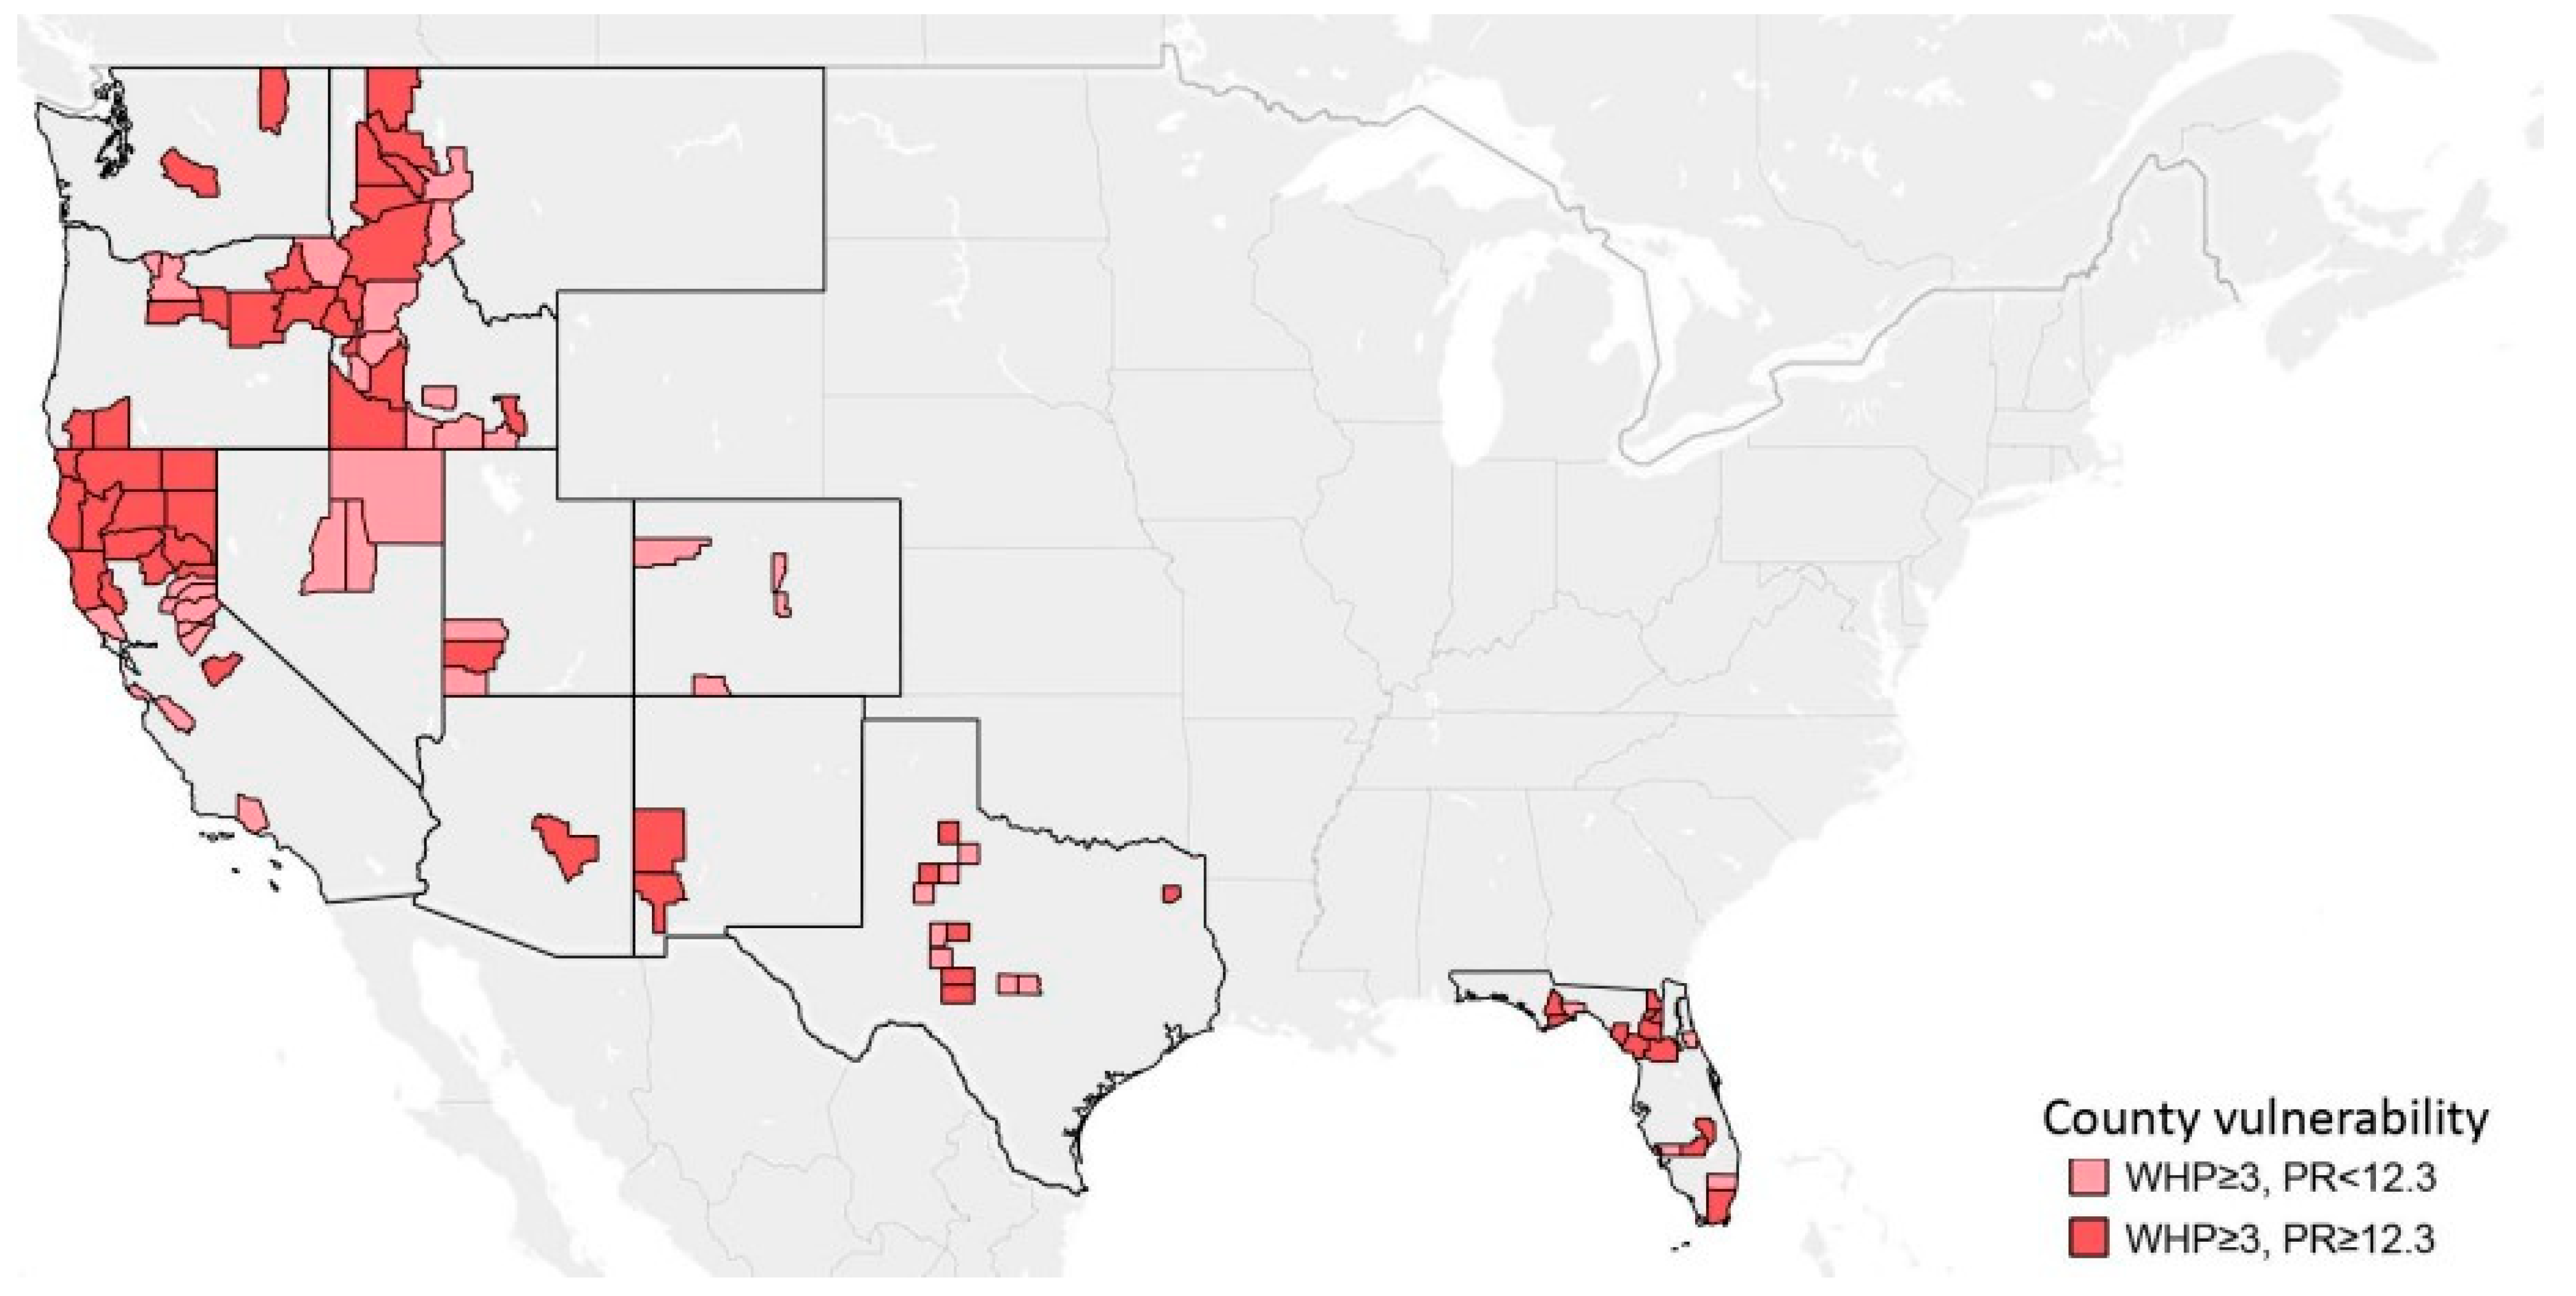
In the coterminous United States, among the 14 states with the highest total acreage burned by wildfire between 2016 and 2020, 98 counties had a WHP of 3 or greater. Of those 14 states, Oklahoma and Wyoming had no counties with a WHP ≥ 3. In the remaining 12 states, counties combining moderate-to-high WHP and higher poverty rates (WHP ≥ 3 and PR ≥ 12.3 percent) outnumbered counties combining moderate-to-high WHP and lower poverty rates. Sixty percent of counties with WHP ≥ 3 had a poverty rate ≥ 12.3 (shaded red in Figure 1). Forty percent of counties with WHP ≥ 3 had a poverty rate of < 12.3 (shaded pink).
The geographical distribution of areas in the high-wildfire-risk states, which combine moderate-to-high WHP and higher poverty rates and take the form of clusters of adjoining counties. For example, several at-risk northern California counties are adjoining, and the cluster is contiguous with two counties in southwest Oregon. Elsewhere in Oregon, a cluster of moderate-to-high WHP and higher poverty rate counties are in the state’s north-central and northeast regions. An unbroken set of coterminous counties running along the western axis of Idaho and adjacent to counties in Nevada combine elevated wildfire hazard potential and higher poverty. In contrast, one dozen counties in Florida combine moderate-to-high WHP and higher poverty, but there is comparatively greater geographical dispersion of these regions in different parts of the state.
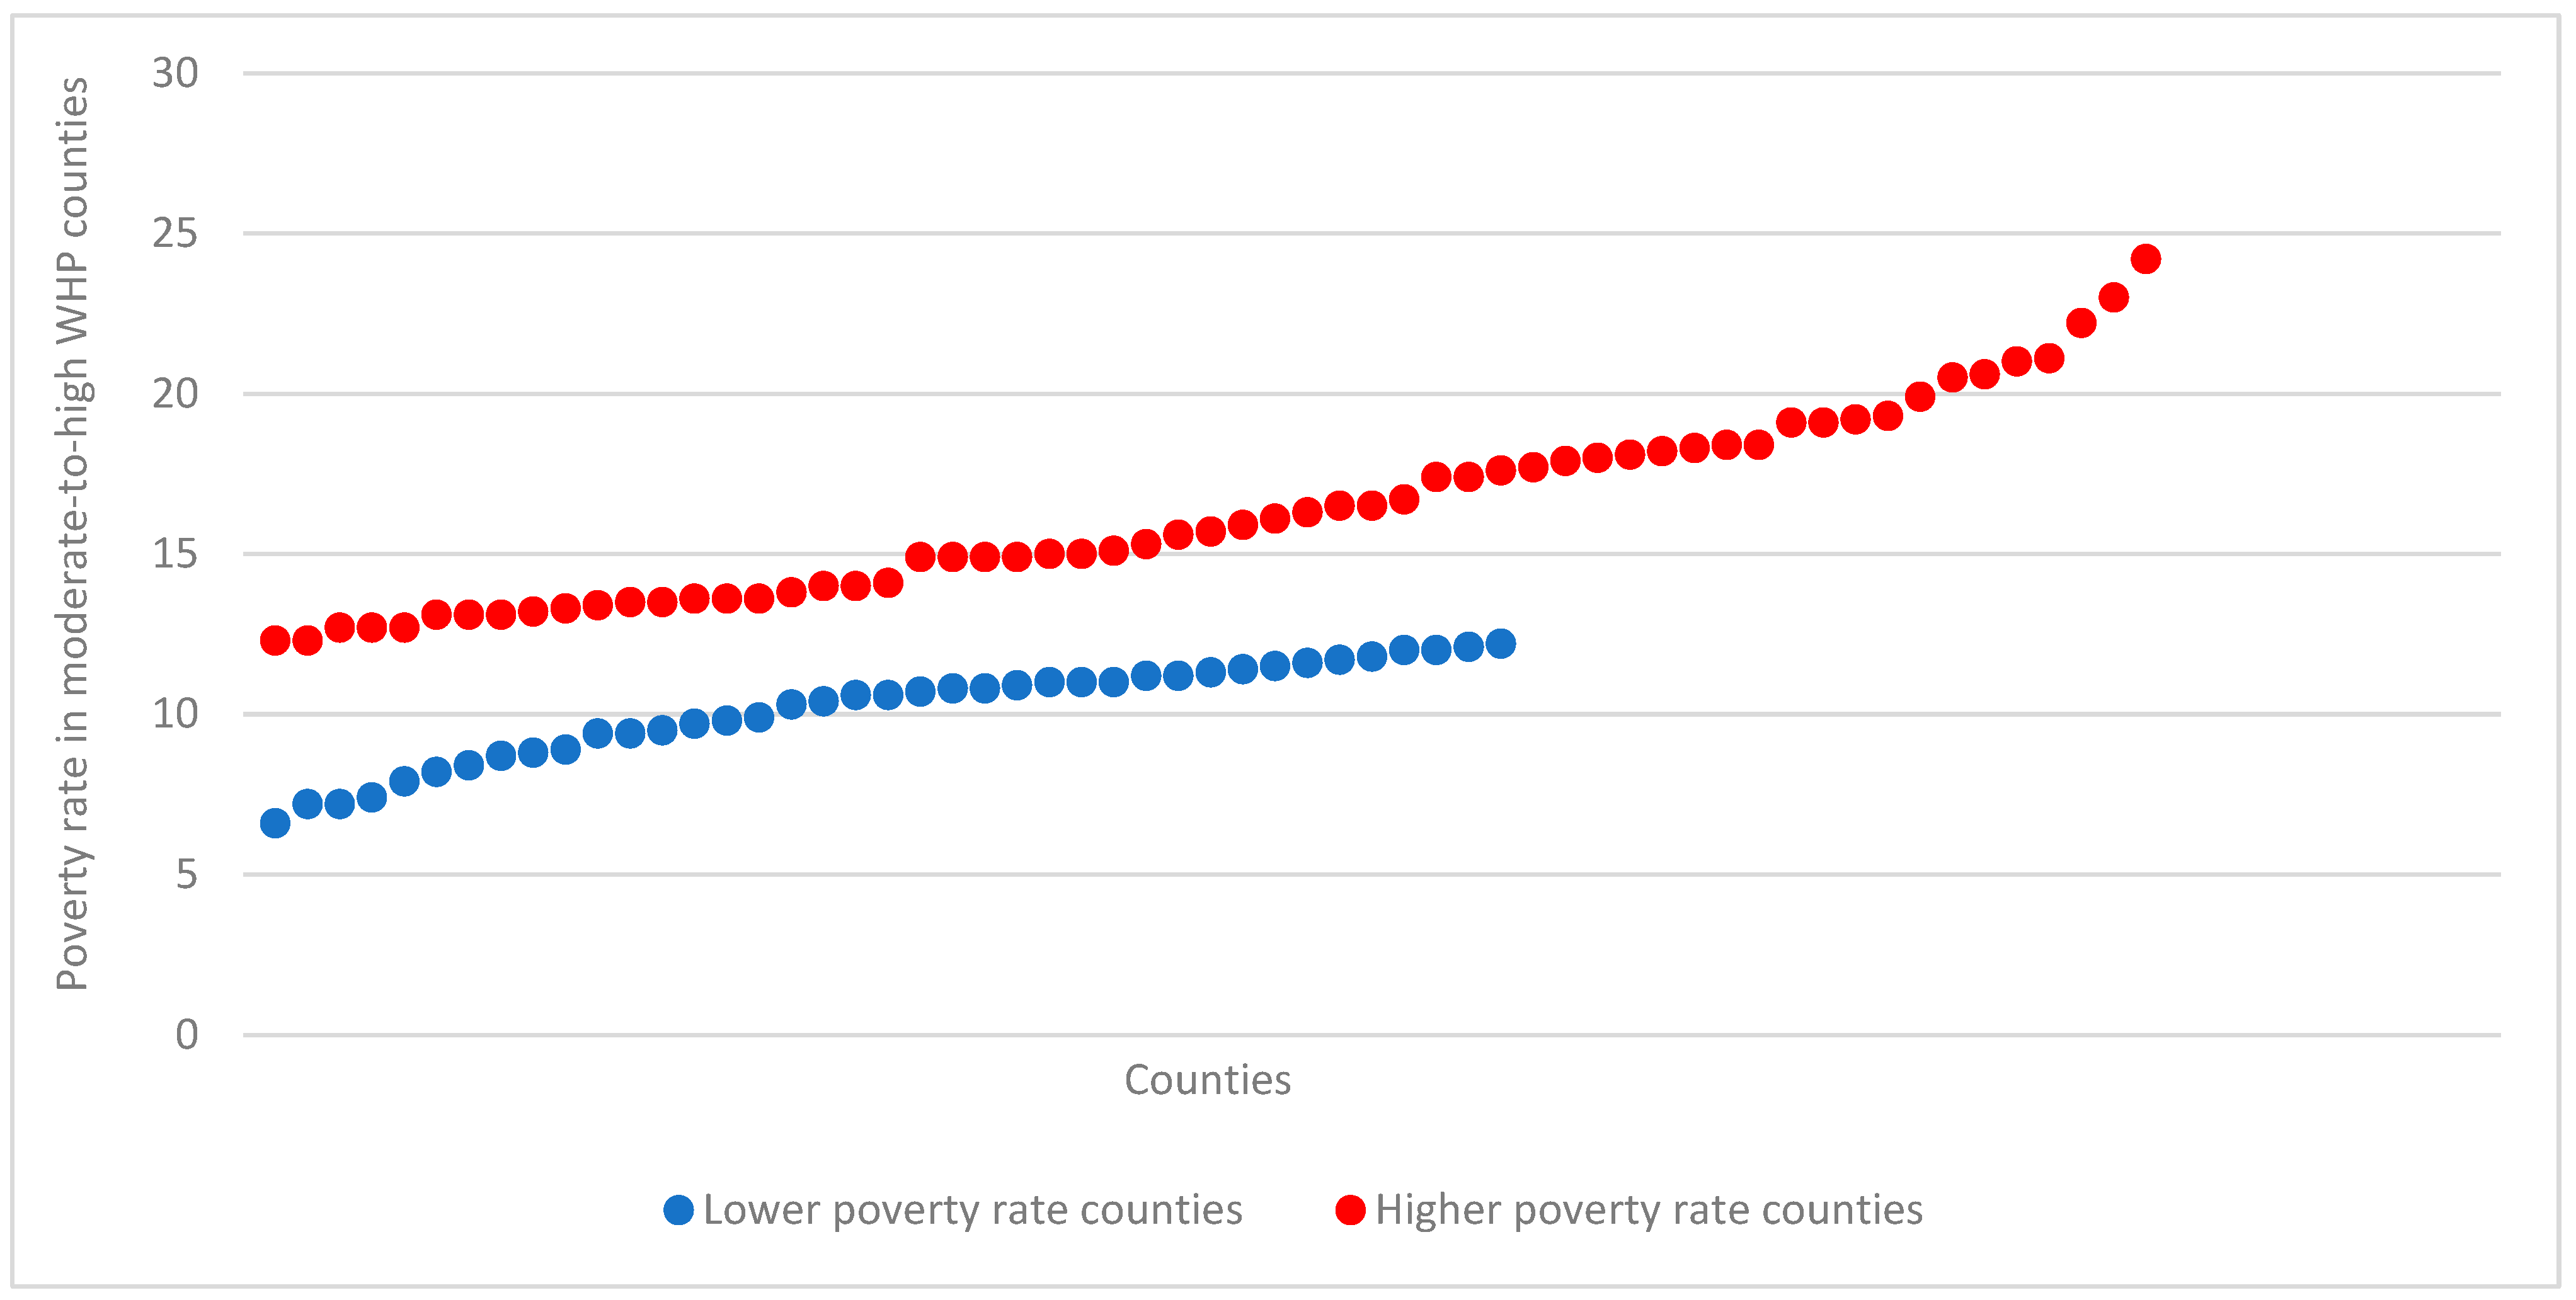
Figure 2 exhibits the 59 counties with moderate-to-high wildfire hazard potential that are comparatively lower-income (red), and 39 moderate-to-high WHP counties with poverty rates below the 2019 national poverty rate of 12.3 percent (blue). Not only are there more higher-poverty-rate counties among the 98 counties, there is also greater variance in the poverty rate in the higher-poverty-rate vs. lower-poverty-rate counties (σ2 = 8.68 vs. 2.38). The variance is greatest in the poorest subset of counties (steeper-sloping, far-right-hand portion of the red distribution in Figure 2).
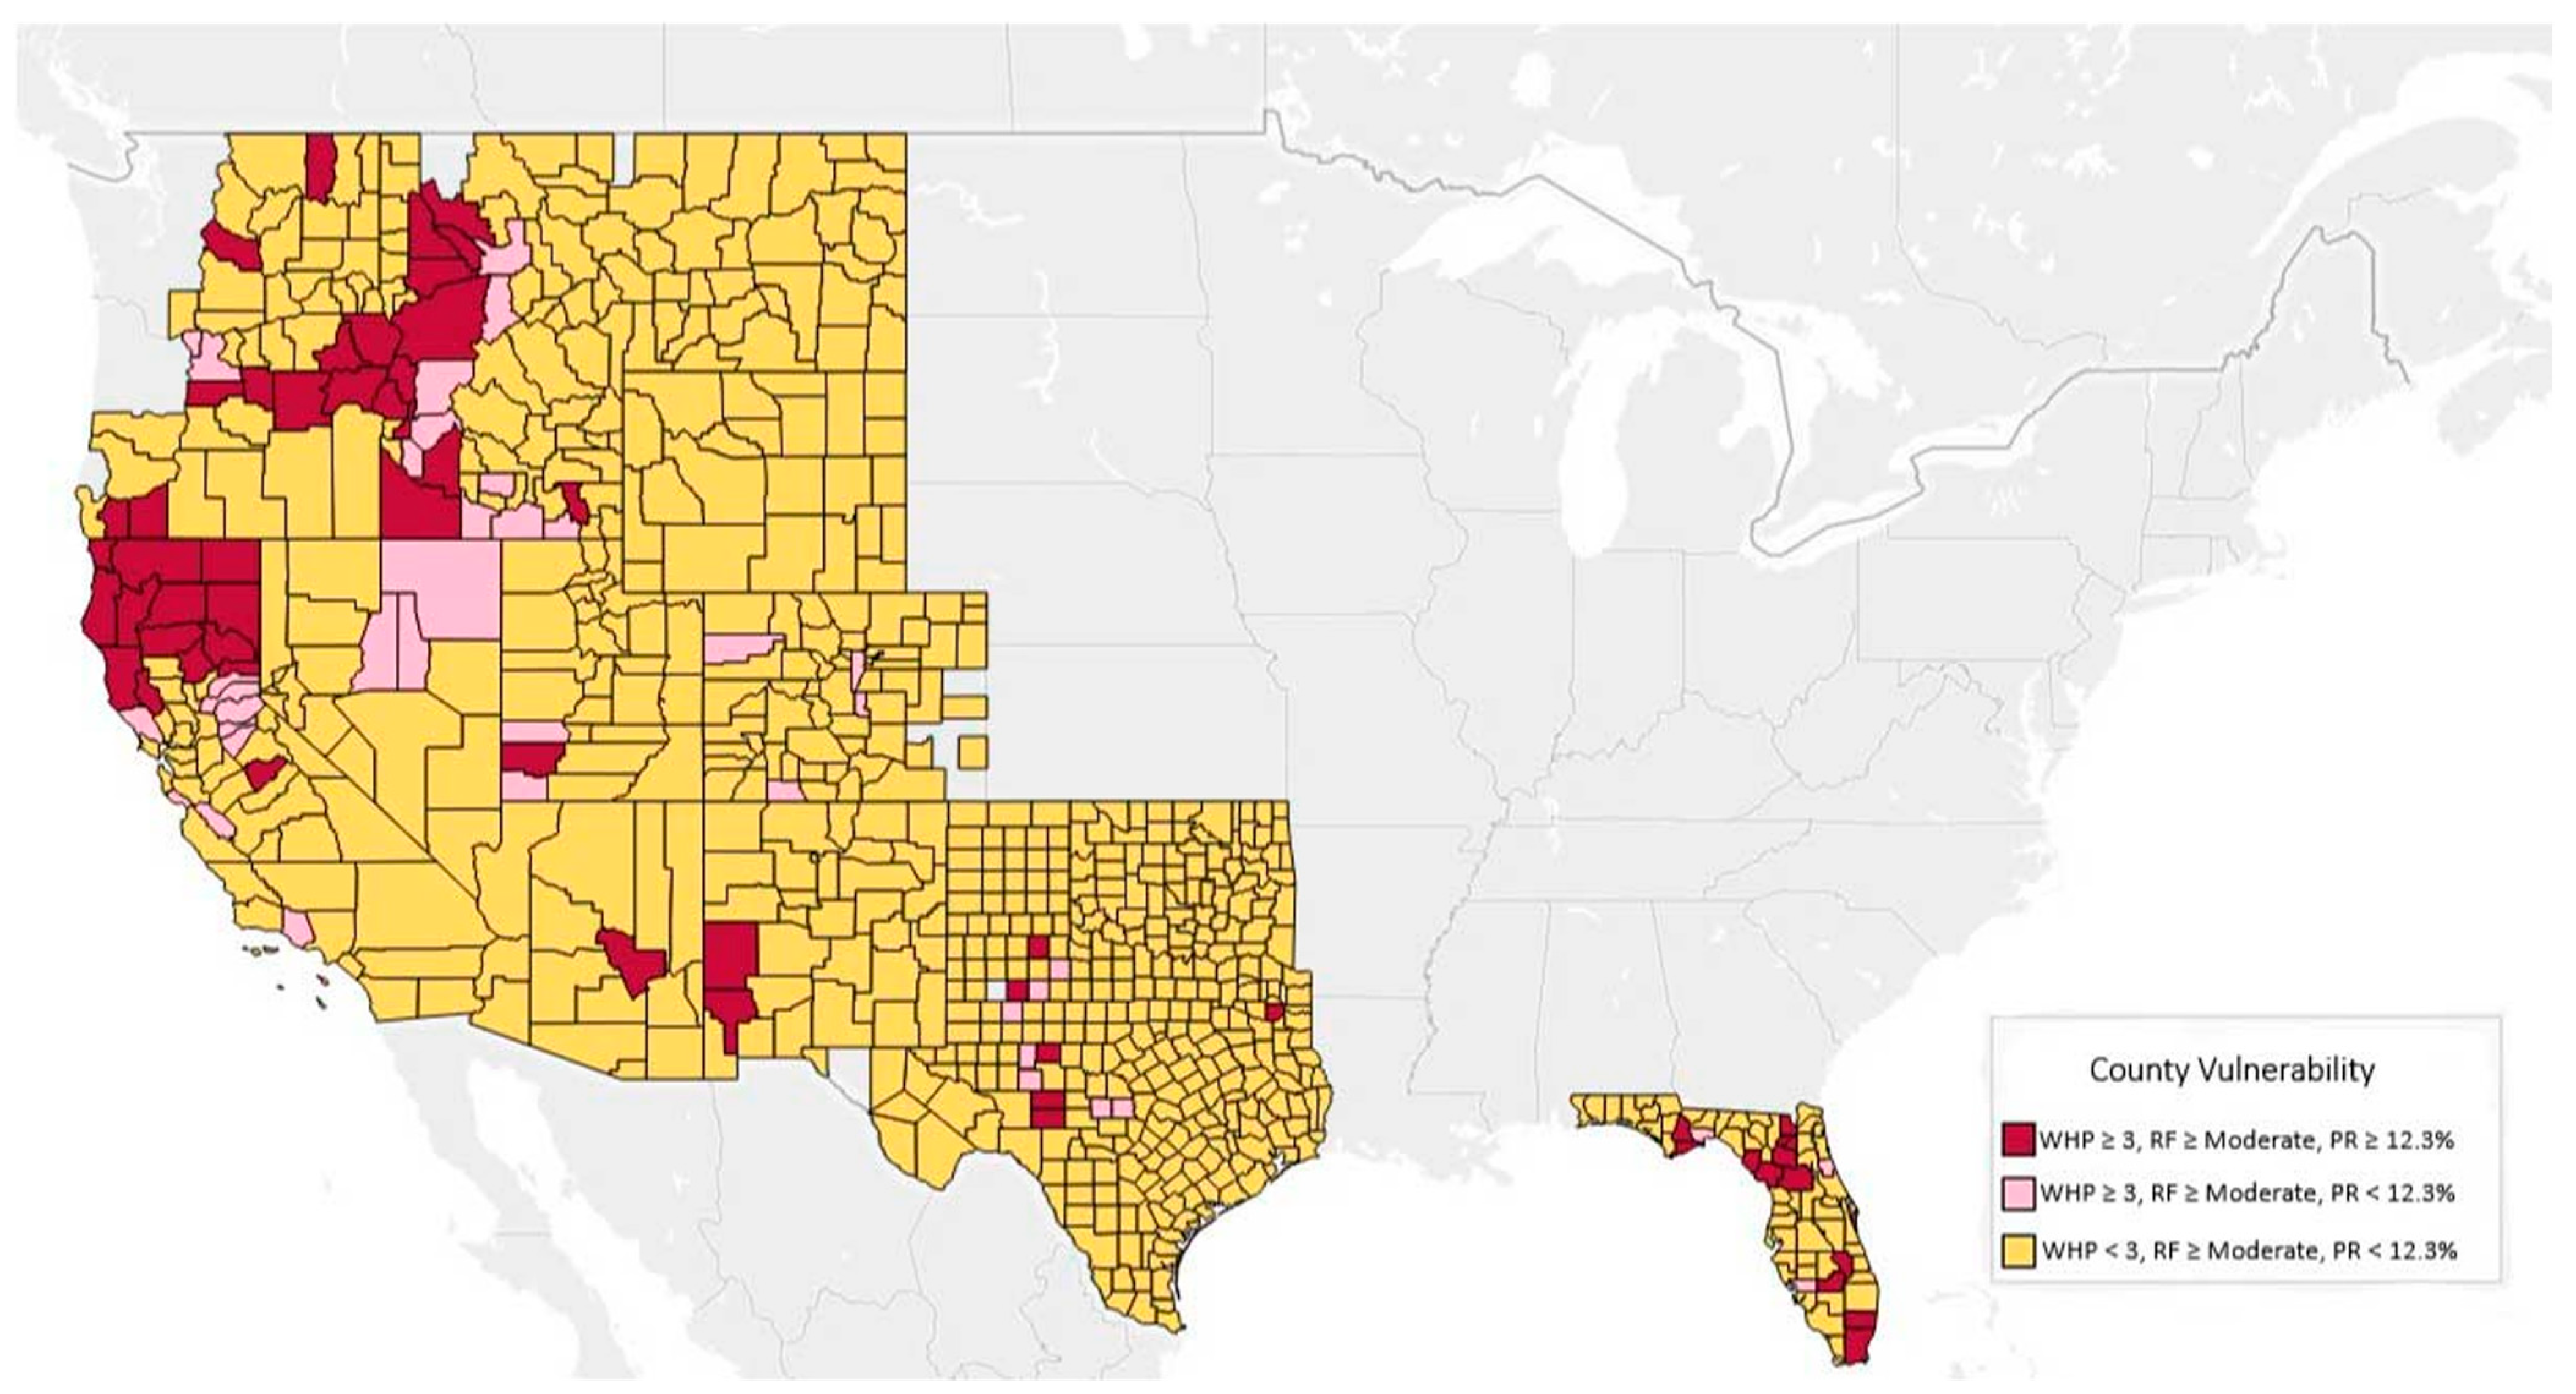
Figure 3 combines three datasets: counties with moderate, major, severe, or extreme wildfire risk among the 14 highest wildfire risk states, per First Street Foundation’s Fire Factor scale; all WHP ≥ 3 at the county-level per the Forest Service’s Wildfire Risk to Communities data; and county-level poverty rate data from the U.S. Census Bureau. With the exception of Lincoln County, Montana, all higher-poverty-rate counties that the Forest Service model designates as having moderate-to-high wildfire risk are identical to at-risk counties identified by the First Street Foundation’s Fire Factor (all red-shaded counties in Figure 3). Similarly, lower-poverty-rate counties that the Forest Service recognizes as having moderate-to-high wildfire risk are matched by Fire Factor data (pink-shaded counties). The major differences between the Forest Service and First Street Foundation model outputs are instances of lower-poverty-rate counties that the Forest Service categorizes as lower wildfire risk (WHP < 3) but that First Street Foundation labels moderate or higher wildfire risk. The latter counties are shaded yellow in Figure 3.
It is important to consider that the Forest Service’s WHP and the First Street Foundation’s Fire Factor are not directly comparable metrics. WHP is an index that quantifies the relative potential for wildfire that may be difficult to suppress. In contrast, First Street Foundation’s 1-to-10 (and alternately, 1-to-5) scale for measuring Fire Factor considers the cumulative likelihood of a property being affected by wildfire over a 30-year period. Notwithstanding these differences, the two models rely on comparable data: WHP and Fire Factor both incorporate data on spatially derived estimates of burn probability. Second, Fire Factor incorporates the Forest Service’s LANDFIRE fuels dataset as a baseline for fuel type and fuel behavior [24]. Third, the metric adopted by the two models is a continuous integer value that depicts probabilistic risk.
4.2. Wildfire, Housing Concentration, and Insurance Risk
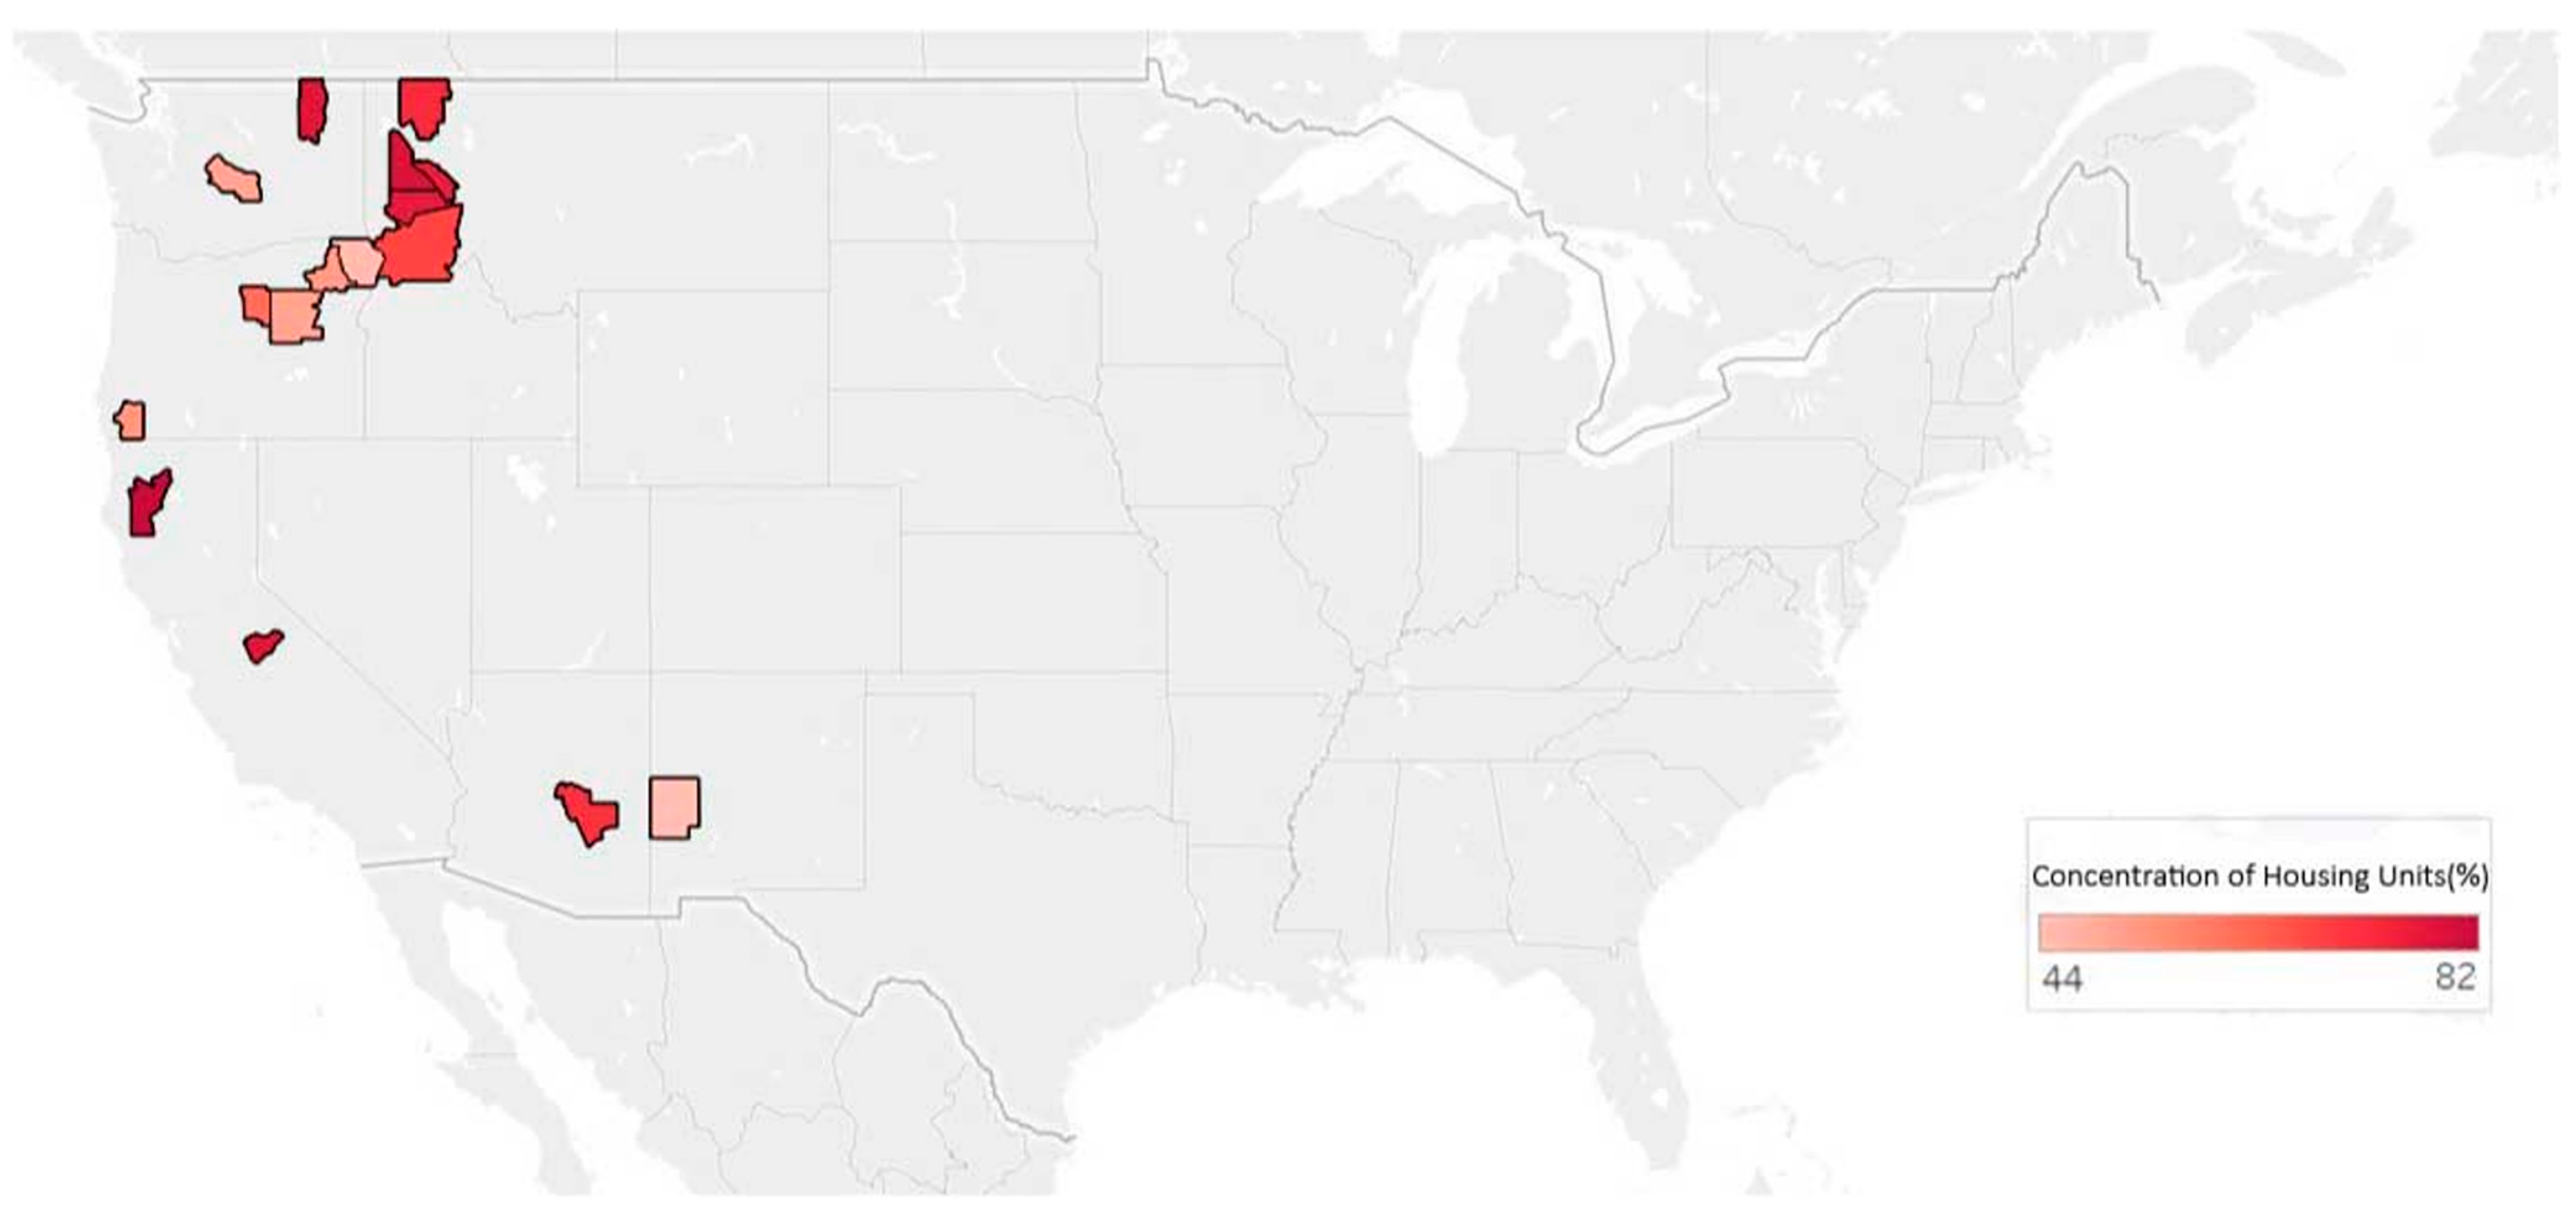
From an insurance perspective, concentration of housing units in wildfire-prone areas is another important variable to consider, whether relying on Forest Service WHP or First Street Foundation Fire Factor data as an indicator of wildfire risk. We are particularly interested in the intersection of concentrated housing, poverty, and insurance insecurity. Data on housing concentration in wildfire-prone areas was provided by Verisk, a data analytics firm that models wildfire risk for the insurance industry. Verisk’s FireLine risk management tool combines remote-sensing imagery, data on fuel abundance and fuel regrowth in previously burned areas, slope of terrain, access (i.e., road access for fire containment), and U.S. Census Bureau data on housing unit density. Data for Florida were unavailable. We matched counties in each of 12 states that combine Verisk’s 2020 data on the concentration of housing units in counties with high and extreme wildfire risk (where “high and extreme” is the top tier of Verisk’s three categories of wildfire risk) combined with our 2020 data set of 59 moderate-to-high WHP and higher-poverty-rate counties (red-shaded counties in Figure 1). These triangulated data are shown in Figure 4.
The overlay of housing unit concentration data in Figure 4 serves to highlight the particular vulnerability of communities in central and northeast Oregon and the adjacent counties of Idaho’s panhandle. In contrast, northern California counties are fewer in Figure 4 vs. Figure 1 and Figure 3, underlining the comparatively lower concentration of at-risk housing units in California.
Compared to the Forest Service’s WHP, First Street Foundation’s Fire Factor yields more counties with moderate-to-high wildfire risk. Figure 5 replaces WHP with Fire Factor data, with an overlay of Verisk housing concentration data.
The Fire Factor overlay on Verisk data in Figure 5 shows comparatively more counties with high concentrations of housing units at high or extreme risk from wildfire. Whereas WHP + Verisk data (Figure 4) implicate seven states with very high concentrations of housing units in high- and extreme-wildfire-risk counties, Fire Factor + Verisk data (Figure 5) reveal 11 states with this combination of elevated risks. The concentration of housing units with high to extreme wildfire risk in at least two counties in Figure 5 reaches or exceeds 90 percent.
4.3. Wildfire-Prone States and Market Share of Insurance Companies
California’s comparatively more sparsely populated, at-risk homeowners are beneficiaries of the 2021 Safer from Wildfires program, with 2022 marking the first year of implementation. In terms of design and scope, Safer from Wildfires, which aims to improve protection of properties in wildfire-prone areas and restore confidence among insurance companies, has no direct equivalent among the other, major wildfire-prone states in this study.
One measure of risk is access to replacement insurance. Although there are hundreds or even thousands of licensed primary and out-of-state insurers operating in every U.S. state [25], our research reveals that in many of the most wildfire-prone states, homeowner policy underwriting is comparatively highly concentrated. We examined the total number of premiums sold to insured entities (excluding premiums destined for reinsurance) in each of the lower 48 states. Data are published by the National Association of Insurance Commissioners [26]. There are nine states where the cumulative market share of the top 10 property and casualty insurers is 60 percent or more of the market. Seven of those states are among this study’s fourteen most wildfire-prone states: Arizona, Colorado, Montana, New Mexico, Oregon, Washington, and Wyoming. The abundance of licensed insurers in these states does not imply that policies are underwritten by a large and varied set of insurers. New Mexico led all U.S. states with 2604 licensed out-of-state insurers in 2020. Yet, that same year, the market share of the state’s top 10 property insurance underwriters was 60.6 percent, placing it among the states with most concentrated insurance markets. A relatively high percentage of homeowners in at least seven major wildfire-prone states are subject to the risk determination decisions of a comparatively small group of policy underwriters.
5. Discussion
5.1. Results and Policy Considerations
The results in the present study underscore the geographical distribution of homeowners in major wildfire-prone states whose risk factors include not just wildfire exposure risk, but also socioeconomic risk. The data reveal that many of the affected regions are outside of California, and yet California is a leader nationwide in developing moratoria on insurance nonrenewal and cancellation due to wildfire-related risks, in providing subsidies to homeowners to protect properties, and in enticing risk-averse insurers back to the market. Lower-income homeowners as a proportion of all homeowners in areas of high wildfire risk are prominent not only in northern California, but in 12 of the 14 major wildfire-prone states in the coterminous U.S., including the majority of counties in Idaho and significant portions of Oregon and Texas. This paper points to the need for additional research on socioeconomic variables, such as income and insurability risk, as overall determinants of wildfire risk. In the process, we expect more studies to bring attention to at-risk homeowners in geographical areas beyond wildfire-plagued parts of California. Consider that the deadly 2018 Camp Fire which destroyed Paradise, California affected homeowners who by California income standards are comparatively less wealthy. Butte County, California, where Paradise resides, had a 2019 median household income of USD 52,537. In comparison, the median household income of counties most directly affected by the massive 2022 Hermits Peak–Calf Canyon wildfires in New Mexico ranged from USD 28,446 to USD 30,946.
An open question this research highlights is how stakeholders such as insurance companies and insurance commissioners outside of California will respond to the intertwined problems of climate-driven, destructive wildfire, insurance risk in high- and extreme-wildfire-risk areas, and the plight of low-income homeowners in these areas. California’s moratoria, which are meant to be time-limited, and its recent efforts to enable homeowners to harden homes and create defensible space, offer potential models for other at-risk regions of the country. Federal-level programs such as Firewise USA, which channels congressionally authorized funds for wildfire education and risk reduction to communities, are also part of the solution [7]. However, like California’s Safer from Wildfires program which, to date, is the most well-resourced program for wildfire prevention and protection of any state, Firewise USA does not earmark assistance for lower-income households. Since aid is unlikely to flow to all or even most individual homeowners, the community-scale assistance provided by programs such as Firewise USA and Safer from Wildfires may prove particularly important for lower-income homeowners who simultaneously confront natural disaster risk and severe economic risk. Safer from Wildfires makes resources available to engage whole neighborhoods in fuel reduction efforts in common areas and in creating evacuation routes and emergency communication plans. Presently, in poorer, rural precincts in high-wildfire-risk areas of the American Southwest and in the western mountain states, these efforts are piecemeal. More intentional and more generously resourced programs will become increasingly urgent as the risks from major, destructive wildfires continue to mount.
5.2. Further Research Needs
This article considers the combination of wildfire risk and insurance risk for lower-income households in wildfire-prone states. Additional research is required to explore the full range of wildfire-related risks that affect vulnerable populations in and near wildfire-prone areas. A broad set of environmental, public health, and economic risks from wildfire extends far beyond the factors considered in conventional homeowners’ policies and in commercial-fire-insurance policies.
An important challenge for stakeholders to consider is the complexity of public and private property regimes in wildfire-prone areas. To illustrate, there are federally designated wilderness areas in some at-risk counties in this analysis, and these public lands are often contiguous with private land holdings. Fire management efforts in these areas have been complicated historically and continue to pose challenges. Beginning in the 1970s, federal agencies managing public lands in the West began adopting “let burn” policies to enable forest regeneration in fire-adapted ecosystems, including in wilderness areas. However, in practice, fire suppression continued (and currently continues) in these areas due to the abundant presence of homes and other structures in and near federally designated wilderness [27]. More broadly, wildfire-prone areas of the West include complex mosaics of public and private lands, with private property “inholdings” inside of the National Forest and National Park systems—legacies of the 1862 Homestead Act. There is also “stranded land”—parcels of public property landlocked by private land holdings. These lands are not easily accessed by fire crews (considering trespassing norms on private land), creating obstacles for fire suppression. Across 11 western states, there are approximately 6 million acres of stranded land, and research indicates that fires originating on stranded land are more likely to escape containment and increase in size versus comparable fires originating on accessible land [28,29]. Land swaps are one potential solution to this challenge: federal agencies can arrange to exchange stranded land for comparable private property, thereby reducing the patchiness of property types and improving fire safety on public lands.
Wildfire, including in the wildfire-prone/higher-poverty-rate counties examined in this article, poses risks to a variety of environmental assets and services neither covered in insurance policies nor properly valued in state or national income accounting. By way of illustration, Ferry County, Washington, a higher-WHP/higher-poverty-rate county, is home to the Colville Indian Reservation where timber extraction and recreation are key economic activities. Along a stretch of the Columbia River running through the county, a salmon hatchery was established nearly a decade ago to aid restoration of a salmon run. Considering wildfire risks, a major wildfire in this area could affect water quality, wildlife habitat, other environmental service values, and livelihood values, but these assets are not addressed in conventional insurance policies. It is unrealistic to expect households in and around the underserved Colville Indian Reservation to bear the costs of insuring larger, landscape- and societal-scale environmental, health, and economic risks posed by wildfire.
Future research is needed to properly assess the full suite of values threatened by wildfire, particularly in underserved areas where local economies and livelihoods tend to be more natural-resource-dependent. Were “non-market” values to become incorporated into private insurance contracts, a “carrot” approach for homeowners is more likely to be accepted by policyholders. Incentives might include discounted premiums in return for reducing hazardous fuels and adoption of other fire safety measures on insured property or in wildfire-prone communal areas such as neighborhood woodlots or right of ways. As part of the U.S. Department of Agriculture’s Conservation Reserve Enhancement Program, farmers and landowners are incentivized to set aside or manage land to protect water quality, reduce soil erosion, secure critical wildlife habitat, and protect areas with high recreation value [30]. A comparable program could aim to prompt property owners to reduce wildfire risks on their own lands and adjacent lands by, for example, cost sharing of fuel reduction activities, creating fuel breaks in vegetated landscapes, protecting water sources for firefighters, and comparable risk reduction measures.
6. Conclusions
Improved methods, models, and refined datasets are enabling more precision in the arena of wildfire science. In contrast, policy responses to protect vulnerable communities from erratic, destructive wildfire lag behind. This article triangulates data on wildfire risk, income, and insurability, with the goal of understanding the vulnerability of lower-income homeowners—homeowners that are more likely to experience property insurance nonrenewal or cancellation due to wildfire risk. Using data from the U.S. Forest Service, we find that counties with moderate to high wildfire risk are more likely to be counties with higher poverty rates (59 out of a total of 98 counties in 12 high-wildfire-risk states). A more refined dataset from the risk-modeling organization, First Street Foundation, finds many additional counties, beyond those identified by the Forest Service, that are at moderate, major, severe, or extreme risk of wildfire, although both the Forest Service and First Street Foundation datasets are in close agreement regarding the set of wildfire-prone, high-poverty-rate counties. Differences in these datasets have implications for agencies and organizations tasked with managing wildfire risk, with First Street Foundation’s data proving more granular and comprehensive.
California homeowners, who experienced a surge of insurance nonrenewal and cancellation decisions by insurance carriers in 2018 and 2019, are experiencing regulatory relief in 2022. The Safer from Wildfires program adopted in late 2021 aims to incentivize homeowners and neighborhoods to adopt fire safety measures and to oblige insurers to recognize and reward these interventions. California is ahead of other states in the wildfire-prone West in addressing the challenges of wildfire-related property insurance risk. In the absence of comparable policies, lower-income homeowners in nearby states may be at higher risk of insurance termination. The concentration of insurance underwriting in wildfire-prone states elevates these risks, limiting opportunities for homeowners to find replacement insurance. More research is needed to determine risks to the most vulnerable communities on a location-by-location basis. No less urgent is the identification of resources to support wildfire planning, response, and recovery efforts among underserved communities. New initiatives such as Safer from Wildfires and older established programs such as Firewise USA will prove important for community-based wildfire management, as will widespread adoption at the local level of multistakeholder Community Wildfire Protection Plans [7]. The high probability of continued, destructive wildfires across the American West and beyond, and the varied stakeholders affected by wildfire, point to the urgent need for planning and response strategies involving multiple interests—from federal, state, local, and tribal governments to businesses, nonprofits, homeowner associations, neighborhoods, and individual homeowners. Insurance companies are among the interested parties in this urgent work, as are vigilant state insurance commissioners.
Author Contributions
Conceptualization, M.R.A.; methodology, M.R.A.; software, B.E.H.; validation, M.R.A. and B.E.H.; formal analysis, M.R.A. and B.E.H.; investigation, M.R.A. and B.E.H.; resources, M.R.A. and B.E.H.; data curation, B.E.H.; writing—original draft preparation, M.R.A.; writing—review and editing, M.R.A.; visualization, B.E.H.; supervision, M.R.A.; project administration, M.R.A.; funding acquisition, M.R.A. All authors have read and agreed to the published version of the manuscript.
Funding
This research was supported by University of Georgia Arch Foundation Professorship funding.
Data Availability Statement
Data used in this project are available by request from the authors.
Conflicts of Interest
The authors declare no conflict of interest.
References
- NIFC. National Interagency Fire Center Online Database. Available online: https://www.nifc.gov/fire-information/statistics/wildfires (accessed on 23 April 2022).
- Parks, S.A.; Abatzoglou, J.T. Warmer and drier fire seasons contribute to increases in area burned at high severity in western US forests from 1985 to 2017. Geophys. Res. Lett. 2020, 47, e2020GL089858. [Google Scholar] [CrossRef]
- Abatzoglou, J.T.; Williams, A.P. Impact of anthropogenic climate change on wildfire across western US forests. Proc. Natl. Acad. Sci. USA 2016, 113, 11770–11775. [Google Scholar] [CrossRef] [PubMed] [Green Version]
- Jolly, W.M.; Cochrane, M.A.; Freeborn, P.H.; Holden, Z.A.; Brown, T.J.; Williamson, G.J.; Bowman, D.M.J.S. Climate-induced variations in global wildfire danger from 1979 to 2013. Nat. Commun. 2015, 6, 7537. [Google Scholar] [CrossRef] [PubMed]
- Williams, A.P.; Abatzoglou, J.T.; Gershunov, A.; Guzman-Morales, J.; Bishop, D.A.; Balch, J.K.; Lettenmaier, D.P. Observed impacts of anthropogenic climate change on wildfire in California. Earth’s Future 2019, 7, 892–910. [Google Scholar] [CrossRef] [Green Version]
- Davies, I.P.; Haugo, R.D.; Robertson, J.C.; Levin, P.S. The unequal vulnerability of communities of color to wildfire. PLoS ONE 2018, 13, e0205825. [Google Scholar] [CrossRef] [PubMed] [Green Version]
- Auer, M.R. Considering equity in wildfire protection. Sustain. Sci. 2021, 16, 2163–2169. [Google Scholar] [CrossRef] [PubMed]
- Muyskens, J.; Tran, A.B.; Ahmed, N.; Phillips, A. One in Six Americans Live in Areas with Significant Wildfire Risk. Washington Post. 2022. Available online: https://www.washingtonpost.com/climate-environment/interactive/2022/wildfire-risk-map-us/ (accessed on 17 May 2022).
- Adams, M.D.O.; Charnley, S. The environmental justice implications of managing hazardous fuels on federal forest lands. Ann. Am. Assoc. Geogr. 2020, 110, 1907–1935. [Google Scholar] [CrossRef]
- Mercer, D.E.; Prestemon, J.P. Production function models for wildfire risk analysis in the wildland–urban interface. For. Policy Econ. 2005, 7, 782–795. [Google Scholar] [CrossRef]
- Lynn, K.; Gerlitz, W. Mapping the relationship between wildfire and poverty. In US Forest Service Proceedings; RMRS-P-41; University of Oregon: Eugene, OR, USA, 2006. [Google Scholar]
- RAND. The impact of changing wildfire risks on California’s residential insurance market. In California’s Fourth Climate Change Assessment; California Natural Resources Agency: Sacramento, CA, USA, 2018. [Google Scholar]
- Governor’s Office of Planning and Research. Appendix III: Homeowners Insurance and Mitigation Working Group Report. 2019. Available online: https://opr.ca.gov/meetings/wildfire-commission/2019-06-07/docs/20190607-Item_7_Appendix_III_Insurance_Workgroup_Report_Draft_for_Discussion.pdf (accessed on 7 May 2022).
- US Forest Service. Wildfire Risks to Communities. Online Database. Available online: https://wildfirerisk.org/download/ (accessed on 11 April 2022).
- First Street Foundation. The Fifth National Risk Assessment: Fueling the Flames. 2022. Available by Request to Fifth Street Foundation. Available online: https://report.firststreet.org/ (accessed on 17 May 2022).
- Dillon, G.K.; Gilbertson-Day, J.W. Wildfire Hazard Potential for the United States (270-m), Version 2020 (3rd Edition). Available online: https://www.fs.usda.gov/rmrs/datasets/wildfire-hazard-potential-united-states-270-m-version-2020-3rd-edition#:~:text=WHP%20is%20an%20index%20that,fuel%20treatments%20may%20be%20needed (accessed on 21 May 2022).
- US Forest Service. Spatial Dataset of Probabilistic Wildfire Risk Components for the Conterminous United States. Available online: https://www.fs.usda.gov/rds/archive/products/RDS-2016-0034/_metadata_RDS-2016-0034.html/ (accessed on 2 May 2022).
- US Forest Service; U.S. Department of Interior. LANDFIRE. Online Database. Available online: https://landfire.gov/ (accessed on 5 May 2022).
- Dillon, G. Wildfire Hazard Potential (WHP) for the Coterminous United States (270-m GRID), Version 2014 Continuous. 3rd Edition. Fort Collins, CO: Forest Service Research Data Archive. 2020; Online Database. Available online: https://www.fs.usda.gov/rds/archive/Catalog/RDS-2015-0047-3 (accessed on 23 April 2022).
- First Street Foundation. Defining America’s Past, Present, and Future Wildfire Risk. 2022. Available online: https://firststreet.org/risk-factor/fire-factor/ (accessed on 8 July 2022).
- First Street Foundation. The Data behind Fire FactorTM. Available online: https://riskfactor.com/methodology/fire (accessed on 8 July 2022).
- United States Census Bureau. Poverty Data Tables. Available online: https://www.census.gov/topics/income-poverty/poverty/data/tables.html (accessed on 18 October 2021).
- Quinton, S. As Wildfire Risk Increases, Home Insurance is Harder to Find. Available online: https://www.pewtrusts.org/en/research-and-analysis/blogs/stateline/2019/01/03/as-wildfire-risk-increases-home-insurance-is-harder-to-find (accessed on 17 December 2021).
- First Street Foundation. Highlights from “Fueling the Flame”. 2022. Available online: https://firststreet.org/research-lab/published-research/article-highlights-from-fueling-the-flames/ (accessed on 10 July 2022).
- Insurance Information Institute. A Firm Foundation: How Insurance Supports the Economy. 2022. Available online: https://www.iii.org/publications/a-firm-foundation-how-insurance-supports-the-economy/a-50-state-commitment/insurance-companies-by-state (accessed on 8 May 2022).
- National Association of Insurance Commissioners. 2020 Market Share Reports for Property/Casualty Groups and Companies by State and Countrywide. 2021 Edition. Available online: https://content.naic.org/sites/default/files/publication-msr-pb-property-casualty.pdf (accessed on 20 April 2022).
- Van Wagtendonk, J.W. The history and evolution of wildland fire use. Fire Ecol. 2007, 3, 3–17. [Google Scholar] [CrossRef]
- Leonard, B.; Plantinga, A.J.; Wibbenmeyer, M. Stranded land constrains public land management and contributes to larger fires. Environ. Res. Lett. 2021, 16, 114014. [Google Scholar] [CrossRef]
- Leonard, B. Stranded. PERC Rep. 2022, 39, 9–11. [Google Scholar]
- U.S. Department of Agriculture. Conservation Reserve Enhancement Program. 2021. Available online: https://www.fsa.usda.gov/Assets/USDA-FSA-Public/usdafiles/Conservation/PDF/fsa_crep_factsheet_22.pdf (accessed on 10 July 2022).
Figure 1.
Higher wildfire hazard potential and poverty rates in high wildfire risk states.

Figure 2.
Poverty rate range in counties with moderate-to-high wildfire hazard potential.

Figure 3.
Higher wildfire hazard potential in combined Forest Service/First Street Foundation/U.S. Census Bureau datasets.
Figure 3.
Higher wildfire hazard potential in combined Forest Service/First Street Foundation/U.S. Census Bureau datasets.

Figure 4.
Higher-poverty-rate counties with the greatest concentration of housing units in Forest-Service-designated moderate-to-high risk areas.
Figure 4.
Higher-poverty-rate counties with the greatest concentration of housing units in Forest-Service-designated moderate-to-high risk areas.

Figure 5.
Higher poverty rate counties with the greatest concentration of housing units in Fire Factor moderate-to-high risk areas.
Figure 5.
Higher poverty rate counties with the greatest concentration of housing units in Fire Factor moderate-to-high risk areas.

Publisher’s Note: MDPI stays neutral with regard to jurisdictional claims in published maps and institutional affiliations. |
© 2022 by the authors. Licensee MDPI, Basel, Switzerland. This article is an open access article distributed under the terms and conditions of the Creative Commons Attribution (CC BY) license (https://creativecommons.org/licenses/by/4.0/).
Share and Cite
MDPI and ACS Style
Auer, M.R.; Hexamer, B.E. Income and Insurability as Factors in Wildfire Risk. Forests 2022, 13, 1130. https://doi.org/10.3390/f13071130
AMA Style
Auer MR, Hexamer BE. Income and Insurability as Factors in Wildfire Risk. Forests. 2022; 13(7):1130. https://doi.org/10.3390/f13071130
Chicago/Turabian StyleAuer, Matthew Robert, and Benjamin Evan Hexamer. 2022. "Income and Insurability as Factors in Wildfire Risk" Forests 13, no. 7: 1130. https://doi.org/10.3390/f13071130
Note that from the first issue of 2016, this journal uses article numbers instead of page numbers. See further details here.