
Recent Advances in Forest Insect Pests and Diseases Monitoring Using UAV-Based Data: A Systematic Review


Abstract
:1. Introduction
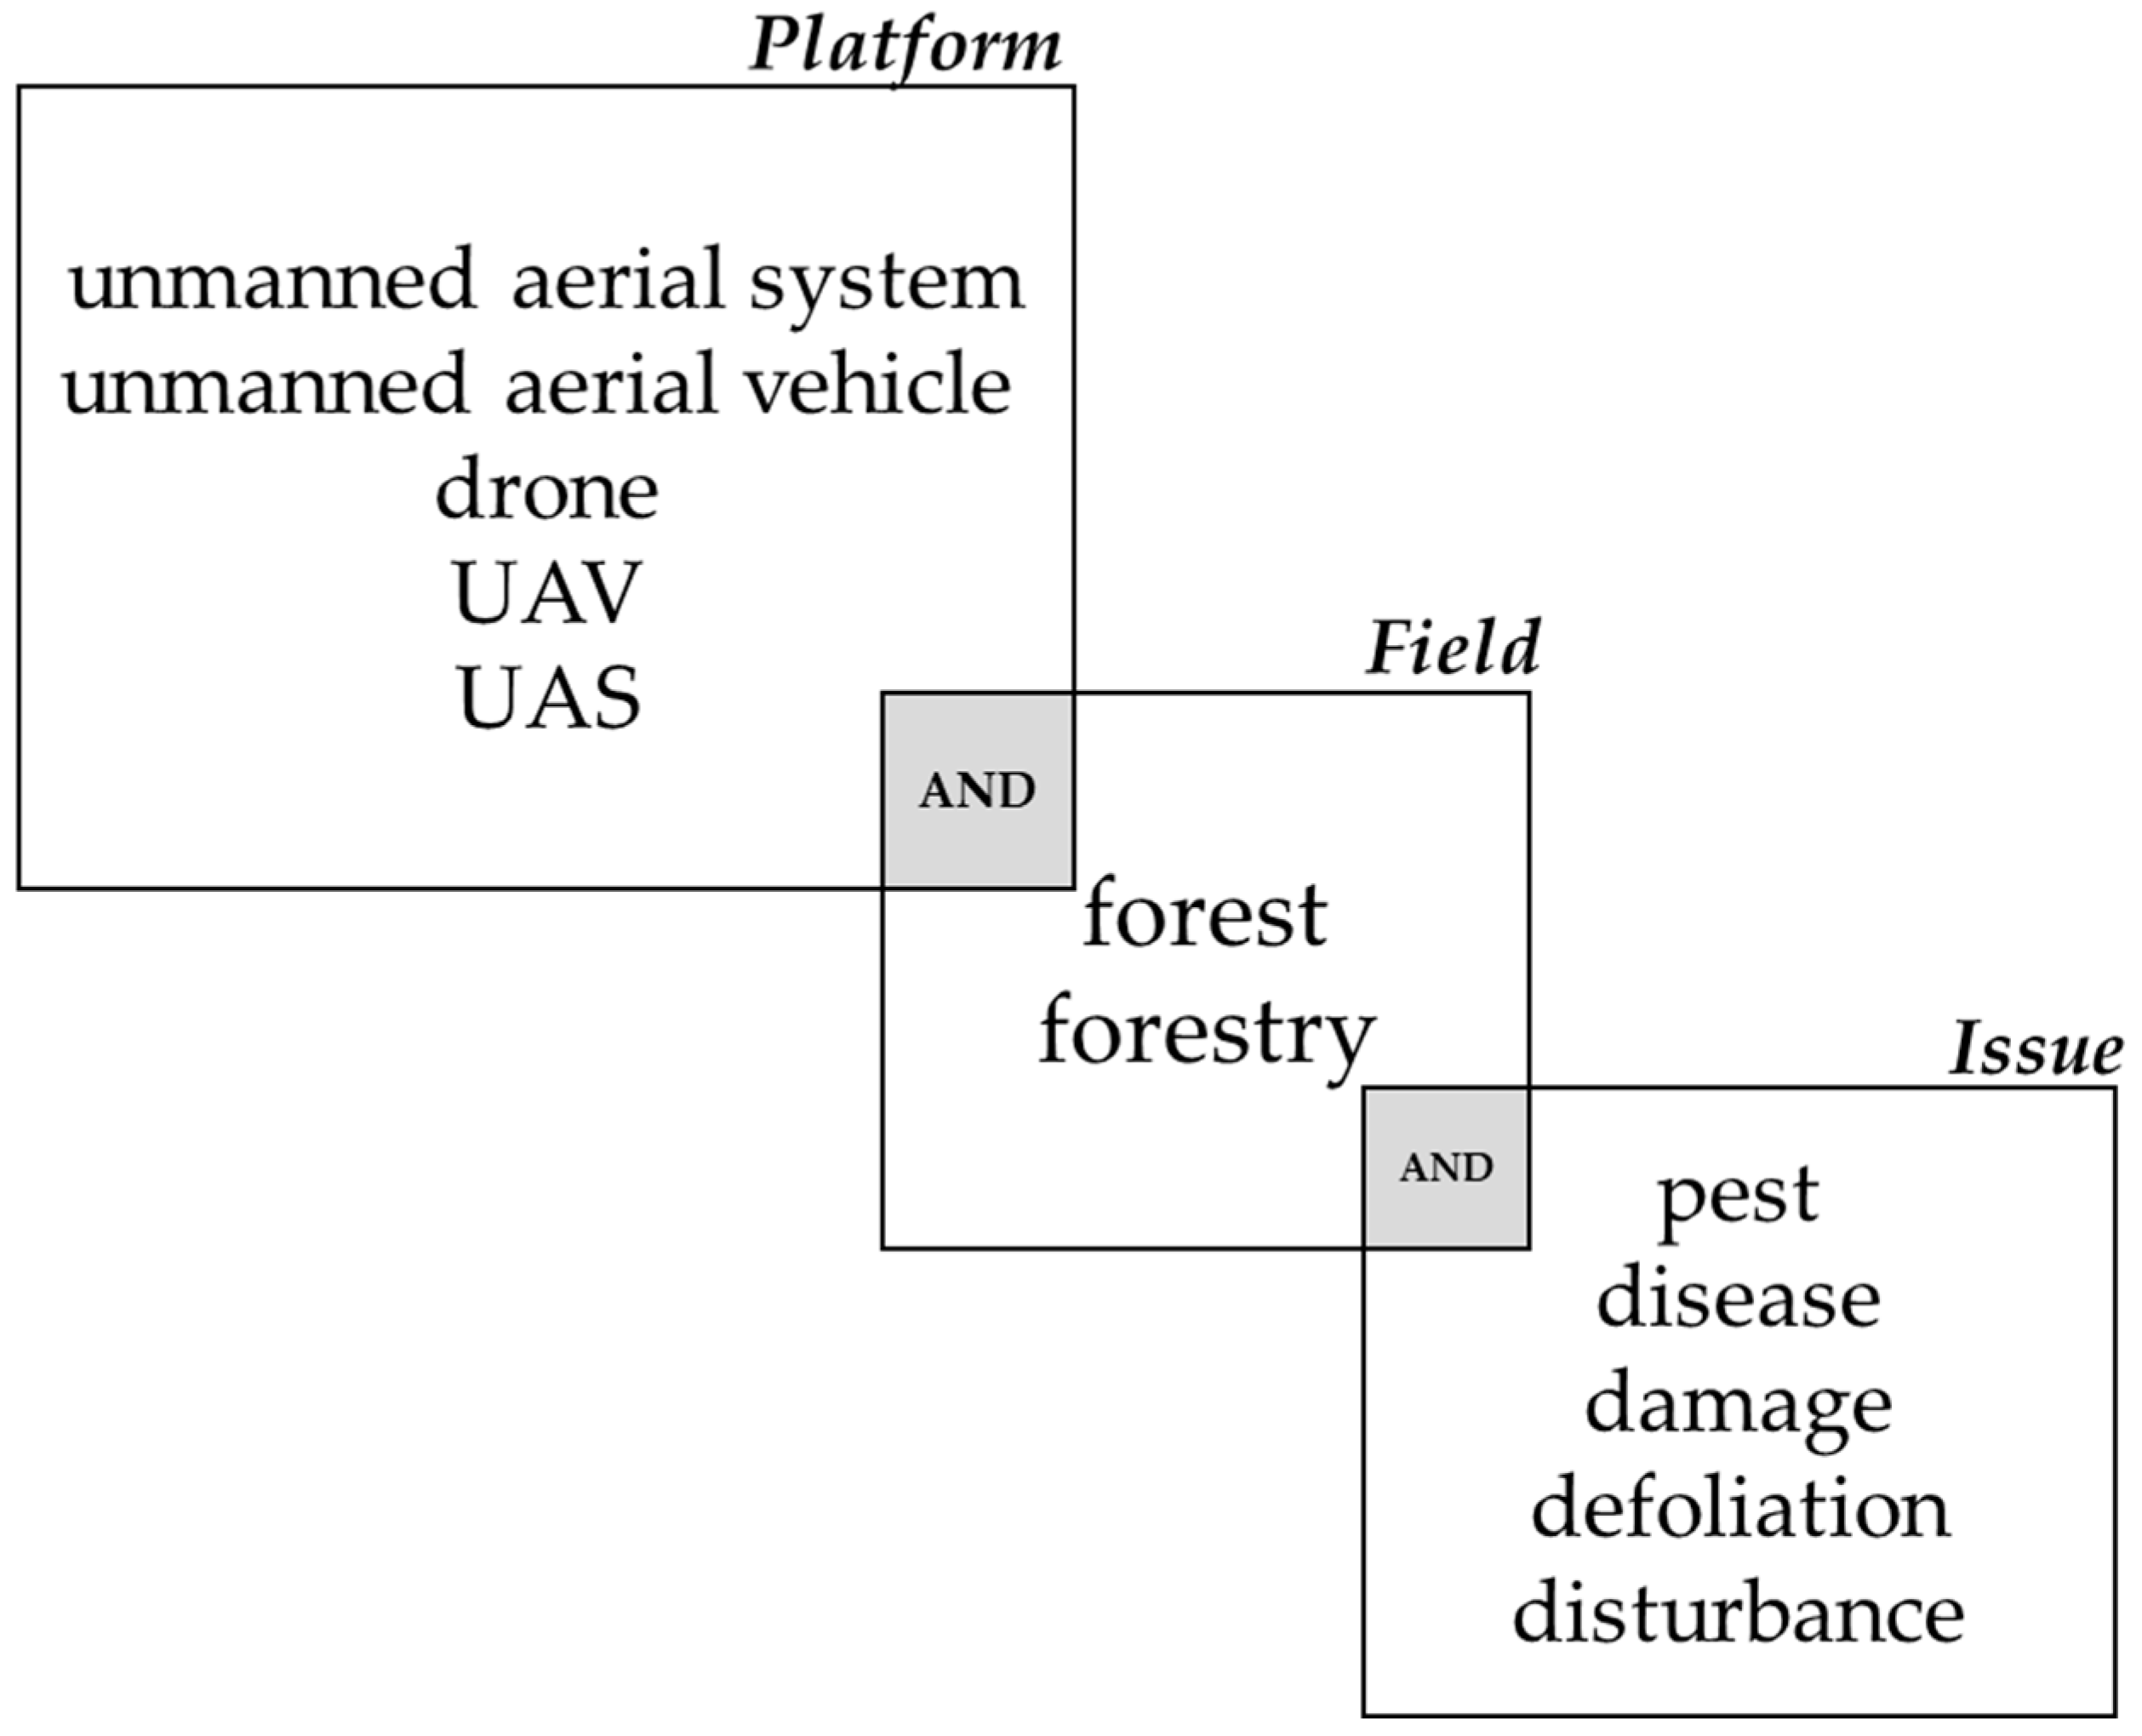
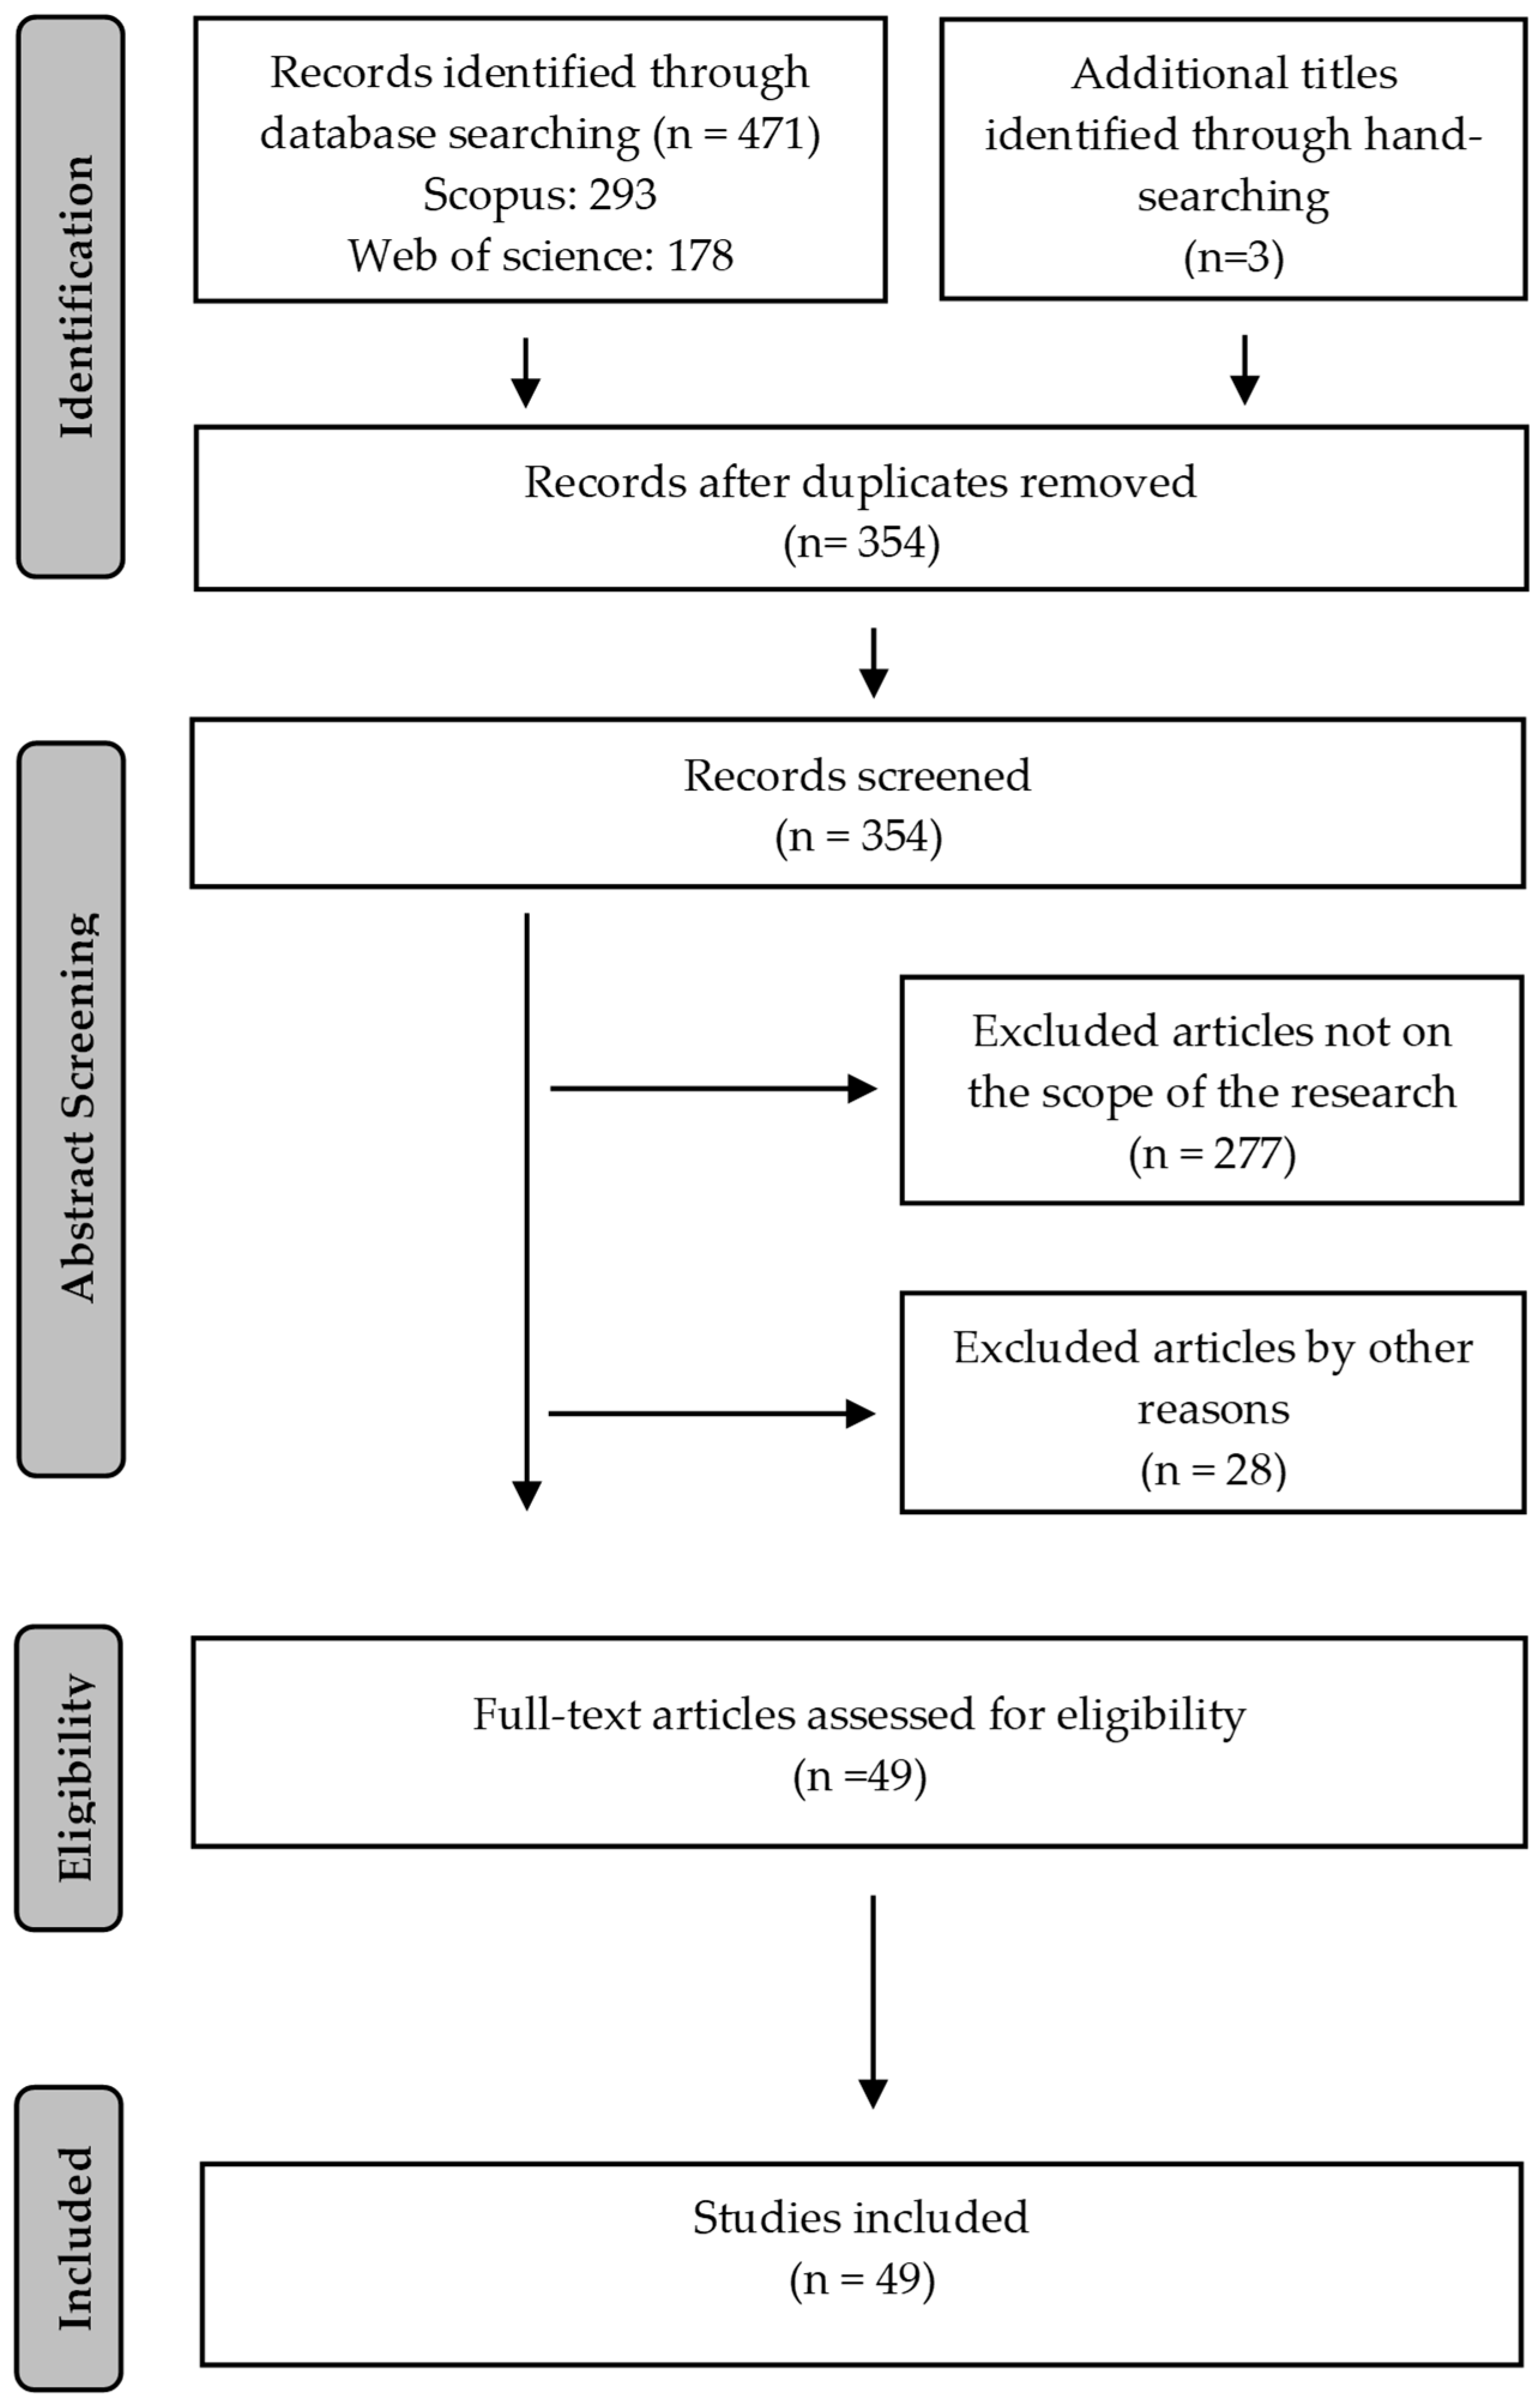
2. Methods
3. Results and Discussion
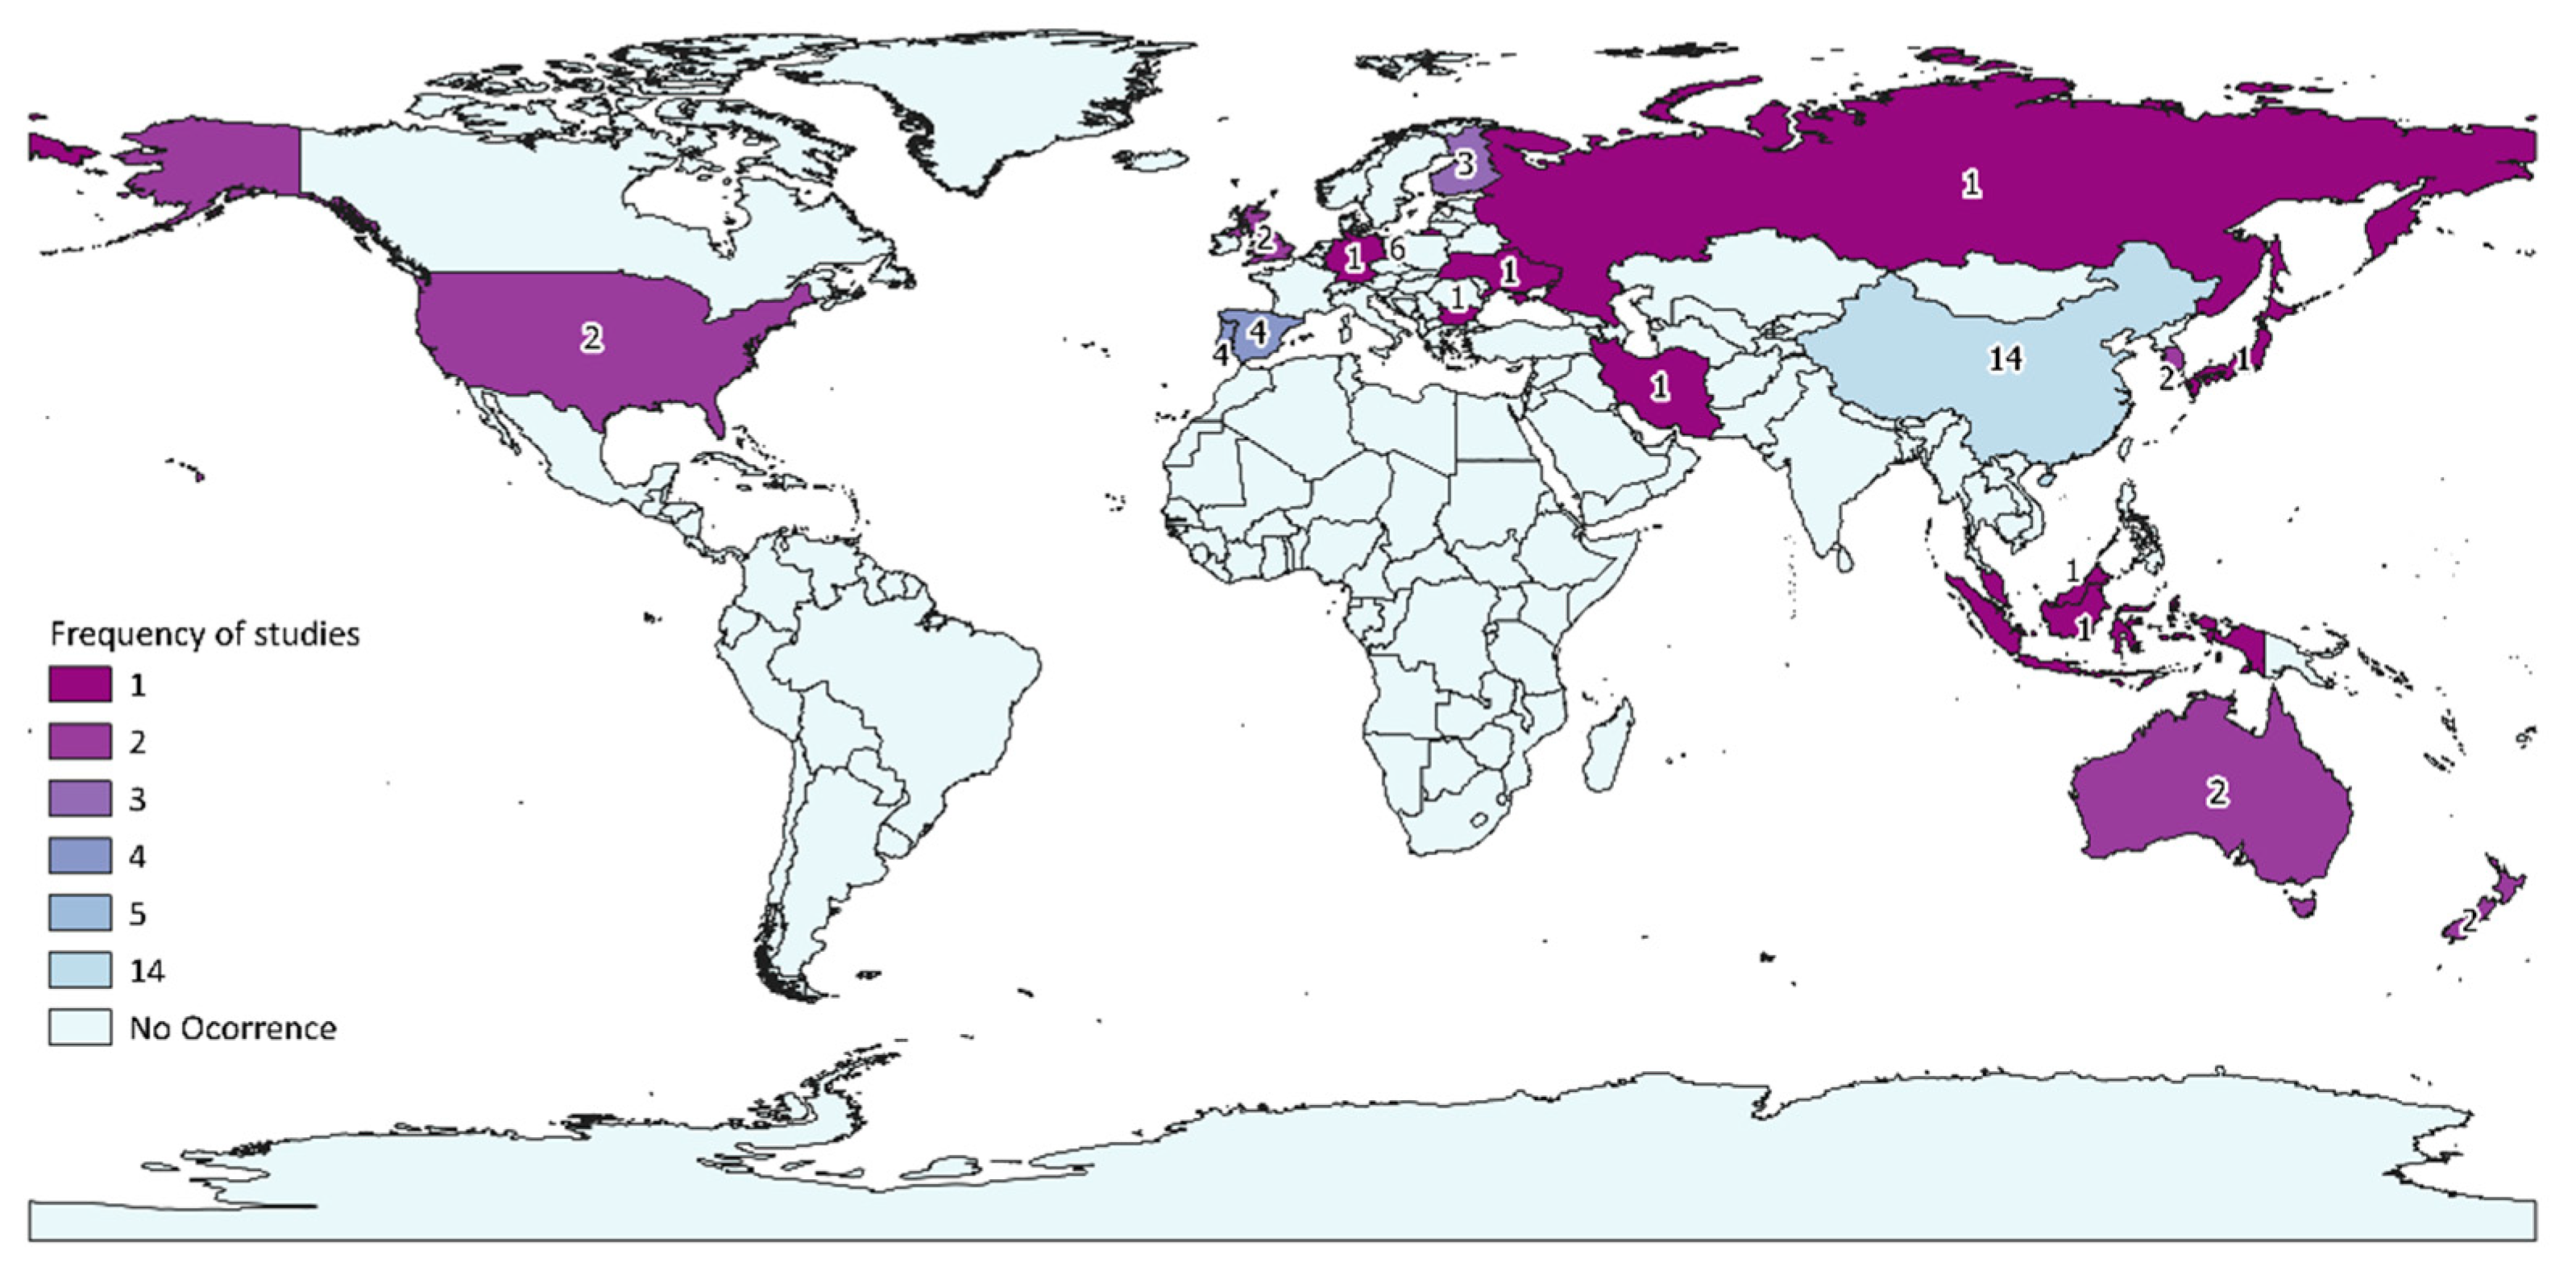
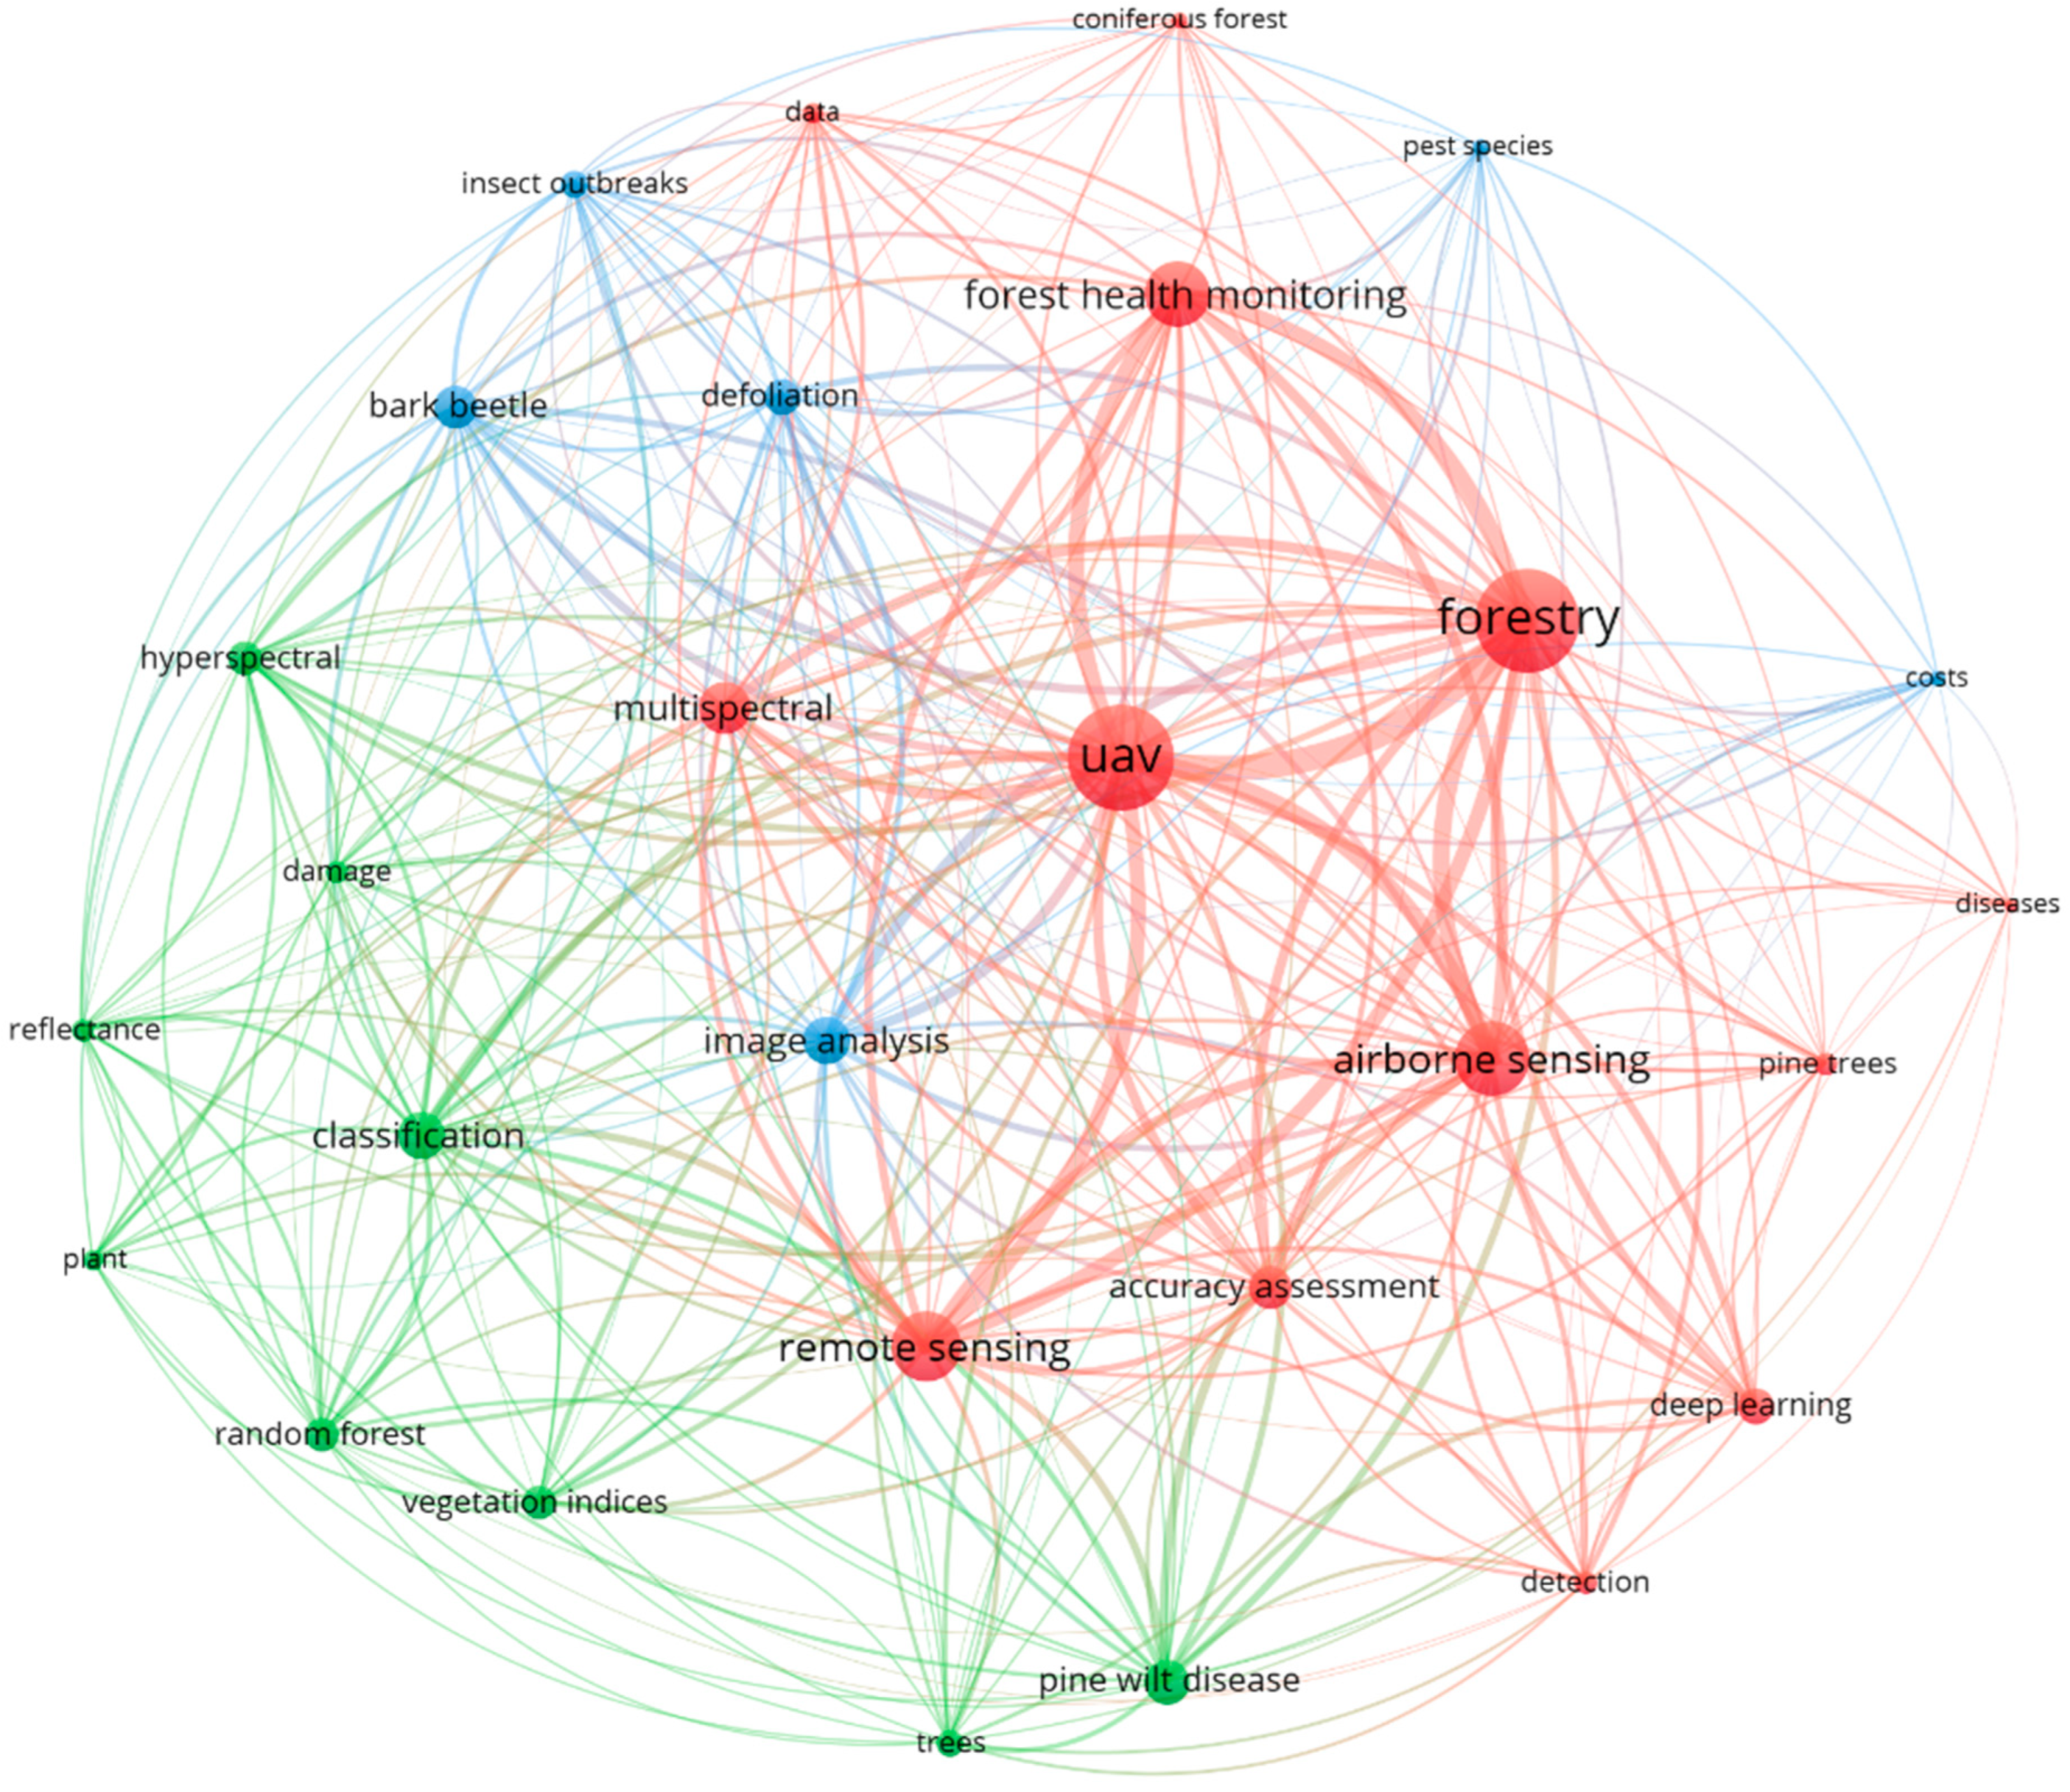
3.1. General Characterization of Selected Studies
3.2. Taxonomic Characterization
3.3. UAV and Sensor Types
3.3.1. UAV Types
3.3.2. Sensor Types
3.4. UAV Data Collection
3.4.1. Area Coverage
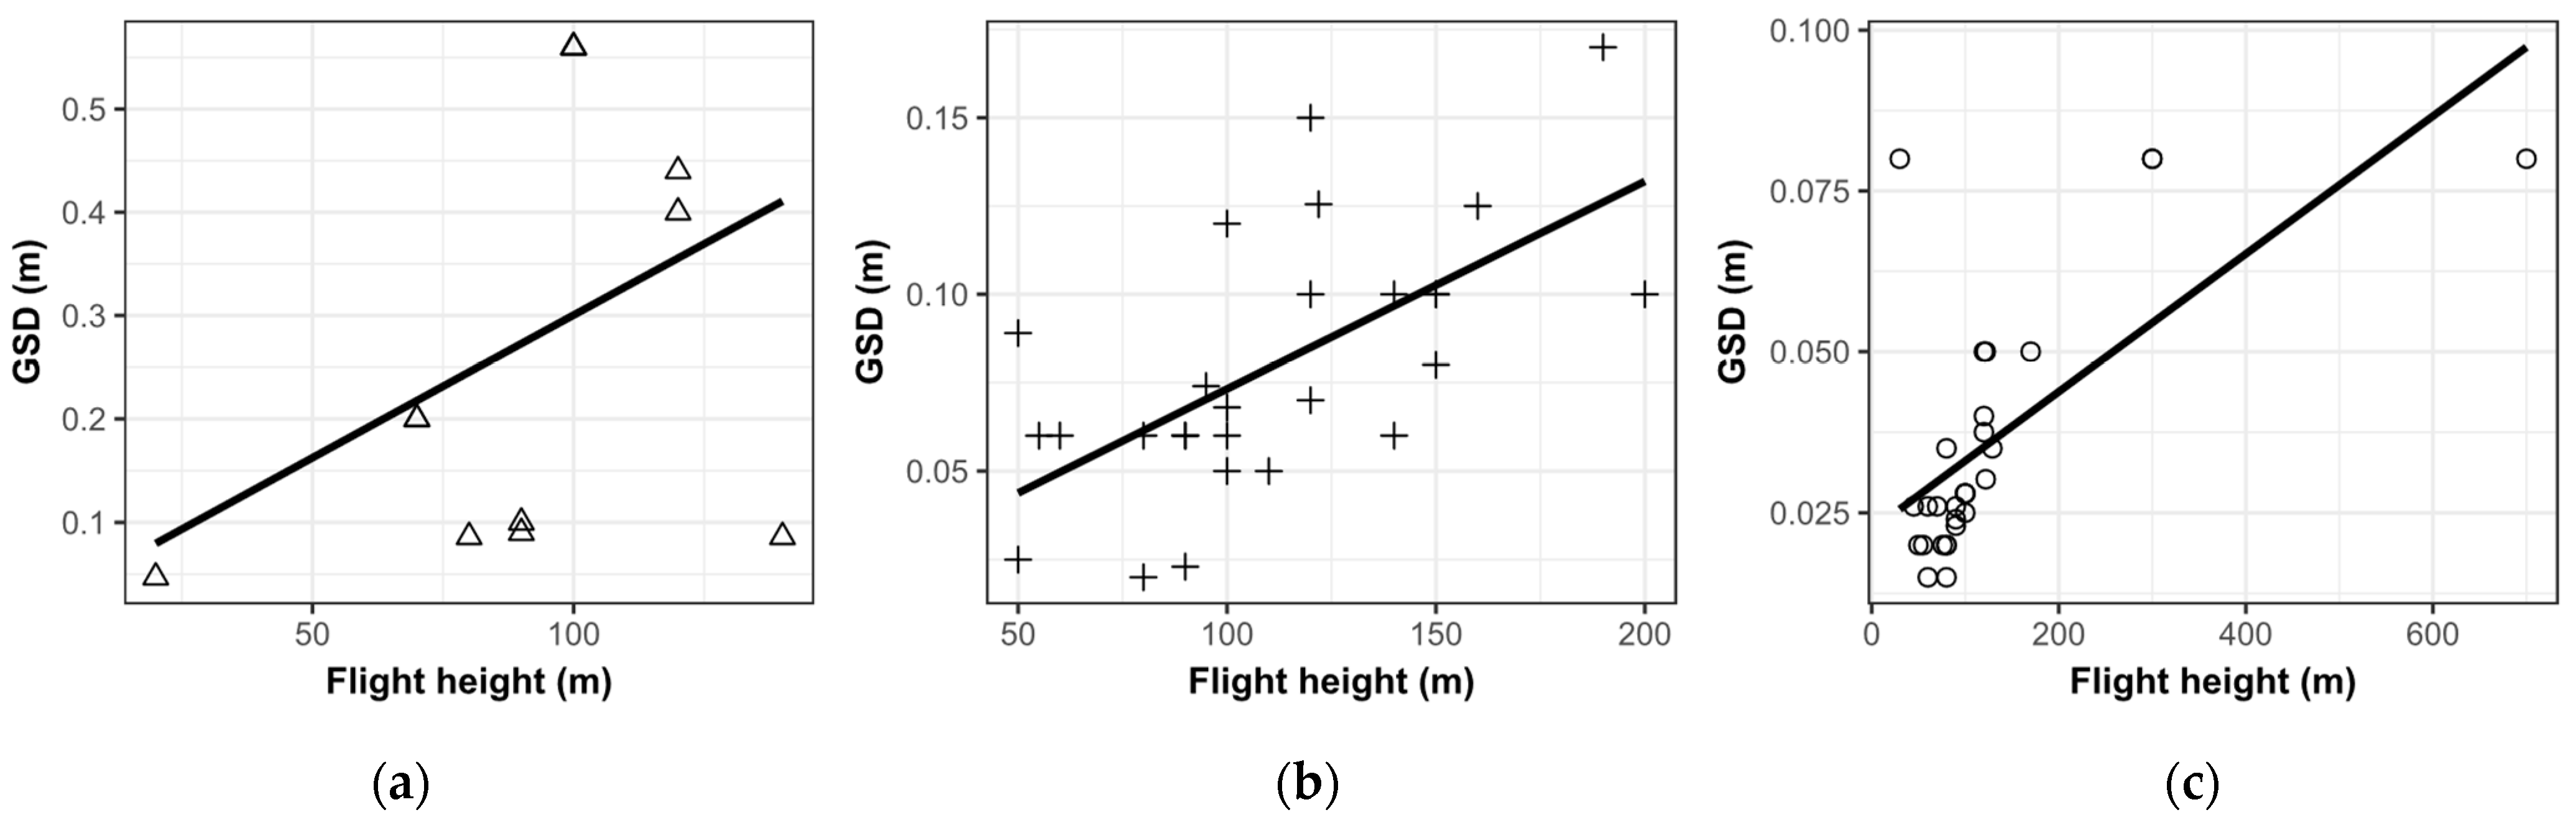
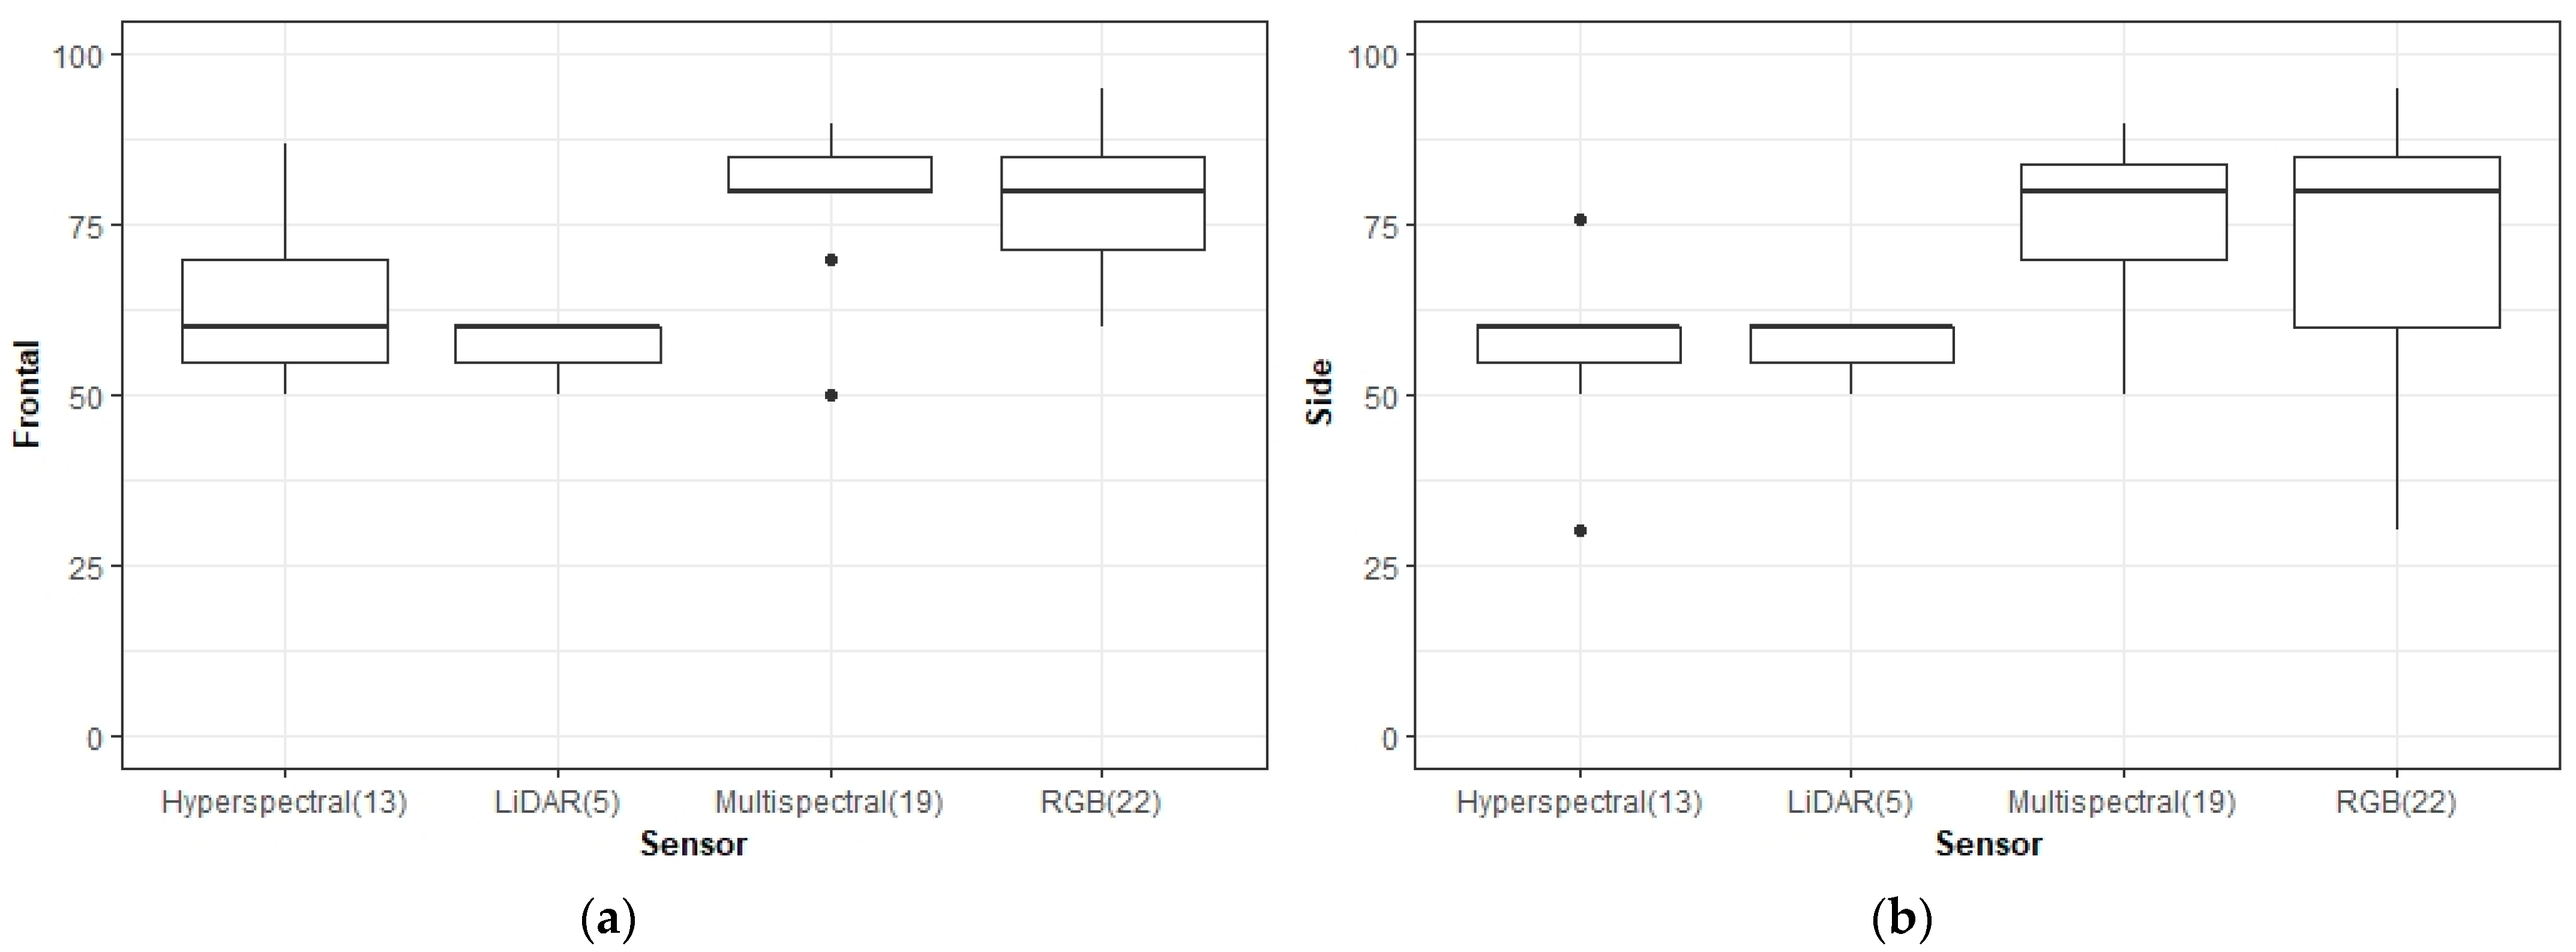
3.4.2. Technical Flight Parameters
3.4.3. Ancillary Field and Laboratory Data for UAV–FIPD
3.5. Data Processing and Analytical Methods
3.5.1. Spatial Unit Analysis
3.5.2. Segmentation of Single Tree Objects
3.5.3. Feature Extraction and Selection
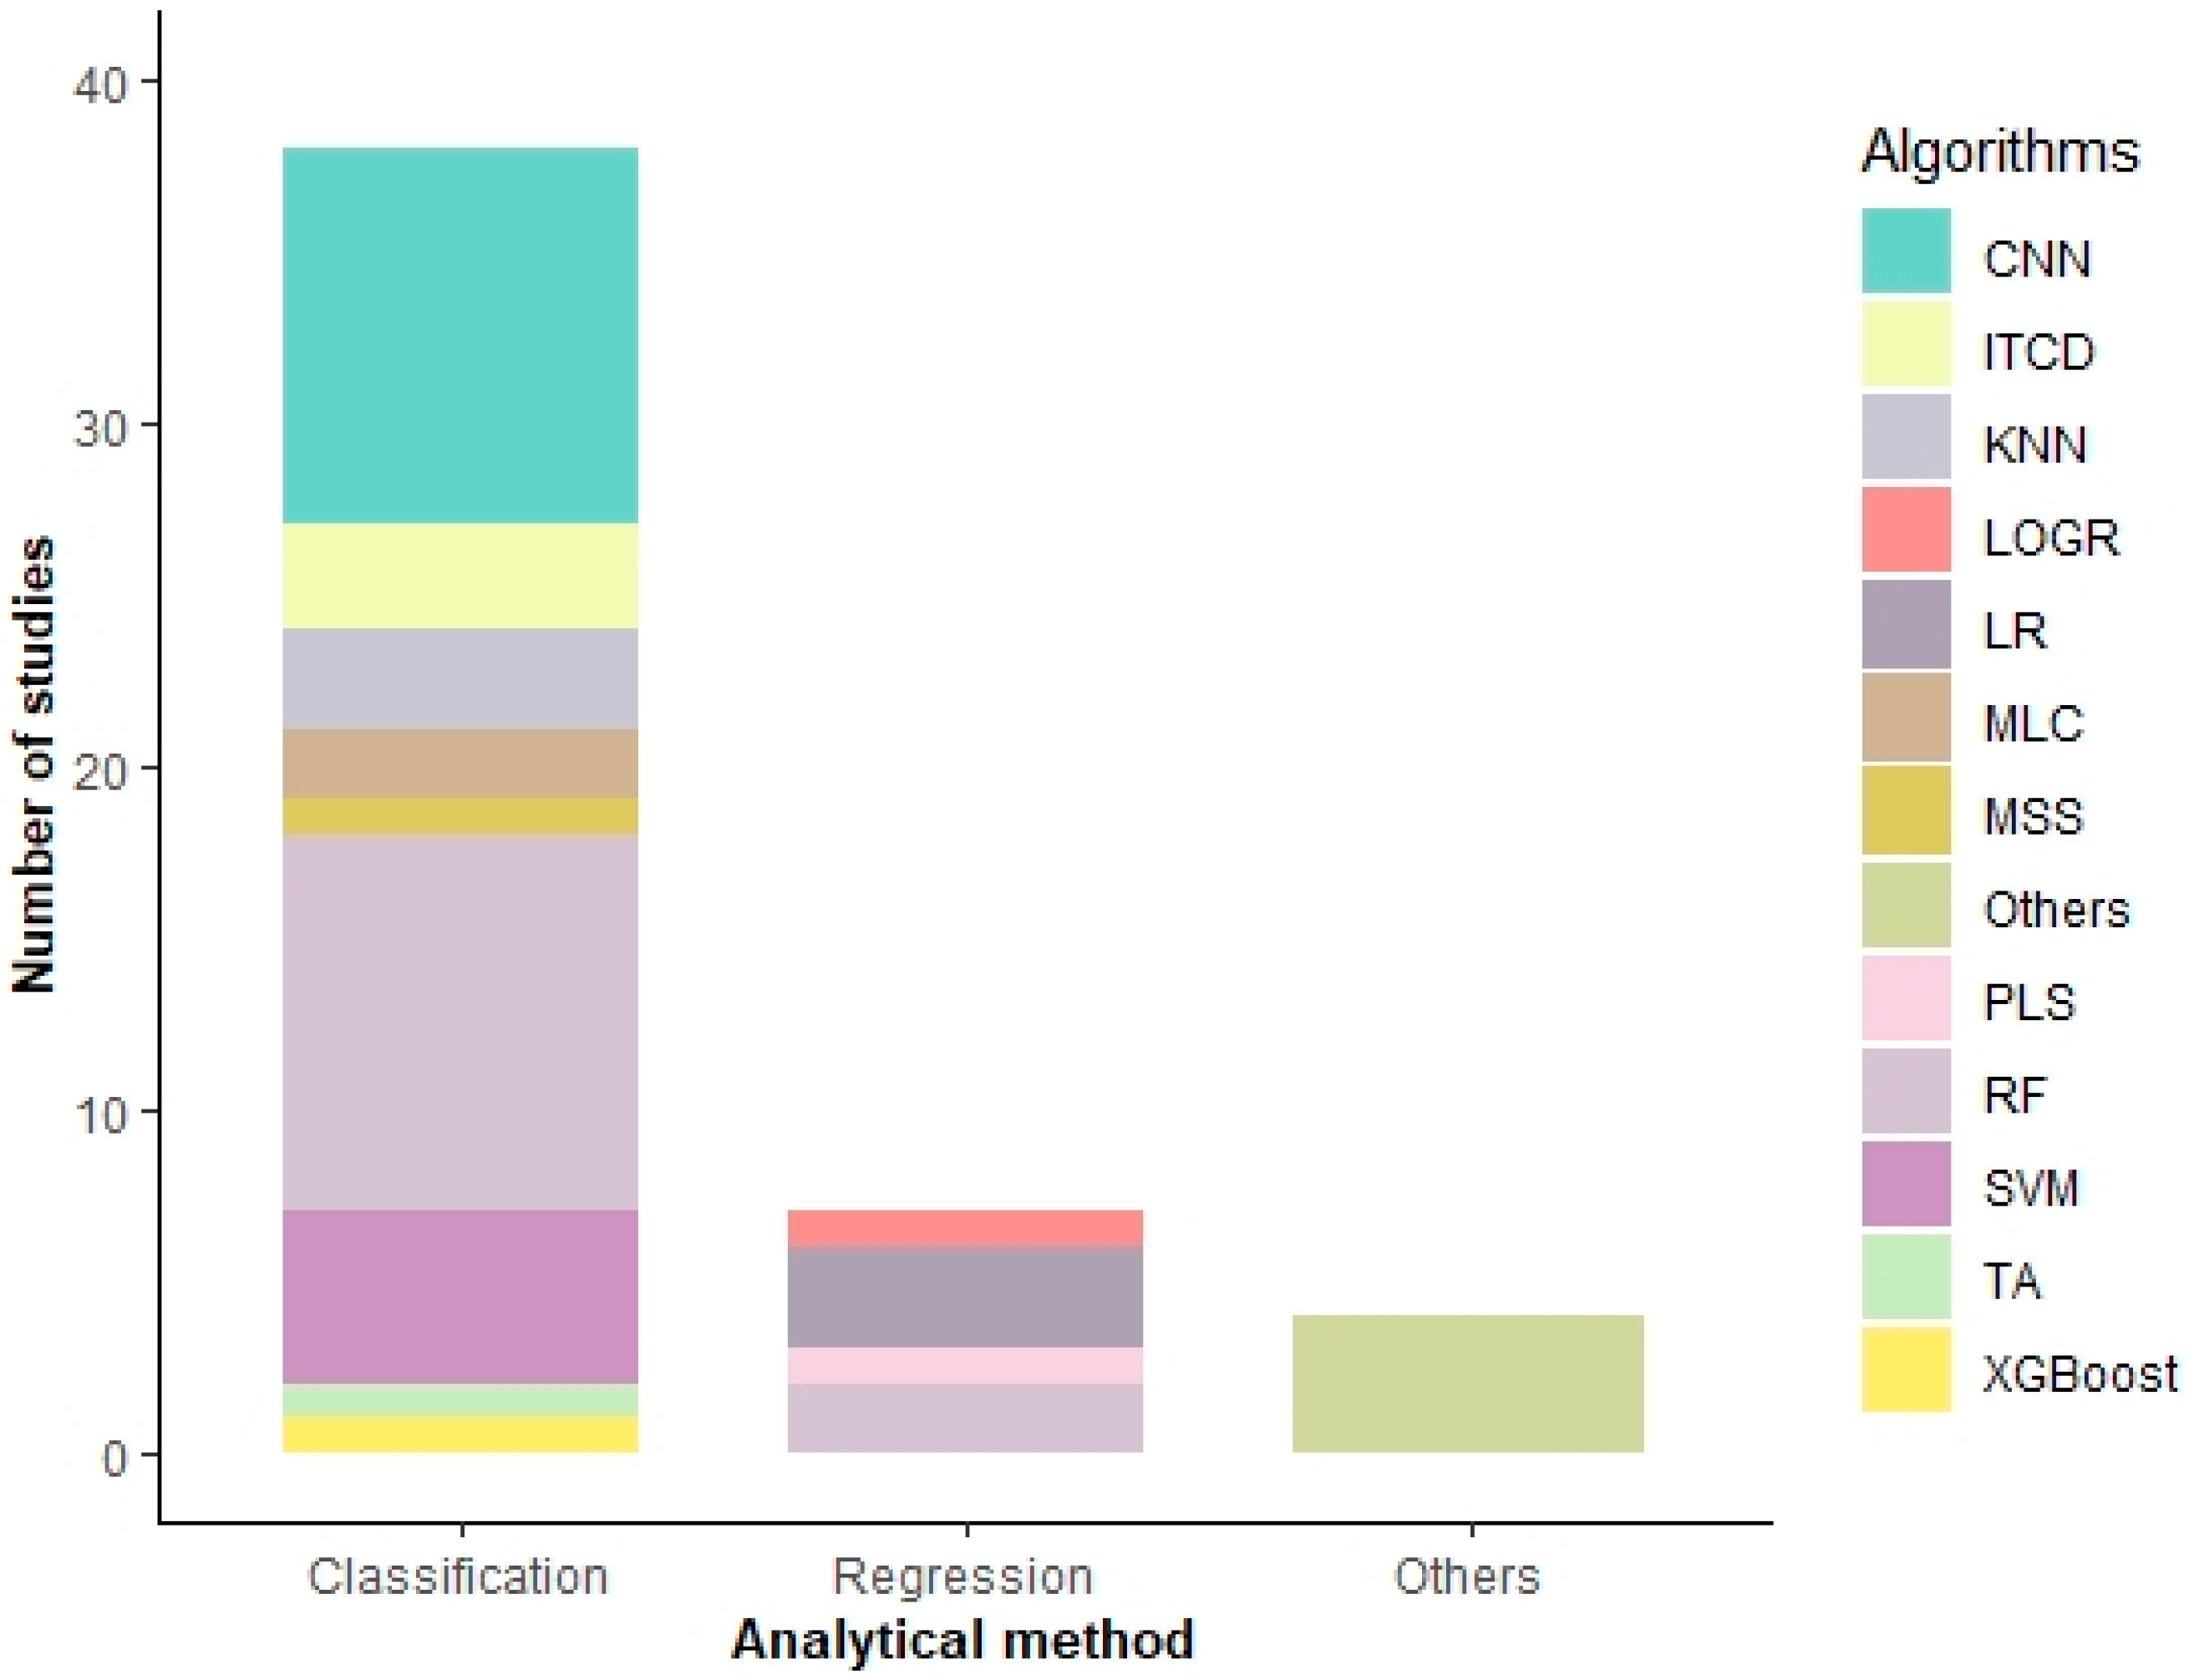
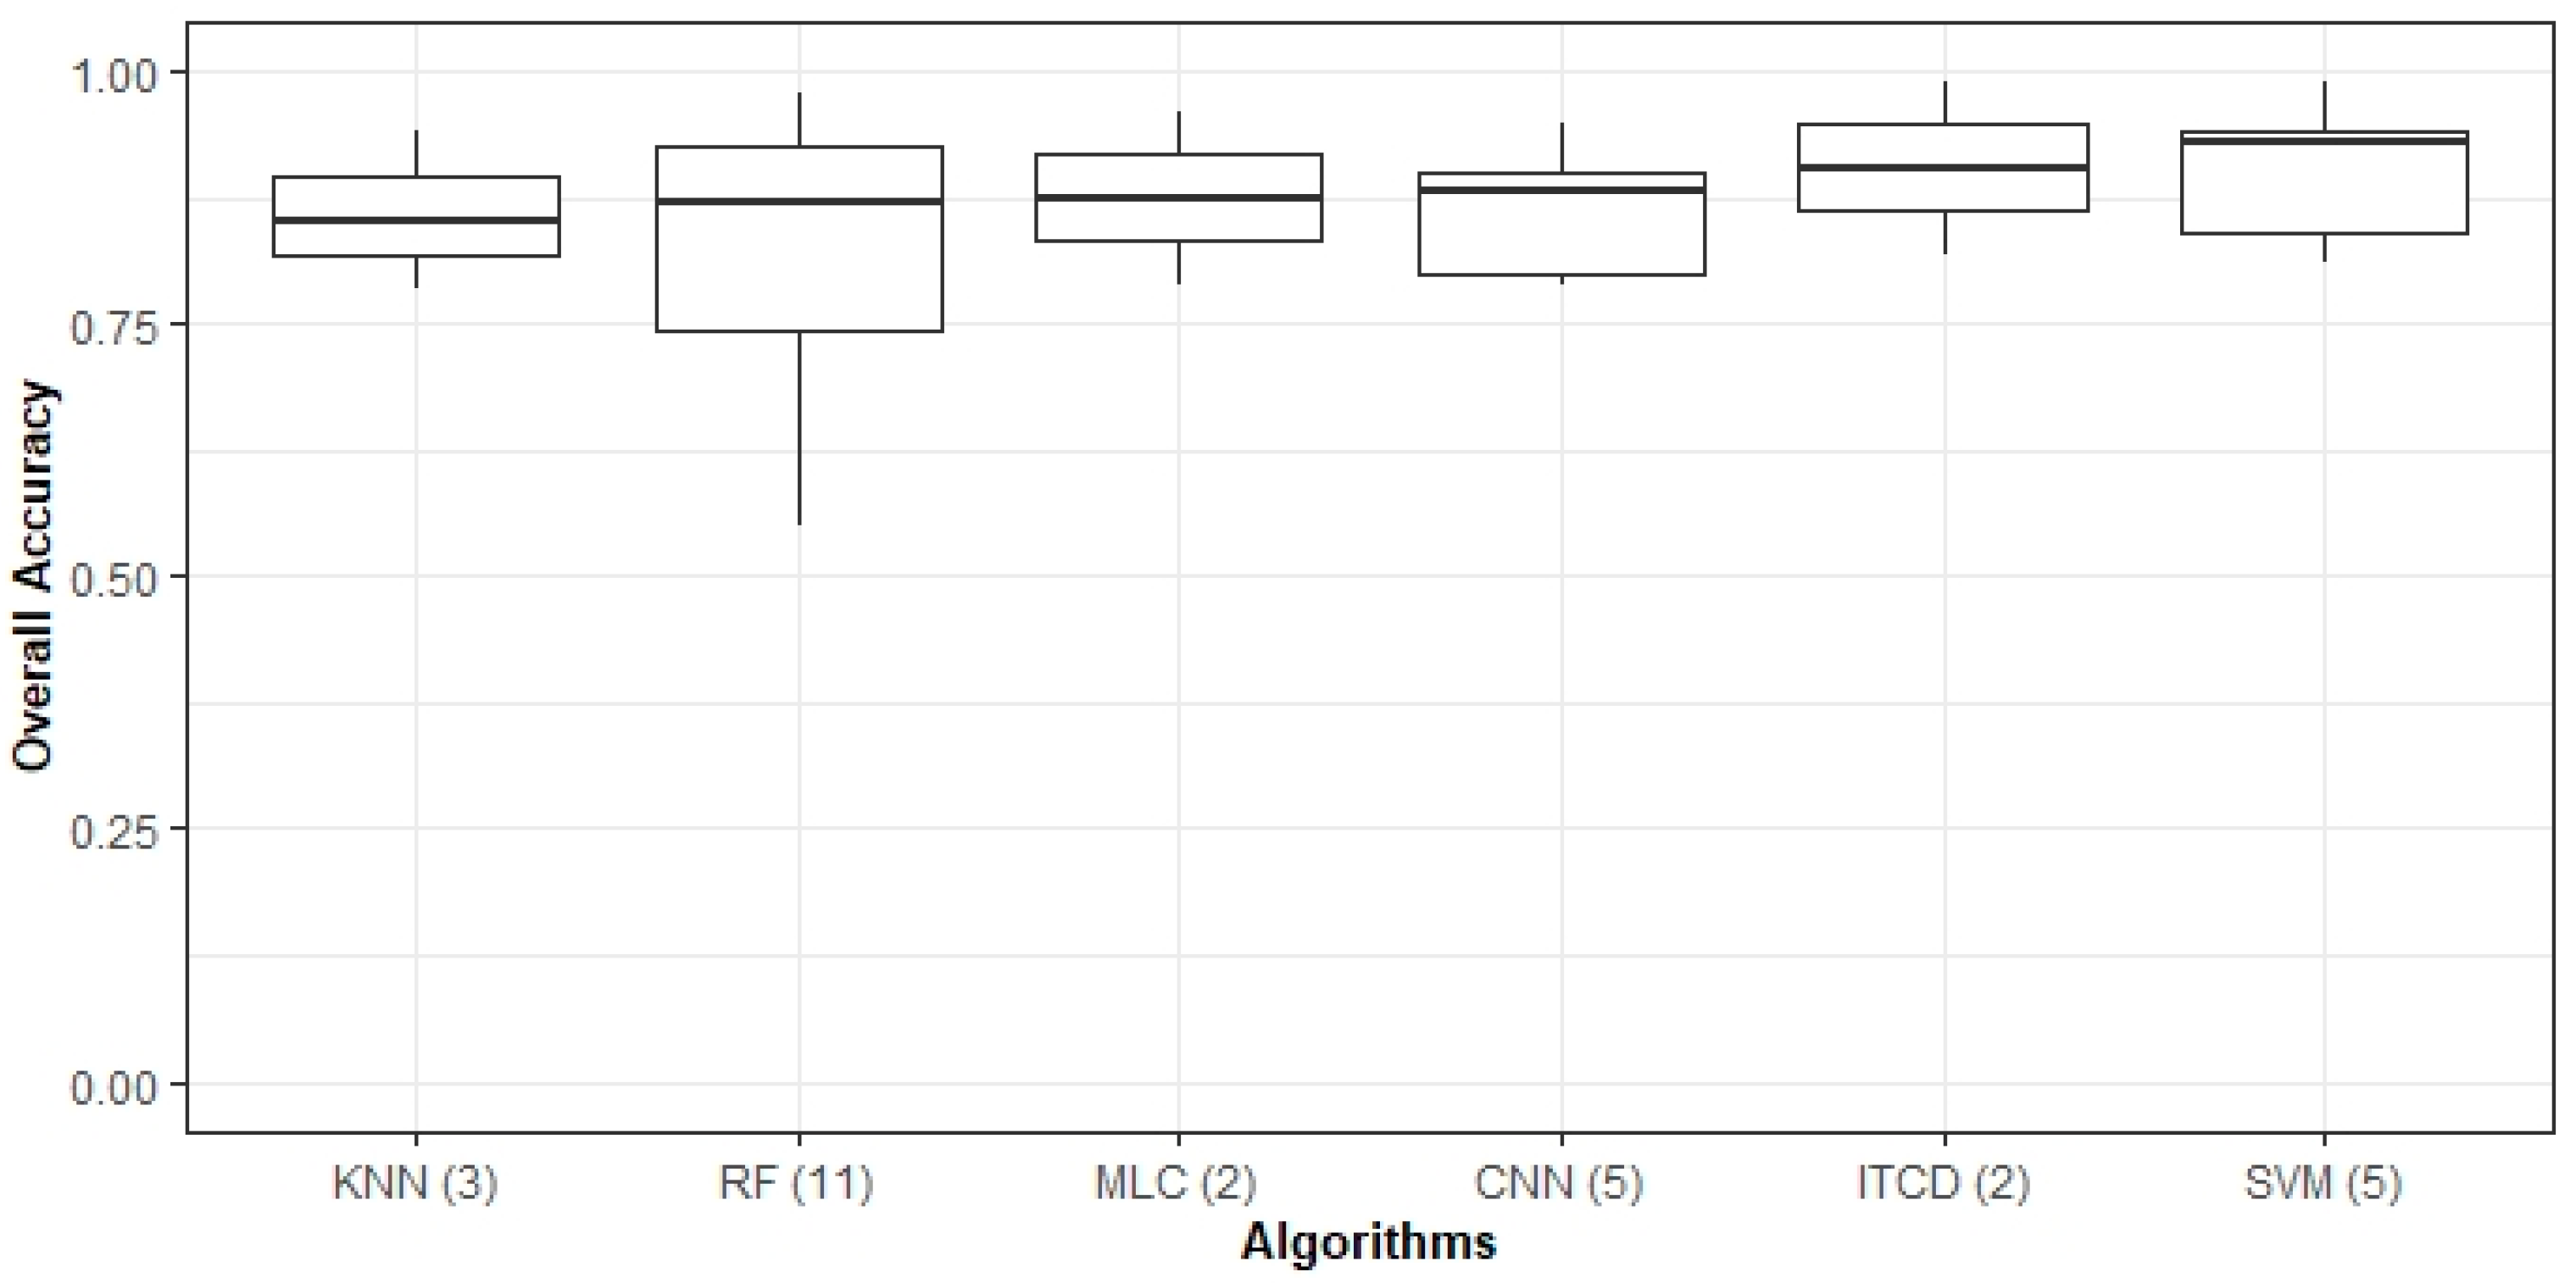
3.5.4. Analysis Type, Algorithms, and Overall Accuracy (OA)
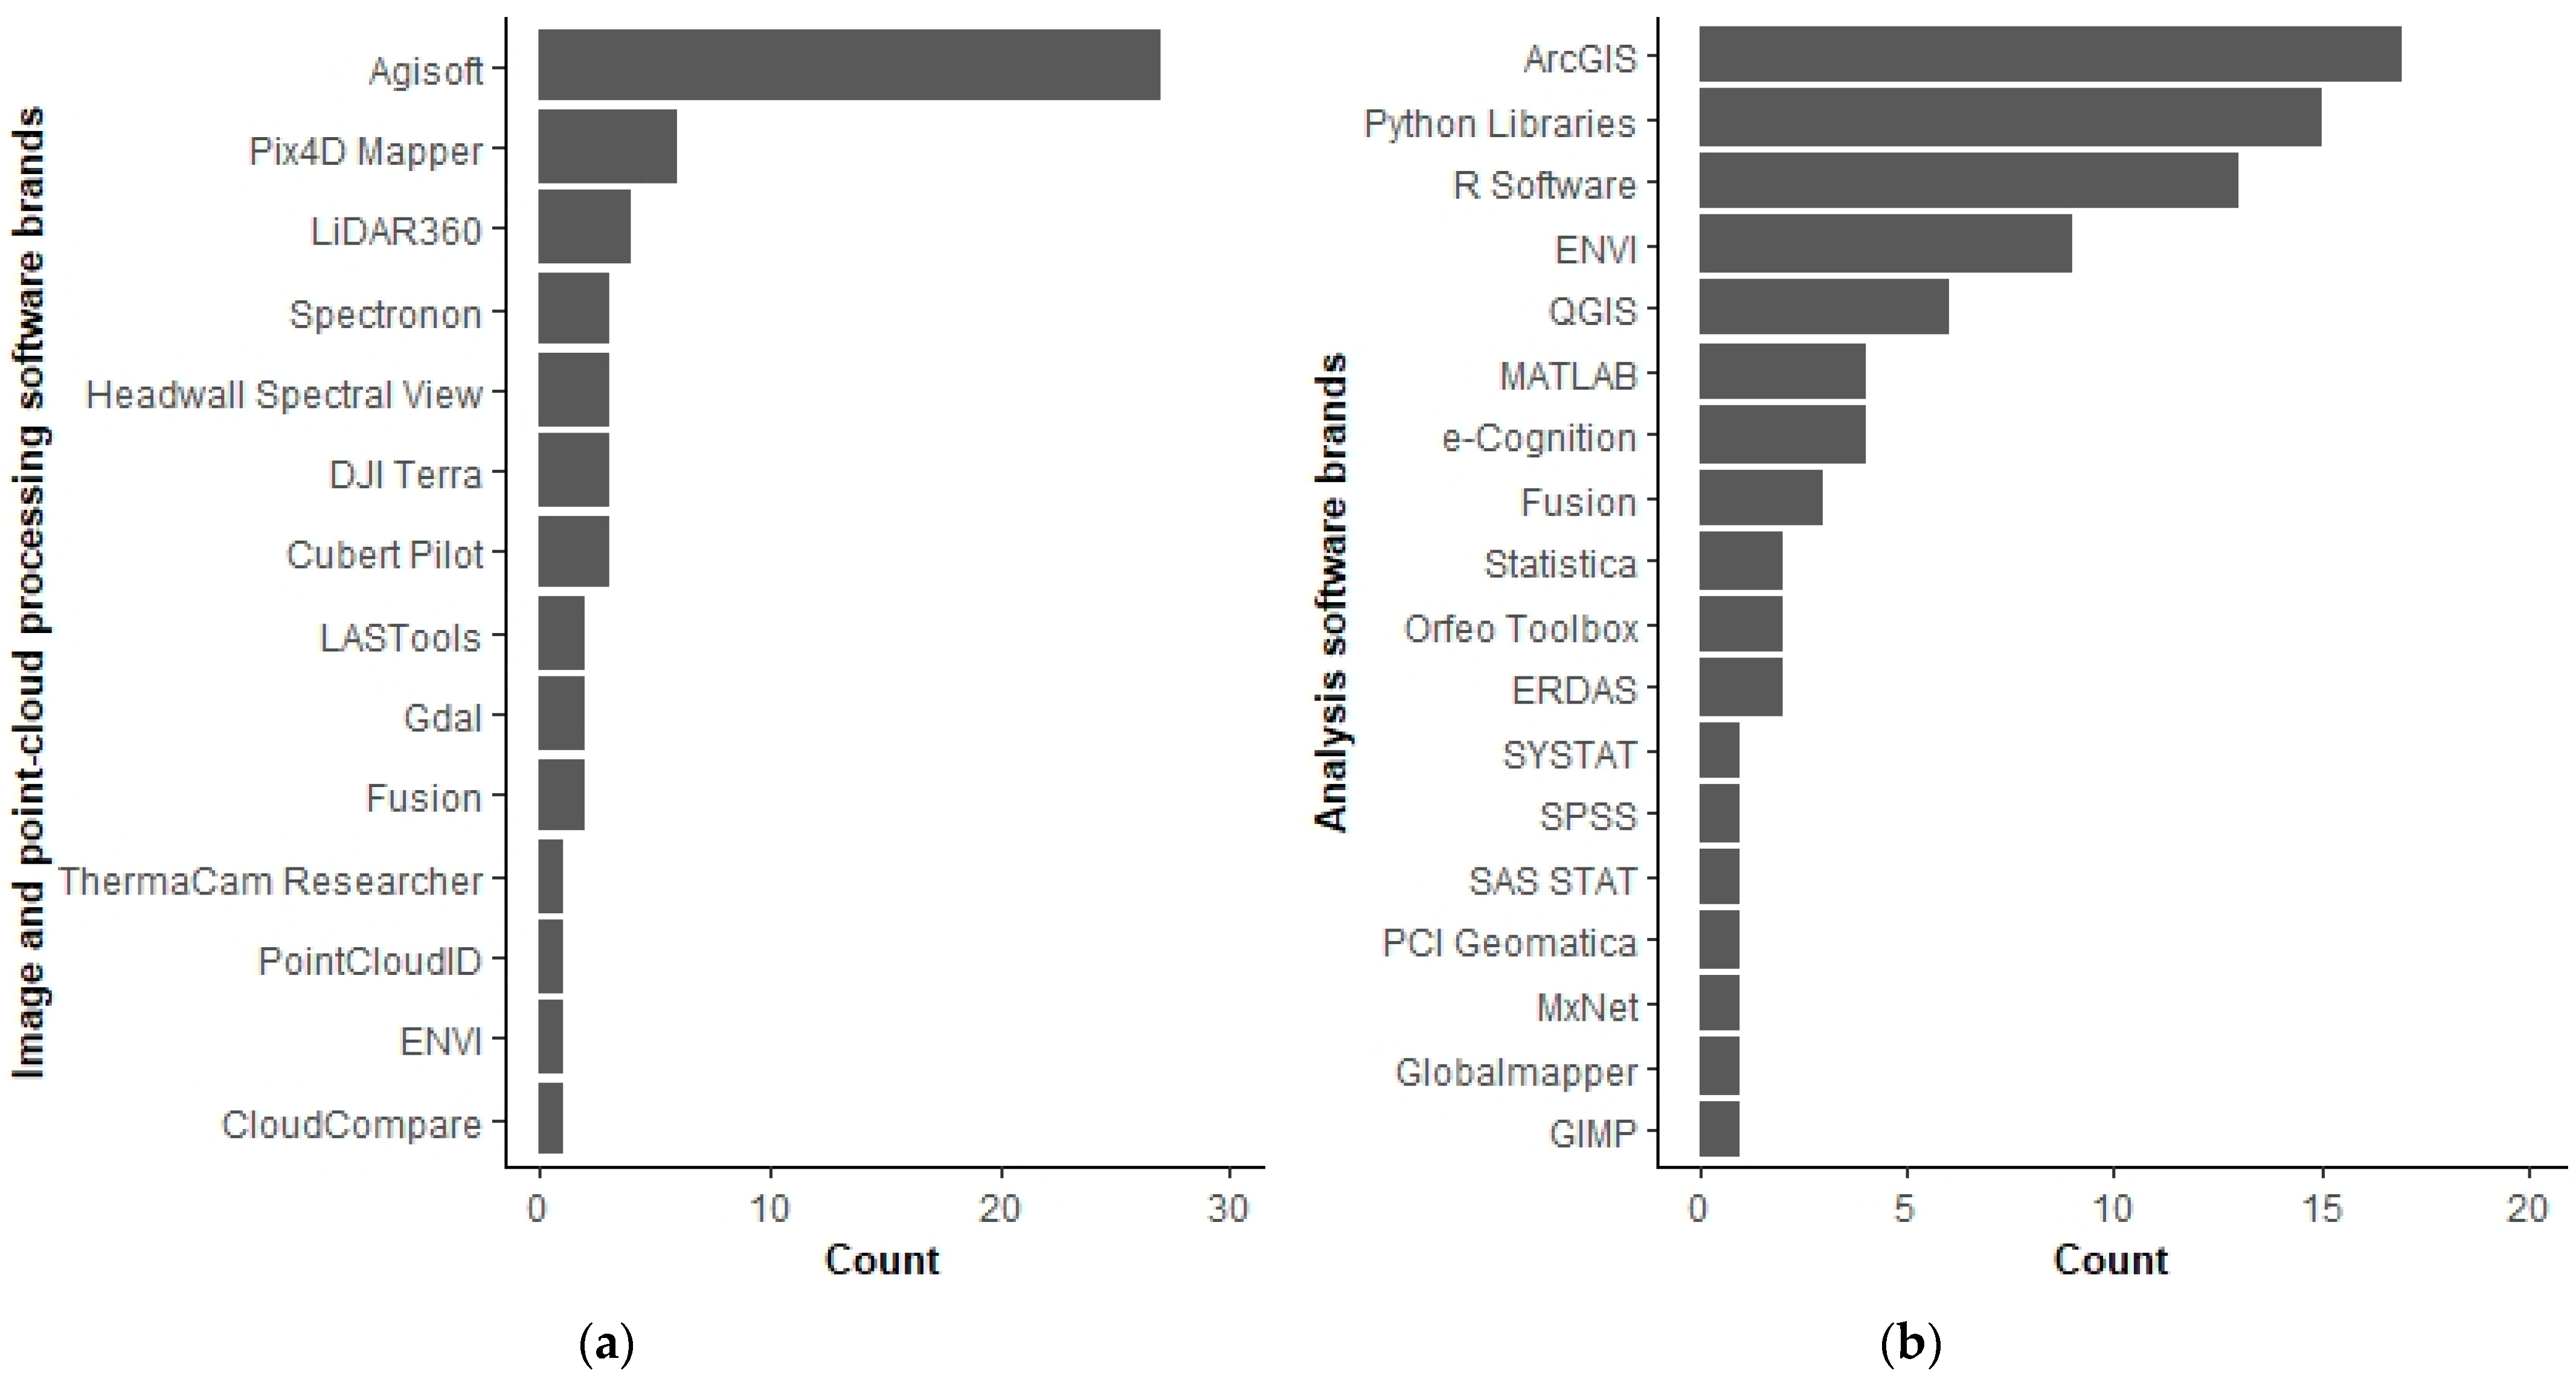
3.6. Pre-Processing and Analysis Software
4. Research Gaps, Challenges, and Further Research
5. Conclusions
Author Contributions
Funding
Institutional Review Board Statement
Informed Consent Statement
Data Availability Statement
Acknowledgments
Conflicts of Interest
References
- Anderegg, W.R.L.; Trugman, A.T.; Badgley, G.; Anderson, C.M.; Bartuska, A.; Ciais, P.; Cullenward, D.; Field, C.B.; Freeman, J.; Goetz, S.J.; et al. Climate-Driven Risks to the Climate Mitigation Potential of Forests. Science 2020, 368, eaaz7005. [Google Scholar] [CrossRef] [PubMed]
- FAO. Assessing Forest Degradation: Towards the Development of Globally Applicable Guidlines; Forest Resources Assessment Working Paper 177; Food and Agriculture Organization of the United Nations: Rome, Italy, 2011. [Google Scholar]
- Canadell, J.G.; Raupach, M.R. Managing Forests for Climate Change Mitigation. Science 2008, 320, 1456–1457. [Google Scholar] [CrossRef] [PubMed] [Green Version]
- FAO. Climate Change Guidelines for Forest Managers; FAO Forestry Paper 172; Food and Agriculture Organization of the United Nations: Rome, Italy, 2013; p. 123. [Google Scholar]
- FAO. Managing Forests for Climate Change; Food and Agriculture Organization of the United Nations: Rome, Italy, 2010; p. 20. [Google Scholar]
- Dale, V.; JOYCE, L.; Mcnulty, S.; Neilson, R.; Ayres, M.; Flannigan, M.; Hanson, P.; Irland, L.; Lugo, A.; PETERSON, C.; et al. Climate Change and Forest Disturbances. BioScience 2001, 51, 723–734. [Google Scholar] [CrossRef] [Green Version]
- Senf, C.; Buras, A.; Zang, C.S.; Rammig, A.; Seidl, R. Excess Forest Mortality Is Consistently Linked to Drought across Europe. Nat. Commun. 2020, 11, 6200. [Google Scholar] [CrossRef]
- Seidl, R.; Spies, T.A.; Peterson, D.L.; Stephens, S.L.; Hicke, J.A. Searching for Resilience: Addressing the Impacts of Changing Disturbance Regimes on Forest Ecosystem Services. J. Appl. Ecol. 2016, 53, 120–129. [Google Scholar] [CrossRef] [Green Version]
- Koricheva, J.; Castagneyrol, B. Science Direct Responses of Forest Insect Pests to Climate Change: Not so Simple. Curr. Opin. Insect Sci. 2019, 35, 103–108. [Google Scholar] [CrossRef]
- Raffa, K.F.; Aukema, B.H.; Bentz, B.J.; Carroll, A.L.; Hicke, J.A.; Turner, M.G.; Romme, W.H. Cross-Scale Drivers of Natural Disturbances Prone to Anthropogenic Amplification: The Dynamics of Bark Beetle Eruptions. BioScience 2008, 58, 501–517. [Google Scholar] [CrossRef] [Green Version]
- Lausch, A.; Borg, E.; Bumberger, J.; Dietrich, P.; Heurich, M.; Huth, A.; Jung, A.; Klenke, R.; Knapp, S.; Mollenhauer, H.; et al. Understanding Forest Health with Remote Sensing, Part III: Requirements for a Scalable Multi-Source Forest Health Monitoring Network Based on Data Science Approaches. Remote Sens. 2018, 10, 1120. [Google Scholar] [CrossRef] [Green Version]
- Brovkina, O.; Cienciala, E.; Surový, P.; Janata, P. Unmanned Aerial Vehicles (UAV) for Assessment of Qualitative Classification of Norway Spruce in Temperate Forest Stands. Geo-Spat. Inf. Sci. 2018, 21, 12–20. [Google Scholar] [CrossRef] [Green Version]
- Lausch, A.; Heurich, M.; Gordalla, D.; Dobner, H.J.; Gwillym-Margianto, S.; Salbach, C. Forecasting Potential Bark Beetle Outbreaks Based on Spruce Forest Vitality Using Hyperspectral Remote-Sensing Techniques at Different Scales. For. Ecol. Manag. 2013, 308, 76–89. [Google Scholar] [CrossRef]
- Gómez, C.; Alejandro, P.; Hermosilla, T.; Montes, F.; Pascual, C.; Ruiz, L.Á.; Álvarez-Taboada, F.; Tanase, M.A.; Valbuena, R. Remote Sensing for the Spanish Forests in the 21st century: A Review of Advances, Needs, and Opportunities. For. Syst. 2019, 28, eR001. [Google Scholar] [CrossRef]
- Dash, J.P.; Watt, M.S.; Pearse, G.D.; Heaphy, M.; Dungey, H.S. Assessing Very High Resolution UAV Imagery for Monitoring Forest Health during a Simulated Disease Outbreak. ISPRS J. Photogramm. Remote Sens. 2017, 131, 1–14. [Google Scholar] [CrossRef]
- Guimarães, N.; Pádua, L.; Marques, P.; Silva, N.; Peres, E.; Sousa, J.J. Forestry Remote Sensing from Unmanned Aerial Vehicles: A Review Focusing on the Data, Processing and Potentialities. Remote Sens. 2020, 12, 1046. [Google Scholar] [CrossRef] [Green Version]
- Poley, L.G.; McDermid, G.J. A Systematic Review of the Factors Influencing the Estimation of Vegetation Aboveground Biomass Using Unmanned Aerial Systems. Remote Sens. 2020, 12, 1052. [Google Scholar] [CrossRef] [Green Version]
- Klosterman, S.; Richardson, A. Observing Spring and Fall Phenology in a Deciduous Forest with Aerial Drone Imagery. Sensors 2017, 17, 2852. [Google Scholar] [CrossRef] [Green Version]
- Hall, R.J.; Castilla, G.; White, J.C.; Cooke, B.J.; Skakun, R.S. Remote Sensing of Forest Pest Damage: A Review and Lessons Learned from a Canadian Perspective. Can. Entomol. 2016, 148, S296–S356. [Google Scholar] [CrossRef]
- Pádua, L.; Vanko, J.; Hruška, J.; Adão, T.; Sousa, J.J.; Peres, E.; Morais, R. UAS, Sensors, and Data Processing in Agroforestry: A Review towards Practical Applications. Int. J. Remote Sens. 2017, 38, 2349–2391. [Google Scholar] [CrossRef]
- Rullan-Silva, C.D.; Olthoff, A.E.; Delgado de la Mata, J.A.; Pajares-Alonso, J.A. Remote Monitoring of Forest Insect Defoliation. A Review. For. Syst. 2013, 22, 377–391. [Google Scholar] [CrossRef] [Green Version]
- Yao, H.; Qin, R.; Chen, X. Unmanned Aerial Vehicle for Remote Sensing Applications—A Review. Remote Sens. 2019, 11, 1443. [Google Scholar] [CrossRef] [Green Version]
- Manfreda, S.; McCabe, M.; Miller, P.; Lucas, R.; Pajuelo Madrigal, V.; Mallinis, G.; Ben Dor, E.; Helman, D.; Estes, L.; Ciraolo, G.; et al. On the Use of Unmanned Aerial Systems for Environmental Monitoring. Remote Sens. 2018, 10, 641. [Google Scholar] [CrossRef] [Green Version]
- Torresan, C.; Berton, A.; Carotenuto, F.; Di Gennaro, S.F.; Gioli, B.; Matese, A.; Miglietta, F.; Vagnoli, C.; Zaldei, A.; Wallace, L. Forestry Applications of UAVs in Europe: A Review. Int. J. Remote Sens. 2017, 38, 2427–2447. [Google Scholar] [CrossRef]
- Adão, T.; Hruška, J.; Pádua, L.; Bessa, J.; Peres, E.; Morais, R.; Sousa, J. Hyperspectral Imaging: A Review on UAV-Based Sensors, Data Processing and Applications for Agriculture and Forestry. Remote Sens. 2017, 9, 1110. [Google Scholar] [CrossRef] [Green Version]
- Eugenio, F.C.; Schons, C.T.; Mallmann, C.L.; Schuh, M.S.; Fernandes, P.; Badin, T.L. Remotely Piloted Aircraft Systems and Forests: A Global State of the Art and Future Challenges. Can. J. For. Res. 2020, 50, 705–716. [Google Scholar] [CrossRef]
- Dainelli, R.; Toscano, P.; Di Gennaro, S.F.; Matese, A. Recent Advances in Unmanned Aerial Vehicles Forest Remote Sensing—A Systematic Review. Part II: Research Applications. Forests 2021, 12, 397. [Google Scholar] [CrossRef]
- Torres, P.; Rodes-Blanco, M.; Viana-Soto, A.; Nieto, H.; García, M. The Role of Remote Sensing for the Assessment and Monitoring of Forest Health: A Systematic Evidence Synthesis. Forests 2021, 12, 1134. [Google Scholar] [CrossRef]
- Eugenio, F.C.; PereiradaSilva, S.D.; Fantinel, R.A.; de Souza, P.D.; Felippe, B.M.; Romua, C.L.; Elsenbach, E.M. Remotely Piloted Aircraft Systems to Identify Pests and Diseases in Forest Species: The Global State of the Art and Future Challenges. IEEE Geosci. Remote Sens. Mag. 2021, 10, 2–15. [Google Scholar] [CrossRef]
- Page, M.J.; McKenzie, J.E.; Bossuyt, P.M.; Boutron, I.; Hoffmann, T.C.; Mulrow, C.D.; Shamseer, L.; Tetzlaff, J.M.; Akl, E.A.; Brennan, S.E.; et al. The PRISMA 2020 Statement: An Updated Guideline for Reporting Systematic Reviews. Syst. Rev. 2021, 10, 89. [Google Scholar] [CrossRef]
- Colomina, I.; Molina, P. Unmanned Aerial Systems for Photogrammetry and Remote Sensing: A Review. ISPRS J. Photogramm. Remote Sens. 2014, 92, 79–97. [Google Scholar] [CrossRef] [Green Version]
- Aria, M.; Cuccurullo, C. Bibliometrix: An R-Tool for Comprehensive Science Mapping Analysis. J. Informetr. 2017, 11, 959–975. [Google Scholar] [CrossRef]
- RStudio Team RStudio: Integrated Development Environment for R; RStudio, PBC: Boston, MA, USA, 2021.
- Eskandari, R.; Mahdianpari, M.; Mohammadimanesh, F.; Salehi, B.; Brisco, B.; Homayouni, S. Meta-Analysis of Unmanned Aerial Vehicle (UAV) Imagery for Agro-Environmental Monitoring Using Machine Learning and Statistical Models. Remote Sens. 2020, 12, 3511. [Google Scholar] [CrossRef]
- Dash, J.P.; Watt, M.S.; Paul, T.S.H.; Morgenroth, J.; Hartley, R. Taking a Closer Look at Invasive Alien Plant Research: A Review of the Current State, Opportunities, and Future Directions for UAVs. Methods Ecol. Evol. 2019, 10, 2020–2033. [Google Scholar] [CrossRef] [Green Version]
- Zotero; Center for History and New Media at George Mason University: Fairfax, VA, USA, 2022.
- van Eck, N.J.; Waltman, L. Software Survey: VOSviewer, a Computer Program for Bibliometric Mapping. Scientometrics 2010, 84, 523–538. [Google Scholar] [CrossRef] [PubMed] [Green Version]
- Lausch, A.; Erasmi, S.; King, D.; Magdon, P.; Heurich, M. Understanding Forest Health with Remote Sensing-Part II—A Review of Approaches and Data Models. Remote Sens. 2017, 9, 129. [Google Scholar] [CrossRef] [Green Version]
- Cardil, A.; Vepakomma, U.; Brotons, L. Assessing Pine Processionary Moth Defoliation Using Unmanned Aerial Systems. Forests 2017, 8, 402. [Google Scholar] [CrossRef] [Green Version]
- Dash, J.; Pearse, G.; Watt, M. UAV Multispectral Imagery Can Complement Satellite Data for Monitoring Forest Health. Remote Sens. 2018, 10, 1216. [Google Scholar] [CrossRef] [Green Version]
- Senf, C.; Seidl, R.; Hostert, P. Remote Sensing of Forest Insect Disturbances: Current State and Future Directions. Int. J. Appl. Earth Obs. Geoinf. 2017, 60, 49–60. [Google Scholar] [CrossRef] [Green Version]
- Adamopoulos, E.; Rinaudo, F. UAS-Based Archaeological Remote Sensing: Review, Meta-Analysis and State-of-the-Art. Drones 2020, 4, 46. [Google Scholar] [CrossRef]
- Näsi, R.; Honkavaara, E.; Lyytikäinen-Saarenmaa, P.; Blomqvist, M.; Litkey, P.; Hakala, T.; Viljanen, N.; Kantola, T.; Tanhuanpää, T.; Holopainen, M. Using UAV-Based Photogrammetry and Hyperspectral Imaging for Mapping Bark Beetle Damage at Tree-Level. Remote Sens. 2015, 7, 15467–15493. [Google Scholar] [CrossRef] [Green Version]
- Näsi, R.; Honkavaara, E.; Blomqvist, M.; Lyytikäinen-Saarenmaa, P.; Hakala, T.; Viljanen, N.; Kantola, T.; Holopainen, M. Remote Sensing of Bark Beetle Damage in Urban Forests at Individual Tree Level Using a Novel Hyperspectral Camera from UAV and Aircraft. Urban For. Urban Green. 2018, 30, 72–83. [Google Scholar] [CrossRef]
- Minařík, R.; Langhammer, J. Use of a Multispectral UAV Photogrammetry for Detection and Tracking of Forest Disturbance Dynamics. In The International Archives of the Photogrammetry, Remote Sensing & Spatial Information Sciences—ISPRS Archives; Zdimal, V., Ramasamy, S.M., Skidmore, A., Altan, O., Comiso, J., Thenkabail, P.S., Halounova, L., Safar, V., Planka, L., Raju, P.L.N., et al., Eds.; International Society for Photogrammetry and Remote Sensing: Christian Heipke, Germany, 2016; Volume 41, pp. 711–718. [Google Scholar]
- Klouček, T.; Komárek, J.; Surový, P.; Hrach, K.; Janata, P.; Vašíček, B. The Use of UAV Mounted Sensors for Precise Detection of Bark Beetle Infestation. Remote Sens. 2019, 11, 1561. [Google Scholar] [CrossRef] [Green Version]
- Safonova, A.; Tabik, S.; Alcaraz-Segura, D.; Rubtsov, A.; Maglinets, Y.; Herrera, F. Detection of Fir Trees (Abies Sibirica) Damaged by the Bark Beetle in Unmanned Aerial Vehicle Images with Deep Learning. Remote Sens. 2019, 11, 643. [Google Scholar] [CrossRef] [Green Version]
- Abdollahnejad, A.; Panagiotidis, D. Tree Species Classification and Health Status Assessment for a Mixed Broadleaf-Conifer Forest with Uas Multispectral Imaging. Remote Sens. 2020, 12, 3722. [Google Scholar] [CrossRef]
- Honkavaara, E.; Näsi, R.; Oliveira, R.; Viljanen, N.; Suomalainen, J.; Khoramshahi, E.; Hakala, T.; Nevalainen, O.; Markelin, L.; Vuorinen, M.; et al. Using Multitemporal Hyper-and Multispectral UAV Imaging for Detecting Bark Beetle Infestation on Norway Spruce. In The International Archives of the Photogrammetry, Remote Sensing and Spatial Information Sciences—ISPRS Archives; Paparoditis, N., Mallet, C., Lafarge, F., Jiang, J., Shaker, A., Zhang, H., Liang, X., Osmanoglu, B., Soergel, U., Honkavaara, E., et al., Eds.; International Society for Photogrammetry and Remote Sensing: Christian Heipke, Germany, 2020; Volume 43, pp. 429–434. [Google Scholar]
- Minařík, R.; Langhammer, J.; Lendzioch, T. Automatic Tree Crown Extraction from Uas Multispectral Imagery for the Detection of Bark Beetle Disturbance in Mixed Forests. Remote Sens. 2020, 12, 4081. [Google Scholar] [CrossRef]
- Minařík, R.; Langhammer, J.; Lendzioch, T. Detection of Bark Beetle Disturbance at Tree Level Using UAS Multispectral Imagery and Deep Learning. Remote Sens. 2021, 13, 4768. [Google Scholar] [CrossRef]
- Safonova, A.; Hamad, Y.; Dmitriev, E.; Georgiev, G.; Trenkin, V.; Georgieva, M.; Dimitrov, S.; Iliev, M. Individual Tree Crown Delineation for the Species Classification and Assessment of Vital Status of Forest Stands from UAV Images. Drones 2021, 5, 77. [Google Scholar] [CrossRef]
- Nguyen, H.T.; Caceres, M.L.L.; Moritake, K.; Kentsch, S.; Shu, H.; Diez, Y. Individual Sick Fir Tree (Abies mariesii) Identification in Insect Infested Forests by Means of UAV Images and Deep Learning. Remote Sens. 2021, 13, 260. [Google Scholar] [CrossRef]
- Cessna, J.; Alonzo, M.G.; Foster, A.C.; Cook, B.D. Mapping Boreal Forest Spruce Beetle Health Status at the Individual Crown Scale Using Fused Spectral and Structural Data. Forests 2021, 12, 1145. [Google Scholar] [CrossRef]
- Zhang, N.; Wang, Y.; Zhang, X. Extraction of Tree Crowns Damaged by Dendrolimus Tabulaeformis Tsai et Liu via Spectral-Spatial Classification Using UAV-Based Hyperspectral Images. Plant Methods 2020, 16, 1–9. [Google Scholar] [CrossRef]
- Zhang, N.; Zhang, X.; Yang, G.; Zhu, C.; Huo, L.; Feng, H. Assessment of Defoliation during the Dendrolimus Tabulaeformis Tsai et Liu Disaster Outbreak Using UAV-Based Hyperspectral Images. Remote Sens. Environ. 2018, 217, 323–339. [Google Scholar] [CrossRef]
- Duarte, A.; Acevedo-Muñoz, L.; Gonçalves, C.I.; Mota, L.; Sarmento, A.; Silva, M.; Fabres, S.; Borralho, N.; Valente, C. Detection of Longhorned Borer Attack and Assessment in Eucalyptus Plantations Using UAV Imagery. Remote Sens. 2020, 12, 3153. [Google Scholar] [CrossRef]
- Megat Mohamed Nazir, M.N.; Terhem, R.; Norhisham, A.R.; Mohd Razali, S.; Meder, R. Early Monitoring of Health Status of Plantation-Grown Eucalyptus Pellita at Large Spatial Scale via Visible Spectrum Imaging of Canopy Foliage Using Unmanned Aerial Vehicles. Forests 2021, 12, 1393. [Google Scholar] [CrossRef]
- Miraki, M.; Sohrabi, H.; Fatehi, P.; Kneubuehler, M. Detection of Mistletoe Infected Trees Using UAV High Spatial Resolution Images. J. Plant Dis. Prot. 2021, 128, 1679–1689. [Google Scholar] [CrossRef]
- Maes, W.; Huete, A.; Avino, M.; Boer, M.; Dehaan, R.; Pendall, E.; Griebel, A.; Steppe, K. Can UAV-Based Infrared Thermography Be Used to Study Plant-Parasite Interactions between Mistletoe and Eucalypt Trees? Remote Sens. 2018, 10, 2062. [Google Scholar] [CrossRef] [Green Version]
- Lehmann, J.R.K.; Nieberding, F.; Prinz, T.; Knoth, C. Analysis of Unmanned Aerial System-Based CIR Images in Forestry—A New Perspective to Monitor Pest Infestation Levels. Forests 2015, 6, 594–612. [Google Scholar] [CrossRef] [Green Version]
- Lin, Q.; Huang, H.; Chen, L.; Wang, J.; Huang, K.; Liu, Y. Using the 3D Model RAPID to Invert the Shoot Dieback Ratio of Vertically Heterogeneous Yunnan Pine Forests to Detect Beetle Damage. Remote Sens. Environ. 2021, 260, 112475. [Google Scholar] [CrossRef]
- Lin, Q.; Huang, H.; Wang, J.; Huang, K.; Liu, Y. Detection of Pine Shoot Beetle (PSB) Stress on Pine Forests at Individual Tree Level Using UAV-Based Hyperspectral Imagery and Lidar. Remote Sens. 2019, 11, 2540. [Google Scholar] [CrossRef] [Green Version]
- Liu, M.; Zhang, Z.; Liu, X.; Yao, J.; Du, T.; Ma, Y.; Shi, L. Discriminant Analysis of the Damage Degree Caused by Pine Shoot Beetle to Yunnan Pine Using UAV-Based Hyperspectral Images. Forests 2020, 11, 1258. [Google Scholar] [CrossRef]
- Cardil, A.; Otsu, K.; Pla, M.; Silva, C.A.; Brotons, L. Quantifying Pine Processionary Moth Defoliation in a Pine-Oak Mixed Forest Using Unmanned Aerial Systems and Multispectral Imagery. PLoS ONE 2019, 14, e0213027. [Google Scholar] [CrossRef]
- Otsu, K.; Pla, M.; Duane, A.; Cardil, A.; Brotons, L. Estimating the Threshold of Detection on Tree Crown Defoliation Using Vegetation Indices from Uas Multispectral Imagery. Drones 2019, 3, 80. [Google Scholar] [CrossRef] [Green Version]
- Otsu, K.; Pla, M.; Vayreda, J.; Brotons, L. Calibrating the Severity of Forest Defoliation by Pine Processionary Moth with Landsat and UAV Imagery. Sensors 2018, 18, 3278. [Google Scholar] [CrossRef] [Green Version]
- Guerra-Hernández, J.; Díaz-Varela, R.A.; Ávarez-González, J.G.; Rodríguez-González, P.M. Assessing a Novel Modelling Approach with High Resolution UAV Imagery for Monitoring Health Status in Priority Riparian Forests. For. Ecosyst. 2021, 8, 61. [Google Scholar] [CrossRef]
- Pádua, L.; Marques, P.; Martins, L.; Sousa, A.; Peres, E.; Sousa, J.J. Monitoring of Chestnut Trees Using Machine Learning Techniques Applied to UAV-Based Multispectral Data. Remote Sens. 2020, 12, 3032. [Google Scholar] [CrossRef]
- Sandino, J.; Pegg, G.; Gonzalez, F.; Smith, G. Aerial Mapping of Forests Affected by Pathogens Using UAVs, Hyperspectral Sensors, and Artificial Intelligence. Sensors 2018, 18, 944. [Google Scholar] [CrossRef] [PubMed] [Green Version]
- Dell, M.; Stone, C.; Osborn, J.; Glen, M.; McCoull, C.; Rimbawanto, A.; Tjahyono, B.; Mohammed, C. Detection of Necrotic Foliage in a Young Eucalyptus Pellita Plantation Using Unmanned Aerial Vehicle RGB Photography—A Demonstration of Concept. Aust. For. 2019, 82, 79–88. [Google Scholar] [CrossRef] [Green Version]
- Iordache, M.-D.; Mantas, V.; Baltazar, E.; Pauly, K.; Lewyckyj, N. A Machine Learning Approach to Detecting Pine Wilt Disease Using Airborne Spectral Imagery. Remote Sens. 2020, 12, 2280. [Google Scholar] [CrossRef]
- Syifa, M.; Park, S.-J.; Lee, C.-W. Detection of the Pine Wilt Disease Tree Candidates for Drone Remote Sensing Using Artificial Intelligence Techniques. Engineering 2020, 6, 919–926. [Google Scholar] [CrossRef]
- Tao, H.; Li, C.; Zhao, D.; Deng, S.; Hu, H.; Xu, X.; Jing, W. Deep Learning-Based Dead Pine Tree Detection from Unmanned Aerial Vehicle Images. Int. J. Remote Sens. 2020, 41, 8238–8255. [Google Scholar] [CrossRef]
- Qin, J.; Wang, B.; Wu, Y.; Lu, Q.; Zhu, H. Identifying Pine Wood Nematode Disease Using Uav Images and Deep Learning Algorithms. Remote Sens. 2021, 13, 162. [Google Scholar] [CrossRef]
- Wu, B.; Liang, A.; Zhang, H.; Zhu, T.; Zou, Z.; Yang, D.; Tang, W.; Li, J.; Su, J. Application of Conventional UAV-Based High-Throughput Object Detection to the Early Diagnosis of Pine Wilt Disease by Deep Learning. For. Ecol. Manag. 2021, 486, 118986. [Google Scholar] [CrossRef]
- Park, H.G.; Yun, J.P.; Kim, M.Y.; Jeong, S.H. Multichannel Object Detection for Detecting Suspected Trees with Pine Wilt Disease Using Multispectral Drone Imagery. IEEE J. Sel. Top. Appl. Earth Obs. Remote Sens. 2021, 14, 8350–8358. [Google Scholar] [CrossRef]
- Xia, L.; Zhang, R.; Chen, L.; Li, L.; Yi, T.; Wen, Y.; Ding, C.; Xie, C. Evaluation of Deep Learning Segmentation Models for Detection of Pine Wilt Disease in Unmanned Aerial Vehicle Images. Remote Sens. 2021, 13, 3594. [Google Scholar] [CrossRef]
- Yu, R.; Luo, Y.; Zhou, Q.; Zhang, X.; Wu, D.; Ren, L. A Machine Learning Algorithm to Detect Pine Wilt Disease Using UAV-Based Hyperspectral Imagery and LiDAR Data at the Tree Level. Int. J. Appl. Earth Obs. Geoinf. 2021, 101, 102363. [Google Scholar] [CrossRef]
- Yu, R.; Ren, L.; Luo, Y. Early Detection of Pine Wilt Disease in Pinus Tabuliformis in North China Using a Field Portable Spectrometer and UAV-Based Hyperspectral Imagery. For. Ecosyst. 2021, 8, 44. [Google Scholar] [CrossRef]
- Yu, R.; Luo, Y.; Li, H.; Yang, L.; Huang, H.; Yu, L.; Ren, L. Three-Dimensional Convolutional Neural Network Model for Early Detection of Pine Wilt Disease Using Uav-Based Hyperspectral Images. Remote Sens. 2021, 13, 4065. [Google Scholar] [CrossRef]
- Yu, R.; Luo, Y.; Zhou, Q.; Zhang, X.; Wu, D.; Ren, L. Early Detection of Pine Wilt Disease Using Deep Learning Algorithms and UAV-Based Multispectral Imagery. For. Ecol. Manag. 2021, 497, 119493. [Google Scholar] [CrossRef]
- Sun, Z.; Wang, Y.; Pan, L.; Xie, Y.; Zhang, B.; Liang, R.; Sun, Y. Pine Wilt Disease Detection in High-Resolution UAV Images Using Object-Oriented Classification. J. For. Res. 2021, 577. [Google Scholar] [CrossRef]
- Smigaj, M.; Gaulton, R.; Barr, S.L.; Suárez, J.C. UAV-Borne Thermal Imaging for Forest Health Monitoring: Detection Of Disease-Induced Canopy Temperature Increase. In International Archives of the Photogrammetry, Remote Sensing & Spatial Information Sciences—ISPRS Archives; Paparoditis, N., Raimond, A.-M., Sithole, G., Rabatel, G., Coltekin, A., Rottensteiner, F., Briottet, X., Christophe, S., Dowman, I., Elberink, S.O., et al., Eds.; International Society for Photogrammetry and Remote Sensing: Christian Heipke, Germany, 2015; Volume 40, pp. 349–354. [Google Scholar]
- Smigaj, M.; Gaulton, R.; Suárez, J.C.; Barr, S.L. Canopy Temperature from an Unmanned Aerial Vehicle as an Indicator of Tree Stress Associated with Red Band Needle Blight Severity. For. Ecol. Manag. 2019, 433, 699–708. [Google Scholar] [CrossRef]
- Fraser, B.T.; Congalton, R.G. Monitoring Fine-Scale Forest Health Using Unmanned Aerial Systems (UAS) Multispectral Models. Remote Sens. 2021, 13, 4873. [Google Scholar] [CrossRef]
- Briechle, S.; Krzystek, P.; Vosselman, G. Classification of Tree Species and Standing Dead Trees by Fusing Uav-Based Lidar Data and Multispectral Imagery in the 3D Deep Neural Network Pointnet++. In ISPRS Annals of the Photogrammetry, Remote Sensing and Spatial Information Sciences; Paparoditis, N., Mallet, C., Lafarge, F., Remondino, F., Toschi, I., Fuse, T., Eds.; Copernicus GmbH: Göttingen, Germany, 2020; Volume 5, pp. 203–210. [Google Scholar]
- Elli, E.F.; Sentelhas, P.C.; Bender, F.D. Impacts and Uncertainties of Climate Change Projections on Eucalyptus Plantations Productivity across Brazil. For. Ecol. Manag. 2020, 474, 118365. [Google Scholar] [CrossRef]
- Zhang, Y.; Wang, X. Geographical Spatial Distribution and Productivity Dynamic Change of Eucalyptus Plantations in China. Sci. Rep. 2021, 11, 19764. [Google Scholar] [CrossRef]
- Potts, B.M.; Vaillancourt, R.E.; Jordan, G.; Dutkowski, G.; Costa e Silva, J.; Gay, M.; Steane, D.; Volker, P.; Lopez, G.; Apiolazza, L.; et al. Exploration of the Eucalyptus Globulus Gene Pool. In Proceedings of the Eucalyptus in a Changing World—IUFRO Conference, Aveiro, Portugal, 1–15 October 2004; Borralho, N., Pereira, J.S., Marques, C., Coutinho, J., Madeira, M., Tomé, M., Eds.; IUFRO: Aveiro, Portugal, 2004; pp. 46–61. [Google Scholar]
- Cromwell, C.; Giampaolo, J.; Hupy, J.; Miller, Z.; Chandrasekaran, A. A Systematic Review of Best Practices for UAS Data Collection in Forestry-Related Applications. Forests 2021, 12, 957. [Google Scholar] [CrossRef]
- Tmušić, G.; Manfreda, S.; Aasen, H.; James, M.R.; Gonçalves, G.; Ben-Dor, E.; Brook, A.; Polinova, M.; Arranz, J.J.; Mészáros, J.; et al. Current Practices in UAS-Based Environmental Monitoring. Remote Sens. 2020, 12, 1001. [Google Scholar] [CrossRef] [Green Version]
- Shi, Y.; Thomasson, J.A.; Murray, S.C.; Pugh, N.A.; Rooney, W.L.; Shafian, S.; Rajan, N.; Rouze, G.; Morgan, C.L.S.; Neely, H.L.; et al. Unmanned Aerial Vehicles for High-Throughput Phenotyping and Agronomic Research. PLoS ONE 2016, 11, e0159781. [Google Scholar] [CrossRef] [PubMed] [Green Version]
- González-Jorge, H.; Martínez-Sánchez, J.; Bueno, M.; Arias, P. Unmanned Aerial Systems for Civil Applications: A Review. Drones 2017, 1, 2. [Google Scholar] [CrossRef]
- Watts, A.C.; Ambrosia, V.G.; Hinkley, E.A. Unmanned Aircraft Systems in Remote Sensing and Scientific Research: Classification and Considerations of Use. Remote Sens. 2012, 4, 1671–1692. [Google Scholar] [CrossRef] [Green Version]
- Zong, J.; Zhu, B.; Hou, Z.; Yang, X.; Zhai, J. Evaluation and Comparison of Hybrid Wing VTOL UAV with Four Different Electric Propulsion Systems. Aerospace 2021, 8, 256. [Google Scholar] [CrossRef]
- Müllerová, J.; Bartaloš, T.; Brůna, J.; Dvořák, P.; Vítková, M. Unmanned Aircraft in Nature Conservation: An Example from Plant Invasions. Int. J. Remote Sens. 2017, 38, 2177–2198. [Google Scholar] [CrossRef]
- Assmann, J.J.; Kerby, J.T.; Cunliffe, A.M.; Myers-Smith, I.H. Vegetation Monitoring Using Multispectral Sensors—Best Practices and Lessons Learned from High Latitudes. J. Unmanned Veh. Sys. 2019, 7, 54–75. [Google Scholar] [CrossRef] [Green Version]
- Pajares, G. Overview and Current Status of Remote Sensing Applications Based on Unmanned Aerial Vehicles (UAVs). Photogramm. Eng. Remote Sens. 2015, 81, 281–330. [Google Scholar] [CrossRef] [Green Version]
- Stuart, M.B.; McGonigle, A.J. Hyperspectral Imaging in Environmental Monitoring: A Review of Recent Developments and Technological Advances in Compact Field Deployable Systems. Sensors 2019, 19, 3071. [Google Scholar] [CrossRef] [Green Version]
- Stöcker, C.; Bennett, R.; Nex, F.; Gerke, M.; Zevenbergen, J. Review of the Current State of UAV Regulations. Remote Sens. 2017, 9, 459. [Google Scholar] [CrossRef] [Green Version]
- EASA. Commission Implementing Regulation (EU) 2019/947 of 24 May 2019 on the Rules and Procedures for the Operation of Unmanned Aircraft. Available online: https://eur-lex.europa.eu/eli/reg_impl/2019/947/oj (accessed on 5 March 2021).
- Iglhaut, J.; Cabo, C.; Puliti, S.; Piermattei, L.; O’Connor, J.; Rosette, J. Structure from Motion Photogrammetry in Forestry: A Review. Curr. For. Rep. 2019, 5, 155–168. [Google Scholar] [CrossRef] [Green Version]
- Whitehead, K.; Hugenholtz, C.H. Applying ASPRS Accuracy Standards to Surveys from Small Unmanned Aircraft Systems (UAS). Photogramm. Eng. Remote Sens. 2015, 81, 787–793. [Google Scholar] [CrossRef]
- Barbedo, J. A Review on the Use of Unmanned Aerial Vehicles and Imaging Sensors for Monitoring and Assessing Plant Stresses. Drones 2019, 3, 40. [Google Scholar] [CrossRef] [Green Version]
- Ke, Y.; Quackenbush, L.J. A Review of Methods for Automatic Individual Tree-Crown Detection and Delineation from Passive Remote Sensing. Int. J. Remote Sens. 2011, 32, 4725–4747. [Google Scholar] [CrossRef]
- Koch, B.; Kattenborn, T.; Straub, C.; Vauhkonen, J. Segmentation of Forest to Tree Objects. In Forestry Application of Airborne Laser Scanning: Concept and Case Studies; Maltamo, M., Naesset, E., Vauhkonen, J., Eds.; Springer Netherlands: Dordrecht, The Netherlands, 2014; pp. 89–112. ISBN 94-017-8662-3. [Google Scholar]
- Wang, L.; Gong, P.; Biging, G.S. Individual Tree-Crown Delineation and Treetop Detection in High-Spatial-Resolution Aerial Imagery. Photogramm. Eng. Remote Sens. 2004, 70, 351–357. [Google Scholar] [CrossRef] [Green Version]
- Zhen, Z.; Quackenbush, L.; Zhang, L. Trends in Automatic Individual Tree Crown Detection and Delineation—Evolution of LiDAR Data. Remote Sens. 2016, 8, 333. [Google Scholar] [CrossRef] [Green Version]
- Mohan, M.; Silva, C.; Klauberg, C.; Jat, P.; Catts, G.; Cardil, A.; Hudak, A.; Dia, M. Individual Tree Detection from Unmanned Aerial Vehicle (UAV) Derived Canopy Height Model in an Open Canopy Mixed Conifer Forest. Forests 2017, 8, 340. [Google Scholar] [CrossRef] [Green Version]
- Dalponte, M.; Reyes, F.; Kandare, K.; Gianelle, D. Delineation of Individual Tree Crowns from ALS and Hyperspectral Data: A Comparison among Four Methods. Eur. J. Remote Sens. 2015, 48, 365–382. [Google Scholar] [CrossRef] [Green Version]
- Dalponte, M.; Coomes, D.A. Tree-centric Mapping of Forest Carbon Density from Airborne Laser Scanning and Hyperspectral Data. Methods Ecol. Evol. 2016, 7, 1236–1245. [Google Scholar] [CrossRef] [Green Version]
- Vincent, L.; Soille, P. Watersheds in Digital Spaces: An Efficient Algorithm Based on Immersion Simulations. IEEE Trans. Pattern Anal. Mach. Intell. 1991, 13, 583–598. [Google Scholar] [CrossRef] [Green Version]
- Gu, J.; Grybas, H.; Congalton, R.G. Individual Tree Crown Delineation from UAS Imagery Based on Region Growing and Growth Space Considerations. Remote Sens. 2020, 12, 2363. [Google Scholar] [CrossRef]
- Hyyppa, J.; Kelle, O.; Lehikoinen, M.; Inkinen, M. A Segmentation-Based Method to Retrieve Stem Volume Estimates from 3-D Tree Height Models Produced by Laser Scanners. IEEE Trans. Geosci. Remote Sens. 2001, 39, 969–975. [Google Scholar] [CrossRef]
- Li, W.; Guo, Q.; Jakubowski, M.K.; Kelly, M. A New Method for Segmenting Individual Trees from the Lidar Point Cloud. Photogramm. Eng. Remote Sens. 2012, 78, 75–84. [Google Scholar] [CrossRef] [Green Version]
- Reitberger, J.; Schnörr, C.; Krzystek, P.; Stilla, U. 3D Segmentation of Single Trees Exploiting Full Waveform LIDAR Data. ISPRS J. Photogramm. Remote Sens. 2009, 64, 561–574. [Google Scholar] [CrossRef]
- Hyyppä, J.; Hyyppä, H.; Leckie, D.; Gougeon, F.; Yu, X.; Maltamo, M. Review of Methods of Small-footprint Airborne Laser Scanning for Extracting Forest Inventory Data in Boreal Forests. Int. J. Remote Sens. 2008, 29, 1339–1366. [Google Scholar] [CrossRef]
- Zhou, Y.; Zhang, R.; Wang, S.; Wang, F. Feature Selection Method Based on High-Resolution Remote Sensing Images and the Effect of Sensitive Features on Classification Accuracy. Sensors 2018, 18, 2013. [Google Scholar] [CrossRef] [Green Version]
- Lu, D.; Weng, Q. A Survey of Image Classification Methods and Techniques for Improving Classification Performance. Int. J. Remote Sens. 2007, 28, 823–870. [Google Scholar] [CrossRef]
- Sowmya, A.; Trinder, J. Modelling and Representation Issues in Automated Feature Extraction from Aerial and Satellite Images. ISPRS J. Photogramm. Remote Sens. 2000, 55, 34–47. [Google Scholar] [CrossRef]
- Fotso Kamga, G.A.; Bitjoka, L.; Akram, T.; Mengue Mbom, A.; Rameez Naqvi, S.; Bouroubi, Y. Advancements in Satellite Image Classification: Methodologies, Techniques, Approaches and Applications. Int. J. Remote Sens. 2021, 42, 7662–7722. [Google Scholar] [CrossRef]
- Oumar, Z.; Mutanga, O.; Ismail, R. Predicting Thaumastocoris Peregrinus Damage Using Narrow Band Normalized Indices and Hyperspectral Indices Using Field Spectra Resampled to the Hyperion Sensor. Int. J. Appl. Earth Obs. Geoinf. 2013, 21, 113–121. [Google Scholar] [CrossRef]
- Ma, L.; Fu, T.; Blaschke, T.; Li, M.; Tiede, D.; Zhou, Z.; Ma, X.; Chen, D. Evaluation of Feature Selection Methods for Object-Based Land Cover Mapping of Unmanned Aerial Vehicle Imagery Using Random Forest and Support Vector Machine Classifiers. Int. J. Geo-Inf. 2017, 6, 51. [Google Scholar] [CrossRef]
- Ma, L.; Cheng, L.; Li, M.; Liu, Y.; Ma, X. Training Set Size, Scale, and Features in Geographic Object-Based Image Analysis of Very High Resolution Unmanned Aerial Vehicle Imagery. ISPRS J. Photogramm. Remote Sens. 2015, 102, 14–27. [Google Scholar] [CrossRef]
- Ma, L.; Li, M.; Ma, X.; Cheng, L.; Du, P.; Liu, Y. A Review of Supervised Object-Based Land-Cover Image Classification. ISPRS J. Photogramm. Remote Sens. 2017, 130, 277–293. [Google Scholar] [CrossRef]
- Ma, L.; Liu, Y.; Zhang, X.; Ye, Y.; Yin, G.; Johnson, B.A. Deep Learning in Remote Sensing Applications: A Meta-Analysis and Review. ISPRS J. Photogramm. Remote Sens. 2019, 152, 166–177. [Google Scholar] [CrossRef]
- Osco, L.P.; Marcato Junior, J.; Marques Ramos, A.P.; de Castro Jorge, L.A.; Fatholahi, S.N.; de Andrade Silva, J.; Matsubara, E.T.; Pistori, H.; Gonçalves, W.N.; Li, J. A Review on Deep Learning in UAV Remote Sensing. Int. J. Appl. Earth Obs. Geoinf. 2021, 102, 102456. [Google Scholar] [CrossRef]
- Nasiri, V.; Darvishsefat, A.A.; Arefi, H.; Pierrot-Deseilligny, M.; Namiranian, M.; Le Bris, A. Unmanned Aerial Vehicles (UAV)-Based Canopy Height Modeling under Leaf-on and Leaf-off Conditions for Determining Tree Height and Crown Diameter (Case Study: Hyrcanian Mixed Forest). Can. J. For. Res. 2021, 51, 962–971. [Google Scholar] [CrossRef]
- Puente, C.; Olague, G.; Smith, S.V.; Bullock, S.H.; Hinojosa-Corona, A.; González-Botello, M.A. A Genetic Programming Approach to Estimate Vegetation Cover in the Context of Soil Erosion Assessment. Photogramm. Eng. Remote Sens. 2011, 77, 363–376. [Google Scholar] [CrossRef] [Green Version]
- Batista, J.E.; Cabral, A.I.R.; Vasconcelos, M.J.P.; Vanneschi, L.; Silva, S. Improving Land Cover Classification Using Genetic Programming for Feature Construction. Remote Sens. 2021, 13, 1623. [Google Scholar] [CrossRef]
- Batista, J.E.; Silva, S. Improving the Detection of Burnt Areas in Remote Sensing Using Hyper-Features Evolved by M3GP. In Proceedings of the 2020 IEEE Congress on Evolutionary Computation (CEC), Glasgow, UK, 19–24 July 2020. [Google Scholar]
- Mejia-Zuluaga, P.A.; Dozal, L.; Valdiviezo-N, J.C. Genetic Programming Approach for the Detection of Mistletoe Based on UAV Multispectral Imagery in the Conservation Area of Mexico City. Remote Sens. 2022, 14, 801. [Google Scholar] [CrossRef]


| No. | Ref. | Year | Title | Journal | Contents |
|---|---|---|---|---|---|
| 1 | [24] | 2017 | Forestry applications of UAVs in Europe: a review | International Journal of Remote Sensing | A review of UAV-based forestry applications and aspects of regulations in Europe. Three studies about FIPDs were reviewed. |
| 2 | [25] | 2017 | Hyperspectral Imaging: A Review on UAV-Based Sensors, Data Processing and Applications for Agriculture and Forestry | Remote Sensing | A review on UAV-based hyperspectral sensors, data processing, and applications for agriculture and forestry. Three studies about FIPDs were reviewed. |
| 3 | [26] | 2020 | Remotely piloted aircraft systems and forests: a global state of the art and future challenges | Canadian Journal of Forest Research | A review of UAV-based forestry applications. Six studies about FIPDs were reviewed. |
| 4 | [16] | 2020 | Forestry Remote Sensing from Unmanned Aerial Vehicles: A Review Focusing on the Data, Processing and Potentialities | Remote Sensing | A review focusing on data, processing, and potentialities. It covers all types of procedures and provides examples. Nine studies about FIPDs were reviewed. |
| 5 | [27] | 2021 | Recent Advances in Unmanned Aerial Vehicles Forest Remote Sensing—A Systematic Review. Part II: Research Applications | Forests | A systematic review of UAV system solutions, technical advantages, drawbacks of the technology, and considerations on technology transfer. Seventeen studies about FIPDs were reviewed. |
| 6 | [28] | 2021 | The Role of Remote Sensing for the Assessment and Monitoring of Forest Health: A Systematic Evidence Synthesis | Forests | A systematic evidence synthesis about forest health issues with reference to different remote sensing platforms and techniques. Ten studies about UAV–FIPDs were reviewed. |
| 7 | [29] | 2021 | Remotely Piloted Aircraft Systems to Identify Pests and Diseases in Forest Species: The Global State of the Art and Future Challenges | IEEE Geoscience and remote sensing magazine | A literature review of UAV-based on forest pest and disease monitoring. Thirty-three studies about FIPDs were reviewed. |
| Category | Parameter | Description |
|---|---|---|
| General | Source | Refereed journals and conference proceedings |
| Year | - | |
| Authors | - | |
| Study location | The geographic location of the study area | |
| Taxonomy | Specie | Name of the host tree specie |
| Pest or disease | Name of the pest or disease | |
| UAV and sensor types | UAV type | Type of the UAV (fixed-wing, rotary-wing) |
| Sensor type | Active or passive sensor, manufacturer, model | |
| Data collection and pre-processing | Study area size | Area coverage in hectares |
| Flight altitude | Measured (m) | |
| Spatial resolution | Measured centimeters (cm) | |
| Imagery Overlap | Percentage of frontal and side overlap | |
| Field data collection | Ancillary field and laboratory data about FIPD | |
| Radiometric calibration | Calibrated panels | |
| Geometric calibration | Ground control points (GCPs) | |
| Data processing and analytical methods | Spatial unit analysis | Pixel-based, object-based |
| Segmentation single tree | Manual, raster-based, vector-based | |
| Feature extraction and selection | No feature extraction, vegetation indices, textural or contextual image, linear transformations, auxiliary data | |
| Analysis type | Classification, regression, other | |
| Algorithms | Statistical, machine learning, deep learning, other | |
| Accuracy metrics | Measured in percentage | |
| Software used | Software brands | Software used to process imagery and analytical methods |
| Journals | No. | Quartile Rank | Publisher |
|---|---|---|---|
| Remote Sensing | 17 | Q1 | MDPI |
| Forests | 5 | Q1 | MDPI |
| Forest Ecology and Management | 3 | Q1 | Elsevier Inc. |
| Drones | 2 | Q1 | MDPI |
| Forest Ecosystems | 2 | Q1 | Springer |
| Remote Sensing of Environment | 2 | Q1 | Elsevier Inc. |
| Sensors | 2 | Q2 | MDPI |
| Australian Forestry | 1 | Q1 | Taylor & Francis Ltd. |
| Engineering | 1 | Q1 | Elsevier Inc. |
| Geo-Spatial Information Science | 1 | Q1 | Taylor & Francis Ltd. |
| IEEE Journal of selected topics in Applied Earth Observation and Remote Sensing | 1 | Q2 | Institute of Electrical and Electronics Engineers Inc. |
| International Journal of Applied Earth Observation and Geoinformation | 1 | Q1 | Elsevier Inc. |
| International Journal of Remote Sensing | 1 | Q1 | Taylor & Francis Ltd. |
| ISPRS Journal of Photogrammetry and Remote Sensing | 1 | Q1 | Elsevier Inc. |
| Journal of Forestry Research | 1 | Q2 | Northeast Forestry University |
| Journal of Plant Diseases and Protection | 1 | Q2 | Springer International Publishing AG |
| Plant Methods | 1 | Q1 | BioMed Central Ltd. |
| PLoS One | 1 | Q1 | Public Library of Science |
| Urban Forestry and Urban Greening | 1 | Q1 | Urban und Fischer Verlag GmbH und Co. KG |
| Conference Proceedings | No. | Publisher |
|---|---|---|
| International Archives of the Photogrammetry Remote Sensing and Spatial Information Sciences (ISPRS) Archives | 3 | International Society for Photogrammetry and Remote Sensing |
| ISPRS Annals of the Photogrammetry Remote Sensing and Spatial Information Sciences | 1 | Copernicus GmbH |
| Common Name | Host Tree Species | Studies | |
|---|---|---|---|
| Pests | Bark beetle | Abies sibirica, Abies mariesii, Picea abies, Pinus sylvestris, Pinus nigra | [43,44,45,46,47,48,49,50,51,52,53,54] |
| Chinese pine caterpillar | Pinus tabulaeformis | [55,56] | |
| Longhorned borer | Eucalyptus globulus | [57] | |
| Mosquito bugs | Eucalyptus pellita | [58] | |
| Mistletoe | Parrotia persica | [59,60] | |
| Oak splendor beetle | Quercus robur | [61] | |
| Pine shoot beetle | Pinus yunnanensis | [62,63,64] | |
| Processionary moth | Pinus Sylvestris, Pinus nigra, Pinus halepensis | [39,65,66,67] | |
| Stem borer | Eucalyptus pellita | [58] | |
| Tortrix moth | Abies mariesii | [53] | |
| Diseases | Armillaria root rot | Picea abies | [12] |
| Alder Phytophtora | Alnus glutinosa | [68] | |
| Chestnut ink disease | Castanea sativa | [69] | |
| Myrtle rust | Melaleuca quinquenervia | [70] | |
| Bacterial wild | Eucalyptus pellita | [58,71] | |
| Pine wild disease | Pinus pinaster, P. desiflora, P. massoniana | [72,73,74,75,76,77,78,79,80,81,82,83] | |
| Red band needle blight | Pinus Sylvestris and P. contorta | [84,85] | |
| White pine needle cast | Pinus strobus and Pinus resinosa | [86] | |
| Simulated | Pinus radiata | [15,40] |
| Flight Height (m) | GSD (m) | ||||||
|---|---|---|---|---|---|---|---|
| Sensor Type | No. | Max | Min | Median | Max | Min | Median |
| RGB | 29 | 700 | 30 | 90 | 0.080 | 0.015 | 0.028 |
| Multispectral | 27 | 200 | 50 | 100 | 0.170 | 0.020 | 0.070 |
| Hyperspectral | 12 | 140 | 20 | 95 | 0.560 | 0.047 | 0.200 |
| Thermal | 4 | 122 | 60 | 75 | 0.980 | 0.150 | 0.211 |
| Segmentation Single Tree | Method | Synopsis | Studies |
|---|---|---|---|
| Manually | Manually segmented trees | Digitalization of each tree crown above imagery using GIS software. | [15,39,40,50,54,56,60,64,68,79,80] |
| Local maxima filter and Buffer | Local maxima filter within a rasterized CHM to detect the treetops, then a buffer applied on the treetop using GIS software. | [39,46,48,84,85] | |
| Raster-based | Mean shift algorithm | GEOBIA method. Multispectral image segmentation using ArcGIS segment mean shift tool. | [66] |
| Multiresolution segmentation | GEOBIA method. Multispectral image segmentation using eCognition software multiresolution segmentation tool. | [12,61,83] | |
| Local maxima filter and mean shift algorithm | Local maxima of a sliding window using the brightness of the multispectral image. Then, the select by location tool is used between treetops and for large-scale mean shift algorithm segments (GEOBIA). | [57] | |
| Safonova et al. Wavelet-based local thresholding | Tree crown delineation using RGB images. The steps are contrast enhancement, crown segmentation based on wavelet transformation and morphological operations, and boundary detection. | [52] | |
| Safonova et al. Treetop detection | RGB images are transformed into one grey-scale band image; next, the grey-scale band image is converted into a blurred image; finally, the blurred image is converted into a binary image. | [47] | |
| Voronoi Tesselations | Local maxima filter within a rasterized CHM calculates the treetops and then uses a Voronoi tessellation algorithm [110]. | [65] | |
| Dalponte individual tree segmentation | Local maxima within a rasterized CHM calculates the treetops and then uses a region-growing algorithm for individual segmentation [111,112]. | [50,59] | |
| Watershed segmentation | Vicent and Soille original algorithm [113]. When the CHM is inverted, tree tops or vegetation clusters look like “basins”. | [49] | |
| Marker-controlled watershed [109]. Marker and segmentation functions are used for multi-tree identification and segmentation using rasterized CHM [114]. | [50,86] | ||
| Binary watershed analysis and the Euclidean distance using rasterized CHM or NIR band. | [69,79] | ||
| Hyyppä et al. [115] methodology. | [43] | ||
| Nyguen Treetops in nDSM data | Based on pixel intensity, an iterative sliding window is passed over the nDSM. Finally, the refinement is applied to eliminate treetops that are too close to each other. | [53] | |
| Vector-based | 3D region-growing algorithm | 3D region-growing algorithm applied in a point cloud (LiDAR or photogrammetric) using a built-in function for treetop detection [116]. | [50,63,79] |
| 3D segmentation of single trees | Point cloud-based method with tree segmentation using a normalized cut algorithm [117]. | [87] | |
| Voxel-based single tree | Lidar point cloud data are converted into voxels in order to estimate the leaf area density and the construction of the 3D forest scene. | [63] |
| Feature Type | Description | Studies |
|---|---|---|
| Spectral features | Statistics of original bands, ratios between bands, vegetation indices | [12,15,39,40,43,44,45,46,48,49,50,51,54,55,56,57,58,59,60,61,62,63,64,66,68,69,70,71,72,75,77,79,80,81,82,83,84,85,86,87] |
| Textural features | Gray level co-occurrence matrix (GLCM), grey level difference vector (GLDV) | [48,68,86] |
| Linear transformations | Hue, saturated and intensity (HSI), principal component analysis (PCA) | [55,61,79] |
| Geo-auxiliary | Original and normalized digital surface models (DSM) such as digital elevation models (DEM), canopy height models (CHM), slope, aspect, height percentiles | [12,39,48,50,53,54,62,63,65,68,71,81,85,86,87] |
| Multisensor | Inclusion of data obtained from different sensors in analytical methods | [44,62,79,84,87] |
| Multitemporal | Inclusion of multitemporal data classification in analytical methods | [15,40,48,59,69] |
Publisher’s Note: MDPI stays neutral with regard to jurisdictional claims in published maps and institutional affiliations. |
© 2022 by the authors. Licensee MDPI, Basel, Switzerland. This article is an open access article distributed under the terms and conditions of the Creative Commons Attribution (CC BY) license (https://creativecommons.org/licenses/by/4.0/).
Share and Cite
Duarte, A.; Borralho, N.; Cabral, P.; Caetano, M. Recent Advances in Forest Insect Pests and Diseases Monitoring Using UAV-Based Data: A Systematic Review. Forests 2022, 13, 911. https://doi.org/10.3390/f13060911
Duarte A, Borralho N, Cabral P, Caetano M. Recent Advances in Forest Insect Pests and Diseases Monitoring Using UAV-Based Data: A Systematic Review. Forests. 2022; 13(6):911. https://doi.org/10.3390/f13060911
Chicago/Turabian StyleDuarte, André, Nuno Borralho, Pedro Cabral, and Mário Caetano. 2022. "Recent Advances in Forest Insect Pests and Diseases Monitoring Using UAV-Based Data: A Systematic Review" Forests 13, no. 6: 911. https://doi.org/10.3390/f13060911