Article

An Ecological-Economic Approach to Assess Impacts of the Expansion of Eucalyptus Plantations in Agroforest Landscapes of Northern Ethiopia

1
Forest Research Center and Associated Laboratory TERRA, School of Agriculture, University of Lisbon, Tapada da Ajuda, 1349-017 Lisboa, Portugal
2
College of Agriculture and Environmental Sciences, University of Gondar, Gondar P.O. Box 196, Ethiopia
3
Research Centre for Mathematics and Applications, University of Évora, Colégio Luis Verney, 7000-671 Évora, Portugal
*
Author to whom correspondence should be addressed.
Forests 2022, 13(5), 686; https://doi.org/10.3390/f13050686
Submission received: 7 March 2022 / Revised: 20 April 2022 / Accepted: 27 April 2022 / Published: 28 April 2022
(This article belongs to the Special Issue Multiple-Use and Ecosystem Services of Forests)

Abstract

:
The conversion of fertile croplands to Eucalyptus woodlots in Ethiopian highlands, due to its business attractiveness to smallholders, raises concerns related to food production, water resources, carbon and other ecosystem services. This study was therefore designed to examine land allocation and plantation management decisions. Our emphasis was on the analysis of tradeoffs between the economic gains obtained from harvesting Eucalyptus timber and food production, carbon and water use. For that purpose, we considered a 1987 ha agroforest landscape in the Amhara region, Northern Ethiopia. With a planning horizon covering nine one-year periods, we developed and used nine Model I single objective linear programming (LP) models, and analyzed tradeoffs between objectives (e.g., land expectation value (LEV), Carbon, volume of ending inventory (VolEI), crop production and water use) using an LP-based Pareto frontier approach. The study revealed that the objective of maximizing the total economic gain from the sale of Eucalyptus wood poles favored a complete conversion of the available cropland into Eucalyptus woodlots. To meet the minimum annual crop production/consumption/requirements of households in the study area, the land under Eucalyptus should be limited to 1772 ha, with a sequestration potential of 1.5 to 1.57 × 10⁷ kg yr−1 of carbon in the aboveground biomass. However, this land cover limit should be decreased to 921 ha so as to limit the total annual water use (for biomass production) below the amount available from rainfall (11,000 m3 ha−1 yr−1). Moreover, the study highlighted that maximizing the harvested wood volume or LEV would come at the cost of a decreased aboveground carbon stock and volume of ending inventory and higher total water use. It also provided alternative optimal Pareto-front points, among which decision makers will be able to select their preferred targets. The current study also showed the potential for the application of Pareto frontier approaches to support the development of effective ecological/economic management strategies and the design of land use policies in an Ethiopian context.

1. Introduction

The area of natural forests and woodlands in Ethiopia has been shrinking, whereas the population and the demand for forest products has rapidly increased [1]. Thus, the establishment of forest plantations has been one of the government’s main strategies to deal with the huge gap between forest product supply and demand in the country [2]. Since the beginning of the 20th century, successive governments have attempted to promote the establishment of forest plantations, mainly of Eucalyptus, across the country [3,4]. This policy led to large-scale state- and community-owned plantations of Eucalyptus. Starting from the early 1980s, smallholder farmers have been taking the lead in expanding Eucalyptus tree planting in the form of woodlots [4,5,6]. Often farmers grow Eucalyptus in areas for which there are few other use options, e.g., areas along the holding boundary or that have small productivity, or else in small woodlots in the front yard or in the garden. In the past three decades, however, owing to the popular acceptance of Eucalyptus plantations as an attractive business for smallholders, the conversion of fertile croplands to Eucalyptus woodlots is becoming common [7,8,9]. In most parts of the country, fertile croplands have been converted to Eucalyptus woodlots every year, mainly because it is a more lucrative form of income [8]. Moreover, woodlots on agricultural farms are not only used to increase the tree cover but can also be used for climate change mitigation through carbon sequestration [10]. Planting Eucalyptus on former cropland can increase aboveground biomass carbon and contribute to climate change mitigation [11].
Nevertheless, the uncontrolled expansion of Eucalyptus on crop lands has raised great concern, mainly related to its impact on food production and water resources [12]. A recent study reported that the conversion of cropland into Eucalyptus in the central highlands has led to an annual loss of 4.5 × 10⁷ kg of wheat production or 3.1 × 10⁷ kg of barley, which translates to the grain needs of 70,000 to 100,000 households [13]. Producing more food for a growing population in the coming decades, while at the same time combating poverty and hunger and coping with the impacts of climate change, is the major challenge facing agriculture in Africa. Another issue related to Eucalyptus expansion is its impact on water resources, as the species has been reported to have high water consumption, mainly attributed to its fast growth and high biomass production. This implies that carbon sequestration could be another important variable to be considered when analyzing the Eucalyptus expansion issue. Moreover, the analysis can now move further from the single objective of maximizing economic gains from wood production to the consideration of multiple objectives such as carbon, water and food, which requires multi-objective optimization.
The decision of whether to facilitate or else to constrain the expansion of Eucalyptus requires scientific-based decision support systems. Available studies related to the issue are mainly based on interview-based qualitative justifications, e.g., [8,14], or plot- and household-level comparisons of crop and Eucalyptus land uses in terms of economic and ecological variables [6,13,15,16,17]. There is an opportunity to take advantage of advanced decision support tools to provide more information to policymakers and other stakeholders about the impacts of Eucalyptus plantations on timber-related revenues, crop production, carbon and water resources.
Linear programming (LP) is a powerful tool to formulate and solve practical economic problems and is widely applied in management planning in several economic activities [18]. There exists a wealth of literature demonstrating the use of LP in solving forest and land management planning problems [19]. The literature also reports the use of multiple criteria decision analysis (MCDA) for finding solutions to decision problems with multiple conflicting goals or criteria [19,20]. In this case, in decision analysis one sets criteria to address the supply of multiple ecosystem services in a multi-objective forest management planning process, and then adopts an MCDA method to analyze the tradeoffs among these criteria [21]. There are various decision support tools based on MCDA [22]. The tools provide outputs through which end users and scientific researchers can learn and understand the impacts of management plans on the provision of forest ecosystem services [23,24]. For example, the literature reports recent successful applications of the Pareto frontier tool [25]. The Pareto Frontier is an a posteriori MCDA approach in which decision makers are not required to set targets for criteria before being informed of trade-offs among ecosystem services.
MCDA and its application in tradeoff analysis have been extensively used and developed for plantation forest management, including that of Eucalyptus forests [25,26,27,28,29]. Borges et al. [25] analyzed tradeoffs between four economic and environmental criteria (objectives), i.e., net present value (NPV), timber supply, cork supply, carbon stock and value of ending inventory. Researchers in Northeast China also used MCDA to examine tradeoffs between carbon, timber and total NPV [30]. A study in the Western Alps characterized trade-offs and synergies between timber production, biodiversity conservation and protection against natural hazards using the Pareto frontier method [31].
However, applications of LP or of MCDA in support of management planning and policy analysis in agroforest landscapes and in developing countries such as Ethiopia are scarce. The current study has therefore attempted to address this gap. It examines the impacts of converting cropland into Eucalyptus plantations. Namely, we focus on the impacts of this conversion on economic returns, as well as on the provision of other ecosystem services (e.g., food production, carbon and water). We analyze further the tradeoff between these ecosystem services. The goal of this study is to help identify land allocation and plantation management strategies that may address several criteria simultaneously, while considering the tradeoffs between them. Specifically, this research considers a Eucalyptus-dominated agroforest landscape located in northern Ethiopia and uses LP and MCDA to examine land allocation and plantation management alternatives and their impacts on economic gains from harvesting Eucalyptus timber, while addressing food production and water use concerns.

2. Materials and Methods

2.1. Case Study Area

The study was conducted in the agroforest landscape of Kosoye Amba Kebele administrative unit of the Wogera district, Northwestern Ethiopia (Figure 1). It is located at 37.36° E longitude and 12.46° N latitude. The altitude ranges from 1100 m to 3040 m a.s.l, with an average altitude of 2812 m a.s.l. The mean annual rainfall is between 1000 and 1200 mm, and the minimum and maximum temperature are 14 °C and 33 °C, respectively. The rainy season extends from June until the end of September, with most of the rain being received in July and August [32].
The decision to select the case study area was made in cooperation with the district forestry experts. In this area, the rate of conversion of cropland to Eucalyptus woodlots has been relatively high, leading to a substantial area of Eucalyptus. It extends over 1987 ha, of which 1327 ha is cropland and 660 is plantation forest. The regional administrative office reports a total of 1350 households in the Kebele. Crop production (e.g., wheat, barley and beans) is the main livelihood activity of these households. Small-scale Eucalyptus farming has been part of this crop-dominated livelihood system. Its importance increased over the past couple of decades, in which farm households have reportedly converted their croplands into Eucalyptus woodlots. On average, a household in the case study area manages 0.013 ha of Eucalyptus woodlots—established mainly on former croplands—which is about 20% of the average household land holding size. The woodlots are a source of cash income, generated from the sale of round wood (the size ranges from 7 to 13 cm DBH) and fuel wood. The case study area is classified into 81 homogeneous analysis areas based on land cover type (e.g., Eucalyptus, barley and beans) as well as on eucalypt stand age, productivity and cutting cycle.

2.2. Model Building

The goal of this study was to examine land allocation and plantation management alternatives and their impacts on economic gains from harvesting Eucalyptus timber, while addressing food production and water use concerns. In the case of the Eucalyptus analysis areas, we considered three alternative harvest ages (four, five and six years), whereas in the case of crop analysis areas, we considered two alternatives, e.g., no conversion and conversion to Eucalyptus in the beginning of the planning horizon. In the case of the latter, after the conversion, Eucalyptus may be harvested at four, five or six years of age. We considered a planning horizon extending over nine one-year periods. Each management alternative in each analysis area corresponded to a decision variable in a Model I linear program [33]:
j = 1 M i X i j = a i , i = 1 , , N
i = 1 N j = 1 M i w i j t X i j = W t , t = 1 , , T
i = 1 N j = 1 M i c a r b o n i j t X i j = C A R B t , t = 1 , , T
i = 1 N j = 1 M i w a t e r i j t X i j = W A T E R t , t = 1 , , T
i = 1 N j = 1 M i c r o p i j t X i j = C R O P P R O D t , t = 1 , , T
L E V = i = 1 N j = 1 M i l e v i j X i j
T O T W O O D = t = 1 T W t
V o l E I = i = 1 N j = 1 M i v e i i j X i j
C A R B A v e r = t = 1 T C A R B t / T
W U T O T = t = 1 T W A T E R t
W U A n n u a l = t = 1 T W A T E R t / T
C R O P T O T = t = 1 T C R O P P R O D t
C R O P A n n u a l = t = 1 T C R O P P R O D t / T
X i j 0 , i j
where N = 81, the total number of analysis areas.
  • Mi = the number of prescriptions for analysis area i.
  • T = 9, the number of planning years.
  • Xij = number of hectares of analysis area i assigned to prescription j.
  • ai = total area of the analysis area i.
  • wijt = wood harvested in period t that results from assigning prescription j to analysis area i. This was estimated using a local growth model, with a yield table for seedling and coppice stands in four productivity site classes [34].
  • carbonijt = yearly carbon stock at the end of period t that results from assigning prescription j to analysis area i [34].
  • waterijt = total annual water use in period t that results from assigning prescription j to analysis area i [34].
  • cropijt = annual crop production in period t that results from assigning prescription j to analysis area i.
  • levij = land expectation value associated with prescription j in analysis area i. Estimated based on information provided by landowners, key informants and merchants (e.g., labor, input, harvesting and transportation costs, as well as product prices). As the major Eucalyptus product that farmers produce and sell in the case study area is poles, this product was considered as the target product in the study.
  • Veiij = Volume of the Eucalyptus inventory at the end of the planning horizon associated with prescription j in analysis area i.
Equation (1) states that the sum of number of hectares in an analysis area assigned to each prescription must be equal to the corresponding analysis area’s total number of ha ai. Equations (2)–(5) define, respectively, the total wood harvested Wt, the carbon stock CARBt, the total water use WATERt and the total crop produced CROPPRODt in each period t. Equations (6)–(13) define, respectively, the case study area land expectation value, the total wood harvested, the standing volume of the inventory at the end of the planning horizon, the average carbon stock across planning periods, the total water use in the planning horizon, the average annual water use, the total crop production in the planning horizon and the average annual crop production in the case study area. The inequalities (Equation (14)) state the non-negativity constraints.
The annual crop production was estimated based on the average yield record in the 2018/19–2019/20 campaign year. The yield in this year was one of the lowest recorded over the past decades (mainly attributed to the late onset of rain and high amount of rain during and after crop maturity). Therefore, two additional average yield scenarios were considered—production in ‘moderately normal’ and ‘normal’ conditions—based on the information from key informants.
The equations (Equations (1)–(14)) were then used to formulate 12 LP models, with each corresponding to a decision scenario (Table 1). The first (MOD 1) and the fourth models (MOD 4) have an objective function of maximizing LEV and VolEI, respectively, and do not include any constraint. They include only the area constraints (Equation (1), Table 1). The second model (MOD 2) extends MOD1 to include a constraint on the land area to be kept for crop production in order to meet annual crop grain needs by households in the case study area (Equation (15), Table 1).
C R O P P R O D t M i n C r o p P r o d H H , t
where CROPPRODt is the total crop produced in each period t, MinCropProd is the annual crop production (for consumption) needs per household, which was reported as 447 kg per year [35], and HH is the total number of households in the case study area.
A third model (MOD 3) also targets LEV maximization and it includes constraints on the annual water use level (Table 1). As explained earlier, the overuse of water is one of the most commonly reported arguments against Eucalyptus tree planting. Hence, in MOD 3, we attempted to set a maximum water use level, equivalent to the case study area’s annual rainfall amount, which was intended to balance the water lost or utilized by the plant for biomass production (Equation (16)).
W A T E R t R F A , t
where WATERt is the total water used for biomass production in each period t, RF is the average annual rainfall amount in cubic meters per hectare (a 30 year average value of 1100 mm per square meter per year or 11,000 cubic meters per hectare per year), and A is the total land area of the case study, which is 1987 hectare.
The four LP models, MOD 1 to 4, considered the average annual crop production based on the ‘low’ crop production scenario, explained above. For the two other production scenarios, eight additional LP models were developed: four models (MOD 5 to 8) for the ‘moderately normal’ scenario, and another four models (MOD 9 to 12) for the ‘normal’ crop production scenario (Table 1).
In order to gain more insights into the impacts of land allocation and plantation management alternatives, we analyzed tradeoffs between objectives using an LP-based Pareto frontier approach [27]. The approach generates the feasible set in the criteria space for the land allocation and management problem using the estimation refinement method (see [25] for a detailed mathematical description of the Pareto frontier approach and its application in forest management). The approach was used to analyze the tradeoffs between six criteria, e.g., LEV, carbon, VolEI, wood harvested, crop production and water use.

3. Results

3.1. Result of Single Objective Optimization

The 12 single-objective LP solutions provide interesting information (Table 2). As expected, the highest LEV and harvested wood values, 8.46 × 10⁹ Ethiopian Birr (ETB) and 8.3 × 10⁵ m3, respectively, were found by the unconstrained LEV maximization models MOD 1, 5 and 9. Nevertheless, in these scenarios there is no crop production—as the whole cropland is allocated for Eucalyptus plantations. Moreover, the average annual water use, 3.76 × 10⁷ m3, is the second highest, next to the unconstrained VolEI maximization scenarios in MOD 4, 8 and 12.
The inclusion of crop production constraints in scenarios MOD 2, 6 and 10 reduced the values of both LEV and the volume of wood harvested as compared to the unconstrained LEV maximization models, the reduction being higher in MOD 2 (0.91 × 10⁹ ETB of LEV and 0.82 × 10⁵ m3 of wood) and lower in MOD 10 (0.40 × 10⁹ ETB of LEV and 0.42 × 10⁵ m3 of wood) (Table 2).
Out of the total 1327 ha of cropland, up to 1112, 1157 and 1200 ha would be converted into Eucalyptus land use, in the case of MOD 2, 6 and 10, respectively (Table 3). These scenarios target the economic gain maximization from wood production, while guaranteeing the minimum food consumption requirements of households. With this land allocation, it would also be possible to store 1.5 to 1.57 × 10⁷ kg yr−1 of carbon in the aboveground biomass (Table 2), which is equivalent to 5.5 to 5.76 × 10⁵ t yr−1 of CO2.
Nevertheless, the land allocations in these scenarios lead to average annual water use values of 3.41, 3.53 and 3.6 × 10⁷ m3 in MOD 2, 6 and 10, respectively. These are lower than the values associated with the unconstrained scenarios, yet they are higher than the case study area’s total annual water available from rainfall, 2.18 × 10⁷ m3.
Scenarios MOD 3, 7 and 11 address the water use concerns by constraining the LEV maximization objective by applying a maximum annual water use, a level equivalent to the annual rainfall of the study area. As expected in these scenarios, there is a substantial decrease in LEV and the volume of harvested wood, ranging from 47.7% to 50.6% depending on the scenario, when compared to the amount in the unconstrained LEV maximization models MOD 1, 5 and 9 (Table 2).
These decision scenarios, on the other hand, are associated with the highest amount of crop production. Given that wheat consumes more water per kg of biomass than Eucalyptus (Table 2) and that wheat occupies two thirds of the cropland in the case study area, one might expect a higher value of water consumption in these scenarios. The opposite was found, however, and this can be explained by the higher biomass production per ha of Eucalyptus as compared to wheat, as well as to the other two crops (barley and beans), which results in higher total water use. Thus, the models opt to maximize the objective function—LEV—while attaining the maximum water use limit by allocating less land for Eucalyptus than for crop production (Table 3). Furthermore, only a small proportion of the land under wheat crop was allocated for Eucalyptus (3.6%, 0.6% and 0.4% in MOD 3, 7 and 11, respectively), whereas it was much higher in the case of barley (63.7%, 56% and 51.3% in MOD 3, 7 and 11, respectively) and bean crops (20.7% in all three scenarios). This reflects that the reduction in LEV due the lower wood production can be compensated for by allocating more land for the crop type that gives the highest production per ha (Table 3) and LEV (which is wheat) while keeping the maximum water use limit.
The crop production scenarios affect other outcomes, namely, when they include a constraint of water use (MOD 3, 7 and 11) (Table 2). For instance, the highest wood volume amount was in the ‘low’ crop production scenario model, MOD 3 (4.34 × 10⁵ m3), whereas the lowest was in the ‘normal’ production scenario model, MOD 11 (4.1 × 10⁵ m3). The reverse was found when the scenarios were compared for LEV and total crop production, with the highest being in MOD 11 (4.46 × 10⁹ ETB and 26.2 × 10⁶ kg) and the lowest in MOD 3 (4.36 × 10⁹ ETB and 10.35 × 10⁶ kg). The land conversion/allocation results show that the amount of crop land to be converted into Eucalyptus was relatively higher in the case of MOD 3 (261 ha) than in the case of MOD 7 (210 ha) and MOD 11 (197 ha) (Table 3). No additional cropland can be converted into Eucalyptus while ensuring that the water use does not exceed the amount available from rainfall. These decision scenarios limit the annual water use, while also contributing to a more even flow of wood and a more even carbon stock compared with the other scenarios (Figure 2, Figure 3 and Figure 4).
One might expect a lower volume of ending inventory in the case of scenarios with constraints on water use as a lower amount of land is converted to Eucalyptus. The result, however, is the opposite—the volume of the inventory at the end of the planning horizon increased by 42%, 50% and 52% in models MOD 3, 11 and 7, respectively, when compared to the value in the unconstrained LEV maximization scenarios (6.19 × 10⁴ m3). The reason for this can better be understood when we see the optimal land conversion/harvesting prescriptions (i.e., convert and harvest at an age of 4, 5 and 6 years) of the model’s solution (Figure 5). The results show that a lower harvesting age (four years) was the optimal prescription in the unconstrained LEV maximization scenarios (MOD 1, 5 and 9) as well as in the case of scenarios with constraints on crop production (MOD 2, 6 and 10). In all these scenarios, the converted crop land was assigned to be managed under a four-year rotation age.
When the objective was to maximize the standing volume at the end of the planning horizon in MOD 4, 8 and 12, the crop land units were assigned to a conversion to Eucalyptus and to be managed under a five-year rotation age (Figure 5). This is related to the age at the end of the planning horizon and the respective standing volume. A hectare of land converted to Eucalyptus and managed with a five-year rotation at the end of the planning horizon will have a stand that is four years old, whereas if that same hectare was converted to Eucalyptus and managed with a three- or a four-year rotation, it would have a stand that is one year or three years old, respectively. Those decision scenarios lead to the highest volume of the ending inventory (50.62 × 10⁴ m3) as well as the highest aboveground carbon stock (2.76 × 10⁷ kg). Conversely, they are associated with the lowest volume of harvested wood (4.14 × 10⁵ m3). This is half the volume in the unconstrained LEV-maximization scenarios. Nevertheless, the LEV is only 0.71 lower than the LEV in the latter scenarios. This finding is expected, because LEV considers future net revenues of Eucalyptus woodlots, which means that the value of the standing volume is included in the estimation, though it is not harvested within the planning horizon.
Constraining the LEV maximization objective by annual water use in MOD 3, 7 and 11 led to higher harvesting ages, which is in contrast with the solutions in the other scenarios (Figure 5). The results show that 43.8%, 48.8% and 52.7% of the total cropland to be converted into Eucalyptus was assigned to be managed with six-year rotations in MOD 3, 7 and 11, respectively. The remaining land was allocated for four- and five-year rotations, with 20%–26% for the former and 26%–30% for the latter. For the same reason as explained above in the case of the ending inventory maximization scenarios, the higher number of hectares assigned to higher harvesting ages resulted a higher ending inventory volume in the water-use-constrained LEV-maximization scenarios (MOD 3, 7 and 11) as compared to the unconstrained (MOD 1, 5 and 9) and crop-production-constrained scenarios (MOD 2, 6 and 10), in which more land was allocated to lower harvesting ages (Figure 5). Similarly, the sharp difference in the volume of the ending inventory among the water-use-constrained scenarios also resulted from the different assignments of harvesting prescriptions.
Another important finding in the current study is related to the impact of site productivity classes on decision scenarios. A variation was found only in the solutions from the water-use-constrained LEV-maximization scenarios (MOD 3, 7 and 11). In all these three scenarios, it was from the lower-productivity class sites (class IV sites) that the larger area of crop land was allocated for (or chosen for conversion into) Eucalyptus (47.2%, 37.4% and 37.7% of the total 275 ha in MOD 3, 7 and 11, respectively), whereas the entire cropland from site class II was assigned to remain as cropland in all models (Table 4). Most area was assigned to the six-year rotation in site class IV, five-year rotation in site class III and four-year rotation in site class I.

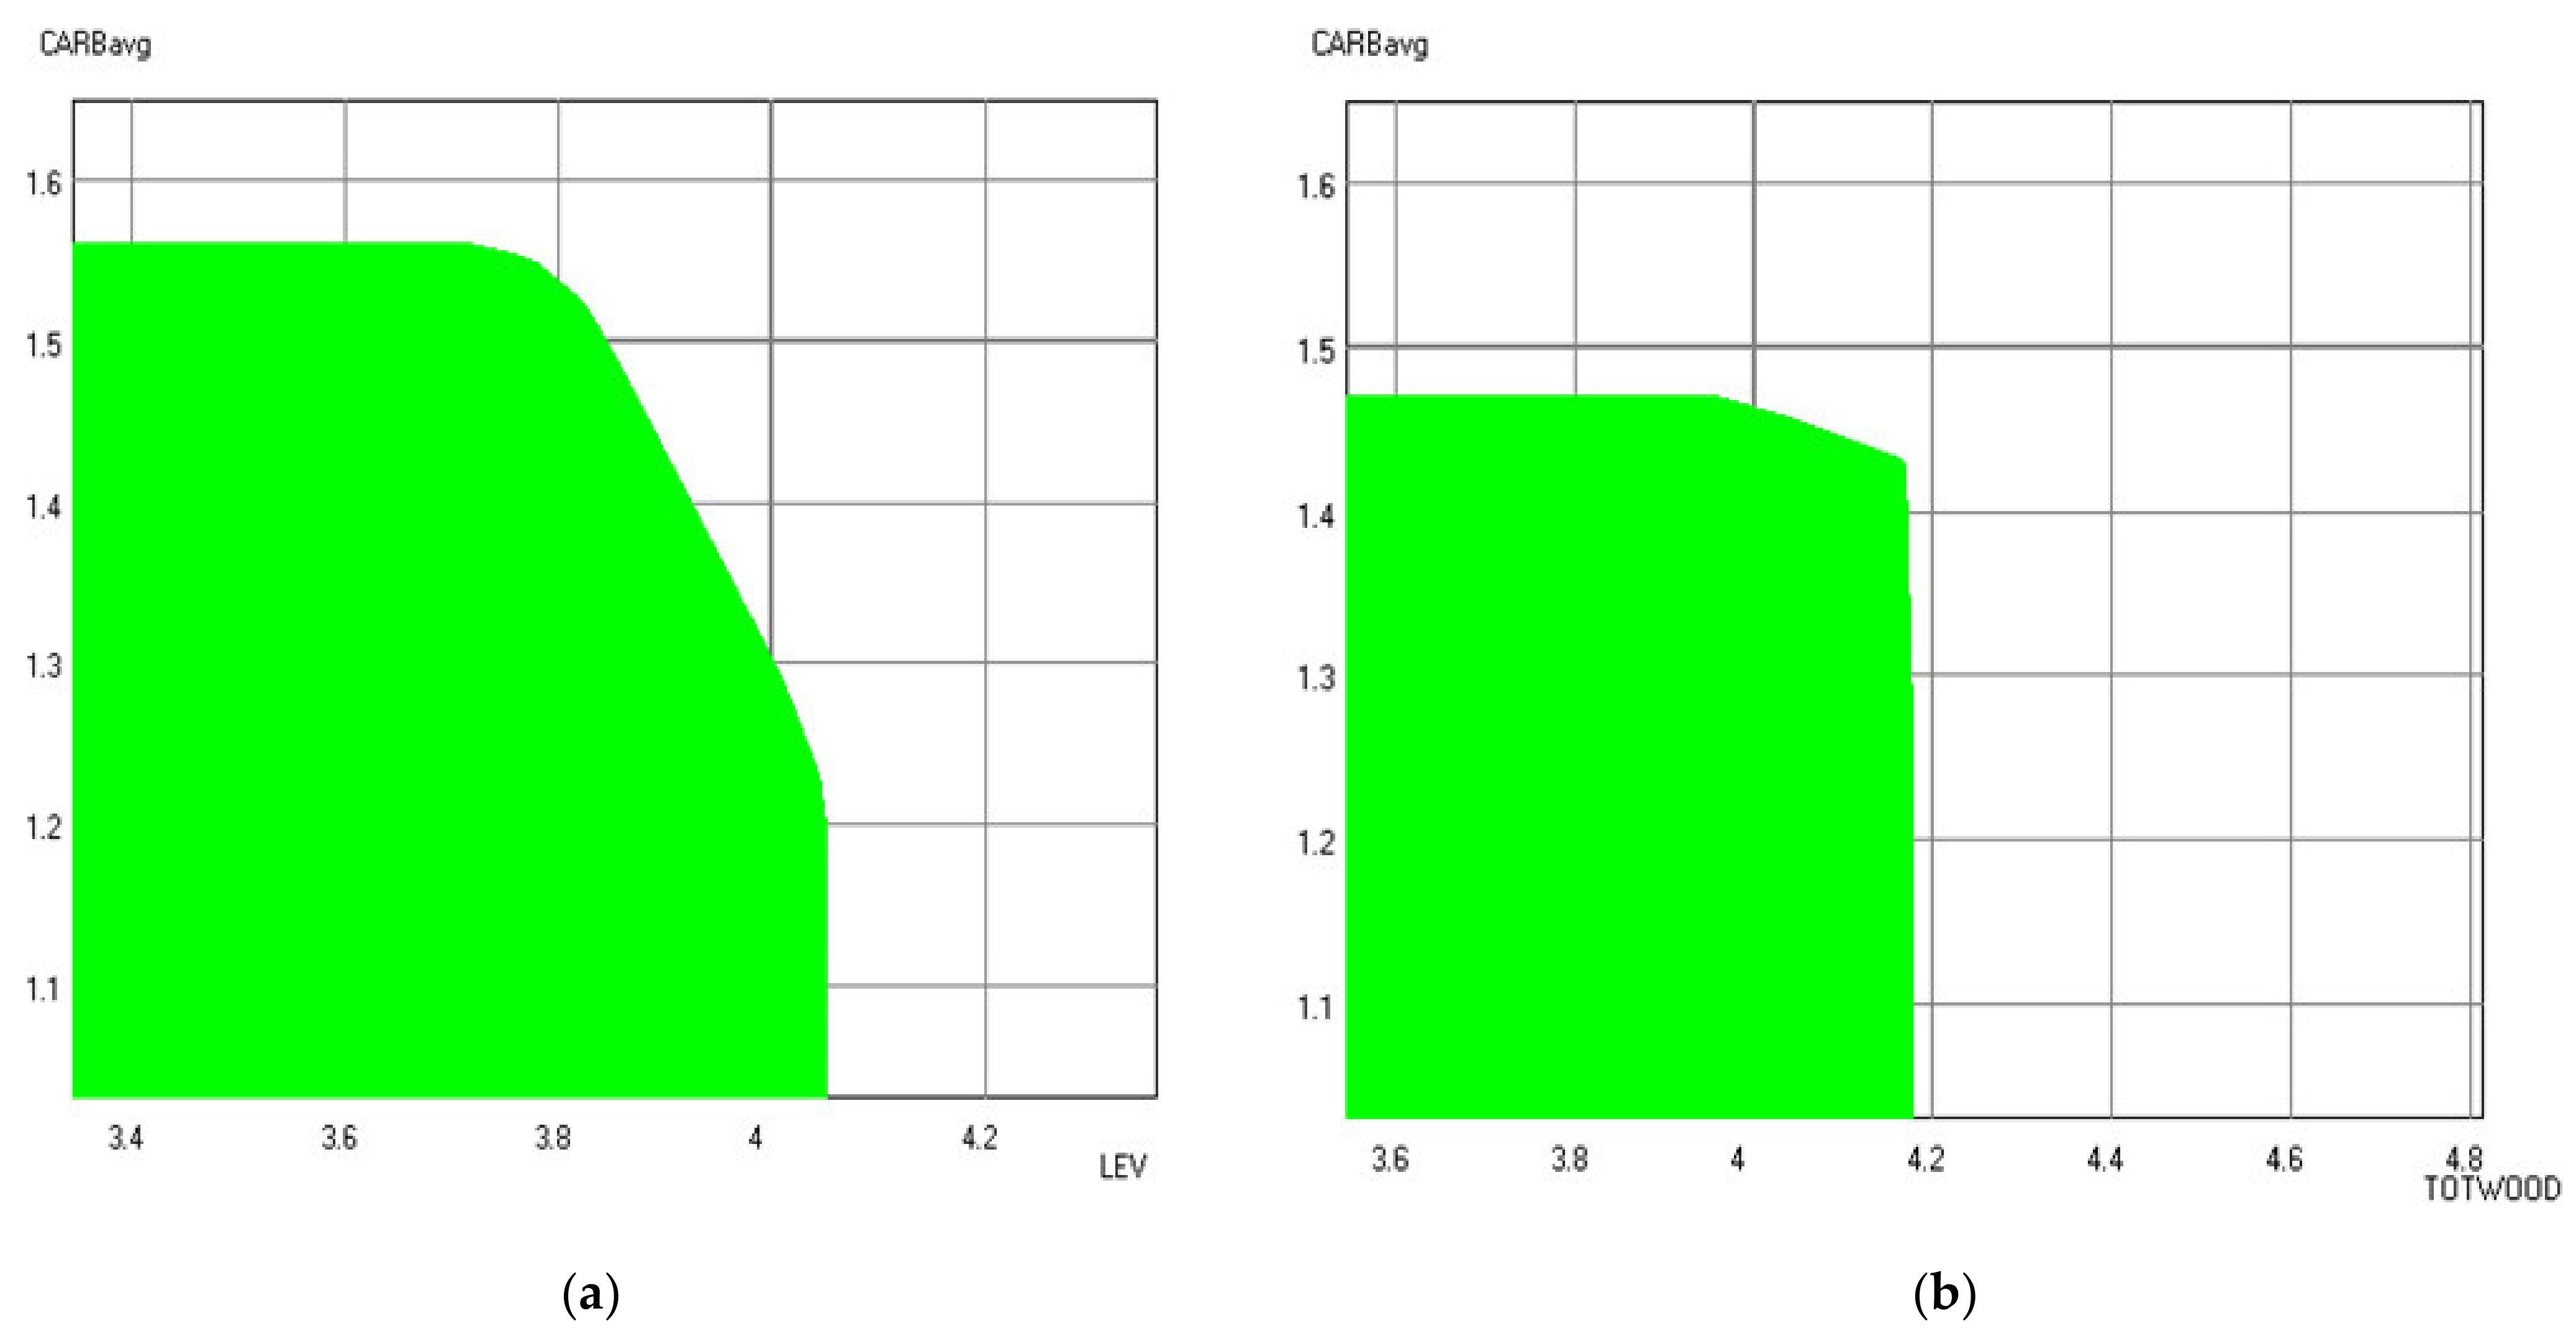
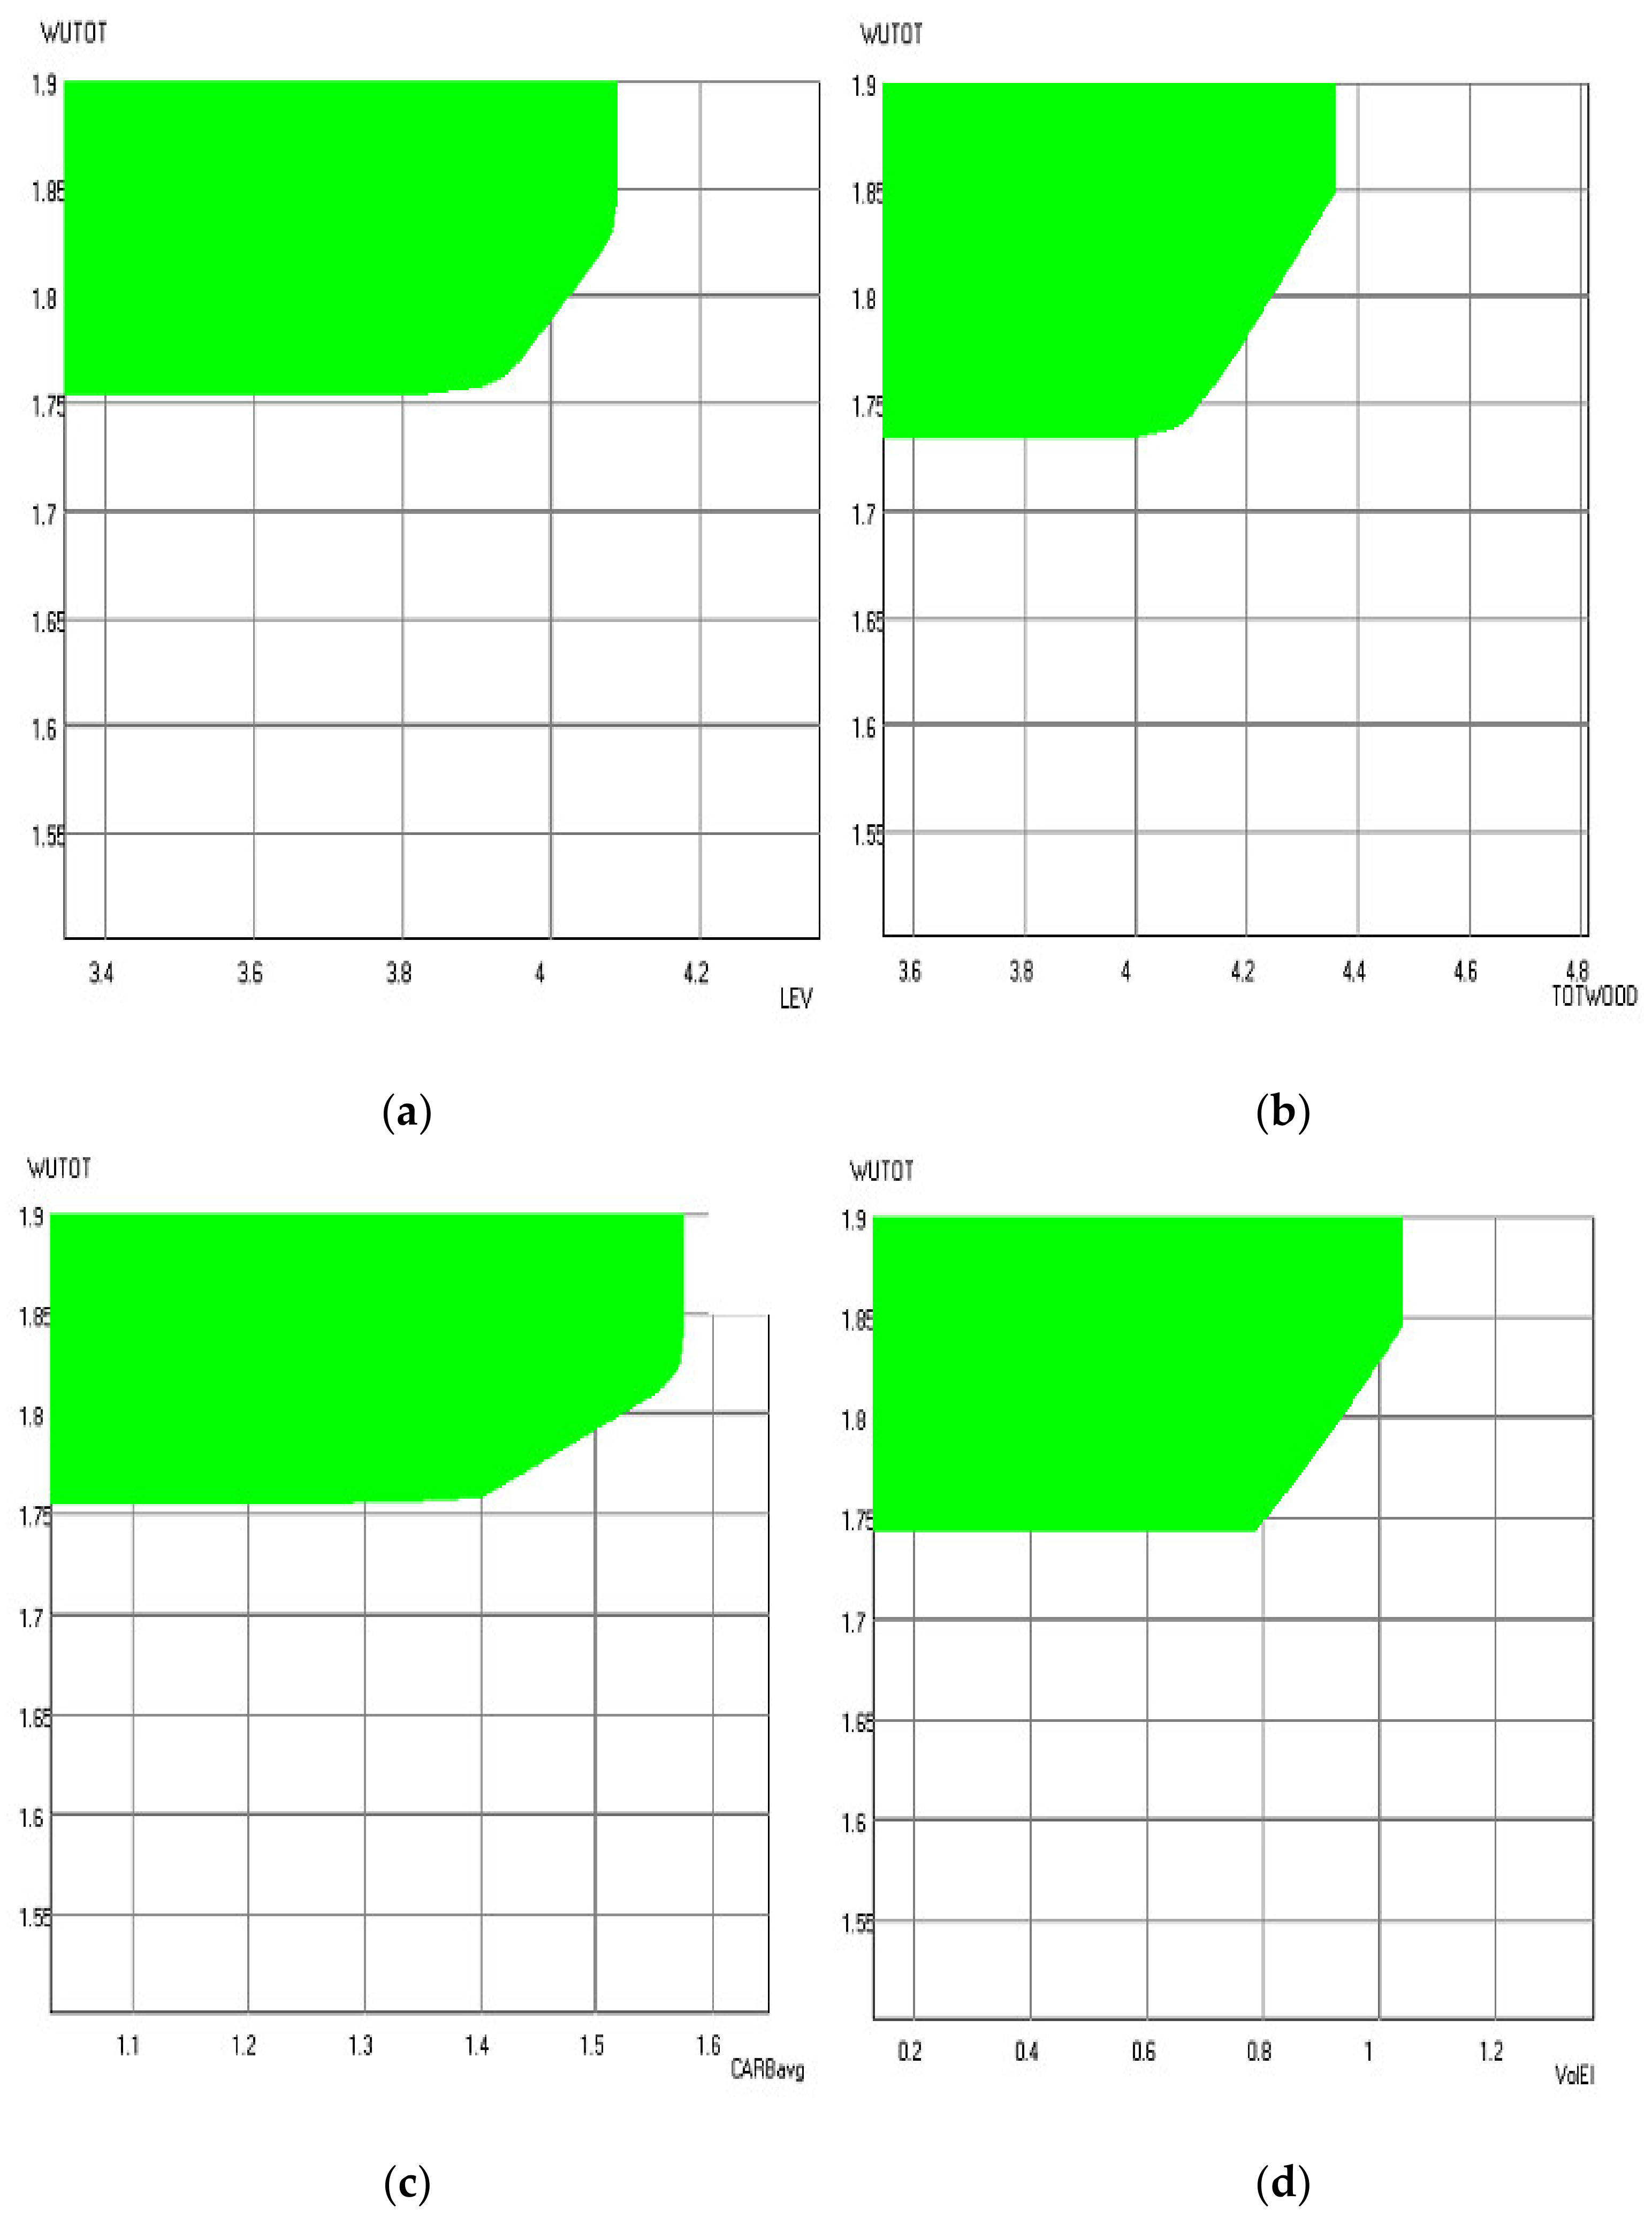
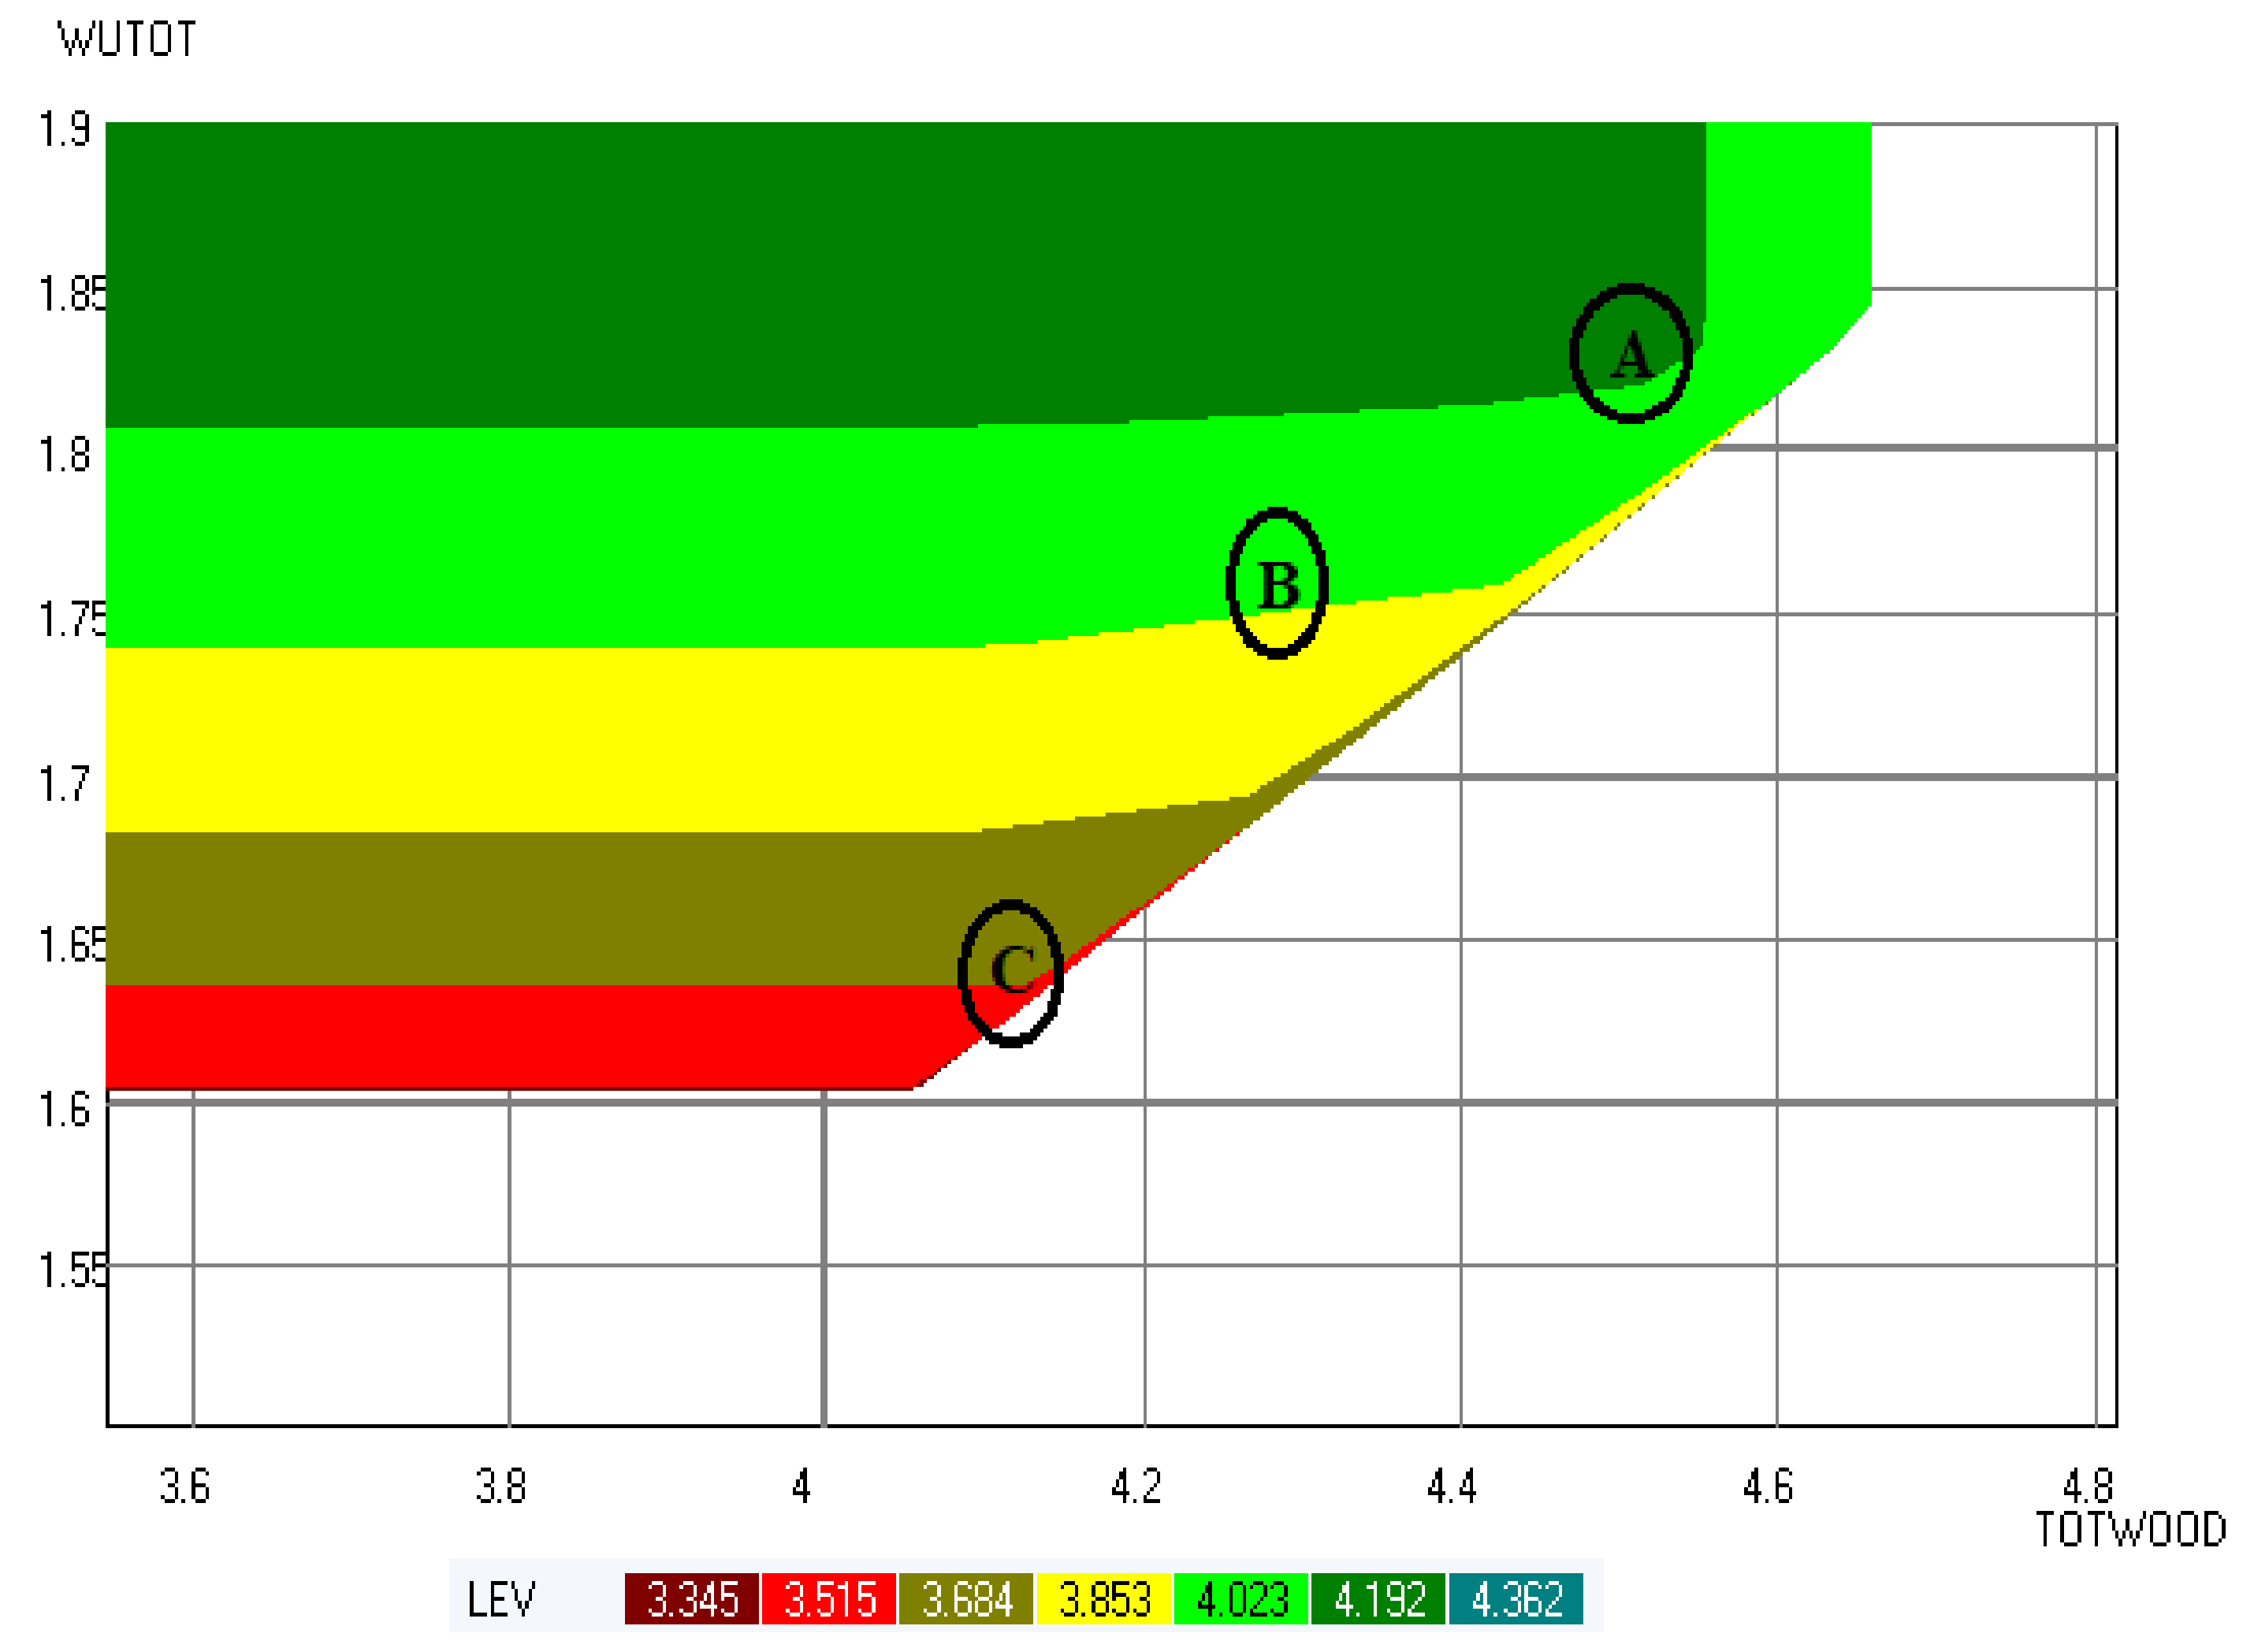
3.2. Trade-Offs between Management Planning Criteria

Unlike single-criterion optimization scenarios, the tradeoff analysis considered multiple objectives—the maximization of LEV, the volume of wood harvested, the volume of the ending inventory, aboveground carbon stock and total crop production, as well as the minimization of total water use over the planning horizon. An LP file similar to the one developed for MOD 3, presenting a decision scenario constrained by annual water use, was used to study the tradeoffs between the six criteria.
The Pareto frontier tool provided the minimum and maximum values for each criterion. Accordingly, minimum and maximum values of 3.35 × 10⁹ and 4.36 × 10⁹ ETB, respectively, were found for LEV, whereas the values for total wood harvested over the planning horizon ranged from 3.55 × 10⁵ to 4.82 × 10⁵ m3, and for the volume of the ending inventory the values ranged from 0.13 × 10⁵ to 1.37 × 10⁵ m3. For the average aboveground carbon stock, the minimum value was 1.03 × 10⁷ kg, whereas the maximum was 1.65 × 10⁷ kg. Regarding water use, a minimum of 1.5 × 10⁸ m3 of water would be used over the planning horizon, which corresponds to1.6 × 108 m3 of water per year (whereas the maximum value was. 1.9 × 10⁸ m3 of total water use, corresponding to 2.1 × 10⁸ m3 per year). For the remaining criteria, i.e., crop production, the amount of total crop production over the planning horizon ranged from 9.02 × 10⁶ to 11.92 × 10⁶ kg, which is equivalent to a yearly production of 1 × 10⁶ to 1.32 × 10⁶ kg. This minimum crop production amount is by far larger than the minimum crop production requirement (for consumption) for the case study area (0.41 × 10⁶ kg per year).
By keeping the value of the crop production criteria at this minimum value, a five-dimensional decision map depicting the tradeoffs among the other five criteria was produced (Figure 6). The overall information from the map is that maximizing carbon stock and/or VolEI would come at the cost of reduced harvested wood volume or LEV and increased total water use. The results showed that the amount of carbon stock can be increased from the minimum value of 1.03 × 10⁷ kg up to a maximum of 1.34 × 10⁷ kg, although ensuring an increase in harvested wood volume from its minimum value of 3.55 × 10⁵ m3 to a maximum value of 4.60 × 10⁵ m3 (Figure 6). However, in order to increase the maximum value of carbon stock from 1.34 × 10⁷ to 1.44 × 10⁷ kg, the maximum harvested wood volume should be decreased from 4.60 × 10⁵ to 4.39 × 10⁵ m3. For a further increase in the maximum value of carbon stock up to 1.55 × 10⁷ kg, there should be an equivalent reduction in the maximum harvested wood volume from 4.39 × 10⁵ to 4.18 × 10⁵ m3. In other words, the maximum carbon stock would decrease from 1.55 × 10⁷ to 1.34 × 10⁷ kg if it was necessary to increase the maximum harvested wood volume from 4.18 to 4.60 × 10⁵ m3 (Figure 6).
Increasing the maximum harvested wood volume could lead to a reduction in VolEI, especially for harvested wood values greater than 3.97 × 10⁵ m3. For instance, at a maximum harvested wood volume of 3.97 × 10⁵ m3, there would be a maximum VolEI value equal to 1.16 × 10⁵ m3, whereas when the wood volume grows to a maximum of 4.18 or 4.60 × 10⁵ m3, the maximum VolEI would be 0.96 × 10⁵ or 0.54 × 10⁵ m3, respectively (Figure 6).
As expected, a change in the maximum values of these criteria was found to impact the water use criteria. At the minimum values of carbon—1.03 × 10⁷ kg, wood—3.55 × 10⁵ m3 and VolEI—0.13 × 10⁵ m3, the minimum water use was 1.5 × 10⁸ m3 (Figure 6). When the carbon stock value grows to a maximum value of 1.34 × 10⁷ kg, while keeping the harvested wood volume at 3.55 × 10⁵ m3, the minimum water use value would be 1.59 × 10⁸ m3, whereas at a maximum carbon stock value of 1.55 × 10⁷ kg, again with the same level of harvested wood, the water use would be at least 1.70 × 10⁸ m3. This minimum water use is associated with the minimum LEV value at each carbon stock level (as shown in the colored slices of the five-dimensional map, Figure 6). Water use values increase with LEV. For instance, in the case of the former carbon stock value, the minimum water use value ranges from 1.59 × 10⁸ m3 at an LEV value of 3.45 × 10⁹ ETB, and 1.65 × 10⁸ m3 at 3.68 × 10⁹ ETB up to 1.81 × 10⁸ m3 at 4.19 × 10⁹ ETB. In the latter case, it ranges from 1.70 × 10⁸ m3 through 1.73 × 10⁸ m3, up to 1.81, with an LEV value of 3.51 × 10⁹ ETB, 3.68 × 10⁹ ETB and 4.02 × 10⁹ ETB, respectively.
The tradeoffs can better be understood if we look at a bi-dimensional map, showing tradeoffs between two criteria, while fixing the values of the other criteria. For illustration, some bi-dimensional maps were produced to depict tradeoffs between carbon and LEV; carbon and harvested wood; and between water use and LEV, wood and carbon (Figure 7 and Figure 8). Accordingly, the map for LEV and carbon stock (Figure 7a) shows that the maximum aboveground carbon stock that can be stored per year is almost 1.56 × 10⁷ kg, corresponding to a value of 3.34 × 10⁹ ETB of LEV. Moving forward along the horizontal axis of the map, it is shown that LEV can be increased up to 3.716 × 10⁹ ETB without decreasing the amount of carbon stock. A further increase in LEV above this value would result in a reduction in carbon stock. For instance, an increase in LEV from 3.716 × 10⁹ to 3.778 × 10⁹ ETB (1.65%) resulted a corresponding decrease in carbon stock from 1.562 × 10⁷ to 1.552 × 10⁷ kg (0.60%). Furthermore, a change in LEV from 3.999 × 10⁹ to 4.040 × 10⁹ ETB (1.002%) is reflected in a decrease in carbon stock from 1.3 × 10⁷ to 1.235 × 10⁷ kg (5.28%).
Carbon stock also had a tradeoff with harvested wood volume, but mainly at higher values of the latter (Figure 7b). Up to a wood volume value of 3.98 × 10⁵ m3, carbon stock can be increased—to a maximum of 1.471 × 10⁷ kg—without decreasing the harvested wood volume. After this value, a 2.15% increase in the amount of harvested wood, from 3.98 × 10⁵ to 4.045 × 10⁵ m3, led to a 0.92% reduction in carbon stock, from 1.471 × 10⁷ to 1.458 × 10⁷ kg, whereas a 0.07% increment of harvested wood, from 4.170 × 10⁵ to 4.174 × 10⁵ m3, led to a 9.77% reduction in carbon stock, from 1.374 × 10⁷ to 1.252 × 10⁷ kg. At the maximum harvested wood volume, which was 4.18 × 10⁵ m3, the corresponding carbon stock amount would become 1.03 × 10⁷ kg.
Similarly to the results discussed previously, total water use was increased with an increase in LEV, harvested wood volume, carbon stock and ending inventory criteria (Figure 8a–d). According to the result, starting from an LEV value of 3.8 × 10⁹ ETB, an increase in LEV increased the total water use. For instance, a change in LEV from 3.832 × 10⁹ to 3.934 × 10⁹ ETB (2.62%) results in a corresponding increase in total water use from 1.756 × 10⁸ to 1.763 × 10⁸ m3 (0.38%) (Figure 8a). On the other hand, a change in LEV from 4.063 × 10⁹ to 4.086 × 10⁹ ETB (0.54%) is reflected in an increase in total water use from 1.819 × 10⁸ to 1.844 × 10⁸ m3 (1.37%). Likewise, a 2.04% increase in the amount of harvested wood, from 4.00 × 10⁵ to 4.083 × 10⁵ m3, led to a 0.34% increase in total water use, from 1.735 × 10⁸ to 1.741 × 10⁸ m3, whereas a 1.95% increase in harvested wood, from 4.083 × 10⁵ to 4.164 × 10⁵ m3, led to a 1.58% increase in total water use, from 1.741 × 10⁸ to 1.769 × 10⁸ m3 (Figure 8b).
The conversion of cropland into Eucalyptus is driven by economic gains and yet it impacts water use, an important issue in the case study area. Thus, for illustration, we compared different possible Pareto front points in water use–LEV–harvested wood three-dimensional decision maps (Figure 9). Point ‘A’ is characterized by a high economic gain (in terms of LEV) of 4.193 × 10⁹ ETB, but with high water use (1.824 × 10⁸ m3), resulting from the higher harvested wood volume (4.51 × 10⁸ m3) and lower carbon stock (1.24 × 10⁷ kg) (Table 5). At Point ‘C’, a lower economic gain (3.701 × 10⁹ ETB of LEV) and lower total water use (1.642 × 10⁸ m3) can be observed, which is mainly because of the lower harvested wood volume (4.118 × 10⁵ m3). The Pareto frontier analysis also provides information about how much of the total land of the study area can be covered with Eucalyptus and cropland so as to attain the aforementioned values of the criteria. Accordingly, at Point ‘A’—i.e., the point with the highest LEV value but at the expense of higher water consumption—the area of land under Eucalyptus plantation would be 835 ha, and 1152 ha of cropland, which means only 175 ha of the current cropland (out of 1337 ha) could be converted into Eucalyptus. If it is necessary to limit the total water use up to 1.642 × 10⁸ m3, i.e., at Point ‘C’, there will be a reduction in LEV; and the land under Eucalyptus should not be more than 696 ha, which means that only 34 ha of the current cropland should be converted.

4. Discussion

The approach presented in the current study employed single- and multiple-objective optimization (trade off analysis) to examine land conversion and management alternatives with respect to the impact on economic and ecological variables. The results from the single-objective optimization models, reflecting 12 decision scenarios, highlight that as long as the objective is to maximize the economic gains from land resources, Eucalyptus plantation is the best and feasible form of land use as compared to the crop production alternative. This objective leads to a complete conversion of the available cropland into Eucalyptus woodlots.
Given that crops (wheat, barley and beans) are the main source of the people’s staple food, the complete conversion of cropland will have a substantial impact on the availability of food in the case study area. In the highlands of Ethiopia, the conversion of cropland into Eucalyptus has led to losses of 4.5 × 10⁷ kg of wheat production or 3.1 × 10⁷ kg of barley production annually [13], which translates to the grain needs of 70,000 to 100,000 households. Therefore, this clearly shows that decisions regarding Eucalyptus expansion must consider its impact on food security. Regarding the harvesting prescriptions, the models preferred shorter harvesting periods, with all the converted cropland assigned to be managed under a four-year rotation age. This means that the additional biomass that could potentially result from extending the rotation is not sufficient to offset the loss of discounted net revenues. An important point to be noted here is that the selling product considered in the study is construction poles, not timber, so the result could be different if other wood products that needed to be larger were considered. This, however, requires further investigation.
Constraining the LEV maximization objective with a certain crop production amount (equivalent to the annual household food consumption requirement) resulted in a reduction in LEV and wood, with the reduction being lower in MOD 10 (the normal crop production scenario). This indicates that with a normal crop production scenario, a relatively small area of cropland is enough to meet the minimum crop production constraint, and hence more land can be allocated for Eucalyptus land use, the result of which is higher wood production and LEV as compared to models considering the two other crop production scenarios, MOD 2 and 6. With this land allocation, it could also be possible to store 1.5 to 1.57 × 10⁷ kg yr−1 of carbon in the aboveground biomass, which is equivalent to 5.5 to 5.76 × 10⁵ t yr−1 of CO2. if the conversion of cropland into Eucalyptus is regulated by landscape level ecologic/economic objectives, the potential of the Eucalyptus-agriculture mosaic landscape to simultaneously address economic, food security and climate change mitigation objectives can be achieved. This potential integration of economic and climate change mitigation objectives through plantation and woodlots has been suggested by other authors [10,11]. Furthermore, an increase in land allocation for Eucalyptus with increasing crop production—i.e., from MOD 2 to 10—also indicates that agricultural measures to enhance crop production could help to attain the food security targets in a small area of land so that more land can be allocated for Eucalyptus, leading to a higher economic gain while contributing towards carbon sequestration.
Water use is one of the most important aspects discussed in relation to Eucalyptus expansion in Ethiopia [36]. In the current study, we attempted to address water use concerns by constraining the LEV maximization objectives by impose a maximum annual water use value, a level equivalent to the annual rainfall in the study area, i.e., decision scenarios MOD 3, 7 and 11. This approach obviously has drawbacks, as not all of the rainfall in the area would remain there (the area in which Eucalyptus is planted); rather, a certain amount would exit this area through evaporation and runoff. In addition, it does not consider the influence of silvicultural options on water use. However, it is able to depict the relationship/impact. Accordingly, the constrained scenarios, as expected, resulted in a significant decrease in LEV and the volume of harvested wood as compared to the unconstrained ones. Moreover, there was a significant reduction in the amount of land allocated for Eucalyptus.
The reduction in land allocated for Eucalyptus and of the volume of harvested wood was associated with the increase in crop productivity, i.e., from the ‘low’ crop production scenario (MOD 3) to the ‘moderate’ (MOD 7) and ‘normal’ (MOD 11) scenarios. This could be related to the magnitude of contributions from the uses of cropland towards the objective function, i.e., LEV maximization, while maintaining the maximum water use limit. As this contribution may increase with crop production, the allocation of a unit of land for crop use in the case of the ‘normal’ crop production scenario (MOD 11) could contribute more towards the objective function, LEV maximization, than that of ‘ moderately normal’ (MOD 7) and ‘low (MOD 3) production scenarios. The result is thus a higher allocation of land for cropland uses by MOD 11, and hence, higher total crop production and total water use (but not beyond the limit), and a lower volume of harvested wood as compared to MOD 3 and 7.
The multiple-objective optimization process, carried out using the Pareto frontier approach, also revealed that maximizing carbon stock and/or VolEI would come at the cost of reduced harvested wood volume or LEV and increased total water use, with the tradeoff being more evident at larger values of the criteria. We determined the possibility of increasing carbon stock without greatly affecting the LEV up to a certain amount, beyond which the tradeoff would begin. Such a tradeoff between the economic returns from wood and carbon stock has also been reported in other optimization studies, e.g., [37,38]. However, it is important to note that different patterns of relationship might have been observed in the current study if the monetary value of carbon sequestration was included in the estimation of LEV; this should therefore be addressed in future optimization studies. Similarly, carbon stock also demonstrated a tradeoff with harvested wood volume, but mainly at higher values of the latter. The reduction in carbon stock with larger wood biomass harvests was also reported in a Eucalyptus-dominated stand in Portugal [29]. The authors reported that higher levels of total harvested wood lead to a lower number of trees and thus a lower capacity to store carbon.
Similarly with the results discussed above, total water use was found to increase with an increase in LEV, harvested wood volume, carbon stock and ending inventory criteria. The implication of this is that an increase in wood production by converting cropland into Eucalyptus plantations would continue to be a threat to water availability in the study area. This finding highlights the importance of future research on hydrological models to fine-tune the estimation of these tradeoffs. Moreover, this result is consistent with the findings of other authors. For instance, Zengin et al., (2015) [39] employed an optimization technique and considered water yield (discharge), and found that the wood production and carbon stock of Eucalyptus and Pine plantations had a greater trade-off with the water yield. Similarly, a study on Pinus elliotii forests in the southeastern USA reported similar relationship patterns for timber production, carbon sequestration and water yields [40].
In line with the current study, a study in the central highlands of Ethiopia reported that, considering a biomass production estimate of ~16,000 kg ha−1 yr−1, Eucalyptus woodlots would consume 12,560 m3 of water per hectare per year, or 1256 mm m−2 yr−1, which was on the same order as the total annual rainfall in their study area, and was substantially higher than estimated evapo-transpiration from crops and grasslands in the area [41]. The authors stressed that this raises a concern for the viability of local streams. Moreover, as the study region is located in the headwaters of the Blue Nile basin, this potentially has broader implications for water resources in a contentious trans-boundary basin. Therefore, the current and future extent of Eucalyptus patches need to be considered in water resource management [36].

5. Conclusions

In this study, we examined land conversion policies (from cropland to Eucalyptus plantations) under several decision scenarios. These scenarios were used to consider economic gains, as well as other ecosystem service objectives (carbon, wood and water use). Based on this analysis, we concluded that as far as the objective is to maximize the total economic gains, Eucalyptus plantations are the best form of land use when compared to the crop production alternative. This scenario favors a complete conversion of the available cropland into Eucalyptus woodlots.
However, in order to at least meet the annual crop production/consumption requirements of households in the case study area, the total Eucalyptus land should be limited to 1772 ha (out of the total 1987 ha), with a sequestration potential of 1.5 to 1.57 × 10⁷ kg yr−1 of carbon in the aboveground biomass. This limit could actually be increased with higher crop productivity. However, this land cover limit should be decreased to 921 ha so as to limit the total annual water use (for biomass production) below the amount available from rainfall (11,000 m3 ha−1 yr−1).
Based on the tradeoff analysis, maximizing the harvested wood volume or LEV would come at the cost of a decreased aboveground carbon stock and volume of the ending inventory and higher total water use. This study further research highlights the potential for the application of Pareto frontier approaches to support the development of effective ecological/economic management strategies and the design of land use policies in an Ethiopian context.
There are, however, some issues that should be addressed in future research. One important issue is that the water use and stand growth model did not take into account climate change and management effects. Realistically, however, a growth and yield model should be developed based on permanent sample plots and climate information. In addition, there are other forest management objectives such as controlling erosion or soil losses, enhancing soil fertility and the impact on biodiversity, which should be integrated into the model as well.

Author Contributions

Conceptualization, D.A. and J.G.B.; methodology, D.A., J.G.B., S.M. and V.B.; software, D.A., J.G.B., S.M. and V.B.; validation, D.A. and J.G.B.; formal analysis, D.A. and J.G.B.; data curation, D.A. and J.G.B.; writing—original draft preparation, D.A. and J.G.B.; writing—review and editing, D.A., J.G.B., S.M. and V.B.; visualization, D.A., J.G.B. and S.M.; supervision, J.G.B. and S.M.; project administration, J.G.B. and S.M.; funding acquisition, J.G.B. and S.M. All authors have read and agreed to the published version of the manuscript.

Funding

This research was supported by the NOBEL project, grant agreement number 773324, which is part of the ERA-NET Cofund ForestValue, by the Marie Skodowska-Curie Research and Innovation Staff Exchange (RISE) within the H2020 Work Programme (H2020-MSCA-RISE-2020/101007950) (DecisionES), by the University of Gondar Research Grant, by the MEDFOR Master Programme on Mediterranean Forestry and Natural Resources Management (Erasmus+: Erasmus Mundus Joint Master Degrees, Project 20171917), by the Portuguese Science Foundation (FCT), Portugal, namely, through the Ph.D. grant of Dagm Abate (UI/BD/151525/2021), by the FCT—Fundação para a Ciência e a Tecnologia, I.P. in the scope of Norma Transitória—DL57/2016/CP1382/CT15, by a project MODFIRE—A multiple criteria approach to integrate wildfire behavior in forest management planning with the reference PCIF/MOS/0217/2017, and by another FCT grant of CIMA, grant number UIDB/04674/2020 and the Forest Research Center Project UIDB/00239/2020 and the University of Gondar grant agreement UOGRCS/2021.

Data Availability Statement

The data that support the findings of this study are available from the corresponding author upon request.

Conflicts of Interest

The authors declare no conflict of interest.

References

  1. Ministry of Environment Forest and Climate Change. Ethiopia Forest Sector Review, Focus on Commercial Forestry and Industrialization. Technical Report. 2017. Available online: www.ethiopia.gov.et (accessed on 12 January 2022).
  2. Bekele, M. Forest Plantations and Woodlots in Ethiopia; Working Paper Series; African Forest Forum: Nairobi, Kenya, 2011; Volume 1. [Google Scholar]
  3. Pohjonen, V.; Pukkala, T. Eucalyptus globulus in Ethiopian forestry. For. Ecol. Manag. 1990, 36, 19–31. [Google Scholar] [CrossRef]
  4. Mekonnen, Z.; Kassa, H.; Lemenh, M.; Campbell, B. The role and management of Eucalyptus in lode hetosa district, central Ethiopia. For. Trees Livelihoods 2007, 17, 309–323. [Google Scholar] [CrossRef]
  5. Achalu, N. Farm Forestry Decision—Making Strategies of the Guraghae Households, Southern-Central Highlands of Ethiopia. Ph.D. Dissertation, Technische University Dresden, Agriculture Natural Resource Extension, Dresden, Germany, 2004. [Google Scholar]
  6. Duguma, L.A.; Hager, H. Farmers’ assessment of the social and ecological values of land uses in central highland Ethiopia. Environ. Manag. 2011, 47, 969–982. [Google Scholar] [CrossRef] [PubMed]
  7. Lemenih, M. Growing ucalypt by smallholder farmers in Ethiopia. In Proceedings of the Congress on Eucalyptus Species Management, History, Status and Trends in Ethiopia, Addis Ababa, Ethiopia, 15–17 September 2010; Gil, L., Tadesse, W., Tolosana, E., López, R., Eds.; Ethiopian Institute of Agricultural Research: Addis Ababa, Ethiopia, 2010. [Google Scholar]
  8. Jenbere, D.; Lemenih, M.; Kassa, H. Expansion of Eucalyptus farm forestry and its determinants in Arsi Negelle District, South Central Ethiopia. Small Scale For. 2012, 11, 389–405. [Google Scholar] [CrossRef] [Green Version]
  9. Tefera, B.; Kassa, H. Trends and driving forces of Eucalyptus plantation by smallholders in the Lake Tana Watershed of Ethiopia. In Social and Ecological System Dynamics; AESS Interdisciplinary Environmental Studies and Sciences Series; Stave, K., Goshu, G., Aynalem, S., Eds.; Springer: Cham, Switzerland, 2017. [Google Scholar] [CrossRef]
  10. Ahimbisibwe, V.; Auch, E.; Groeneveld, J.; Tumwebaze, S.B.; Berger, U. Drivers of household decision-making on land-use transformation: An example of woodlot establishment in Masindi District, Uganda. Forests 2019, 10, 619. [Google Scholar] [CrossRef] [Green Version]
  11. Mesfin, A.; Wubalem, T. Eucalyptus in Ethiopia: Risk or Opportunity? Ethiopian Institute of Agricultural Research: Addis Ababa, Ethiopia, 2014; ISBN 9789994453914. [Google Scholar]
  12. Dessie, G.; Erkossa, T. Eucalyptus in East Africa: Socio-Economic and Environmental Issues; Working Paper FP46/E; FAO: Rome, Italy, 2011. [Google Scholar]
  13. Alemneh, T.; Benjamin, Z.; Simane, B.; Ambelu, A. Changing Patterns of Tree Cover in a Tropical Highland Region and Implications for Food, Energy, and Water Resources. Front. Environ. Sci. 2019, 7, 1. [Google Scholar] [CrossRef]
  14. Tadesse, S.A.; Tafere, S.M. Local people’s knowledge on the adverse impacts and their attitudes towards growing Eucalyptus woodlot in Gudo Beret Kebele, Basona Worena district, Ethiopia. Ecol. Process. 2017, 6, 37. [Google Scholar] [CrossRef] [Green Version]
  15. Chanie, T.; Collick, A.S.; Adgo, E.; Lehmann, C.J.; Steenhuis, T.S. Eco-hydrological impacts of Eucalyptus in the semi humid Ethiopian Highlands: The Lake Tana Plain. J. Hydrol. Hydromech. 2013, 61, 21–29. [Google Scholar] [CrossRef] [Green Version]
  16. Yitaferu, B.; Abewa, A.; Amare, T. Expansion of Eucalyptus woodlots in the fertile soils of the highlands of Ethiopia: Could it be a treat on future cropland use? J. Agric. Sci. 2013, 5, 97–103. [Google Scholar] [CrossRef]
  17. Jaleta, D.; Mbilinyi, B.P.; Mahoo, H.F.; Lemenih, M. Effect of Eucalyptus expansion on surface runoff in the central highlands of Ethiopia. Ecol. Process. 2017, 6, 1. [Google Scholar] [CrossRef] [Green Version]
  18. Mohammadi, Z.; Limaei, S.M.; Shahraji, T.R. Linear programming approach for optimal forest plantation. J. For. Res. 2017, 28, 299–307. [Google Scholar] [CrossRef]
  19. Kaya, A.; Bettinger, P.; Boston, K.; Akbulut, R.; Ucar, Z.; Siry, J.; Merry, K.; Cieszewski, C. Optimisation in Forest Management. Curr. For. Rep. 2016, 2, 1–17. [Google Scholar] [CrossRef] [Green Version]
  20. Belavenutti, P.; Romero, C.; Diaz-Balteiro, L. A critical survey of optimization methods in industrial forest plantations management. Sci. Agric. 2018, 75, 239–245. [Google Scholar] [CrossRef] [Green Version]
  21. Kaim, A.; Anna, F.C.; Volk, M. A review of multi-criteria optimization techniques for agricultural land use allocation. Environ. Model. Softw. 2018, 105, 79–93. [Google Scholar] [CrossRef]
  22. Sacchelli, S.; Bernetti, I. Integrated management of forest ecosystem services: An optimization model based on multi-objective analysis and metaheuristic approach. Nat. Resour. Res. 2019, 28, 5–14. [Google Scholar] [CrossRef]
  23. Baskent, E.Z.; Jordan, G.A. Forest landscape management modeling using simulated annealing. For. Ecol. Manag. 2002, 165, 29–45. [Google Scholar] [CrossRef]
  24. Baskent, E.Z.; Keles, S.; Kadiogullari, A.I. Challenges in developing and implementing a decision support systems (ETcAP) in forest management planning: A case study in Honaz and Ibradi, Turkey. Scand. J. For. Res. 2014, 29, 121–131. [Google Scholar] [CrossRef]
  25. Borges, J.G.; Garcia-Gonzalo, J.; Bushenkov, V.; McDill, M.E.; Marques, S.; Oliveira, M.M. Addressing multicriteria forest management with Pareto Frontier methods: An application in Portugal. For. Sci. 2014, 60, 63–72. [Google Scholar] [CrossRef] [Green Version]
  26. Garcia-Gonzalo, J.; Bushenkov, V.; McDill, M.E.; Borges, J.G. A decision support system for assessing trade-offs between ecosystem management goals: An application in Portugal. Forests 2015, 6, 65–87. [Google Scholar] [CrossRef] [Green Version]
  27. Borges, J.G.; Marques, S.; Garcia-Gonzalo, J.; Rahman, A.U.; Bushenkov, V.; Sottomayor, M.; Carvalho, P.O.; Nordstrom, E.M. A multiple criteria approach for negotiating ecosystem services supply targets and forest owners’ programs. For. Sci. 2017, 63, 49–61. [Google Scholar] [CrossRef]
  28. Marques, S.; Marto, M.; Bushenkov, V.; McDill, M.; Borges, J.G. Addressing wildfire risk in forest management planning with multiple criteria decision-making methods. Sustainability 2017, 9, 298. [Google Scholar] [CrossRef] [Green Version]
  29. Marto, M.; Reynolds, K.M.; Borges, J.G.; Bushenkov, V.A.; Marques, S.; Marques, M.; Barreiro, S.; Botequim, B.; Tomé, M. Web-based forest resources management decision support system. Forests 2019, 10, 1079. [Google Scholar] [CrossRef] [Green Version]
  30. Dong, L.B.; Lu, W.; Li, Z.G. Developing alternative forest spatial management plans when carbon and timber values are considered: A real case from northeastern China. Ecol. Model. 2018, 385, 45–57. [Google Scholar] [CrossRef]
  31. Lafond, V.; Cordonnier, T.; Mao, Z.; Courbaud, B. Trade-offs and synergies between ecosystem services in uneven-aged mountain forests: Evidences using Pareto fronts. Eur. J. For. Res. 2017, 136, 997–1012. [Google Scholar] [CrossRef]
  32. Derbe, T.; Sisay, Y.; Genanew, A. Factors influencing smallholder farmers adoption of Eucalyptus woodlot in Wogera District, North Gondar Zone, Amhara Regional State of Ethiopia. IJSRM Int. J. Sci. Res. Manag. 2018, 6, 566–574. [Google Scholar] [CrossRef]
  33. Johnson, K.N.; Scheurman, H.L. Techniques for prescribing optimal timber harvest and investment under different objectives–Discussion and synthesis. For. Sci. 1977, 23 (Suppl. S1), a0001–z0001. [Google Scholar]
  34. Abate, D.F. An ecological-economic approach to assess impacts of Eucalyptus woodlot expansion in agroforest landscapes of Northern Ethiopia. Master’s Thesis, School of Agriculture, University of Lisbon, Lisbon, Portugal, 2020. [Google Scholar]
  35. Worku, I.H.; Dereje, M.; Minten, B.; Hirvonen, K. Diet transformation in Africa: The case of Ethiopia. Agric. Econ. 2017, 48, 73–86. [Google Scholar] [CrossRef] [Green Version]
  36. Enku, T.; Melesse, A.M.; Ayana, E.K.; Tilahun, S.A.; Abate, M.; Steenhuis, T.S. Groundwater use of a small Eucalyptus patch during the dry monsoon phase. Biologia 2020, 75, 853–864. [Google Scholar] [CrossRef]
  37. Keleş, S.; Başkent, E.Z. Modelling and analyzing timber production and carbon sequestration values of forest ecosystems: A case study. Pol. J. Environ. Stud. 2007, 16, 473–479. [Google Scholar]
  38. Raymer, A.K.; Gobakken, T.; Solberg, B.; Hoen, H.F.; Bergseng, E. A forest optimisation model including carbon flows: Application to a forest in Norway. For. Ecol. Manag. 2009, 258, 579–589. [Google Scholar] [CrossRef]
  39. Zengin, H.; Asan, Ü.; Destan, S.; Engin Ünal, M.; Yeşil, A.; Bettinger, P.; Değermenci, A.S. Modeling harvest scheduling in multifunctional planning of forests for longterm water yield optimization. Nat. Resour. Model. 2015, 28, 59–85. [Google Scholar] [CrossRef]
  40. Cademus, R.; Escobedo, F.J.; McLaughlin, D.; Abd-Elrahman, A. Analyzing trade-offs, synergies, and drivers among timber production, carbon sequestration, and water yield in Pinus elliotii forests in Southeastern USA. Forests 2014, 5, 1409–1431. [Google Scholar] [CrossRef] [Green Version]
  41. Zaitchik, B.F.; Simane, B.; Habib, S.; Anderson, M.C.; Ozdogan, M.; Foltz, J.D. Building climate resilience in the Blue Nile/Abay Highlands: A role for earth system sciences. Int. J. Environ. Res. Public Health 2012, 9, 435–461. [Google Scholar] [CrossRef] [Green Version]
Figure 1. Location map of the case study area in Wogera district, Northern Ethiopia.
Forests 13 00686 g001
Figure 2. Annual harvested wood by decision scenario.
Forests 13 00686 g002
Figure 3. Annual aboveground carbon stock by decision scenario.
Forests 13 00686 g003
Figure 4. Annual water use by decision scenario.
Forests 13 00686 g004
Figure 5. Area assigned to each prescription in each decision scenario.
Forests 13 00686 g005
Figure 6. Set of five-dimensional decision maps showing the tradeoffs between total water use (WUTOT, 108 m3), aboveground carbon stock (CARBavg, 107 kg), total harvested wood (TOTWOOD, 105 m3),volume of ending inventory (VolEI, 105 m3) and land expectation value (LEV, 109 ETB).
Forests 13 00686 g006
Figure 7. Illustration of two-dimensional decision map showing tradeoffs between aboveground carbon stock (CARBavg, 107 kg) and (a) LEV (109 ETB) and (b) total harvested wood volume (TOTWOOD, 105 m3).
Forests 13 00686 g007
Figure 8. Illustration of two-dimensional decision maps showing tradeoffs between total water use (WUTOT, 108 m3) and (a) LEV (109 ETB), (b) total harvested wood volume (TOTWOOD, 105 m3), (c) carbon stock (CARBavg, 107 kg), and (d) volume of ending inventory (VolEI, 105 m3).
Forests 13 00686 g008
Figure 9. Pareto front points in a three-dimensional decision map showing tradeoffs among LEV, harvested wood and total water use.
Forests 13 00686 g009
Table 1. Summary of crop production and decision scenarios and corresponding linear programming (LP) models.
Crop Production ScenariosDecision Scenarios (LP Models)Objective FunctionConstraintEquations
LowMOD 1MAX LEVNAEquations (1)–(14)
MOD 2MAX LEVMinimum annual grain food consumption needsEquations (1)–(15)
MOD 3MAX LEVMaximum annual water useEquations (1)–(14) and (16)
MOD 4MAX VEINAEquations (1)–(14)
Moderately NormalMOD 5MAX LEVNAEquations (1)–(14)
MOD 6MAX LEVMinimum annual grain food consumption needsEquations (1)–(15)
MOD 7MAX LEVMaximum annual water useEquations (1)–(14) and (16)
MOD 8MAX VEINAEquations (1)–(14)
NormalMOD 9MAX LEVNAEqutaions (1)–(14)
MOD 10MAX LEVMinimum annual grain food consumption needsEquations (1)–(15)
MOD 11MAX LEVMaximum annual water useEquations (1)–(14) and (16)
MOD 12MAX VEINAEquations (1)–(14)
Table 2. Optimal values associated with decision scenarios.
Decision ScenariosLEV (109 ETB *)TOTWOOD (105 m3)CARBAver (107 kg)VolEI (104 m3)WUTOT (108 m3)WUAnnual (107 m3)CROPTOT (106 kg)CROPAnnual (106 kg)
MOD 18.468.31.656.193.393.7600
MOD 27.557.481.56.193.073.413.670.41
MOD 34.364.341.1478.811.872.0810.351.15
MOD 47.754.142.7650.623.483.8700
MOD 58.468.31.656.193.393.7600
MOD 67.97.741.546.193.183.533.670.41
MOD 74.424.191.1539.411.892.1119.392.15
MOD 87.754.142.7650.623.483.8700
MOD 98.468.31.656.193.393.7600
MOD 108.067.881.576.193.243.63.670.41
MOD 114.464.11.169.331.922.1326.22.91
MOD 127.754.142.7650.623.483.8700
* LEV—land expectation value in Ethiopian Birr (ETB), TOTWOOD—total harvested wood, CARBavg—aboveground carbon stock, VolEI—volume of ending inventory, WUTOT—total water use in the planning horizon, WUAnnual—average annual water use, CROPTOT—total crop production in the planning horizon, CROPAnnual—average annual crop production.
Table 3. Optimal land allocation in each scenario.
Decision Scenario/ModelTotal Land Allocated (In ha)
PlantationCrop
MOD 119870
MOD 21772215
MOD 39211066
MOD 419870
MOD 519870
MOD 61817170
MOD 78701117
MOD 819870
MOD 919870
MOD 101860127
MOD 118571130
MOD 1219870
NOTE: before optimization, 660 and 1327 ha were allocated to Eucalyptus plantations and to crop production, respectively.
Table 4. Optimal land allocation (ha) for different site productivity classes in the case of water-use-constrained LEV-maximization scenarios.
Site ClassPrescriptions *MOD 3MOD 7MOD 11
Site IP168.48854.0739.69
P29.11223.530
P3000
P4259.8259.8297.71
Total337.4
Site II **P4/Total482
Site IIIP1000
P253.5430.13253.54
P3000
P4179.25202.658179.25
Total232.79
Site IVP1000
P215.4300
P3114.43102.76103.93
P4145.14172.24171.07
Total275
* Prescriptions: P1—harvesting age 4, P2—harvesting age 5, P3—harvesting age 6, and P4—remain as crop land. ** No conversion of cropland.
Table 5. Solutions in the feasible set for the selected points (points selected in Figure 9).
CriteriaPoint APoint BPoint CChange from Point A to BChange from Point A to C
LEV (109 ETB)4.1934.0193.7010.1740.492
TOTWOOD (105 m3)4.514.2744.1180.2360.392
CARBAvge(107 Kg)1.2371.3081.368−0.071−0.131
VolEI (105 m3)0.6020.6810.567−0.0790.035
WUTOT (108 m3)1.8241.7551.6420.0690.182
WUAnnual (107 m3)2.0271.951.8240.0770.203
CROPTOT (106 Kg)11.34711.56411.839−0.217−0.492
CROPAnnual (105 Kg)12.60812.84913.155−0.241−0.547
LandUnderEuc (ha)83576569670139
LandUnderCrop (ha)115212221291−70−139
Publisher’s Note: MDPI stays neutral with regard to jurisdictional claims in published maps and institutional affiliations.

