1. Introduction
Combustion of biomass is a major biogeochemical process by which carbon is returned to the atmosphere from terrestrial ecosystems [
1,
2]. Fire has been an important process on Earth from at least the Silurian period over 400 million years ago [
3]; since that period, this process has influenced the evolution of organisms [
4,
5], the successional state of ecosystems [
6], and biogeochemical cycles including the concentration of oxygen and carbon dioxide in the atmosphere [
7]. Although combustion is clearly a natural process that has occurred for much of Earth’s history, there is also a current concern that the incidence of wildfires, due to changes in fuel loads and climate, has and will continue to increase in the future [
8,
9]. Increased combustion could thus serve as a positive feedback to climate change. However, there is also a concern that past estimates of vegetation combustion have been biased upward, with one study indicating that the amount of carbon released by live tree combustion has likely been overestimated by 59% to 83% [
10].
The fraction of a fuel combusted in wildfire depends on the interaction of particle size, packing, moisture, distance from heat source, and rate of energy release [
11,
12,
13,
14,
15,
16]. Although most studies of fuel combustion are on dead biomass, theoretically they can be applied to live fuels and suggest the following mechanisms. As fire intensity (i.e., rate of energy release) increases, so do the temperatures, combustion, and woody plant mortality rates associated with fires. Fine twigs are in close proximity to leaves and other twigs (i.e., within tens of centimeters), leading to more exchange of energy than more distant plant parts; hence, they are likely to be combusted. Moreover, their small diameter increases their surface area-to-volume ratio, allowing them to dry out and absorb energy faster than larger branches and stems. In contrast, large branch segments are not in such close proximity (i.e., separated by 10 to >100 cm), have a lower surface area-to-volume ratio, dry more slowly, and are less effective at absorbing energy from other burning particles. Tree stems or boles are separated by even more distance (i.e., often >1 m) and have a very low surface area-to-volume ratio when compared to twigs or branches; hence, they are the least likely to be combusted. As a result, the smallest diameter woody fuels are theoretically the most likely to be combusted in a wildfire [
17].
Empirical estimates of the fraction of aboveground live woody vegetation combusted (as opposed to killed) by wildfires are highly uncertain, ranging from very little [
10,
17] to the majority [
18]. It is unclear just how much of this variability in estimates is related to methodological differences as opposed to natural variation. We posit that smaller trees would have higher combustion rates than larger ones; moreover, high severity fire areas should have more combustion than low severity fire areas. Thus, natural variation in both vegetation structure and fire severity could lead to a large range in the combustion rate. However, when visual (either ground-based or remote) estimates of combustion after the fire are used, variation either among observers or methods can also introduce uncertainty.
Direct destructive methods are not practical, given the size of woody vegetation such as trees, and because combustion estimates require comparing biomass before and after a fire. Furthermore, there are hazards in working near an advancing fire front. Therefore, the most practical ways to estimate combustion rates are ground-based, post-fire estimates that can then be used to adjust existing biomass equations at the tree level (e.g., Miesel et al. [
17]), make stand-level estimates of the proportion combusted (e.g., Campbell et al. [
19]), and create similar types of estimates at larger spatial scales (e.g., Knorr et al. [
1,
2]). One challenge in making these estimates is to reconstruct the plant parts that were combusted. Another is to relate combustion estimates at one level (e.g., branches) to others (trees, stands, and landscapes); although there clearly has to be a relationship among these levels, most published estimates neither explicitly explore nor use this relationship.
Wildfires in California such as the Rim and Creek Fires have been used as an example of “fires of the future” in which wildfires become more intense, severe, and larger [
20]. One of the many concerns related to such fires is the amount of carbon added to the atmosphere via combustion. Published estimates of combustion rates of aboveground live biomass from the Rim Fire, based on remote sensing, vary from 16% for low severity patches to 85% for high severity patches [
18], whereas ground-based estimates from other fires [
10], theoretical considerations (
Figures S1 and S2), and ground-based observations (
Figure S3) suggest much lower combustion rates. Therefore, our objective was to use ground-based methods to assess the fraction of aboveground woody carbon that is lost via combustion in low, moderate, and high severity patches in large fire complexes, and at multiple levels (twigs, branches and boles, individual trees, stands of trees, and the entire area in which a fire occurs), to test the following five hypotheses:
Smaller woody structures (e.g., twigs) would more likely to be completely combusted than larger ones (e.g., boles);
Combustion loss rates at the individual tree level would increase with fire severity and decrease with tree size (i.e., diameter and height);
High combustion rates in small trees would be countered by lower rates in the largest trees, reducing stand-level average combustion rates, because at the stand-level, larger trees contribute substantially more biomass than small ones;
Low and moderate severity patches are proportionally large enough and their combustion rates sufficiently low enough to reduce a fire’s average combustion rate at the landscape-level relative to that estimated for high severity patches.
Given Hypotheses 1–4, aboveground woody combustion at the stand to landscape levels would be an order of magnitude less than previously estimated at the Rim Fire (e.g., Garcia et al. [
18]).
To address these hypotheses, we developed a more robust ground-based method to determine the fraction of live aboveground woody biomass combusted during wildfire based on a reconstruction of the biomass that was combusted from branches and from the bole (i.e., main stem), as evidenced by charring. We examined a range of fire severities and tree sizes to determine the proportional loss of branch and bole carbon. We then developed species- and size-specific models of combustion rates and applied them to a range of stand diameter distributions and fire severity spatial databases to estimate carbon losses at the stand and landscape level for multiple large fires that have been described as either high severity or catastrophic.
2. Materials and Methods
2.1. Study Area
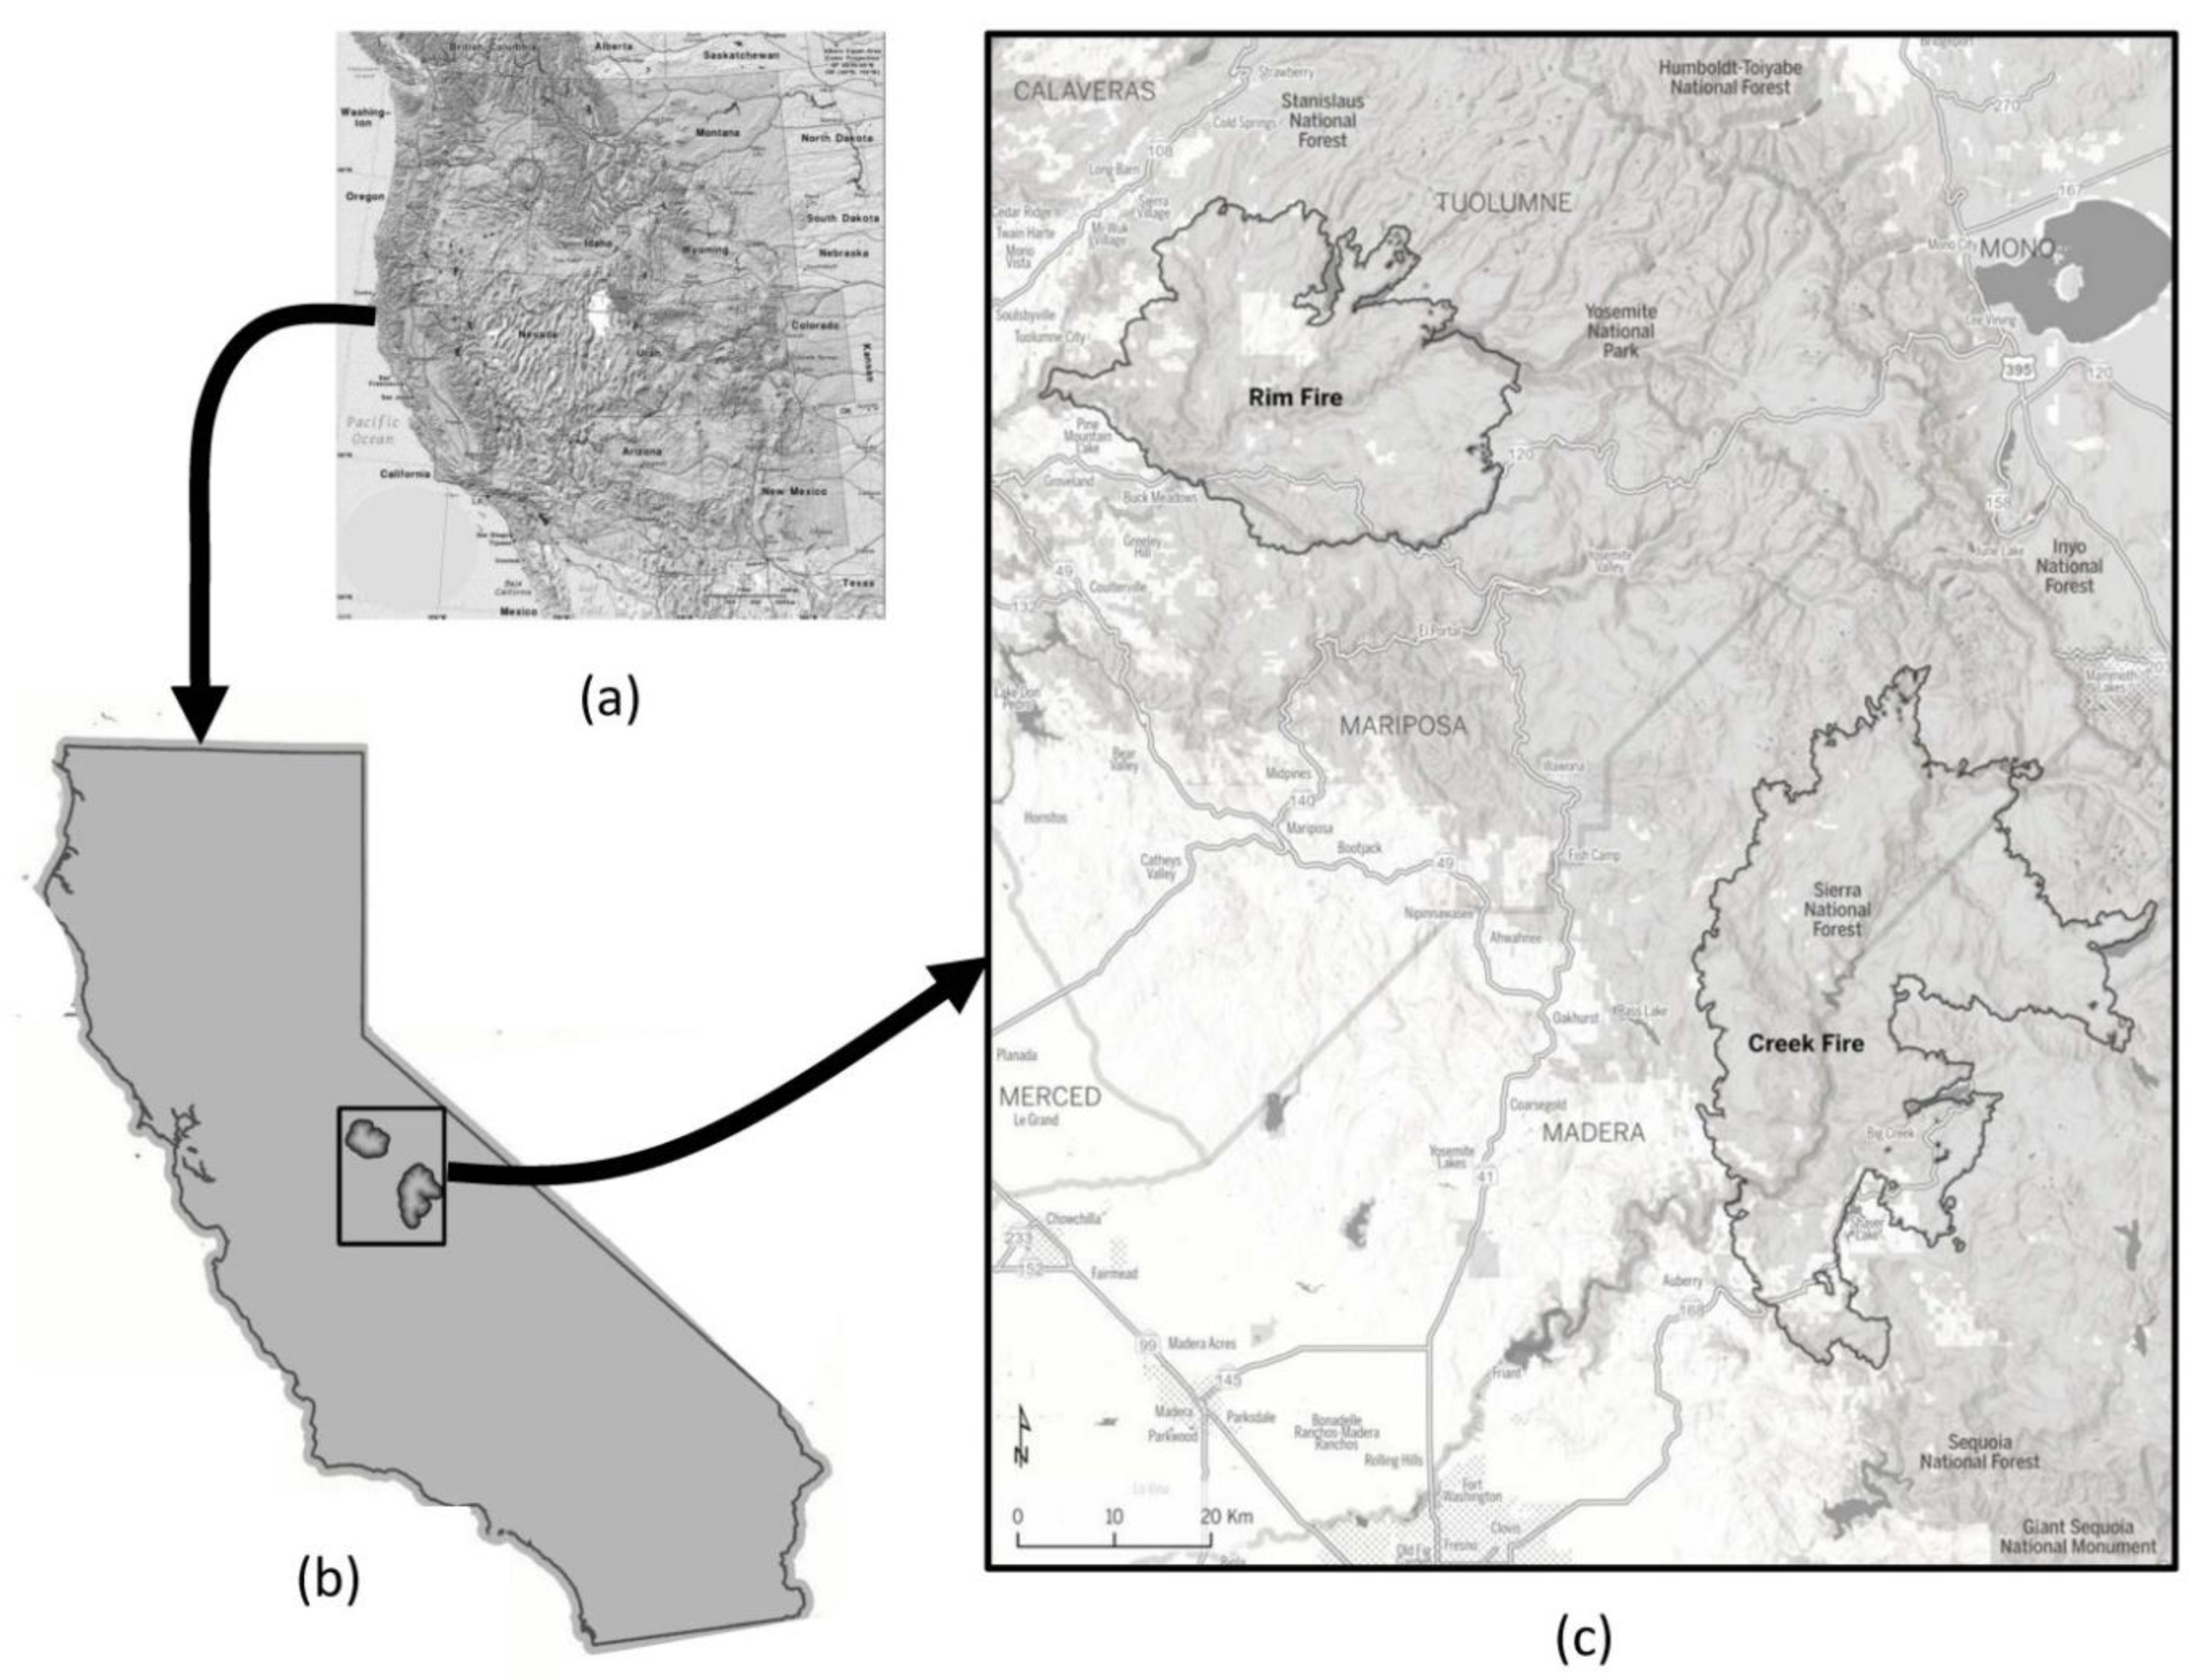
Our field study areas were composed of mixed-conifer and
Pinus ponderosa (Dougl. ex Laws.), which dominated forests in the Rim Fire of 2013 and the Creek Fire of 2020 within the central and southern Sierra Nevada Mountains of California, USA (
Figure 1). The 104,176 ha Rim Fire was active from 17 August through 4 November of 2013 on the Stanislaus National Forest, some private lands, and the western portion of Yosemite National Park. The 153,738 ha Creek Fire was active from 4 September through 24 December of 2020, mainly on the Sierra National Forest, but including some private lands. Our field data collection locations ranged from 1370 to 1490 m elevation in the Rim Fire, and from 1520 to 2180 m elevation in the Creek Fire.
At the lower elevations, these forests primarily consist of Ponderosa pine (P. ponderosa), white fir (Abies concolor (Gord. & Glend.) Lindl. ex Hildebr.), incense-cedar (Calocedrus decurrens (Torr.) Florin), Douglas-fir (Pseudotsuga menziesii (Mirbel) Franco), sugar pine (P. lambertiana Dougl.), and California black oak (Quercus kelloggii Newb.), with shrubs mainly consisting of mountain whitethorn (Ceanothus cordulatus Kellogg), deer brush (C. integerrimus Hook. & Arn.), and greenleaf manzanita (Arctostaphylos patula Greene). At the higher elevations in our study sites, the forests primarily consist of Jeffrey pine (P. jeffreyi Grev. & Balf.) and A. concolor, with some C. decurrens and occasional red fir (A. magnifica A. Murr.) at the highest elevations, and shrubs comprising mainly C. cordulatus.
2.2. Branch Models
Our branch models were based on branch orders, with first order branches representing the smallest twigs and second order branches representing branches where two first order branches joined, etc. (
Figure S4). The benefit of this system is that it can be used to reconstruct the branch orders missing from those that remain given that higher order segments are more likely to remain than lower order ones.
2.2.1. Field Data for Branch Models
There were two phases of field data collection in the development of the branch models. First, branches from recently downed live trees or live tree tops of the main species present in the Rim and Creek Fires (A. concolor, C. decurrens, P. lambertiana, P. ponderosa, and P. menziesii) were dissected to determine the number, diameter, and length of the branch orders on individual branches. Mid-point diameter and the length were determined on a subsample of up to 10 of each branch order segments of each dissected branch; when there were <10, all segments were measured.
Second, we visually examined intact, standing trees of each of the five species listed above in each of six diameter at breast height (DBH) size classes (1.0–4.9, 5.0–9.9, 10.0–24.9, 25.0–49.9, 50.0–99.9, >100 cm) to determine branch structure, as defined by the highest branch order present on a tree, the maximum branch diameter, length of the highest branch order segment, and the total branch length of the highest branch order. Maximum branch order was determined by starting with the outmost twigs and visually assessing where they joined to form a second order, and where second orders joined to form third orders, and so on. Maximum branch diameter and lengths were estimated visually; however, these estimates were repeatedly checked against a caliper and meter stick when branches were low enough on the tree to be measured directly.
2.2.2. Branch-Level Models
The average maximum branch order, diameter, and length data, combined with the average bifurcation ratio (i.e., the number of lower order branches divided by the number of branches for the next higher order; see
Figure S4), as well as segment diameter and length from the branch dissections, were used to develop tree species- and DBH size class-specific branch-level models. For lengths and diameters of orders not dissected, we interpolated between the highest order dissected and the highest order visually estimated. The volume of each branch order was calculated as the product of the branch segment area (as determined from the mid-length diameter), the length, and the number of segments. The total branch volume was determined by summing up all the branch order volumes and the relative branch order contribution was calculated as the ratio of the branch order volume to the total branch volume.
2.2.3. Tree-Level Branch Models
At the tree-level we developed three sets of models, with different weighting of the branches (
Figure S5 The simplest used the relative contribution of orders found on the highest order branches of each species and DBH size class). We termed this the maximum branch order model. However, trees also contained branches that terminated at a lower order than those closest to the ground. We accounted for this by either using the total estimated volume of each branch for each DBH size class as a weighting factor (i.e., the volume-weighted model) or using an additional weighting factor related to the bole length each branch represented (i.e., the volume and length-weighted model).
2.3. Tree-Level Combustion Indicator Sampling
We collected field data in the spring of 2018 and 2021 for the Rim and Creek Fires, respectively. In both fire areas, we gathered data in each fire severity patch type (low, moderate, high) at five points separated by 50 m as determined by a laser hypsometer along straight-line transects through the middle of the patches. To determine the location of the fire severity categories, we used the U.S. Forest Service’s “Rapid Assessment of Vegetation Condition after Wildfire” (RAVG) fire severity mapping system (
https://fsapps.nwcg.gov/ravg/data-access, accessed on 1 May 2021). If we encountered a point location along transects that was a different fire severity category than targeted in the specific sample area, we skipped that location and proceeded to the next location, 50 m further along. Additionally, if the transect came to the end of a patch within a particular fire severity category, we changed the direction of the transect 90 degrees to stay within the patch.
At each point location, we recorded the GPS coordinates and data on individual conifer trees in six size classes (see above), using the closest tree from each size class to the point location. This theoretically resulted in 30 trees being sampled per transect. However, in some cases, certain DBH size classes were not present near a plot center. To replace these “missing” trees, we sampled others as we traveled between points within the fire severity patch. Although we did not sample by species per se, we generally found the full range of DBH size classes for the main species we encountered. In the case of P. ponderosa, our method did not provide sufficient numbers of small DBH trees in high severity fire patches. We therefore sampled an additional transect in a high severity patch that was dominated by P. ponderosa in small DBH size classes to supplement the database. In addition, because trees >100 cm DBH were uncommon, some of our point locations did not include any trees of this DBH size class. In such cases, for the Creek Fire, we sampled >100 DBH trees as we traveled between point locations.
For each tree in the Rim fire, we recorded species, DBH, height, live/dead status, distance from point location, char depth of bole, maximum bole char height, whether there was any consumption of branches (yes or no), percentage of crown length killed, diameter of the smallest branches remaining, diameter of the largest branches consumed, and percentage consumption of each order of branches. The diameter of each tree was determined using either a DBH tape or a large caliper to the nearest 1 cm. The heights of DBH size classes 3–6 were visually estimated (with periodic checks using a clinometer and tape or hypsometer), whereas those of the smaller DBH size-classes were estimated using a meter stick. The maximum height or relative height (depending on the distance) of charring was determined, as we had assumed there would be a fixed relationship between the maximum and minimum char height. The char depth on the bole was visually estimated after a subset of trees had been examined by cutting into them with either a knife or hatchet. If crown consumption was noted we visually estimated the smallest branch diameter remaining and the largest one combusted, periodically checking these estimates with a caliper. The fraction of each branch order combusted was visually estimated when crown combustion had occurred as 5%, 10%, 25%, 50%, 75%, 90%, 95%, or 100% combustion. Given that the Rim Fire occurred several years before sampling, we distinguished between branches lost via decomposition-related fragmentation and combustion (
Figure S6).
In the Creek Fire, we generally followed these same methods at each point with some changes to improve precision. At the Creek Fire, all tree heights were determined either using a clinometer and hypsometer or, if they were short enough, with a meter stick. We determined the minimum and maximum char height (percentage of tree height), given our observations on the Rim Fire that the char height often varied substantially on one side of the tree versus the other side. A detailed examination of char depth at the Rim Fire indicated that the char depth was variable enough that it needed to be determined on each tree. Therefore, at the Creek Fire we used a hatchet to chop into each bole on at least two places to determine the depth of char (generally in 0.5 cm increments).
2.4. Estimate of Wildfire Intensity
We used van Wagner’s scorch height model [
21] to estimate I, the fire line intensity (kcals m
−1 s
−1) of the sampled areas:
with the maximum height of bole char (m) serving as the scorch height. For high severity fire patches, we used the maximum height observed on transects to indicate fire intensity. We did this for moderate and low severity fire patches as well; however, also we calculated the average fire intensity using all the trees in those transects because for these two severities it may be more representative than the maximum.
2.5. Tree-Level Combustion
The Jenkins et al. [
22] general softwood equations were used to predict the proportion of aboveground woody mass in boles versus branches as a function of DBH (
Figure S1). Data on the proportion of branch volume combusted were then combined with this to determine the fraction of each tree’s total aboveground woody biomass lost to branch combustion.
We also used the data on bole char height and depth to estimate proportion of aboveground woody biomass lost to combustion. For the Rim Fire we made several estimates, since only the maximum height of bole char was noted. First, we assumed that the minimum and maximum char heights were equal, giving a maximum bole combustion estimate. Second, we used the relationship between the minimum and maximum bole char height found for a subsample of trees examined in detail on the Rim Fire (
Figure S15). This gave the minimum bole combustion estimate. The data on bark char depth collected at each fire were then used to estimate the volume of char, assuming that the char depth declined as one went up the tree, reaching zero where the char ended. We assumed that 46% of the bark’s C was lost via pyrolysis [
23] during bole charring, based on the average of Czimczik et al. [
24].
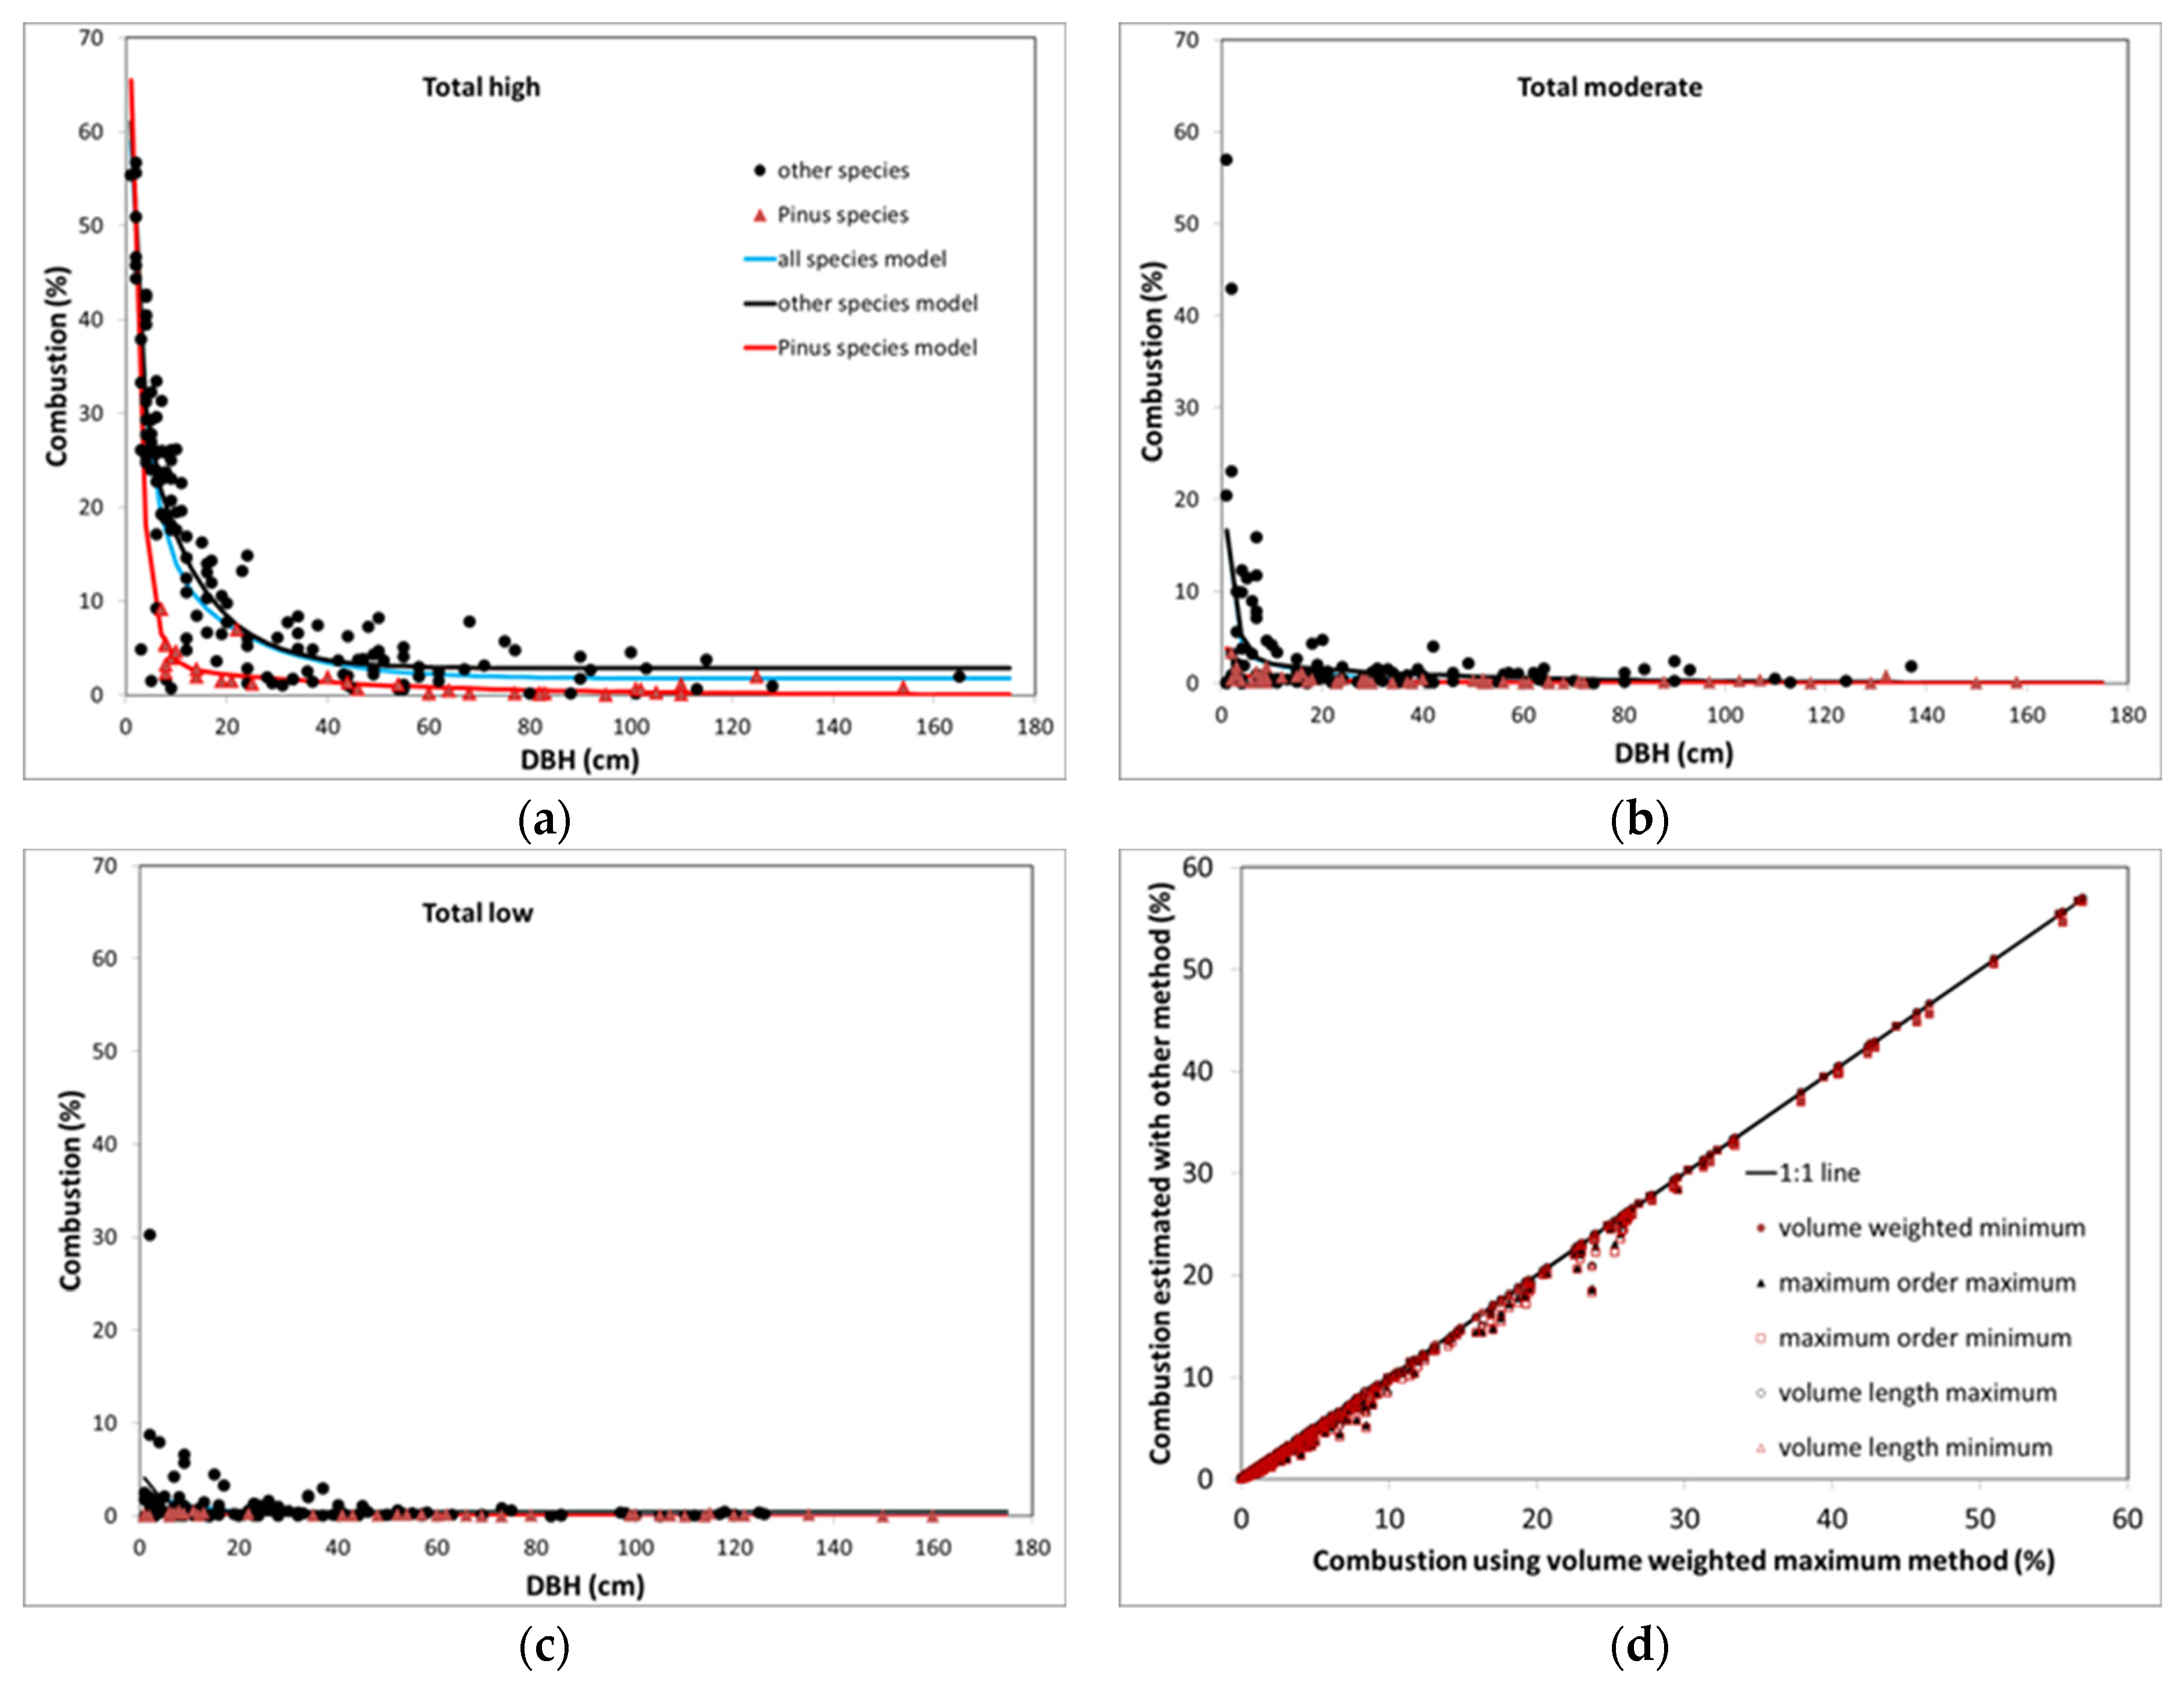
Individual tree estimates of the fraction combusted for each fire intensity class were used to develop non-linear regression models using SAS procedure NLIN with the Gauss method and parameter bounds [
25] that would predict the proportion of branches, boles, and aboveground woody biomass consumed as a function of tree DBH. We estimated models for each fire severity class and species group (i.e., all species together,
Pinus species, and other species). Species groups were based on a preliminary analysis, which indicated that species in the genus
Pinus appeared to have substantially lower combustion rates (particularly of branches) than the other conifer species. Although we analyzed all six sets of estimates based on the branch and bole scorch models used, we largely present results for the estimates based on volume weighting of branches and maximum bole char height models.
The tree-level combustion models used were interrelated and based on negative exponential functions with multiple components. The most complicated was a negative exponential model with an asymptote that separated the response into three components:
where Combustion
1, Combustion
2, and Combustion
3 pertain to the combustion maximums (percentage) for component 1, 2, and 3, respectively;
k1 and
k2 (cm
−1) determine the rate the first two components decline with increasing DBH. We also ran simpler models including a dual component negative exponential (i.e., Combustion
3 was zero):
a single component, negative exponential decline to an asymptote (i.e.,
k2 was zero):
and a single component negative exponential (i.e., Combustion
2 was zero)
As Proc NLIN automatically reduced the number of parameters when a simpler model was sufficient to fit the data, the Akaike Information Criteria (AIC) was not necessary to select the simplest model. Therefore, our primary method to identify the “best” model was goodness of fit, which was calculated as:
where SS is the sums of squared deviations for either the error term or the corrected total. We also examined residuals to determine if there was a bias at any point in the DBH range examined and selected the model with the minimum bias.
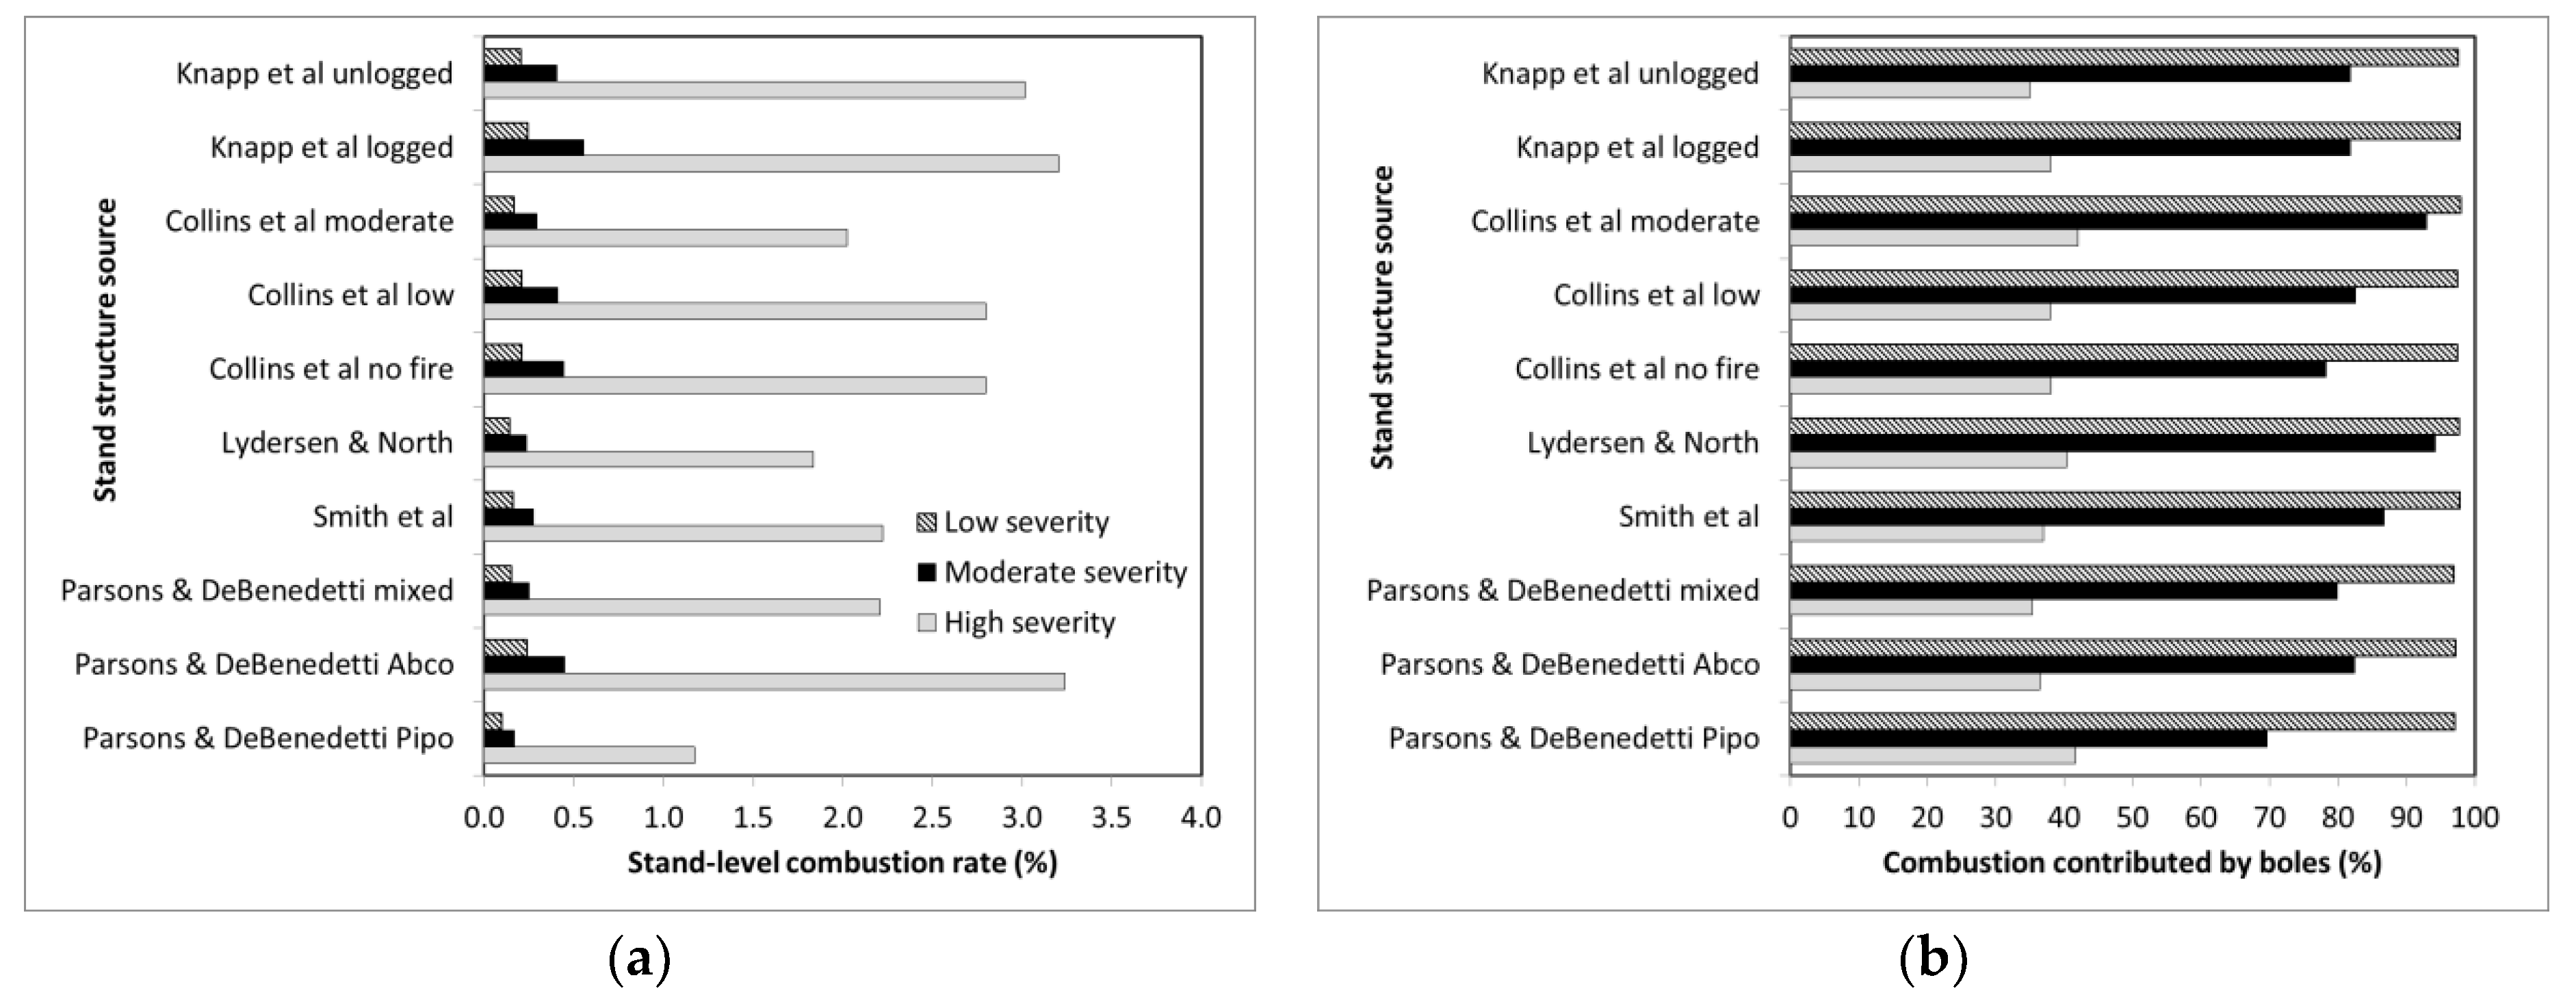
2.6. Stand-Level Combustion
We estimated the total stand-level combustion losses for each of the fire severity classes from our combustion regression models and published data on DBH size class structure for mixed conifer forests in the California Sierra Mountains [
20,
26,
27,
28,
29]. While some of the publications reported DBH size structure for species or
Pinus versus other species, some did not [
28,
29]. However, the latter did report the relative contribution of species to basal area. We therefore apportioned the number of stems in each DBH size class by the proportion of basal area of species.
Total aboveground biomass was estimated from DBH using equations for species groups developed by Chojnacky et al. [
30]. Biomass in branches and boles were calculated from total aboveground biomass using the Jenkins et al. [
22] general softwood equations, predicting the proportion of aboveground woody mass in boles versus branches as a function of DBH. To calculate the combustion loss for each tree in a fire severity class (e.g., low severity) the appropriate biomass term (e.g., branch) was multiplied by the combustion rate, predicted from the corresponding combustion–DBH model (e.g., branch–low severity). We also estimated the fraction of combustion coming from branches versus boles.
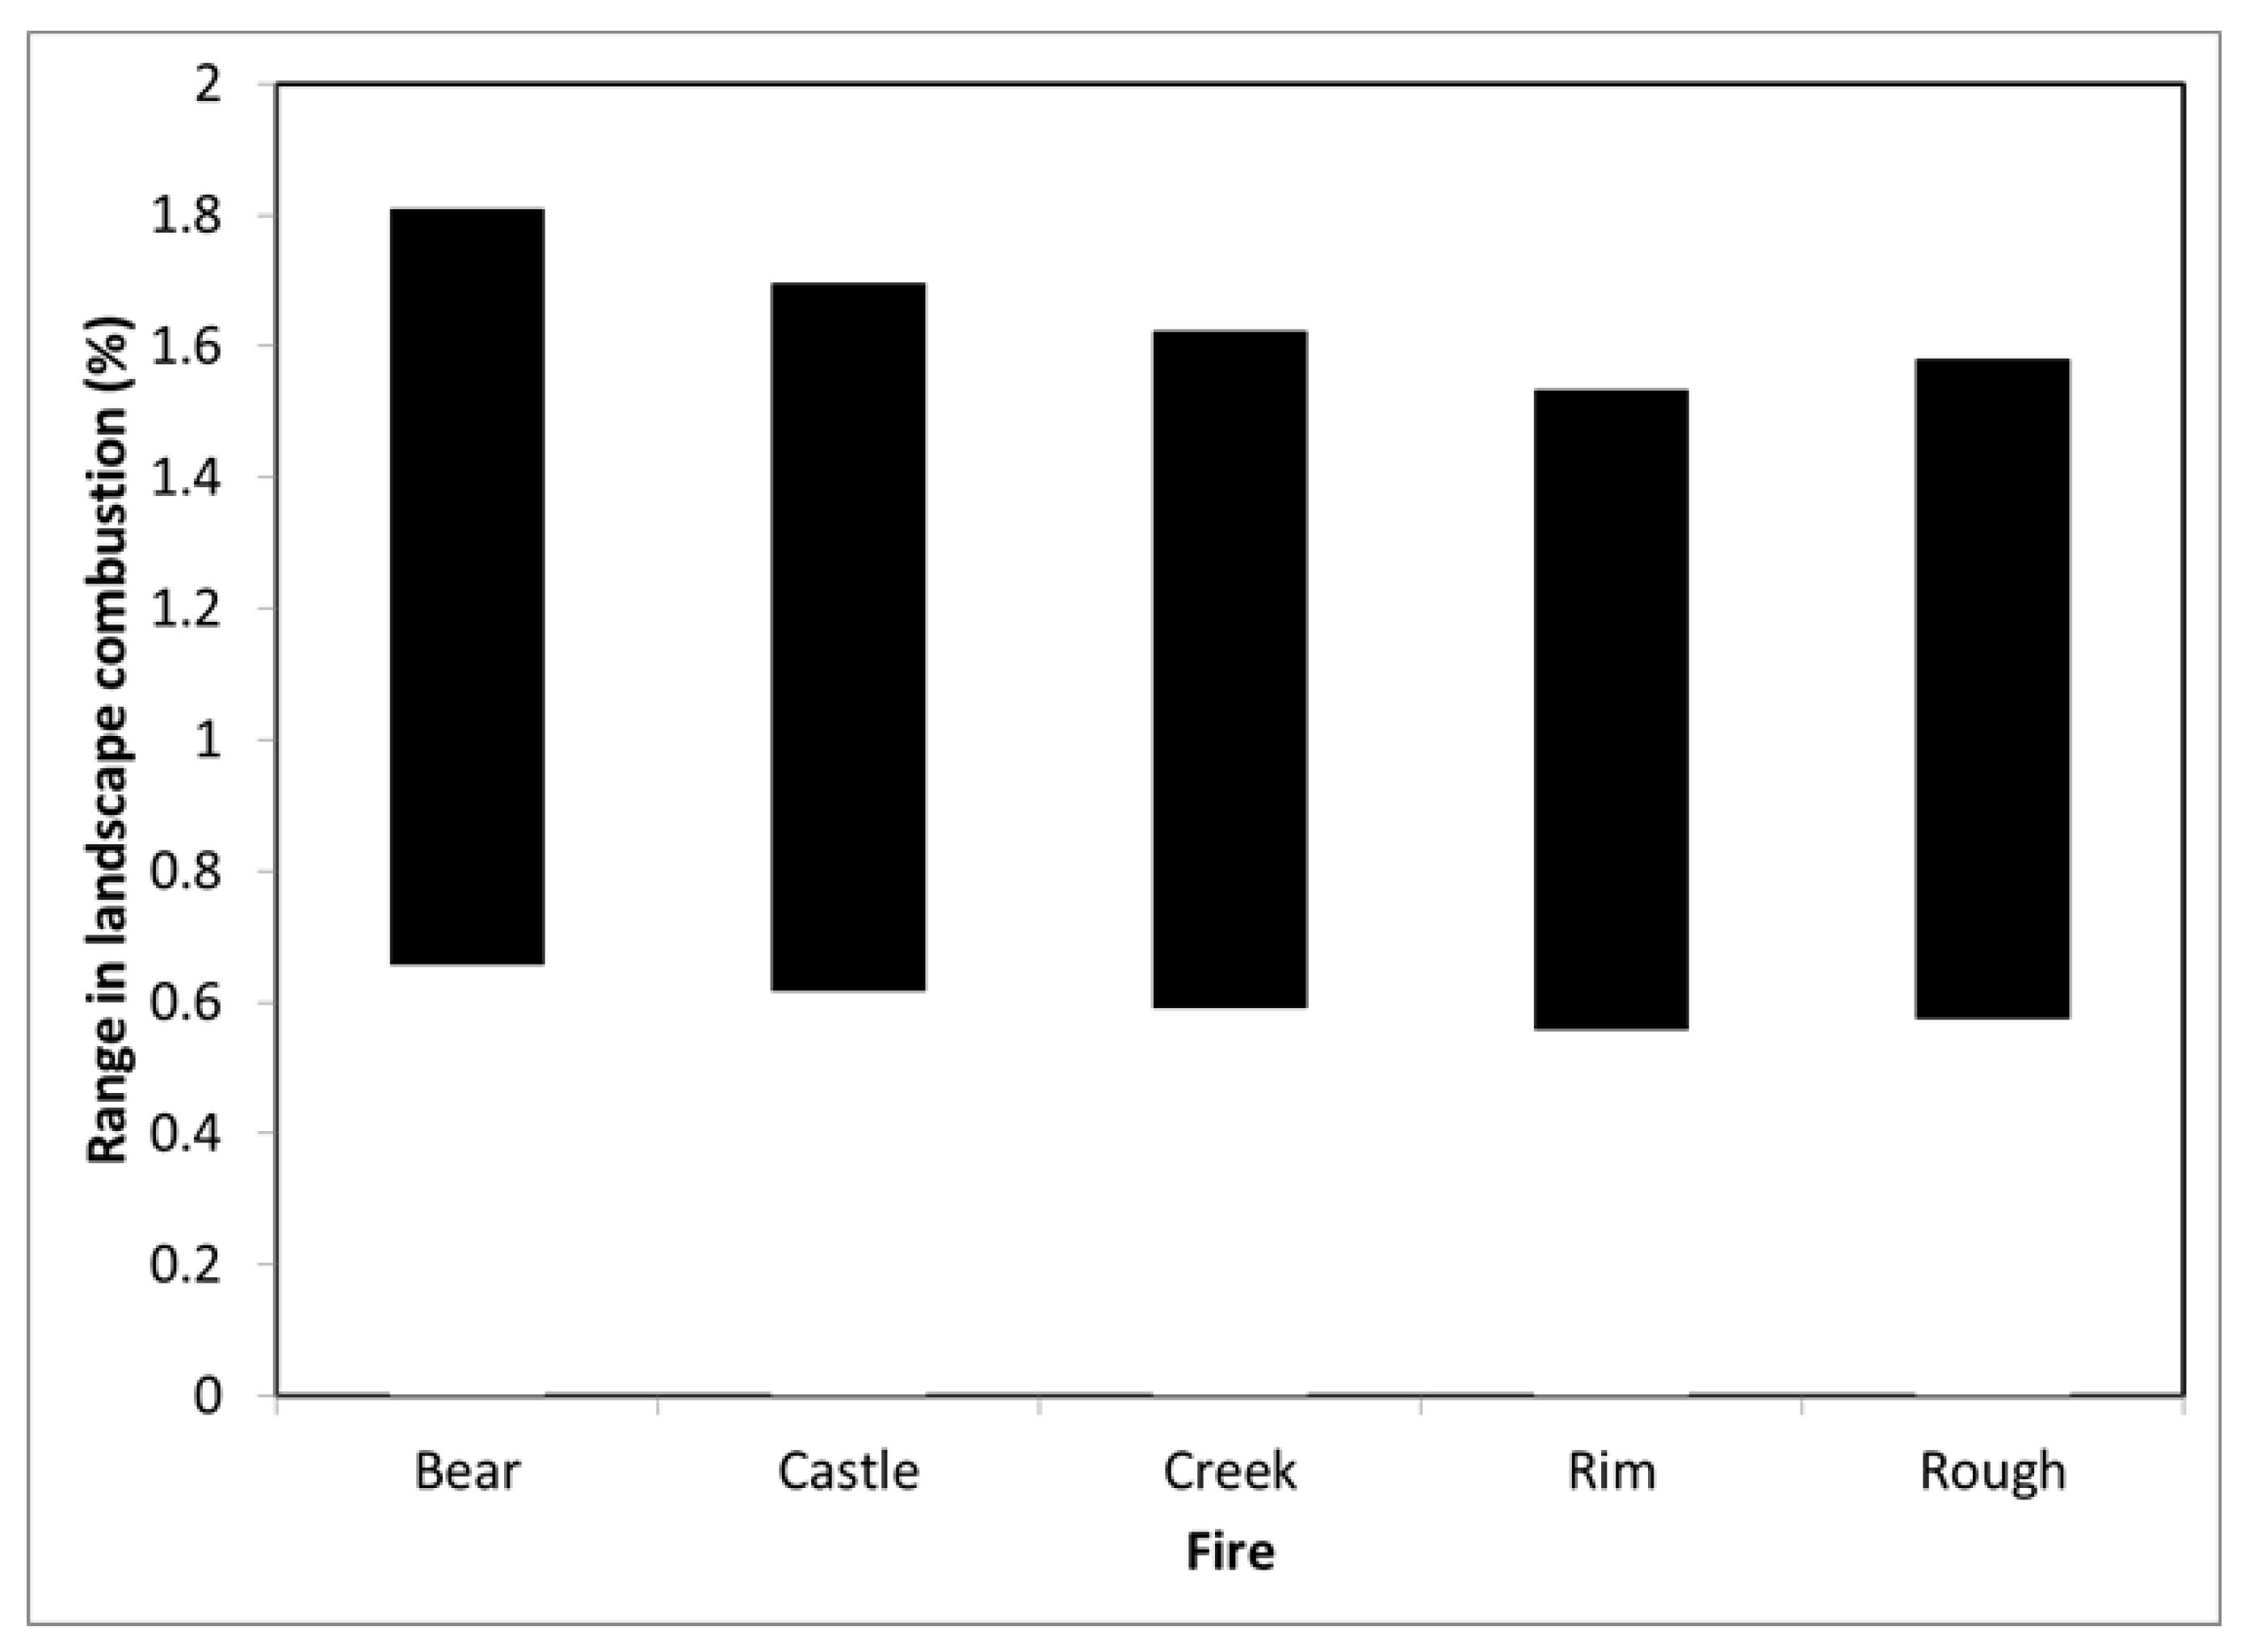
2.7. Landscape-Level Combustion
To explore the consequences of the distribution of fire severities at the landscape-level (i.e., the entire area burned) we weighted the losses for each fire severity class at the stand-level by the abundance of the severity class on the landscape for the five largest Sierra Nevada fires occurring during 2011–2020 in conifer forests on national forest lands that were composed >50% by
P. ponderosa,
P. jeffreyi, and mixed-conifer forest types. In addition to the Creek Fire and Rim Fire, this included the 61386 ha Rough Fire of 2015, the 129068 ha Bear Fire of 2020, and the 70487 ha Castle Fire of 2020, all within the Sierra Nevada region. The Rapid Assessment of Vegetation Condition after Wildfire (RAVG) dataset (
https://fsapps.nwcg.gov/ravg/data-access, accessed 15 November 2021) was used to determine distributions for conifer forests on national forest lands in three severity classes: low (<25% basal area mortality), moderate (25%–75% basal area mortality), and high (>75% basal area mortality).
4. Discussion
4.1. Evaluation of Hypotheses
We employed a novel, field-based method to estimate the fraction of aboveground woody biomass combusted in large wildfires and evaluated five hypotheses that span multiple levels, ranging from tree parts to landscapes. The advantage of our method is that findings at one level can be related to another. For example, although we did find high rates of biomass combustion for some portions of branches and for small trees in high severity fire patches, a number of factors led the average combustion rate at higher levels of organization (i.e., trees, stands, and landscapes) to be substantially lower. Below, we evaluate each of our hypotheses in turn.
4.1.1. Hypothesis 1
Our findings for branches and to some degree for boles were consistent with Hypothesis 1. We did not observe any live branches >2 cm diameter that were fully combusted in even the most severe fire patches; it is likely that 2 cm represents an approximate combustion threshold in terms of the proximity, surface area-to-volume ratio, and drying rates of branch segments. Moreover, the 2 cm diameter limit suggests that for the species we examined, only branch orders one to three are of potentially combustible size. This places significant constraints on how much of a branch or tree can be combusted (
Figures S10 and S11).
We found that, while all sizes of trees had losses from bark charring, this loss was proportionally highest for the smallest diameter trees. However, this may have been more related to proximity to ground fuels and the distribution of energy release than diameter per se. This suggests that proximity to heat source is also important to consider.
4.1.2. Hypothesis 2
We found multiple lines of evidence to support Hypothesis 2. Specifically, our branch models predicted that as DBH increased the proportion of branches susceptible to combustion declined. Using
A. concolor as an example, orders one to three (the most susceptible to combustion) comprise 78% and 11% of branches for DBH size classes one and six, respectively (
Figure S10). At the level of trees, the proportion of branches in total aboveground woody biomass declined as DBH increased, which meant that even if the combustion rate of branches was constant, the fraction of total woody biomass combusted would be reduced 60% from the smallest to the largest DBH trees. Combining these two DBH-related effects suggests that 1.8%–31% of aboveground woody mass could be consumed for this species, with the highest value for the smallest trees (
Figure S11). These estimates pertain to
A. concolor in high severity fire patches; very little branch consumption occurred in low and moderate severity fire patches. Specifically, in moderate severity patches, only 17% of the trees had evidence of crown consumption. In low severity patches, even fewer trees (6%) had evidence of crown consumption. This suggests that on moderate and low severity fires, one could expect that 0.3%–5.3% and 0.1%–1.9% of aboveground woody biomass would be consumed at the level of trees, respectively, with the higher values pertaining to the smallest trees.
We found that the rate of bole combustion related to charring also declined as tree size increased. Although char depth increased to some degree with fire severity, the main effect was to char more of the bole length as fire severity increased (
Figure S13). In contrast to Hypothesis 2, tree species had a larger effect on bole combustion than tree size. The differences in char depth among species seemed to be related to bark density, with less dense bark exhibiting a deeper char layer (
Figure S15b).
4.1.3. Hypothesis 3
At the stand-level, consistent with Hypothesis 3, higher combustion rates (i.e., 34.9% in high severity fire patches) in the smallest trees were strongly offset by the lower ones (i.e., 1.4% also in high severity fire patches) in larger trees because biomass increases exponentially with DBH. Consider that it would take ≈190,000 1 cm DBH trees to equal the biomass of a single 100 cm DBH tree (or ≈30,000 to equal a 50 cm DBH tree). Thus, while small DBH trees might be orders of magnitude more abundant than larger ones, they are not sufficiently abundant to counter the effects that a few larger DBH trees have on stand-level combustion rates. In addition, increasing the proportion of biomass in Pinus species greatly decreased stand-level combustion rates, because branches of these species were rarely combusted. This suggests that estimates of stand level combustion rate need to account for differences in taxa as well as tree sizes.
4.1.4. Hypothesis 4
Consistent with Hypothesis 4, we found that, at the landscape level, the very low rates of combustion in low and moderate severity fire patches diluted the effects of higher combustion rates in high severity fire patches. The much lower rates of combustion observed in low and moderate severity fire patches is likely due to the fact that branch combustion in these two severity classes is extremely low. Despite being classified as high severity fires, a large share (48% to 58%) of the fires we examined was of low and moderate severity according to RAVG. Moreover, as noted below, the proportion of moderate severity fire patches is underestimated by RAVG, so it is highly likely that high severity fire patches comprise the minority of even “highly severe” wildfires. Thus, the overall combustion rate in “high” severity fires is likely to be less than half that observed in those portions that were actually high severity.
4.1.5. Hypothesis 5
Our estimates of stand- to landscape-level combustion rates are more than an order of magnitude less than reported by some remote sensing-based studies (
Table 4). For example, Garcia et al. [
18] estimated that 32%, 52%, and 85% of the aboveground biomass was consumed by the Rim fire in low, moderate, and high severity fire patches, respectively. De Santis et al. [
31] estimated that conifers in low, moderate, and high severity fire patches had average biomass combustion rates of 25%, 47%, and 65%, respectively. Applied to the RAVG fire severity distribution for the Rim Fire, these values suggest a landscape average combustion rate of 45%–57% in contrast to the 1%–1.2% we found when our combustion models were applied to various stand structures. For high severity fire patches, we estimated that 1.2%–3.2% of aboveground woody biomass was combusted by fire. Even when foliage was accounted for (see below) our ranges were far below that of Garcia et al. [
18] and De Santis et al. [
31]. In contrast, our estimates are more in line with the 1%–3% that can be inferred from Miesel et al. [
17] for a range of fire severities in mixed conifer forests of California. They are also consistent with field-based research of high-severity fire patches in multiple large fires in the Eastern Cascades of Oregon, where <3% of live conifer tree biomass was consumed [
32]. Thus, we cannot reconcile Garcia et al.’s or De Santis et al.’s outcomes with our field data, or with that from other field-based studies, which also find that the vast majority of the carbon remains in trees, even in moderate- and high-severity fire patches in large wildfires [
10,
19,
32,
33].
4.2. Evaluation of Uncertainty
Our models predicting the relative volume of branch orders were preliminary and additional efforts should be made to improve them, particularly regarding estimates of bifurcation ratios. However, it is doubtful that these improvements would alter the relative relationships we found, specifically, that as tree DBH increases the maximum order present, diameter, and length of branches increases. Regardless of bifurcation ratios, these trends led to the highest order branch segments to be much larger than the lowest order ones. Hence, for the largest trees, the volume of the highest order branch segment was 374–62,241 times larger than for the first order ones. For the highest order and first order branch segments to have equal volume, then first order branch segments would have to be similarly more abundant than the highest order branch segments. Our models predicted that first order branch segments were less abundant than this by a factor of 5.5–66. It is highly unlikely that our estimates of bifurcation ratios could have been off by that much, but even if they were it may not have made a difference. In the case in which branch segment orders are equally abundant, the relative contribution of each order would be the reciprocal of the maximum order present; with six orders present, the contribution of the first three orders would be 50% to branches or 8% of aboveground woody mass of the largest trees. Therefore, given the limitations of branch mass on trees, even exceedingly high amounts of order one to three branch segments would not allow the majority of aboveground woody biomass to be consumed by fire.
Uncertainty was also introduced by our visual estimates of the fraction of branch orders consumed; however, this was unlikely to have altered our basic findings. In the case of small diameter trees in high fire severity patches, consumption of branch orders one to three were often complete, leading to little uncertainty in estimating the fraction consumed. Similarly, for trees in which no crown consumption occurred (the vast majority of trees), no uncertainty would have been introduced. Therefore, this source of uncertainty is highest for the largest trees in high severity fire patches, but even here it was unlikely to have been substantial. For example, if first order branch segments were 10% of branches and branches were 16% of aboveground woody mass (as is typical for large DBH trees), then estimating 50% consumption of first order branch segments would mean that 0.8% of aboveground woody biomass would have been consumed. Had 25 or 75% of the first order branch segments been consumed it would mean that 0.4% and 1.2% of the aboveground woody mass would have been consumed, respectively. Although these numbers certainly differ, all are small proportions of the aboveground woody biomass.
There were also uncertainties associated with combustion related to bole charring. We assumed that char thickness decreased as one proceeds up the stem. More needs to be learned about the longitudinal pattern of char depth. If the char depth is constant (which seems unlikely), then perhaps bole char losses would have been twice what we estimated. This would have had the largest impact on our estimates of combustion for low and moderate fire severity patches, because bole charring contributed to most of the combustion losses in these areas. However, char height was also limited in these patches. In addition to better understanding longitudinal variation in char depth, the amount of carbon lost via pyrolysis needs to be more precisely determined. Our use of a constant fraction of carbon loss of ≈46% likely overestimated losses from low severity fires and potentially underestimated it for high severity ones. As charring was the most important carbon loss mechanism in low to moderate severity fire patches, it is worthy of further attention.
Our stand-level estimates are preliminary, but additional DBH distribution data would be unlikely to alter our basic finding that combustion losses from the largest trees dominate stand-level calculations (
Figure S16). Substantial improvements in stand-level estimates would most likely be related to better estimates of the proportion of stands comprised of
Pinus versus other species, given that the former have ≈50% the combustion rates of the latter. Additionally, our analysis did not address interactions between stand structure and fire severity; however, while this interaction influences fire severity distributions, it would not change the fundamental relationships between tree size, biomass, and combustion rates.
At the level of entire fires (i.e., landscapes), uncertainty was related to the distribution of fire severity classes used. Specifically, we used RAVG to determine the areal extent of fire severity classes. Although RAVG provides an early (30–60 days) estimate of fire severities, it also tends to classify areas that eventually become moderate severity into the high severity class [
34,
35]. Therefore, our estimate of average landscape consumption rates may be higher than actually occurred. We can assess the degree this would have influenced our estimates of aboveground woody consumption for the Rim Fire. Potter [
36] estimated that 33% of the Rim Fire was high severity; estimates based on MTBS (Monitoring Trends in Burn Severity) indicate that 20% was high severity. Using these fire severity distributions suggests that our landscape range for the Rim Fire would have been 0.5%–1.3% for Potter and 0.3%–0.9% for MTBS versus the 0.6%–1.5% we determined using RAVG.
4.3. Other Combustion Losses
We did not estimate fire consumption of either foliage or roots; however, the former, at least for high severity patches, could be substantial. If we assume that consumption of first order branch segments is the same as foliage consumption (
Figure S17), then our stand level estimates of aboveground consumption for high severity patches would have been 3.2%–5.7%. At the landscape level, the average total aboveground consumption rate would have been much lower because there was very little foliage consumption for low and moderate severity patches. Specifically, the total aboveground biomass consumed at the landscape level, adjusted for foliage combustion, would have ranged from 1.4% to 3%. Although some of the fine roots in the lower portions of the organic soil horizons may have been consumed, particularly in high severity fire patches, there was little evidence that coarse roots of live trees were consumed. Assuming that combustion of live roots was minimal, and roots comprised 20% of total live biomass, the total stand-level live biomass combustion for high severity patches would be 2.6%–4.6%. Adjusting the landscape-level combustion rate to account for root biomass gives a range of 1.1%–2.4%. Although these combustion rates are low, they are 1.3–1.9 times our estimate for aboveground woody combustion and suggest that a more detailed accounting of foliage and root combustion is warranted in future studies.
We also did not evaluate combustion losses from either understory plants or aboveground, dead organic matter. During our field work in high severity fire patches, we observed that the forest floor and many downed tree boles, stumps, and associated dead coarse roots were largely consumed. In contrast, sound, large-standing dead trees could be deeply charred, but largely remained even in high severity fire patches. We can use the published distribution of carbon pools (e.g., found in Miesel et al. [
17]) combined with our live woody biomass combustion rates, and assume the complete combustion of the understory plants and aboveground dead pools (i.e., coarse woody debris and the forest floor) to estimate pool-specific losses for high severity fire patches. This indicates that combustion of aboveground live woody biomass could account for 4%–10% of the total ecosystem combustion losses. Alternatively, if we assume that 50% of the coarse woody debris was combusted, then live aboveground woody biomass would have contributed 5%–12% of the total ecosystem combustion losses. These estimates contrast markedly with the live tree contribution if the values from Garcia et al. [
18] were used: live combustion rates of 85% would mean 74% to 78% of the ecosystem combustion losses would have been associated with live tree combustion.
4.4. Policy Implications
Our findings have significant implications for a wide range of policy analyses related to wildfire combustion. The fraction of live woody biomass combusted varies not only with fire severity level; but also, depending on the organizational level being examined, a number of other factors, including the size structure of woody parts and trees, the species composition of trees present, and mixture of fire severity levels within fires. This suggests that great care must be taken in selecting the combustion rate(s) to be used in either modeling combustion or calibrating remote sensing-based estimates. Furthermore, until an improved multi-level (e.g., branches to landscapes) understanding of combustion rates has been attained, we recommend that such research be tied to field-based, level-relevant data to the extent possible. A key improvement includes determining the limits within which realistic combustion rates can be expected for a given level of analysis.
These findings also suggest that assumptions about combustion in past policy-related analyzes (e.g., [
37,
38]) should be re-evaluated. Based on our results and those of others [
10], combustion-related emissions may have been overestimated. In contrast, fire-related losses via decomposition of fire-killed trees and the amount of fuel generated by fire disturbance may have been underestimated. Hence, the consequences of management actions may not be adequately understood until a more robust understanding of live woody combustion develops.


