Article

Experimental Characterization of Particulate and Gaseous Emissions from Biomass Burning of Six Mediterranean Species and Litter

by
Enrica Nestola
1,
Gregorio Sgrigna
1,*,
Emanuele Pallozzi
2,
Loredana Caccavale
2,
Gabriele Guidolotti
3 and
Carlo Calfapietra
3
1
Institute of Research on Terrestrial Ecosystems (IRET), National Research Council (CNR), 73100 Lecce, Italy
2
Institute of Research on Terrestrial Ecosystems (IRET), National Research Council of Italy (CNR), 00015 Monterotondo, Italy
3
Institute of Research on Terrestrial Ecosystems (IRET), National Research Council of Italy (CNR), 05010 Porano, Italy
*
Author to whom correspondence should be addressed.
Forests 2022, 13(2), 322; https://doi.org/10.3390/f13020322
Submission received: 27 December 2021 / Revised: 11 February 2022 / Accepted: 11 February 2022 / Published: 16 February 2022
(This article belongs to the Section Forest Meteorology and Climate Change)

Abstract

:
Wildfires across the Mediterranean ecosystems are associated with safety concerns due to their emissions. The type of biomass determines the composition of particulate matter (PM) and gaseous compounds emitted during the fire event. This study investigated simulated fire events and analysed biomass samples of six Mediterranean species and litter in a combustion chamber. The main aims are the characterization of PM realized through scanning electron microscopy (SEM/EDX), the quantification of gaseous emissions through gas chromatography (GC-MS) and, consequently, identification of the species that are potentially more dangerous. For PM, three size fractions were considered (PM10, 2.5 and 1), and their chemical composition was used for particle source-apportionment. For gaseous components, the CO, CO2, benzene, toluene and xylene (BTXs) emitted were quantified. All samples were described and compared based on their peculiar particulate and gaseous emissions. The primary results show that (a) Acacia saligna was noticeable for the highest number of particles emitted and remarkable values of KCl; (b) tree species were related to the fine windblown particles as canopies intercept PM10 and reemit it during burning; (c) shrub species were related to the particles resuspended from soil; and (d) benzene and toluene were the dominant aromatic compounds emitted. Finally, the most dangerous species identified during burning were Acacia saligna, for the highest number of particles emitted, and Pistacia lentiscus for its high density of particles, the presence of anthropogenic markers, and the highest emissions of all gaseous compounds.

1. Introduction

Combustion is widely identified as one of the major sources of worldwide air pollution, mainly releasing carbonaceous material in both gaseous and aerosol phases [1]. Particularly, biomass burning, such as wildfire [2], forest fire [3] and crop residue burning from agriculture [4], emit several trace gases, including carbon monoxide (CO), carbon dioxide (CO2), nitrogen oxides, particulate matter (PM) and volatile organic compounds (VOCs) [5]. PM is harmful to human health [6], it reduces atmospheric visibility [7], and it is considered a relevant pollutant that plays a role in climate change [8,9].
PM can affect atmospheric chemistry in two main ways: (1) by acting as cloud condensation nuclei, thus, influencing the formation and lifetime of cloud cover and precipitation [10] and (2) by scattering/absorbing light and altering the Earth’s radiation budget [11]. The international classification of PM with significant effects on human health describes three dimensional categories: PM10, PM2.5 and PM1, which are represented by all particles below 10, 2.5 and 1 μm, respectively [12]. As shown by Wang et al. [12], the smaller the particles, the higher the risk for human health.
On the other hand, the emissions of CO and VOCs in combination with nitrogen oxides trigger the photochemical production of secondary pollutants, such as ozone [13], which severally affect the chemical composition of the atmosphere and result in adverse effects on human health [14]. Within the large category of VOCs, aromatic hydrocarbons represent a major component of the identified emissions from Mediterranean wildfires [15]. Among them, benzene, toluene and xylene (BTX) are the dominant emissions and are significant pollutants regarding their health hazards [16]: benzene has been classified as a carcinogen by IARC [17]; toluene causes symptoms, including sore throat and irritation of the upper respiratory tract [18]; and mixed xylene (o-, m- and p-) inhalation affect the respiratory and cardiovascular systems [19].
In recent decades, wildfires across the Mediterranean Basin increased in size and severity due both to climate and land-use changes [20]. Although Mediterranean ecosystems are highly resilient to fire, the increasing frequency of fire events might go beyond vegetation adaptive thresholds, thus, altering the vegetation recovery capacity [21]. Particularly, the pine forest is one of the most fire-prone Mediterranean ecosystems [22], and high fire severity might alter the recovery capacity through increased mortality in the aerial seed bank [23].
Beyond health and safety concerns, forest fires are responsible for the fragmentation of ecosystems, the degradation of soils, the instability of mountain slopes and the loss of biodiversity and ecosystem services, such as carbon sequestration [24,25]. It is well established that parameters, such as the type of biomass, moisture content and heat intensity during the fire event, determine: (a) the compounds and their abundances in smoke plumes [26], (b) the composition of the particulate matter [27] and (c) the volatile organic compounds (VOCs) emitted [15].
Consequently, the species composition or the biomass type of a specific ecosystem contributes in a peculiar way to the gaseous and particulate emissions. For this reason, both the particulate and gas emission characterization and quantification during controlled combustion of Mediterranean forest species can improve emission inventories, endorse climatic projections for the future and are suitable for the source apportionment of pollutants [28,29].
Different studies [28,30,31,32] provided significant and detailed information about gaseous compounds and PM tracers from fire experiments but did not analyse the specific contribution to the emission from the particular species. In fact, although experiments conducted in the field are more representative of real conditions, they cannot help in identifying a single plant type contribution. Conversely, the combustion chamber specifically allows investigation on these peculiar differences related to forest fire events [33]. Recently, Guo et al. [5] conducted an extensive combustion experiment on dominant tree species in the Chinese boreal forest ecosystem of gaseous pollutants and PM considering different types of fuel.
However, only fine particulate matter (PM2.5) was considered in the analysis. Similarly, Alves et al. [29] gave valuable information about gaseous and particulate emissions from the open burning of vine, olive, willow and acacia; however, only PM10 was considered. A previous study [34] reported the gaseous and particulate emissions from different plant tissues (leaves, branches and litter) of Mediterranean species considering the contribution of the different phases of burning. However, it could not distinguish the size of emitted particles nor the particulate elemental composition but only the total amount released during the experiment.
Considering this lack of information and the implication of PM on human health, we focused our present work on the particle size and elemental composition of particulate matter derived from controlled biomass burnings of a Mediterranean protected forest in southern Italy, along with their emitted gaseous compounds. The main aim of this study is to characterize the particulate (PM10, 2.5 and 1) and gaseous emissions of six Mediterranean species and litter.
To reach this aim, for all sampled species, we analysed: (a) the total amount of particulate emitted, the relative PM size fraction and the chemical composition of all particles’ size; and (b) the most representative emitted compounds of four trees (Acacia saligna, Casuarina equisetifolia, Eucalyptus camaldulensis and Pinus halepensis), two shrubs (Juniperus oxycedrus subs macrocarpa and Pistacia lentiscus) and litter (mixed material: i.e., needles, leaves and little branches) from fire experiments in a Mediterranean pine forest reserve.
Through the particles and gaseous characterization from biomass burning of each species, we attempt to identify the species that are potentially more dangerous for human health in terms of the emitted particles and gaseous compounds. The study area, a coastal forest close to a large harbour and an industrial area, could be representative of many other human settlements, especially in the Mediterranean area.

2. Materials and Methods

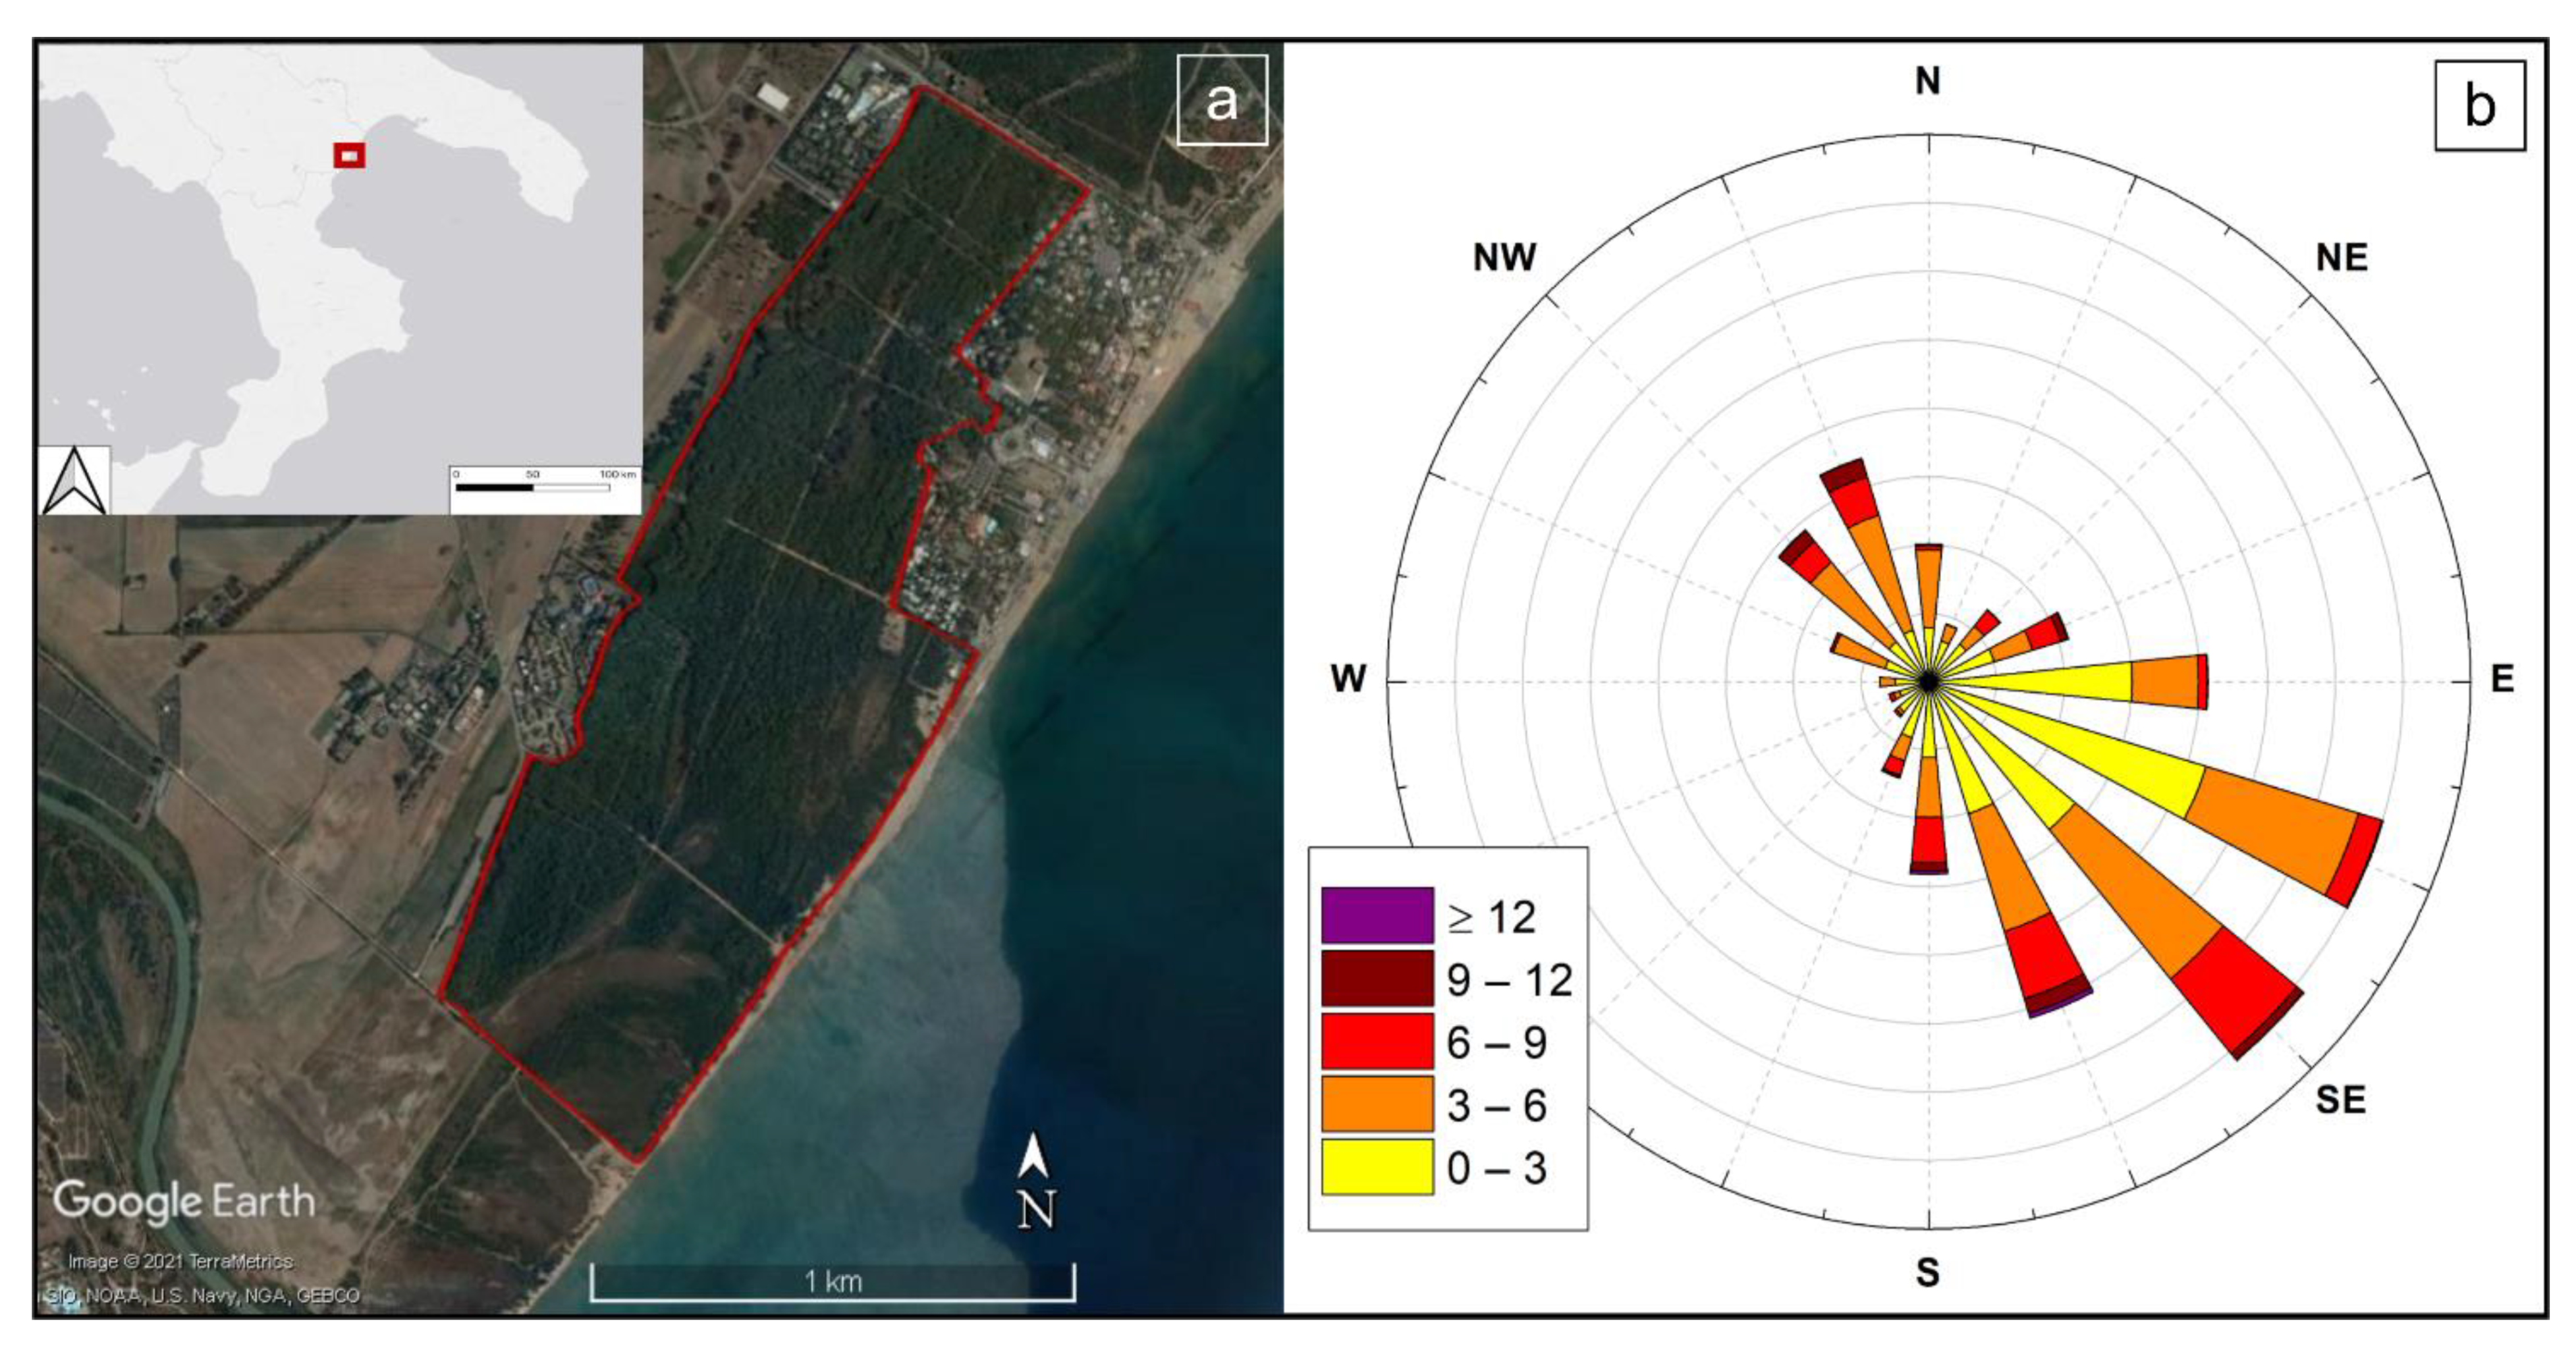
2.1. Study Area and Field Data Collection

The study area is located at the southern part of Metaponto Natural Reserve, Basilicata Region, South of Italy (40°21′24.5″ N 16°49′39.3″ E; Figure 1a). It is one of the first protected sites created in Basilicata (1972; about 240 ha) and is located between the mouths of Bradano and Basento rivers. This reserve was founded to hold back the anthropization of the coast, preserve cultivated areas through the afforestation and safeguard wetland ecosystems at the mouths [35]. The reserve hosts two areas belonging to Natura 2000 network of the Basilicata Region, which have recently become Special Areas of Conservation (IT9220085 Costa Ionica Foce Basento and IT9220090 Costa Ionica Foce Bradano, Ministerial Decree of 21 February 2013).
The vegetation is mainly classified as Mediterranean pine forest (e.g., Pinus halepensis and Pinus pinea), which is characterized by one of the highest flammability indexes in Europe [36]. In the understory, the secondary tree-shrub layer is mainly given by species of the Mediterranean scrub, such as Pistacia lentiscus, Juniperus oxycedrus ssp. macrocarpa, Rhamnus alaternus and Phyllirea latifolia. Secondary species include Acacia saligna and Eucalyptus sp. as well as other psammophytes species.
The site was selected as a case study for its specific combination of proneness to fire, strong human activity (tourism and agriculture) and presence of protected areas. In addition, the area has a special interest related to blazes because a major fire that recently affected the northern side of the Natural Reserve [37]. To provide a complete description of the physical characteristics of the study area, Figure 1b shows a wind rose, which reports the direction and the intensities of prevailing winds.
Samples were collected on 3rd and 4th August 2019 via a 2 km transect within the study area (Figure 1a). Overstory and understory woody plants and litter were collected from at least three different individuals per species along the transect, ensuring, at the same time, a good representation of the local population mainly composed by Acacia saligna, Casuarina equisetifolia, Eucalyptus camaldulensis, Pinus halepensis, Juniperus oxycedrus subs macrocarpa and Pistacia lentiscus. Leaves/needles and small woody branches were collected at sampling heights of 4 m and 1 m for overstory and understory vegetation, respectively. All the samples were air-dried (leaf water content of 10% ± 2) before the combustion experiments and original plant materials were not washed to remove dust as we aimed to simulate natural conditions during forest fires.

2.2. Combustion Chamber

Biomass samples were burned using a combustion chamber, which consists of a stainless steel chamber and an exhaust chimney as described in detail in previous studies [33,34]. The chamber is equipped with a stainless-steel burning basket of 16 × 16 cm, which is covered by a grid where the biomass is located for combustion. The heating is provided by an epiradiometer equipped with ceramic-coated wires [34].
A hundred grams of sample for each different species and litter were positioned on a sample-holder, and combustion was started by the epiradiometer. The chamber was continuously flushed using an electrical fan to ensure the optimal mix with oxygen during combustion and the optimal circulation of gases and particles throughout the chamber and the chimney. The airflow was maintained at a constant rate of 0.5 m s−1 and continuously monitored with an anemometer. There were, overall, seven combustion experiments were: one for litter and six for the above-mentioned species.

2.3. CO and CO2 Measurements

The concentrations of CO and CO2 were measured at a rate of 6 points per minute using a portable analyser MRU NOVA PLUS (MRU ITALIA Srl, Thiene (VI), Italy) sampling directly from the exhaust chimney. The calibrations were performed by the instrument manufacturer before the cycle of experiments reported here.

2.4. VOCs Sampling

The VOCs identified in this study were benzene, toluene, m-p-xylene and o-xylene (BTX). The VOCs sampling line consisted of a glass tube connected perpendicularly to the exhaust chimney through a Teflon tube to a trap filled with 200 mg of Tenax. The trap outlet was connected to a syringe allowing the manual collection of 200 mL of air during each of the three different phases of burning (pre-ignition, flaming and smouldering). Each manual sampling occurred for about 1 min to be representative of the whole phase.
A Teflon filter with 1 mm pores (Whatman plc 7590-004, © Copyright Cytiva, Global Life Sciences Solutions, Marlborough, MA, USA) was used to remove particles in front of the sorbent trap. During the pre-ignition, the sampling was performed when the smoke was starting to appear. During the flaming phase, we sampled as soon as the flame appeared. Finally, during the smouldering phase, the sampling occurred 10 s after the flame turned off. The black of the chamber was collected before each combustion experiment.
VOCs retained on the adsorption traps were first thermally desorbed using a thermal desorption unit (Unity 1, Markes International Limited, Llantrisant, UK) and then analysed with a GC-MS MSD 5975C (Agilent Technologies, Wilmington, NC, USA), equipped with a 30 m long HP-5ms capillary column (J&W Scientific USA, Agilent Technologies, Palo Alto, CA, USA) with an inner diameter of 0.25 mm. The ramp consisted in an initial temperature of 35 °C that was held for 5 min, followed by an increase of 4 °C per minute, up to 250 °C. The chromatograms obtained were analysed using Agilent MassHunter Qualitative Analysis 10.0.

2.5. Particulate Sampling

During each combustion experiment, an isokinetic sampling line was used for the collection of PM on a nitrocellulose filters (0.2 μm porosity). To achieve isokinetic sampling of PM, the flow rate through the sampling system was adjusted to the same flow rate of the fluid moving inside the exhaust chimney using a needle valve placed between the filter and the sampling pump [34]. Particulate matter was sampled for the entire combustion experiment. Filters were used as substrate to perform a quali-quantitative analysis of PM through scanning electron microscopy.

2.6. Scanning Electron Microscopy and Energy-Dispersive X-ray Spectroscopy

To characterize the particulate emissions from biomass burning, the particle size and elemental composition of PM fixed on nitro-cellulose filters were obtained through scanning electron microscopy (SEM) and energy-dispersive X-ray spectroscopy (EDX) analysis, respectively [38,39]. A Phenom ProX (Phenom-World BV, Eindhoven, The Netherlands) scanning electron microscope was used, equipped with X-ray analyser.
Every combustion experiment resulted in a filter where PM was collected. For each filter, three different portions of approximately 1 cm2 were selected and fixed to the head of the carbon-based stub (PELCO Tabs, Ted Pella, Inc., Redding, CA, USA) and thus were observed through SEM/EDX analysis, after having fluxed them with compressed air. For particulate size analysis and number count, SEM images were performed in backscattered electron configuration, with an incident electron energy of 5 keV, in order to limit the surface charging as previously described by Baldacchini et al., 2019. Sixty random images with a scan size of 150 × 150 μm were acquired for each filter, at a resolution of 1024 × 1024 pixels. SEM images were analysed with Gwyddion open-source software, in order to obtain the number and the dimensions of particles originating from the combustion [40].
The number of particles in the image, together with the diameter of the equivalent sphere (deq) of each particle, was obtained by applying a colour threshold-based grain analysis [41,42]. Particles with a deq comparable with the size of a single pixel (0.146 μm) were excluded, resulting in a lower cut-off at about 0.3 μm in the diameter of the analysed particles. Particles with a deq larger than 10 μm (which accounted for less than 0.1% of the total detected particles) were also excluded, resulting in a final data set composed of PM 10–0.3 particles. For particle density analysis, data were divided in three dimensional groups: PM 2.5–10 (all PM included between 2.5 and 10 μm), PM 1–2.5 (all PM included between 1 and 2.5 μm) and PM 0.3–1 (all PM included between 0.3 and 1 μm).
For the elemental analysis of trapped particles on filters, between 18 and 63 images (lateral size included between 5 and 50 μm; 1024 × 1024 pixels) per sample were further acquired, in backscattered electrons configuration and at an electron voltage of 15 kV. Then, a range between 220 and 290 particles per species were analysed. Per each particle, deq was obtained by averaging their two main Feret diameters [43], as measured by ImageJ software [44]. Through dedicated Phenom Pro Suite software, EDX spectra for the elemental analysis were obtained by positioning the laser beam in the centre of selected particles [38].
The main elements identified in the particles were C, N, O, Na, Mg, Al, Si, Cl, K, Ca, Cr, Mn and Fe. Trace elements observed were P, S, Sc, Ti, V, Ni, Cu, Zn, Mo, Sn, Sb, Ba, Ce and Pb. As described in Baldacchini et al. [42], a semi-quantitative estimation of the elemental composition was obtained by calculating the weighted volume percentage (W%) occupied by each element x over the number of selected particles.
This was obtained as a product of the composition C (as percentage) of each element x on each particle i (Cxi, as obtained by the EDX software) and the corresponding particle volume Vi, as obtained by the diameter of the equivalent sphere deq (Vi = 4/3 π (deq/2)3). Then, for each element x, these volumes were summed together, and the sum was normalized by using the total analysed particle volume. The resulting W% for each element x was obtained using the following equation:
W % x = i = 1 N C x i × V i i = 1 N V i
O was excluded from the whole analysis, since it is homogeneously bound to all kinds of molecules, and thus it cannot be used as discriminating factor. However, we kept C and N in our analysis, since they are key elements of organic matter and, as showed by Garcia-Hurtado et al. [28], organic matter emitted during biomass burning represents over 90% of the total emitted mass.

2.7. Statistical Analysis and Principal Component Analysis

Statistica software, v 8 (StatSoft Italia srl, Padua, Italy) was used for statistical analysis in this study. PM density variability on filters from different samples (the six species and litter), was analysed using one-way ANOVA, following confirmation of normality using the Shapiro–Wilk test. Significant differences (thus, the identification of homogeneous groups) were identified using a post-hoc test, namely a multiple comparison test, which was used to determine the significant differences among the six species and litter in an analysis of variance setting. The Tukey HSD test revealed homogeneous groups (p < 0.05).
Principal component analyses (PCA) were performed on the W% data of the whole analysed elements. The large number of initial variables, identified by all 26 analysed elements, was reduced by grouping specific elements. Groups were created by summing three or more elements among them, and two criteria were followed: (a) the elemental source apportionment, i.e., elements characteristic of specific sources and usually found associated in the same particle, such as the Steel and Road marker groups; (b) elements appearing only once—i.e., recorded only in one species, here grouped as Residual Metals.
For PCA performed on PM data, the final list of 16 variables is C, N, Na, Mg, Al, Si, P, S, Cl, K, Ca, Ti, Fe, Steel marker (Cr + Mn + Ni), Road marker (Cu + Sb + Zn) and Residual Metals (Sc + V + Sn + Ce + Mo + Ba + Pb). For PCA performed on gaseous components, the considered variables are CO, CO2, benzene, toluene, m-p- xylene and o-xylene. Only for gaseous components, values of E. camaldulensis were excluded from the case list due to issues with the instrumental setup at the end of the combustion campaign.

3. Results

3.1. Particle Size Distribution

The mean particle density, calculated as the number of particles per square millimetre (#PM/mm2), for each species and litter is shown in Figure 2A. Results from the Tukey HSD-test are also shown, and letters evidence the homogenous groups: species that share the same letter, and thus the same group, do not present significant differences (p < 0.05). The highest number of particles was found for A. saligna (88,570.4 #PM/mm2) and the lowest for J. oxycedrus (5940 #PM/mm2).
The particle density for A. saligna was more than two-times higher than C. equisetifolia, which was the second in number of particles (38,449.6 #PM/mm2). Except for P. lentiscus (24,365.9 #PM/mm2) and the before mentioned species, all the other samples show a density value within 10,000 particles per mm2.
The distribution over the three main PM size fractions (PM 2.5–10, PM 1–2.5 and PM 0.3–1) is reported in Figure 2B. For all the samples, more than 91% of the particles had an aerodynamic diameter below 1 μm (PM 0.3–1). C. equisetifolia, P. halepensis and P. lentiscus reported values higher than 98%, while A. saligna showed the lowest value for the same size fraction (91.8%). Values varied from 0.9% (P. halepensis) to 7.9% (A. saligna) for the size range 1–2.5 μm. The coarse particles (PM 2.5–10) resulted as less than 1% ranging from 0.07% (C. equisetifolia) to 0.6% (litter).

3.2. Particles Chemical Composition: SEM-EDX Analysis

The elemental composition of particles, represented by the weighted percentages (W%) shows the predominant presence of C and N. Their average values were 29.3 ± 3.0, 19.0 ± 1.7 and 44.8 ± 1.9, respectively, while the average sum of all other elements was 6.9 ± 1.0. The considerably higher W% values recorded for C and N, for all species and litter at each dimensional class, are separately presented in Table 1.
The W% of the other identified elements are graphically divided into two groups for each sample and PM fraction (Figure 3 and Figure 4). The threshold for W%, chosen to discriminate the elements, was 0.3%. Thus, the two resulting groups were (a) major elements (Na, Mg, Al, Si, Cl, K, Ca, Cr, Mn and Fe; Figure 3) with W% > 0.3 and (b) trace elements (P, S, Sc, Ti, V, Ni, Cu, Zn, Mo, Sn, Sb, Ba, Ce and Pb; Figure 4) with W% < 0.3. The threshold was considered as an average value among all species and litter for each element. For the PM chemical composition, results are shown following the classification of PM: PM10 (PM < 10 μm), PM2.5 (PM < 2.5 μm) and PM1 (PM < 1 μm).
As a general trend in all species and litter, with decreasing the PM size, the W% of the main crustal elements (Al and Si—predominant silicate components) decreased, with a corresponding increase of the K, Cl and Fe for major elements (Figure 3). For trace elements, with decreasing the PM size, we observed an increase of many metals, such as Ti, Cu, Zn, Mo, Sn, Ba and Ce (Figure 4).
A. saligna diverges from other species for remarkable levels of Cl and K for all PM fractions: the quantity of the two elements always exceeded the other samples by one order of magnitude (Figure 3). Values of N resulted above the average for PM 10 class (Table 1, bold value). Minor concentrations, but still observable, were also found for Ca and Fe, which were recorded in the PM10 and PM2.5 classes (Figure 3a,b). Regarding elements in traces, S had the highest concentration (Figure 4a), and it was always found in particles that also included K, Cl and Na.
C. equisetifolia stood out for the Fe quantity, which showed the highest value for PM2.5 (Figure 3b) and PM1 (Figure 3c). Other major elements were in the average range, without any notable characterization, except for the Cr presence at high W% values for the 2.5 dimensional class and Mg for PM10 and PM2.5. In addition, Al observed at PM2.5 class showed relatively high values, especially when compared to Si. K also showed high levels when compared to Cl and Na for PM10, while this difference gradually spread downward with PM2.5 and PM1. Ti was found in all size fractions as well as S and Ba, while Ce was recorded for PM2.5 and PM1 (Figure 4).
E. camaldulensis showed the highest values in all classes of C (Table 1, bold values). We observed significant high values of Al and Si, related to 1:1 in PM10 and 2.5 (Figure 3a,b), with Al higher than Si for PM1 (Figure 3c). Fe showed similar values to C. equisetifolia, P. halepensis, and litter for PM10 (Figure 3a) while being remarkably higher in PM2.5 and PM1 (Figure 3b,c). In addition, Cl, K and Na were set in the same value range for all classes. Concerning minor elements, E. camaldulensis was characterized by notable values of Ti for PM10 (Figure 3a), Ni and Pb for PM2.5 (Figure 3b) and Ba for PM1 (Figure 3c).
J. oxycedrus samples always presented W% values of N above the average (Table 1, bold values). For this species, Ca was the element with a higher concentration at all PM size fractions (Figure 3). No other remarkable concentrations were observed for major elements, except for the higher K levels when compared to Cl and Na (Figure 3). Furthermore, J. oxycedrus showed the lowest values of Fe (Figure 3). For minor elements, very high values of S were recorded for PM10 (Figure 4a) while most of Cu and Zn were found in the PM1 fraction (Figure 4).
P. halepensis is notable for very high values of Si in PM10 (Figure 3a) and Ca in PM2.5 (Figure 3b) while presenting low values of Fe in PM2.5 and PM1 (Figure 3b,c). It is noteworthy that P. halepensis reported very high values for several minor elements; particularly remarkable values of S and Ni for PM10 (Figure 4a); S, P, Sn and Ba for PM2.5 (Figure 4b); and S and Ti for PM1 (Figure 4c). In addition, P. halepensis in all dimensional classes always showed W% values of C above the average (Table 1, bold values).
In P. lentiscus, we recorded tremendous values of Si and Fe in PM10 (Figure 3a), which were at least 1.7-fold and 3.4-fold higher than other samples, respectively. It is interesting to note that Na has comparable values with Cl and K (Figure 3a). Observed particles with high levels of Na showed the comparable presence of Cl and lower percentages of K. High values of K in PM2.5 (Figure 3b) and Fe in PM2.5 and PM1 (Figure 3b,c) were also recorded.
Regarding minor elements, Ti presented 2.5-fold and 1.7-fold higher values than the average in PM2.5 and PM1, respectively (Figure 4b,c). Sc and V were found in negligible traces for all PM classes only in P. lentiscus (W% ≤ 0.006). We also noticed high values of Cu in PM2.5 (Figure 4b) and the presence of Zn in PM1 (Figure 4c). Moreover, together with J. oxycedrus, it was the only species that showed traces of Sb (Figure 4b,c). Finally, P. lentiscus showed the highest values of S in PM1 (Figure 4c).
Values of litter were usually lower compared to other samples, except for Ca, Cr and Mn in PM1 (Figure 3c), which were slightly higher than the others. Traces of S and Ti were detected for all the PM classes in the litter, along with P in PM10 and PM1 (Figure 4a,c). Finally, together with P. halepensis, litter samples present in all dimensional classes W% values of C above the average (Table 1).

3.3. CO, CO2 and VOCs Emission

The peak of temperature reached during the combustion, the minimum level of O2 concentration (%) and the emission factors of CO2, CO and BTX (g Kg−1) are shown in Table 2. Values for E. camaldulensis are not reported because of a technical issue that occurred during the measurements of this last species. The peak of temperature—that is the maximum temperature reached during the whole combustion process—was determined for every species and ranged from 648.3 °C in A. saligna to 833.86 °C in P. lentiscus and occurred during the flaming phase.
O2 levels decreased suddenly as soon as the flaming phase started, reaching a minimum level of 17.7% in J. oxycedrus and in the litter. Less oxygen was consumed during the combustion of P. lentiscus, where the O2 level reached 18.9% in concentration. The burning of litter showed the highest CO2 emission factor (1617.00 g Kg−1), which was more than twice that measured in C. equisetifolia (698.25 g Kg−1). P. lentiscus, instead, showed the maximum CO emission factor (121.86 g Kg−1), while again C. equisetifolia had the minimum CO emission factor (78.55 g Kg−1) among the studied species.
The studied compounds were mainly released during the flaming and smouldering phases during the burning of each species. Particularly, benzene was the most emitted compound, followed by toluene and xylene, respectively. P. lentiscus always showed the highest values for BTXs emissions, and C. equisetifolia always showed the lowest values. Benzene oscillated from a minimum of 0.27 g Kg−1 (C. equisetifolia) to a maximum of 1.28 g Kg−1 (P. lentiscus). Toluene reported maximum values for P. lentiscus (0.43 g Kg−1) and minimum values for C. equisetifolia (0.06 g Kg−1).
Xylene presented 0.06 g Kg−1 as the highest emission value (P. lentiscus) and 0.01 g Kg−1 as the lowest emission value (C. equisetifolia). J. oxycedrus showed the same maximum values as P. lentiscus for xylene and the second highest values for toluene (0.26 g Kg−1) and benzene (0.55 g Kg−1).

3.4. Principal Component Analysis

Principal component analysis (PCA) based on correlation, was applied to the W% data of the 13 detected elements and three groups, as described on Section 2.7. The analysis was performed for the three-dimensional classes, CO, CO2 and the BTX emissions data recorded during combustions experiments. The analysis highlights the most discriminant elements for the analysed species.
The factor coordinates of variables (Figure 5a,c,e,g) and the factor scores (Figure 5b,d,f,h) of the two first principal components (PCs) are plotted in Figure 5. The eigenvalues of the two PCs, which measure proportion of variance, were at 38.03% and 22.28% for PM10, 31.53% and 28.17% for PM2.5, 35.38% and 26.83% for PM1 and 79.49% and 15.14% for gaseous emissions, for PC1 and PC2, respectively.
Based on the results obtained by PCA, to systematize the complex composition of PM described by PCs and to guide the reader, we roughly divided the elements and compounds into two main groups: endogenous and exogenous. Endogenous elements are mainly emitted during biomass combustion since they are basic components of organic matter: C, N, K, Cl, Na, Ca, Mg, P and S mostly pertain to this group [28,45,46,47]. Exogenous elements are related to particles deposited on leaves and plant surfaces, which are re-emitted during combustion. Among these, Si, Al, Ti and Fe at low concentration (Fe < 3%) are considered natural crustal components (mainly generated from soil resuspension) while Steel marker, Road marker and Residual Metals associated with higher Fe concentration have anthropogenic origin [38,48,49,50].
Regarding PM, PCA discriminates the six species and litter for the three-dimensional classes and highlights the main driver elements that differentiate the particles, or groups of them per each species in all classes: Carbon (C-based); Nitrogen (N-based); KCl particles; Silicon (Si-based); and Anthropogenic particles, represented by Fe, Steel marker, Residual Metals and Road marker. The last group, despite showing less discriminating power in PCA, allows differentiating the vegetational types (trees VS shrubs).
Different coloured rings were adopted to highlight the principal characterizing elements and compounds. When it was impossible to draw a complete ring, an open polygon describes the group to which species belong. To describe the presence of endogenous elements, brown and yellow rings were adopted, for C- and N-based particles, respectively. Grey rings were used to highlight Si-rich particles, which represent the “natural part” of the exogenous group. The anthropogenic part of the exogenous group is evidenced with red rings for Fe + Steel Marker, Road marker and Residual Metals (Figure 5).
Clusters emerging from PCs analysis are not straightforward. In fact, for each dimensional class, a different pattern is evidenced. Nevertheless, most samples showed a coherent particulate elemental composition across all dimensional classes. For example, C-based particles were consistently found in E. camaldulensis for all PM sizes (brown rings on Figure 5). As a general output, PC1 discriminates samples dominated by Si-based particles from N-based particles at all PM classes (grey and yellow rings on Figure 5).
In Figure 5b, starting from the top right to the bottom left, species with high concentration of C (E. camaldulensis) up to species with high concentration of N (J. oxycedrus, A. saligna) are displayed accordingly, but the same trend is not visible for PM2.5 and PM1 (Figure 5d,f). It is noteworthy that Fe particles were always associated with the Si-based particles; in fact, red rings were usually included in grey rings (Figure 5b,d,f). For all PM sizes, A. saligna was always well separated from other samples and this was unsurprising considering its KCl enormous presence (Figure 5).
P. lentiscus emerged as a Si-based species in PM10 and PM2.5 (Figure 5b,d), and it was always associated with Fe, Steel marker and Road particles. C. equisetifolia strongly correlated with Steel marker and presented Si and Fe concentrations mainly for PM2.5 and PM1 (Figure 5d,f). E. camaldulensis presented Fe, Steel marker and Residual Metals for PM1 and only Metals for PM10.
P. halepensis and litter generally presented endogenous particles, both C and N-based and others, such as Ca/P/Mg/S. Moreover, P. halepensis was associated with the Metals group for PM 10 and PM2.5 (Figure 5b,d). It is noteworthy that litter in all PM classes was always placed in the proximity of the intersection of the Cartesian axis, suggesting that litter is not characterized by any specific elements, except for Ca for all PM sizes (Figure 5). We highlight the variability of technological markers among species and dimensional classes: in PM10, the largest part of Fe-Steel markers as related to P. lentiscus (shrub species); in PM2.5, the same markers were related to C. equisetifolia and P. lentiscus (tree + shrub); and in PM1, only E. camaldulensis and C. equisetifolia were strongly related to Fe-Steel particles and Residual metals (tree species).
Regarding PCs analysis for gaseous components (namely CO2, CO and BTXs) the CO2 concentration was evidenced as the main driver of the analysis: species were grouped and distributed on the Cartesian plane following mostly its differential concentration. The highest levels of carbon dioxides were found in litter and P. lentiscus, medium concentrations in A. saligna and P. halepensis, evidenced by blue and light blue rings, respectively, in Figure 5h, and the lowest were recorded for J. oxycedrus and C. equisetifolia.
The second main trend evidenced by PCA is the clustering of the two shrub species: P. lentiscus together with J. oxycedrus (green ring). They both evidenced the highest levels for all gaseous components, except CO2. The only species showing the significantly higher amounts of all gaseous components was P. lentiscus, and this pertains to both clusters evidenced by PCA (intersection of blue and green rings). On the other hand, C. equisetifolia showed the lowest emissions for every recorded gaseous compound, and it is not included in any cluster.

3.5. Main Particles Characterization

A total of 1800 particles were analysed by SEM/EDX on the whole filter set from all species and litter. According to their chemical composition and based on their dimensional and morphological characteristics and also considering the drivers evidenced by PCA, seven main categories of particles were identified: Potassium chloride (KCl particles), Iron and steel-based (Fe-steel), Carbon-based particles (C-based); Nitrogen-based (N-based), rich in Sulphur (S particles), Silicon-based (Si-based) and rich in Calcium (Ca particles). The C-based particles category is divided into two sub-categories: spherical particles and soot agglomerates.
The categories are shown on a dedicated image (Figure 5) and related to the species in which a determined particles category resulted as most representative. A brief description for each category is reported here, showing the percentages of the characterizing elements, the eventual presence of recurring associated elements, their peculiar morphology and dimensions:
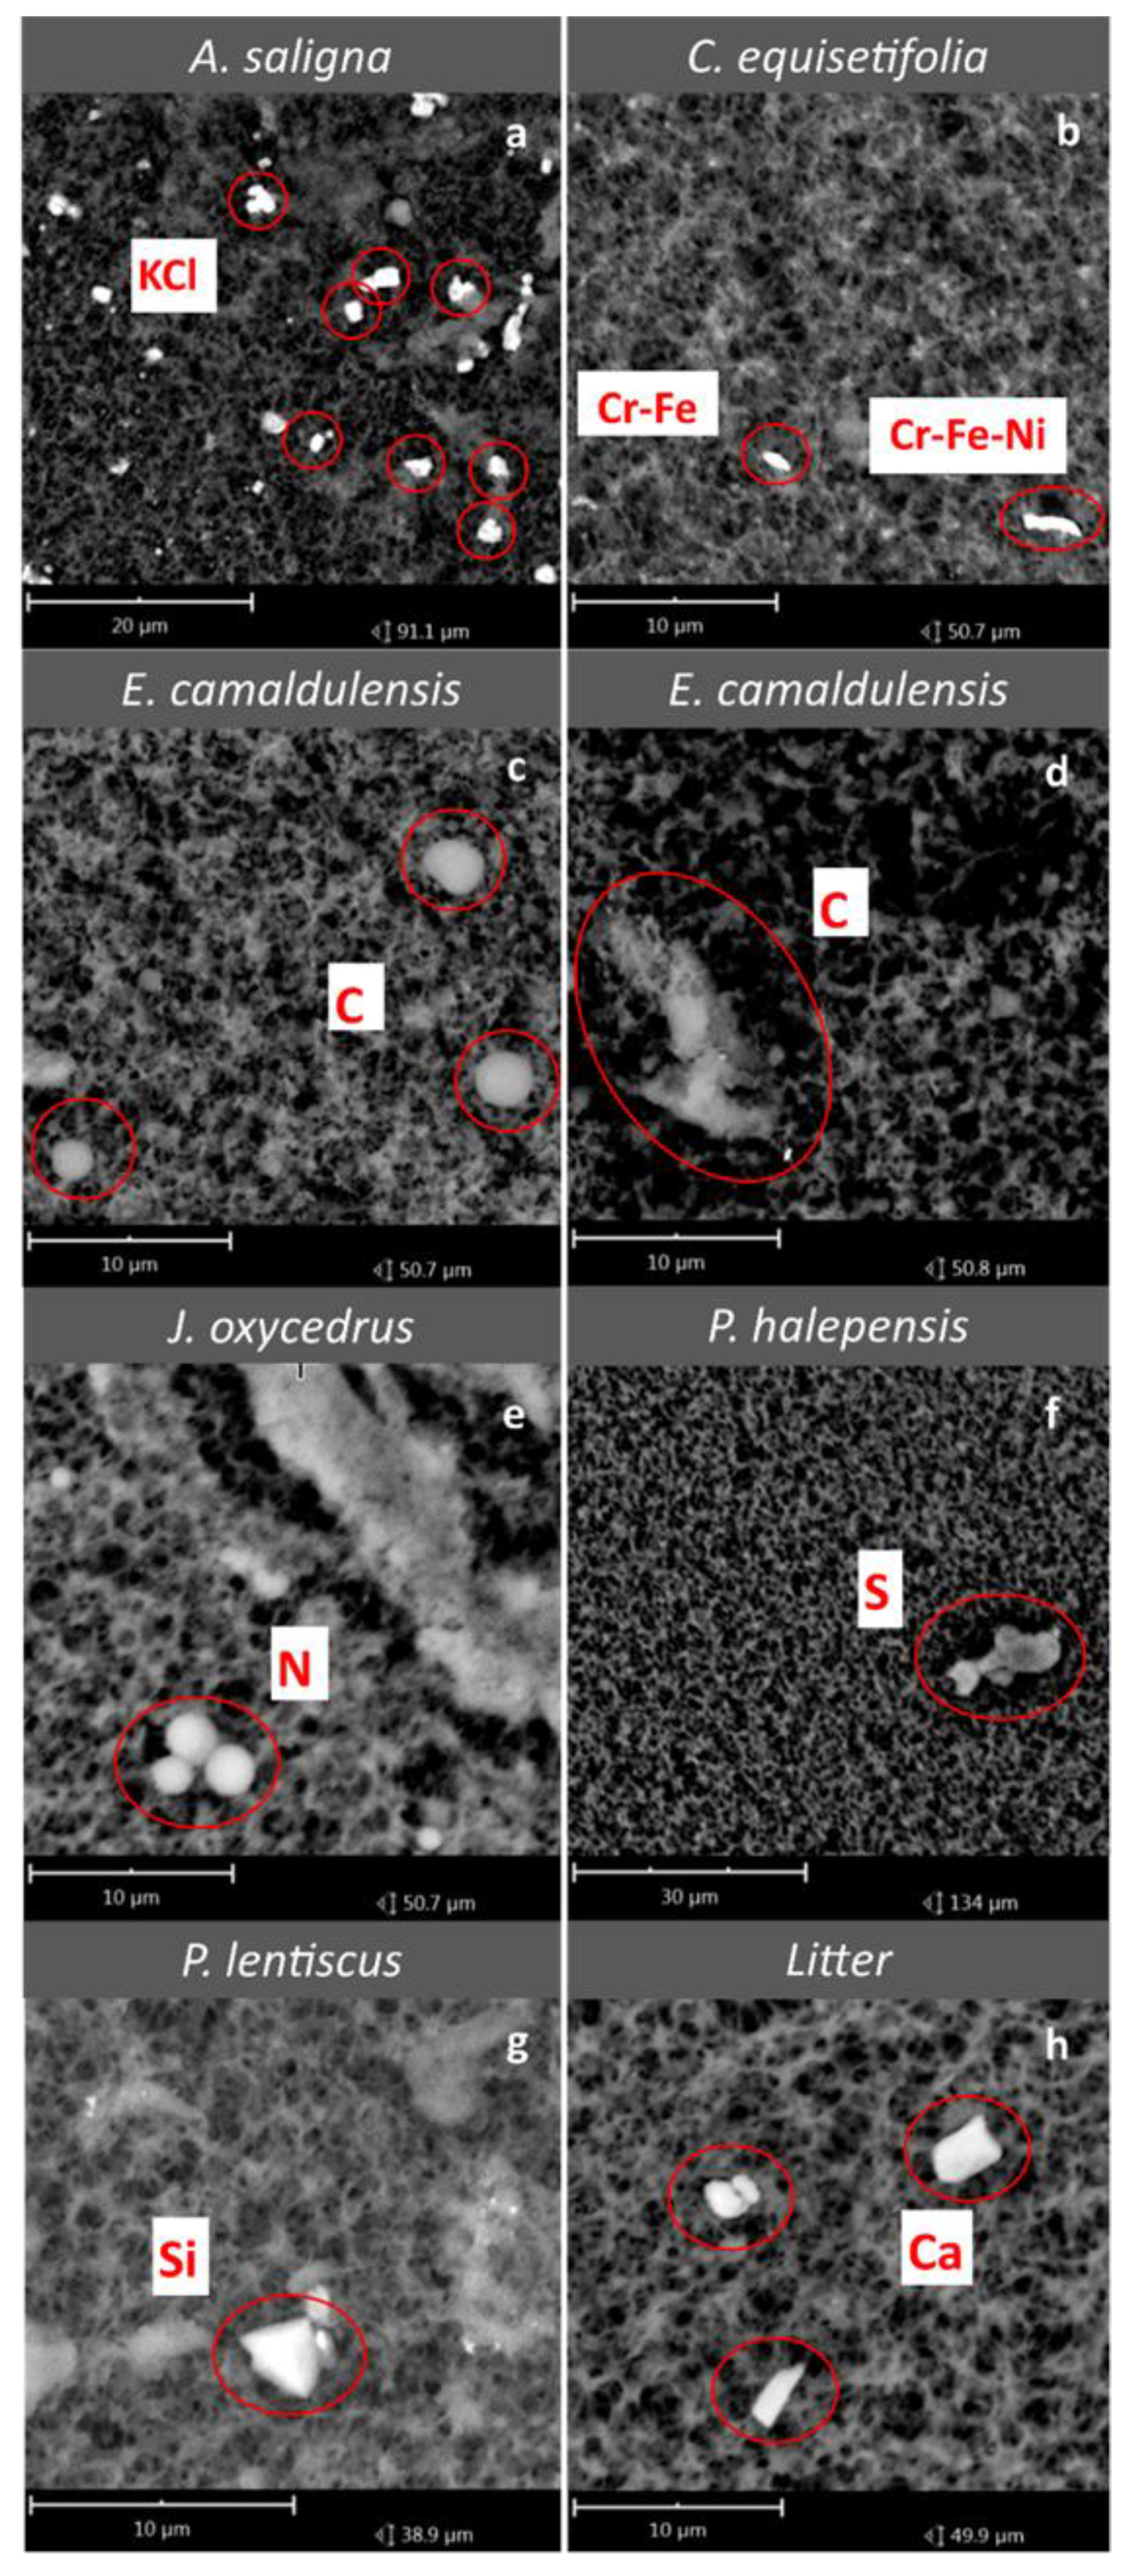
  • KCl particles: Cl < 12%, K < 14%, elements mean ratio is Cl/K = 0.85, partially (<30% of particles) associated with Na (% < 2), their dimensions are mostly between 1 and 2.5 μm, and the morphology is characterized by single or agglomerates of square-shaped particles with sharp edges (Figure 6a).
  • Fe-steel particles: 15% < Fe < 50%, always associated with Cr (% < 10) and Mn (% < 6), occasionally with Ni (% < 5), their dimensions vary between 0.3 and 10 μm nevertheless, they are mostly <2 μm (Figure 6b), and the morphology is irregular polygonal or stick shape and sharped edges.
  • C-based: (a) spherical particles, 35% < C < 50%, usually associated with K and Si (% < 0.5), and the dimensions are mostly <2.5 μm; (b) soot agglomerates, C > 40%, usually associated with K, Si, Na and S (% < 0.5), and their dimensions vary between 1 and 10 μm and present irregular morphology (Figure 6c,d).
  • N-based: always spherical particles, 25% < N <40%, always associated with K and less frequently with S, Cl, Si and Na, not necessarily all together; their dimensions are mostly <2.5 μm (Figure 6e).
  • S particles: 1% < S < 5%, always associated with K, Cl and Ca (% < 0.5) and Si, P and Na (% < 0.3), irregular shaped, high dimensional and morphological variability, and they can reach large dimensions (even >10 μm) (Figure 6f).
  • Si-based: 5%< Si <20%, almost always associated with Al, in ratios Al/Si included between 0.25 and 0.3, and K (% < 5), less frequently with Ca (% < 5), Na and Mg (% < 0.5), and with an irregular polygonal or rounded shape, always with smoothed edges and high dimensional variability (Figure 6g).
  • Ca particles: 8% < Ca < 25%, usually associated with K (% < 0.5), Si and S (% < 0.3), irregular-rounded shape, and the dimensions vary between 1 and 10 μm (Figure 6h).

4. Discussion

4.1. Particle Size Distributions and Density

Particulate matter and gaseous pollutants emitted by forest fire contribute to atmospheric pollution and vary with the species burned [34]. Several studies investigated the amount of particulate emitted from combustion experiments [11,51,52]. Different techniques have been adopted to identify the dust produced during combustion (i.e., optical counters and low-pressure cascade impactors), and the results are usually expressed as a ratio of mass/volume.
Differently, in our study, the total particle density was estimated by SEM imaging coupled with grain analysis over filters, and the results are expressed in number of particles/area (Figure 2A). Consequently, our results are not directly comparable with the previous literature unless considering a relative comparison among the same species. We seek other studies that compared particle density from combustion experiments of the same species analysed in our study. Many studies reported the results of smoke emissions from prescribed burning activities that concerned mixed vegetation or different types of biomass combusted together [27,46,53].
We found only one study [54] that considered separate combustion of the same genus analysed in our research (i.e., Pinus pinaster, Eucalyptus globulus and Acacia longifolia). Accordingly with our work, Gonçalves et al. [54] found comparable values of PM emission for Eucalyptus and Pinus, with higher particle emission for the former. Conversely, we found different outcomes for Acacia. As shown in Figure 2, the number of particles counted on Acacia filters was noticeably higher than other samples; this could be ascribed to the extraordinary values of K and Cl that we recorded through filter analysis that will be discussed later in this section. Even if mostly made by natural components, this large number of emitted particles recorded for A. saligna could be considered as a risk factor in terms of emissions during forest fire.
Figure 2B presents the size of particulates, expressed as relative abundances (%), that we found on filters after combustion experiments. This is a crucial trait to be monitored as the behaviour of PM within the human respiratory system depends on their size. As described by Leonelli et al. [55], while the PM10 is not retained by the upper airways, fine particles (PM2.5) represent the thoracic fraction of particles.
PM1 corresponds to the very fine particles (diameter of 1 μm or less) that can permeate inside the alveoli. In our study, the frame that emerged in terms of number of particles per size fraction is coherent with the typical atmospheric PM size distribution generally observed [56], and it is characterized by the domination of fine particles (primarily soot-related) as also reported in other analysis of fires in laboratory-based experiments [57,58,59].
In comparison to other species, A. saligna showed different results and emerged for dimensional size distribution (Figure 2B). In fact, it is the only species that showed such a significant presence of fine particles (PM 1–2.5 = 7.9%). This is likely due, once again, to Acacia’s exceptional values of K and Cl, whose nature is characterized by this dimensional distribution (Figure 3b). C. equisetifolia and P. halepensis are the species that emitted a higher amount of very fine particles (PM 0.3–1 ≥ 99%).
It is well known that, the smaller the diameter of the PM, the higher the health risk it creates, as finer particles can carry toxic substances deeper into the human respiratory system [60]. This particle property makes clear the importance of the quali-quantification analysis of particles with very fine aerodynamic diameter for health hazards, considering that these fine dust fractions usually suffer from a lack of chemical characterization [61].

4.2. Particles Chemical Composition

Apart from the size distribution of the emitted PM, we identified the elemental composition of particles as the health effects caused by PM are dependent not only on its physical but also on chemical properties [62]. Except for O, which was excluded from the analysis, the most abundant elements recorded were C and N.
Their relative abundances strongly characterize the composition of particles emitted, thus, giving important information about species characterization. If we compare the elemental composition of particles recorded in previous studies developed with the same detecting instrument (SEM/EDX, Phenom Pro-X, as described Section 2.6), we observe a significant higher presence of C and N. Baldacchini et al. [39] analysed particles on leaves show an average value of C, N and O of 85.1%. Sgrigna et al. [38] analysed particles on cellulose filters that show the average value of the same elements of 71%. In the present study, the sum of these elements represents the 93%.
Among the most abundant elements, Al, Si, Ca and Fe were recorded in all the samples (Figure 3). They are usually recognized as “natural elements”, and can be classified as earth’s crust aerosol group or associated with resuspended soil [50,63,64]. However, even if Fe is abundant in nature, it can also originate from anthropogenic sources. In fact, Fe is also a tracing element for traffic PM and, in general, is a technological marker [39,65]. Si and Ca can be also found as components of plant tissues [66].
Na, Cl, K and Mg are classified as natural tracing elements and are found within different salt compounds, usually typical components of sea spray aerosol [67]. Furthermore, elements, such as K and Mg, could also originate from the plant tissues [66]. On the other hand, Cu, Zn, Mo, Ce, Pb, Ba, Cr, Mn and Ni have anthropogenic origins; particularly Cr, Mn, Ni and part of the above-mentioned Fe are considered to be steel plant fingerprints [38,68,69].
K, Na and Cl were observed across all species and litter (Figure 3). This is consistent with previous studies that analysed smoke particles from field and indoor burning experiments [70,71]. The presence of K is usually ascribable to the results of volatilization of plant tissues during combustion [70] and it is widely considered as marker of biomass burning [27,32,49,52,53,72]. In this context, we recorded tremendous values of K and Cl for A. saligna, which were always associated in the same particle (Figure 3a). This peculiarity is likely linked both with (1) plant traits and (2) site characteristics.
First, A. saligna is a halophyte species frequently used in reforestation programs for semi-arid regions. It can tolerate salt spray, extreme winds and sandy soil [73]. As well described by Rahman et al. [74], one of the key mechanisms of salt tolerance in plants may be associated with the increasing of the retention of K+ ions in photosynthetic tissues by preventing the absorption of Na. Other analyses on remaining minerals in the ashes from leaves and stems burning confirm the presence of KCl (sylvite) associated with Acacia species [45]. Thus, the presence of a considerable part of these elements can be likely ascribed as an intrinsic Acacia species characteristic.
Furthermore, as described in Section 3.2, the Cl/K ratio in A. saligna is always in the same range for all analysed particles (0.85) with the same morphological characteristics. This describes the presence of the two elements in potassium chloride salt form (KCl), while the relative percentages of K and Cl in other species are likely also an indicator of biomass combustion [5,70]. Na was found, and it was often associated with Cl and K (Figure 3). This denotes the presence of NaCl, a kind of salt that is likely derived from marine spray. NaCl was likely accumulated on tree leaves before their collection, also considering the sampling area proximity to the Ionian Sea and the southeastern predominant winds (Figure 1b).
In A. saligna, Na is always significantly lower than K and Cl (1 order of magnitude). In all other species the three elements Na, Cl and K show different mutual relationships and are often found associated in the same particle, with highly variable relative percentages. This suggests the presence of salt aggregates dominated both by KCl (as in A. saligna) and NaCl (as in P. lentiscus) and when not associated with Na and Cl, K is bonded to other elements (Ca, S and Mg), within typical particles from biomass burning.
The presence of Fe is noticeable for all species (except for A. saligna and J. oxycedrus) and the highest values of all samples were recorded for the PM2.5 class (particularly for C. equisetifolia and P. lentiscus; Figure 3b). Furthermore, mainly in C. equisetifolia and E. camaldulensis but also P. halepensis, P. lentiscus and litter, the presence of Ni, Cr and Mn was found at all PM classes. The iron presence, together with these elements suggests the direct effect of steel plant on these species [60,68].
We hypothesize that particles accumulated on collected leaves and branches are preserved until the burning process, and re-emitted as PM within the re-suspended fumes. This is supported by the direction and the intensities of winds at our study area (Figure 1b). In fact, the prevailing winds blow from the south-east, where the industrial area of the city of Taranto (Apulia, South Italy) is located. It is likely that, when the winds blow from the SE, the site is influenced by anthropogenic sources mainly related to steelworks, iron foundries and by the presence of heavy metals, which characterize the Taranto industrial area [69].
In addition to Fe, Ni, Cr and Mn, E. camaldulensis, C. equisetifolia and P. halepensis also showed relatively high heavy metals (HM) concentrations. In this respect, it is important to indicate the values of Sn, Ba, Ce and Pb, recorded for the above-mentioned species (Figure 4). The presence of HM confirms the probable effect of air pollutants deposition on sampled leaves, which are typical of the ambient air concentrations of polluted urban or industrial areas [28].
Regarding trace elements, we noticed that Mo, Sn, Ba, Pb and Ce were only found on tree species while Cu, Zn and Sb were observed only for shrub species. As Mo, Sn, Ba and Pb are identified as heavy metals originating from human activities [38,65], this finding corroborates the thesis that particles containing these elements are drifted through the south-east winds and are intercepted by trees canopy. On the other hand, Cu, Zn and Sb, commonly classified as road traffic markers and abrasion products, and found on shrubs, are related to road dust resuspension [38,75].
The finer the particles (from PM10 to PM1), the higher percentage values of the above-mentioned elements were found (Figure 4). Namely, Cu, Zn, Sb, Ba and Ce showed higher values both in PM2.5 and PM1; Ni, Sn and Pb only in PM2.5; and Sc, V and Mo only in PM1. This is not surprising considering that fine particles are mostly linked to anthropogenic sources that involve high-temperature processes [76] and the city of Taranto, where the wind blows from, include well-developed oil refineries, chemical works, some shipyards for building warships, in addition to the already mentioned steel factory [69].
As described in Section 3.4, all the aforesaid elements pertain to the exogenous group of particles. Conversely, among trace elements S and P can be ascribed to the endogenous component of particles [77,78,79]. The two elements are widely recognized as biomass emission burning [80], and their presence depends on fuel composition [81]. S significantly appears more abundant in P. halepensis, at all PM classes, followed by J. oxycedrus and A. saligna for PM10 and P. lentiscus and J. oxycedrus for PM1, but it has been recorded in all species and litter at different percentages. This is supported by Figas et al. [82], who explained that, apart from the content of SO2 in the air and the richness of soil soluble sulphates, the content of S in the plant depends on the plant species.
Furthermore, it is noteworthy that, differently from exogenous trace elements, no relevant relationship was found between the S presence and the particle dimensions. Similarly, P has been recorded in all species at least in one PM class except for J. oxycedrus, and, like S, when the percentage values are averaged among all species, no differences were evidenced between the three dimensional classes. It originates from soils and it is an essential nutrient of plants [83] but it is also likely related to plant species. It is noteworthy how in P. halepensis, which showed the highest values for P, this element was always recorded in association with particles containing S.
Finally, among trace elements, also Ti was found in almost all species (except A. saligna). This element has an ambivalent nature: it can be associated with both crustal/natural components [84,85] and anthropogenic particles [86]; thus, the description for Ti is not straightforward. In general, we mainly observed the natural origin of Ti, since it is mostly bounded to natural components, such as K, Cl and S or crustal elements (Si).
The only exception was found for litter, where Ti is also associated with Fe, Zn and Cu. This association (Ti + Fe and Ti + Cu + Zn) together with the location (litter) suggests a possible anthropogenic origin of Ti from vehicular emissions [49].
For both anthropogenic and natural elements, especially Ca, can be hypothesized a conservative and accumulation process of material within the litter. Similarly, an accumulation of steel plant leaf-deposited particles (identified through the markers Fe, Cr and Mn) is probable. It is noteworthy that the other HM, characterizing the species (Ni, Cu, Zn, Mo, Sn, Ba and Ce), are not found in the litter burning. This absence could inform or in HM leaching at deeper levels within the soil or in a less abundant presence of these pollutants in the air (thus deposited on sampled leaves), with respect to steel plant markers (abundant at all levels and species).

4.3. CO, CO2 and VOCs Emission

As also shown in other studies, CO2 emissions occurred primarily and reached the highest peak during the flaming phase, while CO was mainly released in a second moment, during the smouldering phase [34,87,88]. These results are in good agreement with what found by Vicente et al. [27], who studied forest wildfire emissions in Portugal, obtaining values from 1029 to 1655 g kg−1 for CO2 and from 67 to 383 g kg−1 for CO. Our study presents lower CO2 emission when compared to what Akagi et al. [89] found, which ranged from 1489 (boreal forest) to 1686 g Kg−1 (savanna), and to what was reported by Andreae and Merlet [1] for extratropical forests wildfires, which had a CO2 emissions factor that ranged from 1569 g Kg−1 (extratropical forest) to 1613 (savanna and grassland).
The emission factors obtained for CO, instead, are a bit higher if compared with the study of Andreae and Merlet [1] (65 g Kg−1 on savanna and grassland and 107 g Kg−1 on extratropical forest) while are in the range of what was found by Akagi et al. [89] (63 and 127 g Kg−1, respectively, for savanna and boreal forest). BTX emission factors were calculated as well since they are dominant aromatic compounds in forests wildfires [15]. According to Faix et al. [90] and Struppe et al. [91], aromatic compounds are emitted upon thermal degradation of biomass, essentially from wood lignin. Benzene was a predominant compound among the BTX, especially in P. lentiscus, with values of 1.28 g Kg−1, that were reasonably close to the values for emissions from extratropical forests (1.11 g Kg−1, [78]).
Andreae and Merlet [1], on the contrary, found lower benzene emissions in wildfires of different ecosystems, reaching these levels only for biofuel burning or charcoal making. Other species showed minor benzene emissions that were 4.7-fold less (C. equisetifolia). P. lentiscus also showed the highest levels of Toluene and Xylene. Toluene emission factors obtained are in the range of what was studied by Akagi et al. [78] and Andreae and Merlet [1] (respectively, (0.48 and 0.40 g Kg−1) on extratropical forests. The xylene levels that we report are quite lower than what was reported in other studies, more comparable with savanna and grasslands or tropical forests.
The temperature was monitored in real-time during every combustion event, and since it was measured with a thermocouple at the base of the flame, it should be intended as the maximum temperature also among the flame profile, as showed by Wotton and Martin [92]. The highest temperatures recorded occurred always during the flaming phase, and these were in accordance with the results found in similar combustion experiments.
In Pallozzi et al. [34], where combustion experiments were performed on different plant tissues, the peak ranged from 562 to 813 °C in Quercus pubescens and from 531 to 713 in Pinus halepensis. In both species, the highest temperatures were reached when the branches, rather than leaves or litter, were burned, indicating that the heat was developed more in presence of wood tissues. Other studies on leaf litter of Quercus robur burning, showed a maximum temperature of 550 °C [33]. The values obtained are comparable also to what was found in field studies on wildfires [92,93].

4.4. PCA Analysis

PCA was used to describe the major differences among species and litter, based on the elemental composition of emitted particles. It discriminated and grouped the analysed species based on their characteristic elemental composition and gaseous emissions. Through this analysis, the main drivers are evidenced: C- and N-based particles (endogenous) and Si-based and anthropogenic particles (exogenous). Both groups are represented in all PM classes, and they coexist together in the majority of samples, neither one nor the other category was a discriminant factor. The main example is E. camaldulensis, which showed high levels of both endogenous and exogenous particles.
Similarly to our findings, Garcia-Hurtado et al. [28] described C-based particles as important components of the emitted PM during burning and reported their size mainly below 2.5 μm. Several studies [45,79] mentioned nitrogen losses due to volatilization when combustion of the biomass is nearly complete, which is presumably due to the conversion of most plant nitrogen to NH3, NOx and N2 gases during the combustion process [77]. Nevertheless, we found a significant amount of N within several spherical particles in our experiments (Table 1; Figure 6e).
As suggested by Yokelson [94], who reported spherical particles from open biomass burning, we hypothesize that these particles could have been molten, cooled rapidly after emission and, thus, re-condensed on filters. This is also supported by Samsonov et al. [84] who argued that organic matter burns down partially or completely and that grains disintegrate into small particles and are lifted out of the fire by hot currents. Then, the particles cool, forming the smoke emission.
A. saligna is always separated from all other samples, due to its strongly characterized KCl content. Only in PM10, A. saligna is included in the yellow ring as species containing N-based particles (Figure 5b). Makkonen et al. [95] reported that the relatively high amounts of coarse fraction nitrogen may be an indication of nitrate formation on sea salt, producing coarse NaNO3 and HCl vapour. This suggestion could also be consistent with Na presence related to the particles that characterize A. saligna.
The second species strongly characterized by PCA is E. camaldulensis, which appears to be a strong emitter of different kinds of particles. As above mentioned, it showed the highest values for C-based particles in all classes, both in soot and spherical form (as presented in Figure 6c,d), but it is also always included in the Si-based and technology-related group of particles (grey and red rings, Figure 5).
It is noteworthy how a similar pattern is shown for the third best characterized species, C. equisetifolia, which is always included in the technology-related particles group and it showed high levels of C in PM10 and high levels of Si in PM2.5 and PM1. This species, if we consider also the relatively high density of particles recorded on filters (as showed in Section 3.1) could be described as the most potentially dangerous species among the analysed ones, based on PM data outcomes.
The last tree species of sampling set, P. halepensis could be associated with E. camalduensis and C. equisetifolia: it is well represented by C-based particles, and for PM10 and 2.5 by anthropogenic elements. What is differentiating P. halepensis from the two above-described tree species is the high S presence in all dimensional classes.
The last two species, the only sampled shrubs, J. oxycedrus and P. lentiscus, even if not usually associated in the same group, also showed a similar pattern of characterizing elements in the PCA: both species show the coexistence of endogenous particles and anthropogenic particles in 2- on 3-dimensional classes. Nevertheless, the first one is also strongly characterized by N-based particles, and the second one showed a stronger relation with technology-related particles.
Within the anthropogenic-related particles, four different groups of elements are included: Fe, Steel marker, Road marker and Residual metals. The only two species that showed a strong relationship with Road marker are P. lentiscus, in all classes and J. oxycedrus for PM10 and 1. This suggests a re-suspension influence for these species from local pollution sources, such as the closest roads or particles originated by the use of agricultural machinery in the nearest farmlands [49,96].
Finally, due to the significantly high levels of dangerous elements re-emitted, together with its relatively high density of particles, P. lentiscus is included among the potentially more dangerous species for human health in this study.
On the other hand, Fe, Steel marker and residual metals are always characterizing E. camaldulensis, C. equisetifolia and P. halepensis while are not associated with Road markers (Cu, Zn and Sb). This condition could suggest two different sources of technological related particles deposited on samples before burning. If the Road markers are related to shrub species, the tree canopies intercept the exogenous (anthropogenic) particles.
Tree leaves could have accumulated dust coming from the urban settlements or also from the upwind industrial area of Taranto. Thus, we can assume that PCA, considering the emitted particles, is also discriminating the species set based on the vegetation typology. This confirms how shrubs are mostly related to resuspension from soil/Road markers while trees are related to windblown particles (Steel and Residual Metal).
Finally, the litter sample is always represented close to the axis interception. This peculiar positioning denotes the general equilibrium of elements for this sample, which likely homogenously accumulates the different kinds of elements and markers, which characterize trees and shrubs in the study area. It is noteworthy how the litter is mostly associated with J. oxycedrus by PCA: Ca is the main element that combines the two samples.
Ca was also found in P. halepensis and, as previously described, could be accumulated in the litter deposits mainly made by pine and J. oxycedrus needles. This was confirmed by Palviainen et al. [97], who identified the foliage as immediate sources of Ca to the soil and recognize an effective retention of Ca in woody litter. Our results were supported by literature as high values of Ca were registered in smoke particles from wildfire episodes over central Portugal, which included Pinus pinaster and forest litter [27].
PCA performed on gaseous components confirmed two main trends evidenced by the same analysis on particles: P. lentiscus was notable for the high emissions level, and the two shrub species are related. The total amount of recorded BTXs was significantly higher first in P. lentiscus than in J. oxycedrus. Thus, as found for particles emissions, PCA performed on gaseous compounds discriminates shrubs from tree species. While for PCA-elements, this was due to the deposited elements on the shrubs layer; in this case, we are not able to address this clustering to vegetation type characteristics rather than intrinsic traits of J. oxycedrus and P. lentiscus.
Furthermore, the main driver evidenced for gaseous components was the CO2 emitted. The following ranking of analysed species and litter can be realized by observing the differential CO2 emissions: litter; P. lentiscus, A. saligna, P. halepensis, J. oxycedrus and C. equisetifolia. Finally, C. equisetifolia emerged as a low emitter species for all gaseous compounds, while it was reported as one of the species with a high particle density during PM analysis.

5. Conclusions

This study provides original data on the PM and gaseous emissions released by the controlled burning of six Mediterranean species and litter, paying particular attention to the size fraction, chemical composition and total amount of particulates emitted. The main results can be resumed as follows:
  • PM10 emissions from forest burning are related to species-specific characteristics of trees and shrubs but are also strongly influenced by local environment/regional conditions.
  • A. saligna is notable for the highest number of particles emitted and remarkable values of KCl, which is likely related to a plant protection mechanism from salinity.
  • The other high vegetation types analysed in our study, the tree species E. camaldulensis, C. equisetifolia and P. halepensis, are related to fine windblown particles: their canopies intercept PM10 and re-emit it during burning.
  • Medium high plants observed in our study, the two shrub species, P. lentiscus and J. oxycedrus, are differentiated from other samples by the presence of resuspended particles from soil and/or roads.
  • Litter samples demonstrated a homogenous accumulation of different kinds of elements and markers, which characterized the trees and shrubs in the study area.
  • Benzene and toluene were the dominant aromatic compounds emitted.
Finally, the species identified in our study with a stronger impact on local air quality and potentially more dangerous for human health when combusted were:
  • A. saligna (the highest number of particles emitted and medium values for gaseous emissions).
  • P. lentiscus (high density of particles; anthropogenic particles, such as Fe, Steel and Road group; highest emissions for all gaseous compounds).
  • C. equisetifolia (high density of particles; technology-related particles, such as Fe with the Steel group, although with the lowest emissions for gaseous compounds).
  • We also indicate litter and P. lentiscus as the strongest contributors to greenhouse gas emissions in the atmosphere when compared to all species analysed, considering their significantly higher emissions of CO2.

Author Contributions

Conceptualization, E.N., G.S. and E.P.; Formal analysis, E.N., G.S., E.P. and L.C.; Funding acquisition, C.C.; Methodology, E.N., G.S. and E.P.; Resources, E.P. and G.G.; Writing—original draft, E.N. and G.S.; Writing—review and editing, E.N., G.S., E.P. and G.G. All authors have read and agreed to the published version of the manuscript.

Funding

This research was funded by the project SERV_FORFIRE “Integrated services and approaches for assessing effects of climate change and extreme events for fire and post-fire risk prevention”. Project SERV_FORFIRE is part of ERA4CS, an ERA-NET initiated by JPI Climate, and funded by FORMAS (SE), DLR (DE), BMWFW (AT), IFD (DK), MINECO (ES) ANR (FR) with co-funding by the European Union (Grant 690462). This research was co-funded funded by the project ‘OT4CLIMA’, which was financed by the Italian Ministry of Education, University and Research (D.D. 2261 del 6.9.2018, PON R&I 2014-2020 and FSC).

Institutional Review Board Statement

Not applicable.

Informed Consent Statement

Not applicable.

Data Availability Statement

Part of data used for the research, namely wind data, were found at: http://centrofunzionalebasilicata.it/it/scaricaDati.php (accessed on 15 February 2022).

Acknowledgments

We wish to thank Protezione Civile of the Basilicata Region for providing meteorological data.

Conflicts of Interest

The authors declare no conflict of interest.

References

  1. Andreae, M.; Merlet, P. Emission of trace gases and aerosols from biomass burning. Glob. Biogeochem. Cycles 2001, 15, 955–966. [Google Scholar] [CrossRef] [Green Version]
  2. Knorr, W.; Lehsten, V.; Arneth, A. Determinants and predictability of global wildfire emissions. Atmos. Chem. Phys. 2012, 12, 6845–6861. [Google Scholar] [CrossRef] [Green Version]
  3. Adam, M.G.; Tran, P.T.M.; Bolan, N.; Balasubramanian, R. Biomass burning-derived airborne particulate matter in Southeast Asia: A critical review. J. Hazard. Mater. 2021, 407, 124760. [Google Scholar] [CrossRef] [PubMed]
  4. Ni, H.; Han, Y.; Cao, J.; Chen, L.W.A.; Tian, J.; Wang, X.; Chow, J.C.; Watson, J.G.; Wang, Q.; Wang, P.; et al. Emission characteristics of carbonaceous particles and trace gases from open burning of crop residues in China. Atmos. Environ. 2015, 123, 399–406. [Google Scholar] [CrossRef]
  5. Guo, L.; Ma, Y.; Tigabu, M.; Guo, X.; Zheng, W.; Guo, F. Emission of atmospheric pollutants during forest fire in boreal region of China. Environ. Pollut. 2020, 264, 114709. [Google Scholar] [CrossRef] [PubMed]
  6. Laumbach, R.; Kipen, H. Respiratory health effects of air pollution: Update on biomass smoke and traffic pollution. J. Allergy Clin. Immunol. 2012, 129, 3–13. [Google Scholar] [CrossRef] [PubMed] [Green Version]
  7. Green, M.C.; Chen, L.W.A.; DuBois, D.W.; Molenar, J.V. Fine particulate matter and visibility in the Lake Tahoe Basin: Chemical characterization, trends, and source apportionment. J. Air Waste Manag. Assoc. 2012, 62, 953–965. [Google Scholar] [CrossRef] [PubMed] [Green Version]
  8. Sharma, S.K.; Agarwal, P.; Mandal, T.K.; Karapurkar, S.G.; Shenoy, D.M.; Peshin, S.K.; Gupta, A.; Saxena, M.; Jain, S.; Sharma, A.; et al. Study on Ambient Air Quality of Megacity Delhi, India During Odd–Even Strategy. Mapan J. Metrol. Soc. India 2017, 32, 155–165. [Google Scholar] [CrossRef]
  9. Keywood, M.; Kanakidou, M.; Stohl, A.; Dentener, F.; Grassi, G.; Meyer, C.P.; Torseth, K.; Edwards, D.; Thompson, A.M.; Lohmann, U.; et al. Fire in the air: Biomass burning impacts in a changing climate. Crit. Rev. Environ. Sci. Technol. 2013, 43, 40–83. [Google Scholar] [CrossRef]
  10. Peñuelas, J.; Llusià, J. BVOCs: Plant defense against climate warming? Trends Plant Sci. 2003, 8, 105–109. [Google Scholar] [CrossRef]
  11. Shen, G.; Wei, S.; Wei, W.; Zhang, Y.; Min, Y.; Wang, B.; Wang, R.; Li, W.; Shen, H.; Huang, Y.; et al. Emission factors, size distributions, and emission inventories of carbonaceous particulate matter from residential wood combustion in rural china. Environ. Sci. Technol. 2012, 46, 4207–4214. [Google Scholar] [CrossRef] [Green Version]
  12. Wang, X.; Xu, Z.; Su, H.; Ho, H.C.; Song, Y.; Zheng, H.; Hossain, M.Z.; Khan, M.A.; Bogale, D.; Zhang, H.; et al. Ambient particulate matter (PM1, PM2.5, PM10) and childhood pneumonia: The smaller particle, the greater short-term impact? Sci. Total Environ. 2021, 772, 145509. [Google Scholar] [CrossRef]
  13. Preisler, H.K.; Zhong, S.; Esperanza, A.; Brown, T.J.; Bytnerowicz, A.; Tarnay, L. Estimating contribution of wildland fires to ambient ozone levels in National Parks in the Sierra Nevada, California. Environ. Pollut. 2010, 158, 778–787. [Google Scholar] [CrossRef]
  14. Goldammer, J.G.; Statheropoulos, M.; Andreae, M.O. Impacts of Vegetation Fire Emissions on the Environment, Human Health, and Security: A Global Perspective. In Wildland Fires and Air 10 Pollution Developments in Environmental Science; Bytnerowicz, A., Arbaugh, M., Riebau, A., Andersen, C., Eds.; Elsevier: Amsterdam, The Netherlands, 2009; Volume 8, pp. 3–36. ISBN 9780080556093. [Google Scholar]
  15. Evtyugina, M.; Calvo, A.I.; Nunes, T.; Alves, C.; Fernandes, A.P.; Tarelho, L.; Vicente, A.; Pio, C. VOC emissions of smouldering combustion from Mediterranean wildfires in central Portugal. Atmos. Environ. 2013, 64, 339–348. [Google Scholar] [CrossRef]
  16. Nayek, S.; Padhy, P.K. Personal exposure to VOCs (BTX) and women health risk assessment in rural kitchen from solid biofuel burning during cooking in West Bengal, India. Chemosphere 2020, 244, 125447. [Google Scholar] [CrossRef] [PubMed]
  17. Agency for Toxic Substances and Disease Registry (ATSDR). Toxicological Profile for Benzene; U.S. Public Health Service, U.S. Department of Health and Human Service: Atlanta, GA, USA, 2007.
  18. Agency for Toxic Substances and Disease Registry (ATSDR). Toxicological Profiles for Toluene; U.S. Public Health Service, U.S. Department of Health and Human Service: Atlanta, GA, USA, 2017.
  19. Agency for Toxic Substances and Disease Registry (ATSDR). Toxicological Profiles for Xylene; U.S. Public Health Service, U.S. Department of Health and Human Service: Atlanta, GA, USA, 2007.
  20. González-De Vega, S.; De las Heras, J.; Moya, D. Resilience of Mediterranean terrestrial ecosystems and fire severity in semiarid areas: Responses of Aleppo pine forests in the short, mid and long term. Sci. Total Environ. 2016, 573, 1171–1177. [Google Scholar] [CrossRef] [PubMed]
  21. García-Llamas, P.; Suárez-Seoane, S.; Taboada, A.; Fernández-Manso, A.; Quintano, C.; Fernández-García, V.; Fernández-Guisuraga, J.M.; Marcos, E.; Calvo, L. Environmental drivers of fire severity in extreme fire events that affect Mediterranean pine forest ecosystems. For. Ecol. Manag. 2019, 433, 24–32. [Google Scholar] [CrossRef]
  22. Dimitrakopoulos, A.P.; Mitsopoulos, I.D.; Kaliva, A. Short communication. comparing flammability traits among fire-stricken (low elevation) and non fire-stricken (high elevation) conifer forest species of Europe: A test of the mutch hypothesis. For. Syst. 2013, 22, 134–137. [Google Scholar] [CrossRef] [Green Version]
  23. Calvo, L.; Santalla, S.; Valbuena, L.; Marcos, E.; Tárrega, R.; Luis-Calabuig, E. Post-fire natural regeneration of a Pinus pinaster forest in NW Spain. Plant Ecol. 2008, 197, 81–90. [Google Scholar] [CrossRef]
  24. Turco, M.; Rosa-Cánovas, J.J.; Bedia, J.; Jerez, S.; Montávez, J.P.; Llasat, M.C.; Provenzale, A. Exacerbated fires in Mediterranean Europe due to anthropogenic warming projected with non-stationary climate-fire models. Nat. Commun. 2018, 9, 3821. [Google Scholar] [CrossRef]
  25. Bo, M.; Mercalli, L.; Pognant, F.; Cat Berro, D.; Clerico, M. Urban air pollution, climate change and wildfires: The case study of an extended forest fire episode in northern Italy favoured by drought and warm weather conditions. Energy Rep. 2020, 6, 781–786. [Google Scholar] [CrossRef]
  26. Oros, D.R.; Simoneit, B.R.T. Identification and emission factors of molecular tracers in organic aerosols from biomass burning Part 1. Temperate climate conifers. Appl. Geochem. 2001, 16, 1513–1544. [Google Scholar] [CrossRef]
  27. Vicente, A.; Alves, C.; Calvo, A.I.; Fernandes, A.P.; Nunes, T.; Monteiro, C.; Almeida, S.M.; Pio, C. Emission factors and detailed chemical composition of smoke particles from the 2010 wildfire season. Atmos. Environ. 2013, 71, 295–303. [Google Scholar] [CrossRef]
  28. Garcia-Hurtado, E.; Pey, J.; Borrás, E.; Sánchez, P.; Vera, T.; Carratalá, A.; Alastuey, A.; Querol, X.; Vallejo, V.R. Atmospheric PM and volatile organic compounds released from Mediterranean shrubland wildfires. Atmos. Environ. 2014, 89, 85–92. [Google Scholar] [CrossRef] [Green Version]
  29. Alves, C.A.; Vicente, E.D.; Evtyugina, M.; Vicente, A.; Pio, C.; Amado, M.F.; Mahía, P.L. Gaseous and speciated particulate emissions from the open burning of wastes from tree pruning. Atmos. Res. 2019, 226, 110–121. [Google Scholar] [CrossRef]
  30. Briggs, N.L.; Jaffe, D.A.; Gao, H.; Hee, J.R.; Baylon, P.M.; Zhang, Q.; Zhou, S.; Collier, S.C.; Sampson, P.D.; Cary, R.A. Particulate Matter, Ozone, and Nitrogen Species in Aged Wildfire Plumes Observed at the Mount Bachelor Observatory. Aerosol Air Qual. Res. 2017, 16, 3075–3087. [Google Scholar] [CrossRef] [Green Version]
  31. Bhattarai, C.; Samburova, V.; Sengupta, D.; Iaukea-Lum, M.; Watts, A.C.; Moosmüller, H.; Khlystov, A.Y. Physical and chemical characterization of aerosol in fresh and aged emissions from open combustion of biomass fuels. Aerosol Sci. Technol. 2018, 55, 1266–1282. [Google Scholar] [CrossRef]
  32. Balachandran, S.; Pachon, J.E.; Lee, S.; Oakes, M.M.; Rastogi, N.; Shi, W.; Tagaris, E.; Yan, B.; Davis, A.; Zhang, X.; et al. Particulate and gas sampling of prescribed fires in South Georgia, USA. Atmos. Environ. 2013, 81, 125–135. [Google Scholar] [CrossRef]
  33. Lusini, I.; Pallozzi, E.; Corona, P.; Ciccioli, P.; Calfapietra, C. Novel application of a combustion chamber for experimental assessment of biomass burning emission. Atmos. Environ. 2014, 94, 117–125. [Google Scholar] [CrossRef] [Green Version]
  34. Pallozzi, E.; Lusini, I.; Cherubini, L.; Hajiaghayeva, R.A.; Ciccioli, P.; Calfapietra, C. Differences between a deciduous and a conifer tree species in gaseous and particulate emissions from biomass burning. Environ. Pollut. 2018, 234, 457–467. [Google Scholar] [CrossRef]
  35. Imbrenda, V.; Coluzzi, R.; Lanfredi, M.; Loperte, A.; Satriani, A.; Simoniello, T. Analysis of landscape evolution in a vulnerable coastal area under natural and human pressure. Geomat. Nat. Hazards Risk 2018, 9, 1249–1279. [Google Scholar] [CrossRef] [Green Version]
  36. Xanthopoulos, G.; Calfapietra, C.; Fernandes, P. Fire Hazard and Flammability of European Forest Types. In Post-Fire Management and Restoration of Southern European Forests. Managing Forest Ecosystems; Moreira, F., Arianoutsou, M., Corona, P., De las Heras, J., Eds.; Springer: Berlin, Germany, 2012; Volume 24, pp. 79–92. ISBN 9785984520973. [Google Scholar]
  37. Amato, L. Incendio a Metaponto, 600 Evacuati dai Campeggi: Le Fiamme Divorano la Pineta. Available online: https://bari.repubblica.it/cronaca/2017/07/13/news/incendio_metaponto_evacuati_campeggi-170722749/ (accessed on 2 December 2021).
  38. Sgrigna, G.; Baldacchini, C.; Esposito, R.; Calandrelli, R.; Tiwary, A.; Calfapietra, C. Characterization of leaf-level particulate matter for an industrial city using electron microscopy and X-ray microanalysis. Sci. Total Environ. 2016, 548–549, 91–99. [Google Scholar] [CrossRef]
  39. Baldacchini, C.; Sgrigna, G.; Clarke, W.; Tallis, M.; Calfapietra, C. An ultra-spatially resolved method to quali-quantitative monitor particulate matter in urban environment. Environ. Sci. Pollut. Res. 2019, 26, 18719–18729. [Google Scholar] [CrossRef]
  40. Nečas, D.; Klapetek, P. Gwyddion: An open-source software for SPM data analysis. Cent. Eur. J. Phys. 2012, 10, 181–188. [Google Scholar] [CrossRef]
  41. Yan, J.; Lin, L.; Zhou, W.; Han, L.; Ma, K. Quantifying the characteristics of particulate matters captured by urban plants using an automatic approach. J. Environ. Sci. (China) 2016, 39, 259–267. [Google Scholar] [CrossRef]
  42. Baldacchini, C.; Castanheiro, A.; Maghakyan, N.; Sgrigna, G.; Verhelst, J.; Alonso, R.; Amorim, J.H.; Bellan, P.; Bojović, D.D.; Breuste, J.; et al. How Does the Amount and Composition of PM Deposited on Platanus acerifolia Leaves Change Across Different Cities in Europe? Environ. Sci. Technol. 2017, 51, 1147–1156. [Google Scholar] [CrossRef]
  43. Merkus, H.G. Particle size measurements. In Particle Size Measurements: Fundamentals, Practice, Quality; Springer: Berlin/Heidelberg, Germany, 2009. [Google Scholar]
  44. Schneider, C.A.; Rasband, W.S.; Eliceiri, K.W. NIH Image to ImageJ: 25 years of image analysis. Nat. Methods 2012, 9, 671–675. [Google Scholar] [CrossRef]
  45. Yusiharni, E.; Gilkes, R. Minerals in the ash of Australian native plants. Geoderma 2012, 189–190, 369–380. [Google Scholar] [CrossRef]
  46. Dong, T.T.T.; Stock, W.D.; Callan, A.C.; Strandberg, B.; Hinwood, A.L. Emission factors and composition of PM2.5 from laboratory combustion of five Western Australian vegetation types. Sci. Total Environ. 2020, 703, 134796. [Google Scholar] [CrossRef]
  47. Pateraki, S.; Manousakas, M.; Bairachtari, K.; Kantarelou, V.; Eleftheriadis, K.; Vasilakos, C.; Assimakopoulos, V.D.; Maggos, T. The traffic signature on the vertical PM profile: Environmental and health risks within an urban roadside environment. Sci. Total Environ. 2019, 646, 448–459. [Google Scholar] [CrossRef]
  48. Schröder, W.; Nickel, S.; Schönrock, S.; Meyer, M.; Wosniok, W.; Harmens, H.; Frontasyeva, M.V.; Alber, R.; Aleksiayenak, J.; Barandovski, L.; et al. Spatially valid data of atmospheric deposition of heavy metals and nitrogen derived by moss surveys for pollution risk assessments of ecosystems. Environ. Sci. Pollut. Res. 2016, 23, 10457–10476. [Google Scholar] [CrossRef] [PubMed] [Green Version]
  49. Saggu, G.S.; Mittal, S.K. Source apportionment of PM10 by positive matrix factorization model at a source region of biomass burning. J. Environ. Manag. 2020, 266, 110545. [Google Scholar] [CrossRef] [PubMed]
  50. Amato, F.; Pandolfi, M.; Viana, M.; Querol, X.; Alastuey, A.; Moreno, T. Spatial and chemical patterns of PM10 in road dust deposited in urban environment. Atmos. Environ. 2009, 43, 1650–1659. [Google Scholar] [CrossRef]
  51. Garcia-Maraver, A.; Zamorano, M.; Fernandes, U.; Rabaçal, M.; Costa, M. Relationship between fuel quality and gaseous and particulate matter emissions in a domestic pellet-fired boiler. Fuel 2014, 119, 141–152. [Google Scholar] [CrossRef]
  52. Vicente, E.D.; Tarelho, L.A.C.; Teixeira, E.R.; Duarte, M.; Nunes, T.; Colombi, C.; Gianelle, V.; da Rocha, G.O.; Sanchez de la Campa, A.; Alves, C.A. Emissions from the combustion of eucalypt and pine chips in a fluidized bed reactor. J. Environ. Sci. 2016, 42, 246–258. [Google Scholar] [CrossRef]
  53. Zhang, Y.; Obrist, D.; Zielinska, B.; Gertler, A. Particulate emissions from different types of biomass burning. Atmos. Environ. 2013, 72, 27–35. [Google Scholar] [CrossRef]
  54. Gonçalves, C.; Alves, C.; Evtyugina, M.; Mirante, F.; Pio, C.; Caseiro, A.; Schmidl, C.; Bauer, H.; Carvalho, F. Characterisation of PM 10 emissions from woodstove combustion of common woods grown in Portugal. Atmos. Environ. 2010, 44, 4474–4480. [Google Scholar] [CrossRef]
  55. Leonelli, L.; Barboni, T.; Santoni, P.A.; Quilichini, Y.; Coppalle, A. Characterization of aerosols emissions from the combustion of dead shrub twigs and leaves using a cone calorimeter. Fire Saf. J. 2017, 91, 800–810. [Google Scholar] [CrossRef]
  56. Tittarelli, A.; Borgini, A.; Bertoldi, M.; De Saeger, E.; Ruprecht, A.; Stefanoni, R.; Tagliabue, G.; Contiero, P.; Crosignani, P. Estimation of particle mass concentration in ambient air using a particle counter. Atmos. Environ. 2008, 42, 8543–8548. [Google Scholar] [CrossRef]
  57. Danielsen, P.H.; Møller, P.; Jensen, K.A.; Sharma, A.K.; Wallin, H.; Bossi, R.; Autrup, H.; Mølhave, L.; Ravanat, J.-L.; Briedeé, J.J.; et al. Oxidative stress, DNA damage, and inflammation induced by ambient air and wood smoke particulate matter in human A549 and THP-1 cell lines. Chem. Res. Toxicol. 2011, 24, 168–184. [Google Scholar] [CrossRef]
  58. Purvis, C.R.; Mccrillis, R.C.; Kariher, P.H. Fine particulate matter (PM) and organic speciation of fireplace emissions. Environ. Sci. Technol. 2000, 34, 1653–1658. [Google Scholar] [CrossRef]
  59. Hedberg, E.; Kristensson, A.; Ohlsson, M.; Johansson, C.; Johansson, P.Å.; Swietlicki, E.; Vesely, V.; Wideqvist, U.; Westerholm, R. Chemical and physical characterization of emissions from birch wood combustion in a wood stove. Atmos. Environ. 2002, 36, 4823–4837. [Google Scholar] [CrossRef]
  60. Khamraev, K.; Cheriyan, D.; Choi, J.-H. A review on health risk assessment of PM in the construction industry—Current situation and future directions. Sci. Total Environ. 2021, 758, 143716. [Google Scholar] [CrossRef] [PubMed]
  61. Rogula-Kozłowska, W.; Klejnowski, K. Submicrometer aerosol in rural and urban backgrounds in southern poland: Primary and secondary components of PM1. Bull. Environ. Contam. Toxicol. 2013, 90, 103–109. [Google Scholar] [CrossRef]
  62. Lamberg, H.; Nuutinen, K.; Tissari, J.; Ruusunen, J.; Yli-Pirilä, P.; Sippula, O.; Tapanainen, M.; Jalava, P.; Makkonen, U.; Teinilä, K.; et al. Physicochemical characterization of fine particles from small-scale wood combustion. Atmos. Environ. 2011, 45, 7635–7643. [Google Scholar] [CrossRef]
  63. Paoletti, L.; De Berardis, B.; Arrizza, L.; Passacantando, M.; Inglessis, M.; Mosca, M. Seasonal effects on the physico-chemical characteristics of PM2.1 in Rome: A study by SEM and XPS. Atmos. Environ. 2003, 37, 4869–4879. [Google Scholar] [CrossRef]
  64. Kelly, F.J.; Fussell, J.C. Size, source and chemical composition as determinants of toxicity attributable to ambient particulate matter. Atmos. Environ. 2012, 60, 504–526. [Google Scholar] [CrossRef]
  65. Labrada-Delgado, G.; Aragon-Pina, A.; Campos-Ramos, A.; Castro-Romero, T.; Amador-Munoz, O.; Villalobos-Pietrini, R. Chemical and morphological characterization of PM2.5 collected during MILAGRO campaign using scanning electron microscopy. Atmos. Pollut. Res. 2012, 3, 289–300. [Google Scholar] [CrossRef] [Green Version]
  66. Vassilev, S.V.; Baxter, D.; Andersen, L.K.; Vassileva, C.G. An overview of the chemical composition of biomass. Fuel 2010, 89, 913–933. [Google Scholar] [CrossRef]
  67. Prather, K.A.; Bertram, T.H.; Grassian, V.H.; Deane, G.B.; Stokes, M.D.; DeMott, P.J.; Aluwihare, L.I.; Palenik, B.P.; Azam, F.; Seinfeld, J.H.; et al. Bringing the ocean into the laboratory to probe the chemical complexity of sea spray aerosol. Proc. Natl. Acad. Sci. USA 2013, 110, 7550–7555. [Google Scholar] [CrossRef] [Green Version]
  68. Lin, Y.C.; Hsu, S.C.; Lin, S.H.; Huang, Y.T. Metallic elements emitted from industrial sources in Taiwan: Implications for source identification using airborne PM. Atmos. Pollut. Res. 2020, 11, 766–775. [Google Scholar] [CrossRef]
  69. Siciliano, T.; Giua, R.; Siciliano, M.; Di Giulio, S.; Genga, A. The morphology and chemical composition of the urban PM10 near a steel plant in Apulia determined by scanning electron microscopy. Source Apportionment. Atmos. Res. 2021, 251, 105416. [Google Scholar] [CrossRef]
  70. Guo, F.; Ju, Y.; Wang, G.; Alvarado, E.C.; Yang, X.; Ma, Y.; Liu, A. Inorganic chemical composition of PM2.5 emissions from the combustion of six main tree species in subtropical China. Atmos. Environ. 2018, 189, 107–115. [Google Scholar] [CrossRef]
  71. Ma; Tigabu; Guo; Zheng; Guo; Guo Water-Soluble Inorganic Ions in Fine Particulate Emission During Forest Fires in Chinese Boreal and Subtropical Forests: An Indoor Experiment. Forests 2019, 10, 994. [CrossRef] [Green Version]
  72. Niemi, J.V.; Tervahattu, H.; Vehkamäki, H.; Kulmala, M.; Koskentalo, T.; Sillanpää, M.; Rantamäki, M. Characterization and source identification of a fine particle episode in Finland. Atmos. Environ. 2004, 38, 5003–5012. [Google Scholar] [CrossRef] [Green Version]
  73. Kheloufi, A.; Mansouri, L.M.; Mami, A.; Djelilate, M. Physio-biochemical characterization of two acacia species (A. karroo Hayn and A. saligna Labill.) under saline conditions. Reforesta 2019, 33–49. [Google Scholar] [CrossRef]
  74. Rahman, M.M.; Rahma, M.A.; Miah, M.G.; Saha, S.R.; Karim, M.A.; Mostofa, M.G. Mechanistic insight into salt tolerance of Acacia auriculiformis: The importance of ion selectivity, osmoprotection, tissue tolerance, and Na+ exclusion. Front. Plant Sci. 2017, 8, 115. [Google Scholar] [CrossRef] [Green Version]
  75. Pérez, N.; Pey, J.; Querol, X.; Alastuey, A.; López, J.M.; Viana, M. Partitioning of major and trace components in PM10-PM2.5-PM1 at an urban site in Southern Europe. Atmos. Environ. 2008, 42, 1677–1691. [Google Scholar] [CrossRef]
  76. Morawska, L.; Keogh, D.U.; Thomas, S.B.; Mengersen, K. Modality in ambient particle size distributions and its potential as a basis for developing air quality regulation. Atmos. Environ. 2008, 42, 1617–1628. [Google Scholar] [CrossRef] [Green Version]
  77. Misra, M.K.; Ragland, K.W.; Baker, A.J. Wood ash composition as a function of furnace temperature. Biomass Bioenergy 1993, 4, 103–116. [Google Scholar] [CrossRef]
  78. Artaxo, P.; Martins, J.V.; Yamasoe, M.A.; Procópio, A.S.; Pauliquevis, T.M.; Andreae, M.O.; Guyon, P.; Gatti, L.V.; Leal, A.M.C. Physical and chemical properties of aerosols in the wet and dry seasons in Rondônia, Amazonia. J. Geophys. Res. Atmos. 2002, 107, LBA 49-1–LBA 49-14. [Google Scholar] [CrossRef]
  79. Gray, D.M.; Dighton, J. Mineralization of forest litter nutrients by heat and combustion. Soil Biol. Biochem. 2006, 38, 1469–1477. [Google Scholar] [CrossRef]
  80. Echalar, F.; Artaxo, P.; Martins, J.V.; Yamasoe, M.; Gerab, F.; Maenhaut, W.; Holben, B. Long-term monitoring of atmospheric aerosols in the amazon basin: Source identification and apportionment. J. Geophys. Res. Atmos. 1998, 103, 31849–31864. [Google Scholar] [CrossRef]
  81. Saud, T.; Saxena, M.; Singh, D.; Saraswati; Dahiya, M.; Sharma, S.; Datta, A.; Ranu, G.; Mandal, T.K. Spatial variation of chemical constituents from the burning of commonly used biomass fuels in rural areas of the Indo-Gangetic Plain (IGP), India. Atmos. Environ. 2013, 71, 158–169. [Google Scholar] [CrossRef]
  82. Figas, A.; Siwik-Ziomek, A.; Kobierski, M. Heavy metals and sulphur in needles of Pinus sylvestris L. And soil in the forests of city agglomeration. Forests 2021, 12, 1310. [Google Scholar] [CrossRef]
  83. Chapin, F.S.; Matson, P.A.; Mooney, H.A. Principles of Terrestrial Ecosystem Ecology; Springer: New York, NY, USA, 2002; ISBN 0387954392. [Google Scholar]
  84. Samsonov, Y.N.; Belenko, O.A.; Ivanov, V.A. Dispersal and morphological characteristics of smoke particulate emission from fires in the boreal forests of Siberia. Atmos. Ocean. Opt. 2010, 23, 485–493. [Google Scholar] [CrossRef]
  85. Valotto, G.; Rampazzo, G.; Visin, F.; Gonella, F.; Cattaruzza, E.; Glisenti, A.; Formenton, G.; Tieppo, P. Environmental and traffic-related parameters affecting road dust composition: A multi-technique approach applied to Venice area (Italy). Atmos. Environ. 2015, 122, 596–608. [Google Scholar] [CrossRef]
  86. Genga, A.; Siciliano, T.; Siciliano, M.; Aiello, D.; Tortorella, C. Individual particle SEM-EDS analysis of atmospheric aerosols in rural, urban, and industrial sites of Central Italy. Environ. Monit. Assess. 2018, 190, 456. [Google Scholar] [CrossRef]
  87. Lobert, J.M.; Scharffe, D.H.; Weimin, H.; Kuhlbusch, T.A.; Seuwen, R.; Warneck; Crutzen, P.J. Experimental evaluation of biomass burning emissions: Nitrogen and carbon containing compounds. In Global Biomass Burning: Atmospheric, Climatic, and Biospheric Implications; Levin, J., Ed.; MIT Press: Cambridge, MA, USA, 1991; pp. 289–304. [Google Scholar]
  88. Ward, D.E.; Hardy, C.C. Smoke emissions from wildland fires. Environ. Int. 1991, 17, 117–134. [Google Scholar] [CrossRef] [Green Version]
  89. Akagi, S.K.; Yokelson, R.J.; Wiedinmyer, C.; Alvarado, M.J.; Reid, J.S.; Karl, T.; Crounse, J.D.; Wennberg, P.O. Emission factors for open and domestic biomass burning for use in atmospheric models. Atmos. Chem. Phys. 2011, 11, 4039–4072. [Google Scholar] [CrossRef] [Green Version]
  90. Faix, O.; Fortmann, I.; Bremer, J.; Meier, D. Gas chromatographic separation and mass spectrometric characterization of polysaccharide derived products. Holz Roh Werkstoff 1991, 49, 213–219. [Google Scholar] [CrossRef]
  91. Struppe, H.G.; Franke, F.; Hofmann, J.; Ondruschka, B. Coupling of thermal desorption in modified closeable sampling columns with wide-bore capillary gas chromatography and mass spectrometric detection. J. Chromatogr. A 1996, 750, 239–244. [Google Scholar] [CrossRef]
  92. Wotton, B.; Martin, T.; Engel, K. Vertical flame intensity profile from a surface fire. In Proceedings of the 13th International Conference of Forest Fire and Meteorology, Lorne, Australia, 27–31 October 1996; International Association of Wildland Fire: Missoula, MT, USA, 1998; pp. 175–182. [Google Scholar]
  93. Santoni, P.A.; Simeoni, A.; Rossi, J.L.; Bosseur, F.; Morandini, F.; Silvani, X.; Balbi, J.H.; Cancellieri, D.; Rossi, L. Instrumentation of wildland fire: Characterisation of a fire spreading through a Mediterranean shrub. Fire Saf. J. 2006, 41, 171–184. [Google Scholar] [CrossRef] [Green Version]
  94. Yokelson, R.J.; Burling, I.R.; Urbanski, S.P.; Atlas, E.L.; Adachi, K.; Buseck, P.R.; Wiedinmyer, C.; Akagi, S.K.; Toohey, D.W.; Wold, C.E. Trace gas and particle emissions from open biomass burning in Mexico. Atmos. Chem. Phys. 2011, 11, 6787–6808. [Google Scholar] [CrossRef] [Green Version]
  95. Makkonen, U.; Hellén, H.; Anttila, P.; Ferm, M. Size distribution and chemical composition of airborne particles in south-eastern Finland during different seasons and wildfire episodes in 2006. Sci. Total Environ. 2010, 408, 644–651. [Google Scholar] [CrossRef]
  96. Amato, F.; Pandolfi, M.; Escrig, A.; Querol, X.; Alastuey, A.; Pey, J.; Perez, N.; Hopke, P.K. Quantifying road dust resuspension in urban environment by Multilinear Engine: A comparison with PMF2. Atmos. Environ. 2009, 43, 2770–2780. [Google Scholar] [CrossRef]
  97. Palviainen, M.; Finér, L.; Kurka, A.M.; Mannerkoski, H.; Piirainen, S.; Starr, M. Release of potassium, calcium, iron and aluminium from Norway spruce, Scots pine and silver birch logging residues. Plant Soil 2004, 259, 123–136. [Google Scholar] [CrossRef]
Figure 1. (a) Study area location and boundaries of the southern part of the Metaponto Natural Reserve where we conducted a sampling transect (image source: Google Earth) and (b) a wind rose showing the prevailing winds in the study area (average from January–August 2019). Meteorological data were provided by Protezione Civile of the Basilicata Region.
Forests 13 00322 g001
Figure 2. (A) The total particle density presented as number of particles on mm2 ± standard error for litter and species sampled in the study area; homogeneous groups were calculated through Tukey HSD-test, and are represented by the letters (a–c) above each column. (B) Particle size fractions (PM 2.5–10, PM 1–2.5 and PM 0.3–1) expressed as a percentage for the litter and species sampled in the study area.
Forests 13 00322 g002
Figure 3. Weighted volume percentages (W%) of the major elements estimated from SEM/EDX analysis for different species and litter are shown for PM10 (a), PM2.5 (b) and PM1 (c).
Forests 13 00322 g003
Figure 4. Weighted volume percentages (W%) of the trace elements estimated from SEM/EDX analysis for different species and litter are shown for PM10 (a), PM2.5 (b) and PM1 (c).
Forests 13 00322 g004
Figure 5. Principal Component Analysis (PCA) for the three dimensional PM classes: (a,b) PM10; (c,d) PM2.5; (e,f) PM1; and for CO, CO2 and BTXs emitted during combustion experiments: (g,h). For each class is reported the factor coordinates of variables graph (a,c,e,g), and the factor scores corresponding representation (b,d,f,h). Brown rings are used for C-based particles, yellow rings for particles rich in N, grey for Si-rich particles and red rings for Fe + Steel markers. For panel d.2, blue and light blue rings represent high and medium CO2 emission, respectively; the green ring represents high BTXs and CO concentrations.
Forests 13 00322 g005
Figure 6. Characteristic SEM images showing the morphology and main elements characterizing the chemical composition of the seven categories identified in relation to species and litter: (a) Potassium chloride particles in A. saligna; (b) Iron and steel-based particles in C. equisetifolia; (c) Carbon-based spherical particles for E. camaldulensis; (d) Carbon-based soot agglomerates for E. camaldulensis; (e) Nitrogen-based particles for J. oxycedrus; (f) rich in Sulphur particle for P. halepensis; (g) Silicon-based particle for P. halepensis and (h) rich in Calcium particles for litter.
Forests 13 00322 g006
Table 1. The weighted volume percentages (W%) of carbon (C) and nitrogen (N) at the three main PM size fractions detected through scanning electron microscopy (SEM-EDX) on combustion filters. Maximum values are indicated in bold.
SampleC (W%)N (W%)
PM 10PM 2.5PM 1PM 10PM 2.5PM 1
A. saligna26.6326.1925.9921.1020.3320.41
C. equisetifolia30.6224.9825.1318.7118.9419.00
E. camaldulensis34.4332.9631.5917.1818.7217.65
J. oxycedrus26.9626.1728.4620.8922.4421.00
P. halepensis29.7227.7729.8219.9320.7920.29
P. lentiscus26.0325.2129.5016.8020.4721.04
Litter30.6127.7828.6418.6021.6819.33
Table 2. Peak of temperature, oxygen (O2), carbon dioxide (CO2), carbon monoxide (CO) and BTX emitted during combustion experiments for each sample. Maximum values are indicated in bold for each compound, except for O2, where minimum values are indicated.
SamplePeak of Temperature (°C)O2
(%)
CO2
(g Kg−1)
CO
(g Kg−1)
Benzene
(g Kg−1)
Toluene
(g Kg−1)
Xylene
(g Kg−1)
A. saligna648.318.11351.50100.730.520.150.02
C. equisetifolia767.019.0698.2578.550.270.060.01
J. oxycedrus667.017.7892.31109.340.550.260.06
P. halepensis703.518.61238.5092.270.470.130.02
P. lentiscus833.918.91564.20121.861.280.430.06
Litter671.717.71617.0096.870.360.140.03
Publisher’s Note: MDPI stays neutral with regard to jurisdictional claims in published maps and institutional affiliations.

