Article

Forest Structure and Composition Are Critical to Hurricane Mortality

by
Jiaying Zhang
1,*,
Tamara Heartsill-Scalley
2 and
Rafael L. Bras
1
1
School of Civil and Environmental Engineering, Georgia Institute of Technology, Atlanta, GA 30332, USA
2
International Institute of Tropical Forestry, USDA Forest Service, Rio Piedras, PR 00926, USA
*
Author to whom correspondence should be addressed.
Forests 2022, 13(2), 202; https://doi.org/10.3390/f13020202
Submission received: 9 December 2021 / Revised: 23 January 2022 / Accepted: 25 January 2022 / Published: 28 January 2022
(This article belongs to the Section Natural Hazards and Risk Management)

Abstract

:
Hurricanes can cause severe damage to tropical forests. To understand the nature of hurricane impacts, we analyze and compare immediate effects from category-4 hurricane María in 2017 and category-3 hurricane Hugo in 1989 at Bisley Experimental Watersheds (BEW) in the Luquillo Experimental Forest, Puerto Rico. We show that hurricane María caused lower mortality than hurricane Hugo, even though hurricane María was a stronger event with higher sustained wind. The lower mortality was due to the combination of lower accumulated cyclone energy at the site and more wind-resistant forest structure and composition at the time of disturbance. We compare our study site with a nearby location that has the same forest type, Luquillo Forest Dynamics Plot (LFDP), and describe the similarities and differences of mortality and impact factors between the two sites during the two events. During hurricane Hugo, LFDP experienced much lower mortality than BEW, even though the accumulated cyclone energy at LFDP was higher. The difference in mortality was due to contrasting forest structure and composition of the two sites. Our results demonstrate that forest structure and composition at the time of the disturbance were more critical to hurricane-induced mortality at the two sites than accumulated cyclone energy.

1. Introduction

Hurricanes are a major disturbance to tropical forests [1,2,3,4]. Hurricanes cause immediate damages to individual stems in the forest, and the accumulation of short-term effects shapes long-term ecosystem structure and function [5,6,7]. For example, hurricanes can shape the forest over many generations to a shorter tree stature [8,9], higher wood density [8], higher stem density [10], higher tree species diversity [8,11], and lower hurricane-induced tree mortality [8].
The impact of hurricane disturbance to tropical forests depends on many factors, such as hurricane strength [12,13,14,15,16,17,18], topographical location of the forest [19,20,21], and size and species of individual stems [12,22,23,24,25]. Intense wind associated with hurricanes breaks branches, uproots and snaps stems, and defoliates vegetation. Persistent heavy precipitation associated with hurricanes saturates soils, leading to easier uprooting [12,13], and causes landslides that destroy patches of forest land and vegetation [14,15,16,17]. More severe hurricanes generally lead to higher forest damage and mortality [4]. Topographic location influences forest damage because of exposure in relation to hurricane disturbance [19,20,21]. Tree size and species have been found to be impact factors on tree mortality [22,23]. Large trees experience higher mortality possibly due to their taller stems and exposed larger crowns [7,9,13,24]. The relationship between mortality and species is possibly negatively correlated with wood density of the species [4,23,24].
Hurricane disturbance modifies forest structure and composition via immediate mortality and subsequent recovery [5,6]. In turn, the structure and composition of the forest at the time of a hurricane disturbance affect forest mortality because of the dependence of mortality on tree size and species. However, previous studies have not examined in detail how forest structure and composition affect hurricane-induced mortality resulting from consecutive disturbance events. Moreover, the interaction among impact factors (hurricane strength, topographic exposure, size structure, and species composition, etc.) complicates forest mortality outcomes, and has not yet been investigated. Current research advocates for identifying impact factors, interactions, and mechanisms to understand the changes observed in forests after hurricane disturbances, and their implications for recovery and effects of subsequent hurricanes in forest ecosystems [9,26,27]. To study the effect of forest structure and composition on hurricane-induced mortality and its interaction with other impact factors (hurricane strength, topographic exposure), we use stem censuses from a well-documented site to analyze and compare impacts of two hurricanes (hurricane Hugo in 1989 and hurricane María in 2017) to a tropical forest in Puerto Rico. Knowledge of tropical cyclone ecology from this forest system could lead to advances in our understanding of fundamental forest dynamics and responses to hurricane disturbances.

2. Materials and Methods

2.1. Study Site

The tropical forest at the Bisley Experimental Watersheds (BEW; 18°20′ N, 65°50′ W) is located on the northeastern side of the Luquillo Mountains in Puerto Rico. The forest is a mature secondary tabonuco (Dacryodes excelsa) forest recovered from selective logging in the 1930s and severe hurricanes San Felipe in 1928 and San Ciprián in 1932 [28,29]. Since 1989, 85 permanent plots within 13 hectares of the watersheds have been established and the vegetation in the plots are monitored every five years [5,28]. This forest system is recognized as a leading site for cyclone related research [3,7,26,30].

2.2. Tree Census

The species and diameter at breast height (1.3 m) (DBH) of each stem with DBH ≥ 2.5 cm in each plot have been monitored every five years beginning in 1989. The plots are 10-m diameter circles and 40 m apart [5]. The first and second censuses were conducted three months before and after hurricane Hugo (September 1989), respectively, and we refer to them as pre- and post-Hugo censuses. The most recent census was conducted three months after hurricane María (September 2017) (post-María census) and recorded auxiliary information on crown dominance and damage levels of each stem. The pre- and post-Hugo censuses data come from Zhang et al. [31] and the post-María census data come from Zhang et al. [32]. Species are grouped into four plant functional types according to their successional status—early, mid, or late successional trees and palm (Table S1), following previous studies [6,33,34,35,36,37]. The palm species, Prestoea montana, was separated from the three successional types because palms are monocots and are different from trees. Additionally, palms have been given special attention by many researchers in ecosystem modeling because of their unique traits, some that resemble early successional trees, such as low structural “wood” density and fast recruitment with open canopy, and other traits that resemble late successional trees, such as resistance to hurricane winds and shade tolerance.
Damages in the post-María census were classified as Damage I if a stem was defoliated less than 50%, Damage II if a stem had broken branches or heavy defoliation (>50%), and Damage III if the trunk or roots are broken. Trees were declared Dead if there was no evidence of resprouts along the branches or stem, no leaves, no new leaves, more than 50% root exposure, stem breakage, and no tree in place of where there once was a tree. Crowns were classified as Dominant if the percentage of the crown under direct sunlight was more than 75%, Co-dominant if 50%–75%, Intermediate if 25%–50%, and Suppressed if less than 25%. Mortality from hurricane María was calculated as the ratio of the number of stems recorded dead to the total number of stems recorded in the post-María census. Since trees that appeared dead right after a hurricane may resprout and be alive later and we do not have later censuses after hurricane María, the mortality from hurricane María measures the instantaneous mortality (may recover later). The mortality from hurricane Hugo was calculated as the ratio of the number of stems that existed in the pre-Hugo census but not in the post-Hugo census to the number of stems that existed in the pre-Hugo census. Since the census data have been corrected for missing information giving later censuses, the mortality estimated for hurricane Hugo is the true mortality (no recovery). The post-Hugo census did not record crown dominance and damage levels of individual trees, and thus the damage information from hurricane Hugo is unavailable.

2.3. Topographic Exposure

The exposure of the study site to local wind was estimated using a modified EXPOS model [38,39]. Instead of limiting the outcome to binary information of either protected or exposed based on a fixed wind inflection angle as in the original EXPOS model [39], we calculated the likelihood of exposure in terms of a topographic angle (θ), which was calculated as the maximum angle between a location and the mountain peaks in front along the direction of the incoming wind,
θ = max i 1 , 2 , 3 , 2000 { arctan ( z i z 0 i × Δ x ) } ,
where z 0 is the elevation of the point of interest, Δ x is the resolution of the elevation map (10 m), and z i is the elevation of the point that is i pixel(s) away along the direction of the incoming wind (Figure S1a). Given the range of the Luquillo Mountains (20 km), the farthest point selected to calculate the topographic angle is 20 km away from z 0 (i.e., Δ x = 10 m and i = 2000). The elevation map is linearly interpolated so that the wind direction is the x axis. The original topographic elevation data are from USGS National Elevation Dataset [40]. The wind field of each hurricane and the local wind (wind speed and direction) at study site were reconstructed using the HURRECON model [38,39] with the radius of maximum winds Rm = 40 km and scaling parameter that controls the shape of the wind profile curve B = 1.4 for hurricane Hugo [38]. For hurricane María, since it had smaller eye size and hurricane size compared to hurricane Hugo [41,42], the two parameters were set at Rm = 20 km and B = 1.5. The hurricane track and wind speed data are from NOAA HURDAT2 dataset [43]. The elevation and the exposure maps of BEW and LFDP during the two events are shown in Figure S1.

2.4. Accumulated Cyclone Energy at Site

The accumulated cyclone energy (ACE) has been used to express the energy of a cyclone in its lifetime [44]. It is defined as the summation of the square of the wind speed (knots) at six-hour intervals. Here we define accumulate cyclone energy at site (ACES) to express the energy of a cyclone at a specific location. The wind speed is the local wind instead of the hurricane sustained wind, and the topographic exposure to hurricane wind is incorporated into the equation. Since the hurricane track data are not at regularly six-hour intervals (less than six hours when landing), we sum the local energy trapezoidal,
ACES = 10 4 i ( T i + 1 T i ) ( ( v i cos ( θ i ) ) 2 + ( v i + 1 cos ( θ i + 1 ) ) 2 2 ) ,
where v i , θ i , and T i are the wind speed (knots), topographic angle (degree), and the time (at 6-h UTC) at the site for each record i of the hurricane from the HURDAT2 dataset. We count only the records that the hurricane is within 500 km of the study site. The wind speed and the topographic angle for each time were calculated in the previous section. The map of ACES at BEW and LFDP for the two hurricanes are shown in Figure S2.

2.5. Significance Test on the Difference of Mortality between Two Events

The difference in mortality between two events was tested using a z-score statistic [45],
z = ( m 1 m 2 ) m ^ ( 1 m ^ ) ( 1 n 1 + 1 n 2 ) ,
where m1 and m2 are the mortality in event 1 and event 2, respectively, m 1 = d 1 / n 1 , m 2 = d 2 / n 2 , di and ni are the number of dead trees and number of total trees in event i, respectively. m ^ is the pooled estimator of mortality, m ^ = ( d 1 + d 2 ) / ( n 1 + n 2 ) . The z statistic follows a standard Normal distribution N (0,1). The p-value of z is then P = 2 ( 1 Φ ( | z | ) ) , where Φ is the cumulative distribution function of the standard Normal distribution.

3. Results

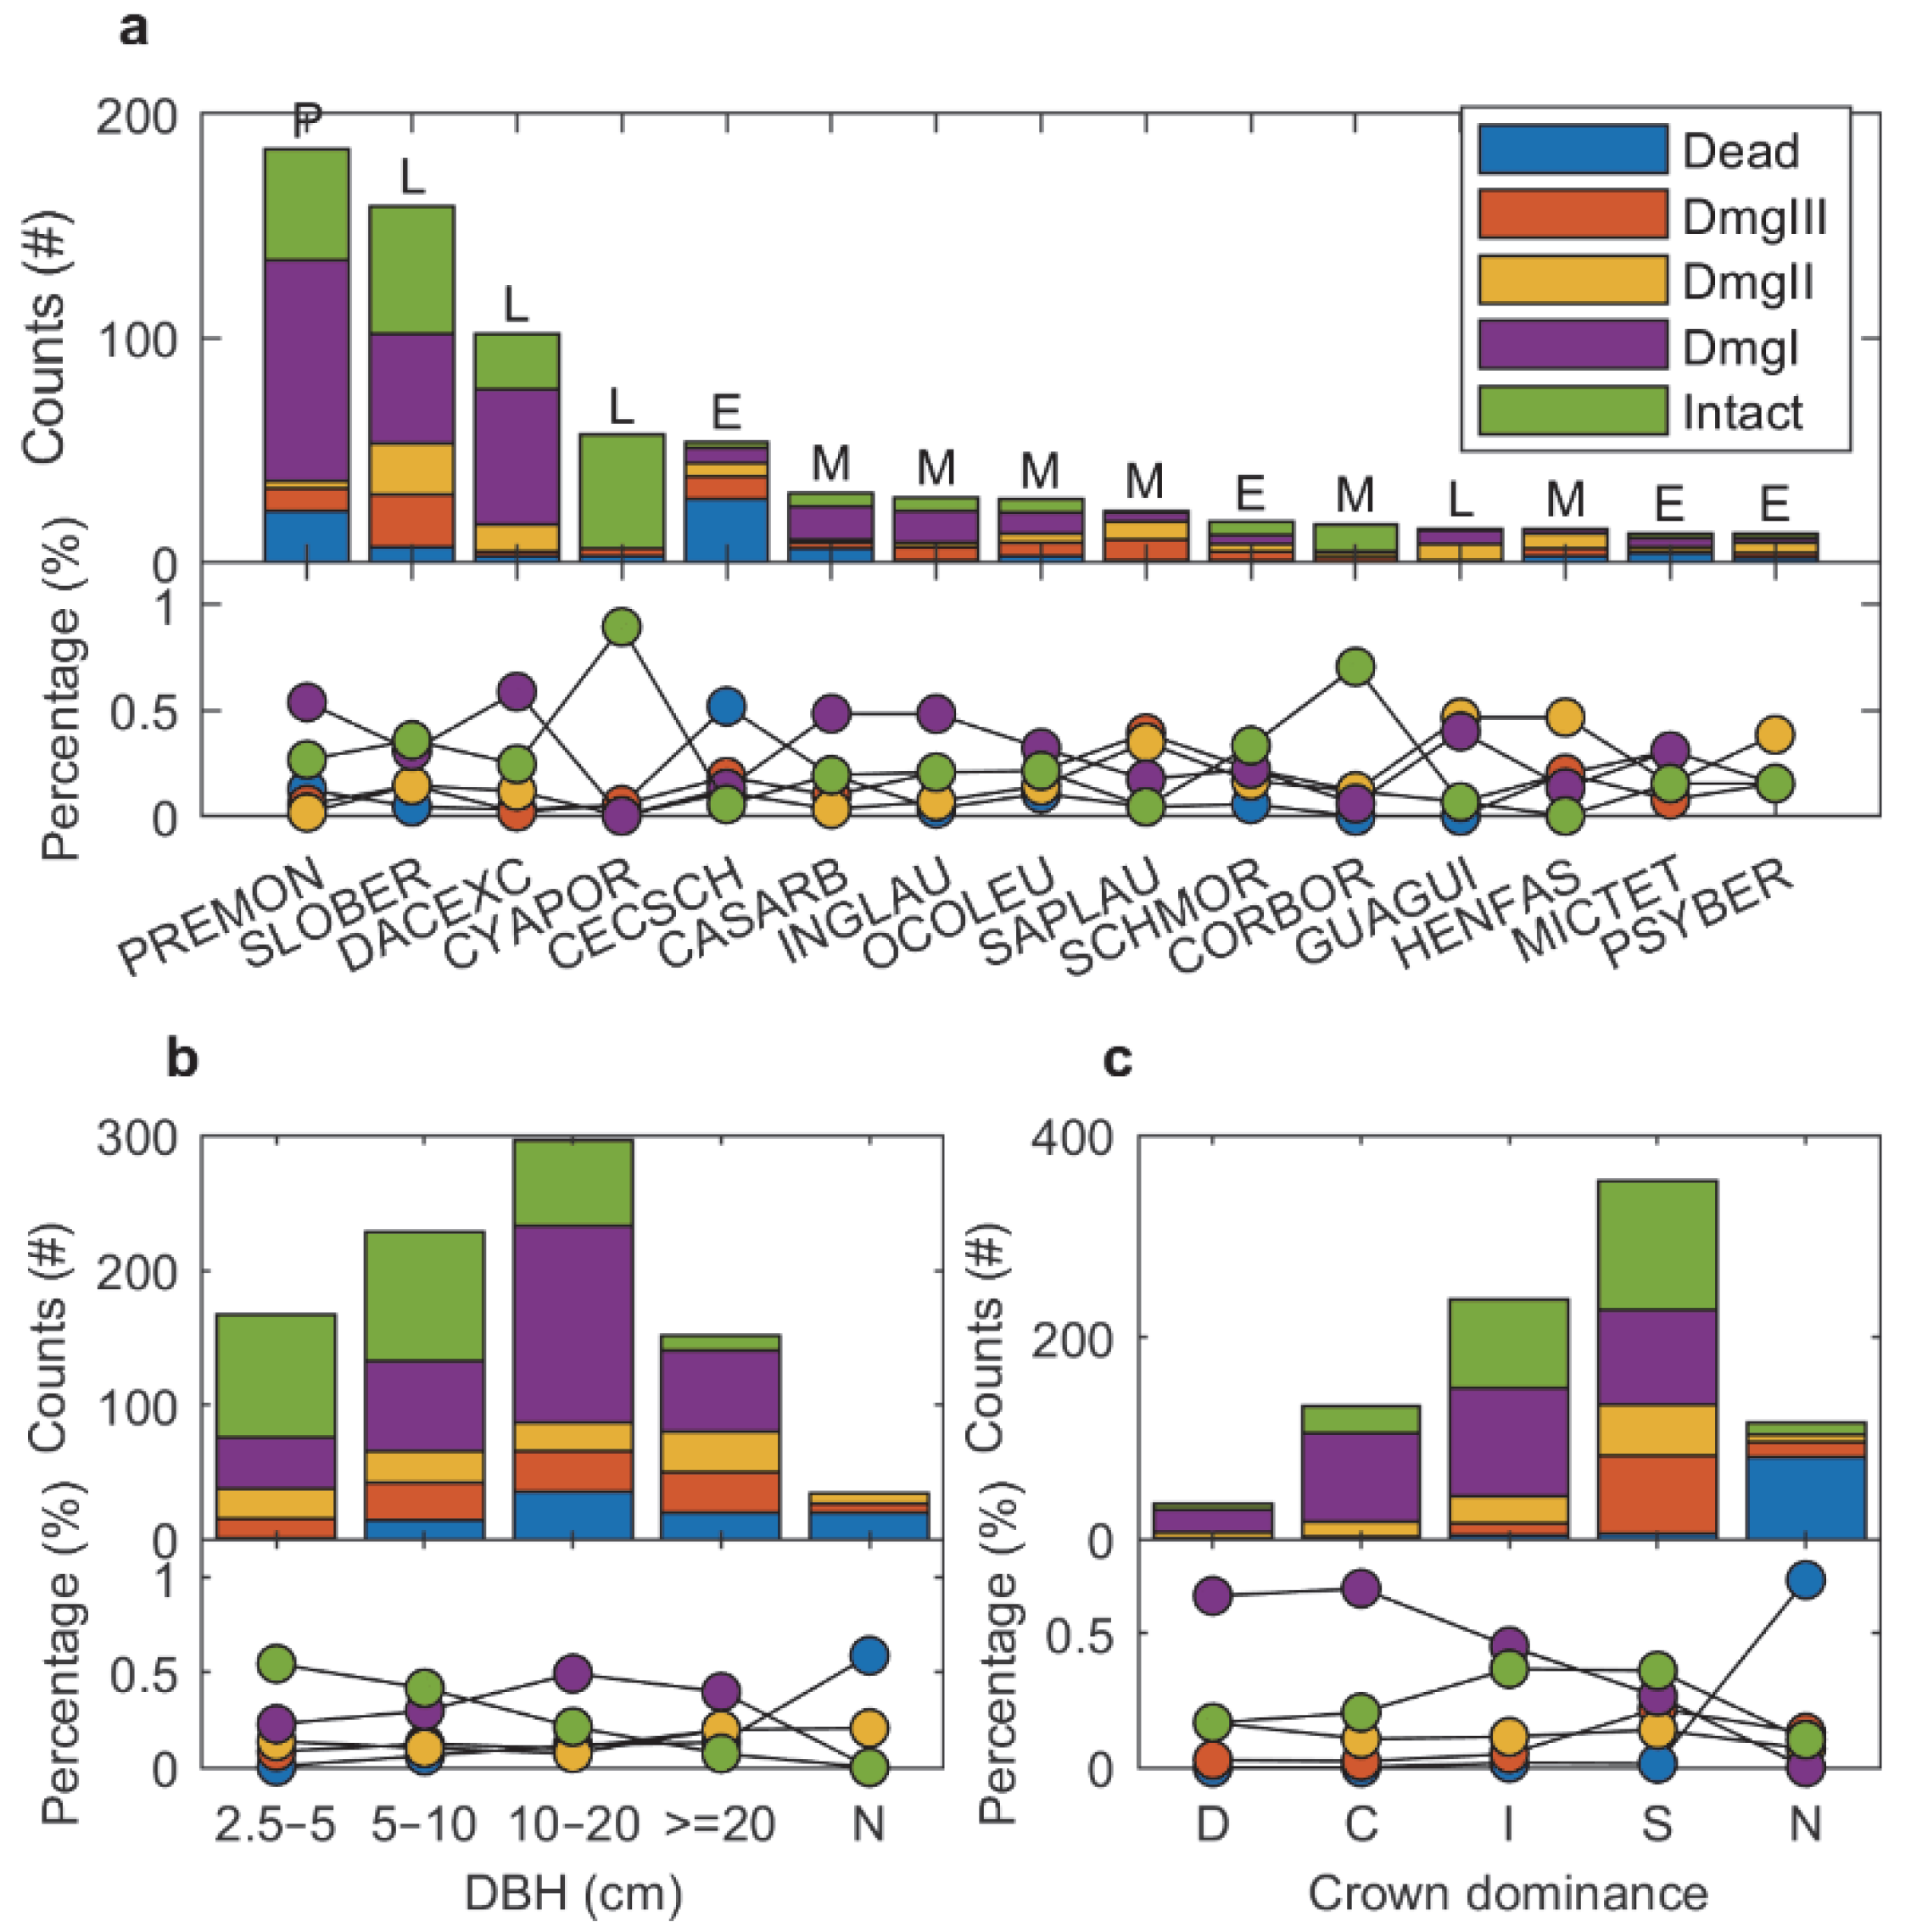
3.1. Observed Damage and Mortality from Hurricanes María and Hugo

The census at Bisley Experimental Watersheds (BEW) after hurricane María showed different levels of damage to stems in the forest, including defoliation, branch breaking, stem snapping, and uprooting. The damage differed among species. Early successional species like Cecropia schreberiana and Miconia tetrandra had the highest mortality (51.85% and 30.77%, respectively), while the mortality of other species was relatively low (less than 20%) (Figure 1a; Table S2). Late successional species (e.g., Sloanea berteriana and Dacryodes excelsa), mid successional species (e.g., Casearia arborea and Inga laurina), and palm (Prestoea montana) were more prone to defoliation than mortality or snapping (Figure 1a, Table S2). The damage also varied among different diameter (DBH) classes (Figure 1b) and crown dominances (Figure 1c). Most of the intermediate- and large-DBH stems (10–20 cm and ≥20 cm) were defoliated, and some of them had branches broken, while most of the small-DBH stems (2.5–5 cm and 5–10 cm) were left intact. Stems with a dominant or co-dominant crown had high probability of defoliation (64% and 67% respectively), while suppressed stems were likely to snap (36%), possibly because they have a higher chance of being hit by falling branches from large trees.
Compared to mortality in the forest from hurricane María (10.27%), the mortality from hurricane Hugo at BEW was significantly higher (57.93%) (z = 20.90, p < 0.0001), even though hurricane Hugo (110 knots) was weaker than hurricane María (135 knots) when it entered Puerto Rico. Hurricane Hugo resulted in higher mortality for all species, except for early successional species C. schreberiana, which experienced ~50% during both hurricanes (z = −0.34, p = 0.73) (Figure 2; Table S2). The mortality from Hugo was significantly higher than that from María for each plant functional type (PFT) (p < 0.0001 for each PFT) (Figure 3a) and each DBH class (p < 0.0001 for each DBH class) (Figure 3b), further evidence that Hugo had a much larger effect on the forest than María.
Mortality varied with species and stem size for both hurricanes (Figure 3a,b) at BEW. Early successional species have lower wood density and thus experienced the highest mortality among the four PFTs in both hurricanes (Figure 3a,c,d). Mid and late successional species had similar mortality in both hurricanes (Figure 3a,c,d). Although palms have low structural “wood” density, they are resistant to wind [46] and had the lowest mortality among the four PFTs during hurricane Hugo (Figure 3a,c). During hurricane María, mortality of palms was the second highest among the four PFTs (Figure 3a,d), most probably the result of diseases that palms were experiencing before hurricane María [6].
The variation of mortality with DBH classes was different for the two hurricanes at BEW. The overall mortality decreased with DBH during Hugo but increased with DBH during María (Figure 3b). The mortality difference between large trees and intermediate trees was significant at 90% significance level for Mid PFT (p = 0.0530) and 99% significance level for Late PFT (p = 0.0008) during Hugo (Figure 3c). This finding suggests that large stems are less vulnerable than intermediate stems to hurricane wind for the same PFTs, especially for Mid and Late PFTs. The higher mortality of large stems in comparison to intermediate stems during María (Figure 3b) was a result of a higher proportion of wind-vulnerable early successional species in the large-DBH category than that in the intermediate-DBH category (Figure 3d), demonstrating the importance of forest species composition to hurricane-induced mortality. The lower mortality of small stems (DBH < 10 cm) was likely due to the protection of the canopy from intermediate and large stems above them (Figure 1c), demonstrating the importance of forest size structure to hurricane-induced mortality.

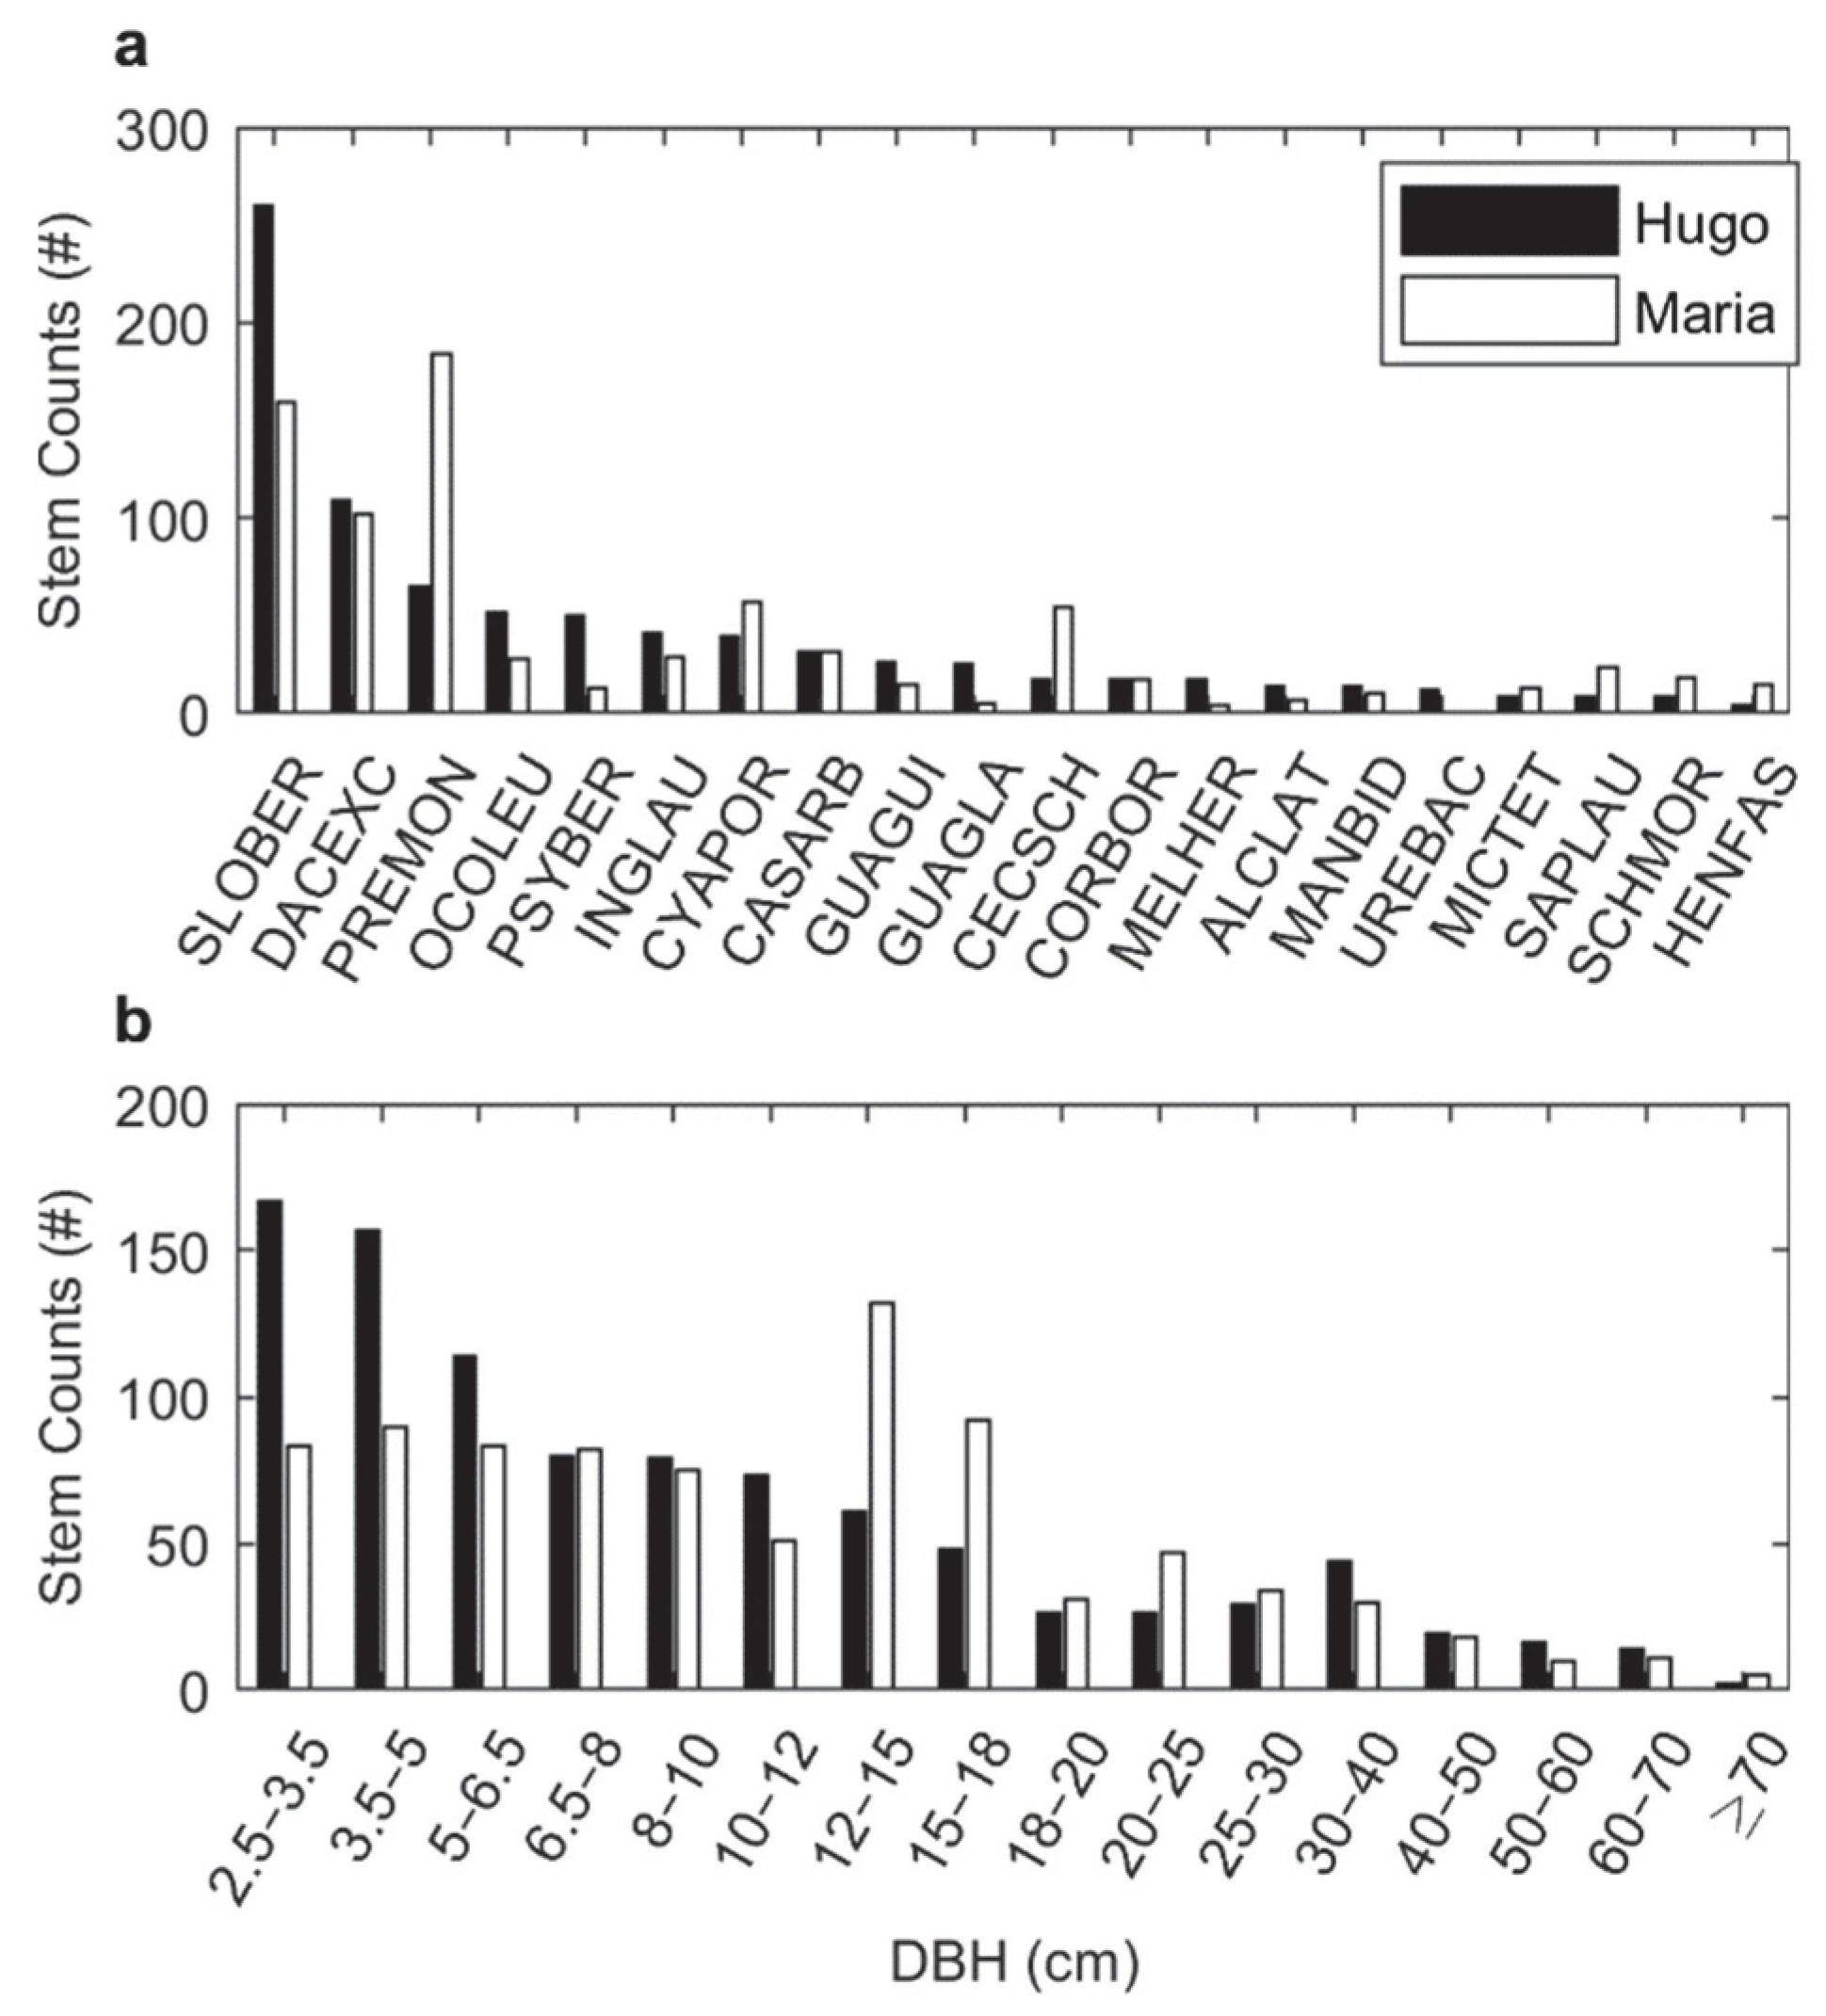
3.2. Forest Structure and Composition

At the time of hurricane Hugo, the forest was dominated by two late successional species, S. berteriana and D. excelsa, in terms of stem abundance. The wind resistant palm species, P. montana, was the third dominant species but accounted for only 7% of the stem abundance in the forest (Figure 4a). Although the late successional species have relatively low mortality compared to early successional species, more than half of the stems in the forest were small (2.5–5 cm and 5–10 cm) (Figure 4b), and those small stems were likely to be exposed to local wind or damaged by falling trees or branches, resulting in high mortality. Succession after the disturbance from hurricane Hugo changed the size structure and species composition of the forest. By the time of hurricane María, the wind resistant palm P. montana had tripled in numbers, accounting for 21% of the stems, and had become the most abundant species in the BEW forest (Figure 4a). The dominant stem size changed to intermediate-DBH class (10–20 cm) (Figure 4b). Ninety percent of the small stems were under the canopy of intermediate and large (≥10 cm) stems and protected from local wind resulting in less mortality than for intermediate and large stems (Figure 1b). Therefore, the differences in forest structure and composition present at the time before the two hurricane events explain partly the differences in mortality during the two hurricane events.

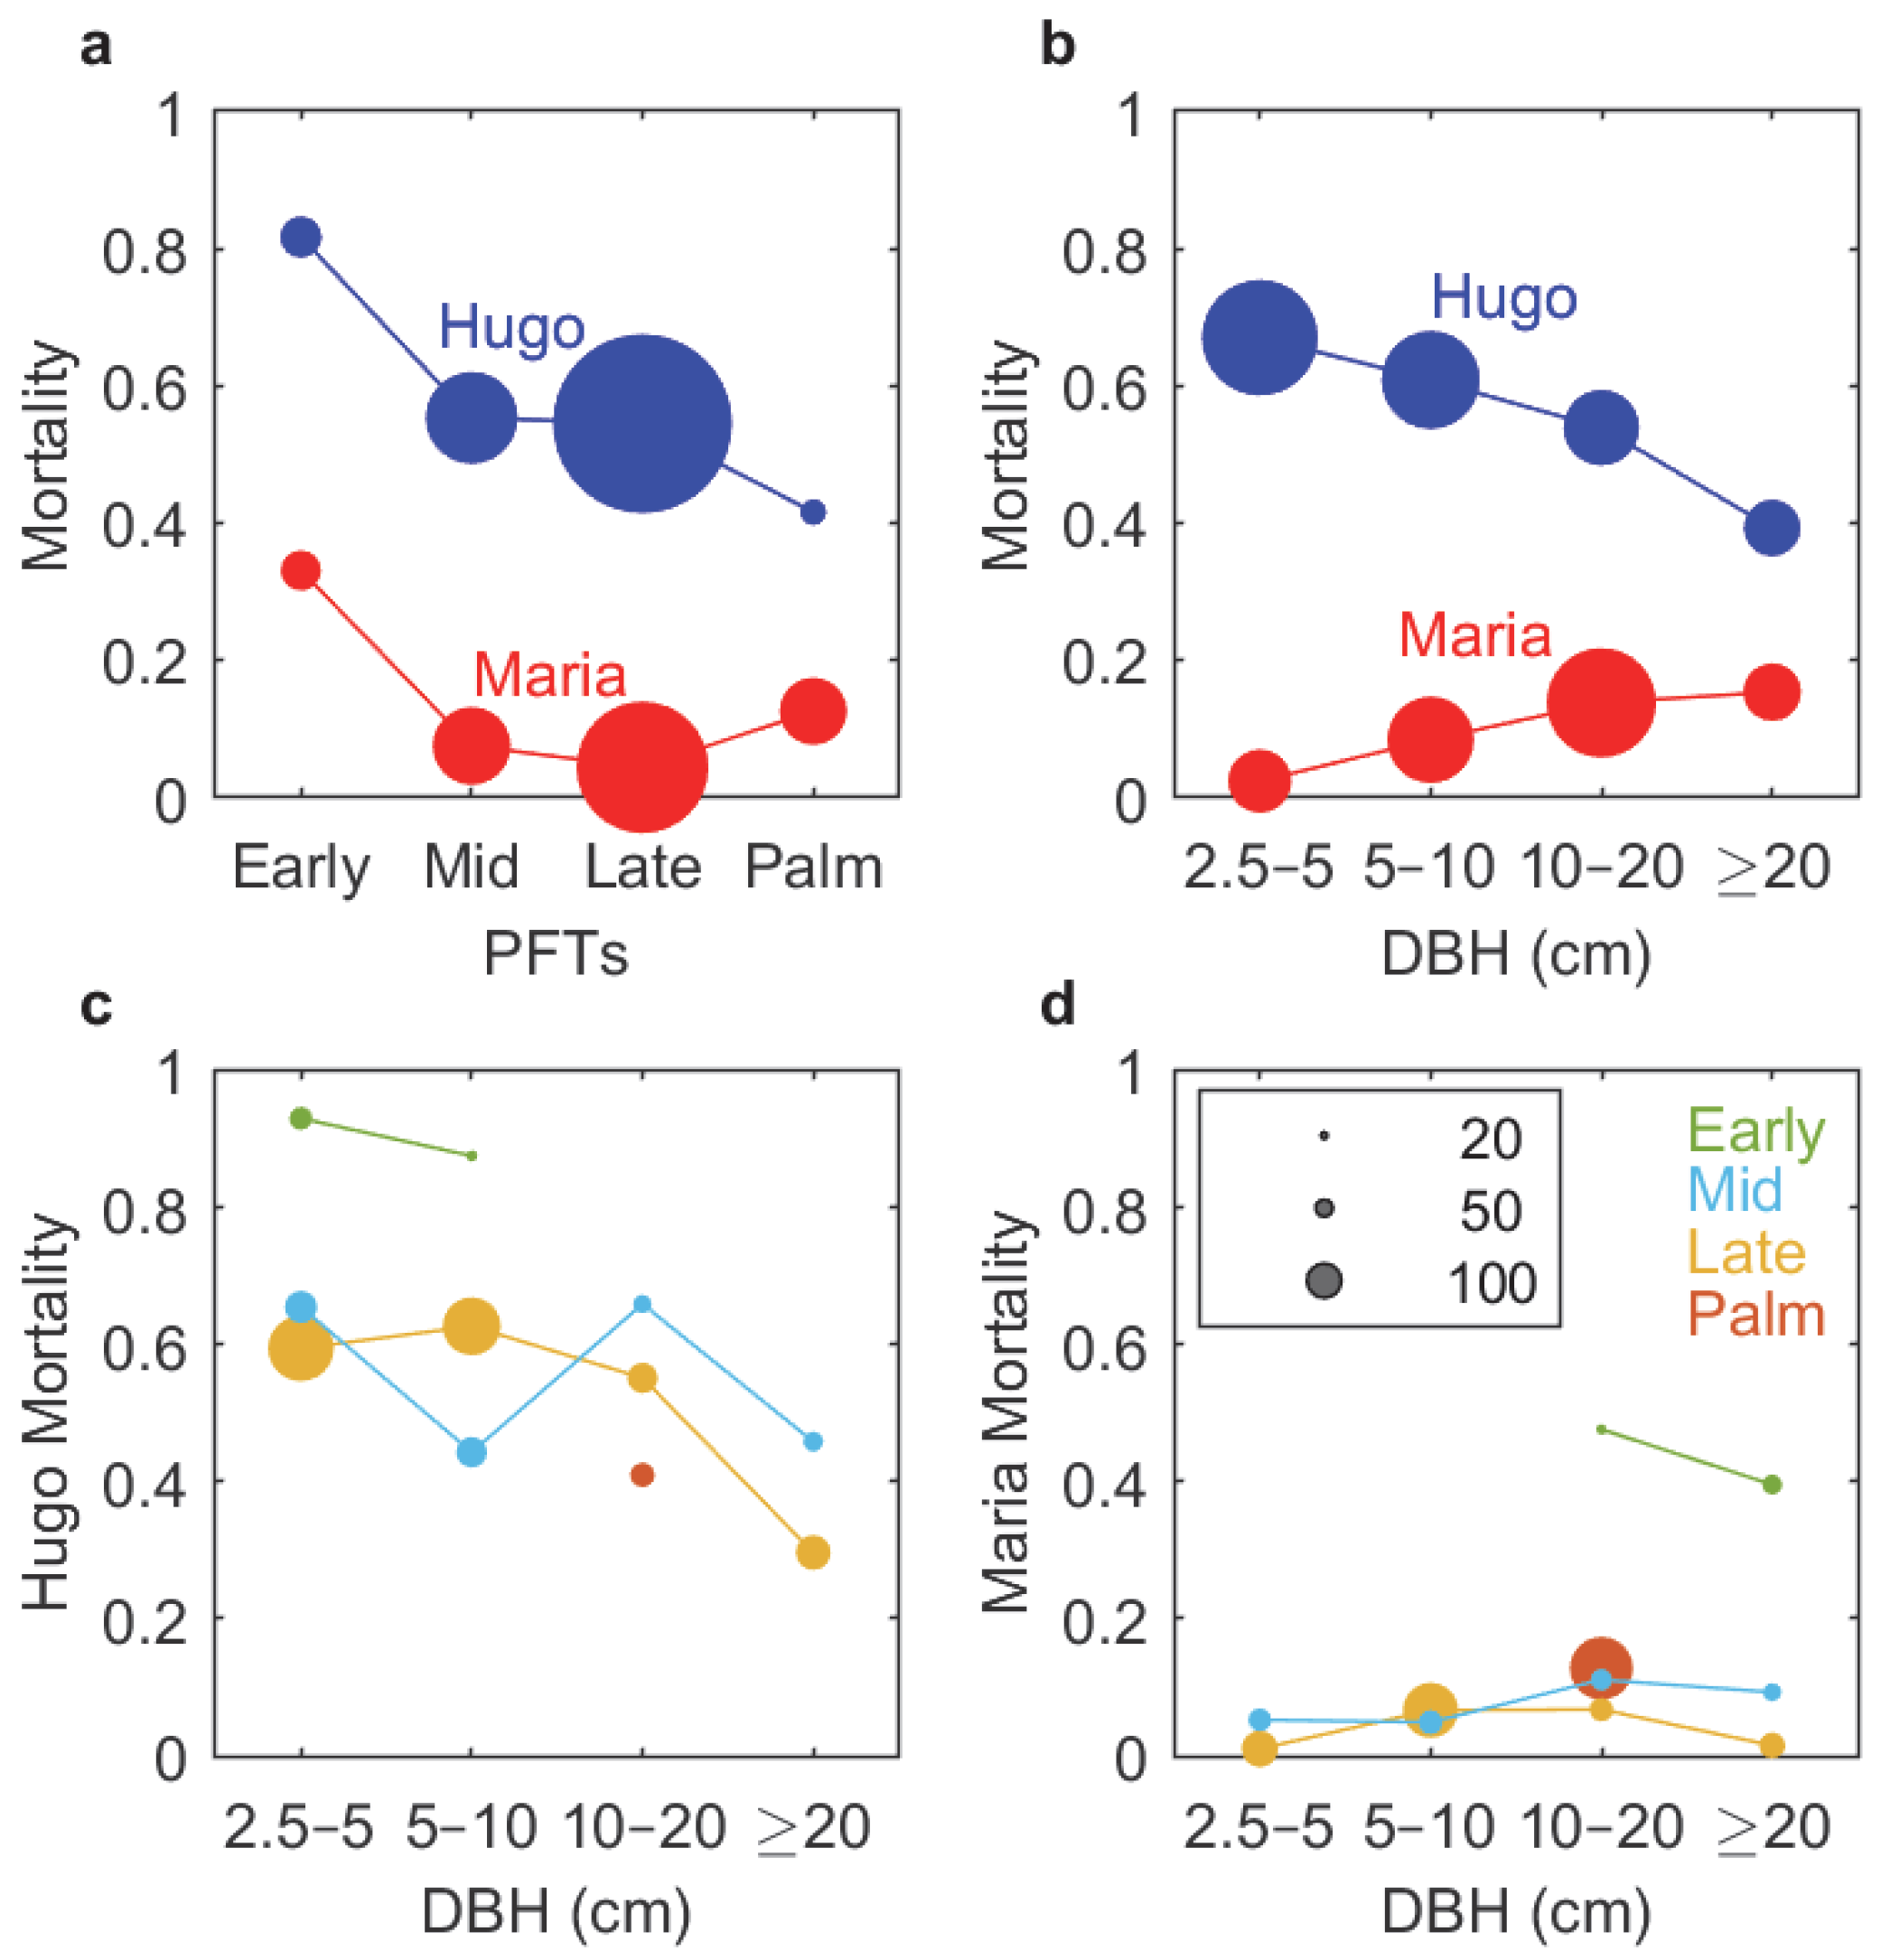
3.3. Forest Exposure to Hurricane Wind

Hurricane Hugo was a category-3 hurricane (110 knots) at landfall in Puerto Rico while hurricane María was a category-4 hurricane (135 knots) at landfall. However, hurricane Hugo passed directly over the BEW while the center of hurricane María was 40 km southeast of the Luquillo Mountains (Figure S1b). The maximum local wind speed at BEW was higher during Hugo (96 knots) than during María (88 knots). Hurricane Hugo had impact on the BEW forest (within 150 km) for 24 h (September 18 00:00 UTC–September 19 00:00 UTC, 1989), as did hurricane María (September 20 00:00 UTC–September 21 00:00 UTC, 2017). Most of the forest was completely exposed to hurricane Hugo while somewhat protected from hurricane María by the Luquillo Mountains (Figure S1d,e). The accumulated cyclone energy at BEW (ACES; see methods) during hurricane Hugo (1.81 × 10⁴ kt2) was significantly higher than that during hurricane María (0.98 × 10⁴ kt2) (p < 0.0001) (Figure S2a,b), which is consistent with the overall mortality in the forest during the two events (57.93% vs. 10.27%). Therefore, the differences in ACES between the two hurricane events likely partly explain the differences in mortality during the two hurricane events.
Site exposure also explains differences in mortality dependence on DBH between the two events. During hurricane Hugo, the forest had high exposure (Figure S1d) and most of the stems exposed to local wind were small stems, which are less wind resistant than large stems. Thus, the mortality of small stems is higher than that of intermediate and large stems. During hurricane María, the exposure of the forest was lower (Figure S1e), and most of the stems exposed are the wind resistant palm species with intermediate size, resulting in much lower mortality than what was observed during hurricane Hugo. Small stems are protected by the canopy of the intermediate and large stems, and thus the mortality of small stems is even lower than that of intermediate and large stems. Therefore, local wind speed and exposure of the forest enhance the importance and complexity of forest structure and species composition on hurricane-induced mortality.

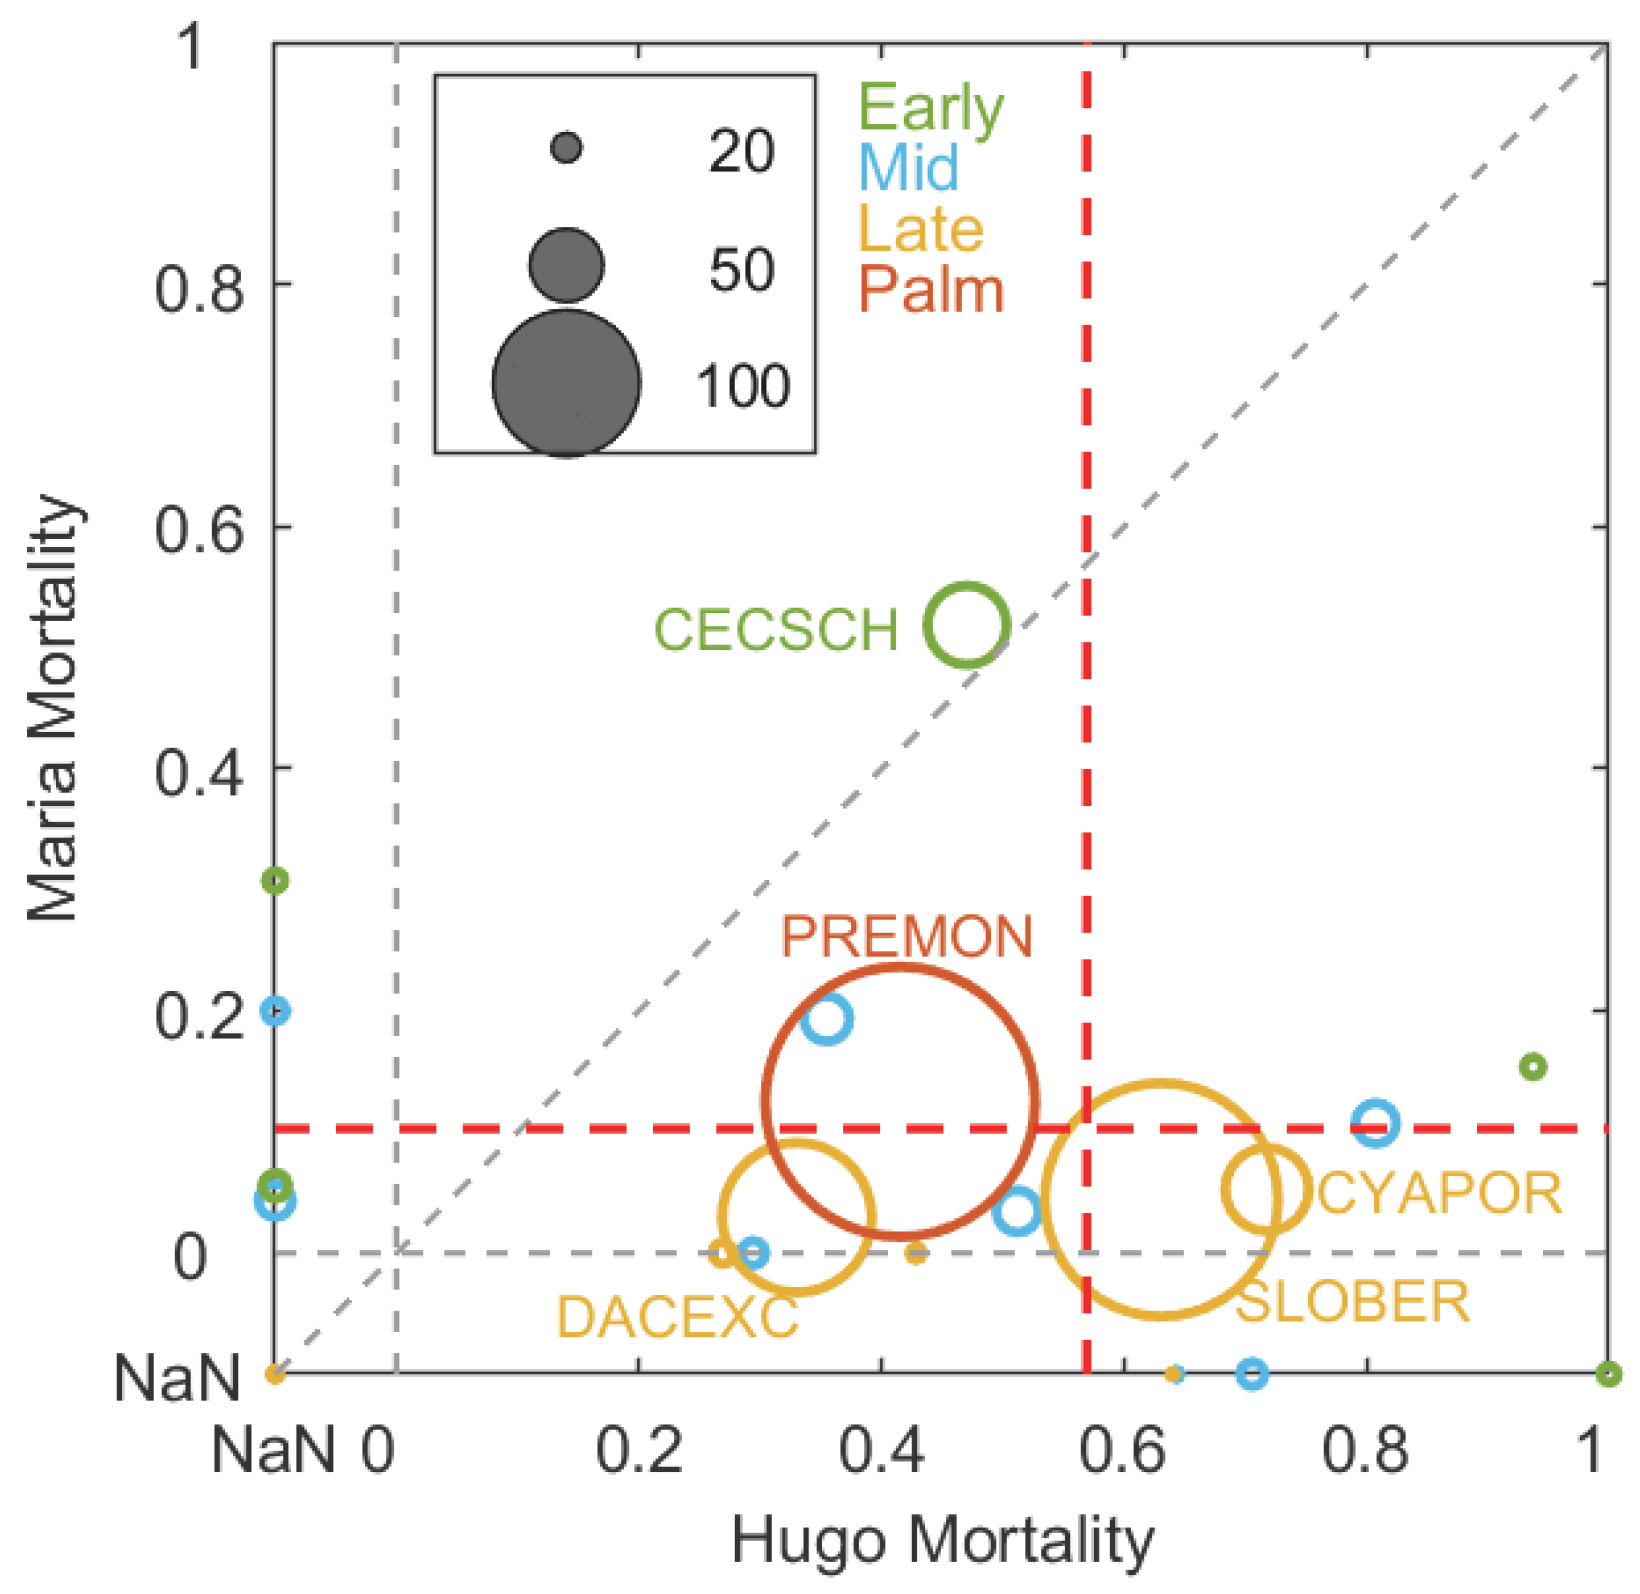
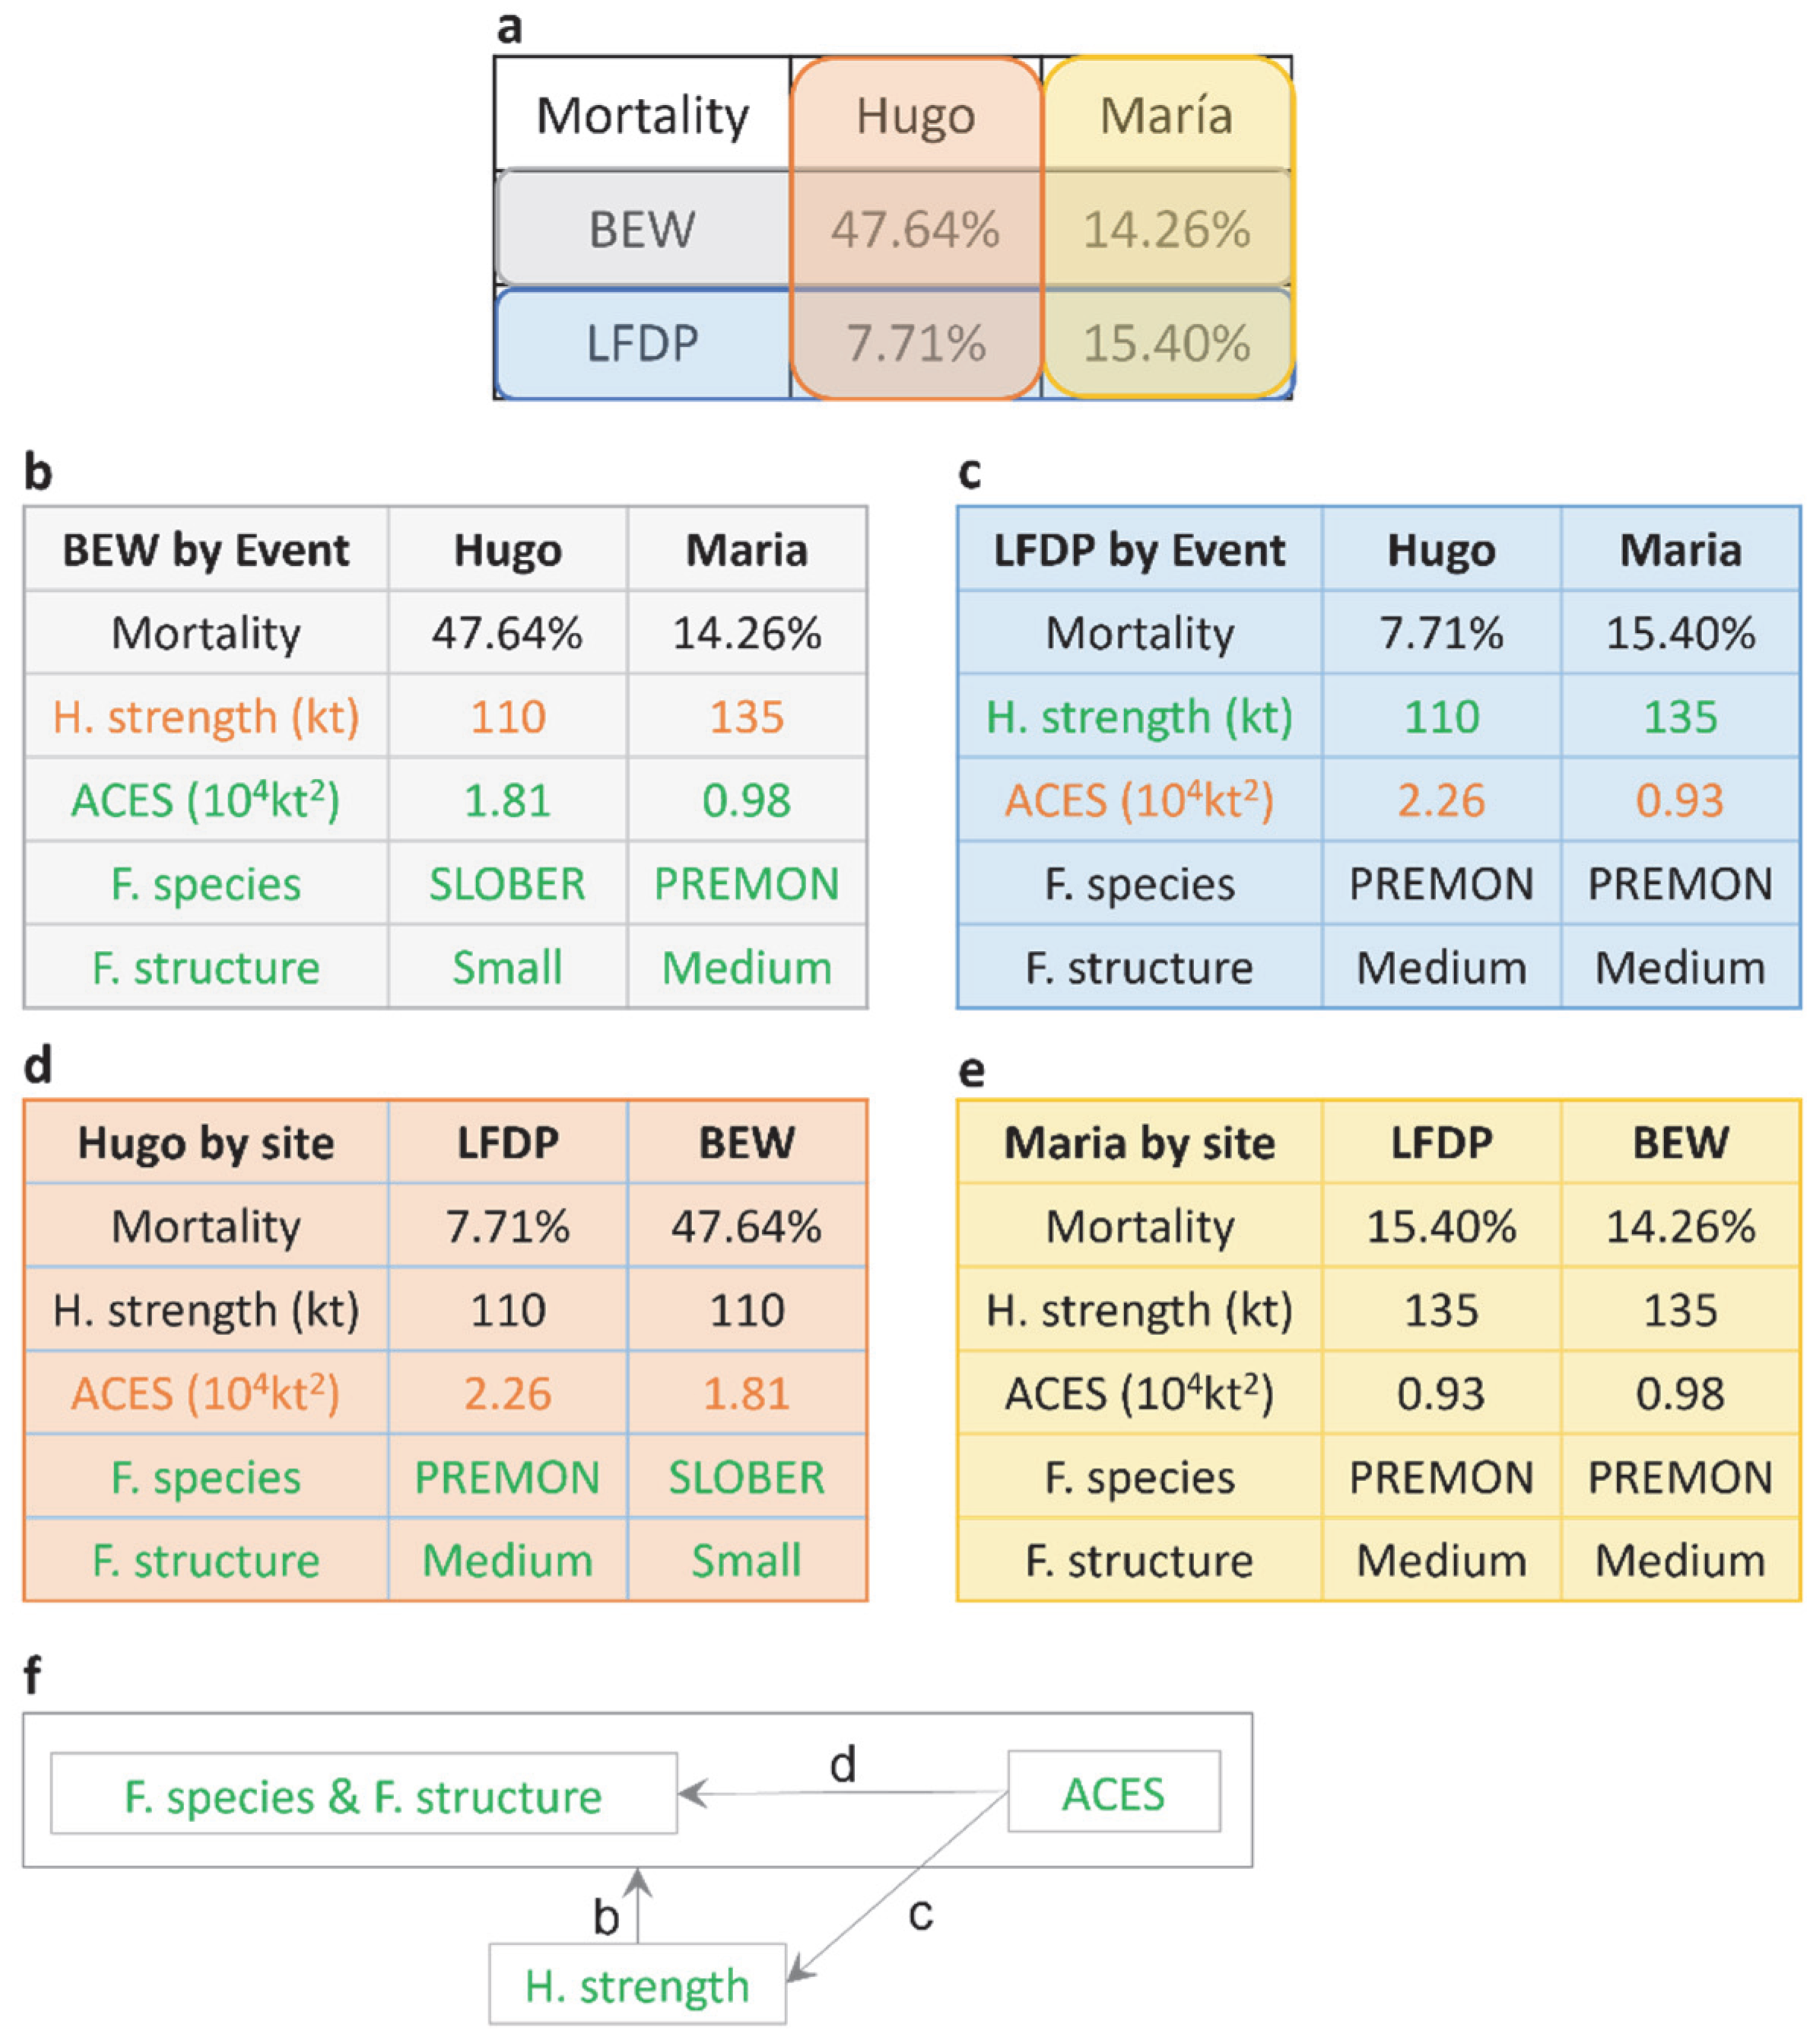
3.4. Same Forest Type and Hurricane Events with Contrasting Site Outcomes

Eight kilometers west of BEW, the Luquillo Forest Dynamics Plot (LFDP) at El Verde Research Area (Figure S1b) has the same forest type and was also affected by the two hurricanes. However, the effect of the two hurricanes on mortality was different at the two study sites (Figure 5a). At LFDP, mortality for intermediate and large stems (DBH ≥ 10 cm) during hurricane María was twice as high as that during hurricane Hugo [4]. In contrast, the mortality at BEW during Maria was just a third of what it was during Hugo (Figure 5a; Figure S4). In the following we contrast the different outcomes of the two sites as a function of different factors and conditions.
At BEW, local wind speed, topographic exposure, and accumulated cyclone energy at the site was much lower during hurricane María than during hurricane Hugo (Figure 5b). Furthermore, size structure and species composition at BEW during hurricane Hugo were more wind resistant than that during María (Figure 5b). Therefore, the lower mortality during María was due to a combination of the lower accumulated cyclone energy at the site and the structure and composition of the forest that were more resistant to hurricane disturbance (Figure 5b,f).
At LFDP, the dominant stem size and dominant species were the same during the two hurricanes—both were dominated by the wind resistant palm species and medium-sized stems (Figure 5c; Figure S3b,d). The exposure to local wind was lower during María than during Hugo because of the track and the distance of hurricanes to the forest (Figure S1g,h). Therefore, the exposure to local wind cannot explain the differences in mortality observed from the two hurricanes at LFDP (Figure 5c). The difference in mortality was attributed to the storm meteorology (wind speed and rainfall) [4] (Figure 5f).
During hurricane María, mortality was similar at the two sites (15.4% for LFPD and 14.26% for BEW) (Figure 5e). Moreover, the accumulated cyclone energy at the two sites was similar (Figure S2b,d). The species composition and size structure of the two sites were also similar at the time before hurricane María (Figure S3): both forests were dominated by the wind resistant palm species and medium-sized stems. These observations are consistent with the conclusion that accumulated cyclone energy, along with forest structure and species composition, are important components to hurricane-induced mortality.
During Hugo, mortality at BEW (47.64%) was significantly higher than mortality at LFDP (7.71%) (p < 0.0001) (Figure 5d). The accumulated cyclone energy at BEW (1.81 × 10⁴ kt2) was lower than that at LFDP (2.26 × 10⁴ kt2) (Figure 5d and Figure S2a,c), and thus cannot explain the mortality difference at the two sites. However, the size structure and species composition of the two forests were significantly different (p < 0.0001) (Figure S3). The forest at LFDP was dominated by the wind resistant palm species, P. montana, and wind resistant medium-sized stems, resulting in much lower mortality than that at BEW, which was dominated by late successional species with small stem size. These results further demonstrate that forest structure and composition are more critical components of hurricane-induced mortality than accumulated cyclone energy (Figure 5f).
Figure 5f summarizes the relative importance of the impact factors: hurricane strength was more important than ACES (Figure 5c), forest state (including species and structure) was more important than ACES (Figure 5d), and forest state together with ACES were more important than hurricane strength (Figure 5b).

4. Discussion

Hurricane Hugo caused higher mortality than hurricane María at our study site, even though hurricane Hugo was a weaker event in terms of hurricane strength (hurricane category). By comparing the results at our study site with a nearby site of the same forest type [4], we were able to identify impact factors and study the interaction among different impact factors. We conclude that hurricane strength, topographic exposure, and forest structure and composition prior to disturbance were all important factors affecting hurricane-induced mortality, yet forest structure and composition played the most critical role, especially when combined with accumulated cyclone energy at the forest. Although it has been reported that tropical forest canopy height, stem density, and species diversity are affected by hurricanes [8,9,10,11], the mechanisms (i.e., changes in forest structure and species composition) and consequences for succession and recovery have not been clearly addressed. Our findings on the role of forest structure and species composition of the same forest site after two hurricane disturbances provide insights on immediate hurricane effects on forests, and the role of sequential events at the same site due to the change and recovery of the structure and composition after those events. With an increase in the availability of long-term studies on individual forest sites, the role of forest structure and species composition in hurricane mortality becomes evident [47,48]. These long-term studies serve to increase our understanding on the interactions between forest structure and composition and hurricane disturbances.
Under a warming climate, hurricanes are predicted to be more frequent and more intense [49,50,51]. The structure and composition of forests that are exposed to hurricane events will continuously change with consecutive and accumulated disturbances. Forests subject to frequent and severe hurricane disturbances are likely to contain wind-resistant canopy and stem structure and have species composition naturally selected under those conditions [52]. In tropical forests, wind resistant species such as palms [28] will continue to have stem dominance and perhaps become more ubiquitous. As hurricanes shift toward higher latitudes [53], extratropical forests will be increasingly subject to hurricane disturbances in the future [21]. Better comprehension of the relationship between forest structure and composition in relation to consecutive hurricane effects is critical to understand the recovery trajectory of forests from hurricane disturbances and to guide monitoring and management strategies [54].

Supplementary Materials

The following are available online at https://www.mdpi.com/article/10.3390/f13020202/s1, Figure S1: Topographic angle maps of two study sites from two hurricanes. Method of calculating topographic angle (θ) of a given point (a), location of the Bisley Experimental Watersheds (BEW) (black star) and the Luquillo Forest Dynamics Plot (LFDP) (black circle) relative to the tracks of hurricanes Hugo and María (colored lines) (b), elevation map of the BEW (c) and the map of the topographic angle of BEW regarding hurricane Hugo (d) and hurricane María (e). (fh) are the same as (ce), except for the LFDP. The topographic angle reveals the likelihood of exposure of a given point to wind disturbances, and smaller angle indicates higher likelihood of being exposed to the wind. The maps in (d,e,g,h) show the minimum topographical angle (maximum exposure) of the pixel among the times when the hurricanes were within 500 km of the site. Figure S2: Same as Figure S1d,e,g,h, but for the accumulated cyclone energy at site (ACES). The domain mean and 95% confidence interval for each site during each hurricane are given in parentheses. Figure S3: Species composition and size structure of the two sites (BEW and LFDP) during the two hurricane events (María and Hugo). (a) and (c) show the stem density of each species (a) and each DBH size (c) with DBH ≥ 10 cm and density ≥ 10 #/ha at BEW at the times of hurricane Hugo and hurricane María. (b,d) are the same as (a,c), but for LFDP. The DBH in X-axis in (c,d) are on a logarithmic scale. The data for LFDP in (b,d) are from Table S1 and Figure S1, respectively, in Uriarte et al. [4], which is under creative commons license (https://creativecommons.org/licenses/by/4.0/, accessed on 25 January 2022). The two distributions in each panel are significantly different (p < 0.0001) using χ2 test. Figure S4: Same as Figure 2, but for stems with DBH ≥ 10 cm. Table S1: Code, Genus and species, Family, and Plant Function Type (PFT) of each species, listed in the order of descending abundance for each PFT before hurricane María. The scientific name of species follows the Integrated Taxonomic Information System (https://www.itis.gov/, accessed on 25 January 2022). Table S2: Mortality of each species from hurricanes Hugo and María. The list is in the descending order of the abundance of each species before hurricane María. Table S3: Damage information of each species from hurricane María. The list is in the descending order of the abundance of each species before hurricane María. Table S4: Damage information of each DBH class from hurricane María. Table S5: Damage information of each crown dominance category from hurricane María.

Author Contributions

Conceptualization, J.Z. and R.L.B.; Data curation, T.H.-S.; Formal analysis, J.Z.; Funding acquisition, R.L.B.; Investigation, J.Z. and T.H.-S.; Methodology, J.Z. and R.L.B.; Project administration, R.L.B.; Resources, T.H.-S.; Software, J.Z.; Supervision, R.L.B.; Validation, J.Z., T.H.-S. and R.L.B.; Visualization, J.Z.; Writing—original draft, J.Z.; Writing—review & editing, J.Z., T.H.-S. and R.L.B. All authors have read and agreed to the published version of the manuscript.

Funding

This research was funded by National Science Foundation, grant number EAR1331841 and K. Harrison Brown Family Chair and supported in part by the USDA Forest Service International Institute of Tropical Forestry working in collaboration with the University of Puerto Rico. The findings and conclusions are those of the authors and should not be construed to represent any official USDA or U.S. Government determination or policy.

Institutional Review Board Statement

Not applicable.

Informed Consent Statement

Not applicable.

Data Availability Statement

All datasets used in this study are publicly available online. The census data for hurricane Hugo is accessible at USDA Forest Service Research Data Archive, the census data for hurricane María is at https://doi.org/10.2737/RDS-2020-0012 (accessed on 25 January 2022). All MATLAB codes and calculated data in this study is available upon request.

Conflicts of Interest

The authors declare no conflict of interest.

References

  1. Lugo, A.E. Visible and invisible effects of hurricanes on forest ecosystems: An international review. Austral Ecol. 2008, 33, 368–398. [Google Scholar] [CrossRef]
  2. Flynn, D.F.B.; Uriarte, M.; Crk, T.; Pascarella, J.B.; Zimmerman, J.K.; Aide, T.M.; Caraballo Ortiz, M.A. Hurricane disturbance alters secondary forest recovery in Puerto Rico. Biotropica 2010, 42, 149–157. [Google Scholar] [CrossRef]
  3. Shiels, A.B.; Gonzalez, G.; Lodge, D.L.; Willing, M.R.; Zimmerman, J.K. Cascading effects of canopy opening and debris deposition from a large-scale hurricane experiment in a tropical rain forest. BioScience 2015, 65, 871–881. [Google Scholar] [CrossRef] [Green Version]
  4. Uriarte, M.; Thompson, J.; Zimmerman, J.K. Hurricane María tripled stem breaks and doubled tree mortality relative to other major storms. Nat. Commun. 2019, 10, 1362. [Google Scholar] [CrossRef] [PubMed] [Green Version]
  5. Heartsill Scalley, T.; Scatena, F.N.; Lugo, A.E.; Moya, S.; Estrada, C.R. Changes in structure, composition, and nutrients during 15 years of hurricane-induced succession in a subtropical wet forest in Puerto Rico. Biotropica 2010, 42, 455–463. [Google Scholar] [CrossRef]
  6. Heartsill Scalley, T. Insights on forest structure and composition from long-term research in the Luquillo mountains. Forests 2017, 8, 204. [Google Scholar] [CrossRef] [Green Version]
  7. Lin, T.-C.; Hogan, J.A.; Chang, C.-T. Tropical cyclone ecology: A scale-link perspective. Trends Ecol. Evol. 2020, 35, 594–604. [Google Scholar] [CrossRef] [Green Version]
  8. Lin, S.-Y.; Shaner, P.-J.L.; Lin, T.-C. Characteristics of old-growth and secondary forests in relation to typhoon disturbance. Ecosystems 2018, 21, 1521–1532. [Google Scholar] [CrossRef]
  9. Lin, T.-C.; Hamburg, S.P.; Lin, K.-C.; Wang, L.-J.; Chang, C.-T.; Hsia, Y.-J.; Vadeboncoeur, M.A.; McMullen, C.M.M.; Liu, C.-P. Typhoon disturbance and forest dynamics: Lessons from a northwest Pacific subtropical forest. Ecosystems 2011, 14, 127–143. [Google Scholar] [CrossRef]
  10. Ibanez, T.; Keppel, G.; Menkes, C.; Gillespie, T.W.; Lengaigne, M.; Mangeas, M.; Rivas-Torres, G.; Birnbaum, P. Globally consistent impact of tropical cyclone on the structure of tropical and subtropical forests. J. Ecol. 2019, 107, 279–292. [Google Scholar] [CrossRef]
  11. Vandermeer, J.; Boucher, D.; Perfecto, I.; de la Cerda, I.G. A theory of disturbance and species diversity: Evidence from Nicaragua after hurricane Joan. Biotropica 1996, 28, 600–613. [Google Scholar] [CrossRef]
  12. Xi, W. Synergistic effects of tropical cyclones on forest ecosystems: A global synthesis. J. For. Res. 2015, 26, 1–21. [Google Scholar] [CrossRef]
  13. Xi, W.; Peet, R.K.; Urban, D.L. Changes in forest structure, species diversity and spatial pattern following hurricane disturbance in a Piedmont North Carolina forest, USA. J. Plant Ecol. 2008, 1, 43–57. [Google Scholar] [CrossRef]
  14. Arnone, E.; Noto, L.V.; Lepore, C.; Bras, R.L. Physically-based and distributed approach to analyze rainfall-triggered landslides at watershed scale. Geomorphology 2011, 133, 121–131. [Google Scholar] [CrossRef] [Green Version]
  15. Arnone, E.; Dialynas, Y.G.; Noto, L.V.; Bras, R.L. Accounting for soil parameter uncertainty in a physically based and distributed approach for rainfall-triggered landslides. Hydrol. Process. 2015, 30, 927–944. [Google Scholar] [CrossRef]
  16. Lepore, C.; Kamal, S.A.; Shanahan, P.; Bras, R.L. Rainfall-induced landslide susceptibility zonation of Puerto Rico. Environ. Earth Sci. 2012, 66, 1667–1681. [Google Scholar] [CrossRef]
  17. Lepore, C.; Arnone, E.; Noto, L.V.; Sivandran, G.; Bras, R.L. Physically based modeling of rainfall-triggered landslides: A case study in the Luquillo forest, Puerto Rico. Hydrol. Earth Syst. Sci. 2013, 17, 3371–3387. [Google Scholar] [CrossRef] [Green Version]
  18. Taylor, A.R.; Dracup, E.; MacLean, D.A.; Boulanger, Y.; Endicott, S. Forest structure more important than topography in determining windthrow during Hurricane Juan in Canada’s Acadian Forest. For. Ecol. Manag. 2019, 434, 255–263. [Google Scholar] [CrossRef]
  19. Boose, E.R.; Chamberlin, K.E.; Foster, D.R. Landscape and regional impacts of hurricanes in New England. Ecol. Monogr. 2001, 71, 27–48. [Google Scholar] [CrossRef]
  20. Bellingham, P.J.; Tanner, E.V.J.; Healey, J.R. Damage and responsiveness of Jamaican montane tree species after disturbance by a hurricane. Ecology 1995, 76, 2562–2580. [Google Scholar] [CrossRef]
  21. Liebsch, D.; Marcilio-Silva, V.; Marcon, A.K.; Galvão, F.; Mikich, S.B.; Marques, M.C.M. How do trees survive a cyclone? The relative role of individual and site characteristics over mortality. Aus. Ecol. 2021, 46, 1356–1365. [Google Scholar] [CrossRef]
  22. Lewis, R.J.; Bannar-Martin, K.H. The impact of cyclone Fanele on a tropical dry forest in Madagascar. Biotropica 2012, 44, 135–140. [Google Scholar] [CrossRef]
  23. Ni, Y.; Wang, T.; Cao, H.; Li, Y.; Bin, Y.; Zhang, R.; Wang, Y.; Lian, J.; Ye, W. An old-growth subtropical evergreen broadleaved forest suffered more damage from Typhoon Mangkhut than an adjacent secondary forest. For. Ecol. Manag. 2021, 496, 119433. [Google Scholar] [CrossRef]
  24. Tanner, E.V.J.; Kapos, V.; Healey, J.R. Hurricane effects on forest ecosystems in the Caribbean. Biotropica 1991, 23, 513–521. [Google Scholar] [CrossRef]
  25. Chirici, G.; Bottalico, F.; Giannetti, F.; Del Perugia, B.; Travaglini, D.; Nocentini, S.; Kutchartt, E.; Marchi, E.; Foderi, C.; Fioravanti, M.; et al. Assessing forest windthrow damage using single-date, post-event airborne laser scanning data. Forestry 2018, 91, 27–37. [Google Scholar] [CrossRef] [Green Version]
  26. Pruitt, J.N.; Little, A.G.; Majumdar, S.J.; Schoener, T.W.; Fisher, D.N. Call-to-action: A global consortium for tropical cyclone ecology. Trends Ecol. Evol. 2019, 34, 588–590. [Google Scholar] [CrossRef]
  27. Hogan, J.A.; Feagin, R.A.; Starr, G.; Ross, M.; Lin, T.C.; O’connell, C.; Huff, T.P.; Stauffer, B.A.; Robinson, K.L.; Lara, M.C.; et al. A research framework to integrate cross-ecosystem responses to tropical cyclones. BioScience 2020, 70, 477–489. [Google Scholar] [CrossRef]
  28. Scatena, F.N. An Introduction to the Physiography and History of the Bisley Experimental Watersheds in the Luquillo Mountains of Puerto Rico; Gen. Tech. Rep. SO-72.; U.S. Department of Agriculture, Forest Service, Southern Forest Experiment Station: New Orleans, LA, USA, 1989; 22p. [Google Scholar]
  29. Castro-Rivera, A.; López-Marrero, T. Allá viene el temporal: Major hurricanes in Puerto Rico between 1851 and 2019. Caribb. Geogr. 2019, 24, 24–39. [Google Scholar]
  30. Zimmerman, J.K.; Wood, T.E.; González, G.; Ramirez, A.; Silver, W.L.; Uriarte, M.; Willig, M.R.; Waide, R.B.; Lugo, A.E. Disturbance and resilience in the Luquillo Experimental Forest. Biol. Conserv. 2021, 253, 108891. [Google Scholar] [CrossRef]
  31. Zhang, J.; Heartsill Scalley, T.; Bras, R.L. Tree Census at Bisley Experimental Watersheds since Hurricane Hugo in 1989 to 2014; Forest Service Research Data Archive: Fort Collins, CO, USA, 2022; in preparation. [Google Scholar]
  32. Zhang, J.; Bras, R.L.; Heartsill Scalley, T. Tree Census at Bisley Experimental Watersheds Three Months after Hurricane María; Forest Service Research Data Archive: Fort Collins, CO, USA, 2020. [Google Scholar]
  33. Walker, L.R. Tree damage and recovery from hurricane Hugo in Luquillo Experimental Forest, Puerto Rico. Part A. special issue: Ecosystem, plant, and animal responses to hurricanes in the Caribbean. Biotropica 1991, 23, 379–385. [Google Scholar] [CrossRef]
  34. Schowalter, T.D.; Ganio, L.M. Invertebrate communities in a tropical rain forest canopy in Puerto Rico following hurricane Hugo. Ecol. Entomol. 1999, 24, 191–201. [Google Scholar] [CrossRef]
  35. Uriarte, M.; Canham, C.D.; Thompson, J.; Zimmerman, J.K.; Brokaw, N. Seedling recruitment in a hurricane-driven tropical forest: Light limitation, density-dependence and the spatial distribution of parent trees. J. Ecol. 2005, 93, 291–304. [Google Scholar] [CrossRef]
  36. Muscarella, R.; Uriarte, M.; Forero-Montaña, J.; Comita, L.S.; Swenson, N.G.; Thompson, J.; Nytch, C.J.; Jonckheere, I.; Zimmerman, J.K. Life-history trade-offs during the seed-to-seedling transition in a subtropical wet forest community. J. Ecol. 2013, 101, 171–182. [Google Scholar] [CrossRef]
  37. Feng, X.; Uriarte, M.; González, G.; Reed, S.; Thompson, J.; Zimmerman, J.K.; Murphy, L. Improving predictions of tropical forest response to climate change through integration of field studies and ecosystem modeling. Glob. Chang. Biol. 2018, 24, e213–e232. [Google Scholar] [CrossRef] [PubMed]
  38. Boose, E.R.; Serrano, M.I.; Foster, D.R. Landscape and regional impacts of hurricanes in Puerto Rico. Ecol. Monogr. 2004, 74, 335–352. [Google Scholar] [CrossRef]
  39. Boose, E.R.; Foster, D.R.; Fluet, M. Hurricane Impacts of tropical and temperature forest landscapes. Ecol. Monogr. 1994, 64, 369–400. [Google Scholar] [CrossRef]
  40. USGS. 1/3-Arc Second National Elevation Dataset; US Geological Survey: Reston, VA, USA, 2018. [Google Scholar]
  41. Parker, L.; Booth, W. Hurricane Hugo Rips through South Carolina. The Washington Post, Friday. 22 September 1989. Available online: https://www.washingtonpost.com/wp-srv/weather/hurricane/poststories/hugo-sc.htm(accessed on 25 January 2022).
  42. Pasch, R.J.; Penny, A.B.; Berg, R.; National Hurricane Center. Tropical Cyclone Report: Hurricane María (AL152017). 2019. Available online: https://www.nhc.noaa.gov/data/tcr/AL152017_Maria.pdf (accessed on 25 January 2022).
  43. Landsea, C.W.; Franklin, J.L. Atlantic hurricane database uncertainty and presentation of a new database format. Mon. Weather Rev. 2013, 141, 3576–3592. [Google Scholar] [CrossRef]
  44. Bell, G.D.; Halpert, M.S.; Ropelewski, C.F.; Kousky, V.E.; Douglas, A.V.; Schnell, R.C.; Gelman, M.E. Climate assessment for 1999. Bull. Am. Meteorol. Soc. 2000, 81, S1–S50. [Google Scholar] [CrossRef]
  45. Montgomery, D.C.; Runger, G.C. Large-sample tests on the difference in population proportions. In Applied Statistics and Probability for Engineers, 7th ed.; Wiley: New York, NY, USA, 2018; pp. 274–275. ISBN 978-1-119-40036-3. [Google Scholar]
  46. Griffith, M.P.; Noblick, L.R.; Dowe, J.L.; Husby, C.E.; Calonje, M.A. Cyclone tolerance in New World Arecaceae: Biogeographic variation and abiotic natural selection. Ann. Bot. 2008, 102, 591–598. [Google Scholar] [CrossRef] [Green Version]
  47. Luke, D.; McLaren, K.; Wilson, B. Modeling hurricane exposure in a Caribbean lower montane tropical wet forest: The effects of frequent, intermediate disturbances and topography on forest structural dynamics and composition. Ecosystems 2016, 19, 1178–1195. [Google Scholar] [CrossRef]
  48. Crow, T.R. A rainforest chronicle: A 30-year record of change in structure and composition at El Verde, Puerto Rico. Biotropica 1980, 12, 42–55. [Google Scholar] [CrossRef]
  49. Emanuel, K. Increasing destructiveness of tropical cyclones over the past 30 years. Nature 2005, 436, 686–688. [Google Scholar] [CrossRef] [PubMed]
  50. Knutson, T.R.; McBride, J.L.; Chan, J.; Emanuel, K.; Holland, G.; Landsea, C.; Held, I.; Kossin, J.P.; Srivastava, A.K.; Sugi, M. Tropical cyclones and climate change. Nat. Geosci. 2010, 3, 157–163. [Google Scholar] [CrossRef] [Green Version]
  51. Bender, M.A.; Knutson, T.R.; Tuleya, R.E.; Sirutis, J.J.; Vecchi, G.A.; Garner, S.T.; Held, I.M. Modeled impact of anthropogenic warming on the frequency of intense Atlantic Hurricanes. Science 2010, 327, 454–458. [Google Scholar] [CrossRef] [PubMed] [Green Version]
  52. Vandermeer, J.; de la Cerda, I.G.; Boucher, D.; Perfecto, I.; Ruiz, J. Hurricane disturbance and tropical tree species diversity. Science 2000, 290, 788–791. [Google Scholar] [CrossRef]
  53. Kossin, J.; Emanuel, K.; Vecchi, G. The poleward migration of the location of tropical cyclone maximum intensity. Nature 2014, 509, 349–352. [Google Scholar] [CrossRef] [Green Version]
  54. Corona, P. Consolidating new paradigms in large-scale monitoring and assessment of forest ecosystems. Environ. Res. 2016, 144, 8–14. [Google Scholar] [CrossRef] [Green Version]
Figure 1. Forest damage three months after hurricane María at Bisley Experimental Watersheds (BEW). Stem counts (#) and percentage (%) of different levels of damage for (a) each species, (b) each diameter (DBH) class, and (c) each crown-dominance class. Damage categories I, II, and III are light damage (<50% of defoliation), intermediate damage (>50% of defoliation or branches broken), and heavy damage (stem or root broken), respectively. Letters above the bar of the species indicate the successional type of the species: palm (P), early (E), mid (M), and late (L) successional trees. Letter N in panel (b) represents not measured. Letters D, C, I, and N in panel (c) represent crown-dominance classes: dominant (D), co-dominant (C), intermediate (I), suppressed (S), and not-measured (N). The data used to produce (ac) are also listed in Tables S3–S5, respectively.
Forests 13 00202 g001
Figure 2. Mortality of each species during Hugo and María. Red lines are community-average mortality, one circle represents one species and the species codes of the five most abundant species are shown. “NaN” indicates that the mortality was not calculated because the sample size was small (<10). The size of the circles is proportional to stem count and the color indicates PFT.
Forests 13 00202 g002
Figure 3. Comparison between mortality from hurricane Hugo and mortality from hurricane María at BEW. (a) mortality of each plant functional type (PFT) for all diameter (DBH) classes, (b) mortality of each DBH class for all PFTs during the two hurricanes, mortality of each PFT in each DBH class (b) during Hugo and (c) during María. The marker size is proportional to the stem count. The color indicates hurricane event in (a,b) and indicates PFT in (c,d).
Forests 13 00202 g003
Figure 4. Species composition and size structure present before hurricane Hugo and before hurricane María at BEW. (a) Stem counts of the most abundant species and (b) distribution of each DBH size. The code and name of each species in (a) are in Table S1. The two distributions in each panel are significantly different at 99% level (p < 0.0001) using χ2 test.
Forests 13 00202 g004
Figure 5. Comparison of mortality and impact factors at Luquillo Forest Dynamics Plot (LFDP) and Bisley Experimental Watersheds (BEW) during hurricanes Hugo and María. (a) The mortality at the two sites during the two hurricane events. The mortality and impact factors at (b) BEW during the two events and (c) LFDP during the two events. The mortality and impact factors at the two sites during (d) hurricane Hugo and (e) hurricane María. (f) The relative importance of the impact factors. The mortality at BEW is for stems with DBH ≥ 10 cm, to be consistent with that at LFDP. The mortality between any two events (panels b,c,d) is significantly different according to z-score test (p < 0.0001) except that the mortality between LFDP and BEW during María (panel e) is not significantly different (p = 0.5304). In panels (bf), H. strength represents hurricane strength at landfall (in knots), ACES represents accumulated cyclone energy at site (104 kt2), F. species represents forest dominant species, and F. structure represents forest dominant DBH size. The mortality, dominant species and DBH size at LFDP are from Uriarte et al. [4], which are also shown in Figure S3. Orange font color indicates that the factor cannot explain mortality while green font color indicates that the factor is consistent with mortality. In panel (f), boxing means combining the impact factors, the arrows between boxes indicate relative importance where the direction of the arrow indicates increasing importance. Relative importance is obtained from the corresponding panels (bd) as shown beside the arrows.
Forests 13 00202 g005
Publisher’s Note: MDPI stays neutral with regard to jurisdictional claims in published maps and institutional affiliations.

