
Impacts of Climate Change on Blue Carbon Stocks and Fluxes in Mangrove Forests


Tropical Coastal & Mangrove Consultants, Shearwater Drive, Pakenham, VIC 3810, Australia
Forests 2022, 13(2), 149; https://doi.org/10.3390/f13020149
Submission received: 23 December 2021
/
Revised: 14 January 2022
/
Accepted: 17 January 2022
/
Published: 19 January 2022
(This article belongs to the Special Issue Carbon and Water Cycles in Coastal Forests under Climate Change and Variability)
Abstract
:Mangroves store blue carbon (693 Mg CORG ha−1) disproportionate to their small area, mainly (74%) in deep soil horizons. Global stock estimates for mangroves (5.23–8.63 Pg CORG) are equivalent to 15–24% of those in the tropical coastal ocean. Carbon burial in mangrove soils averages 184 g CORG m−2 a−1 with global estimates (9.6–15.8 Tg CORG a−1) reflecting their importance in carbon sequestration. Extreme weather events result in carbon stock losses and declines in carbon cycling and export. Increased frequency and ferocity of storms result in increasingly negative responses with increasing strength. Increasing temperatures result in increases in carbon stocks and cycling up to a critical threshold, while positive/negative responses will likely result from increases/decreases in rainfall. Forest responses to sea-level rise (SLR) and rising CO2 are species- and site-specific and complex due to interactive effects with other drivers (e.g., temperature, salinity). The SLR critical threshold is ≈ 6 mm a−1 indicating survival only under very low-low CO2 emissions scenarios. Under low coastal squeeze, landward migration could result in sequestration and CO2 losses of 1.5 and −1.1 Pg C with net stock gains and losses (−0.3 to +0.5 Pg C) and CO2 losses (−3.4 Pg) under high coastal squeeze.
1. Introduction
Mangrove forests occupy the coastal–land interface of subtropical and tropical seas and are ordinarily subjected to harsh environmental conditions that predispose these tidal ecosystems to be resilient to climate or climate-related factors, such as sea-level rise (SLR). Mangroves are naturally well adapted to rapid changes in tides, temperature, salinity, freshwater and sediment inputs, and anoxia. These drivers impose structural and functional constraints and foster adaptation and physiological mechanisms to facilitate subsistence in a harsh saline, low oxygen environment [1,2]. Mangrove ecosystems are characterized by a rich mixture of marine, estuarine, and semi-terrestrial organisms that form unique food webs and play a plethora of roles in the coastal zone by linking food webs and the flow of energy and inorganic and organic materials and geochemical and biogeochemical cycles from the shoreline to the adjacent coastal ocean.
Mangroves are the world’s most carbon-rich ecosystems to the extent that they are considered to play a role in climate regulation and mitigation by capturing and sequestering large amounts of carbon (mostly in soils) that counterbalance anthropogenic CO2 emissions [3,4,5]. The large amounts of carbon reflect high rates of primary production and rapid rates of soil accretion on the forest floor. Like other forested ecosystems, mangroves exchange gases with the atmosphere but like all coastal wetlands also exchange gases and dissolved and particulate materials with adjacent coastal waters. Tidal connections are complex, with variable concentrations of dissolved organic and inorganic solutes and particulates imported and exported by tides, porewater pumping, and subsurface groundwater advection [6]. Flocculation and sedimentation of fine particles is facilitated by tidal circulatory processes, such as (1) a pronounced asymmetry between ebb and flood tides, (2) friction, flow resistance and drag due to the presence of forest structures, and (3) lateral trapping and gradients due to high evapotranspiration. Several interrelated processes exert control over sediment transport and deposition, including (1) tidal pumping, (2) baroclinic circulation, (3) particle trapping in the turbidity maximum, (4) flocculation, (5) the tidal prism, and (6) microbial production of mucus [6].
Sedimentation of particles and the long-term accretion of soils in mangroves is often rapid. Over decades, after initial colonization of a mudflat, the forest develops and the forest floor builds up further, adjusting to sea-level, subsidence, and uplift, with the net result being several meters of soil. As the forest matures, these deposits are penetrated further by extensive tree root systems, various flora and fauna, especially burrowing crabs, to the extent that mangrove deposits contribute about 30% to carbon storage on continental margins in low latitudes [7]. This sequestered carbon is now commonly referred to as ‘blue carbon’, being derived from a marine habitat.
Similarly, mangroves contribute a disproportionate share of carbon to the coastal ocean, as they occupy only 1.5% of the world’s subtropical and tropical coastal area, but account for 5% of net primary production and 12% of ecosystem respiration. These figures illustrate the potential of mangrove reforestation and restoration in ameliorating CO2 emissions in climate mitigation projects. After an update and critical examination of mangrove carbon stocks and pathways, an analysis and forecast will be presented as to the level of significance of mangrove blue carbon storage and cycling at national, regional, and global levels in relation to climate change.
2. Mangrove Blue Carbon: An Update
2.1. Carbon Stocks
Mangrove forests have the largest organic carbon (CORG) stocks of any of earth’s ecosystems, with a global mean total forest stock of 692.8 ± 23.1 (±1 SE) Mg CORG ha−1 (updated from [8] with [9,10,11,12,13,14,15,16,17,18,19,20,21,22,23,24,25,26,27,28]). Soil standing stocks average 516.4 ± 19.8 Mg CORG ha−1 over the upper 1 m depth, accounting for 74% of total ecosystem standing stocks. However, in areas of peat and silt/clay soil, CORG concentrations are considerable to a depth of several meters. In deep (1–6 m) peat soils in mangrove sinkholes on the Yucatan Peninsula, Mexico, massive amounts of soil CORG up to 2792 Mg CORG ha−1 were measured [9]. In 3.5 m cores taken from Trat, Thailand, soil stocks up to 962 Mg CORG ha−1 were measured [10] with no significant change in concentration over the depth profile. Over the upper 2 m in mangrove soils in Gabon, CORG inventories ranged from 618 to 707 Mg CORG ha−1 [11] although there was a clear decline in concentrations with increasing depth. Thus, it is reasonable to conjecture that a more realistic contribution of soil CORG to the total ecosystem CORG stocks may be as high as about 80%. These large amounts of CORG reflect rapid rates of soil accumulation on the forest floor, sustained accumulation over long time periods, and high rates of primary productivity. In contrast, global mean aboveground and belowground mangrove biomass average 105.8 ± 4.2 Mg CORG ha−1 (±1 SE) and 68 Mg CORG ha−1, respectively, as updated from Alongi [8] with new data [9,10,11,12,13,14,15,16,17,18,19,20,21,22,23,24,25,26,27,28], which underscores the dominance of the soil component.
Using the median of 627.8 Mg CORG ha−1 and the most used estimates of global mangrove areas of 83,495 [29] and 137,760 km2 [30], we derive a range of global stock estimates for mangroves of 5.23–8.63 Pg CORG which is much greater than for salt marshes (1.74 Pg CORG) and seagrass meadows (2.61 Pg CORG) and equivalent to 15%–24% of the global mean CORG stocks in the tropical coastal ocean [8]. Regionally, total ecosystem CORG stocks are, on average, greatest on the Pacific Islands and in Southeast Asia, followed by Central and North America and the Caribbean, and in Africa and lowest in the Middle East and in parts of South and East Asia (Table 1). As there are very wide variations within and between individual locations, countries, and regions, the best generalization that can be made is that mangrove CORG stocks tend to be greater in the wet tropics with lower stocks in the dry tropics and in subtropical and warm temperate areas. This conclusion is unsurprising given that 86% of observed variability in mangrove CORG stocks is associated with the best predictor, annual rainfall [31].
2.2. Carbon Burial Rates
Rates of carbon sequestration in mangrove forests average 183.6 g CORG m−2 a−1 (1 SE = 14.7 g CORG m−2 a−1) with a median of 114.8 g CORG m−2 a−1 and a very wide range from 0.001 to 1722.2 g CORG m−2 a−1 (data in Alongi [8] updated with additional refs. [9,28,32,33,34,35,36,37,38,39,40]). More than half of all measurements were <100 g CORG m−2 a−1 with the highest rates observed in degraded or heavily impacted, disturbed forests and catchments such as in China, South and Southeast Asia, and Africa. Multiplying the median by both low and high estimates of mangrove area [29,30], carbon burial in the world’s mangrove forests equates to 9.6–15.8 Tg CORG a−1 which is several times greater than for the tropical coastal ocean (3.9 Tg CORG a−1), slightly greater than for salt marshes (11.7 Tg CORG a−1) but less than in seagrass meadows (35.3 Tg CORG a−1) [8]. The wide variability in CORG burial rates reflects large differences in forests of different ages, types, and locations; rates are more likely to be a function of multiple interrelated drivers such as geomorphology, tidal inundation frequency, forest age, species composition, storms, tidal prism, soil grain size, and oceanic, riverine, and anthropogenic inputs, as sequestration rates exhibited no significant relationship with latitude [41]. Further, in many tropical river deltas, sediment deposition and subsequent CORG accumulation and burial in mangroves are often highly dynamic with episodes of sediment starvation due to damming and episodes of massive bedload transport and deposition that smother mangroves, as found in the Mekong delta [32,42].
2.3. Carbon Mass Balance Dynamics
Using data reviewed in Alongi [43,44], a mass balance of carbon flow through an idealized mangrove forest (Table 2) shows that about 63% of gross primary production GPP) is released as canopy respiration. Of net primary production (13.2 Mg C ha−1 a−1), nearly equal amounts are vested in wood (3.71 Mg C ha−1 a−1), litter (4.28 Mg C ha−1 a−1), and root (5.21 Mg C ha−1 a−1) production [43,44].
Grand mean inputs and outputs are in overall balance (inputs-outputs ≈ 1 Mg C ha−1 a−1), considering the large variability in individual measurements among forests and estuaries in different locations with different geomorphological histories. Undoubtedly, allochthonous inputs from the sea and catchment also play an important, if unqualified, role in mangrove carbon dynamics considering that analysis of the origin of mangrove soil organic matter indicates that about 42% of OM may be derived from external sources [45,46]. Thus, it is likely that some mangrove ecosystems will not be in metabolic balance with some systems being net importers and others being net exporters of carbon.
The two main inputs were mangrove forest primary production and net DIC production in mangrove soils to a depth of 1 m. The latter is not usually considered in carbon mass balance estimates, but evidence suggests that centuries-old, sequestered carbon is still susceptible to remineralization and tidal DOC and DIC export [47], supporting the idea that organic carbon deposited prior to mangrove colonization continues to be decomposed as all mangroves colonize intertidal flats that have considerable stores of CORG [1]. This idea is supported by the fact that radiocarbon dating of mangrove soil profiles of the upper 1–3 m [32,34,38,39,40] indicate subsurface mangrove deposits that are centuries-old, and certainly older that the existing mangrove vegetation. Another unqualified pathway is groundwater which can in many locations provide significant quantities of carbon- and nutrient-rich subsurface water [6].
Second to canopy respiration as a significant carbon loss is DIC + DOC export (Table 2), as nearly all carbon respired within the entire soil horizon is released in dissolved form via advective porewater exchange and/or lateral transport and subsurface tidal pumping to adjacent tidal waters. This large export term contributes nearly 60% of DIC and 27% of DOC discharge to the tropical coastal ocean [43]. Mangroves inhabit only 0.3% of the global ocean coastal area but contribute 55% of air–sea exchange, 14% of CORG burial, 28% of DIC export, and 13% of DOC + POC export from the world’s coastal wetlands and estuaries to the atmosphere and global coastal ocean [43].
3. Climate Change Impacts
The carbon mass balance is only a work in progress, but instructive in identifying the main carbon pathways that, if affected by climate change, will significantly alter the future of the world’s mangrove forests:
- Mangrove primary production and canopy respiration.
- Soil CORG accumulation and burial.
- Forest–coastal water exchange of dissolved carbon.
- Carbon processes within the soil horizon.
Coastal acidification is not considered here as mangroves are likely to be highly resilient due to the naturally highly variable salinity (range: 0.1–4.8), pH (range: 4–9), and pCO2 (range: 4–32,763 μatm) of tidal waters that are a strong source of CO2 emissions to the atmosphere due to pCO2 and [CO32−] oversaturation. The ordinarily low pH of mangrove soil (range: 4–7) as well as subsurface transport of groundwater derived from acidic soils also plays a role in maintaining acidic conditions [6]. Oversaturation and highly variable pH are the net result of high rates of bacterial respiration, eutrophication, and the influence of fluvial discharge, including export of alkalinity, organic matter and DIC, deposition of anthropogenic acids and bases, intense weathering, land-use change, and acid sulphate soil discharge. These chemical factors predispose mangroves to resilience to acidification. In fact, mangroves are apparent buffers of acidification in the tropical coastal zone as DIC and alkalinity exports create a measurable increase in pH indicating that mangroves partly counteract acidification in adjacent coastal waters.
Similarly, increasing hypoxia in tropical coastal waters is unlikely to impact blue carbon in mangroves, considering that they are naturally subject to hypoxia and large tidal variations in dissolved oxygen levels for intermittent periods and have various mechanisms to cope with and mediate low dissolved oxygen levels. Some plants and animals can, to a considerable extent, counteract hypoxia.
3.1. Sea-Level Rise (SLR)
Rising sea-level due to warming seas and melting ice is arguably the main factor determining the survival of mangrove forests, considering their intertidal existence [48]. Global sea-level (GMSL) increased 0.2 m over the 1901–2018 period at a rate of 1.7 mm a−1 with an accelerated rate of 3.7 mm a−1 over 2006–2018 with increased GMSL beyond 2300 [49]. The paleoenvironmental record indicates that over millennial timescales, mangroves have been exposed to different sea-level trajectories, showing a broad capacity to adjust to sea-level variations, as sediment supply, organic matter sequestration, and belowground root growth show considerable natural resilience in response to SLR [50]. Four main factors facilitate mangrove resistance and resilience to SLR: (1) the rate of sea-level change relative to the mangrove soil surface, (2) species composition, (3) the physiographic setting, including the slope of the forest relative to that of the land the mangroves currently occupy, and (4) the presence/absence of obstacles to landward migration [51].
An analysis of mangrove accretion versus local mean SLR [52] found that the threshold accretion rate between survival and drowning was 6 mm a−1. Between 9800 and 7500 years ago, mangroves expanded at a rate driven mainly by the rate of relative SLR, but it was highly likely (90% probability) that they were unable to sustain accretion when relative SLR exceeded 6.1 mm a−1 [53]. Accepting that rates of SLR greater than 6 mm a−1 represent a critical threshold for mangrove survival, a comparison with a recent IPCC analysis (Table 3) of predicted rates of SLR under five CO2 emissions scenarios and five different temperature rise scenarios during the 2040–2060 and 2080–2100 periods [49], infers that mangroves will likely survive in future with declining (−10 to −15 Gt CO2 a−1) CO2 emissions and/or global surface air temperature rises of 1.5–2.0 °C (Table 3).
The impact of submergence due to SLR on mangrove carbon stocks and fluxes will likely be profound. Once available nutrients and oxygen are exhausted and trees are dead, there will be an increase in peat deposits which will result in a net increase in carbon burial of large amounts of dissolved and particulate carbon. Export of forest litter to the adjacent rising sea will be initially large as the dying aboveground biomass decomposes; initial necromass will decompose and release CO2 and CH4 to the atmosphere and tidal water. Labile soil carbon will still be mineralized until nutrients are exhausted. As trees are killed by submergence, live belowground roots will also begin to decompose slowly, leading to soil/peat collapse just below the root zone.
Mangroves that survive SLR will expand and accumulate carbon as SLR will not necessarily lead to blue carbon loss. Encroachment up the intertidal zone (assuming available space) will allow mangroves to build soil surface elevations vertically via soil accumulation, root growth, litter and woody debris accumulation, and microbial and faunal development [4] resulting in long-term soil carbon accumulation. (Sufficient available space for mangrove encroachment landward due to low human population densities is called ‘low coastal squeeze’ whereas insufficient colonization space with SLR due to dense populations is called ‘high coastal squeeze’).
Paleorecords indicate continuous peat development throughout the Holocene in some locales where SLR rates were <5 mm a−1 and peat accumulation of up to 10 m on some carbonate islands [54]. Mangrove peat formation is a complex process, including being built up by root growth stimulated by the emergence of vertical space created by rising coastal waters [4]. Over time, the peat expands vertically as root growth occurs in low oxygen zones that reduce decomposition below the new root zone layer, resulting in carbon accumulation.
Warm temperatures and SLR are driving latitudinal expansion of mangroves into salt marsh habitat in subtropical and tropical areas. Studies have indicated that the invasion of mangroves into previously dominated marsh habitat has resulted in greater soil carbon concentrations and blue carbon accumulation in the newly colonized mangroves [55,56]. Further, on the American east coast slowly rising seas since the mid-Holocene promoted 2–4 times greater soil carbon stocks in mangroves in America than in Australia where sea-level fall resulted in sufficient time for carbon to exit the ecosystem through decomposition and tidal export pathways [56].
These forecasts of course ignore the reality of high spatial and temporal variability in SLR and subsequent mangrove responses, even at the local scale, which will have large implications for mangrove survival and carbon cycling. A good example is an examination of mangrove species’ responses to SLR across the island of Pohnpei, Federated States of Micronesia [57]. A modeling study was conducted using empirical data of soil elevation, accretion rates, forest inventories, water-level monitoring, and differential leveling elevation surveys, to identify which regions and mangrove communities are most vulnerable to SLR. Responses of mean elevation and community composition were analyzed under four SLR scenarios (37, 52, 67, or 117 cm by 2100). The model projected mangrove survival relative to the 37 and 52 cm scenarios with limited relative increases in more flood-tolerant species through 2060. The most flood-tolerant species, Sonneratia alba and Rhizophora stylosa, will increase in relative dominance for 30–40 years before declining, whereas Bruguiera gymnorrhiza, Xylocarpus granatum, and Rhizophora apiculata will in most scenarios decline [57]. Given known species differences in carbon balance and metabolism, and soil carbon concentrations and rates of carbon cycling [6], such changes presage significant differences in mangrove carbon dynamics with SLR.
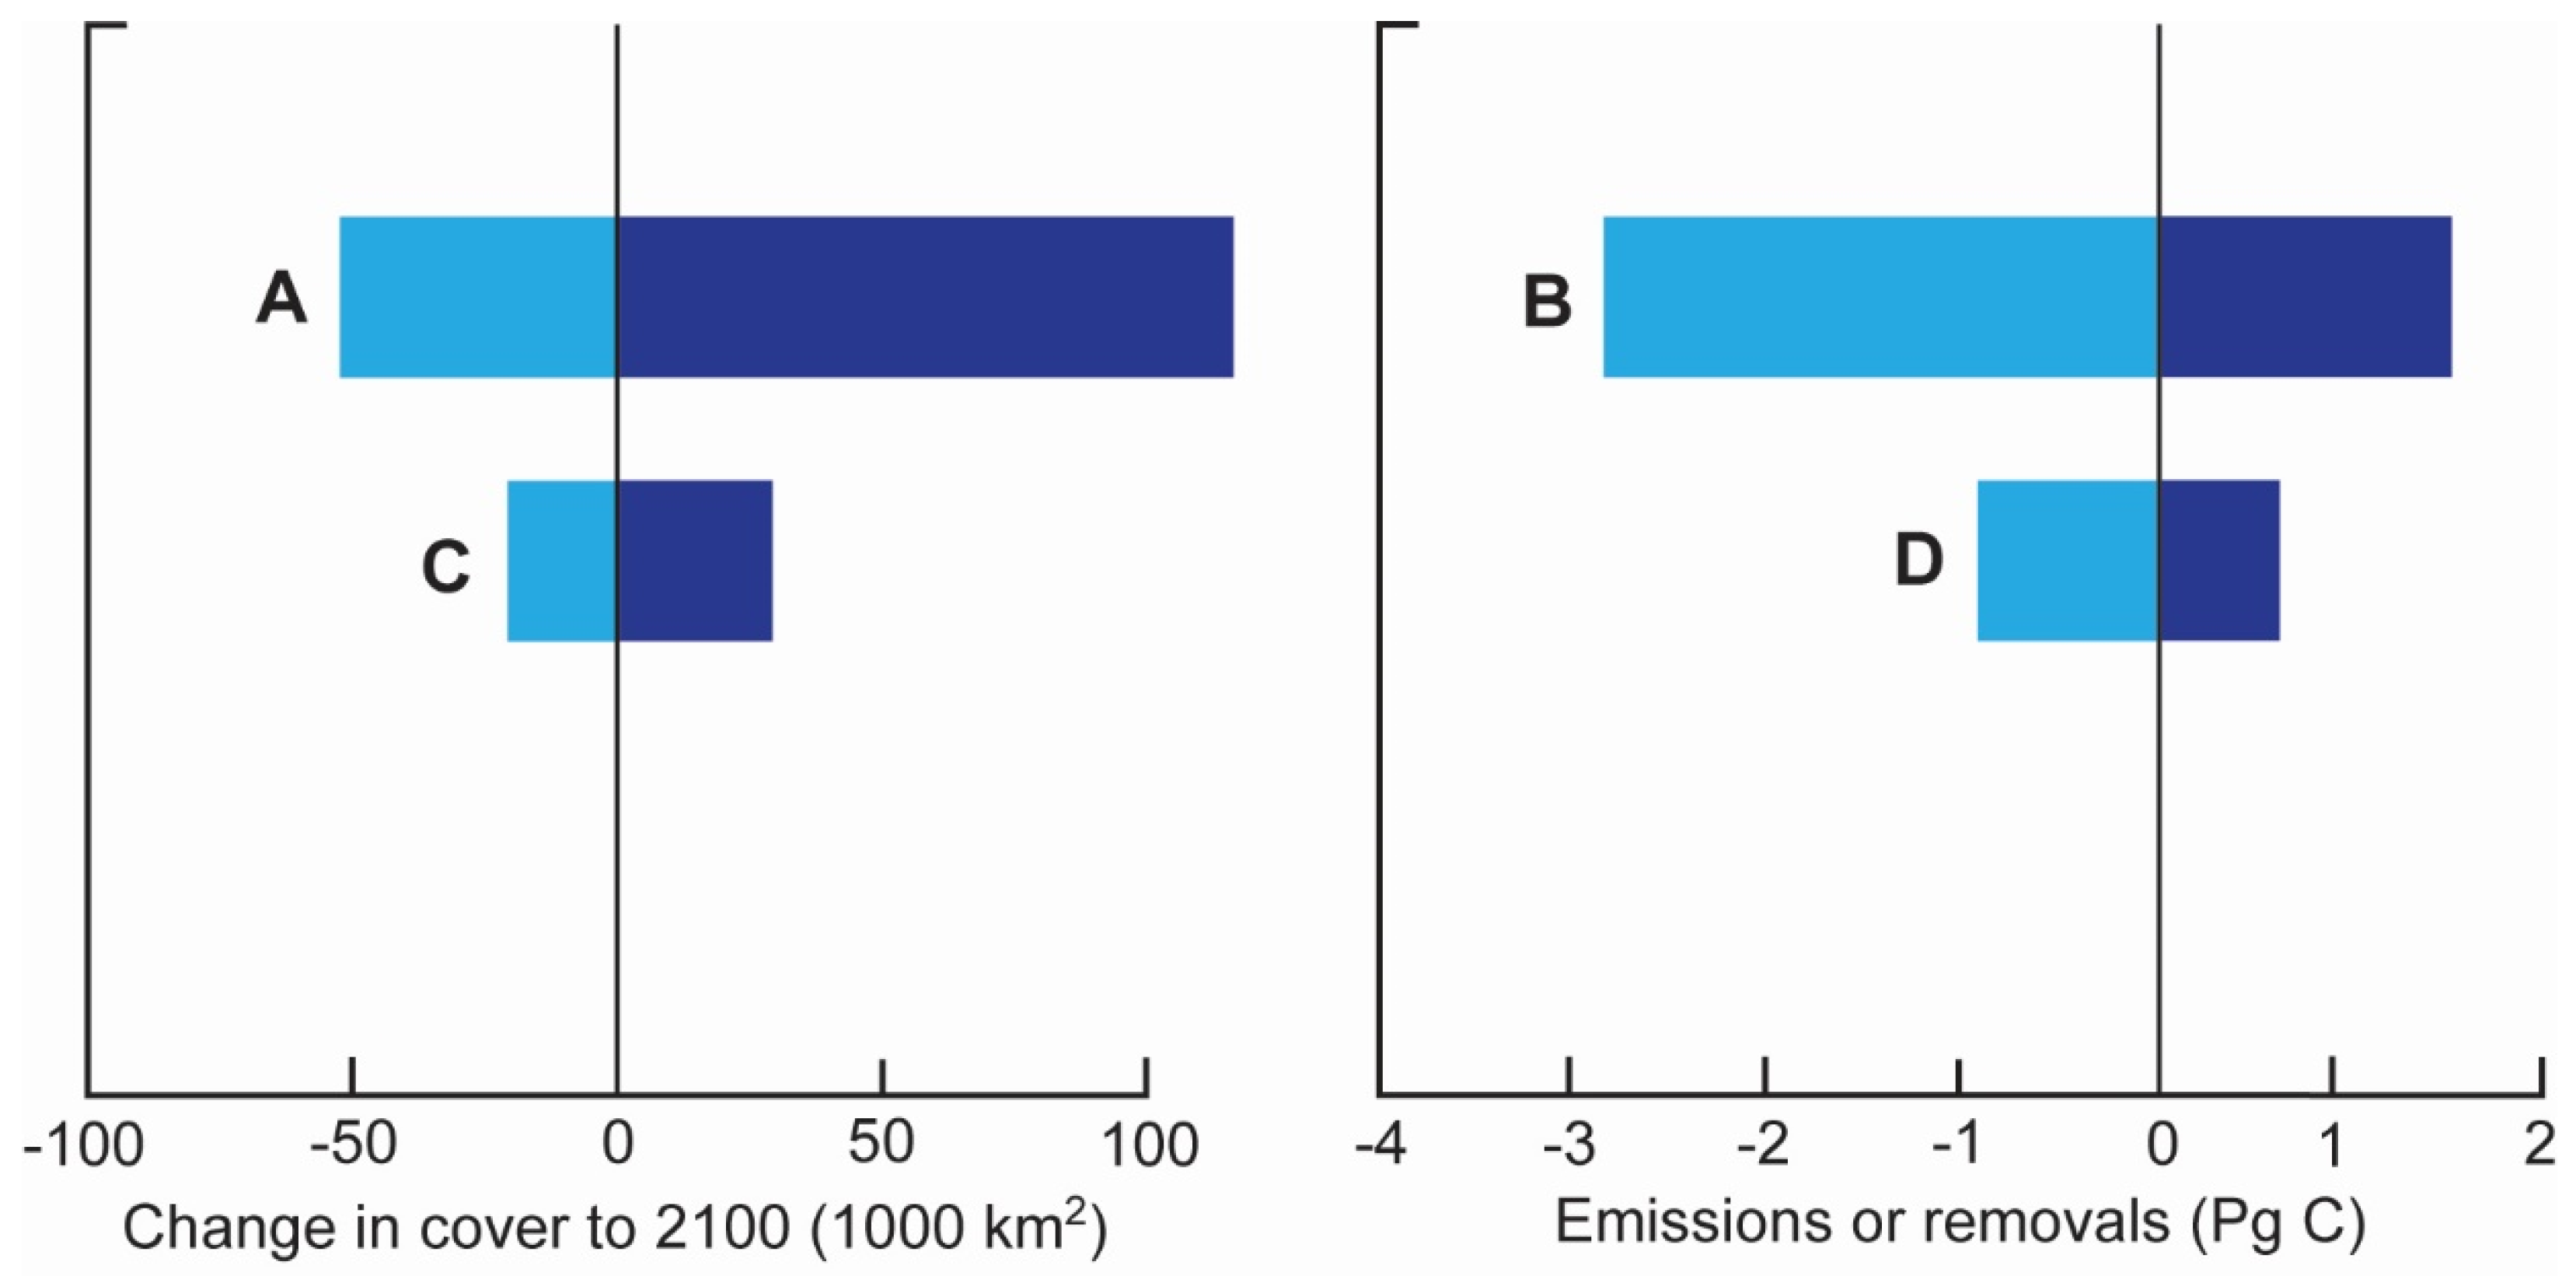
Both the rate of CO2 emissions and the level of accommodation space has been used to measure the impact of SLR on mangrove blue carbon stocks and emissions [58]. Using projected changes in global mangrove areas, global mean carbon stocks and rates of carbon sequestration, the RCP8.5 scenario, where SLR by 2100 is projected between 0.5 and 1.0 m, could result in net gains in blue carbon on the order of 1.5 Pg C to 2100 (Figure 1A), but only under low ‘coastal squeeze’. Low ‘coastal squeeze’ is a high adaptation scenario where mangroves can occupy available space when population density thresholds are between 150 and 300 people km−2 (called P300). Under a high ‘coastal squeeze’ scenario (low adaptation scenario where landward migration is prevented as population densities exceed a threshold of 5–20 people km−2 (called P5)), losses of mangrove blue carbon are expected, resulting in CO2 emissions in the range of 3.4 Pg C to 2100 (Figure 1B). For the RCP4.5 scenario where sea-level is forecast to rise by 0.4–0.7 m by 2100, global gains and losses in mangrove blue carbon stocks will likely be much less at ≈−0.3–0.5 Pg C (Figure 1C) with CO2 emissions of 1.1 Pg under high ‘coastal squeeze’ (Figure 1D).
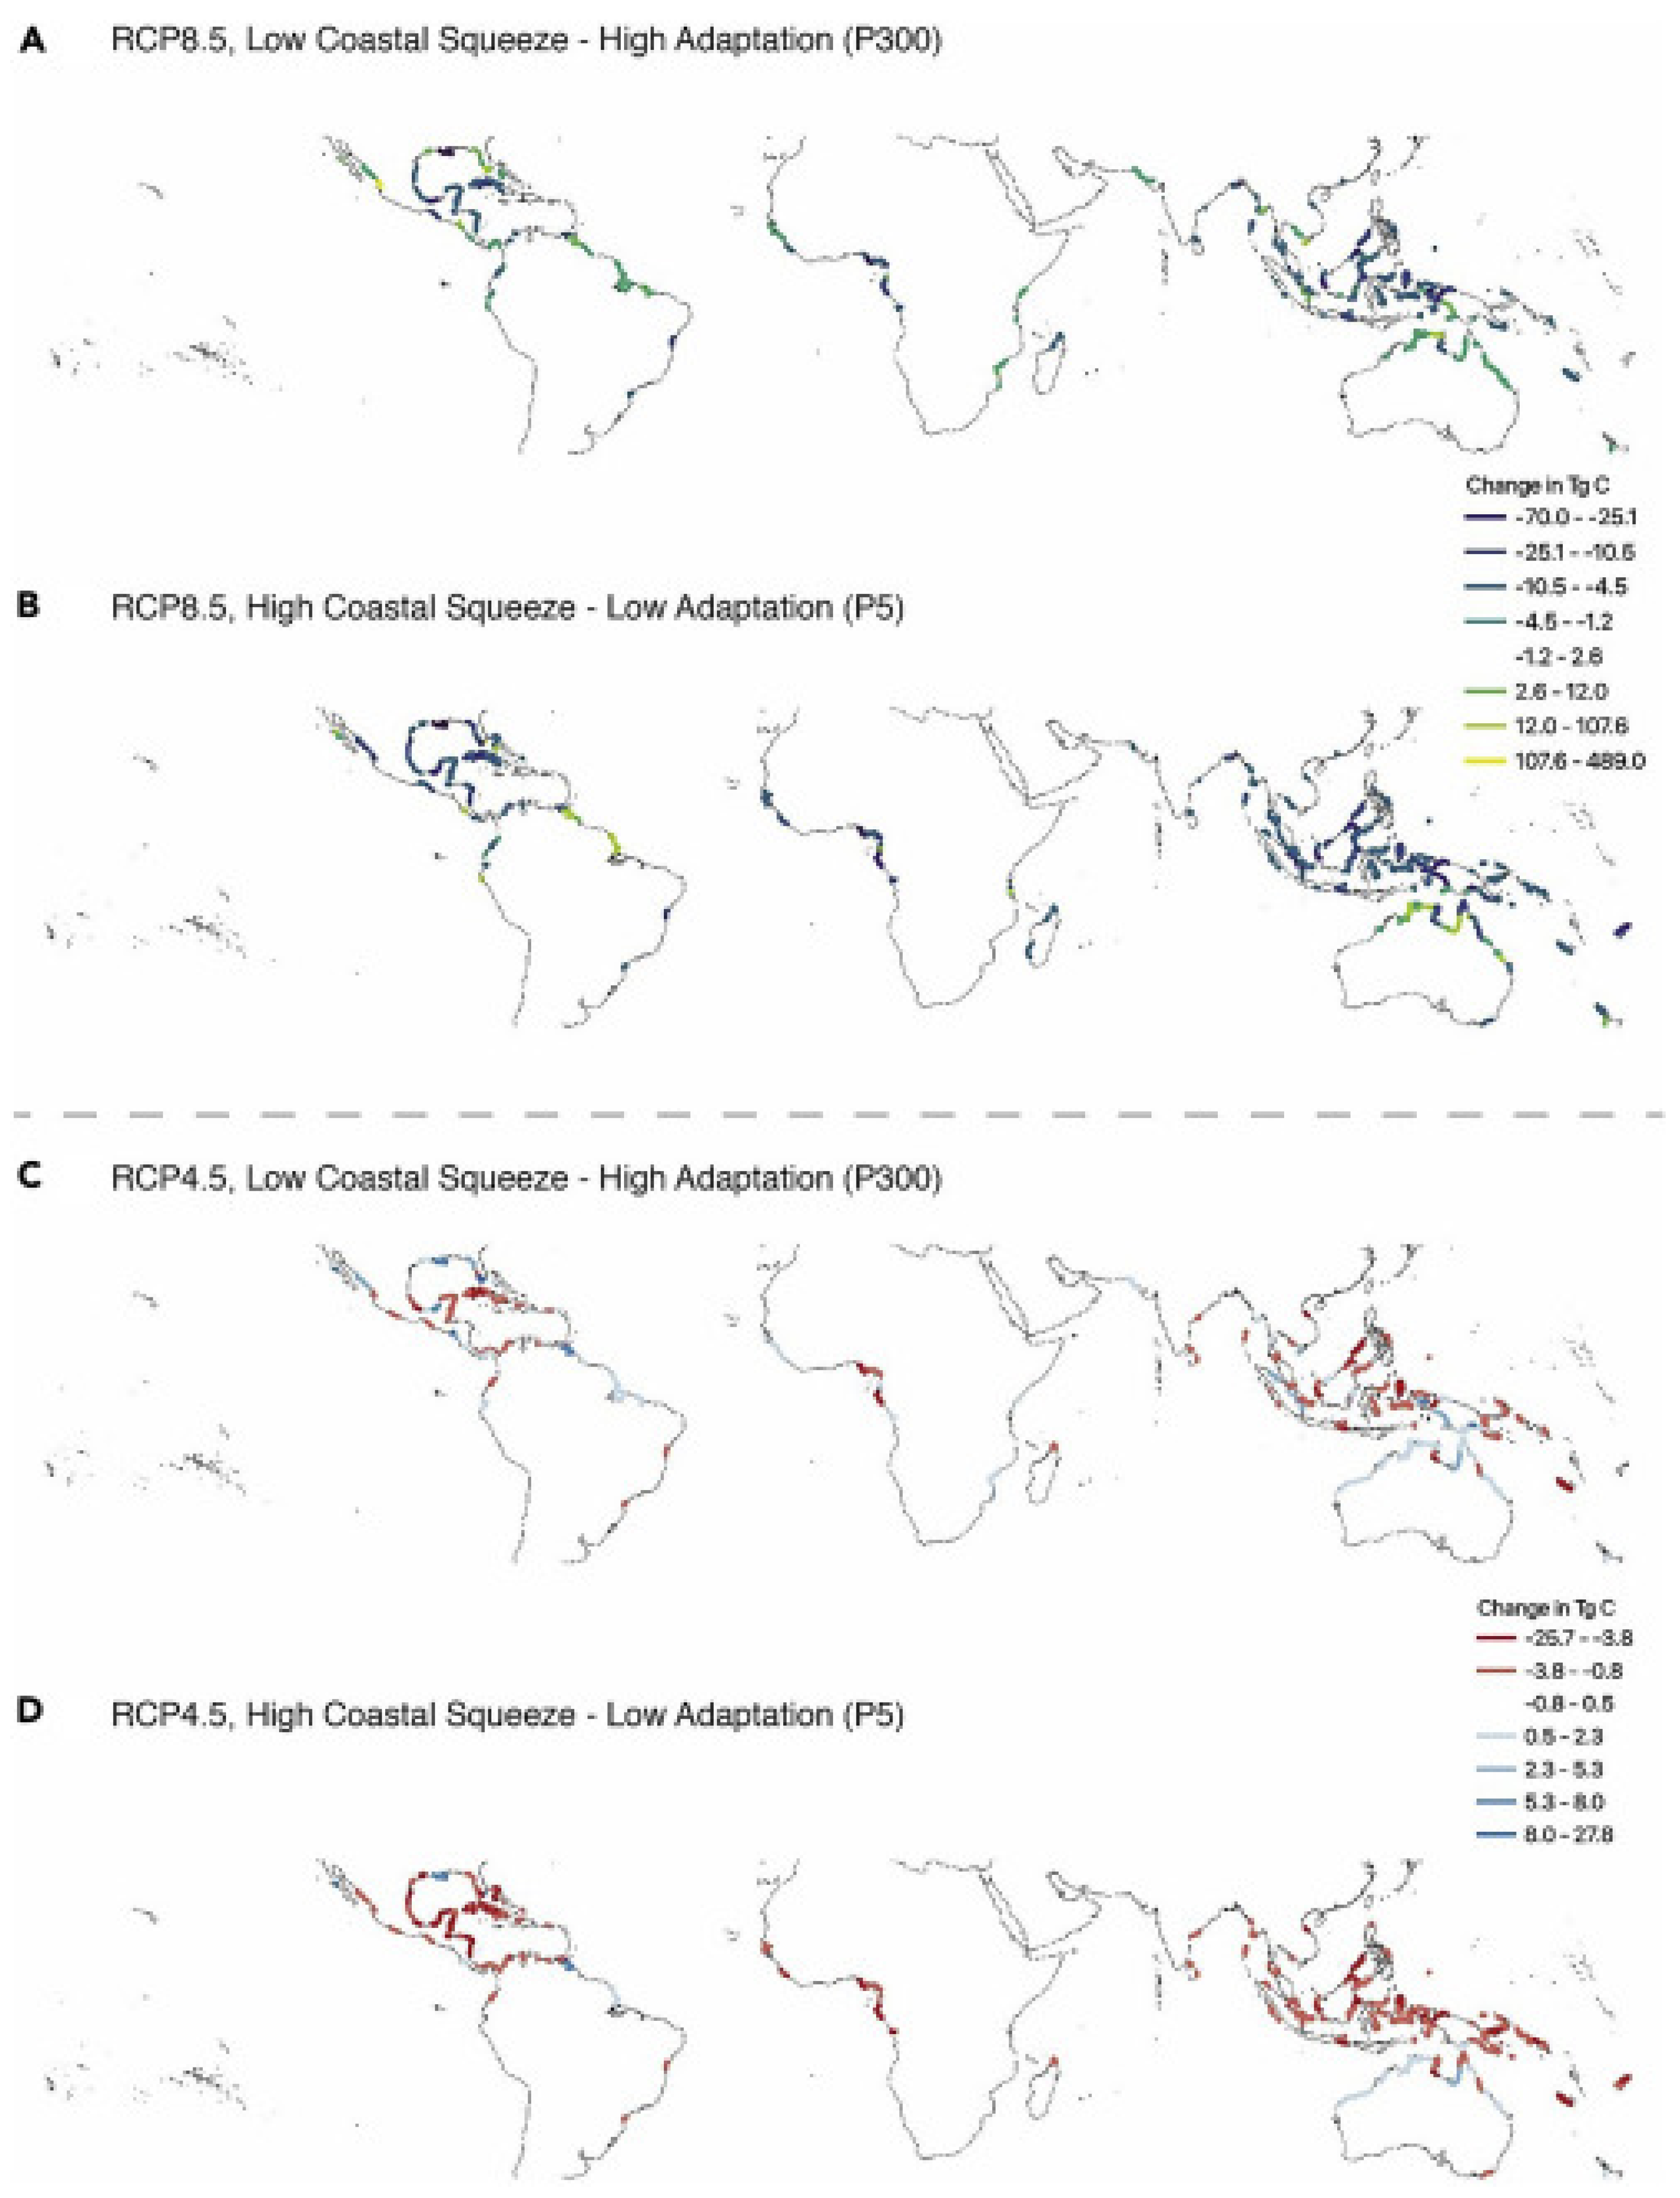
Under the four modeled scenarios (RCP8.5 and RCP4.5) at both low (P300) and high (P5) ‘coastal squeeze’, Lovelock and Reef [58] found that the influence of SLR on mangrove blue carbon stocks was variable between the SLR and coastal squeeze scenarios (Figure 2). Both gains and losses of mangrove area occur in different regions and nations for net change in carbon stocks in all scenarios. For RCP8.5 in low and high coastal squeeze scenarios (Figure 2A,B), Australia, Mexico, and the United States have highest potential for soil carbon accumulation, while Indonesia has the potential for the highest CO2 emissions in both coastal squeeze scenarios. For RCP4.5, gains in mangrove carbon stocks and emissions are much lower (Figure 2C,D) than in the RCP8.5 scenario because tidal inundation is limited, although many of the same countries are in the top 10 for both gains and losses. For RCP8.5, the 10 countries with the highest probability to protect blue carbon if coastal squeeze is minimized are Mexico, Indonesia, United States, Nigeria, Cuba, Mozambique, Fiji, Nicaragua, Malaysia, and Senegal, while the greatest negative effect is on island nations, especially in Oceania. The countries most vulnerable to blue carbon losses include Indonesia, Nigeria, Cuba, United States, Malaysia, Mexico, Australia, Philippines, Cameroon, and Papua New Guinea. Globally, blue carbon gains and losses may be huge, on the order of −70–489 Tg C under RCP8.5 and −27–28 Tg C under RCP4.5 (Figure 2).
3.2. Rising Temperatures, Increased Storms, Extreme Weather Events, and Precipitation Changes
During 2011–2020, the increase in global surface temperature (GST) since 1850–1900 was 1.09 (range: 0.95–1.20) °C with a further likely 1.5 °C increase during 2021–2400 and a very likely crossing of the 2 °C threshold during the 2040–2060 period. Over the 2081–2100 period, average GST is very likely to be higher by 1.0–1.8 °C in the low CO2 emissions scenario and by 3.3–5.7 °C in the high emissions scenario [49]. By 2300, GST will be in the range of 0.9–9.6 °C higher depending on the rate of CO2 emissions. Similarly, global mean sea surface temperatures (SST) have increased 0.88 °C (range: 0.68–1.01) since 1900 and are projected to increase by 0.86 °C (0.43–1.47 °C) and by 2.89 °C (2.01–4.07 °C) by 2100 under low and high rates of CO2 emissions, respectively.
Considering the projected rises in air and sea temperatures, mangroves will respond in most cases positively up to a critical threshold. Warmer temperatures affect mangroves by (1) altering species composition, (2) changing physiological patterns, (3) increasing primary production and ecosystem respiration at least up to critical thresholds, and (4) expanding species ranges to higher latitudes where range is temperature-limited but not limited by other factors [52]. Rises in temperature may also result in decreased survival in arid and increasingly arid regions, (2) increase water vapor deficit, (3) increased secondary production, and (4) shifts in species dominance and biodiversity. Rates of leaf photosynthesis peak for most species at or below a daily mean of 30 °C and leaf CO2 assimilation rates of many species decline as temperatures increase from 33 to 35 °C [6]. It is therefore likely that with small temperature increases (daily mean of <35 °C), mangroves will produce more carbon via higher primary production, although metabolic balance (P versus R) is likely to shift in favor of net heterotrophy (P:R ≤ 1) with rising temperatures. Data from Chinese mangrove forests over long stretches of time indicate that warming during the past 600 years has resulted in a decline in forest development, suggesting that the rise in temperature during the Anthropocene has been too rapid to accommodate a positive mangrove response [59].
Losses of blue carbon due to temperatures above the critical threshold may be compensated by the continuing expansion of mangroves into higher latitudes in the Gulf of Mexico, Florida, New Zealand, Australia, southern China, and southern Africa, with air temperature and rainfall best explaining this range expansion [60]. Obviously, new mangroves will result in an increase in biomass and soil carbon although the latter depends on freshwater availability, soil moisture, hydrologic regime, salt marsh, and mangrove species and productivity as well-developed soils already exist prior to replacement by larger mangrove forests [61]. In many locations where mangroves are replacing less productive or marginal salt marshes, especially in arid areas, there are large increases in soil carbon stocks with mangrove invasion although it may take time for significant development of mangrove soil carbon stocks [62]. Differences in carbon fluxes between salt marshes and invading mangroves is poorly understood with studies indicating variable results across the ecotone [63,64].
While mangrove encroachment into salt marshes appears to be driven primarily by increasing temperatures and reduced frequency of extreme cold events, changes in precipitation patterns and increasing frequency of storms cannot be ruled out as co-factors. Increased temperatures have affected the frequency and intensity of extreme weather events, such as droughts, storms, and cyclones [65]. The increased occurrence of such events is having a dramatic impact on mangroves, especially more frequent episodes of mass mortality [66,67,68,69,70,71]. The best example of such occurrences is the massive dieback of mangroves in the Gulf of Carpentaria, Australia, where 6–10% of the forests died back along 1000 km of coastline during summer 2015–2016 [66]. The onset of the dieback is coincident with unprecedented high temperatures, low rainfall, and the lack of a normal monsoon. Contributing to the mass mortality was an unusually lengthy severe drought coupled with a temporary drop in sea level associated with the 2015–2016 El Niño [67]. The dieback had severe consequences for ecosystem functioning and structure, including blue carbon stocks and cycling [68,69,70]. Mass mortality of mangroves in the Gulf of Carpentaria resulted in a decline in export of carbon and alkalinity to the adjacent coastal ocean [68], large losses of carbon stock [69], and a weakening of greenhouse gas cycling with a lowering of both source/sink cycles in dry years [70].
The effects of cyclones are similar in terms of mangrove carbon cycling as impacts include broken trees, canopy gaps, large amounts of downed woody debris, and irregular surface soil distributions with alternating areas of smothering and scouring of the forest floor as well as greater soil anoxia [71]. Krauss and Osland [71] estimated that forest mortality due to cyclone damage globally averages 40% (range: 13–67%). In the Florida Everglades where mangroves are frequently damaged by cyclones, carbon losses (soil plus biomass) can be severe [72]. Furthermore, short-statured forests often develop in cyclone-prone areas, which translates in more resilient stands but with reduced aboveground biomass carbon stocks [73]. Assuming no peat collapse, soil carbon stock losses will likely be less than biomass losses [74]. Although recovery is often rapid post-cyclone, such carbon increases must be counterbalanced against the cyclone losses.
Rainfall patterns in the subtropics and tropics are changing, with weaker monsoons but more frequent and intense rainfall in parts of Africa, south Asia, and Southeast Asia [52]. High rainfall ordinarily leads to more luxuriant and productive mangroves and thus more blue carbon as, globally, mangrove canopy height is closely linked to rainfall as well as temperature and cyclone frequency [73]. The opposite of course is true as arid-zone mangroves are expected receive less rainfall [52]. Rainfall thresholds have been identified for mangrove range limits in western North America, western Gulf of Mexico, western South America, Western Australia, the Middle East, northwest Africa, east central Africa, and west central Africa [75].
3.3. Rising Atmospheric CO2
Mean atmospheric CO2 concentrations have increased from 326 ppm to 416 mm over the past 50 years and are still rising [49]. Elevated CO2 levels enhance mangrove photosynthesis, growth, respiration, and leaf chlorophyll concentrations with responses being species-specific and complex due to interactive effects with other drivers, namely salinity, temperature, nutrient availability, and water-use efficiency [9,52]. Most mangrove species will respond positively to increasing CO2 concentrations, but some species will respond negatively or will exhibit no or little change. For instance, growth of Avicennia germinans seedlings in greenhouse experiments was enhanced only under elevated CO2 and high nutrient conditions, but root growth doubled under low nutrient and elevated CO2 conditions [76]. Other species similarly exhibit complex responses when subjected to elevated CO2 concentrations with different amounts or rates of other physicochemical factors. For example, when subjected to ambient CO2 and a temperature of 38 °C, Rhizophora apiculata seedlings responded positively to the higher temperature but elevated CO2 enhanced growth only at a lower temperature; under high temperature and elevated CO2, the seedlings nearly died [77].
Confounding responses to elevated CO2 when subjected to co-drivers have been observed in other species such as A. marina, R. stylosa, Kandelia obovata, and Aegiceras corniculatum [78,79,80]. Net photosynthetic rates and water-use efficiency of A. marina and R. stylosa increased when grown under elevated (800 ppm) CO2 and increasing tidal flooding to simulate sea-level rise [78], but these gains were minimal under prolonged flooding conditions. Growth of A. corniculatum and A. marina seedlings within a model salt marsh community under increasing CO2 and low salinity resulted in both mangrove species outcompeting the salt marsh plants, with A. marina producing 48% more biomass (and thus more carbon) under elevated CO2 [79]. However, A. corniculatum was unaffected by higher CO2 but had 36% more growth than the salt marsh plants when grown under full seawater. Increased CO2 can alter species composition and carbon metabolism of the root microbiome [80]. Leaf chlorophyll levels of K. obovata and microbial root biomass increased over 20 weeks with elevated CO2 with a shift in composition of ammonia-oxidizing archaea. There was also a shift in carbon metabolism with a shift in carbon utilization from sugars, amino acids, and carboxylic acids under ambient conditions to use of additional substrates in the order of amino acids > carbohydrates > polymers > carboxylic acids > amines > phenolic acids [80]. In summary, while elevated CO2 in isolation results in increased carbon stocks and cycling in mangroves, the future reality is that other changes in climate must be considered important co-factors (e.g., SLR, rising temperatures) that are likely to alter the outcome of a positive mangrove response and make predictions concerning blue carbon more difficult; a case-by-case basis may be considered a viable solution.
4. Predictions
The impacts of climate change on blue carbon stocks and cycling in mangrove forests are not readily clear cut. While increasing temperatures and CO2 concentrations lead separately to increased carbon production in one-factor experiments, factorial studies indicate complex responses depending on interactive effects between salinity, temperature, and CO2 levels as well as species-specificity. Despite these caveats, increased anthropogenic CO2 emissions can in principle affect the health of mangrove forests (Table 4).
Other factors that will determine whether mangrove carbon stocks and cycling will respond positively, negatively, or not at all, include local geomorphology and weather, species composition, soil type and origin, nutrient availability, and forest age. It is clear from current data and models, however, that large blue carbon losses and gains will likely occur in mangrove forests under various aspects of climate change. Further studies will no doubt discover other interacting drivers of mangrove change.
Funding
This research received no external funding.
Data Availability Statement
Data in this paper originate from the referenced publications.
Conflicts of Interest
The author declares no conflict of interest.
References
- Alongi, D.M. Mangroves. In Encyclopedia of Estuaries; Kennish, M., Ed.; Springer: Berlin, Germany, 2016; pp. 393–404. [Google Scholar]
- Feller, I.C.; Lovelock, C.E.; Berger, U.; McKee, K.L.; Joye, S.B.; Ball, M.C. Biocomplexity in mangrove ecosystems. Annu. Rev. Mar. Sci. 2010, 2, 395–417. [Google Scholar] [CrossRef] [PubMed] [Green Version]
- Alongi, D.M. Blue Carbon: Carbon Sequestration for Climate Change Mitigation; Springer Nature: Cham, Switzerland, 2018. [Google Scholar]
- Friess, D.; Krauss, K.W.; Taillardat, P.; Adame, M.F.; Yando, E.S.; Cameron, C.; Sasmito, S.D.; Sillanpää, M. Mangrove blue carbon in the face of climate change, and restoration. Annu. Plant Rev. 2020, 3, 427–456. [Google Scholar]
- Jennerjahn, T.C.; Gilman, E.; Krauss, K.W.; Lacerda, L.D.; Nordhaus, I.; Wolanski, E. Mangrove ecosystems under climate change. In Mangrove Ecosystems: A Global Biogeographic Perspective; Rivera-Monroy, V.H., Lee, S.Y., Kristensen, E., Twilley, R.R., Eds.; Springer Nature: Cham, Switzerland, 2017; pp. 211–244. [Google Scholar]
- Alongi, D.M. The Energetics of Mangrove Forests; Springer: Dordrecht, The Netherlands, 2009. [Google Scholar]
- Alongi, D.M.; Mukhopadhyay, S.K. Contribution of mangroves to coastal carbon cycling in low latitude seas. Agric. For. Meteorol. 2015, 213, 266–272. [Google Scholar] [CrossRef]
- Alongi, D.M. Global significance of mangrove blue carbon in climate change mitigation. Science 2020, 2, 67. [Google Scholar] [CrossRef]
- Adame, M.F.; Santini, N.S.; Torres-Talamante, O.; Rogers, K. Mangrove sinkholes (cenotes) of the Yucatan Peninsula, a global hotspot of carbon sequestration. Biol. Lett. 2021, 17, 20210037. [Google Scholar] [CrossRef] [PubMed]
- Kida, M.; Watanabe, I.; Kinjo, K.; Kondo, M.; Yoshitake, S.; Tomotsune, M.; Iimura, Y.; Umnouysin, S.; Suchewaboripont, V.; Poungparn, S.; et al. Organic carbon stock and composition in 3.5-m core mangrove soils (Trat, Thailand). Sci. Tot. Environ. 2021, 801, 149682. [Google Scholar] [CrossRef] [PubMed]
- Trettin, C.C.; Dai, Z.; Tang, W.; Lagomasino, D.; Thomas, N.; Lee, S.K.; Simard, M.; Ebanega, M.O.; Stoval, A.; Fatoyinbo, T.E. Mangrove carbon stocks in Pongara National Park, Gabon. Estuar. Coast. Shelf Sci. 2021, 259, 107432. [Google Scholar] [CrossRef]
- Stringer, C.E.; Trettin, C.C.; Zarnoch, S.J.; Tang, W. Carbon stocks of mangroves within the Zambezi River Delta, Mozambique. For. Ecol. Manage. 2015, 354, 139–148. [Google Scholar] [CrossRef]
- Johnson, J.L.; Raw, J.L.; Adams, J.B. First report on carbon storage in a warm-temperate mangrove forest in South Africa. Estuar. Coast. Shelf Sci. 2020, 235, 106566. [Google Scholar] [CrossRef]
- Bai, J.; Meng, Y.; Gou, R.; Lyu, J.; Dai, Z.; Diao, X.; Zhang, H.; Luo, Y.; Zhu, X.; Lin, G. Mangrove diversity enhances plant biomass production and carbon storage in Hainan Island, China. Funct. Ecol. 2021, 35, 774–786. [Google Scholar] [CrossRef]
- Ragavan, P.; Kumar, S.; Kathiresan, k.; Mohan, P.M.; Jayaraj, R.S.C.; Ravichandaran, K.; Rana, T.S. Biomass and vegetation carbon stock in mangrove forests of the Andaman Islands, India. Hydrobiologia 2021, 848, 4673–4693. [Google Scholar] [CrossRef]
- Chatting, M.; LeVay, L.; Walton, M.; Skov, M.W.; Kennedy, H.; Wilson, S.; Al-Maslamani, I. Mangrove carbon stocks and biomass partitioning in an extreme environment. Estuar. Coast. Shelf Sci. 2020, 244, 106940. [Google Scholar] [CrossRef]
- Cooray, P.L.I.G.M.; Kodikara, K.A.S.; Kumara, M.P.; Jayasinghe, U.I.; Madarasinghe, S.K.; Dahdouh-Guebas, F.; Gorman, D.; Huxman, M.; Jayatissa, L.P. Climate and intertidal zonation drive variability in the carbon stocks of Sri Lankan mangrove forests. Geoderma 2021, 389, 114929. [Google Scholar]
- Banderjee, K.; Mitra, A.; Villasante, S. Carbon cycling in mangrove ecosystem of Western Bay of Bengal (India). Sustainability 2021, 13, 6740. [Google Scholar] [CrossRef]
- Merecí-Guamán, J.; Casanoves, F.; Delgado-Rodríguez, D.; Ochoa, P.; Cifuentes-Jara, M. Impact of shrimp ponds on mangrove blue carbon stocks in Ecuador. Forests 2021, 12, 816. [Google Scholar] [CrossRef]
- Barik, J.; Sanyal, P.; Ghosh, T.; Mukhopadhyay, S.K. Carbon stock and storage pattern in the Sundarbans mangrove forest, NE coast of India. Trop. Ecol. 2021, 62, 95–106. [Google Scholar] [CrossRef]
- Zakaria, R.M.; Chen, G.; Chew, L.L.; Sofawi, A.B.; Moh, H.H.; Chen, S.; Teoh, H.W.; Adibah, S.Y.S.N. Carbon stock of disturbed and undisturbed mangrove ecosystems in Klang Straits, Malaysia. J. Sea Res. 2021, 176, 1022113. [Google Scholar] [CrossRef]
- Pricillia, C.C.; Patria, M.P.; Herdiansyah, H. Environmental conditions to support blue carbon storage in mangrove forest: A case study in the mangrove forest, Nusa Lembongan, Bali, Indonesia. Biodiversitas 2021, 22, 3304–3314. [Google Scholar] [CrossRef]
- Wang, G.; Yu, C.; Singh, M.; Guan, D.; Xiong, Y.; Zheng, R.; Xiao, R. Community structure and ecosystem carbon stock dynamics along a chronosequence of mangrove plantations in China. Plant Soil 2021, 464, 605–620. [Google Scholar] [CrossRef]
- Hatje, V.; Masqué, P.; Patire, V.F.; Dórea, A.; Barros, F. Blue carbon stocks, accumulation rates, and associated spatial variability in Brazilian mangroves. Limnol. Oceanogr. 2020, 66, 321–334. [Google Scholar] [CrossRef]
- Kusumaningtyas, M.A.; Kepel, T.L.; Solihuddin, T.; Lubis, A.A.; Putra, A.D.P. Carbon sequestration potential in the rehabilitated mangroves in Indonesia. Ecol. Res. 2021, 37, 80–91. [Google Scholar] [CrossRef]
- Yu, C.; Guan, D.; Gang, W.; Lou, D.; Wei, L.; Zhou, Y.; Feng, J. Development of ecosystem carbon stock with the progression of a natural mangrove forest in Yingluo Bay, China. Plant Soil 2021, 460, 391–401. [Google Scholar] [CrossRef]
- Rovai, A.S.; Coelho, C., Jr.; de Almeida, R.; Cunha-Lignon, M.; Menghini, R.P.; Twilley, R.R.; Cintrón-Molero, G.; Schaeffer-Novelli, Y. Ecosystem-level carbon stocks and sequestration rates in mangroves in the Cananéia-Iguape estuarine system, southeastern Brazil. For. Ecol Manage. 2021, 479, 118553. [Google Scholar] [CrossRef]
- Murdiyarso, D.; Sasmito, S.D.; Sillanpää, M.; MacKenzie, R.; Gaveau, D. Mangrove selective logging sustains biomass carbon recovery, soil carbon, and sediment. Sci. Rep. 2021, 11, 12325. [Google Scholar] [CrossRef]
- Hamilton, S.E.; Casey, D. Creation of high spatio-temporal resolution global database of continuous mangrove forest cover for the 21st century (CGMFC-21). Glob. Ecol. Biogeogr. 2016, 25, 729–738. [Google Scholar] [CrossRef]
- Giri, C.; Ochieng, E.; Tiezen, L.L.; Zhu, Z.; Singh, A.; Loveland, T.; Masek, J.; Duke, N.C. Status and distribution of mangrove forests of the world using earth observation satellite data. Glob. Ecol. Biogeogr. 2011, 20, 154–159. [Google Scholar] [CrossRef]
- Sanders, C.J.; Maher, D.T.; Tait, D.R.; Williams, D.; Holloway, C.; Sippo, J.Z.; Santos, I.R. Are global mangrove carbon stocks driven by rainfall? J. Geophys. Res. Biogeosci. 2016, 121, 2600–2609. [Google Scholar] [CrossRef]
- Collins, D.S.; Nguyen, V.L.; Ta, T.K.O.; Mao, L.; Ishii, Y.; Ktagawa, H.; Nakashima, R.; Vo, T.H.Q.; Tamura, T. Sedimentary evolution of a delta-margin mangrove in Can Gio, northeastern Mekong River delta, Vietnam. Mar. Geol. 2021, 433, 106417. [Google Scholar] [CrossRef]
- Hanggara, B.B.; Murdiyarso, D.; Ginting, Y.R.S.; Widha, Y.L.; Panjaitan, G.Y.; Lubis, A.A. Effects of diverse mangrove management practices on forest structure, carbon dynamics and sedimentation in North Sumatra, Indonesia. Estuar. Coast. Shelf Sci. 2021, 259, 107467. [Google Scholar] [CrossRef]
- Wigand, C.; Eagle, M.; Branoff, B.L.; Balogh, S.; Miller, K.M.; Martin, R.M.; Hanson, A.; Oczkowski, A.J.; Huertas, E.; Loffredo, J.; et al. Recent carbon storage and burial exceed historical rates in the San Juan Bay estuary peri-urban mangrove forests (Puerto Rico, United States). Front. For. Glob. Change 2021, 4, 676691. [Google Scholar] [CrossRef]
- Chen, L.; Lin, Q.; Krauss, K.W.; Zhang, Y.; Cormier, N.; Yang, Q. Forest thinning in the seaward fringe speeds up surface elevation increment and carbon accumulation in managed mangrove forests. J. Appl. Ecol. 2021, 58, 1899–1909. [Google Scholar] [CrossRef]
- Liu, T.; Liu, S.; Wu, B.; Xu, H.; Zhang, H. Increase of organic carbon burial response to mangrove expansion in the Nanliu River estuary, South China Sea. Prog. Earth Planet. Sci. 2020, 7, 71. [Google Scholar] [CrossRef]
- Setyadi, G.; Sugianto, D.N.; Wijayanti, D.P.; Pribadi, R.; Supardy, E. Sediment accretion and total organic carbon accumulation among different mangrove vegetation communities in the Kamora Estuary of Mimika Regency, Papua, Indonesia. J. Ecol. Eng. 2021, 22, 142–156. [Google Scholar] [CrossRef]
- Zhang, Y.; Meng, X.; Xia, P.; Zhang, J.; Liu, D.; Li, Z.; Wang, W. Spatiotemporal variations in the organic carbon accumulation rate in mangrove sediments from the Yingluo Bay, China, since 1900. Acta Oceanol. Sinica 2021, 40, 65–77. [Google Scholar] [CrossRef]
- Passos, T.; Penny, D.; Sanders, C.; De França, E.; Oliveira, T.; Santos, L.; Barcellos, R. Mangrove carbon and nutrient accumulation shifts driven by rapid development in a tropical estuarine system, northeast Brazil. Mar. Pollut. Bull 2021, 166, 112219. [Google Scholar] [CrossRef] [PubMed]
- Rani, V.; Nandan, S.B.; Schwing, P.T. Carbon source characterization and historical carbon burial in three mangrove ecosystems on the southwest coast of India. Catena 2021, 197, 104980. [Google Scholar] [CrossRef]
- MacKenzie, R.; Sharma, S.; Rovai, A.R. Environmental drivers of blue carbon burial and soil carbon stocks in mangrove forests. In Dynamic Sedimentary Environments of Mangrove Coasts; Sidik, F., Friess, D.A., Eds.; Elsevier: Amsterdam, The Netherlands, 2021; pp. 275–294. [Google Scholar]
- Nardin, W.; Vona, I.; Fagherazzi, S. Sediment deposition affects mangrove forests in the Mekong delta, Vietnam. Cont. Shelf Res. 2021, 213, 104319. [Google Scholar] [CrossRef]
- Alongi, D.M. Carbon cycling in the world’s mangrove ecosystems revisited: Significance of non-steady state diagenesis and subsurface linkages between the forest floor and the coastal ocean. Forests 2020, 11, 977. [Google Scholar] [CrossRef]
- Alongi, D.M. Carbon balance in salt marsh and mangrove ecosystems: A global synthesis. J. Mar. Sci. Eng. 2020, 8, 767. [Google Scholar] [CrossRef]
- Kristensen, E.; Connolly, R.M.; Otero, X.L.; Marchand, C.; Ferreira, T.O.; Rivera-Monroy, V.H. Biogeochemical cycles: Global approaches and perspectives. In Mangrove Ecosystems: A Global and Biogeographic Perspective; Rivera-Monroy, V.H., Lee, S.Y., Kristensen, E., Twilley, R.R., Eds.; Springer: Cham, Switzerland, 2017; pp. 163–209. [Google Scholar]
- Kristensen, E.; Bouillon, S.; Dittmar, T.; Marchand, C. Organic carbon dynamics in mangrove ecosystems: A review. Aquat. Bot. 2008, 89, 201–219. [Google Scholar] [CrossRef] [Green Version]
- Maher, D.T.; Santos, I.R.; Schulz, K.G.; Call, M.; Jacobsen, G.E.; Sanders, C.J. Blue carbon oxidation revealed by radiogenic and stable isotopes in a mangrove system. Geophys. Res. Lett. 2017, 44, 4889–4896. [Google Scholar] [CrossRef]
- Ward, R.D.; de Lacerda, L.D. Responses of mangrove ecosystems to sea level change. In Dynamic Sedimentary Environments of Mangrove Coasts; Sidik, F., Friess, D.A., Eds.; Elsevier: Amsterdam, The Netherlands, 2021; pp. 235–253. [Google Scholar]
- IPCC. Climate change 2021: The physical science basis. In Contribution of Working Group I to the Sixth Assessment Report of the Intergovernmental Panel on Climate Change; Masson-Delmotte, V., Zhai, P., Pirani, S.L., Connors, S.L., Péan, C., Berger, S., Caud, M., Chen, Y., Goldfarb, L., Gomis, M.I., et al., Eds.; Cambridge: Cambridge, UK, 2021; pp. 1–676. [Google Scholar]
- Woodroffe, C.D.; Rogers, K.; McKee, K.L.; Lovelock, C.E.; Mendelssohn, I.A.; Saintilan, N. Mangrove sedimentation and response to relative sea-level rise. Annu. Rev. Mar Sci. 2016, 8, 243–266. [Google Scholar] [CrossRef] [PubMed] [Green Version]
- Friess, D.A.; McKee, K.L. The history of surface-elevation paradigms in mangrove biogeomorphology. In Dynamic Sedimentary Environments of Mangrove Coasts; Sidik, F., Friess, D.A., Eds.; Elsevier: Amsterdam, The Netherlands, 2021; pp. 179–198. [Google Scholar]
- Alongi, D.M. Responses of mangrove ecosystems to climate change in the Anthropocene. In Mangroves: Ecology, Biodiversity, and Management; Rastogi, R.P., Phulwara, M., Gupta, D.K., Eds.; Springer Nature: Singapore, 2021; pp. 201–224. [Google Scholar]
- Saintilan, N.; Khan, N.S.; Ashe, E.; Kelleway, J.J.; Rogers, K.; Woodroffe, C.D.; Horton, B.P. Thresholds of mangrove survival under rapid sea-level rise. Science 2020, 368, 1118–1121. [Google Scholar] [PubMed]
- McKee, K.L.; Cahoon, D.R.; Feller, I.C. Caribbean mangroves adjust to rising sea level through biotic controls on change in soil elevation. Glob. Ecol. Biogeogr. 2007, 16, 545–556. [Google Scholar] [CrossRef]
- Kelleway, J.J.; Saintilan, N.; Macreadie, P.I.; Skilbeck, C.G.; Zawadzki, A.; Ralph, P.J. Seventy years of continuous encroachment substantially increase ‘blue carbon’ capacity as mangroves replace salt marshes. Glob. Change Biol. 2016, 22, 1097–1109. [Google Scholar]
- Rogers, K.; Kelleway, J.J.; Saintilan, N.; Megonigal, J.P.; Adams, J.B.; Holmquist, J.R.; Lu, M.; Schile-Beers, L.; Zawadzki, A.; Mazumder, D.; et al. Wetland carbon storage controlled by millennial-scale variation in relative sea-level rise. Nature 2019, 567, 91–95. [Google Scholar] [CrossRef]
- Buffington, K.J.; MacKenzie, R.A.; Carr, J.A.; Apwong, M.; Krauss, K.W.; Thorne, K.M. Mangrove species’ response to sea-level rise across Pohnpei, Federated States of Micronesia. In U.S. Geological Survey Open-File Report 2021–1002; U.S. Geological Survey: Reston, VA, USA, 2021; pp. 1–44. [Google Scholar] [CrossRef]
- Lovelock, C.E.; Reef, R. Variable impacts of climate change on blue carbon. One Earth 2020, 3, 195–211. [Google Scholar] [CrossRef]
- Zhang, Y.; Meng, X.; Xia, P.; Li, Z. Response of mangrove development to air temperature variation over the past 3000 years in Quizhou Bay, tropical China. Front. Earth Sci. 2021, 9, 678189. [Google Scholar] [CrossRef]
- Cavanaugh, K.C.; Parker, J.D.; Cook-Patton, S.C.; Feller, I.C.; Park Williams, A.; Kellner, J.R. Integrating physiological threshold experiments with climate modelling to project mangrove species’ range expansion. Glob. Change Biol. 2015, 21, 1928–1938. [Google Scholar] [CrossRef] [Green Version]
- Yando, E.S.; Osland, M.J.; Willis, J.M.; Day, R.H.; Krauss, K.W.; Hester, M.W. Salt marsh-mangrove ecotones: Using structural gradients to investigate the effects of woody plant encroachment on plant-soil interactions and ecosystem carbon pools. J. Ecol. 2016, 104, 1020–1031. [Google Scholar] [CrossRef] [Green Version]
- Raw, J.L.; Julie, C.L.; Adams, J.B. A comparison of soil carbon pools across a mangrove -salt marsh ecotone at the southern African warm-temperate range limit. S. Afr. J. Bot. 2019, 127, 301–307. [Google Scholar] [CrossRef]
- Simpson, L.T.; Stein, C.M.; Osborne, T.Z.; Feller, I.C. Mangroves dramatically increase carbon storage after 3 years of encroachment. Hydrobiologia 2019, 834, 13–26. [Google Scholar] [CrossRef]
- Lewis, D.B.; Brown, J.A.; Jimenez, K.L. Effects of flooding and warming on soil organic matter mineralization in Avicennia germinans mangrove forests and Juncus roemerianus salt marshes. Estuar. Coast. Shelf Sci. 2014, 139, 11–19. [Google Scholar] [CrossRef]
- Hansen, J.; Sato, M.; Ruedy, R. Perception of climate change. Proc. Nat. Acad. Sci. USA 2012, 109, E2415–E2423. [Google Scholar] [CrossRef] [Green Version]
- Lovelock, C.E.; Feller, I.C.; Reef, R.; Hickey, S.; Ball, M.C. Mangrove dieback during fluctuating sea levels. Sci. Rep. 2017, 7, 1680. [Google Scholar] [CrossRef]
- Abhik, S.; Hope, P.; Hendon, H.H.; Hutley, L.B.; Johnson, S.; Drosdowsky, W.; Brown, J.R.; Duke, N.C. Influence of the 2015–2016 El Niño on the record-breaking mangrove dieback along the northern Australia coast. Sci. Rep. 2021, 11, 20411. [Google Scholar] [CrossRef]
- Sippo, J.Z.; Sanders, C.J.; Santos, I.R.; Jeffrey, L.C.; Call, M.; Harada, Y.; Maguire, K.; Brown, D.; Conrad, S.R.; Maher, D.T. Coastal carbon cycle changes following mangrove loss. Limnol. Oceanogr. 2020, 65, 2642–2656. [Google Scholar] [CrossRef]
- Gomes, L.E.; Sanders, C.J.; Nobrega, G.N.; Vescovi, L.C.; Queiroz, H.M.; Kauffman, J.B.; Ferreira, T.O.; Bernardino, A.F. Ecosystem carbon losses following a climate-induced mangrove mortality in Brazil. J. Environ. Manage. 2021, 297, 113381. [Google Scholar] [CrossRef] [PubMed]
- Zhu, X.; Sun, C.; Qin, Z. Drought-induced salinity enhancement weakens mangrove greenhouse gas cycling. J. Geophys. Res. Biogeosci. 2021, 126, e2021JG006416. [Google Scholar] [CrossRef]
- Krauss, K.W.; Osland, M.J. Tropical cyclones and the organization of mangrove forests: A review. Ann. Bot. 2020, 125, 213–234. [Google Scholar] [CrossRef]
- Jones, M.C.; Wingard, G.L.; Stackhouse, B.; Keller, K.; Willard, D.; Marot, M.; Landacre, B.; Bernhardt, C.E. Rapid inundation of southern Florida coastline despite low relative sea-level rise rates during the late Holocene. Nat. Commun. 2019, 10, 3231. [Google Scholar] [CrossRef] [PubMed]
- Simard, M.; Fatoyinbo, L.; Smetanka, C.; Rivera-Monroy, V.H.; Castañeda-Moya, E.; Thomas, N.; Van der Stocken, T. Mangrove canopy height globally related to precipitation, temperature, and cyclone frequency. Nat. Geosci. 2019, 12, 40–45. [Google Scholar] [CrossRef]
- Chambers, L.G.; Steinmuller, H.E.; Breithaupt, J.L. Toward a mechanistic understanding of ‘peat collapse’ and its potential contribution to coastal wetland loss. Ecology 2019, 100, e02720. [Google Scholar] [CrossRef] [PubMed] [Green Version]
- Osland, M.J.; Feher, L.C.; Griffith, K.T.; Cavanaugh, K.C.; Enwright, N.M.; Day, R.H.; Stagg, C.L.; Krauss, K.W.; Howard, R.J.; Grace, J.B.; et al. Climatic controls on the global distribution, abundance, and species richness of mangrove forests. Ecol. Monogr. 2017, 87, 341–359. [Google Scholar] [CrossRef] [Green Version]
- Reef, R.; Slot, M.; Motro, U.; Motro, M.; Motro, Y.; Adame, M.F.; Garcia, M.; Aranda, J.; Lovelock, C.E.; Winter, K. The effects of CO2 and nutrient fertilization on the growth and temperature response of the mangrove Avicennia germinans. Photosyn. Res. 2016, 129, 159–170. [Google Scholar] [CrossRef] [Green Version]
- Tamimia, B.; Wan Juliana, W.A.; Nizam, M.S.; Zain, C.R.C.M. Elevated CO2 concentration and air temperature impacts on mangrove plants (Rhizophora apiculata) under controlled environment. Iraqi J. Sci. 2019, 60, 1658–1666. [Google Scholar] [CrossRef]
- Jacotot, A.; Marchand, C.; Gensous, S.; Allenbach, M. Effects of elevated atmospheric CO2 and increased tidal flooding on leaf gas-exchange parameters of two common mangrove species: Avicennia marina and Rhizophora stylosa. Photosyn. Res. 2018, 138, 249–260. [Google Scholar]
- Yin, P.; Yin, M.; Cai, Z.; Wu, G.; Lin, G.; Zhou, J. Structural instability of the rhizosphere microbiome in mangrove plant Kandelia obovata under elevated CO2. Mar. Environ. Res. 2018, 140, 422–432. [Google Scholar] [CrossRef]
- Manea, A.; Geedicke, I.; Leishman, M.R. Elevated carbon dioxide and reduced salinity enhance mangrove seedling establishment in an artificial salt marsh community. Oecologia 2020, 192, 273–280. [Google Scholar] [CrossRef]
Figure 1.
Impacts of sea-level rise on mangrove blue carbon stocks and fluxes. Estimates of changes in mangrove forest cover (A,C) under coastal adaptation scenarios that are either high (dark blue) or low (light blue). The projected influence on net blue carbon emissions and removals until 2100 (B,D) are estimated for RCP8.5 scenario (A,B) and RCP4.5 (C,D). Negative values are reductions in global cover or carbon emissions. Modified from source: [58]. Open access under the CC By-NC-ND license 4.0.

Figure 2.
Potential changes in mangrove carbon stocks for two SLR scenarios, (A,B) RCP8.5 (high CO2 emissions) and (C,D) RCP4.5 (lower CO2 emissions) and for a low coastal squeeze–high adaptation scenario (A,C) and high coastal squeeze–low adaptation scenario (B,D). Warm colors indicate net losses and cool colors indicate net gains. Source: [58]. Open access under the CC By-NC-ND license 4.0.


Table 1.
Grand mean regional estimates of organic carbon stocks (Mg CORG ha−1) in mangrove aboveground (AGBCORG) and belowground (BGBCORG) biomass and soil (SCORG) to a depth of 1 m. Updated [9,10,11,12,13,14,15,16] and summarized from [3]. TECORG = total ecosystem CORG stock (Mg CORG ha−1).
| Region | AGBCORG | BGBCORG | SCORG | TECORG |
|---|---|---|---|---|
| Africa | 89.5 | 88.0 | 402.4 | 638.8 |
| Southeast Asia | 115.7 | 44.9 | 656.1 | 806.4 |
| South and East Asia | 94.2 | 35.9 | 445.4 | 482.8 |
| Central and North America and Caribbean | 92.5 | 41.4 | 577.4 | 730.1 |
| South America | 104.3 | 85.2 | 236.9 | 419.4 |
| Middle East | 30.6 | 41.2 | 150.9 | 224.9 |
| Australia and New Zealand | 55.1 | 79.7 | 465.3 | 563.4 |
| Pacific Islands | 213.7 | 172.9 | 599.7 | 987.4 |
Table 2.
Grand mean annual estimates (Mg C ha−1 a−1) of carbon flow in an idealized mangrove forest based on globally averaged data summarized in Alongi [43,44]. GPP = gross primary production; RCANOPY = forest canopy respiration; RMICROALGAE = microalgal respiration; RTIDAL WATER = tidal water respiration; DIC = dissolved inorganic carbon; DOC = dissolved organic carbon; CH4 = methane; POC = particulate organic carbon.
| Inputs | Outputs | ||
|---|---|---|---|
| GPP (mangrove) | 35.3 | RCANOPY | 22.3 |
| GPP (microalgae) | 4.4 | RMICROALGAE | 2.3 |
| DIC production (soil to 1 m) | 18.2 | Air–soil CH4 release | 0.015 |
| Marine | ? | Soil CO2 + DIC release (air + water) | 6.13 |
| Upstream | ? | RTIDAL WATER | 3.35 |
| Groundwater | ? | Air–water CH4 release | 0.0116 |
| Net DOC export | 5.90 | ||
| Net DIC export | 14.0 | ||
| Net CH4 export | 0.0277 | ||
| Net POC export | 1.73 | ||
| Burial | 1.11 | ||
| Total | 57.9 | Total | 56.9 |
Table 3.
Predicted rates of sea-level rise (mm a−1) under (A) five CO2 emissions scenarios a and (B) five different temperature rise scenarios during the 2040–2060 and 2080–2100 periods [49]. Values are forecasted medians and ranges are in parentheses. Bolding indicates mangrove survival, bolded italics indicates indeterminate future, and normal font suggests submergence.
| Year Intervals | (A) CO2 Emissions Scenarios | ||||
|---|---|---|---|---|---|
| Very low | Low | Intermediate | High | Very High | |
| 2040–2060 | 4.2 (2.9–6.1) | 4.9 (3.6–6.9) | 5.9 (4.5–8.0) | 6.5 (5.1–8.7) | 7.3 (5.7–9.8) |
| 2080–2100 | 4.3 (2.5–6.6) | 5.3 (3.3–8.1) | 7.8 (5.3–11.5) | 10.4 (7.5–14.9) | 12 (8.8–17.7) |
| (B) Global surface air temperature scenarios | |||||
| 1.5 °C | 2.0 °C | 3.0 °C | 4.0 °C | 5.0 °C | |
| 2040–2060 | 4.1 (3.0–5.8) | 5.1 (3.8–7.1) | 6.0 (4.7–8.2) | 6.5 (5.1–8.6) | 7.3 (5.8–9.8) |
| 2080–2100 | 4.3 (2.6–6.5) | 5.5 (3.5–8.3) | 7.9 (5.4–11.6) | 9.9 (7.2–14.2) | 11.8 (8.6–17.0) |
a current CO2 emissions are 40 Gt CO2 a−1 compared with the very low (−15 Gt CO2 a−1), low (−10 Gt CO2 a−1), intermediate (10 Gt CO2 a−1), high (≈82 Gt CO2 a−1), and very high (≈124 Gt CO2 a−1) model emissions scenarios.
Table 4.
Forecasted impacts of various climate change issues on mangrove blue carbon stocks and fluxes. 0 = no impact; + = positive response; − = negative response.
Table 4.
Forecasted impacts of various climate change issues on mangrove blue carbon stocks and fluxes. 0 = no impact; + = positive response; − = negative response.
| Climate Change | Blue Carbon Stocks | Carbon Fluxes |
|---|---|---|
| SLR | Outcome dependent on scenario and species (flood tolerance): (1) critical SLR threshold ≈ 6 mm a−1. Survival only under very low-low CO2 emissions scenarios. (2) tidal migration or latitudinal expansion = + biomass and soil C (3) forest death = + soil C, − biomass C; + peat formation/C burial (4) net gain = +1.5 Pg C (low coastal squeeze) (5) net gains and losses = −0.3 to +0.5 Pg C (high coastal squeeze) | Outcome dependent on scenario and species (flood tolerance): (1) critical SLR threshold ≈ 6 mm a−1. Survival only under very low-low CO2 emissions scenarios. (2) tidal migration or latitudinal expansion = + CO2 and CH4 emissions (3) forest death = + in CO2 and CH4 emissions (4) under high coastal squeeze, − of 3.4 Pg C in CO2 emissions (5) under low coastal squeeze, −1.1 Pg C |
| Increasing °C | + in carbon stocks up to critical °C threshold − in carbon stocks in arid regions + in carbon stocks with continuing expansion | + in CO2 assimilation and − respiratory losses up to critical °C threshold − above °C threshold |
| Increasing Storms | − damage carbon biomass losses and soil carbon erosion + or − if storm-induced massive bedload sedimentation | − CO2 losses nutrients exhausted + or − if storm-induced massive bedload sedimentation |
| Extreme Weather Events | − massive dieback | − carbon export and CO2 and CH4 cycling |
| Precipitation Changes | + in regions of increased rainfall − in regions of decreased rainfall | + in regions of increased rainfall − in regions of decreased rainfall |
| Rising CO2 | Responses species-specific and complex due to interactive effects with °C, ‰, CO2 level, etc.: + most species, but − or 0 for some species | Responses species-specific and complex due to interactive effects with °C, ‰, CO2 level, etc.: + most species, but − or 0 for some species |
| Coastal Acidification | 0 | 0 |
| Increasing Hypoxia | 0 | 0 |
Publisher’s Note: MDPI stays neutral with regard to jurisdictional claims in published maps and institutional affiliations. |
© 2022 by the author. Licensee MDPI, Basel, Switzerland. This article is an open access article distributed under the terms and conditions of the Creative Commons Attribution (CC BY) license (https://creativecommons.org/licenses/by/4.0/).
Share and Cite
MDPI and ACS Style
Alongi, D.M. Impacts of Climate Change on Blue Carbon Stocks and Fluxes in Mangrove Forests. Forests 2022, 13, 149. https://doi.org/10.3390/f13020149
AMA Style
Alongi DM. Impacts of Climate Change on Blue Carbon Stocks and Fluxes in Mangrove Forests. Forests. 2022; 13(2):149. https://doi.org/10.3390/f13020149
Chicago/Turabian StyleAlongi, Daniel Michael. 2022. "Impacts of Climate Change on Blue Carbon Stocks and Fluxes in Mangrove Forests" Forests 13, no. 2: 149. https://doi.org/10.3390/f13020149
Note that from the first issue of 2016, this journal uses article numbers instead of page numbers. See further details here.