
Biomass Price Prediction Based on the Example of Poland

 ,
,
Abstract
:1. Introduction
2. Materials and Methods
- p is the autocorrelation parameter
- d stands for the degree of integration of a series
- q is the parameter of the moving average
- where Equation (2):
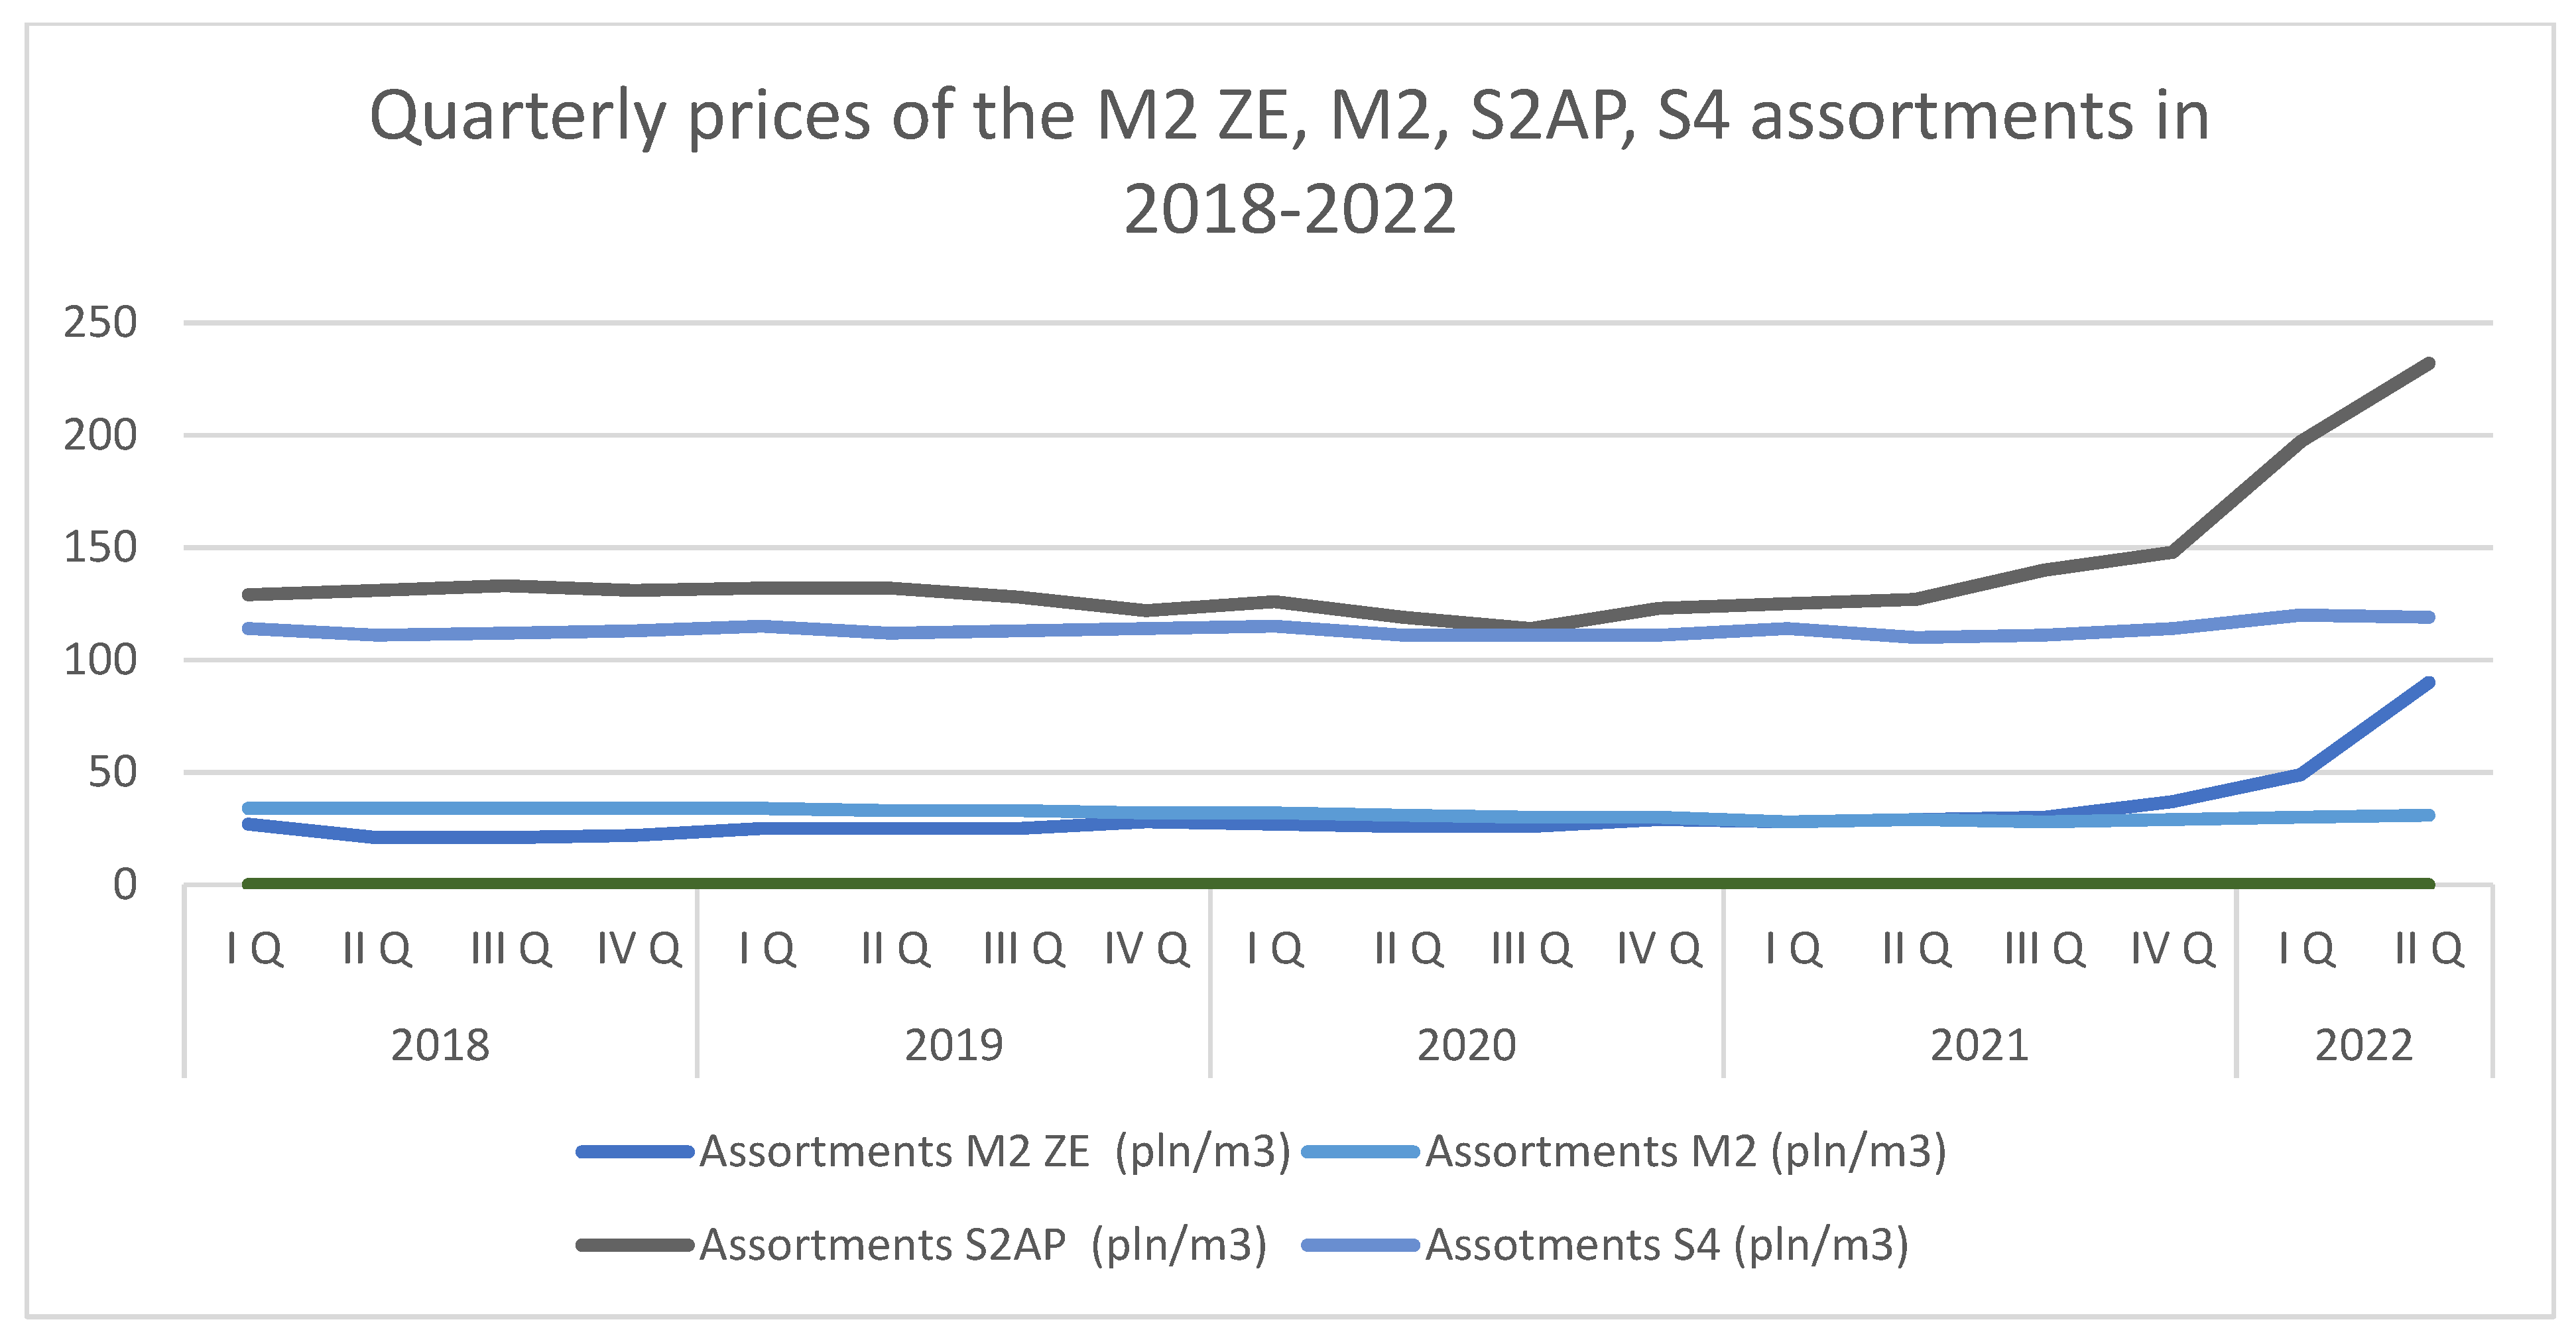
3. Results
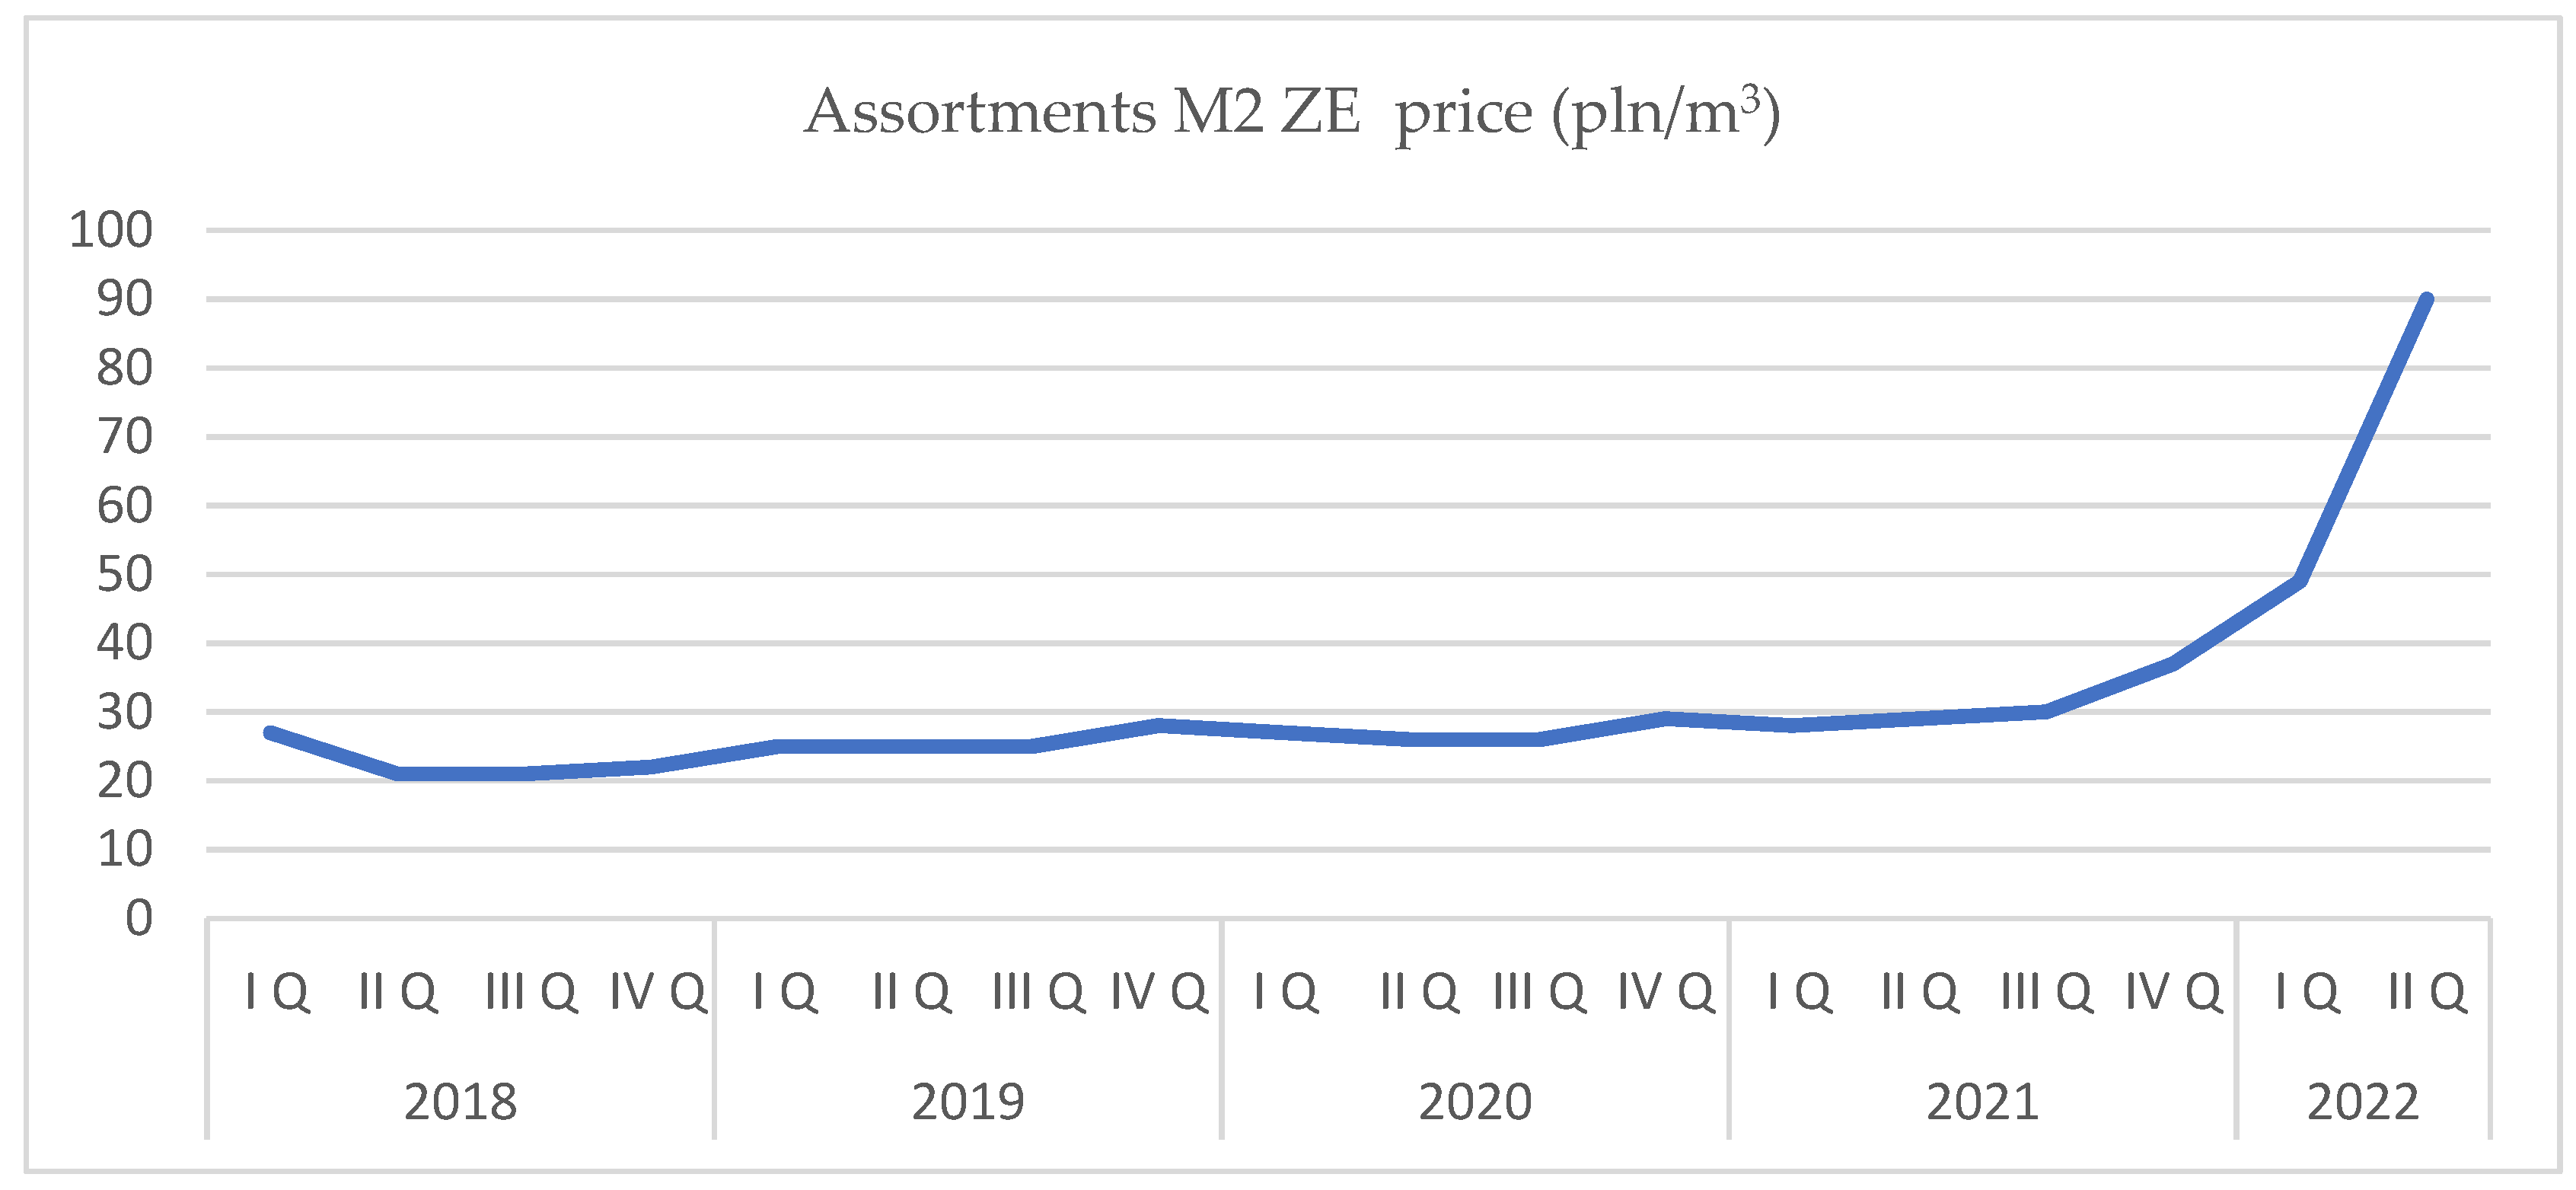
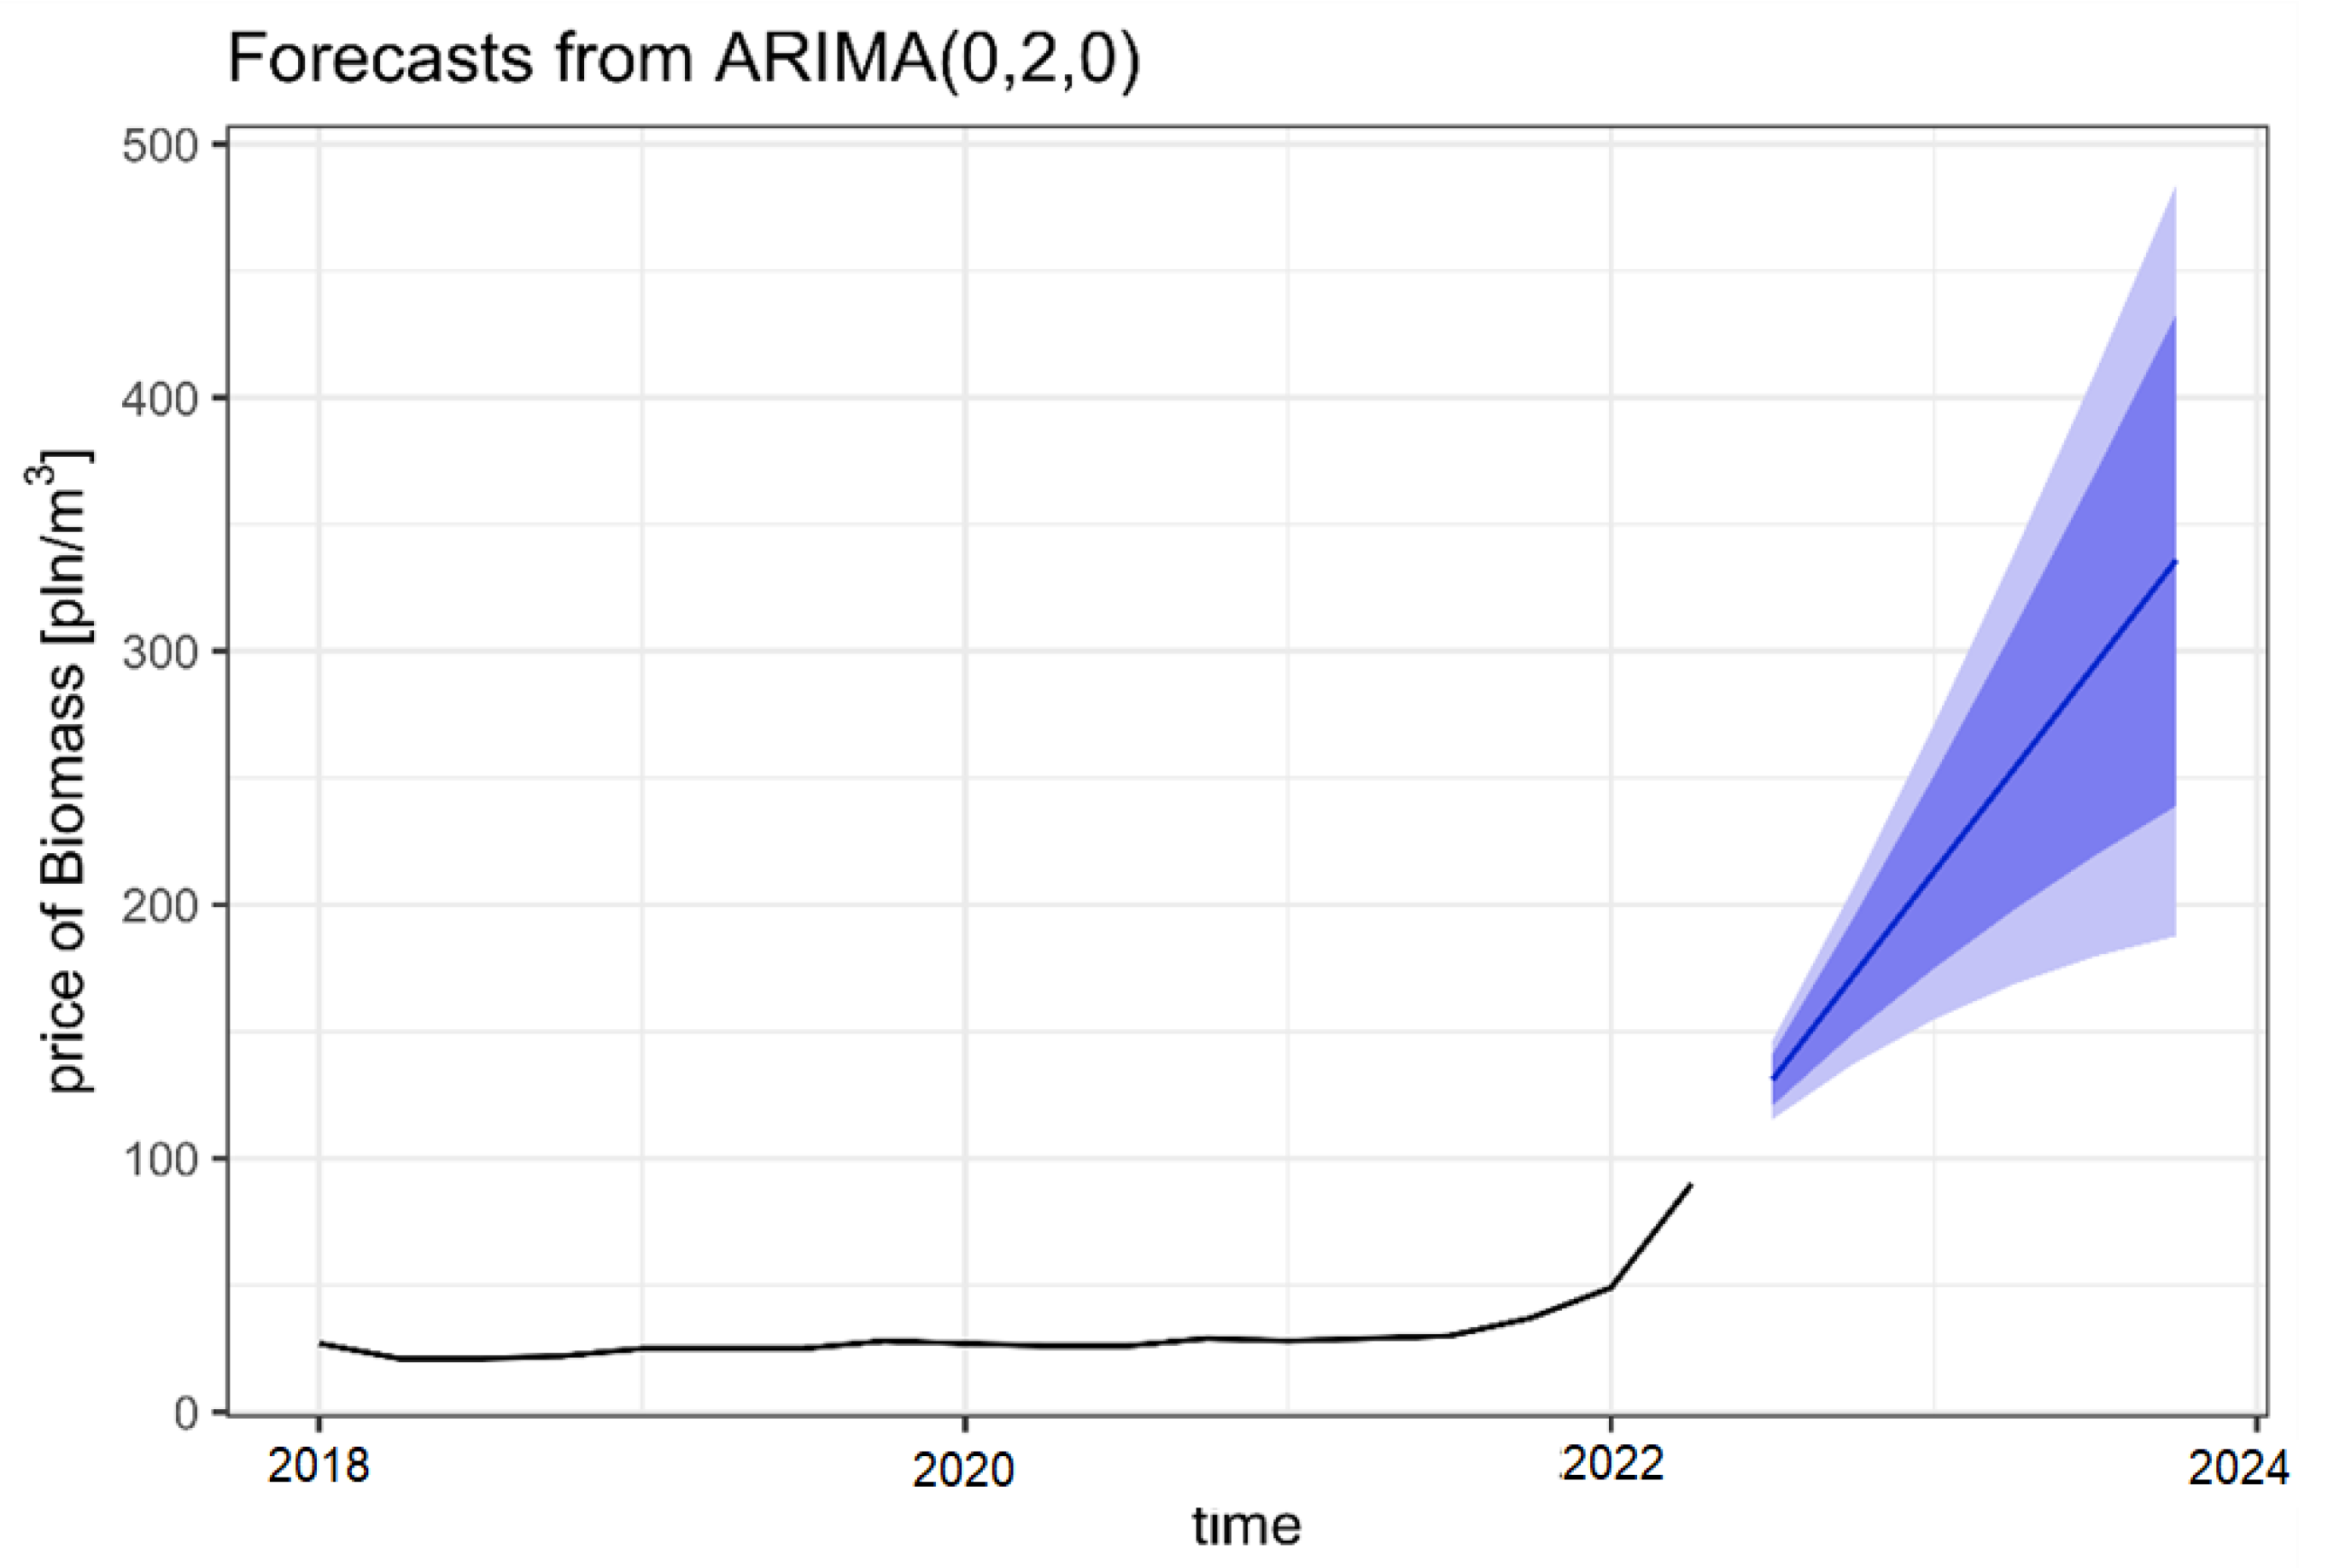
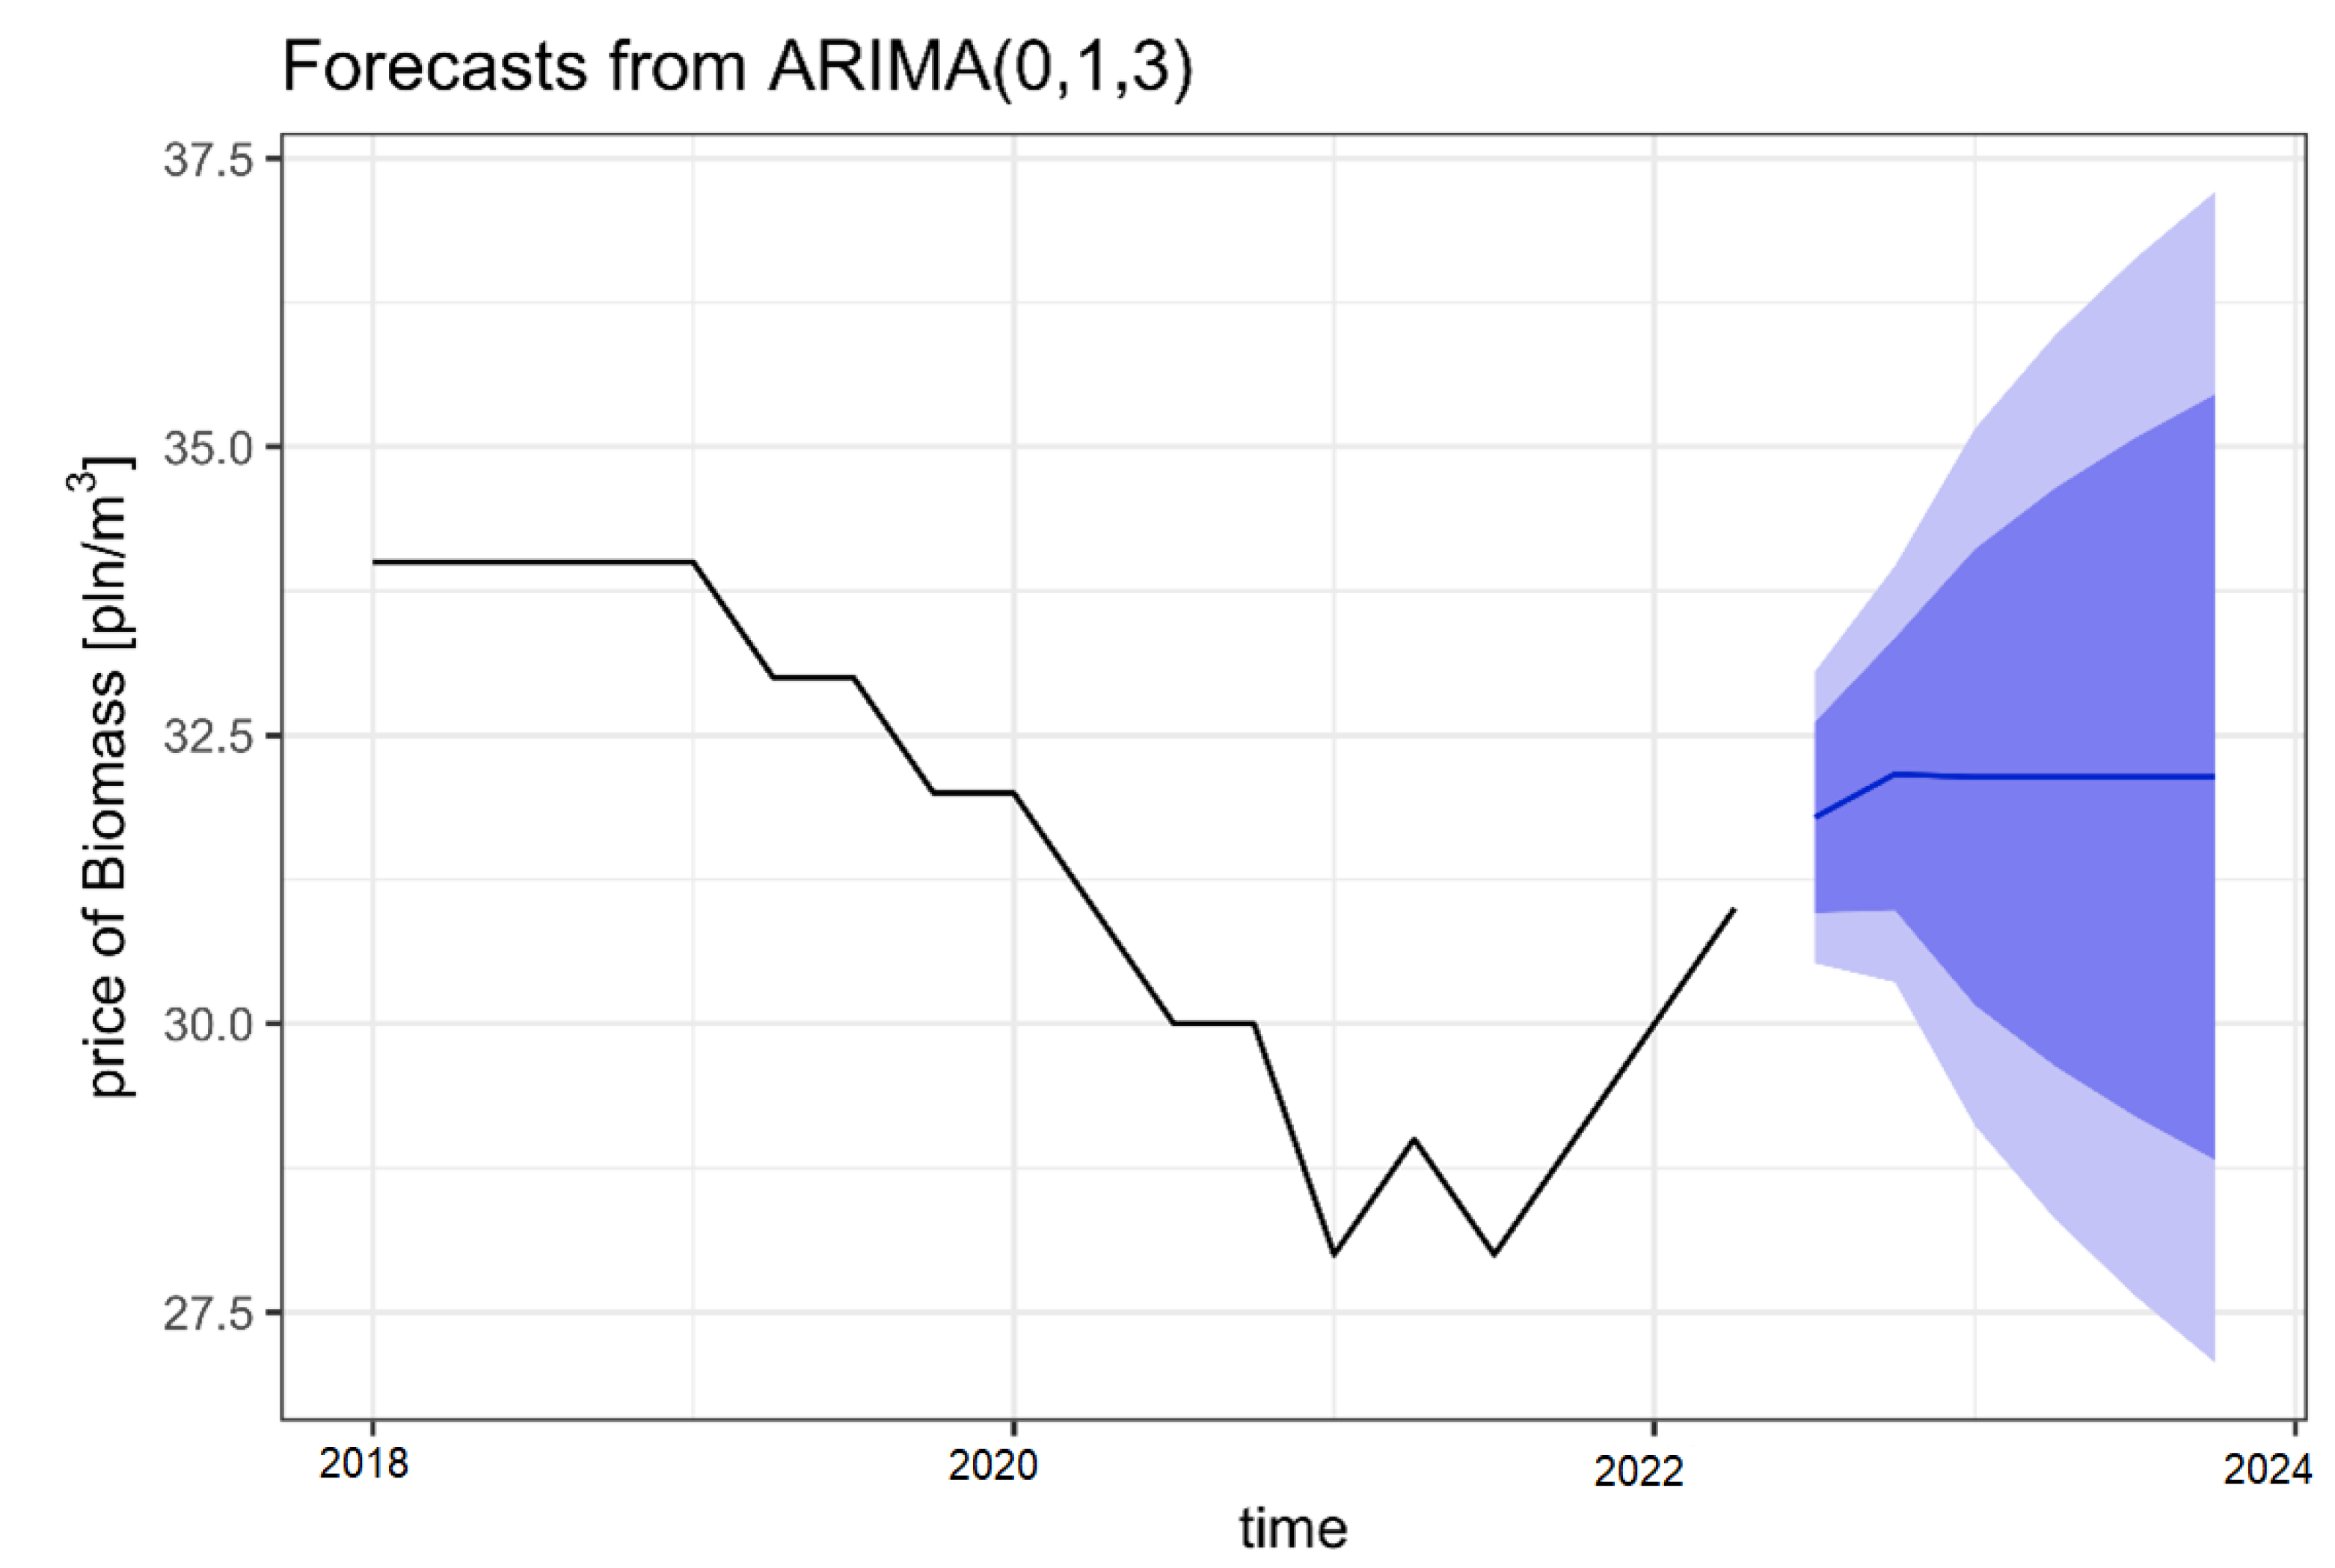
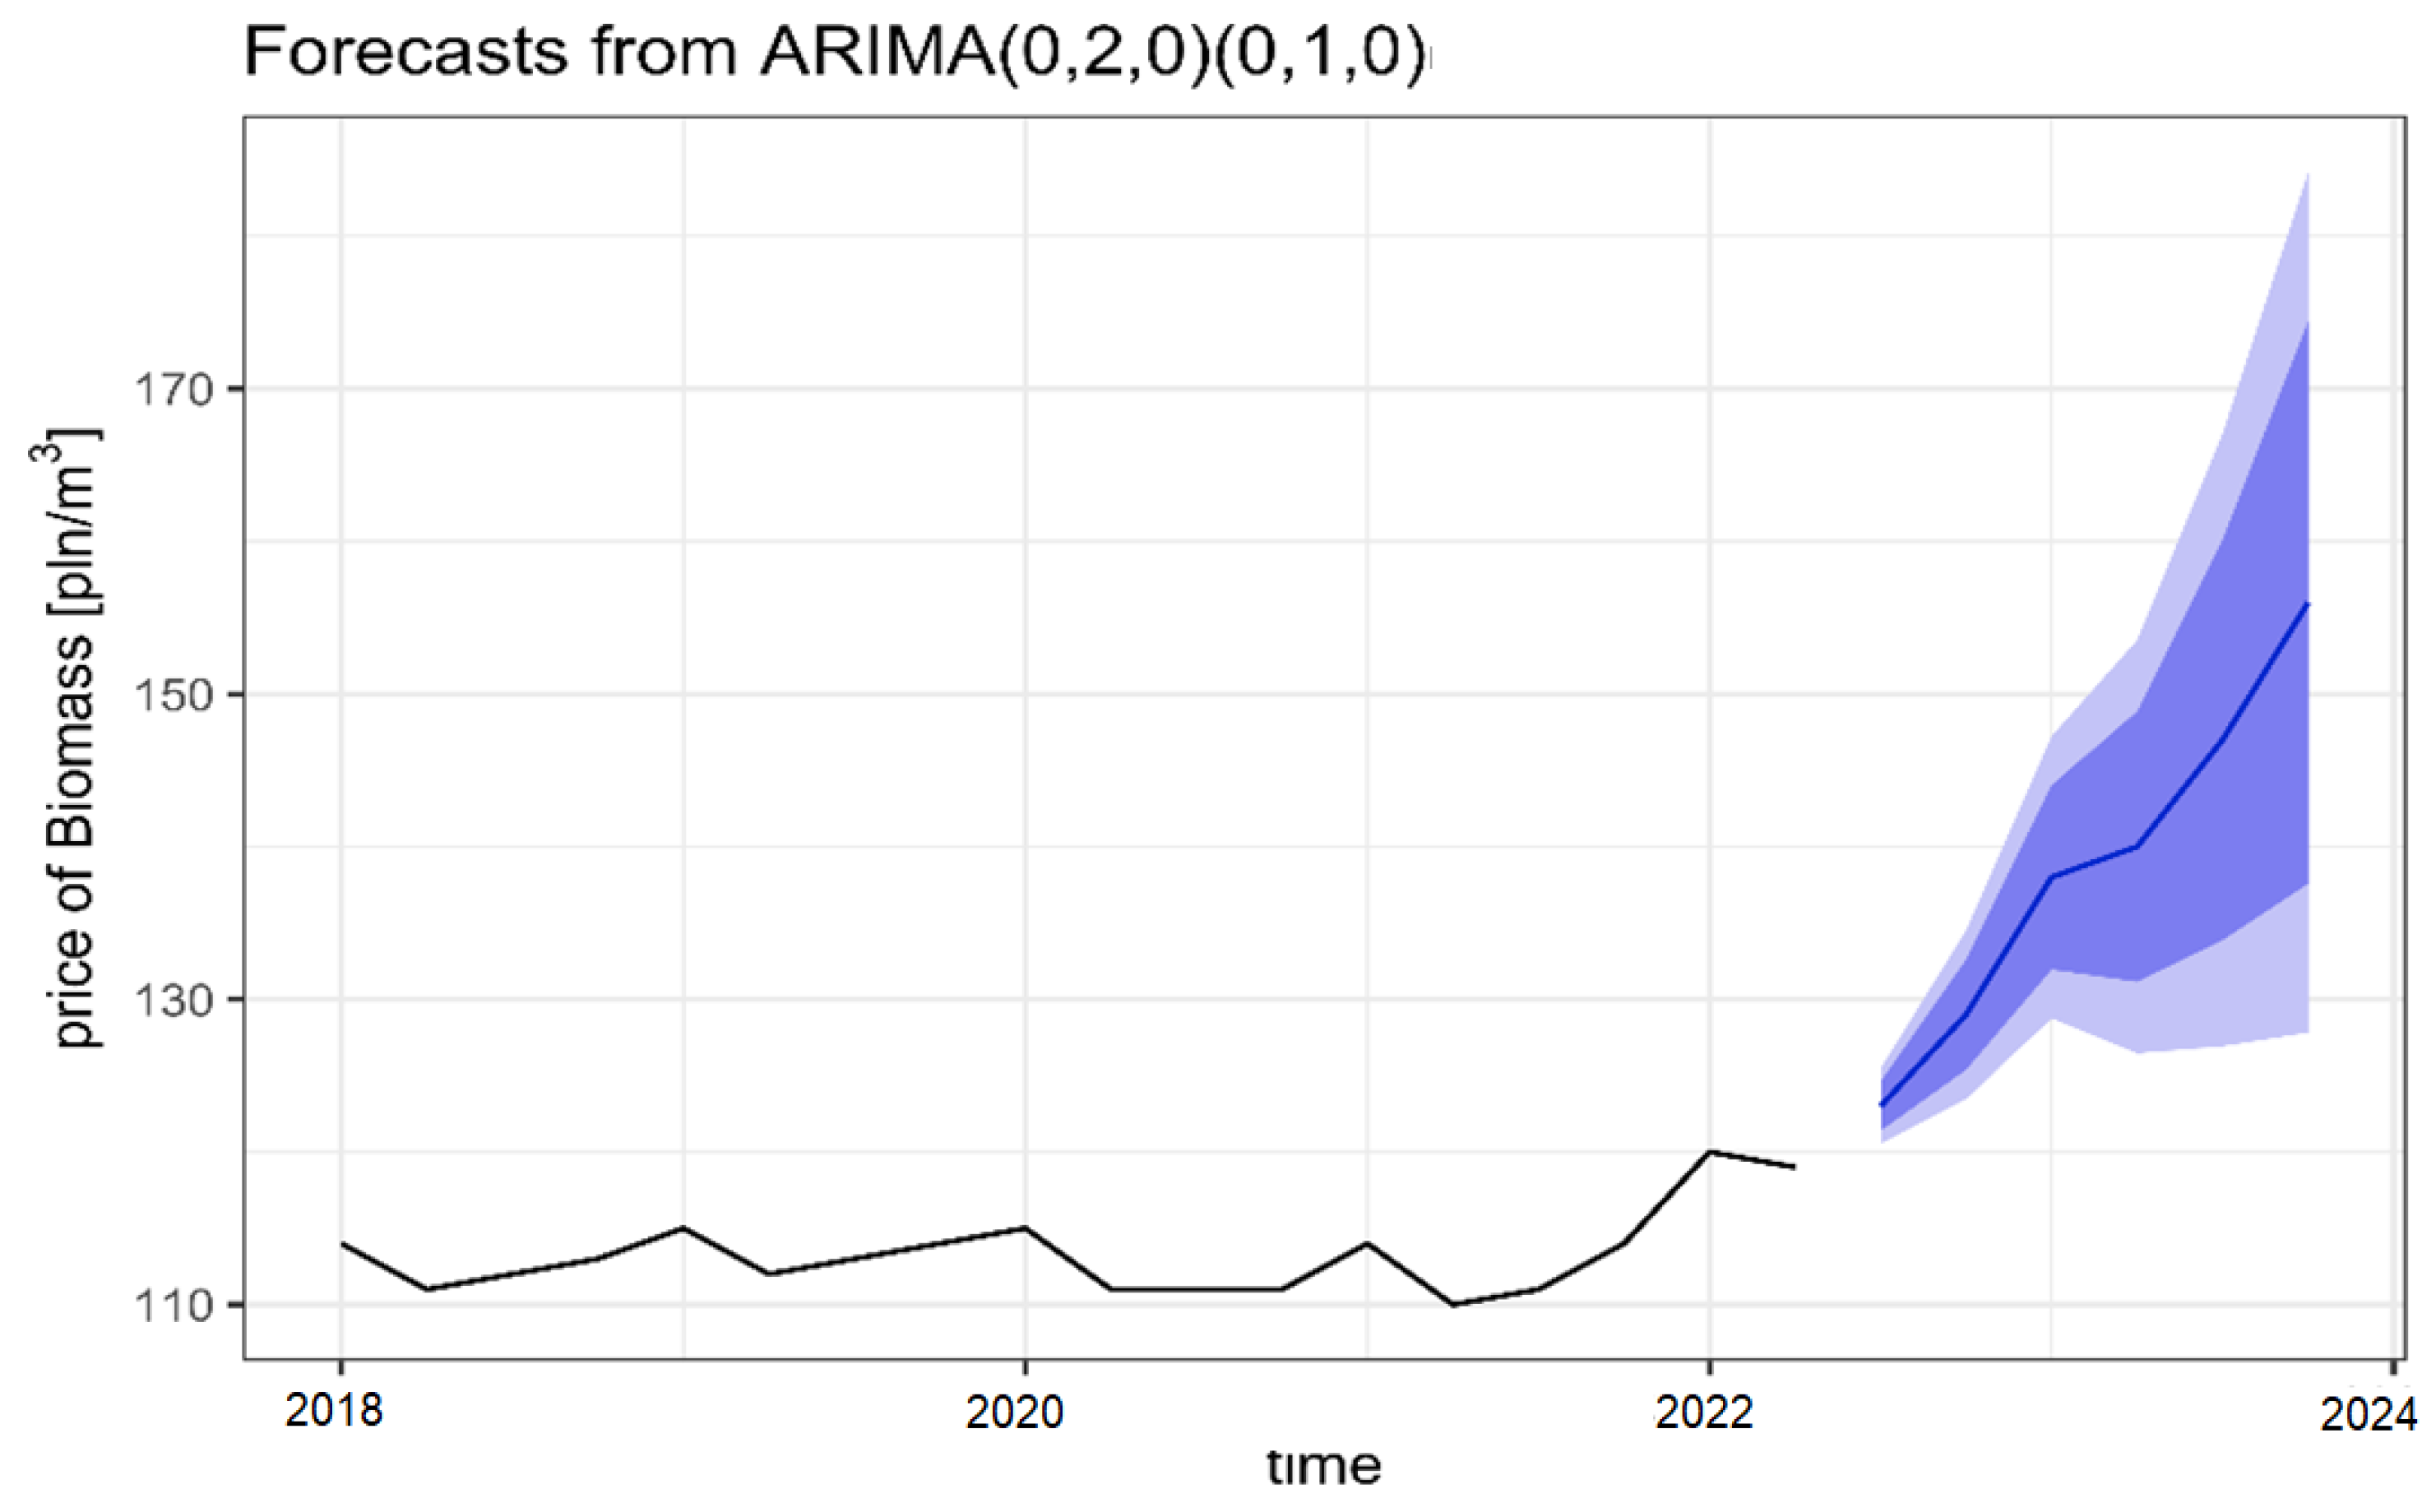
3.1. Forecast for M2 ZE Assortment (Residual Wood)
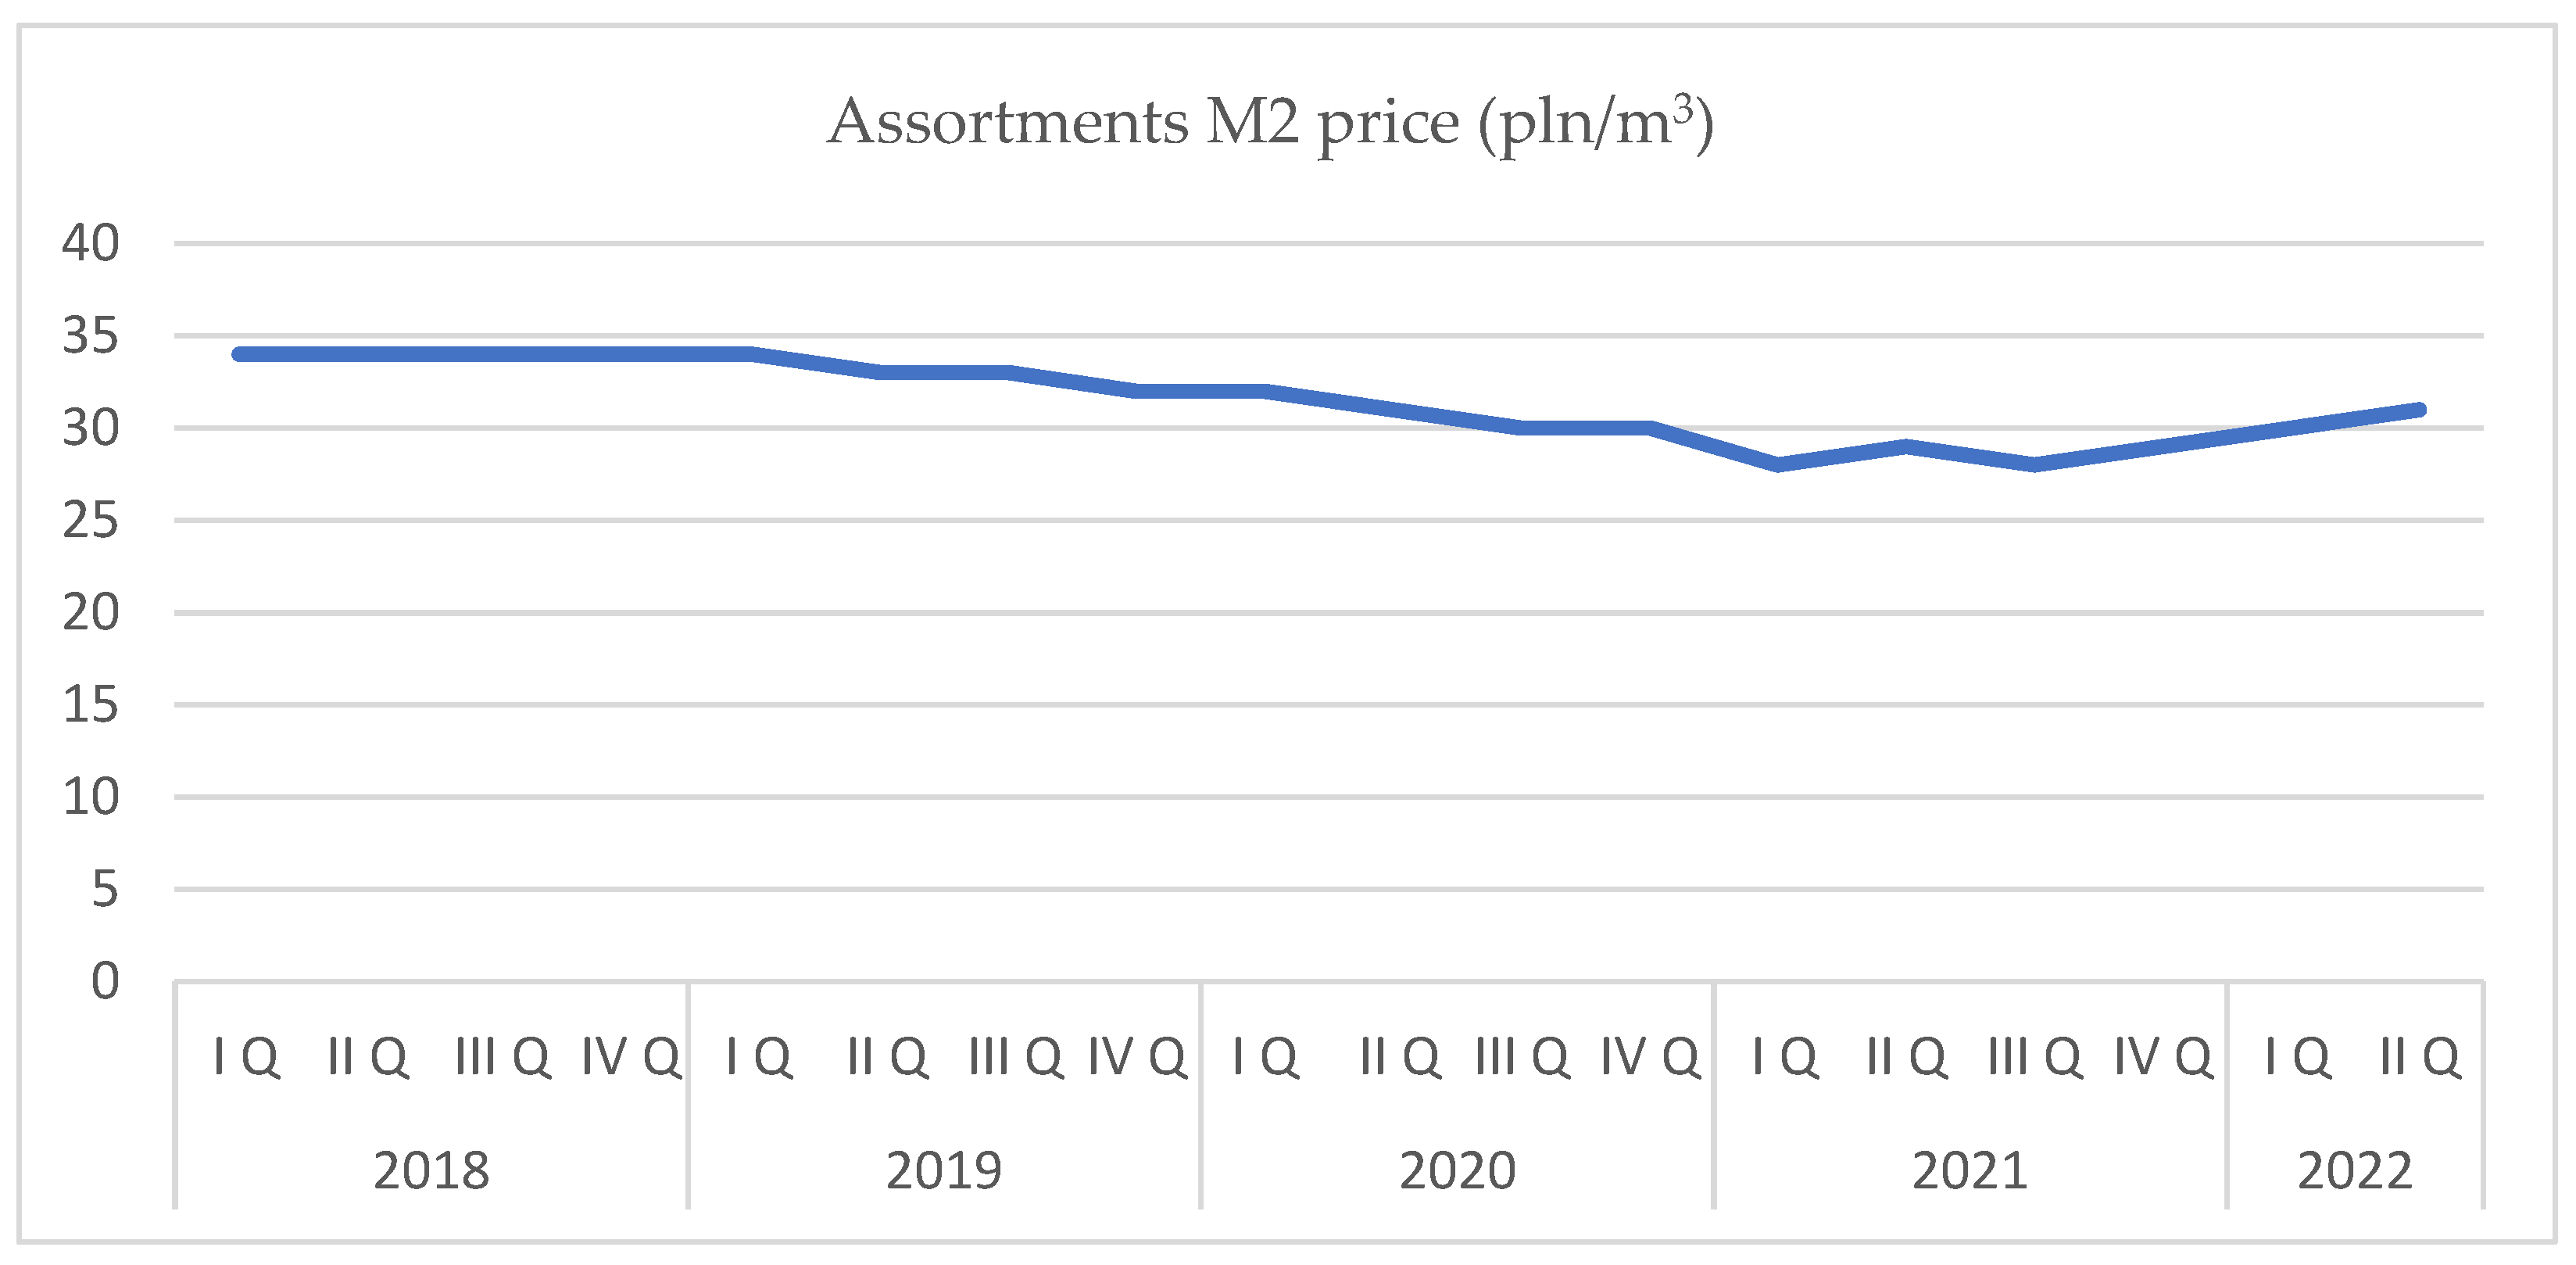
3.2. Forecast for the M2 Assortment (Firewood Slash)
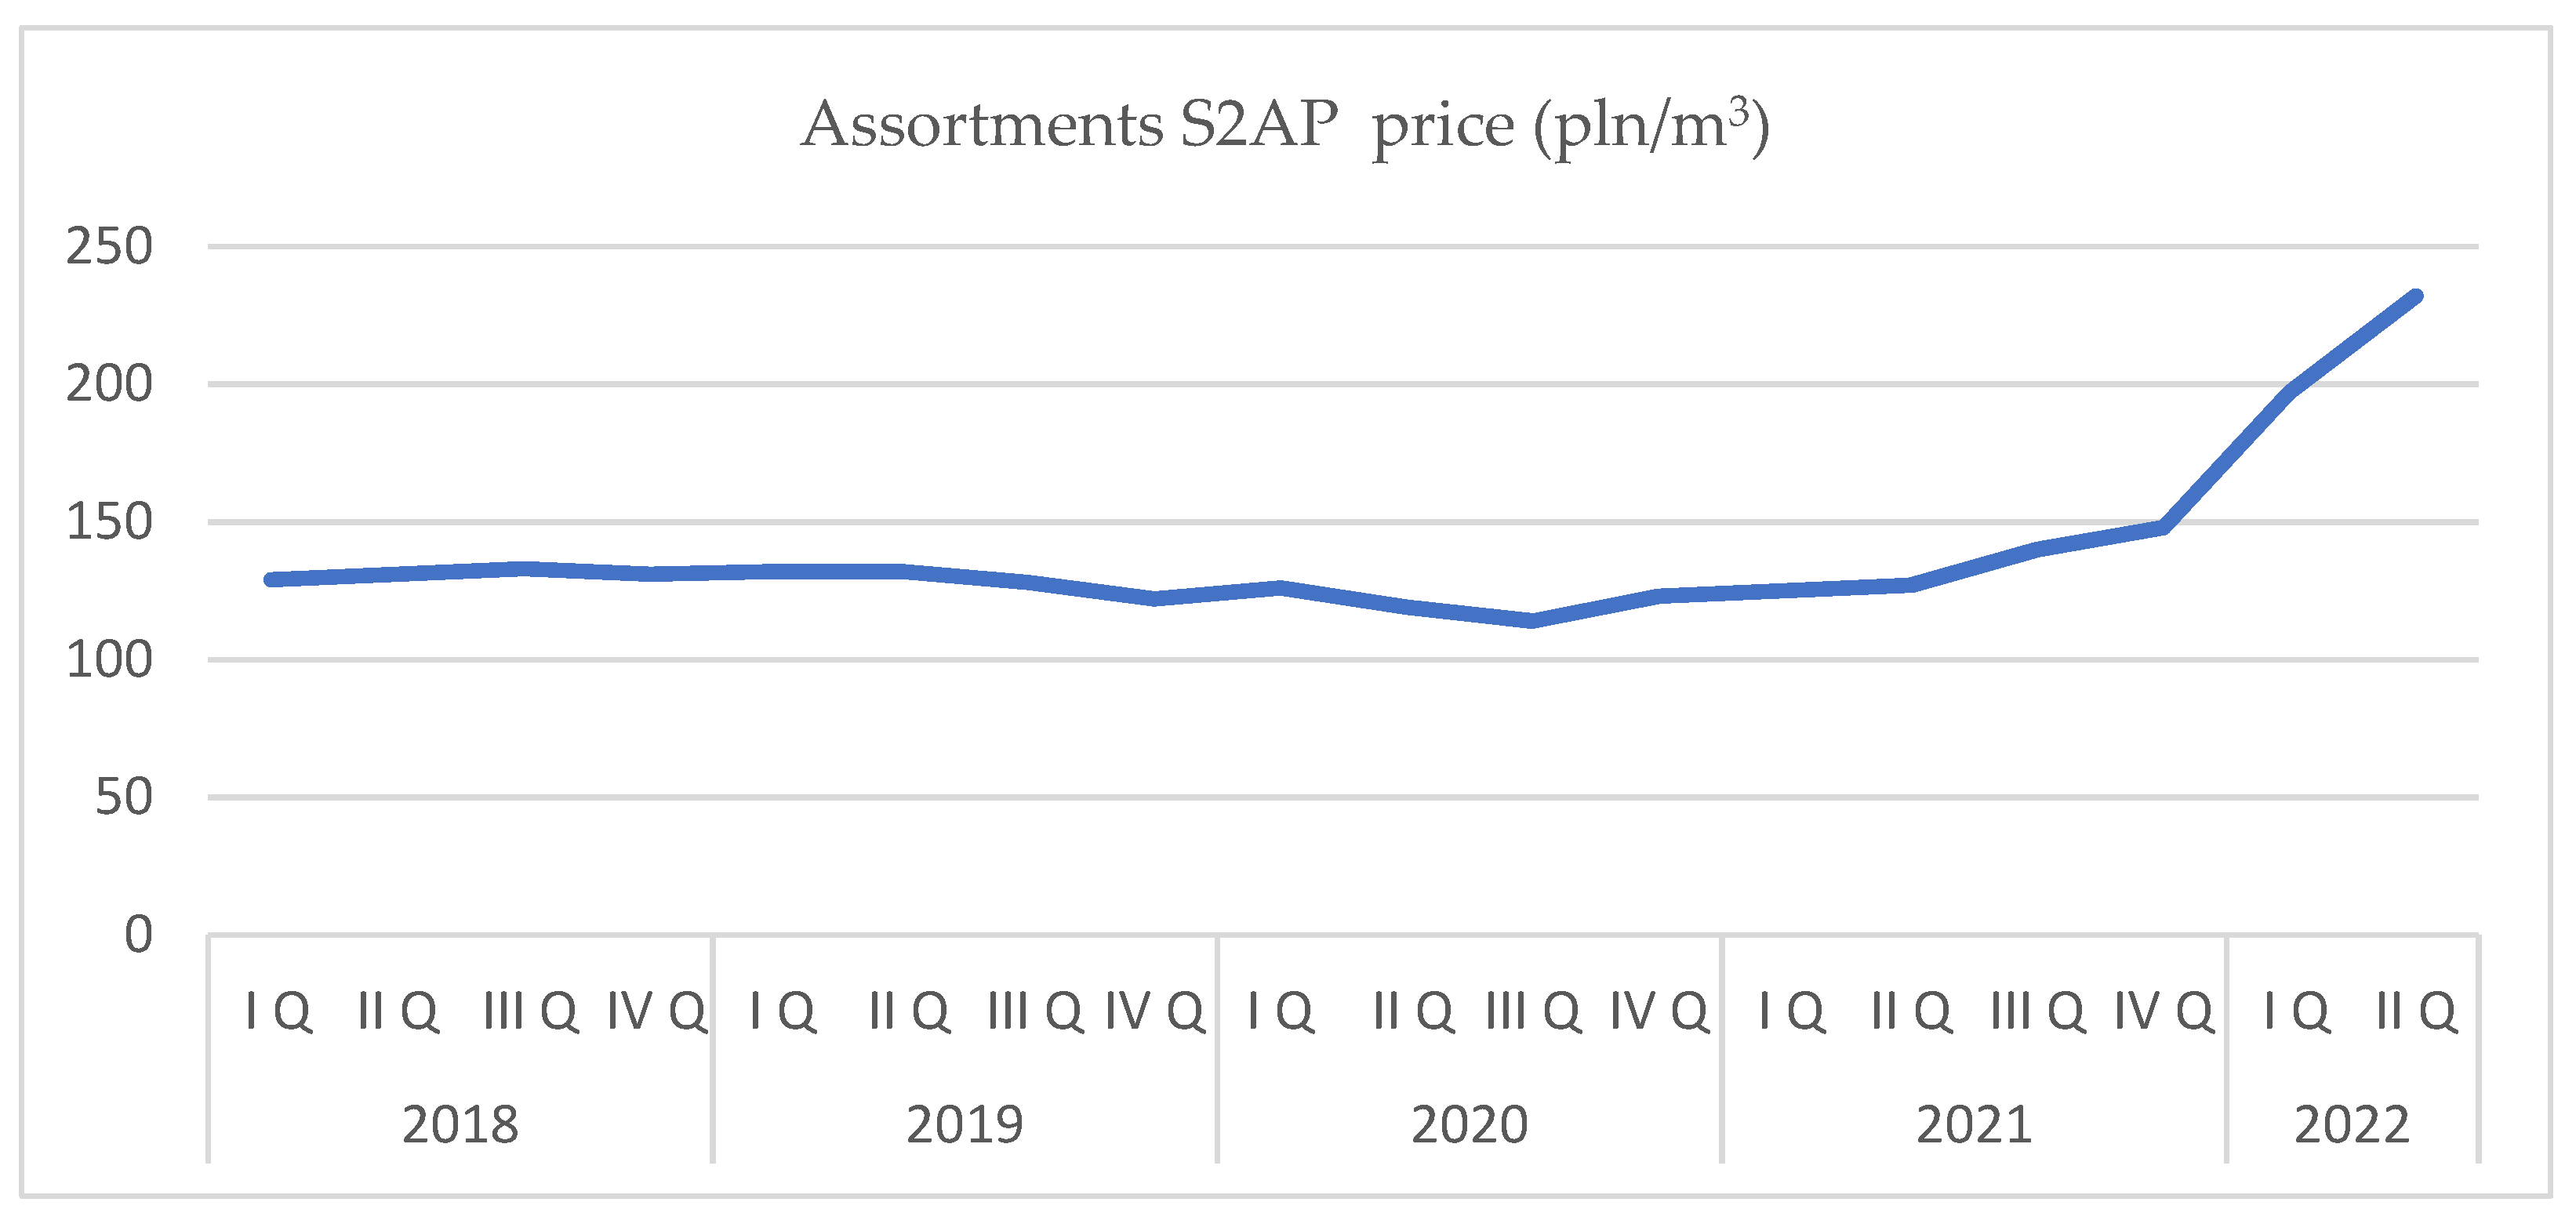
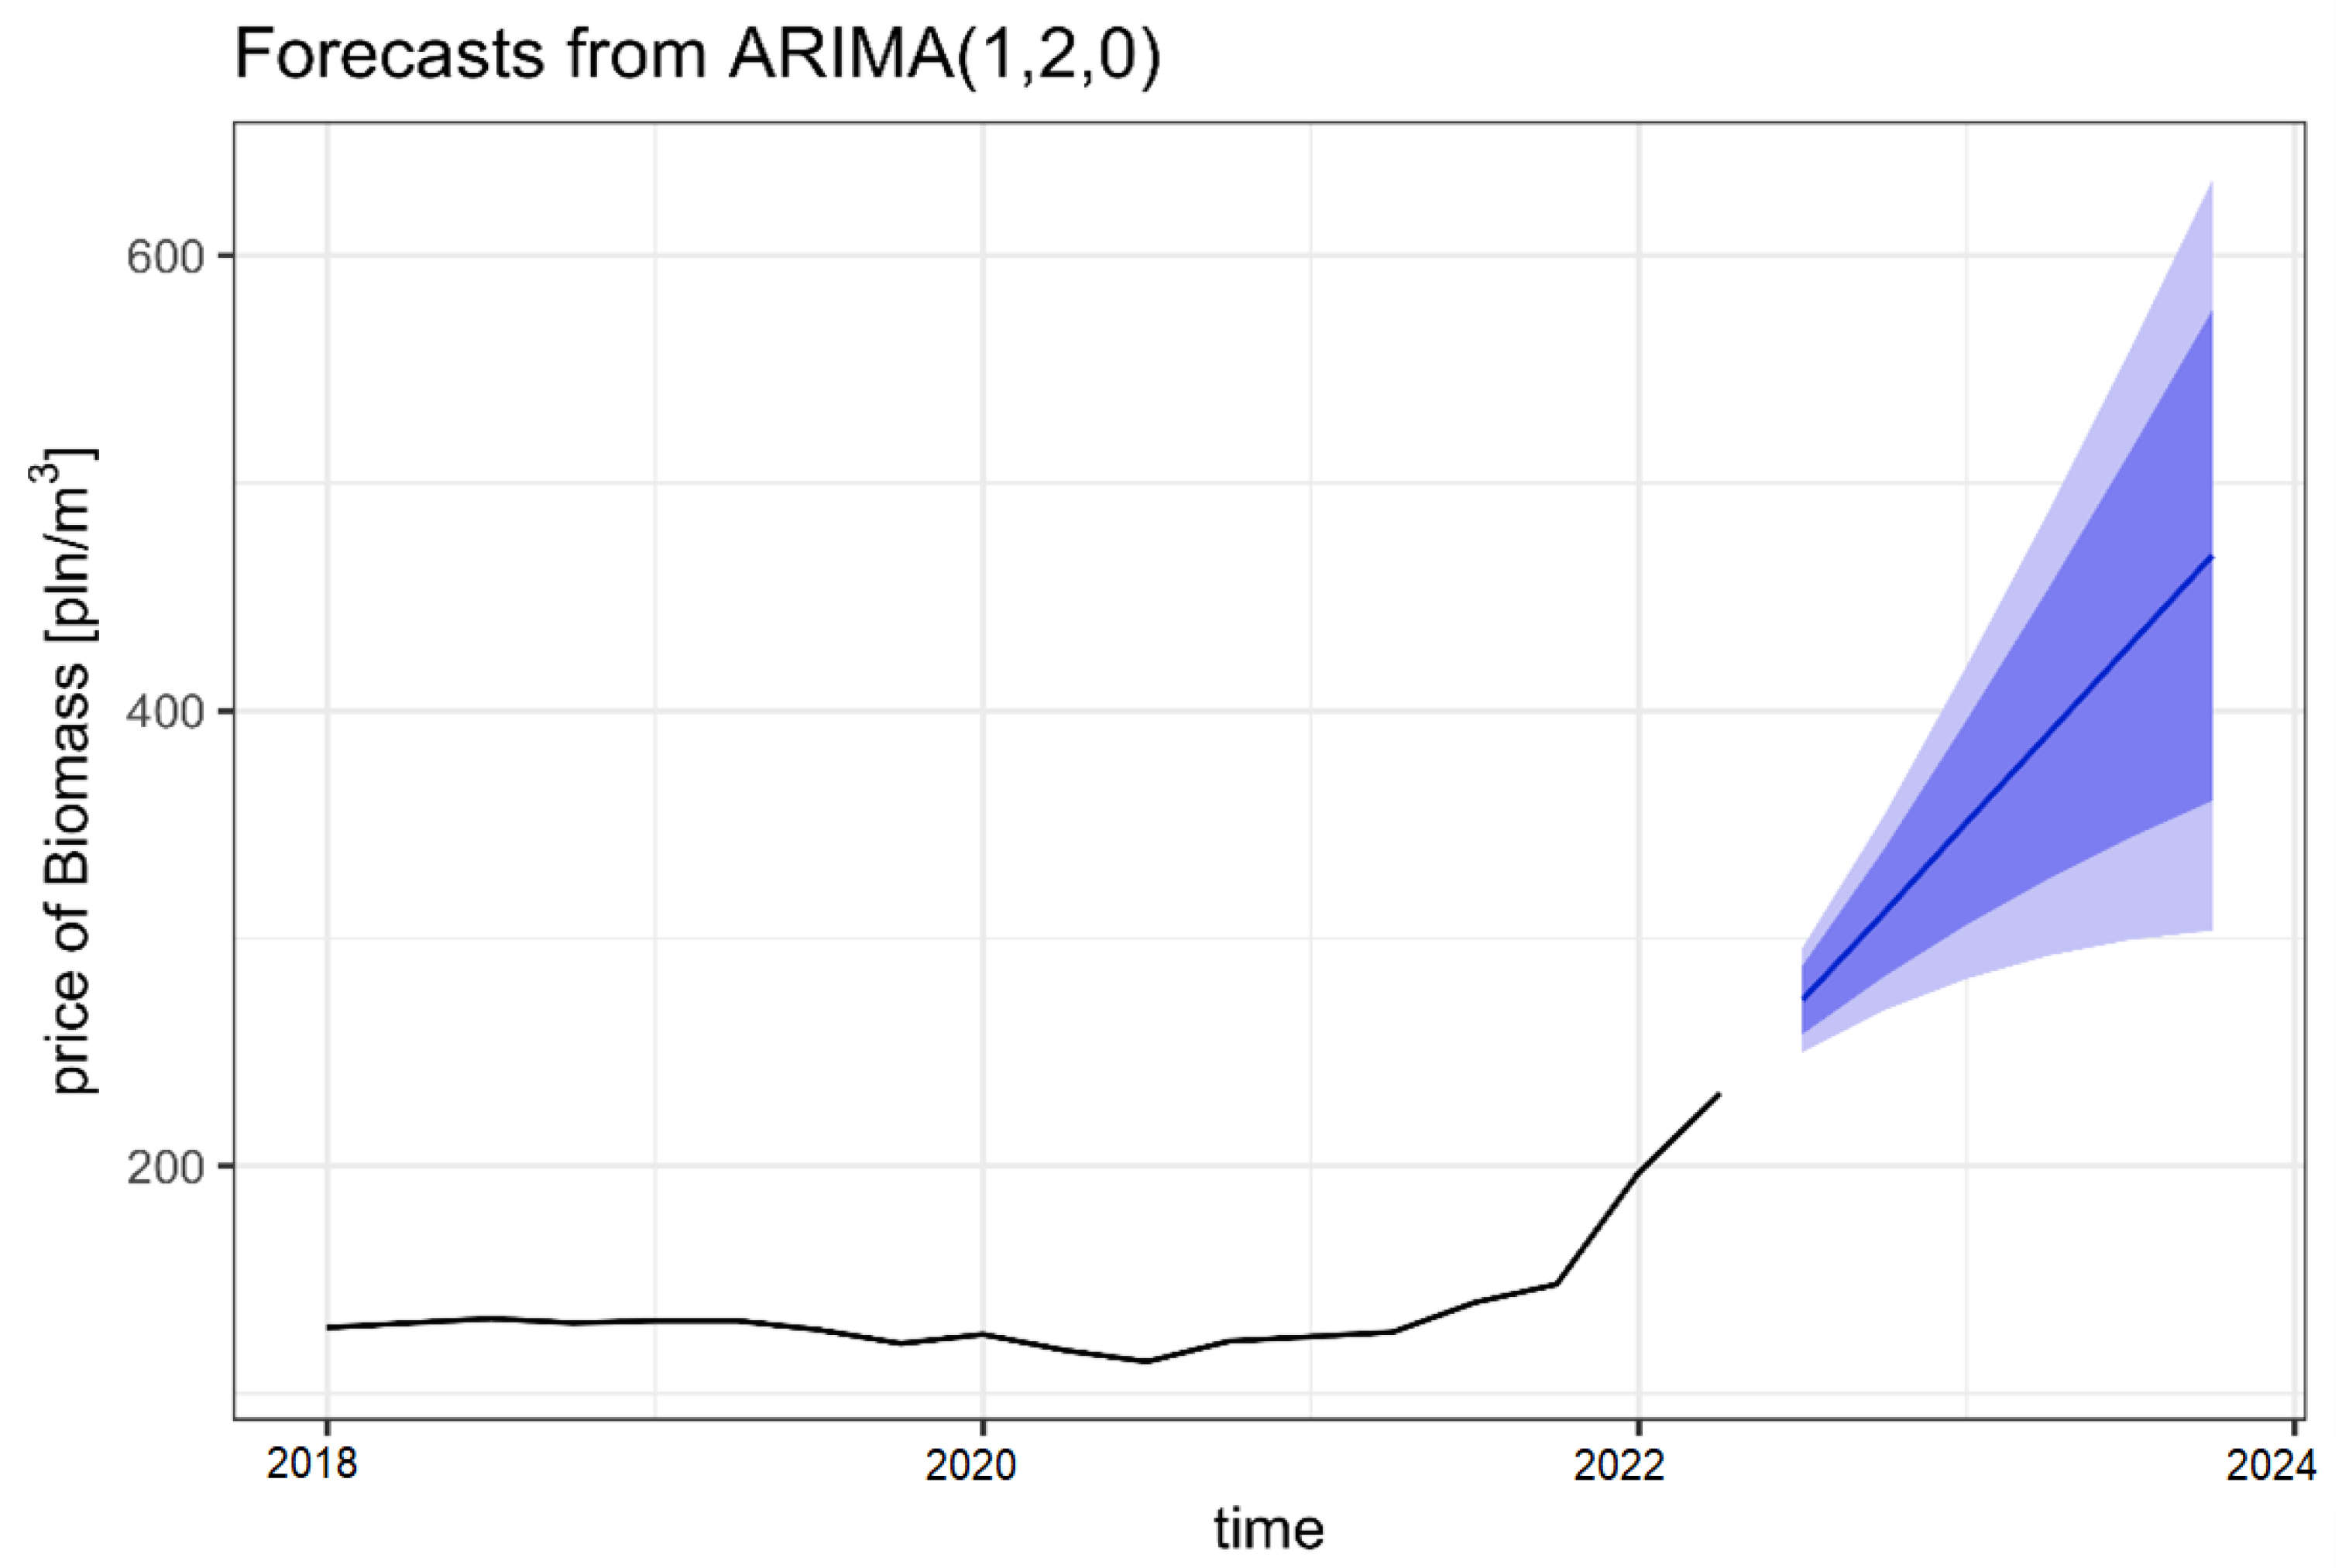
3.3. Forecast for the S2AP Assortment (General Purpose Cordwood)
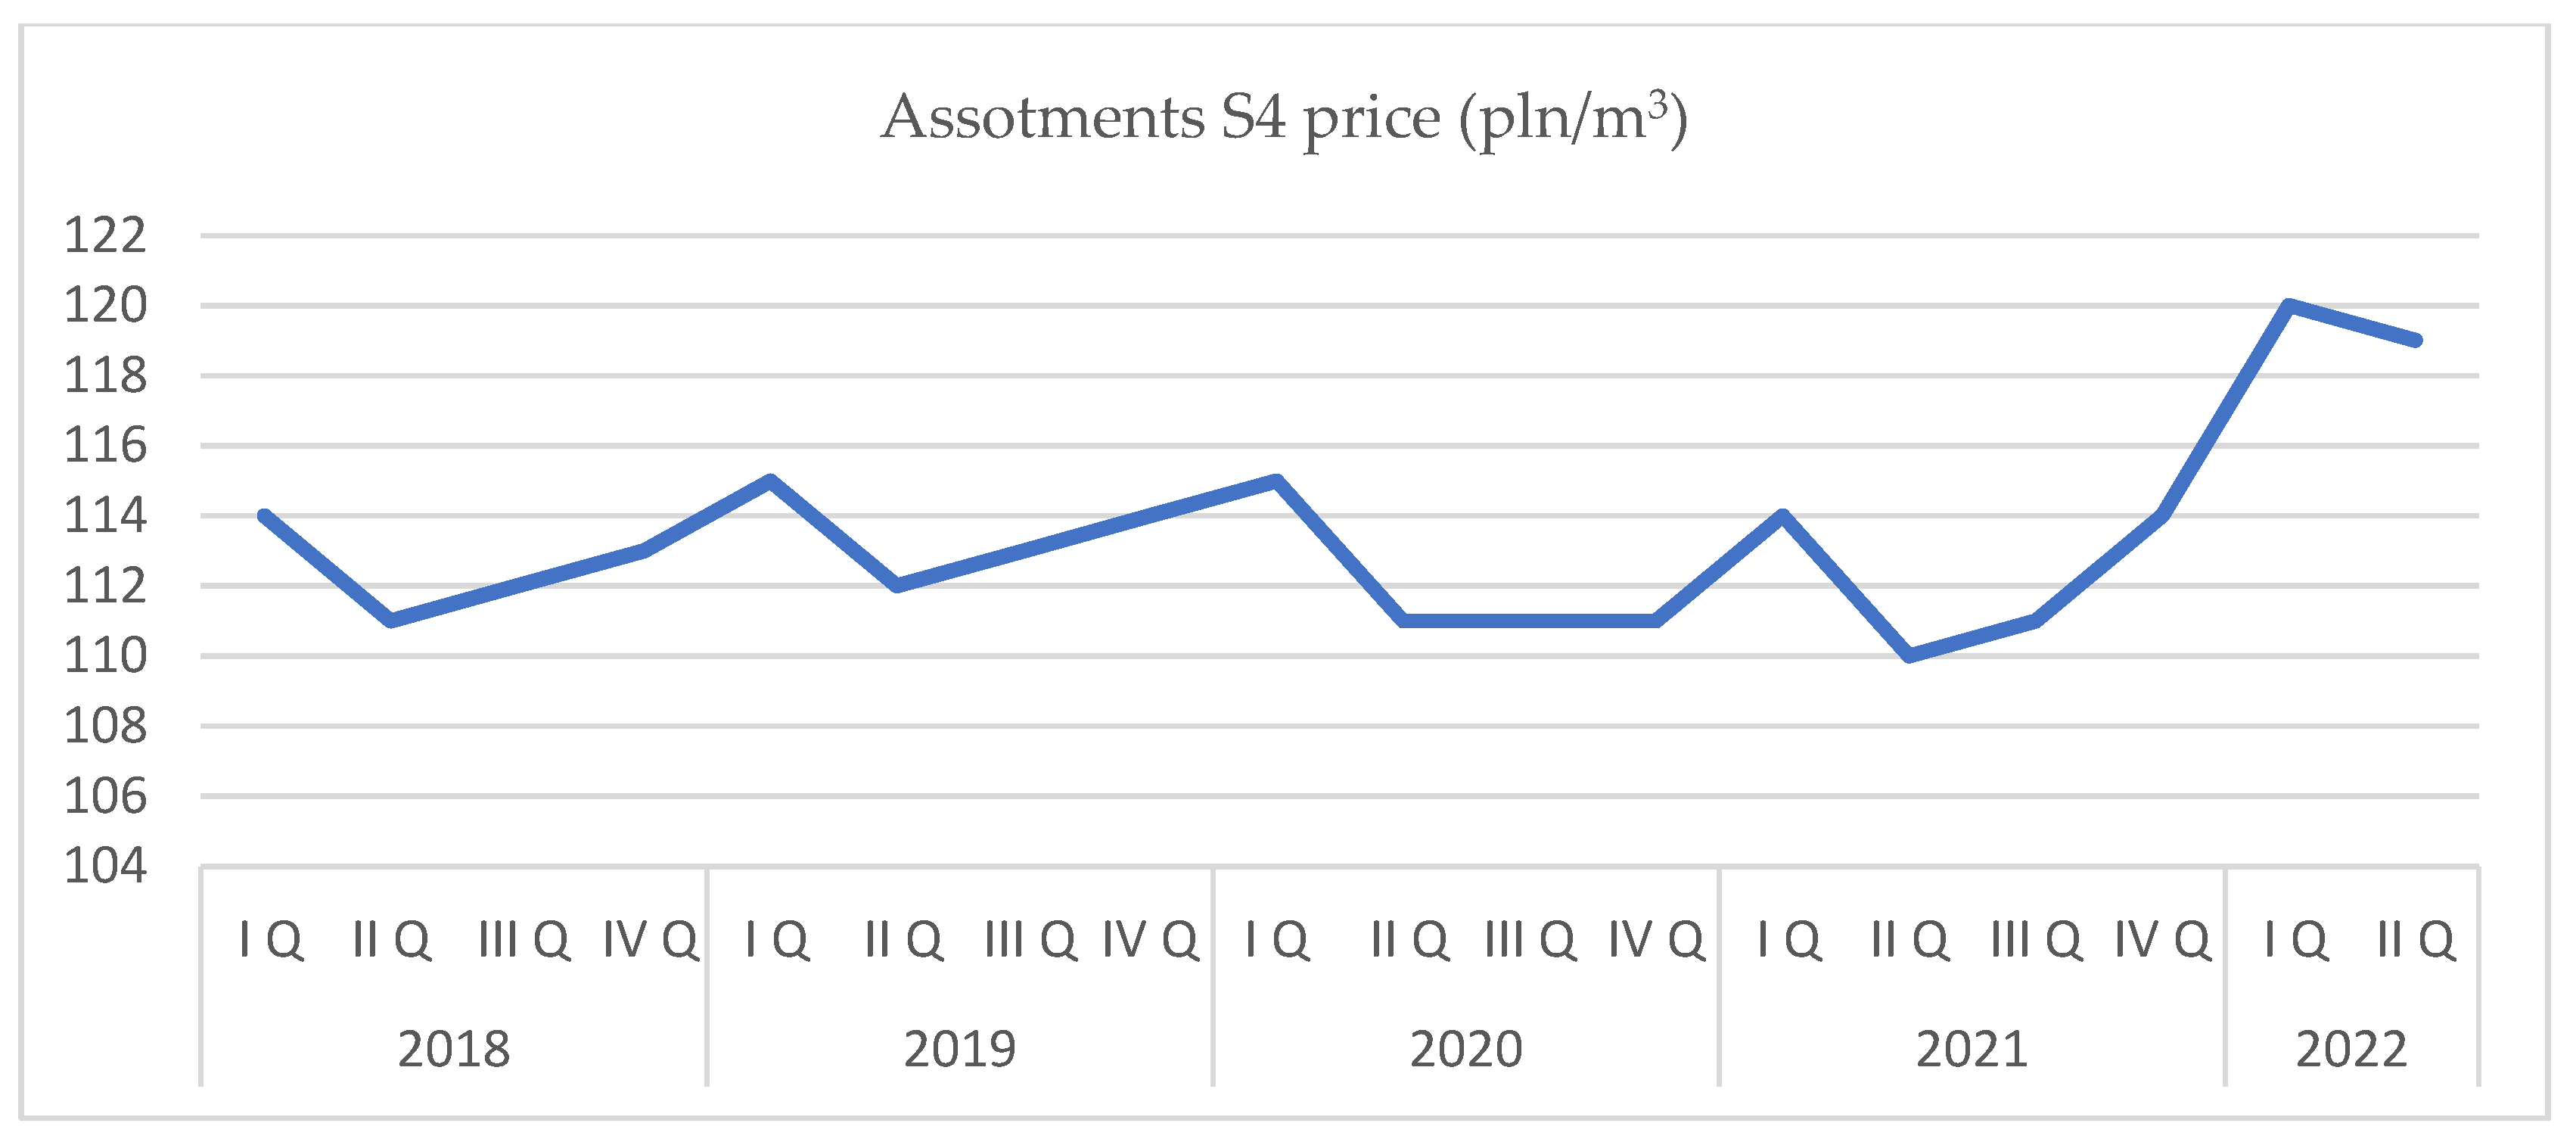
3.4. Forecast for the S4 Assortment (Firewood)
4. Discussion
5. Conclusions
Author Contributions
Funding
Data Availability Statement
Conflicts of Interest
References
- Lundholm, A.; Corrigan, E.; Nieuwenhuis, M. Implementing Climate Change and Associated Future Timber Price Trends in a Decision Support System Designed for Irish Forest Management and Applied to Ireland’s Western Peatland Forests. Forests 2019, 10, 270. [Google Scholar] [CrossRef] [Green Version]
- Hetemäki, L.; Hänninen, R.; Toppinen, A. Short-Term Forecasting Models for the Finnish Forest Sector: Lumber Exports and Sawlog Demand. Forests 2019, 10, 990. [Google Scholar] [CrossRef] [Green Version]
- Hetemäki, L.; Mikkola, J. Forecasting Germany’s Printing and Writing Paper Imports. For. Sci. 2005, 51, 483–497. [Google Scholar] [CrossRef]
- Tzanova, P. Time Series Analysis for Short-Term Forest Sector Market Forecasting. Austrian J. For. Sci. 2017, 134, 2005–2230. [Google Scholar]
- Hlavackova, P.; Brezina, D.; Sujova, A. The Price Formation of Raw Wood in the Czech Republic and a Comparison with the Neighbor States. Procedia Econ. Financ. 2015, 26, 389–395. [Google Scholar] [CrossRef] [Green Version]
- European Green Deal: Commission Proposes Transformation of EU Economy and Society to Meet Climate Ambitions Brussels. 14 July 2021. Available online: https://transport.ec.europa.eu/news/european-green-deal-commission-proposes-transformation-eu-economy-and-society-meet-climate-ambitions-2021-07-14_en (accessed on 12 November 2022).
- Kostadinov, F.; Holm, S.; Steubing, B.; Thees, O.; Lemm, R. Simulation of a Swiss wood fuel and rundwood market: An expolorative study in agent-based modeling. For. Policy Econ. 2014, 38, 105–118. [Google Scholar] [CrossRef]
- Kożuch, A.; Adamowicz, K. Wpływ kosztów realizacji pozaprodukcyjnych funkcji lasu na sytuacje ekonomiczna nadleśnictw Regionalnej Dyrekcji Lasów Państwowych w Krakowie. Sylwan 2016, 160, 1010–1019. [Google Scholar] [CrossRef]
- Niemelä, J.; Young, J.; Alard, D.; Askasibar, M.; Henle, K.; Johnson, R.; Kurttila, M.; Larsson, T.-B.; Matouch, S.; Nowicki, P.; et al. Identifying, managing and monitoring conflicts between forest biodiversity conservation and other human interests in Europe. For. Policy Con. 2005, 7, 877–890. [Google Scholar] [CrossRef]
- Alberdi, I.; Michalak, R.; Fischer, C.; Gasparini, P.; Brändli, U.-B.; Tomter, S.M.; Kuliesis, A.; Snorrason, A.; Redmond, J.; Hernández, L.; et al. Towards harmonized assessment of European forest availability for wood supply in Europe. For. Policy Econ. 2016, 70, 20–29. [Google Scholar] [CrossRef] [Green Version]
- O’Donnell, A.; Cummins, M.; Byrne, K.A. Forestry in the Republic of Ireland: Government policy, grant incentives and carbon 653 sequestration value. Land Use Policy 2013, 35, 16–23. [Google Scholar] [CrossRef]
- Adamowicz, K. Cenowa elastyczność popytu na drewno na pierwotnym lokalnym rynku drzewnym w Polsce. Sylwan 2010, 154, 130–138. [Google Scholar] [CrossRef]
- Gejdoš, M.; Danihelová, Z. Valuation and Timber Market in the Slovak Republic. Procedia Econ. Financ. 2015, 34, 697–703. [Google Scholar] [CrossRef]
- Wysocka-Fiorek, E.; Lachowicz, H. Changes in prices, volume and value of wood raw material sold by the State Forests. Sylwan 2018, 162, 12–21. [Google Scholar] [CrossRef]
- Malinen, J.; Kilpeläinen, H. Price systems for standing sales of industrial roudwood in Finland. Balt. For. 2013, 19, 307–315. [Google Scholar]
- Malinen, J.; Haring, M.; Kilpeläinen, H.; Verkasalo, E. Comparison of alternative roundwood pricing systems—A simulation approach. Silva Fenn. 2015, 49, 13. [Google Scholar] [CrossRef] [Green Version]
- Central Statistical Office. Forestry Statistical Yearbook 2021; Central Statistical Office: Warszawa, Poland, 2021. Available online: https://stat.gov.pl/download/gfx/portalinformacyjny/pl/defaultaktualnosci/5515/13/4/1/rocznik_statystyczny_lesnictwa_2021.pdf (accessed on 2 November 2022).
- Directorate-General of State Forests. Forests in Poland; State Forest Information Center: Warszawa, Poland, 2018. [Google Scholar]
- Directorate-General of State Forests. The State Forests in Numbers 2018; State Forest Information Center: Warszawa, Poland, 2018. Available online: https://www.lasy.gov.pl/pl/informacje/publikacje/do-poczytania/lasy-panstwowe-w-liczbach-1/lasy-panstwowe-w-liczbach-2018.pdf/@@download/file/Lasy%20Pa%C5%84stwowe%20w%20liczbach%202018.pdf (accessed on 2 November 2022).
- Zarzadzenie Nr 68 Dyrektora Generalnego Lasów Panstwowych z Dnia 18 Listopada 2019 r. w Sprawie Prowadzenia Sprzedazy Drewna w Panstwowym Gospodarstwie Lesnym Lasy Panstwowe. (OM-906-1-107/05); State Forest Information Center: Warszawa, Poland, 2005.
- Zarzadzenie Nr 51 Dyrektora Generalnego Lasów Panstwowych z Dnia 16 Sierpnia 2005 r. Zmieniające Zarządzenie Nr 91 Dyrektora Generalnego Lasów Panstwowych, z Dnia 30 Listopada 2001 r, Znak PA-80-121/2001, w Sprawie Prowadzenia Sprzedazy Drewna w Panstwowym Gospodarstwie Lesnym Lasy Panstwowe; (OM-906-1-107/05); State Forest Information Center: Warszawa, Poland, 2005.
- Zarzadzenie nr 46 Dyrektora Generalnegp Lasów Panstwowych z Dnia 24 Pazdziernika 2016r. w Sprawie Sprzedazy Drewna Prowadzonej Przez Panstwowe Gospodarstwo Lesne Lasy Panstwowe; (ZM.800.2.2016); State Forest Information Center: Warszawa, Poland, 2016.
- Adamowicz, K. Ocena wpływu zmian gospodarczych na ilosciowe zmiany podazy surowca drzewnego. Zarządzanie Ochr. Przyr. Lasach 2011, 5, 189–200. [Google Scholar]
- Leskinen, P.; Kangas, J. Modelling Future Timber Price Development by Using Expert Judgments and Time Series Analysis. Silva Fenn. 2001, 35, 93–102. [Google Scholar] [CrossRef] [Green Version]
- Szramka, H.; Bieniaszewski, T.; Auguscik, Ł.; Bobek, J.; Adamowicz, K. Wpływ wad drewna wielkowymiarowego na przychody z jego sprzedazy. Sylwan 2017, 161, 238–246. [Google Scholar] [CrossRef]
- Suchodolski, P.; Idzik, M. Identyfikacja i ocena zmiennosci cen drewna w nadlesnictwie Płock. Wiadomosci Stat. 2018, 11, 41–55. [Google Scholar]
- Borzykowski, N. A supply-demand modeling of the Swiss roundwood market: Actors responsiveness and CO2 implications. For. Policy Econ. 2019, 102, 100–113. [Google Scholar] [CrossRef]
- Holm, S.; Hilty, L.M.; Lemm, R.; Thees, O. Empirical validation of an agent-based model of wood markets in Switzerland. PLoS ONE 2018, 13, e0190605. [Google Scholar] [CrossRef] [Green Version]
- Knauf, M. An Analysis of Wood Market Balance Modeling in Germany. For. Policy Con. 2015, 50, 319–326. [Google Scholar] [CrossRef]
- Koskela, E.; Ollikainen, M. A game-theoretic model of timber prices with capital stock: An empirical application to the Finnish pulp and paper industry. Can. J. For. Res. 1998, 28, 1481–1493. [Google Scholar] [CrossRef]
- Lachowicz, H.; Wysocka-Fijorek, E. Silver birch timber market in Poland in 2008−2012. Sylwan 2016, 160, 971–980. [Google Scholar] [CrossRef]
- Olsson, O.; Hillring, B. Price relationships and market integration in the Swedish wood fuel market. Biomass Bioenergy 2013, 57, 78–85. [Google Scholar] [CrossRef]
- Paschalis−Jakubowicz, P.; Kulik, P.; Lachowicz, H. Obrót surowcem drzewnym najwyższych klas jakosci w Polsce. Sylwan 2015, 159, 91–102. [Google Scholar] [CrossRef]
- Prestemon, J.P.; Holmes, T.P. Timber price dynamics following a natural catastrophe. Am. J. Agric. Econ. 2000, 82, 145–160. [Google Scholar] [CrossRef]
- Zając, S. Analiza ekonometryczna i prognozowanie zjawisk i procesów rynku surowca drzewnego w Polsce. Pr. IBL Ser. A 1999, 886, 1–133. [Google Scholar] [CrossRef]
- Penttinen, M.J. Impact of stochastic price and growth processes on optimal rotation age. Eur. J. Forest Res. 2006, 125, 335–343. [Google Scholar] [CrossRef]
- Khajuria, R.P.; Kant, S.; Laaksonen-Craig, S. Modeling of timber harvesting options using timber prices as a mean reverting process with stochastic trend. Can. J. For. Res. 2011, 42, 179–189. [Google Scholar] [CrossRef]
- Gonzalez-Gomez, M.; Bergen, V. Berücksichtigung der Nichtstationarität von Zeitreihen bei empirischen Untersuchungen des deutschen Rohholzmarktes. Allg. Forst J.-Ztg 2014, 186, 53–62. [Google Scholar]
- Kolo, H.; Tzanova, P. Forecasting the German forest products trade: A vector error correction model. JFE 2017, 26, 30–45. [Google Scholar] [CrossRef]
- Buongiorno, J. Global modelling to predict timber production and prices: The GFPM approach. Forestry 2015, 88, 291–303. [Google Scholar] [CrossRef]
- Gejdoš, M.; Lieskovský, M.; Giertliová, B.; Nĕmec, M.; Danihelová, Z. Prices of Raw-Wood Assortments in Selected Markets of Central Europe and their Development in the Future. Bioresources 2019, 14, 2995–3011. [Google Scholar] [CrossRef]
- Toppinen, A.; Kuuluvainen, J. Forest sector modelling in Europe—The state of the art and future research directions. For. Policy Econ. 2010, 12, 2–8. [Google Scholar] [CrossRef]
- National Bank of Poland. Exchange Rate of the Polish National Bank. Available online: https://www.nbp.pl/home.aspx?f=/statystyka/kursy.html (accessed on 4 August 2022).
- Central Statistical Office. Inflation Coeficients in Poland. Available online: https://stat.gov.pl/obszarytematyczne/ceny-handel/wskazniki-cen/wskazniki-cen-towarow-i-uslug-konsumpcyjnych-pot-inflacja-/miesieczne-wskazniki-cen-towarow-i-uslug-konsumpcyjnych-od-1982-roku/ (accessed on 4 August 2022).
- Shiskin, J.; Young, A.H.; Musgrave, J.C. The X-11 Variant of the Census Method II Seasonal Adjustment Program; Technical Paper 15; US Government Printing Office: Washington, DC, USA, 1967.
- Hodrick, R.; Prescott, E.C.; Postwar, U.S. Business Cycles: An Empirical Investigation. J. Money Credit Bank. 1997, 29, 1–16. Available online: http://www.jstor.org/stable/2953682?origin=JSTOR-pdf (accessed on 13 November 2022). [CrossRef]
- Leskinen, P.; Kangas, J. Modelling and simulation of timber prices for forest planning calculations. Scand. J. For. Res. 1998, 13, 469–476. [Google Scholar] [CrossRef]
- Michinaka, T.; Kuboyama, H.; Tamura, K.; Oka, H.; Yamamoto, N. Forecasting Monthly Prices of Japanese Logs. Forests 2016, 7, 94. [Google Scholar] [CrossRef] [Green Version]
- Prestemon, J.P. Evaluation of U.S. southern pine stumpage market informational efficiency. Can. J. For. Res. 2003, 33, 561–572. [Google Scholar] [CrossRef]
- Zhou, M.; Buongiorno, J. Space-Time Modeling of Timber Prices. J. Agric. Resour. Econ. 2006, 31, 40–56. Available online: https://www.jstor.org/stabilny/40987305 (accessed on 13 November 2022).
- Malaty, R.; Toppinen, A.; Viitanen, J. Modelling and forecasting Finnish pine sawlog stumpage prices using alternative time-series methods. Can. J. For. Res. 2006, 37, 178–187. [Google Scholar] [CrossRef]
- Bolkesjø, T.F. Projecting pulpwood prices under different assumptions on future capacities in the pulp and paper industry. Silva Fenn. 2005, 39, 103–116. [Google Scholar] [CrossRef] [Green Version]
- Dahal, P.; Mehmood, S. Determinants of timber bid prices in Arkansas. For. Prod. J. 2005, 55, 89–94. [Google Scholar]
- Kallio, A. Analysing the Finnish pulpwood market under alternative hypotheses of competition. Can. J. For. Res. 2011, 31, 236–245. [Google Scholar] [CrossRef]
- Sun, C.; Zhang, D. Assessing the Financial Performance of Forestry Related Investment Vehicles: Capital Asset Pricing Model vs. Arbitrage Pricing Theory. Am. J. Agric. Econ. 2001, 83, 617–628. Available online: https://www.jstor.org/stabilny/1245091 (accessed on 13 November 2022). [CrossRef]
- Kagalwala, A. kpsstest: A command that implements the Kwiatkowski, Phillips, Schmidt, and Shin test with sample-specific critical values and reports p-values. Stata J. 2022, 22, 269–292. [Google Scholar] [CrossRef]
- Ning, Z.; Sun, C. Vertical price transmission in timber and lumber markets. J. For. Econ. 2014, 20, 17–32. [Google Scholar] [CrossRef]
- Klepacka, A.M.; Siry, J.P.; Bettinger, P. Stumpage prices: A review of influential factors. Int. For. Rev. 2017, 19, 158–169. [Google Scholar] [CrossRef]
- da Silva, B.K.; Schon, S.Z.; Cubbage, F.W.; Parajuli, R. Spatial and cross-product price linkages in the Brazilian pine timber markets. For. Pol. Econ. 2020, 17, 102186. [Google Scholar] [CrossRef]
- Gan, J.; Tian, N.; Choi, J.; Pelkki, M.H. Synchronized movement between US lumber futures and southern pine sawtimber prices and COVID-19 impacts. Can. J. For. Res. 2022, 52, 614–621. [Google Scholar] [CrossRef]
- Fuhrmann, M.; Dißauer, C.; Strasser, C.; Schmid, E. Analysing price cointegration of sawmill by-products in the forest-based sector in Austria. For. Policy Econ. 2021, 131, 102560. [Google Scholar] [CrossRef]
- Broz, D.R.; Viego, V.N. Forecasting Prices of Manufactured Pinus spp. Using ARIMA Models. Madera Bosques 2014, 20, 37–46. Available online: https://www.scielo.org.mx/pdf/mb/v20n1/v20n1a4.pdf (accessed on 4 August 2022). [CrossRef] [Green Version]
- Koutroumanidis, T.; Ioannou, K.; Arabatzis, G. Predicting fuelwood prices in Greece with the use of ARIMA models, artificial neural networks and a hybrid ARIMA–ANN model. Energy Policy 2009, 37, 3627–3634. [Google Scholar] [CrossRef]
- Soares, N.S.; da Silva, M.L.; de Rezende, J.L.P.; de Lima, J.E.; de Carvalho, K.H.A. Eucalyptus spp. wood price forecasting model. Cerne 2010, 16, 041–052. [Google Scholar]
- Yin, R. Forecasting short-term timber prices with univariate ARIMA models. South. J. Appl. For. 1999, 23, 53–58. [Google Scholar] [CrossRef] [Green Version]
- Palander, T.; Vesa, L. Data-Driven Optimization of Forestry and Wood Procurement toward Carbon-Neutral Logistics of Forest Industry. Forests 2022, 13, 759. [Google Scholar] [CrossRef]
- Buratto, D.A.; Junior, R.T.; Silva, J.C.G.L.; Frega, J.R.; Wiecheteck, M.S.S.A.; Silva, C.A. Use of artificial neural networks and ARIMA to forecasting consumption sawnwood of Pinus sp. in Brazil. Int. For. Rev. 2019, 21, 51–61. [Google Scholar] [CrossRef]
- de Almeida, A.N.; de Souza, V.S.; de Loyola, C.E.; Bittencourt, M.V.L.; da Silva, J.C.G.L. Parana’s plywood external price analysis using the Box & Jenkins methodology. Sci. For. 2009, 37, 61–69. [Google Scholar]
- Reichert, B.; Souza, A.M. Forecast and interactions of the brazilian cellulose prices in the internal and external markets. Ciênc. Florest. 2020, 30, 501–515. [Google Scholar] [CrossRef]
- Cordeiro, S.A.; Soares, N.S.; Braga, M.J.; da Silva, M.L. Export price forecast of Brazilian pine sawn wood. Sci. For. 2010, 38, 205–214. [Google Scholar]
- Soares, N.S.; da Silva, M.L.; de Lima, J.E.; Cordeiro, S.A. Analysis of forecasting the price of natural rubber in Brazil. Sci. For. 2008, 36, 285–294. [Google Scholar]
- Lim, J.H.; Kim, Y.K.; Min, S.H.; Kim, S.W.; Lee, Y.H.; Lee, J.M. Seasonal Trends of Viral Prevalence and Incidence of Kawasaki Disease: A Korea Public Health Data Analysis. J. Clin. Med. 2021, 10, 3301. [Google Scholar] [CrossRef] [PubMed]
- Jiang, S.; Yang, C.; Guo, J.; Ding, Z. ARIMA forecasting of China’s coal consumption, price and investment by 2030. Energy Sources 2018, 13, 190–195. [Google Scholar] [CrossRef]
- Wang, M.; Pan, J.; Li, X.; Li, M.; Liu, Z.; Zhao, Q.; Wang, Y. ARIMA and ARIMA-ERNN models for prediction of pertussis incidence in mainland China from 2004 to 2021. BMC Public Health 2022, 22, 1447. [Google Scholar] [CrossRef] [PubMed]
- Ilie, O.D.; Ciobica, A.; Doroftei, B. Testing the Accuracy of the ARIMA Models in Forecasting the Spreading of COVID-19 and the Associated Mortality Rate. Medicina 2020, 56, 566. [Google Scholar] [CrossRef] [PubMed]
- Doroftei, B.; Ilie, O.D.; Anton, N.; Timofte, S.I.; Ilea, C. Mathematical Modeling to Predict COVID-19 Infection and Vaccination Trends. J. Clin. Med. 2022, 11, 1737. [Google Scholar] [CrossRef]
- Giglio, N.; Lasalvia, P.; Pawaskar, M.; Parellada, C.I.; Rojas, Y.G.; Micone, P.; Neyro, S.E. Trends in Varicella Burden of Disease Following Introduction of Routine Childhood Varicella Vaccination in Argentina: A 12-Year Time Series Analysis. Vaccines 2022, 10, 1151. [Google Scholar] [CrossRef]
- Lim, J.H.; Kim, Y.K.; Min, S.H.; Kim, S.W.; Lee, Y.H.; Lee, J.M. Epidemiology and viral etiology of pediatric immune thrombocytopenia through Korean public health data analysis. J. Clin. Med. 2021, 10, 1356. [Google Scholar] [CrossRef]
- Tian, N.; Zheng, J.X.; Guo, Z.Y.; Li, L.H.; Xia, S.; Lv, S.; Zhou, X.N. Dengue Incidence Trends and Its Burden in Major Endemic Regions from 1990 to 2019. Trop. Med. Infect. Dis. 2022, 7, 180. [Google Scholar] [CrossRef]
- Li, S.; Li, R. Comparison of forecasting energy consumption in Shandong, China Using the ARIMA model, GM model, and ARIMA-GM model. Sustainability 2017, 9, 1181. [Google Scholar] [CrossRef] [Green Version]
- Xu, Y.Q.; Xu, G.X.; An, Z.L.; Liu, Y.B. EPSTO-ARIMA: Electric Power Stochastic Optimization Predicting Based on ARIMA. In Proceedings of the IEEE 9th International Conference on Smart City and Informatization, Shenyang, China, 20–22 October 2021; pp. 70–75. [Google Scholar]
- bin Shabri, M.A.; Samsudin, R.; Ilman, A.B. Recent Trends in Information and Communication Technology. Book Ser. Lect. Notes Data Eng. Commun. Technol. 2018, 5, 449–458. [Google Scholar] [CrossRef]
- Shahriar, S.A.; Kayes, I.; Hasan, K.; Hasan, M.; Islam, R.; Awang, N.R.; Salam, M.A. Potential of Arima-ann, Arima-SVM, dt and catboost for atmospheric PM2.5 forecasting in bangladesh. Atmosphere 2021, 12, 100. [Google Scholar] [CrossRef]
- Mehedintu, A.; Sterpu, M.; Soava, G. Estimation and Forecasts for the Share of Renewable Energy Consumption in Final Energy Consumption by 2020 in the European Union. Sustainability 2018, 10, 1515. [Google Scholar] [CrossRef] [Green Version]
- Alquraish, M.; Ali Abuhasel, K.S.; Alqahtani, A.; Khadr, M. SPI-Based Hybrid Hidden Markov–GA, ARIMA–GA, and ARIMA–GA–ANN Models for Meteorological Drought Forecasting. Sustainability 2021, 13, 12576. [Google Scholar] [CrossRef]
- Li, S.; Yang, X.; Li, R. Forecasting China’s coal power installed capacity: A comparison of MGM, ARIMA, GM-ARIMA, and NMGM models. Sustainability 2018, 10, 506. [Google Scholar] [CrossRef] [Green Version]
- Jiang, F.; Yang, X.; Li, S. Comparison of forecasting India’s energy demand using an MGM, ARIMA model, MGM-ARIMA model, and BP neural network model. Sustainability 2018, 10, 2225. [Google Scholar] [CrossRef] [Green Version]
- Li, S.; Yang, X.; Li, R. Forecasting coal consumption in India by 2030: Using linear modified linear (MGM-ARIMA) and linear modified nonlinear (BP-ARIMA) combined models. Sustainability 2019, 11, 695. [Google Scholar] [CrossRef] [Green Version]
- Musarat, M.A.; Alaloul, W.S.; Rabbani, M.B.A.; Ali, M.; Altaf, M.; Fediuk, R.; Farooq, W. Kabul river flow prediction using automated ARIMA forecasting: A machine learning approach. Sustainability 2021, 13, 10720. [Google Scholar] [CrossRef]
- Wang, H.; Huang, J.; Zhou, H.; Zhao, L.; Yuan, Y. An integrated variational mode decomposition and arima model to forecast air temperature. Sustainability 2019, 11, 4018. [Google Scholar] [CrossRef] [Green Version]
- Hussin, N.H.; Yusof, F.; Jamaludin, A.R.; Norrulashikin, S.M. Forecasting Wind Speed in Peninsular Malaysia: An Application of ARIMA and ARIMA-GARCH Models. Pertanika J. Sci. Technol. 2021, 29, 31–58. [Google Scholar] [CrossRef]
- Zhang, X.C.; Zhou, Q.C.; Weng, S.J.; Zhang, H. ARIMA Model-Based Fire Rescue Prediction. Hindawi Volume 2021, 2021, 3212138. [Google Scholar] [CrossRef]
- Yenidogan, I.; Cayir, A.; Kozan, O.; Dag, T.; Arslan, C. Bitcoin Forecasting Using ARIMA and PROPHET. In Proceedings of the 3rd International Conference on Computer Science and Engineering (UBMK), Sarajevo, Bosnia and Herzegovina, 20–23 September 2018; pp. 621–624. [Google Scholar] [CrossRef]
- Sapsford, D.; Varoufakis, Y. An ARIMa Analysis of Tea Prices. J. Agric. Econ. 1987, 38, 329–334. [Google Scholar] [CrossRef]
- Fattah, J.; Ezzine, L.; Aman, Z.; El Moussami, H.; Lachhab, A. Forecasting of demand using ARIMA model. Int. J. Eng. Bussines Manag. 2018, 10, 1847979018808673. [Google Scholar] [CrossRef] [Green Version]
- Simanov, V. Fuel, or Assortment for Energy Use? 2009. Available online: https://biom.cz/upload/9982d8381d3da848a8072e06cf96ec87/CZ_Biom_Biomasa_a_Energetika_2009_Sbornik.pdf (accessed on 27 July 2022).
- Němec, M.; Dado, M.; Danihelová, Z. Document A study on occupational noise exposure of sawmill workers. Akustika 2014, 21, 31–34. [Google Scholar]
- Mehrotra, S.N.; Kant, S.; Majumdar, I. Industry Cycles in the US Softwood Lumber Industry: 1985 through 2010. For. Prod. J. 2014, 64, 116–125. [Google Scholar] [CrossRef]
- Petersen, B.; Strongin, S. Why are some industries more cyclical than others? J. Bus. Econ. Stat. 1996, 14, 189–198. [Google Scholar]
- Wear, D.N.; Prestemon, J.P.; Foster, M.O. US Forest Products in the Global Economy. J. For. 2016, 114, 483–493. [Google Scholar] [CrossRef]
- Riddle, A. COVID-19 and the US Timber Industry (Updated 29 July 2021); Congressional Research Service: Washington, DC, USA, 2021.
- Toppinen, A.; Kuuluvainen, J. Structural changes in sawlog and pulpwood markets in Finland. Scand. J. Forest Res. 1997, 12, 382–389. [Google Scholar] [CrossRef]
- Solberg, B. An Econometric Analysis of Timber Supply in Eight Northwestern European Countries; EFI Technical Report No. 44; European Forest Institute: Joensuu, Finland, 2011; Available online: https://efi.int/publicationsbank/econometric-analysis-timber-supply-eight-northwestern-european-countries (accessed on 4 August 2022).
- Tian, N.; Poudyal, N.C.; Augé, R.M.; Hodges, D.G.; Young, T.M. Meta-Analysis of Price Responsiveness of Timber Supply. For. Prod. J. 2017, 67, 152–163. [Google Scholar] [CrossRef]
- Kożuch, A.; Banaś, J. The Dynamics of Beech Roundwood Prices in Selected Central European Markets. Forests 2020, 11, 902. [Google Scholar] [CrossRef]
- Polyakov, M.; Wear, D.N.; Huggett, R.N. Harvest Choice and Timber Supply Models for Forest Forecasting. For. Sci. 2010, 56, 344–355. [Google Scholar] [CrossRef]
- Zwirglmaier, K. Seasonality of Prices—The Example of German Timber Prices. Technisce Universitat Munchen 2010. Available online: http://www.gipecofor.org/doc/drupal/liens_article/evenements/2010/ZWIRGLMAIER_IUFRO_Paris_Mai2010.pdf (accessed on 4 August 2022).
- Ghosh, S. Forecasting of demand using ARIMA model. Am. J. Appl. Math. Comput. 2020, 1, 11–18. [Google Scholar] [CrossRef]
- Hýsek, Š.; Löwe, R.; Turčáni, M. What Happens to Wood after a Tree Is Attacked by a Bark Beetle? Forests 2021, 12, 1163. [Google Scholar] [CrossRef]
- Górna, A. Wpływ klęsk żywiołowych na cenę surowca drzewnego w Polsce. Acta Sci. Pol. Silv. Colendar. Ratio Ind. Lignar. 2021, 20, 161–165. [Google Scholar] [CrossRef]
- Sikora, A.T. The effect of natural disasters on the timber market. For. Res. Papers 2017, 78, 277–284. [Google Scholar] [CrossRef] [Green Version]
- Kuboyama, H.; Tachibana, S. Statistical analysis on price trend of softwood roundwood. Kanto J. For. Res 2014, 65, 9–12. [Google Scholar]
- Fernández-Fernández, M.; Naves, P.; Musolin, D.L.; Selikhovkin, A.V.; Cleary, M.; Chira, D.; Paraschiv, M.; Gordon, T.; Solla, A.; Papazova-Anakieva, I.; et al. Pine Pitch Canker and Insects: Regional Risks, Environmental Regulation, and Practical Management Options. Forests 2019, 10, 649. [Google Scholar] [CrossRef]
- Pellet Market in Europe after Pressure of War in Ukraine. Available online: https://www.drewno.pl/artykuly/12552,rynek-peletu-w-europie-po-presja-wojny-na-ukrainie.html (accessed on 29 November 2022).


| Time | Point Forecast (pln/m3) | Lo 80 * (pln/m3) | Hi 80 * (pln/m3) | Lo 95 * (pln/m3) | Hi 95 * (pln/m3) |
|---|---|---|---|---|---|
| 2022 Q3 | 131 | 120.83 | 141.17 | 115.45 | 146.55 |
| 2022 Q4 | 172 | 149.26 | 194.73 | 137.23 | 206.77 |
| 2023 Q1 | 213 | 174.95 | 251.04 | 154.82 | 271.18 |
| Time | Point Forecast (pln/m3) | Lo 80 * (pln/m3) | Hi 80 * (pln/m3) | Lo 95 * (pln/m3) | Hi 95 * (pln/m3) |
|---|---|---|---|---|---|
| 2022 Q3 | 31.79 | 30.96 | 32.61 | 30.52 | 33.05 |
| 2022 Q4 | 32.16 | 30.98 | 33.34 | 30.35 | 33.97 |
| 2023 Q1 | 32.14 | 30.16 | 34.11 | 29.12 | 35.15 |
| Time | Point Forecast (pln/m3) | Lo 80 (pln/m3) | Hi 80 (pln/m3) | Lo 95 (pln/m3) | Hi 95 (pln/m3) |
|---|---|---|---|---|---|
| 2022 Q3 | 272.93 | 257.9 | 287.96 | 249.95 | 295.91 |
| 2022 Q4 | 311.35 | 283.3 | 339.4 | 268.45 | 354.25 |
| 2023 Q1 | 350.83 | 305.94 | 395.72 | 282.18 | 419.48 |
| Time | Point Forecast (pln/m3) | Lo 80 (pln/m3) | Hi 80 (pln/m3) | Lo 95 (pln/m3) | Hi 95 (pln/m3) |
|---|---|---|---|---|---|
| 2022 Q3 | 123 | 121.38 | 124.62 | 120.53 | 125.47 |
| 2022 Q4 | 129 | 125.39 | 132.61 | 123.47 | 134.53 |
| 2023 Q1 | 138 | 131.95 | 144.06 | 128.75 | 147.25 |
| Assortments | M2ZE (pln/m3) | M2 (pln/m3) | S2AP (pln/m3) | S4 (pln/m3) |
|---|---|---|---|---|
| 2022 IIIQ real | 90 | 31 | 232 | 119 |
| 2022 IIIQ forecast | 131 | 31.79 | 272.93 | 123 |
| MAE | 41 | 0.79 | 40.93 | 4 |
| MAPE [%] | 45.56 | 2.55 | 17.64 | 3.36 |
| RMSE | 41 | 0.79 | 40.93 | 4 |
Publisher’s Note: MDPI stays neutral with regard to jurisdictional claims in published maps and institutional affiliations. |
© 2022 by the authors. Licensee MDPI, Basel, Switzerland. This article is an open access article distributed under the terms and conditions of the Creative Commons Attribution (CC BY) license (https://creativecommons.org/licenses/by/4.0/).
Share and Cite
Górna, A.; Wieruszewski, M.; Szabelska-Beręsewicz, A.; Stanula, Z.; Adamowicz, K. Biomass Price Prediction Based on the Example of Poland. Forests 2022, 13, 2179. https://doi.org/10.3390/f13122179
Górna A, Wieruszewski M, Szabelska-Beręsewicz A, Stanula Z, Adamowicz K. Biomass Price Prediction Based on the Example of Poland. Forests. 2022; 13(12):2179. https://doi.org/10.3390/f13122179
Chicago/Turabian StyleGórna, Aleksandra, Marek Wieruszewski, Alicja Szabelska-Beręsewicz, Zygmunt Stanula, and Krzysztof Adamowicz. 2022. "Biomass Price Prediction Based on the Example of Poland" Forests 13, no. 12: 2179. https://doi.org/10.3390/f13122179