Article

Comparing the Building Code Sawn Lumber’s Wet Service Factors (CM) with Four Commercial Wood Species Laboratory Tests

1
Forest Products Department, Faculty of Forestry and Environment, Bogor Agricultural University, Bogor 16680, Indonesia
2
Civil Engineering Study Program, Faculty of Engineering, Pakuan University, Bogor 16129, Indonesia
3
Computer Science Study Program, Faculty of Mathematics and Natural Sciences, Pakuan University, Bogor 16129, Indonesia
*
Author to whom correspondence should be addressed.
Forests 2022, 13(12), 2094; https://doi.org/10.3390/f13122094
Submission received: 24 October 2022 / Revised: 11 November 2022 / Accepted: 5 December 2022 / Published: 8 December 2022
(This article belongs to the Section Wood Science and Forest Products)

Abstract

:
Indonesian Wooden Building Code (SNI 7973-2013) has adopted the National Design Specification (NDS) for Wood Construction since 2013. A periodic harmonization of the building-code-designated values (i.e., reference design values and adjustment factors) with the experimental data of commercial wood species is necessary. This study aimed to compare the building code’s wet service factors (CM) with the laboratory test of some commercial wood species. Since wood is weaker when its moisture content is high, the wet service factor (CM) must adjust the sawn lumber reference design values if the building serves in wet or aquatic environments. Four commercial wood species, namely pine (Pinus merkusii), agathis (Agathis dammara), red meranti (Shorea leprosula), and mahogany (Swietenia mahagoni), were subjected to mechanical property tests. To calculate the empirical CM values, the mechanical properties tests were conducted on air-dry and wet wood. Instead of testing the full-sized timber, which contains the growth characteristics and defects, this study chose clear-wood specimens to resemble the boundary condition of the ceteris paribus (other things being equal). The wet (water-saturated) specimens were immersed in water for 65 days, and the test was carried out when the specimen was still immersed. The test arrangement imitated the submerged wood as the worst-case scenario of the wet environment where the construction serves, rather than green or partially immersed timber. As many as 40 specimens were tested to compare each mechanical property’s wet service factor; thus, this study reported 200 specimens’ laboratory test results. The empirical CM values to adjust the modulus of elasticity, modulus of rupture, shear strength parallel-to-grain, tensile strength parallel-to-grain, and maximum crushing strength (CM = 0.59, 0.76, 0.65, 0.73, and 0.67, respectively) were significantly lower than SNI 7973-2013 designated values (CM = 0.9, 0.85, 0.97, 1, and 0.8, respectively). The empirical CM for the compression stress perpendicular-to-grain at the proportional limit and that at the 0.04″ deformation (CM = 0.66) were slightly lower than the designated values (CM = 0.67), although they were not significantly different. This study resulted in lower empirical CM values than the designated ones, which found that the building code lacked conservativeness. The lacked conservativeness is mainly attributed to the building code’s recent choices, e.g., (1) the wet service environment basis is the green timber rather than the fully water-saturated one, and (2) the ratio of near minimum (5% lower) distribution value is chosen as the CM value rather than the average of wet timber’s mechanical property divided by the air-dry one. This study proposes changing both recent choices to alternative ones to develop more safe and reliable designated CM values.

1. Introduction

Wood is a widespread construction material that has served in various environmental conditions in many past and contemporary cultures. Wood’s earliest use in construction was likely to provide shelter and build vehicles (ships) for transportation. Selecting wood as an environmentally benign material for green building would greatly help achieve global resources sustainability. In addition to their renewable properties, modern wood products have a high recycling potential value, indicating their closed-loop material flow to increase efficiency during their life cycle [1]. Life cycle analysis justifies that mass timber buildings commonly have lower global warming potential and life cycle primary energy than reinforced concrete and steel buildings [2]. Wood products and wooden construction practices (such as timber frames [3], timber formwork [4], and prefabricated timber houses [5]) continuously develop to reduce potential environmental impacts.
Indonesian Wooden Building Code (SNI 7973-2013) [6] has adopted the National Design Specification (NDS) for Wood Construction [7] since 2013. The designated reference design values of structural timber were appointed from the bending test of 1094 pieces of local commercial wood measuring 6 × 12 × 300 cm reported by Firmanti et al. [8]. The allowable stresses determined by machine-assisted grading procedure have considered the species (group of species), the fifth percentile and characteristic values, the timber dimension, and the growth characteristics and defects. Since the 1980s, the practice of reference stress determination in the U.S. and Canada has commonly changed from small-clear wood specimens to full-sized timbers testing. However, the engineering community does not entirely abandon the previous practice because the sequential standard procedures to determine the reference design value from the small-clear wood specimen testing are still legally current. The reference design values of bending strength (Fb), tensile strength parallel-to-grain (Ft), shear strength parallel-to-grain (Fv), compressive strength perpendicular-to-grain (Fc), compressive strength parallel-to-grain (Fc), modulus of elasticity (E), and minimum modulus of elasticity (Emin) must be corrected by some corresponding adjustment factors following Table 1. The adjustment factors consider the service environment conditions’ effects on the member strength and elasticity and shall be unbiasedly estimated.
Although the Building Code thoroughly governs wooden building construction, the existing procedures should be investigated and refined based on independent and trustworthy scientific testing. A periodic harmonization of the building-code-designated values (i.e., reference design values and adjustment factors) with the laboratory tests of commercial wood available in the building material market is necessary. ASTM D5536:94(1999) [9], ASTM D143:2014 [10], ASTM D2555:2005 [11], ASTM D2915:2017 [12], and ASTM D245:2000 [13] are sequence procedures to obtain the allowable stress of full-sized structural lumber from the small clear-wood specimen laboratory tests. If the full-sized sawn lumber sample taken from the market is tested in the laboratory, the sequence procedures to obtain the allowable stress are ASTM D198:2021 [14], ASTM D2555:2005 [11], and ASTM D2915:2017 [12]. The ASTM D5457:2019 [15] replaces the ASTM D2915:2017 [12] if the designer prefers to follow the load and resistance factor design (LRFD) methodology than the allowable stress design (ASD). Those sequence procedures provide a basis for statistical estimates that need further adjustments to determine design values for use with an accepted design methodology. However, they do not purport to address the adjustment factors needed to adjust test data to standardized mechanical and environmental conditions. The building engineers (users) are responsible for seeking the appropriate adjustment factors for specific conditions that the wooden building serves.
The adjustment factor is the ratio of mechanical properties in the relevant service environment to the standardized laboratory test results. Since the allowable stress values (Fb, Ft, Fc, Fv, and Emin) (Table 1) determination has calculated the near minimum value to consider the 95% confidence of safety, their related adjustment factors shall be the unbiased estimation values to avoid redundancy. The unbiased estimations of adjustment values are the average of the ratio of mechanical properties at the relevant service environments to those of the standardized laboratory test results. When an adjustment factor is evaluated, the specimen conditions and test procedures should be well arranged so that the other factors are assumed to be in the boundary condition of the ceteris paribus (all other things being equal). The ceteris paribus condition is necessary to ascertain the independency of the evaluated adjustment factor from the other affecting factors during the experiment processes. Hayatunnufus et al. [16] and Bahtiar et al. [17] measured the bending stress of sawn lumber subjected to concentrated loads at one and several points, respectively. Their laboratory test data on the beam stability factor (CL), defined as the ratio of each edge-wise bending specimen’s modulus of rupture (MOR, SRi) to the standardized straight-grain small-clear wood specimen’s average MOR value ( S ¯ R ), is in harmony with the beam stability factor (CL) designated by SNI 7973-2013. The S R i / S ¯ R ratio, which was curve fitted as the function of beam slenderness ratio (RB) following the Ylinen formula, is the unbiased estimation for the beam stability factor (CL).
Since the wood’s moisture content substantially influences its mechanical properties and their relationship is relatively straightforward, most of the wood usage problem is related to its moisture content. The moisture content effects must be considered when using timber for structural purposes [18]. Temperature and relative humidity daily cycles raise the moisture content daily changes and further affect the wood’s mechanical properties, such as creep deflection [19]. Timber, which frequently receives wet–dry cycles, may degrade faster than constantly wet or dry ones. Wood is composed of anatomical elements whose lumens are connected by different pit types. The cell walls’ behavior naturally affects the wood’s properties as it responds to moisture content change. The moisture content change leads to shrinkage–swelling and the adjustment of wood strength and stiffness [20]. Air-dried wood with an average value of 12%–18% has stronger mechanical properties than wood with more than 20% moisture content. Wood should be conditioned to the dry condition (15%–19% moisture content) for general structural application rather than using it in the green state. When the wood has dried, the free water in the lumens is evaporated first, and further drying increases the wood’s strength with the bound water loss. A negative correlation between wood mechanical properties and the 10%–30% moisture content is reported [21,22,23]. Madsen [
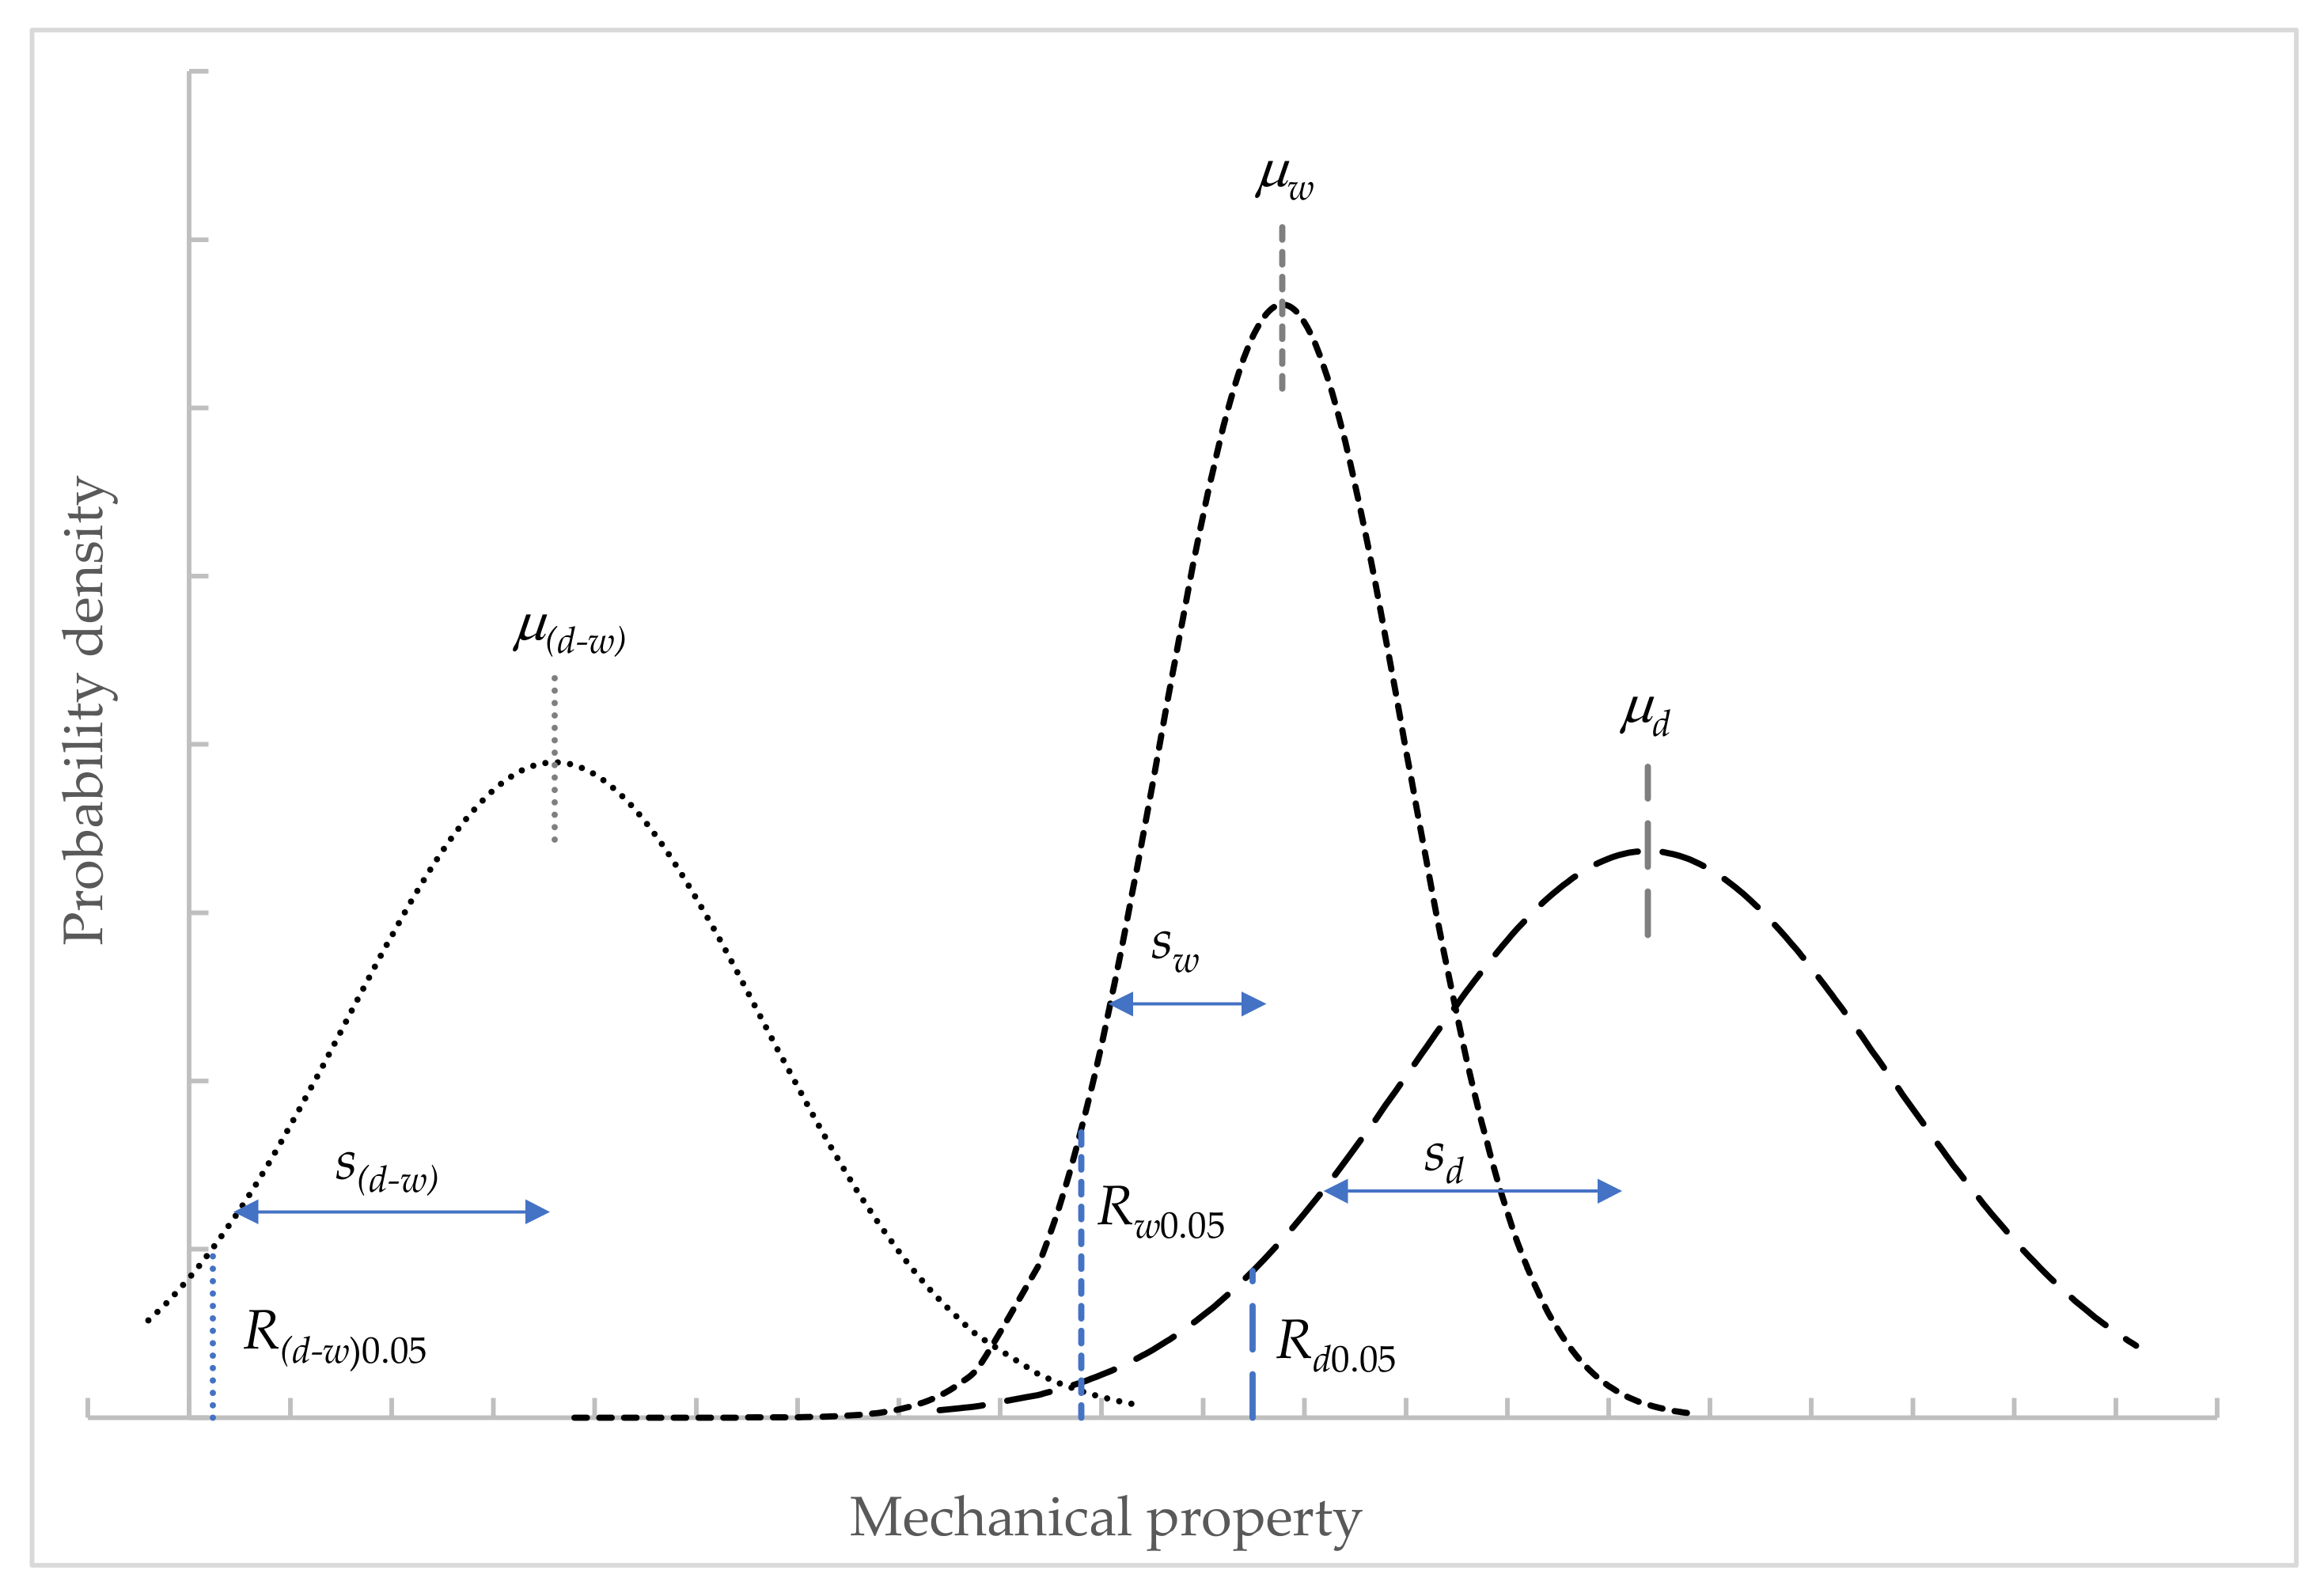
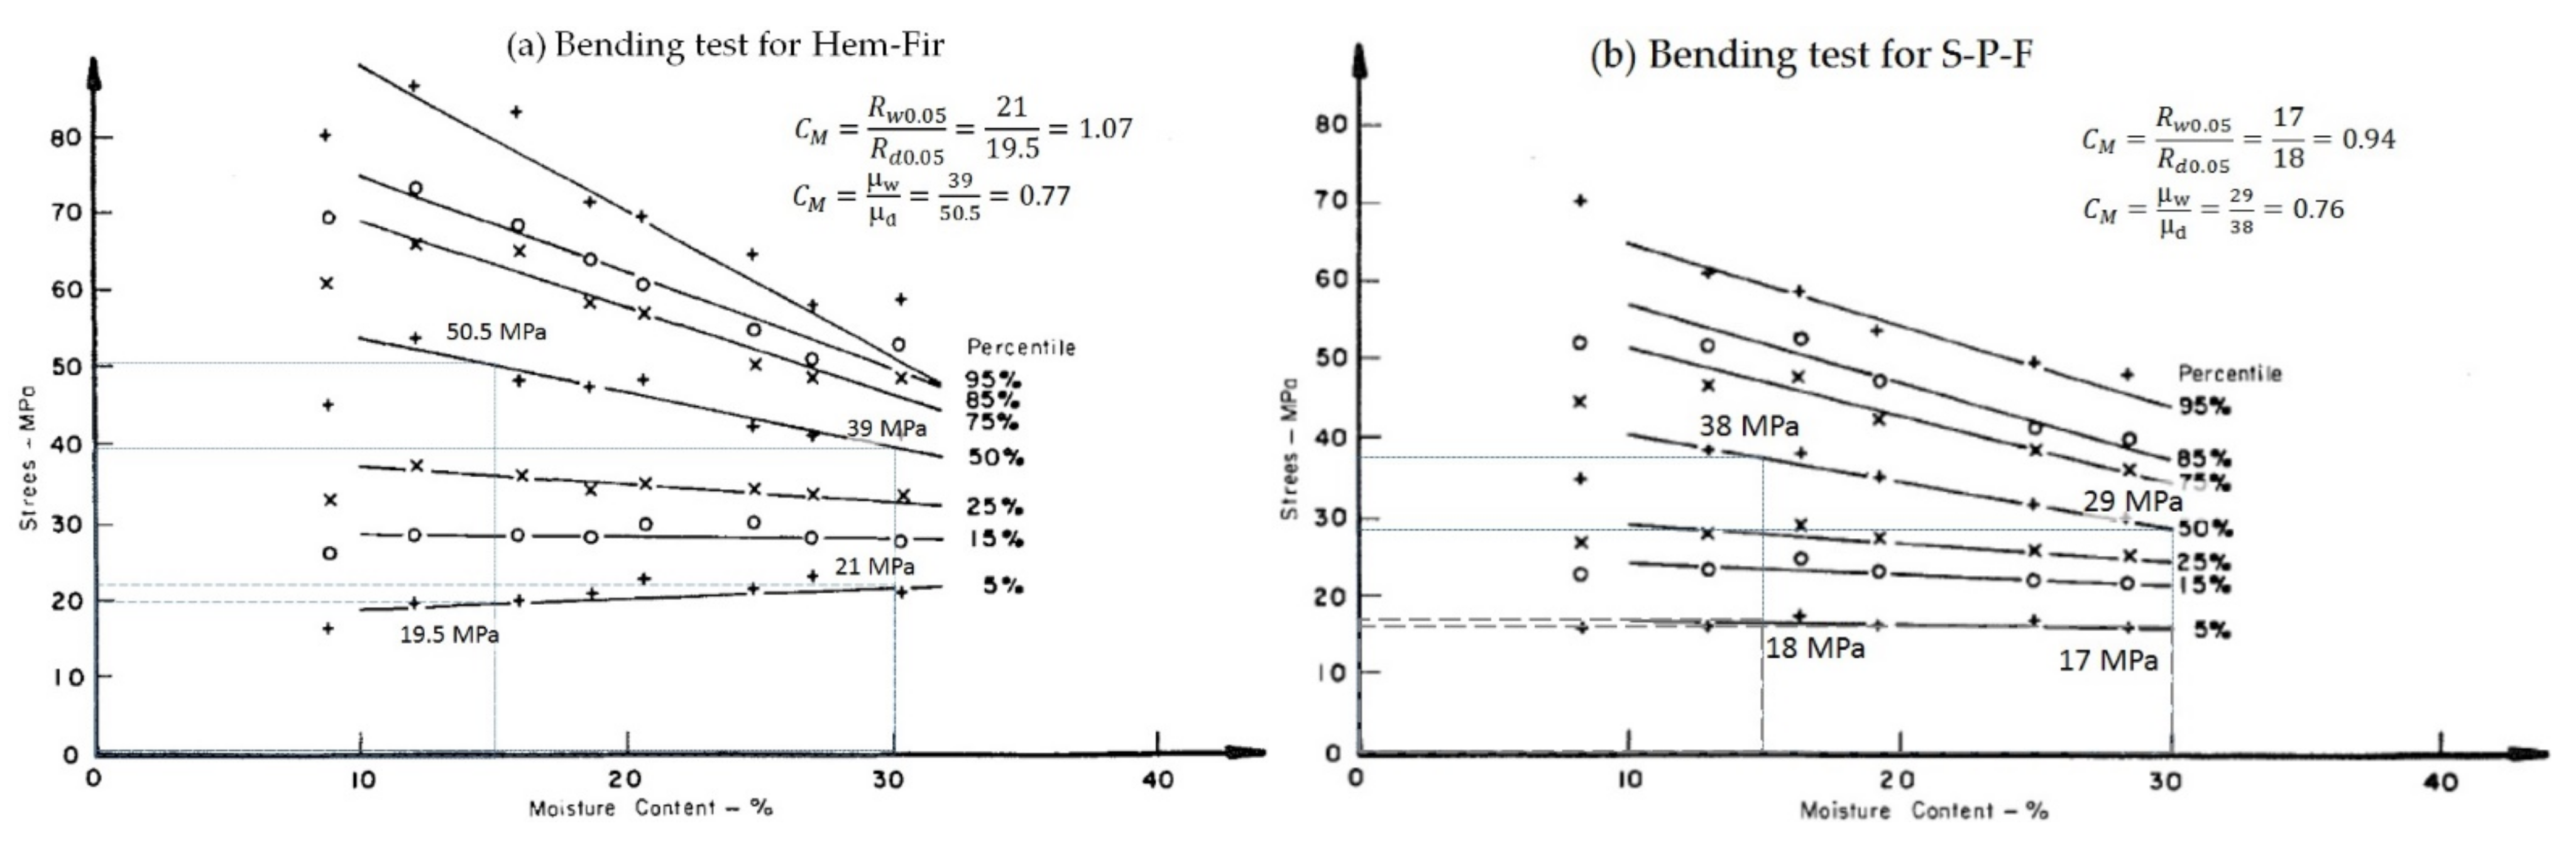
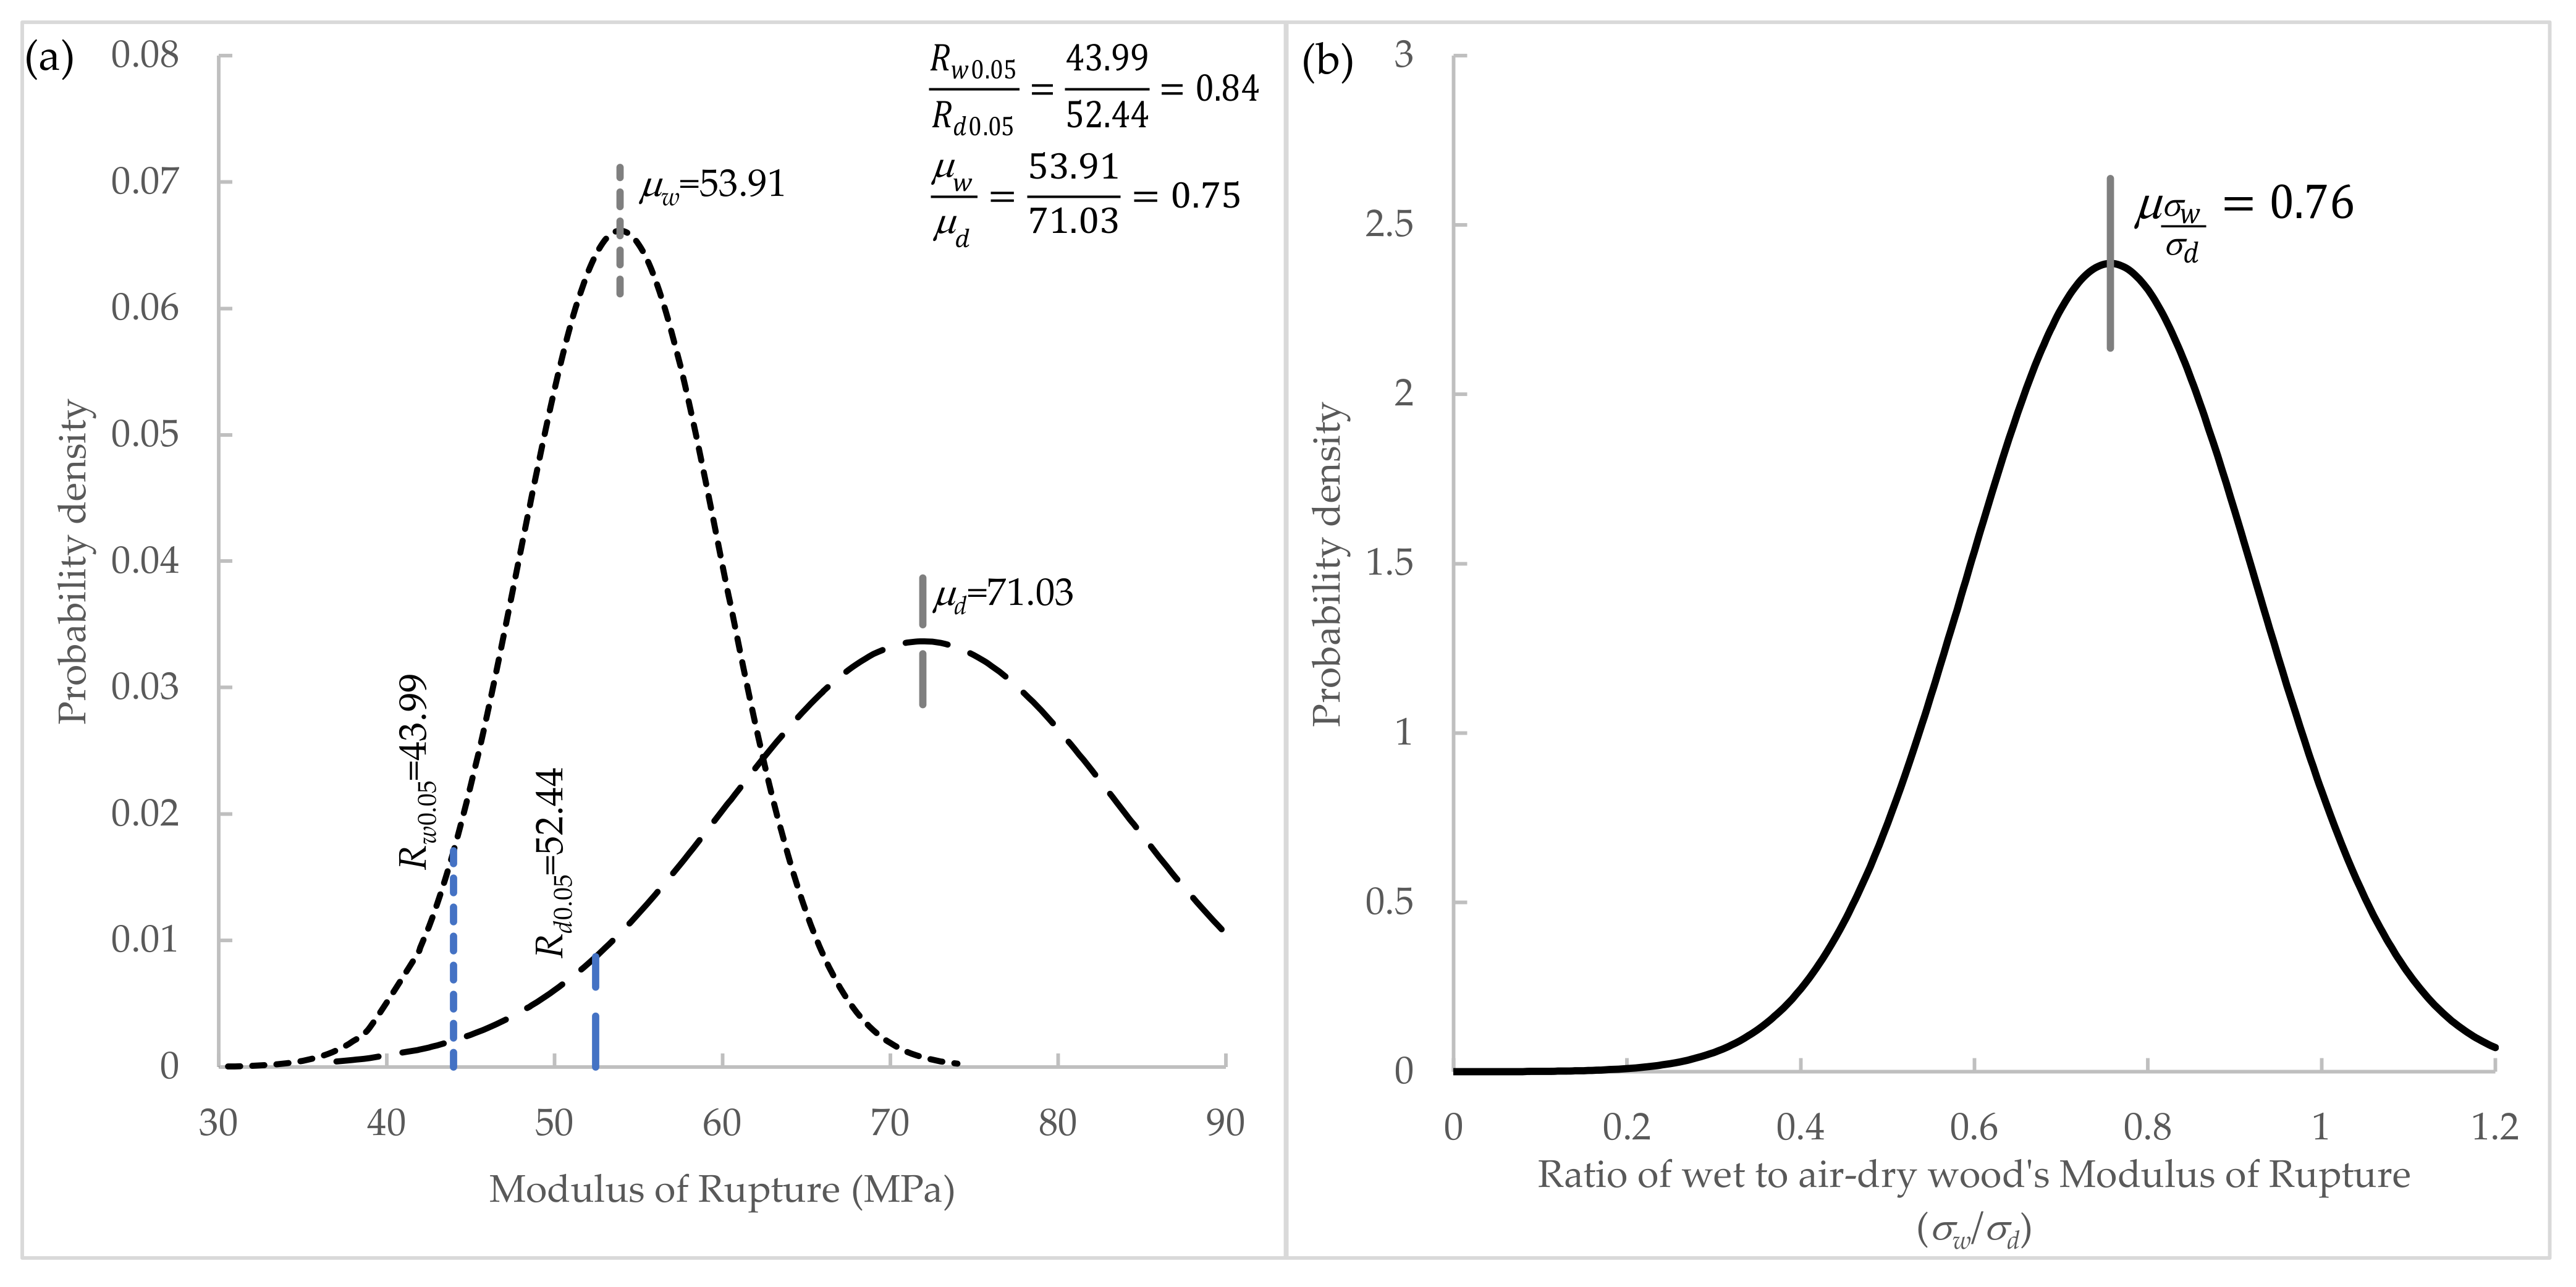
24] conducted the full-sized sawn lumber mechanical properties test at the green and air-dry conditions (moisture content between 10%–25%), measured the mechanical properties change per 1% moisture content difference, and extrapolated the data to the fiber saturation point (FPS). Madsen [24] calculated CM as the ratio of the FPS extrapolated mechanical property to that at air-dry conditions, where he chose the fifth percentile values as the numerator and denominator (CM = Rw0.05/Rd0.05) (Figure 1). Choosing the near minimum values as the basis for CM calculation, Madsen [24] reported that timber’s shear strength parallel-to-grain, compressive strength parallel-to-grain, and compressive stress perpendicular-to-grain are sensitive to the moisture content change; meanwhile, bending strength, tensile strength parallel-to-grain, and stiffness are insensitive.
The mechanical properties of wood measured on dry specimens are significantly greater than on green wood [25,26,27,28,29,30]. The branch and trunk of the living tree or the freshly sawn wood are examples of green wood. The green wood moisture content ranges from 31% to 239% [31,32,33], generally higher than the fiber saturation point (FSP). Researchers proposed various methods to measure the FSP value, which resulted in varied result values [34]. Stamm [35] measured the FSP as around 30%, while some researchers [36,37,38,39,40] proposed the FSP as around 40% (38.5%–42.5%). FSP is the moisture content at which the cell walls are entirely saturated, but water does not exist in cell lumina. Above the fiber saturation point, the cell walls are entirely water-saturated, and some free water is located in the lumina. If its moisture content is above the fiber saturation point, the wood’s mechanical properties are constant at the weakest value and do not significantly change with the moisture content change [41].
In addition to terrestrial construction, wood is also a popular material for a building that serves aquatic and wet environments (e.g., ships [42], harbor ports at marine facilities [43], fishing huts [44], and cooling towers [45,46,47,48]). As hygroscopic materials, wood absorbs and desorbs water from its environment to reach its equilibrium moisture content. The higher moisture content of wood resulted in its strength and stiffness reduction. Eurocode 5:2004 [49] and New Zealand Timber Standard NZS: 3603:1993 [50] accommodate the moisture content exchanged between the material and the environment by governing the concept of service class, which represents the air humidity and temperature which will affect the material’s properties during the structure’s service lifetime [51]. Many countries’ building codes for wood construction (i.e., NDS:2018 [52], CSA-086:2019 [53], and SNI 7973:2013 [6]) govern that wet service factor (CM) is mandatory to adjust the sawn lumber reference design values when the building serves in the wet or aquatic environments. Wood construction designers apply wet service factor (CM) adjustments to ensure the wooden building’s safety and serviceability in a wet environment. When the timber serves the condition where its moisture content exceeds 19% for an extended time, its strength and stiffness are reduced; thus, its design values must be adjusted by the wet service factor (CM) [6,52,53].
SNI 7973:2013 [6] lists the designated CM values (Table 2). SNI 7973:2013 does not specify CM for different species nor the timber’s size and quality, but a different type of material property. In contrast, NDS:2018 [52] provides six tables to accommodate the CM value of different sizes and qualities of timber, such as Table 4A–F. The CM values provided by NDS in Table 4A–C,E,F are the same as seen in Table 2. Only NDS’s Table 4D for visually graded timber (5” × 5” and larger) provides the different CM values.
Because the moisture content generally raises the biggest usage problem of wood as a hygroscopic material, this study encourages investigating the wet service factor (CM). Some occurrences proved the necessity to investigate the wet service factor (CM). A wooden cooling tower that served in a wet environment for 13 years in Pangalengan (ID) was reported to be in a dangerous condition per ISO 10816-3:2009 [54] because it suffered from the high vibration symptom. In addition to the deterioration in the maximum depth of 2.5 mm [45], the vibration amplitude was high because of the decreasing modulus of elasticity (E) value in the high temperature, water-saturated, and immersed conditions. The 13 years of service life is much shorter than the 50 years in the planned design; thus, structural modification following the triangle bracing system is recommended [46].
This study’s objective is to compare and harmonize the experimental CM value with the tabulated one in the building code; thus, wooden construction designers can confidently apply it to design wooden constructions that serve in the wet or aquatic environment. Although small clear-wood properties may differ from the full-sized sawn lumber, small clear-wood specimen test results are the traditional basis to generate the lumber’s allowable stresses associated with the adjustment factors [24]. When comparing the mechanical properties of wet to air-dry wood, the pair of specimens being compared shall have similar properties before the treatment is applied. The defects and growth characteristics, which are variedly contained in every full-sized timber, disturb the assumption of the boundary condition of the ceteris paribus when determining the ratio of the wet to air-dry wood’s mechanical properties. Since the effect of growth characteristics and defects on the full-sized timber’s mechanical properties have been calculated in the structural grading as the strength ratio for determining the allowable stresses (Fb, Fc, Ft, Fc, Fv, E, and Emin) and the size effect factor (CF) has considered the effects of sawn lumber’s dimension (Table 1), the traditional small clear-wood is a well representative specimen to develop the other adjustment factors, such as CD, CM, Ct, Ci, KF, ϕ, and λ. This study tests the mechanical properties of clear-wood in dry and wet conditions to harmonize the building-code-designated wet service factor (
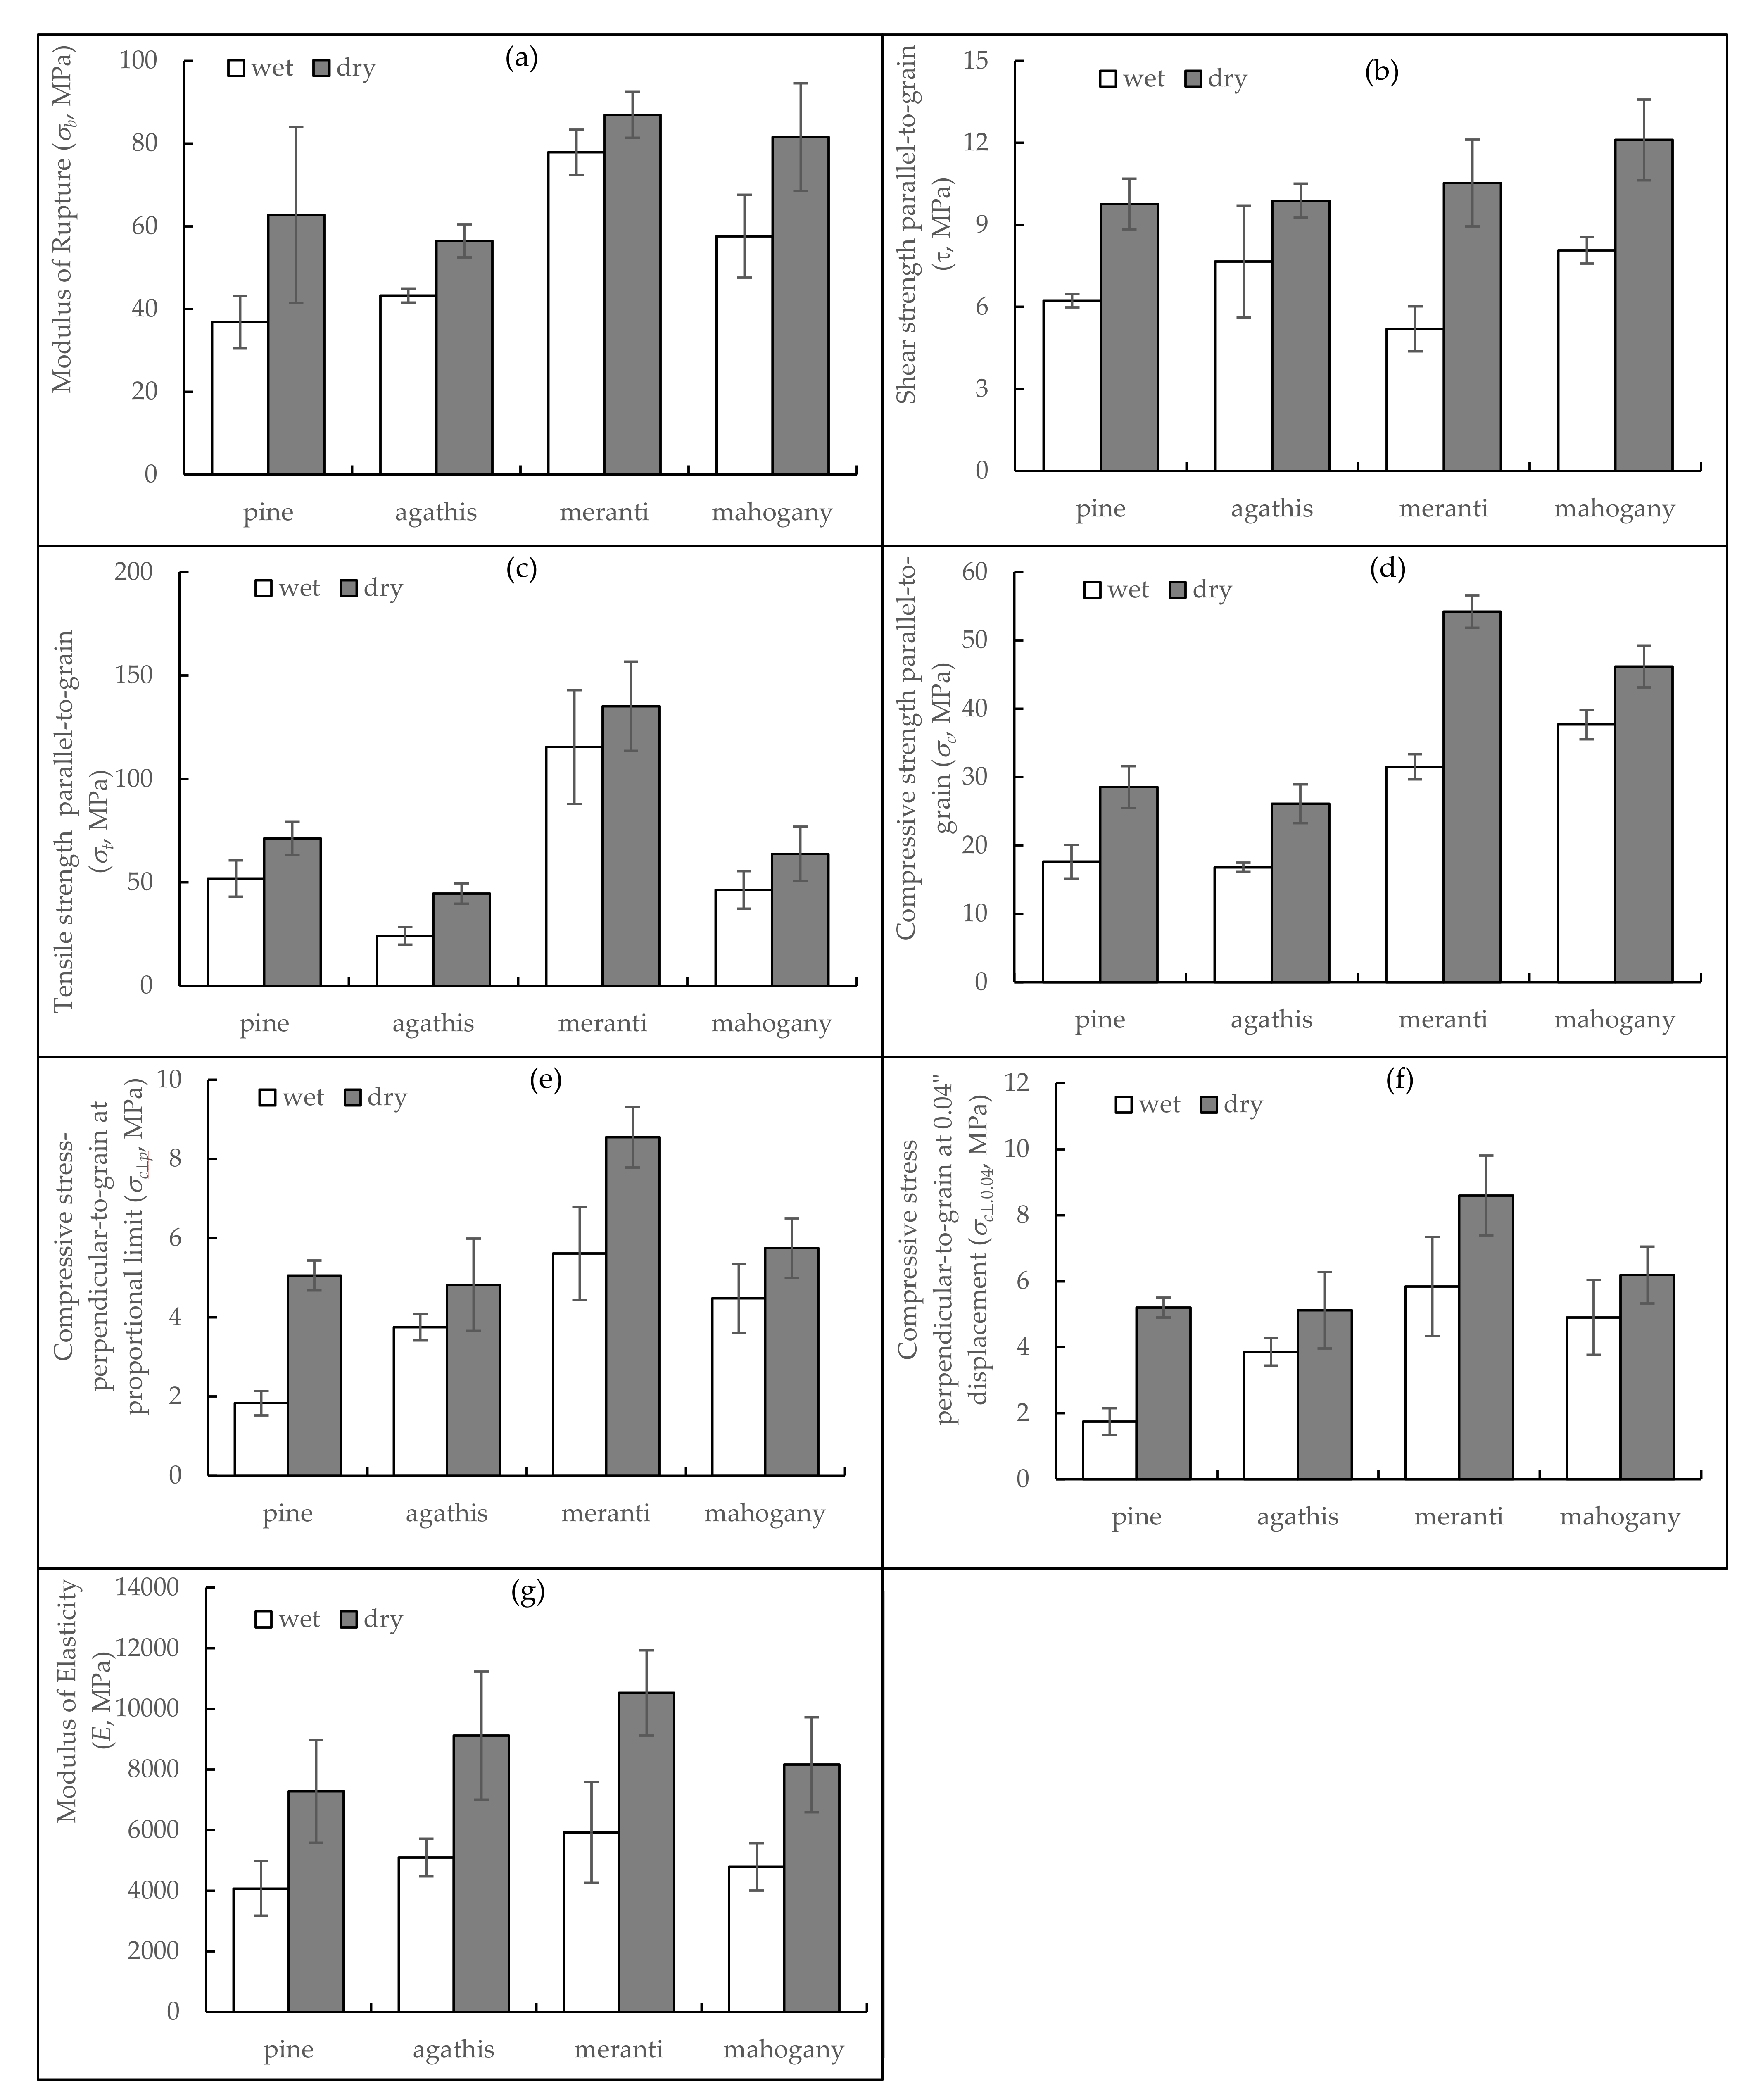
CM) with the laboratory test of commercial wood species available in the building material market. Laboratory tests of several commercially available wood species are necessary to calibrate the tabulated values periodically. Four wood species which abundantly available in the building material market, namely, pine (Pinus merkusii), agathis (Agathis dammara), red meranti (Shorea leprosula), and mahogany (Swietenia mahagoni), are selected in this study as the sample for the mechanical properties tests in the dry and wet conditions. The mechanical properties tests included static bending, shear parallel-to-grain, tension-parallel-to-grain, compression-parallel-to-grain, and compression-perpendicular-to-grain. The empirical CM is the ratio of each mechanical property value in the wet (water-saturated) condition to that in the air-dry condition. Instead of comparing green and air-dry wood, however, this study compared wet (re-saturated) and air-dry wood, and the mechanical test of the wet specimen was conducted when the specimen was immersed in a water bath. These submerged specimen test arrangements imitate the worst-case scenario of what would happen if a wooden building got wet for any reason than comparing green to air-dry wood.

2. Methods

2.1. Physical and Mechanical Properties Test

The 400 × 12 × 6 cm size of some commercially available timbers, including pine, agathis, red meranti, and mahogany, were cut into the size of several small clear specimens following ASTM D143-2014 [10]. Instead of sampling and cutting the tree following ASTM D5536-94 (1999) [9], the timbers were bought randomly from the building material shops to represent the available commercial sawn lumber in the market. The mechanical properties tests were static bending, shear-parallel-to-grain, tension-parallel-to-grain, compression-parallel-to-grain, and compression-perpendicular-to-grain. The static bending tests were made on 2.5 × 2.5 × 41 cm secondary method specimens (Figure 2a). A digital caliper measures the actual height (h) and width (b) at the center and the length (l). The shear-parallel-to-grain tests were applied on 5 × 5 × 6.3 cm specimens notched about 1.3 cm in length and 2 cm in depth to produce failure on a 5 × 5 cm surface (Figure 2b). The shearing surface’s actual dimensions were measured. Figure 2c shows the specimen’s shape and size for the tension-parallel-to-grain tests. The actual cross-sectional dimensions at the smallest part were measured. The compression-parallel-to-grain tests were applied on 2.5 × 2.5 × 10 cm secondary method specimens (Figure 2d). Measurements of the actual length and cross-sectional dimensions were conducted. The specimens having a size of 5 × 5 × 15 cm were prepared for the compression-perpendicular-to-grain tests (Figure 2e). The actual height (h), width (b), and length (l) were measured.
As many as 40 specimens were tested to compare and harmonize the wet service factor (CM) corresponding to each mechanical property. Therefore, 200 specimens were prepared for five mechanical properties tests, such as 100 pieces for the air-dry specimens and 100 for the wet specimens. Each mechanical properties test was conducted on 40 specimens: 20 specimens were tested at the air-dry condition in an indoor room (24–27 °C temperature and 80% relative air humidity), and 20 others were tested in the wet (water-saturated) condition. The mechanical properties test arrangements (e.g., specimen size, lying position, and loading rate) were carefully conducted following ASTM D 143-2014 [10] using Universal Testing Machine (UTM) 30-ton capacity (SATEC/Baldwin, Grove City, PA, USA). The periodically calibrated load cell, linear variable displacement transducers (LVDT), and multipurpose digital indicator (MPDI) data acquisition machine (installed by PT Testindo—Jakarta and calibrated by PT Global Quality Indonesia—Bandung, ID) were set at the UTM to measure and record the load and displacement. The MDPI periodically recorded the test data every 0.5 s.
Meanwhile, the wet (water-saturated) specimens were first immersed in water for 65 days. Then their mechanical properties tests were conducted when the specimen was immersed in a pool of water at around 10 cm depth (Figure 3) to mimic the worst-case scenario of the relevant wet and aquatic environment conditions. The water was obtained from the Ciapus river (6°33′03.2′ S 106°43′37.4″ E) and processed for daily use at the IPB University-Darmaga Campus.
Each specimen’s mass (m1) and dimensions (length (l), width (b), and depth (h)) were measured not long before every mechanical property test. The moisture content, density, and specific gravity were also measured soon after the mechanical property test. After the failure, the specimen’s stringy parts were cleaned, the specimen was weighed (m2), and then put in the 103 ± 2 °C oven for 48 h. After 48 h, the specimen was taken out from the oven, weighed, and put again in the oven. This process was repeated every three hours until three consecutive weights were constant. The constant weight is the oven-dry weight (mo). The moisture content (w) is the percentage of the water mass (m2-mo) to the oven-dry wood mass (mo) (Equation (1)). The density (ρ) is the ratio of air-dry mass (m1) to the air-dry volume (v1) (Equation (2)). Air-dry volume is v1 = l × b × h. Specific gravity (SG) is the ratio of oven-dry mass (mo) to the air-dry volume (v1) and divided by the water density at standard conditions (ρw = 1000 kg/m3) (Equation (3)). All test procedures were conducted in the Forest Products Department—Faculty of Forestry and Environment—IPB University, accredited by The Society of Wood Science and Technology (SWST) since 2014.
w = m 2 m o m o × 100 %
ρ = m 1 v 1 = m 1 l b h
S G = ρ w % + 1 ρ w

2.2. Data Analysis

2.2.1. The Mechanical Properties Difference

Table 3 will summarize each type of mechanical test result. The Kolmogorov–Smirnov, Liliefors, and Shapiro–Wilk test the normality of the error (ε). The errors are the difference of each specimen measurement (xijk) to the average value of the same species and condition specimen ( x ¯ i k ) calculated per Equation (4). The differences between mechanical properties in the wet condition (σw) with that in the dry condition (σd) were evaluated using the modified t-Student test (paired-group t-test), following Table 3 procedures. The t-Student formula is Equation (5).
ε i j k = x i j k x ¯ i k
t = D ¯ i 0 s D / n
  • where
  • xijk = mechanical properties of the ith species (1 = meranti, 2 = mahogany, 3 = agathis, 4 = pine), jth replication (1, 2, 3, 4, and 5), and kth conditions (1 = wet, 2 = air dry)
  • x ¯ i k = average value of the same species and condition specimen
  • D ¯ i = x ¯ i j 2 x ¯ i j 1
  • 0 = hypothetical difference
  • s D = ε i j k 2 n 8
  • n = number of specimens (40 units)
  • 8 = number of cells (species × conditions).
The null hypothesis (H0) is D ¯ i = 0 , while the alternative hypothesis (H1) is D ¯ i   0 . If the calculated absolute tvalue (|tvalue|) (Equation (5)) is greater than the two-tail tabulated t-Student [t(α/2, ν) = t(0.025, n−8)], H0 is rejected and H1 is accepted. The accepted H1 indicates that the wood’s mechanical properties in the dry condition are significantly different from those in the wet condition.

2.2.2. Wet Service Factor

The experimental wet service factor value of each specimen ( C M E i j ) is calculated as the ratio of measured mechanical properties in the wet conditions (σij1) to those at the dry conditions of the same species (σij2) (Equation (6)). The CM values from all possible combinations of the same species’ mechanical properties at wet to air-dry conditions are listed in Table 3. Every species results in 25 combinations; therefore, 100 combinations are listed for four species (Table 3). Since normal approximation [55] was assumed to fit the ratio of wood’s mechanical properties at the wet condition to the air-dry ones, the modified t-Student test (one-point t-Student test) was conducted following Equation (7) to analyze whether the experimental wet service factor (CME) value is different compared to the tabulated value in the building code (CM(SNI)).
C M E i j = σ i j 1 σ i j 2
t = C ¯ M E C M S N I s C M E / n  
  • where:
  • C M E i j = empirical wet service factor for the ith species (1 = meranti, 2 = mahogany, 3 = agathis, 4 = pine) at the jth combination within species (1, 2, 3, …, 25),
  • C ¯ M E = average empirical wet service factor
  • CM(SNI) = SNI 7973:2013-tabulated CM
  • s C M E = standard deviation of empirical wet service factor
  • n = total number of combination data (100 units)
The formula for the one-point t-Student test is Equation (7), while the null hypothesis (H0) is C ¯ M E = C M S N I versus the alternative hypothesis (H1) is C ¯ M E   C M S N I . If the calculated absolute tvalue (|tvalue|) resulting in Equation (7) is greater than the two-tail tabulated t-Student (t(α/2, ν) = t(0.025, 99)), H0 is rejected and H1 is accepted. The accepted H1 indicates that the experimental wet service factor (CME) is significantly different from the tabulated CM in the building code (CM(SNI)). The significantly different CM values will propose to revise the building code tabulated CM.

3. Results and Discussion

3.1. The Physical Properties

The climates in Bogor, West Java, Indonesia are 19.3 °C–34.2 °C temperature, 62.2%–95.4% humidity, and 4212 mm yearly rainfall. The warm, humid, and rainy environments result in wood’s high equilibrium moisture content. This study measured that the specimen’s average air-dry moisture contents ranged from 15.92% to 17.13%, in line with some research reports on wood [17,56,57,58,59] or bamboo [60,61,62,63,64,65] located in Bogor (ID), but wetter than the equilibrium moisture content (EMC) in the subtropical region such as Coventry (UK) [66,67]. The air-dry timber is wetter than mortar [68]. The air-dry specimen’s moisture content is compatible with the timber under dry service conditions, such as indoor structures, where the moisture content does not exceed 19%. The wood’s strength and stiffness are relatively constant when it exceeds the fiber saturation point [41]. When immersed in the water pool for 65 days, the specimen’s moisture content range was 74.13%–131.13% (Table 4). The specimens exceeded the fiber saturation point; thus, their mechanical properties were expectedly constant at the weakest state. The ratio of the mechanical properties of the wood wetter than the fiber saturation point to those in the air-dry conditions resulted in the empirical wet service factor (CM) value. The immersion in the water bath during the mechanical property tests guaranteed the water-saturated condition of the specimen’s whole parts.
The wood densities (ρ) vary within and between species, and the moisture content affects it too. The wet wood always has a higher density than the air-dry ones (Table 4) because the water directly contributes to the mass measurement. All specimens’ specific gravity (SG) was measured and transformed into oven-dry mass per air-dry volume basis, and this study resulted in a value of between 0.41 and 0.61. The density strongly correlates with the mechanical properties, and air-dry density was the basis for structural timber’s strength grading following PKKI NI-5:1961 [69]. Pine and agathis have a similar specific gravity (0.41–0.48). Mahogany is denser (0.51–0.55), while red meranti is the densest among others (0.53–0.61).

3.2. The Mechanical Properties

3.2.1. The Mechanical Properties Difference between Wet and Dry Wood

The wet wood, which has a high moisture content, is lower in strength than the dry wood because of the decrease of the portion of woody material and the density of cell walls. The cell walls’ stiffness also decreases when they bind more water [70]; thus, the wood strength and stiffness also reduce. Madsen [71] reported that the wood stiffness increases as the moisture content decreases and the strength of initially strong wood would also increase.
This study proposed the wet wood mechanical properties test to be conducted on the re-saturated specimen immersed in the water bath. Due to load distribution along the specimen, there might be significantly different mechanical properties resulting from the immersed and non-immersed specimens. In non-immersed specimens, micro-analysis may observe the drier region at the differential part that received the higher stress and strain. Some regions’ higher stress and strain will squeeze more water than other parts. This critical region, which receives the highest load, becomes drier, and its strength increases. The critical region’s increasing strength may improve the whole specimen’s strength. This phenomenon has a lower probability of happening in the immersed specimen.
Several publications provide mechanical properties of pine, agathis, meranti, and mahogany wood at air-dry conditions similar to this study’s results (Table 5). Similar to many reports [18,72,73,74], this study also finds that the mechanical properties of wet wood are consistently weaker than those of dry ones (Table 6). A similar phenomenon is valid for modulus of rupture (σb), shear strength parallel-to-grain (τ), tensile strength parallel-to-grain (σt), maximum crushing strength (σc), compression stress perpendicular-to-grain at the proportional limit (σcpl), compression stress perpendicular-to-grain at the 0.04″ deformation (σc⊥0.04), and modulus of elasticity (E) (Figure 4). This study’s re-saturated wood’s mechanical properties are generally lower than the several published green wood’s mechanical properties [75,76,77]. The reason for the discrepancy is the moisture history of the specimens. The properties of the green specimens are not always the same as those saturated with water after drying.
In addition to the moisture history, the water-immersed condition during the mechanical property test is expected to affect the testing results. When loading is applied to the wet specimen at non-immersed conditions, the specimen part near the loading point may be dryer than the other part, and the hydrogen bonds between cellulose chains at this portion have the probability of returning. The loading point is the most critical portion, where its increasing strength will improve the specimen’s overall strength. When an immersed specimen is subjected to load, every portion is still water-saturated; thus, it has less probability for the hydrogen bond to return.
The dimension deformation during load application to the water-immersed specimen is expected to be higher than the non-immersed specimen because of its lesser hardness. The dimension deformation at the loading point of an immersed specimen is the highest among other portions. The smaller actual cross-sectional dimensions at the loading point because of the indentation of the loading block and support during load application decrease the area, moment of inertia, and stiffness; therefore, the load-carrying capacity and bending-moment-bearing capacity weaken. The measurement of just-harvested (green) lumber’s dimensions usually results in higher values than the re-saturated specimens because the measurements are conducted at the green and air-dry conditions, respectively. In construction practice, the sawn lumber’s actual dimensions are more often measured in dry conditions.
Kolmogorov–Smirnov test indicated that all data distributions are normal. Lilliefors test indicated the normal distribution for almost all data except for tensile strength parallel-to-grain. The Shapiro–Wilk test found the non-normal distribution of the error of three mechanical properties (modulus of rupture, shear strength parallel-to-grain, and tensile strength parallel-to-grain); in contrast, the others (modulus of elasticity, maximum crushing strength, compressive strength perpendicular-to-grain at the proportional limit, and the 0.04″ deformation) are normal (Table 7).
Table 8 shows that the coefficient of variation (CV) of wet and air-dry wood’s mechanical properties ranges are 6.76%–23.63% and 6.75%–17.98%, respectively. The CV of the differences between wet and air-dry wood’s mechanical properties increases to become 18.90%–75.04% because the average values (μ(d-w)) are smaller than the original average value of wet and air-dry wood’s mechanical properties (μw and μd), and the standard deviation (s(d-w)) is higher than wet and air-dry ones (sw and sd) (Figure 1). The paired-group t-test results in Table 8 indicate that the wet wood mechanical properties are significantly different compared to the air-dry’s one.

3.2.2. Wet Service Factor (CM)

The designated reference design value for sawn lumber assumes a maximum moisture content of 19%. Wood with a moisture content of 19% or less is dry, while it with more than 19% is considered wet [6,7,53]. Significant differences in the strength of wet with dry wood require the application of the wet service factor (CM) to adjust the reference design value, especially for the wood member that tends to be wet. Examples of these situations are the green wood that has just been felled, wood used to build scaffolding that is exposed to the weather, wood used for decking, floor joists suspended above the ground that is prone to splashing, wood that is not protected from the weather, and wood near a potential water leak.
The reference design values of wooden members of aquatic environment constructions are subject to this CM adjustment. SNI 7973:2013 [6] does not specify CM for different species but a different type of material property. CM adjusts the mechanical (structural) properties’ reference design values (Fb, Ft, Fc, Fv, Fc, E, and Emin). The reference design values have considered the 5% lower confidence values and the safety factor adjustments. The reference design values have already considered the mechanical property near minimum values; thus, the adjustment factors, including CM, are the ratio of estimated mechanical properties in the actual relevant environment conditions to that measured in the standardized laboratory test conditions. If the minimum CM values among wood species are chosen, the CM adjustment to the reference design may result in a very conservative value. Madsen [24] proposed CM as the ratio of wet to air-dry mechanical properties; both wet and air-dry mechanical properties are the fifth percentile values. In contrast, this study sustains CM as the average ratio of all within a species’ possible combinations of wet mechanical properties to that of air-dry. Suppose both wet and air-dry wood’s mechanical properties (σw and σd, respectively) can be assumed to fit normal distributions. In that case, the distribution of the CM values (σw/σd ratio) can be analyzed using normal approximation following Francés and Rubio [55]. This study proposes straightforward and conservative procedures for determining the empirical CM. The water immersion usually results in the wood’s weakest strength and stiffness; thus, the minimum CM value, ensuring safety, is obtained.
The experimental CM values for each mechanical property show the general trend, although they vary between species (Table 9). The tensile strength sustained in the direction of parallel-to-grain is severely reduced when the wood is soaked in the water. The experimental CM value for tensile strength parallel-to-grain indicates that the ratio of tensile strength of wet to air-dry wood ranges from 0.55 to 0.87. This value shows that wet wood’s tensile-load-bearing capacity weakens to become almost half. Madsen [24] reported a 25% and 35% increase in allowable tensile strength parallel-to-grain above that of green lumber when maximum moisture contents are 19% and 15%, respectively. The 25%–35% additional values are equivalent to a green to air-dry allowable tensile strength ratio of 0.74 to 0.80, which is still comparable to this study’s range results. However, Madsen [24] recommended that CM was equal to 1 because the fifth percentile line was at about the same level for tension. The SNI 7973:2013′s tabulated CM value for tensile strength parallel-to-grain is 1 (one), indicating that the decrease in tensile strength due to wet conditions is not recognized. The building code revision must recognize the wooden member tensile reduction because of wet service conditions. The average empirical CM for tensile strength parallel-to-grain resulting in this study (CM = 0.73) may be safely chosen as the designated CM to recognize the tensile strength parallel-to-grain reduction because of its high moisture content.
In contrast with CM for tensile parallel-to-grain, the building code accommodates the wet wood carrying capacity adjustment to resist bending moment, shear load parallel-to-grain, and compressive load parallel-to-grain (Table 2). However, its tabulated CM values are still too high. The tabulated CM values for modulus of rupture, shear strength parallel-to-grain, maximum crushing strength, and modulus of elasticity are 0.85, 0.97, 0.80, and 0.90, respectively, significantly higher than this experiment’s results; thus, harmonization is necessary. The CM empirical value for modulus of rupture, shear strength parallel-to-grain, maximum crushing strength, and modulus of elasticity are 0.76, 0.65, 0.67, and 0.59, respectively (Table 6). These CM values statistically differ from the SNI 7973:2013-tabulated CM value (Table 10). Due to its high value, the tabulated CM application to adjust the reference design value needs to be more safe, and the building probability of failure is underestimated. The experimental CM values for compressive stress perpendicular-to-grain at the proportional limit and the 0.04″ deformation (CM = 0.66) are a bit lower than the designated values (CM = 0.67), although they are not statistically different.
Madsen [24] reported an 8% to 75% increase in allowable properties above that of green lumber when the maximum moisture content is 19% or 15% (Table 11). Then, Equation (8) calculates the ratio of green to air-dry allowable properties (CM) using his data and finds that the CM ranges are 0.57–0.88 and 0.67–0.93 when the maximum moisture content is 15% and 19%, respectively. Madsen’s [24,71] mechanical properties ratio of full-sized timber at air dry (15% MC) conditions to that of fiber saturation point (30% MC) (Figure 5) is similar to that of lumber 4” (10 cm) and less in nominal thickness (Table 11). Figure 5 indicates that the ratios of average full-sized timber’s mechanical properties at air-dry to the average of that at the fiber saturation point are 0.77 for Hem-Fir and 0.76 for Spruce-Pine-Fir (S-P-F), similar with this study’s results on small-clear wood specimens (CM=0.76, Figure 6). Instead of choosing the ratio of the 50% percentile values representing the average values as the unbiased estimations, Madsen chose the ratio of 5% lower percentile values for calculating the CM values (Rw0.05/Rd0.05). His biased choices resulted in high CM values for the modulus of rupture (1.07 for Hem-Fir and 0.94 for S-P-F) and did not recognize the decreasing modulus of rupture of wet timber. The near minimum values have been considered when determining the timber’s allowable stress; thus, choosing the near minimum values as the basis for CM calculation is redundant.
C M = 1 1 + Δ σ / 100
Wood Handbook [75] also provides functions relating mechanical properties to the specific gravity of small clear-wood specimens at the green and 12% moisture content conditions, based on 43 softwood and 66 hardwood species. Substituting the average specific gravity of pines, agathis, red meranti, and mahogany in Table 4, the approximated mechanical properties at the green and 12% moisture content are in Table 12. Table 12 also lists the ratio of mechanical properties at green to that at 12% moisture content, and the value range is 0.55–0.83.
The current CM values designated by NDS 2018 [52], ASTM D1990-19:2019 [80], and SNI 7973:2013 are not equivalent to the ratio of the green small clear-wood to the dry ones given in ASTM D2555:2005 [11] or wood handbook [75], because the current CM value chooses the fifth percentile limit as the calculation basis (CM = Rw0.05/Rd0.05), complying Madsen’s [24,71] biased estimation. The tabulated green and dry clear-wood’s mechanical properties in ASTM D2555:2005 [11] and wood handbook [75] are the average values (μw and μd). This study proposes to change the calculation basis of CM values from the fifth percentile values to the average of all within species’ possible combinations of wet to dry wood’s mechanical property ratio ( μ σ w σ d ). The calculation basis promoted by this study shall result in a smaller CM than the fifth percentile basis calculation (Rw0.05/Rd0.05) but slightly higher than the ratio of the average wet wood’s mechanical properties to the average dry ones (μw/μd) (Figure 6). The average of σw/σd is the unbiased statistical estimation for CM; thus, it represents the better fit actual reduction to consider the moisture content effects than the ratio of near minimum values (Rw0.05/Rd0.05). This unbiased estimation resulted in similar CM value for bending of small-clear-specimen (Figure 6, CM = 0.76), full-sized timber (Figure 5, CM = 0.76–0.77), and 4” timber or less in nominal thickness (Table 11, CM = 0.74–0.80 ≅ 0.77), which prove its fair independence from the size’s effects.
In general, this study finds that the tabulated CM values are higher than the empirical values; thus, building code revision is necessary. The lacked conservativeness is mainly attributed to the building code’s recent choices, e.g., (1) the wet service environment basis is the green timber rather than the fully water-saturated one, and (2) the ratio of near minimum (5% lower) distribution value is chosen as the CM value rather than the average of the ratio of the wet timber’s mechanical property to the air-dry one. Designers need more conservative CM values to design wooden members of safe and reliable constructions that serve in wet and aquatic environments. This study proposes to change the CM calculation basis from Rw0.05/Rd0.05 to the average of σwd.

4. Conclusions

Wood in wet (water-saturated) stated conditions has significantly lower strength than in air-dry conditions; thus, the wet service factor (CM) must adjust the reference design value when wooden construction serves in wet or aquatic environments. The CM value, empirically measured in this study, ranges from 0.59 to 0.76.
The empirical CM values to adjust the reference design value of modulus of elasticity (E), modulus of rupture (σb), shear strength parallel-to-grain (τ), tensile strength parallel-to-grain (σt), and maximum crushing strength (σc) (CM = 0.59, 0.76, 0.65, 0.73, and 0.67, respectively) are significantly lower than SNI 7973-2013-designated values. The experimental CM values to adjust compressive stress perpendicular-to-grain at the proportional limit cpl) and that at the 0.04″ deformation c⊥0.04) reference design values (CM = 0.66 and 0.66) are a bit lower than the designated values (CM = 0.67), though the one-point t-test shows they are not significantly different.
In general, this study finds that the designated CM values in the building code are higher than the laboratory test results, which indicates that the building code lacked conservativeness. Designers need more conservative CM values to design wooden members of safe and reliable constructions that serve in wet and aquatic environments. This study proposes to change the CM calculation basis from Rw0.05/Rd0.05 to the average of σwd to obtain more conservative and reliable CM values.

Supplementary Materials

The following supporting information can be downloaded at: https://www.mdpi.com/article/10.3390/f13122094/s1.

Author Contributions

Conceptualization, E.T.B.; data curation, E.T.B. and A.K.; formal analysis, E.T.B., T.P. and A.K.; funding acquisition, E.T.B., D.H., A.D. and G.R.P.; investigation, E.T.B., T.P. and A.K.; methodology, E.T.B., T.P. and A.K.; project administration, E.T.B., A.D. and G.R.P.; resources, E.T.B. and A.D.; supervision, E.T.B. and T.P.; validation, E.T.B., T.P. and N.N.; visualization, E.T.B. and A.K.; writing—original draft, E.T.B.; writing—review and editing, E.T.B. All authors have read and agreed to the published version of the manuscript.

Funding

This research was funded by the Directorate General of Higher Education—Ministry of Education, Culture, Research, and Technology (ID), grant number [0054/E5/AK.04/2022 & 082/E5/PG.02.00.PT/2022], and The APC was partly funded by Pakuan University.

Institutional Review Board Statement

Not applicable.

Informed Consent Statement

Not applicable.

Data Availability Statement

The raw and processed data required to reproduce these findings are available in the Supplementary Materials.

Acknowledgments

The authors express their gratitude and appreciation to IPB University (Bogor Agricultural University) (ID), Pakuan University (ID), and the Directorate General of Higher Education—Ministry of Education, Culture, Research, and Technology (ID) for the finances, facilities, and opportunity to conduct this research.

Conflicts of Interest

The authors declare no conflict of interest.

References

  1. Sun, Q.; Huang, Q.; Duan, Z.; Zhang, A. Recycling Potential Comparison of Mass Timber Constructions and Concrete Buildings: A Case Study in China. Sustainability 2022, 14, 6174. [Google Scholar] [CrossRef]
  2. Duan, Z.; Huang, Q.; Zhang, Q. Life Cycle Assessment of Mass Timber Construction: A Review. Build. Environ. 2022, 221, 109320. [Google Scholar] [CrossRef]
  3. Wijnants, L.; Allacker, K.; De Troyer, F. Life-Cycle Assessment of Timber Frame Constructions—The Case of Rooftop Extensions. J. Clean. Prod. 2019, 216, 333–345. [Google Scholar] [CrossRef]
  4. Krišták, L.; Igaz, R.; Brozman, D.; Réh, R.; Šiagiová, P.; Stebila, J.; Očkajová, A. Life Cycle Assessment of Timber Formwork: Case Study. Adv. Mater. Res. 2014, 1001, 155–161. [Google Scholar] [CrossRef]
  5. Achenbach, H.; Wenker, J.L.; Rüter, S. Life Cycle Assessment of Product- and Construction Stage of Prefabricated Timber Houses: A Sector Representative Approach for Germany According to EN 15804, EN 15978 and EN 16485. Eur. J. Wood Wood Prod. 2018, 76, 711–729. [Google Scholar] [CrossRef]
  6. SNI 7973:2013; Spesifikasi Desain Untuk Konstruksi Kayu (Design Specification for Wooden Construction). Badan Standardisasi Nasional: Jakarta, Indonesia, 2013; p. 312.
  7. American National Standard Institution; American Wood Council. NDS, National Design Specification for Wood Construction, ASD/LRFD; American National Standard Institution: New York, NY, USA; American Wood Council: Leesburg, VA, USA, 2012. [Google Scholar]
  8. Firmanti, A.; Bachtiar, E.T.; Surjokusumo, S.; Komatsu, K.; Kawai, S. Mechanical Stress Grading of Tropical Timbers without Regard to Species. J. Wood Sci. 2005, 51, 339–347. [Google Scholar] [CrossRef]
  9. ASTM D5536-94(1999); Standard Practice for Sampling Forest Trees for Determination of Clear Wood Properties. American Society for Testing and Materials (ASTM): West Conshohocken, PA, USA, 2017.
  10. ASTM D143-14; Standard Test Methods for Small Clear Specimens of Timber. American Society for Testing and Materials (ASTM): West Conshohocken, PA, USA, 2014.
  11. ASTM D2555-05; Standard Practice for Establishing Clear Wood Strength Values. American Society for Testing and Materials (ASTM): West Conshohocken, PA, USA, 2005; pp. 1–18.
  12. ASTM D2915; Standard Practice for Sampling and Data-Analysis for Structural Wood and Wood-Based Products. American Society for Testing and Materials (ASTM): West Conshohocken, PA, USA, 2017; pp. 1–14.
  13. ASTM D245; Standard Practice for Establishing Structural Grades and Related Allowable Properties for Visually Graded Lumber. American Society for Testing and Materials (ASTM): West Conshohocken, PA, USA, 2000; Volume 6, p. 46.
  14. ASTM D198; Standard Test Methods of Static Tests of Lumber in Structural Sizes. American Society for Testing and Materials (ASTM): West Conshohocken, PA, USA, 2021; p. 52.
  15. ASTM D5457-19c; Standard Specification for Computing Reference Resistance of Wood-Based Materials and Structural Connections for Load and Resistance Factor Design. American Society for Testing and Materials (ASTM): West Conshohocken, PA, USA, 2019; pp. 1–12.
  16. Hayatunnufus, A.; Nugroho, N.; Bahtiar, E.T. Faktor Stabilitas Balok Kayu Pada Konfigurasi Pembebanan Terpusat (Stability Factor of Wooden Beams in One Point Loading). J. Tek. Sipil dan Lingkung. 2022, 7, 129–146. [Google Scholar] [CrossRef]
  17. Bahtiar, E.T.; Erizal, E.; Hermawan, D.; Nugroho, N.; Hidayatullah, R. Experimental Study of Beam Stability Factor of Sawn Lumber Subjected to Concentrated Bending Loads at Several Points. Forests 2022, 13, 1480. [Google Scholar] [CrossRef]
  18. Nocetti, M.; Brunetti, M.; Bacher, M. Effect of Moisture Content on the Flexural Properties and Dynamic Modulus of Elasticity of Dimension Chestnut Timber. Eur. J. Wood Wood Prod. 2015, 73, 51–60. [Google Scholar] [CrossRef]
  19. Bahtiar, E.T.; Arinana, A.; Nugroho, N.; Nandika, D. Daily Cycle of Air Temperature and Relative Humidity Effect to Creep Deflection of Wood Component of Low-Cost House in Cibeureum-Bogor, West Java, Indonesia. Asian J. Sci. Res. 2014, 7, 501–512. [Google Scholar] [CrossRef]
  20. Dietsch, P.; Franke, S.; Franke, B.; Gamper, A.; Winter, S. Methods to Determine Wood Moisture Content and Their Applicability in Monitoring Concepts. J. Civ. Struct. Health Monit. 2015, 5, 115–127. [Google Scholar] [CrossRef] [Green Version]
  21. Mvondo, R.R.N.; Meukam, P.; Jeong, J.; Meneses, D.D.S.; Nkeng, E.G. Influence of Water Content on the Mechanical and Chemical Properties of Tropical Wood Species. Results Phys. 2017, 7, 2096–2103. [Google Scholar] [CrossRef]
  22. Korkmaz, O.; Buyuksari, Ü. Effects of Moisture Content on Mechanical Properties of Micro-Size Oak Wood. BioResources 2019, 14, 7655–7663. [Google Scholar] [CrossRef]
  23. Kaku, C.; Hasemi, Y.; Kamikawa, D.; Suzuki, T.; Yasui, N.; Koshihara, M.; Nagao, H. Influence of Water Content on the Mechanical Properties of Wood Exposed to Fire. J. Struct. Constr. Eng. (Trans. AIJ) 2017, 82, 299–308. [Google Scholar] [CrossRef] [Green Version]
  24. Madsen, B. Recommended Moisture Adjustment Factors for Lumber Stresses. Can. J. Civ. Eng. 1982, 9, 602–610. [Google Scholar] [CrossRef]
  25. Cousins, W.J. Young’s Modulus of Hemicellulose as Related to Moisture Content. Wood Sci. Technol. 1978, 12, 161–167. [Google Scholar] [CrossRef]
  26. Cousins, W.J. Elastic Modulus of Lignin as Related to Moisture Content. Wood Sci. Technol. 1976, 10, 9–17. [Google Scholar] [CrossRef]
  27. Cannell, M.G.R.; Morgan, J. Young’s Modulus of Sections of Living Branches and Tree Trunks. Tree Physiol. 1987, 3, 355–364. [Google Scholar] [CrossRef]
  28. Kane, B. Branch Strength of Bradford Pear (Pyrus Calleryanavar. ‘Bradford’). Arboric. Urban For. 2007, 33, 283–291. [Google Scholar] [CrossRef]
  29. Kane, B.; Clouston, P. Tree Pulling Tests of Large Shade Trees in the Genus Acer. Arboric. Urban For. 2008, 34, 101–109. [Google Scholar] [CrossRef]
  30. Kane, B. Determining Parameters Related to the Likelihood of Failure of Red Oak (Quercus rubra L.) from Winching Tests. Trees 2014, 28, 1667–1677. [Google Scholar] [CrossRef]
  31. Glass, S.V.; Zelinka, S.L. Moisture Relations and Physical Properties of Wood. In Wood Handbook: Wood as an Engineering Material; General Technical Report FPL-GTR-282; U.S. Department of Agriculture, Forest Service, Forest Products Laboratory: Madison, WI, USA, 2021. [Google Scholar]
  32. Cahyono, T.D.; Wahyudi, I.; Priadi, T.; Febrianto, F.; Darmawan, W.; Bahtiar, E.T.; Ohorella, S.; Novriyanti, E. The Quality of 8 and 10 Years Old Samama Wood (Anthocephalus macrophyllus). J. Indian Acad. Wood Sci. 2015, 12, 22–28. [Google Scholar] [CrossRef]
  33. Cahyono, T.D.; Wahyudi, I.; Priadi, T.; Febrianto, F.; Bahtiar, E.T.; Novriyanti, E. Analysis on Wood Quality, Geometry Factor, and Their Effects on Lathe Check of Samama (Anthocephalus macrophyllus) Veneer. J. Korean Wood Sci. Technol. 2016, 44, 828–841. [Google Scholar] [CrossRef] [Green Version]
  34. Engelund, E.T.; Thygesen, L.G.; Svensson, S.; Hill, C.A.S. A Critical Discussion of the Physics of Wood–Water Interactions. Wood Sci. Technol. 2013, 47, 141–161. [Google Scholar] [CrossRef] [Green Version]
  35. Stamm, A.J. A Review of Nine Methods for Determining the Fiber Saturation Points of Wood and Wood Products. Wood Sci. 1971, 4, 114–128. [Google Scholar]
  36. Hoffmeyer, P.; Engelund, E.T.; Thygesen, L.G. Equilibrium Moisture Content (EMC) in Norway Spruce during the First and Second Desorptions. Holzforschung 2011, 65, 875–882. [Google Scholar] [CrossRef] [Green Version]
  37. Hill, C.A.S.; Forster, S.C.; Farahani, M.R.M.; Hale, M.D.C.; Ormondroyd, G.A.; Williams, G.R. An Investigation of Cell Wall Micropore Blocking as a Possible Mechanism for the Decay Resistance of Anhydride Modified Wood. Int. Biodeterior. Biodegrad. 2005, 55, 69–76. [Google Scholar] [CrossRef]
  38. Hernández, R.E.; Bizoň, M. Changes in Shrinkage and Tangential Compression Strength of Sugar Maple below And above the Fiber Saturation Point. Wood Fiber Sci. 1994, 26, 360–369. [Google Scholar]
  39. Engelund, E.T.; Thygesen, L.G.; Hoffmeyer, P. Water Sorption in Wood and Modified Wood at High Values of Relative Humidity. Part 2: Appendix. Theoretical Assessment of the Amount of Capillary Water in Wood Microvoids. Holzforschung 2010, 64, 325–330. [Google Scholar] [CrossRef]
  40. Thygesen, L.G.; Tang Engelund, E.; Hoffmeyer, P. Water Sorption in Wood and Modified Wood at High Values of Relative Humidity. Part I: Results for Untreated, Acetylated, and Furfurylated Norway Spruce. Holzforschung 2010, 64, 315–323. [Google Scholar] [CrossRef]
  41. Green, D.W. Wood: Strength and Stiffness. In Encyclopedia of Materials: Science and Technology; Elsevier: Amsterdam, The Netherlands, 2001; pp. 9732–9736. [Google Scholar]
  42. McGrail, S. Wooden Shipbuilding and the Interpretation of Shipwrecks. By J. Richard Steffy. Archaeol. J. 1999, 156, 423. [Google Scholar] [CrossRef]
  43. Tsinker, G.P. Handbook of Port and Harbor Engineering; Springer: Boston, MA, USA, 1997; ISBN 978-1-4757-0865-3. [Google Scholar]
  44. Rasolofo, M.V. Use of Mangroves by Traditional Fishermen in Madagascar. Mangroves Salt Marshes 1997, 1, 243–253. [Google Scholar] [CrossRef]
  45. Bahtiar, E.T.; Nugroho, N.; Rahman, M.M.; Arinana, A.; Kartika Sari, R.; Wirawan, W.; Hermawan, D. Estimation the Remaining Service-Lifetime of Wooden Structure of Geothermal Cooling Tower. Case Stud. Constr. Mater. 2017, 6, 91–102. [Google Scholar] [CrossRef]
  46. Bahtiar, E.T.; Nugroho, N.; Hermawan, D.; Wirawan, W. Khuschandra Triangle Bracing System to Reduce the Vibration Level of Cooling Tower—Case Study in PT Star Energy Geothermal (Wayang Windu) Ltd.—Indonesia. Case Stud. Constr. Mater. 2018, 8, 248–257. [Google Scholar] [CrossRef]
  47. Bahtiar, E.T.; Nugroho, N.; Arinana, A.; Darwis, A. Pendugaan Sisa Umur Pakai Kayu Komponen Cooling Tower Di Pembangkit Listrik Tenaga Panas Bumi (PLTP) Unit II Kamojang (Estimating the Remaining Life of Wood Cooling Tower Component in Geothermal Power Plant Unit II Kamojang). J. Tek. Sipil 2012, 19, 103. [Google Scholar] [CrossRef]
  48. Bahtiar, E.T.; Nugroho, N.; Hermawan, D.; Wirawan, W.; Arinana, A.; Sari, R.K.; Rahman, M.M.; Sidik, M. Wood Deterioration of Cooling Tower Structure at Geothermal Power Plant. Asian J. Appl. Sci. 2017, 10, 79–87. [Google Scholar] [CrossRef]
  49. EN 1995-1-1:2004; Eurocode 5: Design of Timber Structures—Part 1-1: General—Common Rules and Rules for Buildings. The European Union: Geneva, Switzerland, 2004; pp. 1–121.
  50. NZS 3603:1993; Timber Structures Standard. Ministry of Business Innovation & Employment: Wellington, New Zealand, 1993.
  51. Granello, G.; Palermo, A. Creep in Timber: Research Overview and Comparison between Code Provisions. N. Z. Timber Des. J. 2019, 27, 6–22. [Google Scholar]
  52. AWC; ANSI. National Design Specification (NDS) for Wood Construction; American Wood Council’s (AWC): Leesburg, VA, USA; ANSI: New York, NY, USA, 2018; p. 192. [Google Scholar]
  53. CSA O86:19; Engineering Design in Wood. CSA Group: Toronto, ON, Canada, 2019.
  54. ISO 10816-3:2009; Mechanical Vibration—Evaluation of Machine Vibration by Measurements on Non-Rotating Parts—Part 3: Industrial Machines with Nominal Power above 15 KW and Nominal Speeds between 120 r/min and 15,000 r/min When Measured in Situ. International Organization for Standardization: Geneva, Switzerland, 2009; pp. 1–12.
  55. Díaz-Francés, E.; Rubio, F.J. On the Existence of a Normal Approximation to the Distribution of the Ratio of Two Independent Normal Random Variables. Stat. Pap. 2013, 54, 309–323. [Google Scholar] [CrossRef]
  56. Wistara, N.J.; Sukowati, M.; Pamoengkas, P. The Properties of Red Meranti Wood (Shorea leprosula Miq) from Stand with Thinning and Shade Free Gap Treatments. J. Indian Acad. Wood Sci. 2016, 13, 21–32. [Google Scholar] [CrossRef]
  57. Alokabel, K.; Lay, Y.E.; Wonlele, T. Penentuan Kelas Kuat Kayu Lokal Di Pulau Timor Sebagai Bahan Konstruksi (Local Wood Strength Grade Determination in Timor Island as Construction Materials). JUTEKS—J. Tek. Sipil 2018, 2, 139. [Google Scholar] [CrossRef]
  58. Lempang, M. Basic Properties and Uses of Agathis (Agathis Hamii M. Dr.) Wood from South Sulawesi. J. Penelit. Kehutan. Wallacea 2017, 6, 157–167. [Google Scholar] [CrossRef] [Green Version]
  59. Bahtiar, E.T.; Nugroho, N.; Massijaya, M.Y.; Roliandi, H.; Augusti, R.; Satriawan, A. Method to Estimate Mechanical Properties of Glulam on Flexure Testing Based on Its Laminae Characteristics and Position. Indones. J. Phys. 2016, 22, 57–67. [Google Scholar] [CrossRef]
  60. Nugroho, N.; Bahtiar, E.T. Nurmadina Grading Development of Indonesian Bamboo Culm: Case Study on Tali Bamboo (Gigantochloa apus). In Proceedings of the 2018 World Conference on Timber Engineering, Seoul, Republic of Korea, 20–23 August 2018; pp. 1–6. [Google Scholar]
  61. Bahtiar, E.T.; Imanullah, A.P.; Hermawan, D.; Nugroho, N. Abdurachman Structural Grading of Three Sympodial Bamboo Culms (Hitam, Andong, and Tali) Subjected to Axial Compressive Load. Eng. Struct. 2019, 181, 233–245. [Google Scholar] [CrossRef]
  62. Nurmadina; Nugroho, N.; Bahtiar, E.T. Structural Grading of Gigantochloa apus Bamboo Based on Its Flexural Properties. Constr. Build. Mater. 2017, 157, 1173–1189. [Google Scholar] [CrossRef]
  63. Nugroho, N.; Bahtiar, E.T. Buckling Formulas for Designing a Column with Gigantochloa apus. Case Stud. Constr. Mater. 2021, 14, e00516. [Google Scholar] [CrossRef]
  64. Nugroho, N.; Kartini; Bahtiar, E.T. Cross-Species Bamboo Grading Based on Flexural Properties. IOP Conf. Ser. Earth Environ. Sci. 2021, 891, 012008. [Google Scholar] [CrossRef]
  65. Nugroho, N.; Bahtiar, E.T.; Budhijatmiko Lelono, A. Kekuatan Bambu Betung (Dendrocalamus asper Backer Ex K.Heyne) Menahan Gaya Normal Tekanan Dan Tarikan (The Strength of Betung Bamboo (Dendrocalamus asper Backer Ex K. Heyne) to Support Normal Force in Compression and Tension). J. Penelit. Has. Hutan 2022, 40, 37–48. [Google Scholar] [CrossRef]
  66. Bahtiar, E.T.; Malkowska, D.; Trujillo, D.; Nugroho, N. Experimental Study on Buckling Resistance of Guadua angustifolia Bamboo Column. Eng. Struct. 2021, 228, 111548. [Google Scholar] [CrossRef]
  67. Bahtiar, E.T.; Trujillo, D.; Nugroho, N. Compression Resistance of Short Members as the Basis for Structural Grading of Guadua angustifolia. Constr. Build. Mater. 2020, 249, 118759. [Google Scholar] [CrossRef]
  68. Hermawan, D.; Budiman, I.; Febrianto, F.; Subyakto, S.; Pari, G.; Ghozali, M.; Bahtiar, E.T.; Sutiawan, J.; de Azevedo, A.R.G. Enhancement of the Mechanical, Self-Healing and Pollutant Adsorption Properties of Mortar Reinforced with Empty Fruit Bunches and Shell Chars of Oil Palm. Polymers 2022, 14, 410. [Google Scholar] [CrossRef]
  69. NI-5 PKKI 1961; Peraturan Konstruksi Kayu Indonesia (Indonesian Wooden Building Code). PKKI: Jakarta, Indonesia, 1961.
  70. Tze, W.T.Y.; Wang, S.; Rials, T.G.; Pharr, G.M.; Kelley, S.S. Nanoindentation of Wood Cell Walls: Continuous Stiffness and Hardness Measurements. Compos. Part A Appl. Sci. Manuf. 2007, 38, 945–953. [Google Scholar] [CrossRef]
  71. Madsen, B. Moisture Content—Strength Relationship for Lumber Subjected to Bending. Can. J. Civ. Eng. 1975, 2, 466–473. [Google Scholar] [CrossRef]
  72. Winandy, J.E. Effect of Moisture Content on Strength of CCA-Treated Lumber. Wood Fiber Sci. 1995, 27, 168–177. [Google Scholar]
  73. Soares, L.; Fraga, I.; Paula, L.; Arroyo, F.; Ruthes, H.; Aquino, V.; Molina, J.; Panzera, T.; Branco, L.; Chahud, E.; et al. Influence of Moisture Content on Physical and Mechanical Properties of Cedrelinga Catenaeformis Wood. BioResources 2021, 16, 6758–6765. [Google Scholar] [CrossRef]
  74. Barrett, J.D.; Lau, W. Bending Strength Adjustments for Moisture Content for Structural Lumber. Wood Sci. Technol. 1991, 25. [Google Scholar] [CrossRef]
  75. Forest Products Laboratory—USDA. Wood Handbook: Wood as an Engineering Material; General Technical Report FPL-GTR-190; Forest Products Laboratory—USDA: Madison, WI, USA, 2010. [Google Scholar]
  76. Martawijaya, A.; Kartasujana, I.; Kadir, K.; Prawira, S.A. Atlas Kayu Indonesia Jilid I (Indonesian Wood Atlas, Volume I); Departemen Kehutanan—Badang Penelitian dan Pengembangan Kehutanan: Bogor, Indonesia, 2005. [Google Scholar]
  77. Martawijaya, A.; Kartasujana, I.; Mandang, Y.I.; Prawira, S.A.; Kadir, K. Atlas Kayu Indonesia, Jilid II (Indonesian Wood Atlas, Volume II); IAWA Journal, Ed.; Departemen Kehutanan—Badang Penelitian dan Pengembangan Kehutanan: Bogor, Indonesia, 1990; Volume 11. [Google Scholar]
  78. Darmawan, W.; Nandika, D.; Hasna Afaf, B.D.; Rahayu, I.; Lumongga, D. Radial Variation in Selected Wood Properties of Indonesian Merkusii Pine. J. Korean Wood Sci. Technol. 2018, 46, 323–337. [Google Scholar] [CrossRef]
  79. Ishiguri, F.; Makino, K.; Wahyudi, I.; Takashima, Y.; Iizuka, K.; Yokota, S.; Yoshizawa, N. Stress Wave Velocity, Basic Density, and Compressive Strength in 34-Year-Old Pinus Merkusii Planted in Indonesia. J. Wood Sci. 2011, 57, 526–531. [Google Scholar] [CrossRef]
  80. ASTM D1990-19; Standard Practice for Establishing Allowable Properties for Visually-Graded Dimension Lumber from In-Grade Tests of Full-Size Specimens. American Society for Testing and Materials (ASTM): West Conshohocken, PA, USA, 2019.
Figure 1. The distribution of mechanical properties at wet and air-dry conditions (Note: μi = average mechanical properties, si = standard deviation, Ri0.05 = fifth percentile value, (i = d, w, and (d-w), are d = dry wood, w = wet wood, and (d-w) = dry wood minus wet wood, respectively).
Forests 13 02094 g001
Figure 2. Specimen’s size and shape for (a) static bending, (b) shear-parallel-to-grain, (c) tensile-parallel-to-grain, (d) compressive-parallel-to-grain, and (e) compressive-perpendicular-to-grain (Note: the size unit is cm).
Forests 13 02094 g002
Figure 3. (A) Mechanical properties test in the (1) air-dry and (2) wet conditions: (a) static bending, (b) shear-parallel-to-grain, (c) tensile-parallel-to-grain, (d) compressive-parallel-to-grain, (e) compressive-perpendicular-to-grain. (B) Universal Testing Machine (SATEC/Baldwin, Grove City, PA, US), equipped with load cell, linear variable displacement transducers, and Multipurpose Digital Indicator (installed by PT Testindo, Jakarta and calibrated by PT Global Quality Indonesia, Bandung, ID) is employed to conduct the mechanical properties test.
Forests 13 02094 g003
Figure 4. Mechanical properties of wood in the wet and air-dry conditions: (a) Modulus of rupture, (b) Shear strength parallel to the grain, (c) Tensile strength parallel to the grain, (d) Maximum crushing strength, (e) Compressive strength perpendicular-to-grain at the proportional limit, (f) Compressive strength perpendicular-to-grain at the 4” deformation, (g) Modulus of elasticity.
Forests 13 02094 g004
Figure 5. Comparison of wet service factor (CM) determination as the ratio of wet (30% MC) to dry (15% MC) full-sized timber specimen’s modulus of rupture following Madsen’s [24,71] graphs: (a) Hem-Fir and (b) Spruce-Pine-Fir (S-P-F).
Forests 13 02094 g005
Figure 6. Comparison of wet service factor (CM) determination as the ratio of wet to dry wood’s modulus of rupture using several basis calculations: (a) the ratio of the fifth percentile value (Rw0.05/Rd0.05), the ratio of the average wet wood’s mechanical properties to the average of dry ones (μwd), and (b) the average of wet to air-dry wood’s mechanical properties ratio ( μ σ w σ d ).
Forests 13 02094 g006
Table 1. Adjustment factors application for correcting the sawn lumber’s reference resistance [6,7].
ASD OnlyASD and LRFDLRFD Only
Load Duration Factor Wet Service FactorTemperature FactorBeam Stability FactorSize FactorFlat Use FactorIncising FactorRepetitive Member FactorColumn Stability FactorBuckling Stiffness FactorBearing Area FactorFormat Conversion FactorResistance FactorTime Effect Factor
CDCMCtCLCFCfuCiCrCPCTCbKFϕλ
Fb’ = Fb×CDCMCtCLCFCfuCiCr---2.540.85λ
Ft’ = Ft×CDCMCt-CF-Ci----2.700.80λ
Fv’ = Fv×CDCMCt---Ci----2.880.75-
Fc⊥’ = Fc⊥×-CMCt---Ci---Cb1.670.90λ
Fc’ = Fc×CDCMCt-CF-Ci-CP--2.400.90-
E’ = E×-CMCt---Ci-------
Emin’ = Emin×-CMCt---Ci--CT-1.760.85-
Table 2. Wet service factor (CM) for sawn lumber [6,7].
FbFtFvFcFcE and Emin
CM0.85 *1.00.970.670.8 **0.9
Note: *: if Fb ≤ 8 MPa, CM = 1.0; **: if Fc ≤ 5.2 MPa, CM = 1.0.
Table 3. Modified t-test procedures to analyze: (1) the dry to wet wood’s mechanical properties differences and (2) the empirical CM to SNI 7973:2013′s tabulated value.
ith Species jth Replicationkth Condition Error   ( ε i j k = x i j k x ¯ i k ) Empirical Wet Service Factor (CME)
1 = Wet2 = Dry1 = Wet2 = Dryxi11/xij2xi21/xij2xi31/xij2xi41/xij2xi51/xij2
1 = meranti1x111x112x111 x ¯ 1 j 1 x112 x ¯ 1 j 2 x111/x112x121/x112x131/x112x141/x112x151/x112
2x121x122x121 x ¯ 1 j 1 x122 x ¯ 1 j 2 x111/x122x121/x122x131/x122x141/x122x151/x122
3x131x132x131 x ¯ 1 j 1 x132 x ¯ 1 j 2 x111/x132x121/x132x131/x132x141/x132x151/x132
4x141x142x141 x ¯ 1 j 1 x142 x ¯ 1 j 2 x111/x142x121/x142x131/x142x141/x142x151/x142
5x151x152x151 x ¯ 1 j 1 x151 x ¯ 1 j 2 x111/x152x121/x152x131/x152x141/x152x151/x152
Average x ¯ 1 j 1 x ¯ 1 j 2
Difference D 1 j = x ¯ 1 j 1 x ¯ 1 j 2
2 = mahogany1x211x212x211 x ¯ 2 j 1 x212 x ¯ 2 j 2 x211/x212x221/x212x231/x212x241/x212x251/x212
2x221x222x221 x ¯ 2 j 1 x222 x ¯ 2 j 2 x211/x222x221/x222x231/x222x241/x222x251/x222
3x231x232x231 x ¯ 2 j 1 x232 x ¯ 2 j 2 x211/x232x221/x232x231/x232x241/x232x251/x232
4x241x242x241 x ¯ 2 j 1 x242 x ¯ 2 j 2 x211/x242x221/x242x231/x242x241/x242x251/x242
5x251x252x251 x ¯ 2 j 1 x251 x ¯ 2 j 2 x211/x252x221/x252x231/x252x241/x252x251/x252
Average x ¯ 2 j 1 x ¯ 2 j 2
Difference D 2 j = x ¯ 2 j 1 x ¯ 2 j 2
3 = agathis 1x311x312x311 x ¯ 3 j 1 x312 x ¯ 3 j 2 x311/x312x321/x312x331/x312x341/x312x351/x312
2x321x322x321 x ¯ 3 j 1 x322 x ¯ 3 j 2 x311/x322x321/x322x331/x322x341/x322x351/x322
3x331x332x331   x   ¯ 3 j 1 x332 x ¯ 3 j 2 x311/x332x321/x332x331/x332x341/x332x351/x332
4x341x342x341 x ¯ 3 j 1 x342 x ¯ 3 j 2 x311/x342x321/x342x331/x342x341/x342x351/x342
5x351x352x351 x ¯ 3 j 1 x351 x ¯ 3 j 2 x311/x352x321/x352x331/x352x341/x352x351/x352
Average x ¯ 3 j 1 x ¯ 3 j 2
Difference D 3 j = x ¯ 3 j 1 x ¯ 3 j 2
4 = pine1x411x412x411 x ¯ 4 j 1 x412 x ¯ 4 j 2 x411/x412x421/x412x431/x412x441/x412x451/x412
2x421x422x421 x ¯ 4 j 1 x422 x ¯ 4 j 2 x411/x422x421/x422x431/x422x441/x422x451/x422
3x431x432x431 x ¯ 4 j 1 x432 x ¯ 4 j 2 x411/x432x421/x432x431/x432x441/x432x451/x432
4x441x442x441 x ¯ 4 j 1 x442 x ¯ 4 j 2 x411/x442x421/x442x431/x442x441/x442x451/x442
5x451x452x451 x ¯ 4 j 1 x451 x ¯ 4 j 2 x411/x452x421/x452x431/x452x441/x452x451/x452
Average x ¯ 4 j 1 x ¯ 4 j 2
Difference D 4 j = x ¯ 4 j 1 x ¯ 4 j 2
Table 4. Physical properties of air-dry and wet clear-wood specimens.
PineAgathisRed MerantiMahogany
DryWetDryWetDryWetDryWet
Moisture content (w, %)17.1131.116.5118.316.574.115.995.6
Density (ρ, g/cm3)0.501.080.560.920.730.950.651.00
Specific gravity (SG)0.420.480.480.410.610.530.550.51
Table 5. This study’s mechanical properties of wood at air-dry conditions compared to several previous reports.
Mechanical PropertiesThis Study’s Laboratory Test Previous   Report   ( x ¯ ± s )   or   ( min max )
PineAgathisMerantiMahoganyPineAgathisMerantiMahogany
Modulus of rupture (σb, MPa)62.7356.4986.9481.5855.15 ± 10.18 [17]52.03 ± 4.46 [16]72.42 ± 12.15 [17]70.47 ± 11.37 [17]
55.57 ± 10.76 [16]49.0–71.1 [69]75.33 ± 15.95 [16]70.83 ± 12.52 [16]
49.0–71.1 [69]49.3 [76]35.3–107.9 [69]49.0–107.9 [69]
63 [78] 87.6 [75]
Shear strength parallel-to-grain (τ, MPa)9.769.8810.5312.118.55 [77] 10 [75]7.0 [76]
Maximum crushing strength (σc, MPa)28.5426.0954.2146.1729.4–41.7 [69]29.4–41.7 [69]21.1–63.7 [69]29.4–61.3 [69]
23.0–29.4 [79]32.8 [76]50.7 [75]36.9 [76]
Modulus of elasticity (E, MPa)727891131052381587218 ± 1837 [17]6976 ± 618 [17]11001 ± 1379 [17]8033 ± 1079 [17]
7341 ± 2069 [16]7407 ± 639 [16]10372 ± 1559 [16]8013 ± 1449 [16]
7845 [69]7845 [69]5884–9806 [69]7845–9806 [69]
7597 [78] 12200 [75]9562 [76]
Table 6. The average mechanical properties of wood in wet (water-saturated) and air-dry conditions.
Mechanical PropertiesWet (Water-Saturated)Air-Dry
PineAgathisMerantiMahoganyPineAgathisMerantiMahogany
Modulus of rupture (σb, MPa)36.8943.2477.9157.6062.7356.4986.9481.58
Shear strength parallel-to-grain (τ, MPa)6.237.665.208.079.769.8810.5312.11
Tensile strength parallel-to-grain (σt, MPa)51.8224.10115.3846.3371.1444.57135.1063.69
Maximum crushing strength (σc, MPa)17.6316.8131.5137.6928.5426.0954.2146.17
Compressive stress perpendicular-to-grain at the proportional limit (σcpl, MPa)1.833.755.614.475.054.828.555.75
Compressive stress perpendicular-to-grain at the 0.04″ deformation (σc⊥0.04, MPa)1.753.865.844.905.205.128.606.18
Modulus of elasticity (E, MPa)40705096592247867278911310,5238158
Table 7. The normality test of the error of mechanical properties test results.
Mechanical PropertiesKolmogorov–SmirnovLillieforsShapiro–Wilk
dpNormalitypNormalityWpNormality
Modulus of rupture (σb)0.11925>0.20normal<0.20normal0.898510.00173not normal
Shear strength parallel-to-grain (τ)0.11753>0.20normal<0.20normal0.928980.01492not normal
Tensile strength parallel-to-grain (σt)0.14497>0.20normal<0.05not normal0.935960.02533not normal
Maximum crushing strength (σc)0.10496>0.20normal>0.20normal0.954680.10992normal
Compressive stress perpendicular-to-grain at the proportional limit (σcpl)0.06086>0.20normal>0.20normal0.991370.98821normal
Compressive stress perpendicular-to-grain at the 0.04″ deformation (σc⊥0.04)0.11445>0.20normal>0.20normal0.977740.60605normal
Modulus of elasticity (E)0.13437>0.20normal<0.10normal0.975720.53438normal
Table 8. Paired-group t-test results for the mechanical properties difference of air-dry and wet wood.
PropertiesSample Size (n)Average ± Standard Deviationt-Valuet Tablep
WetDryDry–Wet
Modulus of rupture (σb, MPa)4053.91±6.0371.93±11.8518.02±10.2511.12592.35180.0000 **
Shear strength parallel-to-grain (τ, MPa)406.79±1.0410.57±1.123.78±1.1820.29472.35180.0000 **
Tensile strength parallel-to-grain (σt, MPa)4059.41±14.0478.62±12.3819.22±14.428.42822.35180.0000 **
Maximum crushing strength (σc, MPa)4025.91±1.7538.75±2.6212.84±2.4333.47062.35180.0000 **
Compressive stress perpendicular-to-grain at the proportional limit (σcpl, MPa)403.92±0.706.04±0.752.13±0.7917.00422.35180.0000 **
Compressive stress perpendicular-to-grain at 0.04″ (σc⊥0.04, MPa)404.09±0.916.28±0.872.19±0.9714.27662.35180.0000 **
Modulus of elasticity (E, MPa)404969±9838768±15773799±143216.78342.35180.0000 **
Note: ** very significantly different.
Table 9. The wet service factor (CM) of four wood species compared to the tabulated CM in SNI 7973:2013.
PropertiesWood SpeciesAverageSNI
PineAgathisMerantiMahogany
Modulus of rupture (σb)0.640.770.900.720.760.85
Shear strength parallel-to-grain (τ)0.640.780.500.670.650.97
Tensile strength parallel-to-grain (σt)0.740.550.870.750.731.00
Maximum crushing strength (σc)0.620.650.580.820.670.80
Compressive stress perpendicular-to-grain at the proportional limit (σcpl)0.360.820.660.790.660.67
Compressive stress perpendicular-to-grain at 0.04″ (σc⊥0.04)0.340.790.690.800.660.67
Modulus of elasticity (E)0.580.590.570.610.590.90
Table 10. One-point t-test result for the difference between empirical and tabulated wet service factor.
PropertiesSample Size
(n, Combination)
Wet Service Factor (CM)|t-value|t-table p
EmpiricStandard ErrorSNI 7973:2013
Modulus of rupture (σb)1000.760.170.855.57392.2760.0000 **
Shear strength parallel-to-grain (τ)1000.650.150.9720.85492.2760.0000 **
Tensile strength parallel-to-grain (σt)1000.730.21113.07022.2760.0000 **
Maximum crushing strength (σc)1000.670.120.811.37552.2760.0000 **
Compressive stress perpendicular-to-grain at the proportional limit (σcpl)1000.660.240.670.50702.2760.6133 ns
Compressive stress perpendicular-to-grain at 0.04″ (σc⊥0.04)1000.660.250.670.58982.2760.5567 ns
Modulus of elasticity (E)1000.590.150.8517.20102.2760.0000 **
Note: **: very significant, ns: not significant.
Table 11. The ratio of green to air-dry allowable properties of lumber 4” (10 cm) and less in nominal thickness when the maximum moisture content is 19% or 15% following Madsen [24] data (recalculated).
PropertiesPercentage Increase in Allowable Properties above That of Green Lumber When Maximum Moisture Content Is [24]Ratio of Green to Air-Dry Allowable Properties When Maximum Moisture Content Is
19%15%19%15%
Modulus of rupture (σb)25350.800.74
Modulus of elasticity (E)14200.880.83
Tensile strength parallel-to-grain (σt)25350.800.74
Maximum crushing strength (σc)50750.670.57
Shear strength parallel-to-grain (τ)8130.930.88
Compressive stress perpendicular-to-grain (σc)50500.670.67
Table 12. The mechanical properties of green and 12% moisture content of small clear specimens were calculated following the function relating mechanical properties to specific gravity [75], and their ratio.
PropertiesSoftwoodHardwoodAverage
CM
PineAgathisMerantiMahogany
Green12% MCCMGreen12% MCCMGreen12% MCCMGreen12% MCCM
Modulus of rupture (σb)48.976.20.6448.3875.30.6461.890.80.6856.883.60.680.66
Shear strength parallel-to-grain (τ)6.18.40.736.18.30.738.911.60.768.110.70.760.75
Maximum crushing strength (σc)23.543.20.5423.242.70.5426.346.10.5724.243.20.560.55
Compressive stress perpendicular-to-grain (σc)2.64.70.552.54.60.554.66.70.693.85.70.670.61
Modulus of elasticity (E)8.810.50.848.710.40.849.311.10.838.810.60.830.83
Publisher’s Note: MDPI stays neutral with regard to jurisdictional claims in published maps and institutional affiliations.

