Article

Plastome Characterization, Phylogenetic Relationships, and Regional Conservation Status of Ficus populifolia Vahl. (Moraceae), a Peripherally Isolated Plant Population in the Arabian Peninsula

by
Samah A. Alharbi
*,
Widad S. AL-Juhani
and
Enas J. Albokhari
Department of Biology, Faculty of Applied Science, Umm Al-Qura University, Makkah 24381, Saudi Arabia
*
Author to whom correspondence should be addressed.
Forests 2022, 13(12), 2063; https://doi.org/10.3390/f13122063
Submission received: 31 October 2022 / Revised: 26 November 2022 / Accepted: 30 November 2022 / Published: 4 December 2022
(This article belongs to the Special Issue Genetic Diversity and Conservation of Forest Species)

Abstract

:
The Ficus populifolia Vahl. in the Arabian Peninsula is threatened, peripheral, and geographically isolated from its main population in Africa. Here, the entire plastome of F. populifolia from the Arabian Peninsula was sequenced and analyzed to provide a baseline genetic resource for future research. The F. populifolia plastome has a classic quadripartite structure with a size of 160,610 bp, the large and small single copies of 88,729 and 20,097 bp, respectively, and each pair of inverted repeats are 25,892 bp. The genome includes 113 unique genes, 79 protein-coding genes, 30 tRNAs, and 4 rRNAs. The results reveal a total of 49 long repeats, including (30) palindromic, (14) forward, and (5) reverse repeats. Similarly, a total of 186 simple sequence repeats were identified, 83.8% of which were mononucleotides. The genomic comparison with four Ficus species indicated that the plastome of F. populifolia was highly conserved, with some hypervariable noncoding regions. The phylogenomic analysis of 28 species of Ficus, based on 78 coding genes, revealed that F. populifolia is closely related to the African species F. lyrata. The genomic data generated in this study provide valuable resources for future investigations on the population genetics, authentication, and genetic conservation of the wild Arabian population of F. populifolia.

1. Introduction

The Ficus L. (Moraceae) is the most diverse woody plant genus in the world. It consists of over 750 species dispersed primarily across tropical and subtropical regions. The genus exhibits a variety of growth habits including epiphytes, hemi-epiphytic stranglers, climbers, shrubs, and freestanding trees [1]. All its species possess a similar obligate pollination mutualism with fig wasps (Agaonidae, Hymenoptera, and Chalcidoidea) [2]. In times of low fruit availability in tropical forests, figs are keystone resources for frugivores [3].
The Ficus populifolia Vahl belongs to the Ficus section Galoglychia, which is composed of 72 species endemic to the African floristic region [4]. The Ficus populifolia is a moderate-sized tree with yellowish bark and heart-shaped leaves (Figure 1A). It grows on rocky slopes and in ravines in drought–deciduous woodland (savanna). It is widely distributed in western, central, eastern, and north-eastern tropical Africa and Southern Arabia [5,6,7] (Figure 1B). The fruit of the F. populifolia is edible [6], and the plant has the potential for medicinal value. It is commonly used in traditional African medicine to treat sore eyes, pulmonary troubles, diarrhea, wounds, and injuries, and it is also used in veterinary medicine [6,8].
The Ficus populifolia in the Arabian Peninsula is located at the north-western boundary of its range, isolated from the main population in Africa by the Red Sea Basin (Figure 1B). Peripheral isolated plant populations are genetically and ecologically significant and have strategic importance for conservation [9]. In most cases, such populations grow in relatively harsh environmental conditions and may harbor unique adaptations [9,10,11]. The fate of these populations is critical, especially in the context of climate change because they may be the sites of evolution, face increased risk of extinction, act as pools of migrants to occupy new areas, or be the source of genetic novelty that reinforces existing genetic diversity in different regions across the distribution range [12,13].
The biggest threat to peripheral isolated plant populations is human activity [9]. Plant diversity in Southern Arabia, particularly Yemen, is under threat from a variety of natural and anthropogenic factors, which contribute to ecosystem and biodiversity loss [14]. Yemen’s forest has been converted to cultivated lands, bare lands, open shrublands, and rangelands. This has caused threats to watershed ecosystems and led to land degradation and desertification. A large proportion of the area’s biomass was lost or threatened, which resulted in an adverse reduction in their provided goods and services [14]. The recent war has accelerated the use of fuelwood due to the lack of liquified petroleum gas, leading to severe damage to Yemen’s forest areas [14]. International organizations such as the European Council and International Union for Conservation of Nature (IUCN) urged for peripheral isolated plant populations to be regarded as a biodiversity resource and thus included in conservation measures [15]. The Ficus populifolia was listed in the IUCN Red List in 2019 as a Least Concern species [16]. However, the IUCN advised for the inclusion of isolated subpopulations on regional Red Lists [17,18]. Thus, an assessment of the regional conservation status of F. populifolia in Arabia is needed.
Plastome sequences are widely applied in phylogeny, comparative genomics, pedigree geography, population differentiation, and species authentication [19,20]. Plastome sequence data on the Ficus species have increased dramatically in recent years, with over 65 accessions available in the National Center for Biotechnology Information (NCBI) database at the time of preparing this paper. However, these data represent only 27 species, around 3.6% of the species in this vast genus, and almost all of them are Indo-Australasian species (found across Asia, Australia, and on Pacific islands) [21]. Plastome data for afrotropical and neotropical Ficus species, in particular, are poorly represented and need to be supplemented. Recently, two chloroplast genomic comparative analyses were published [22,23], which improved our understanding of the plastome organization patterns in Ficus. Yet, the studies lacked any accessions of afrotropical arid land species, which have important ecological value in the genus. Here, the whole plastome of F. populifolia is reported; to the best of our knowledge, this is the first African dryland Ficus species to be sequenced and analyzed. The data generated in this study will enrich the existing Ficus database and help improve our understanding of the diversity of the genus Ficus.
For this study, a genomic comparative analysis was conducted using four plastomes published in the NCBI database, which have not been included in the previous comparative analyses and represent the major groups of Ficus: F. concinna, F. hirta, F. racemosa, and F. sarmentosa. The analysis covered plastome features, codon usage bias, RNA editing sites, long repeats, microsatellites, sequence divergence, inverted repeat junctions, and the evaluation of the selective pressure in coding genes. A phylogenomic analysis was also performed to reveal the placement of F. populifolia among the genus Ficus. Moreover, the species’ conservation status in the Arabian Peninsula was appraised at a regional level, according to the IUCN. The results of this study may provide valuable guidance for F. populifolia management and utilization in the Arabian Peninsula and serve as a genetic resource for future research on this species.

2. Materials and Methods

2.1. Plastome Comparative Analysis

2.1.1. Plant Sampling

A single accession of Ficus populifolia was collected in 2017 from the Farasan Islands in the Red Sea, Saudi Arabia (16°44′50.7″ N 41°54′24.2″ E). The necessary collecting permits were obtained from the Saudi Wildlife Authority, which controls the Farasan Islands Protected Area. Voucher specimen was submitted to the herbarium in Umm Al-Qura University, Saudi Arabia with accession No. SF184.

2.1.2. DNA Extraction, Library Construction, and Genome Sequencing

The CTAB protocol [24] was used to extract DNA from the silica-dried leaves of F. populifolia. The genomic library was built from 1.0 g of DNA using the Illumina TruSeq Nano DNA 350 Kit and following the manufacturer’s protocol. The library was constructed and sequenced using Illumina SBS technology by Macrogen Inc. (Seoul, Republic of Korea). The raw data yield was 8 GB of 151 bp paired-end reads.

2.1.3. Plastome Assembly and Annotation

The raw data were trimmed using Trimmomatic v.0.36 [25], and then the clean-read sequences were assembled using NOVOPlasty v.2.7.2 [26] with kmer (K-mer = 34). The petB of Ficus ardisioides subsp. camptoneura (GQ504569) was used as a seed, and the complete plastome of Ficus religiosa (NC_033979) was used as a reference. Ficus populifolia plastome was annotated using Geseq and mapped using OGDRAW [27]. The annotated plastome of F. populifolia was submitted to GenBank with the accession number (OP132395).

2.1.4. Codon Usage and RNA Editing Sites

The relative synonymous codon usage (RSCU) values were assessed using the MEGA software v.11.0 [28]. The PREP suite [29] was used to predict the RNA editing sites present in the protein-coding genes with a cut-off value of 0.8.

2.1.5. Repeat Analysis in the Plastome

Long repeats in the F. populifolia plastome were identified using REPuter [30] software v. 2 on its default settings. The simple sequence repeats (SSRs) were identified using MIcroSAtellite (MISA) software v.2.1 [31]. The following parameters were set: mononucleotides (8), dinucleotides (5), trinucleotides (4), and 3 each for tetranucleotides, pentanucleotides, and hexanucleotides.

2.1.6. Sequence Divergence and Boundary

The mVISTA program v.2.0 [32] with the Shuffle-LAGAN mode was used to compare the plastome of F. populifolia with four published plastomes of genus Ficus: F. concinna (MZ128521.1), F. hirta (MN364706.1), F. racemosa (NC_028185.1), and F. sarmentosa (OL415083.1) as representatives of subgenera Urostigma, Ficus, Sycomorus, and Synoecia, respectively (Table S1). Those species were chosen primarily because they had not previously been included in Ficus comparative genomic analysis [22,23]. The annotated plastome of F. populifolia was used as a reference. The boundaries between the inverted repeats and single copies were visualized and investigated using IRscope [33].

2.1.7. Characterization of the Substitution Rate

The Ka/Ks Calculator v.2.0 [34] was used with default parameters to detect the ratio of nonsynonymous (Ka) to synonymous (Ks) substitution (Ka/Ks) in plastome sequencing in F. populifolia compared with those in the four Ficus species.

2.1.8. Phylogenomic Analysis

To infer the phylogenomic position of F. populifolia within the genus Ficus, 30 published plastome sequences were obtained from the GenBank of NCBI (Table S1), 27 of which were Ficus species and an outgroup of 3 species from family Flacourtiaceae (Flacourtia indica, Homalium ceylanicum, and Poliothyrsis sinensis). Phylogenomic analyses were performed on a concatenated set of 78 protein-coding genes (CDS) extracted using Geneious Prime® 2022.1.1 [35] and individually aligned with MUSCLE v.3.8.425 [36] using the default Geneious Prime® parameters.
The phylogenomic relationships were inferred using the maximum likelihood (ML) and the Bayesian inference (BI) methods, as implemented on the CIPRES portal [37]. The best evolution model, GTR + I + G, was subsequently used for both ML and BI analysis, as determined using jModelTest2 v.2.1.6 [38] under the Akaike information criterion (AIC) [39]. ML analysis was performed using RAxML v.8.2.12 [40] with 1000 bootstrap (BS) replicates. BI analyses were conducted in two independent runs using MrBayes v.3.2.7 [41] under the unpartitioned strategy. The Markov Chain Monte Carlo (MCMC) analysis was run for 10 million iterations, sampling every 10,000th replicate. Effective sample size (ESS) greater than 200 was used as the indicator for the convergence of runs, calculated using Tracer v.1.7.1 [42]. The first 25% of trees were discarded, and the majority rule consensus tree was built from the remaining trees. The iTOL v.6.5.8 [43] was used to visualize and annotate the ML and BI trees.

2.2. Conservation Assessment

Three field trips were carried out to the Farasan Islands in 2016 and 2017. Field observations were recorded, including the localities of the F. populifolia trees; the habitat conditions and threats were evident. Point distribution data of F. populifolia in the Arabian Peninsula were gathered from three different sources: field observations in the Farasan Islands (Saudi Arabia), available scientific literature [44,45,46,47], and data from Yemen sent by Dr. Othman S. S. Al-Hawshabi. The GeoCAT software Version BETA [48] was used to calculate the extent of occurrence (EOO) and area of occupancy (AOO). The IUCN Red List guidelines [17,18,49] were followed to assess the conservation status of F. populifolia in the Arabian Peninsula. In this study, criterion B was only used due to the availability of the distribution range data.

3. Results and Discussion

3.1. Plastome Characterization

3.1.1. General Characteristics of the Ficus populifolia Plastome

The plastomes of angiosperms are highly conserved in terms of size, gene content, structure, and organization [50]. The complete plastome of F. populifolia obtained displays a typical double helix circular sequence with a size of 160,610 bp (Figure 2, Table 1). This is roughly similar to those previously reported for the Ficus species [22,23,51,52]. It has the classic quadripartite structure of land-plant plastids [53], with large (LSC) and small (SSC) single copies of 88,729 and 20,097 bp, respectively, and each pair of inverted repeats (IRs) of 25,892 bp.
The total guanine–cytosine (GC) content is 35.84%, with IR regions demonstrating significantly higher levels than single copies, a phenomenon that has been also reported in the Ficus species [23]. This may be due to the high GC content in the four rRNA genes [20]. Adenine–thymine (AT), on the other hand, accounts for 64.14% of the overall genome (Table 1), which is similar to most other plastomes [54,55,56,57].
When considering one copy of duplicated genes, the F. populifolia chloroplast includes 113 unique genes, 79 of which are protein-coding (CDS), 30 tRNAs, and 4 rRNAs (Table S2). The LSC region has 59 CDS regions and 22 tRNA genes, whereas the SSC has 13 CDS and 1 tRNA gene. Seventeen duplicated genes were identified in the IR region, consisting of seven tRNA genes, four rRNA genes, and seven CDS genes.
The composition of introns is highly conserved in seed plant plastomes [20], which plays a vital role in the regulation of gene expression [58]. In the F. populifolia plastome, 21 introns were identified and dispersed throughout 19 genes, 6 tRNA genes, and 13 protein-coding genes. Two genes (ycf3 and clpP) have two introns, whereas the others only have one. LSC has15 introns, SSC has 1 intron, and IR has 5 introns (Table 2).

3.1.2. Codon Usage Bias

The protein-coding genes of F. populifolia were detected for the frequency of amino acids, codon usage count, and the RSCU. The results showed that the F. populifolia plastome includes 53,535 codons; leucine (10.79%) was the most common, whereas cysteine (1.19%) was the least (Figure 3). This is in line with what was previously reported on several plant groups [22,55,59]. The RSCU values (Figure 4, Table S3) revealed that 51.5% of the codons (33/64) were not frequently used with an RSCU value of <1 (4 of them had an A/U-ending, and 29 had a C/G-ending). On the other hand, 45.3% of the codons (29/64) showed a high-use preference with an RSCU value of >1 (28 of them had an A/U-ending, and 1 had a C/G-ending). Methionine and tryptophan had no codon bias with RSCU = 1. The tendency of organisms to be biased towards a set of codons could be explained by several factors, including the rate of gene evolution, selection pressures, abundant tRNA, and the level of gene expression [60]. The results indicate a bias for the A/U bases in the F. populifolia plastome, which is concurrent with the codon bias in other Ficus species [22]. This demonstrates that the Ficus plastomes are relatively conserved and have a similar evolutionary history. The bias for the A/U-ending codons is common in the dicots [61].

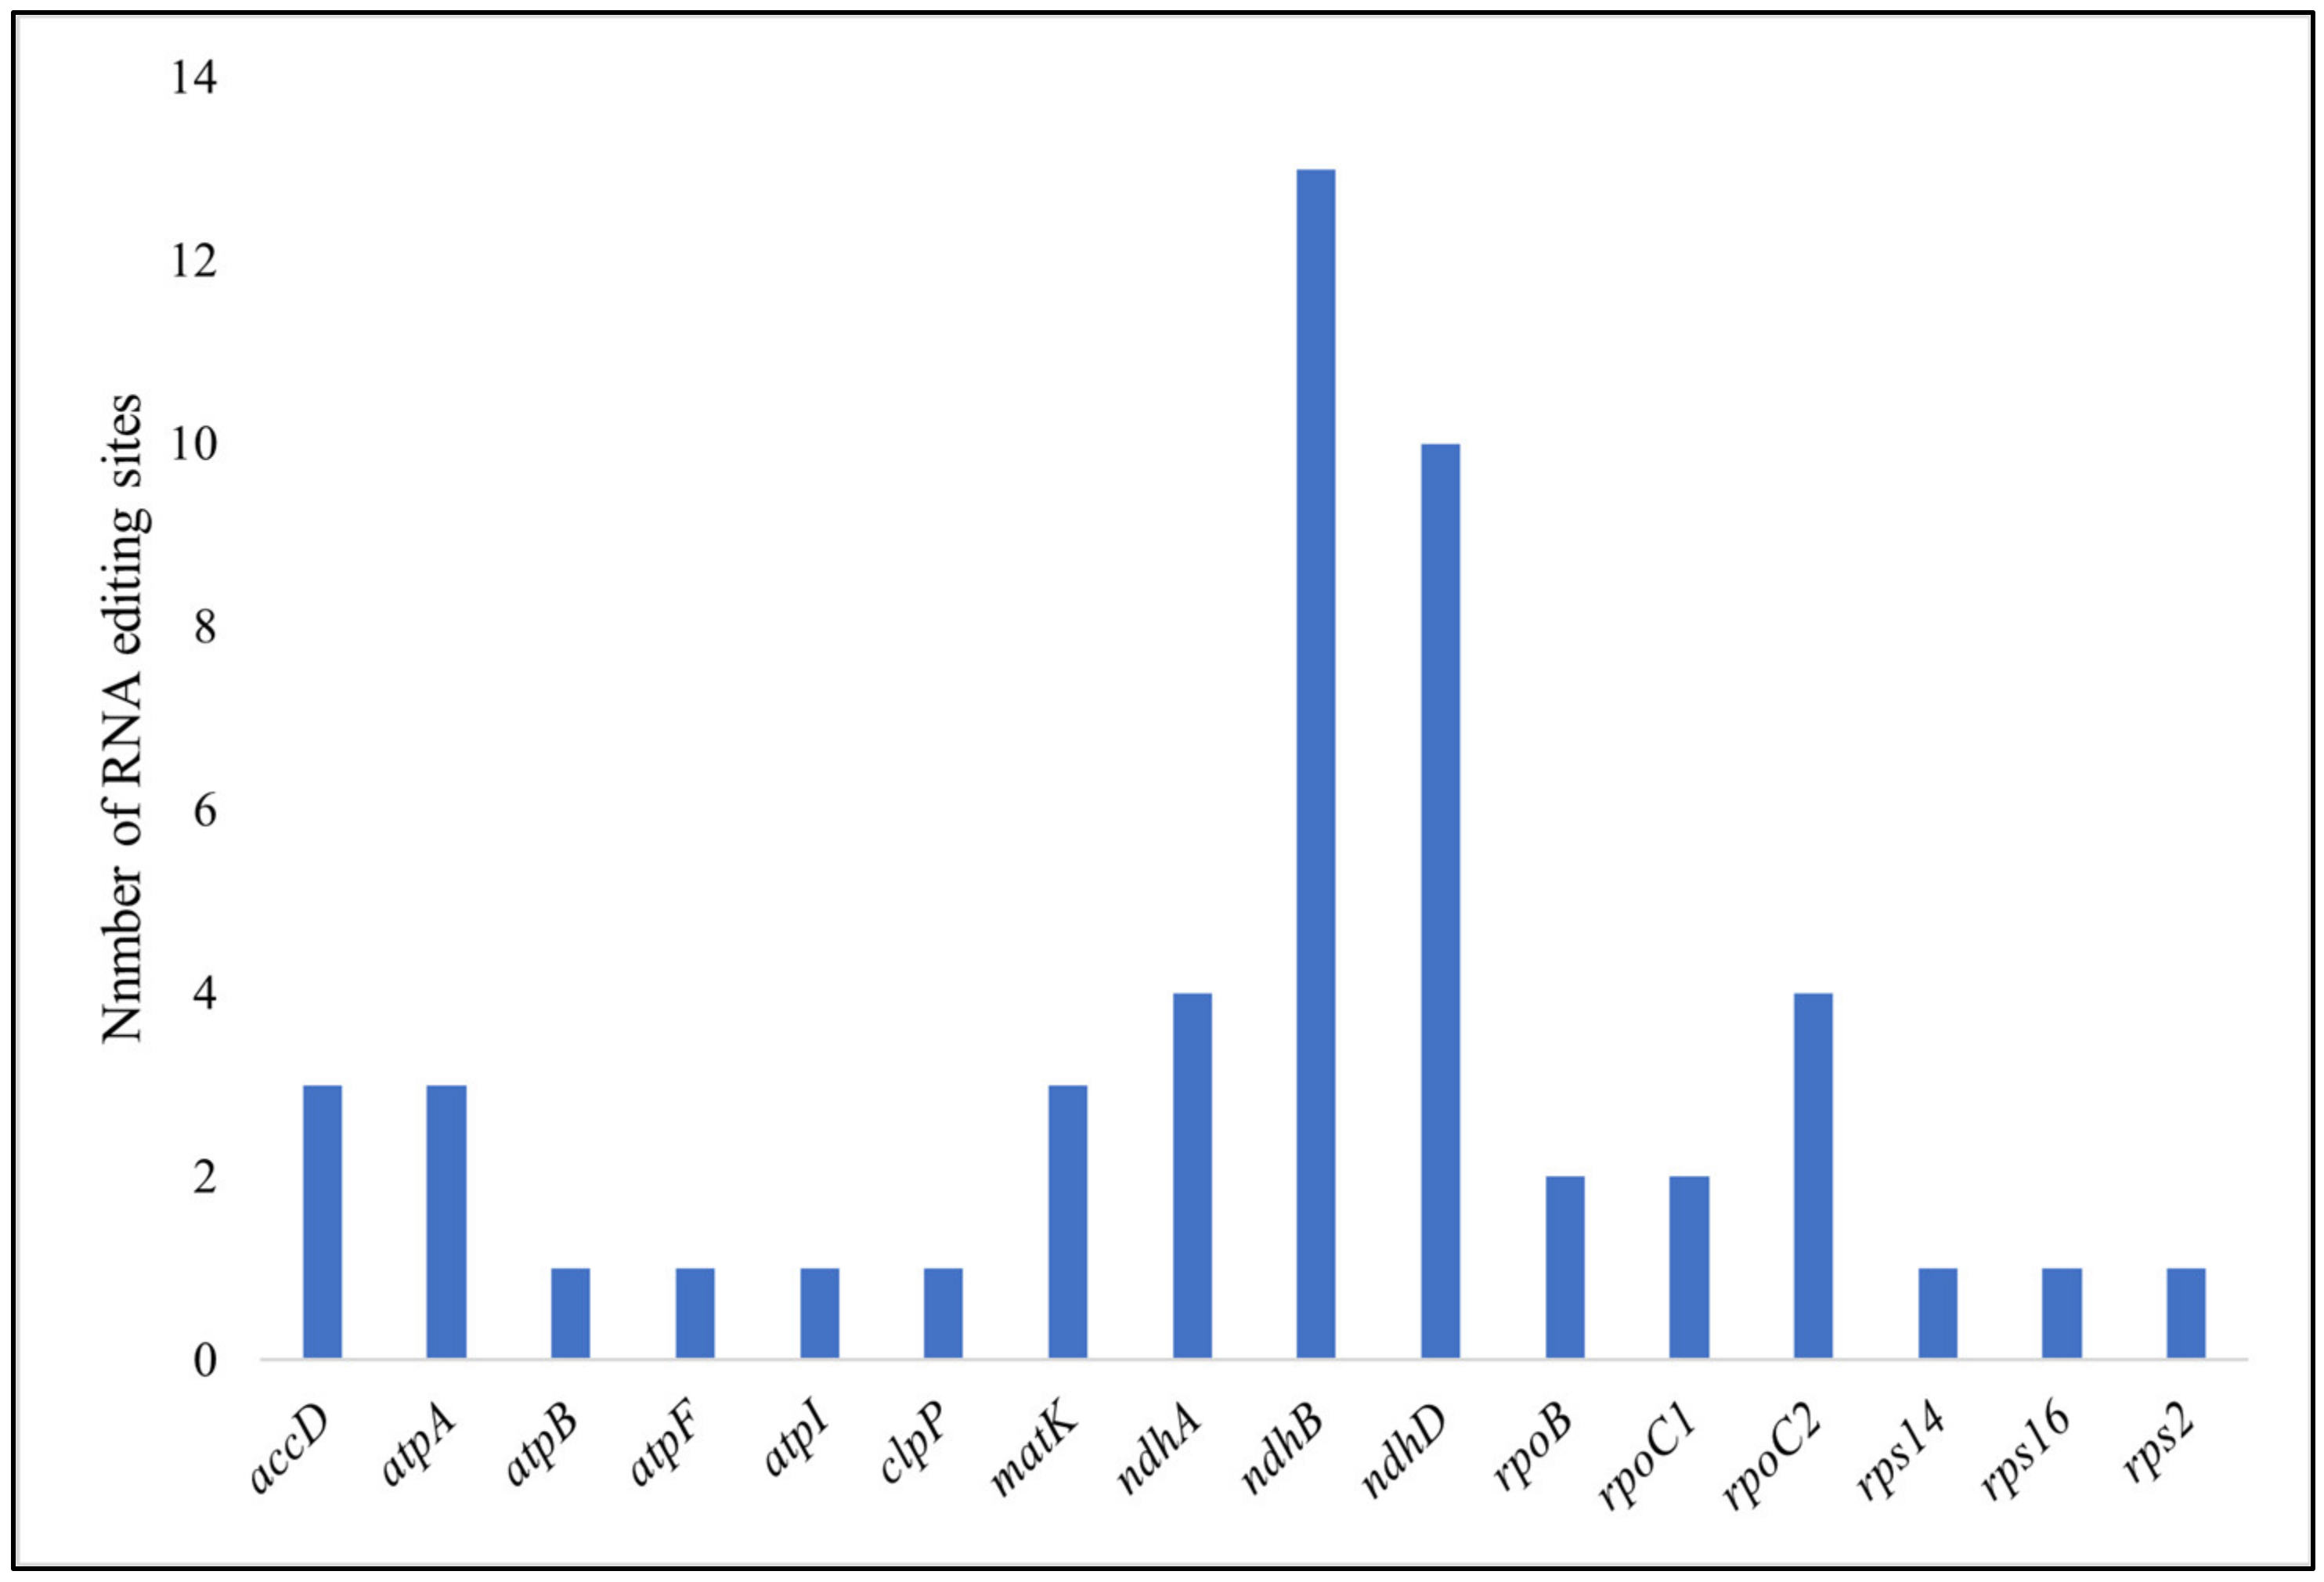
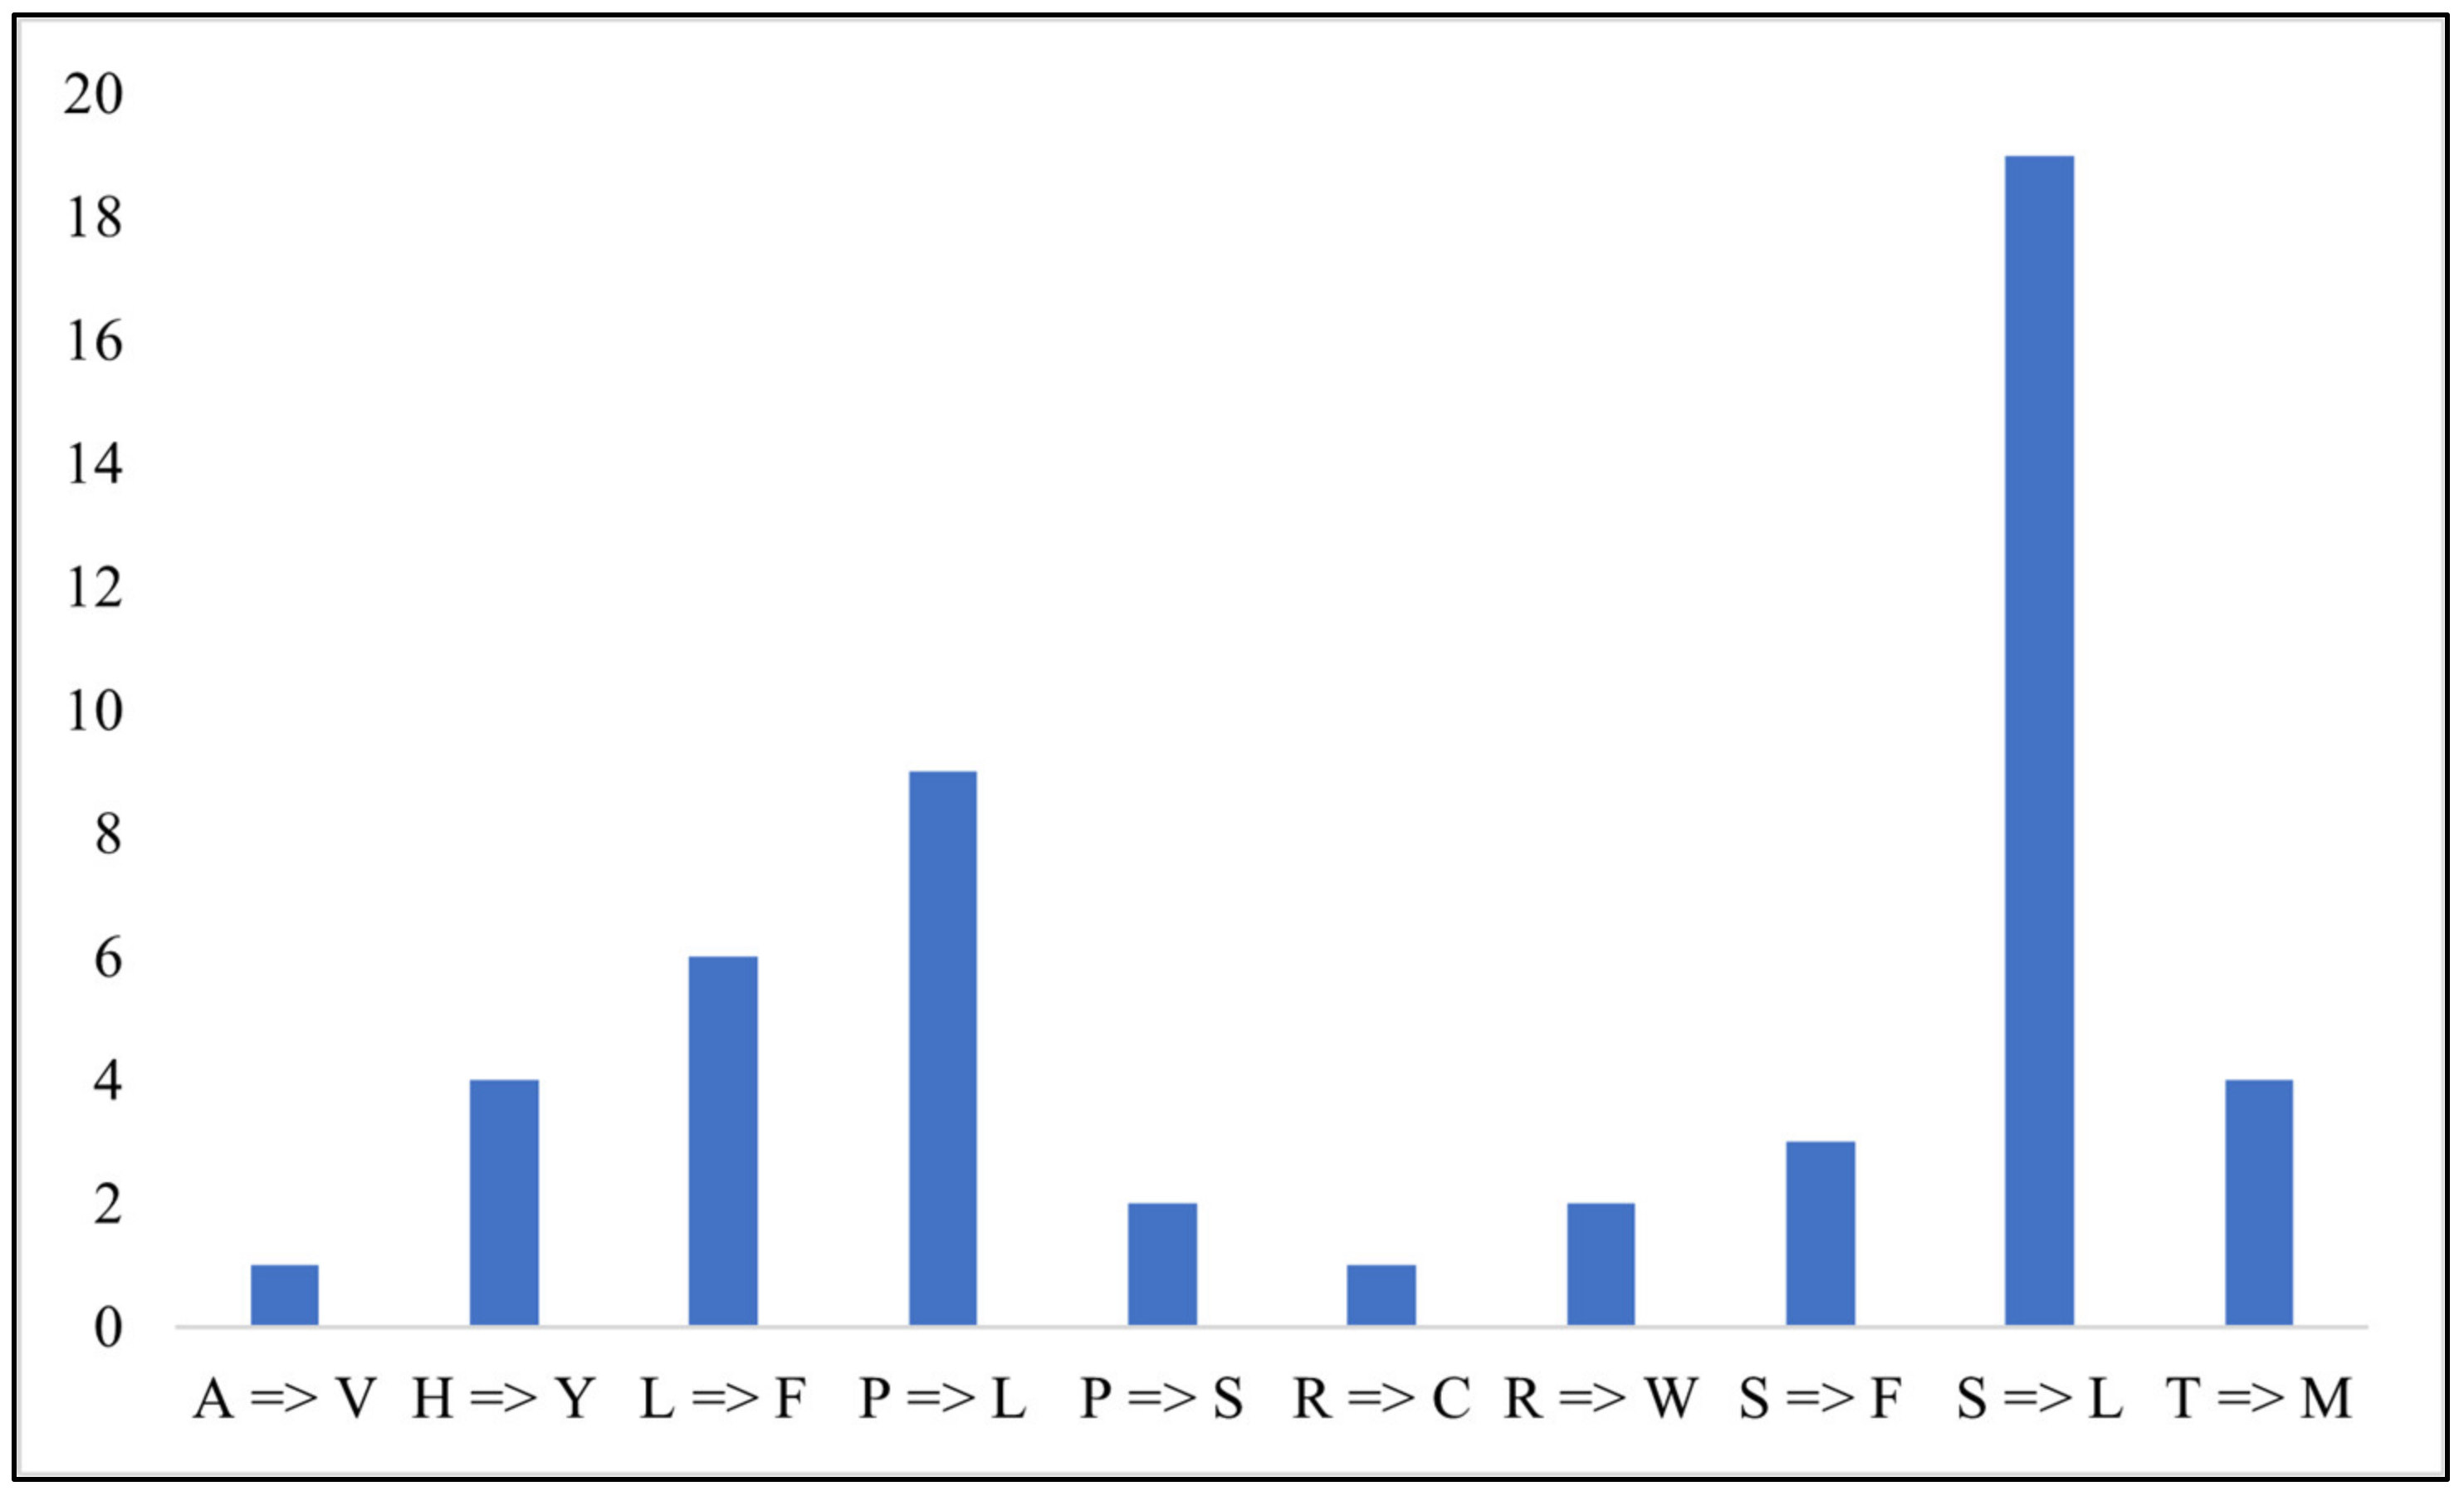
3.1.3. RNA Editing Sites

RNA editing is a fundamental process in the plastome that involves the modification of nucleotides in the messenger RNAs of functional genes [62]. This mechanism is critical for the expression of functional proteins [63]. In this study, the RNA-editing sites were predicted in the F. populifolia plastome using the PREP suite. The results revealed 51 editing sites distributed within 15 coding genes (Figure 5, Table S4). All the base conversions were from C to T, which is consistent with other higher plant plastomes [29,63]. Conversions occurring in the first and second positions of the corresponding codons led to changes in the amino acids, which is consistent with previous research [20]. Most of the codon exchanges (Figure 6) were from serine (S) to leucine (L). The most editing sites were predicted for the ndhB and ndhD genes (13 and 10 sites, respectively), which encode the NDH complex subunits involved in photosynthetic electron transport [63]. This was followed by ndhA and rpoC2 (four); accD, matK, and atpA (three); rpoB and rpoC1 (two); and atpB, atpF, atpI, clpP, rps14, rps16, and rps2 (one). Some genes such as arpl, psbI, psbL, psbM, rpl22, rpl23, rps15, and rps19 had no potential RNA editing sites.

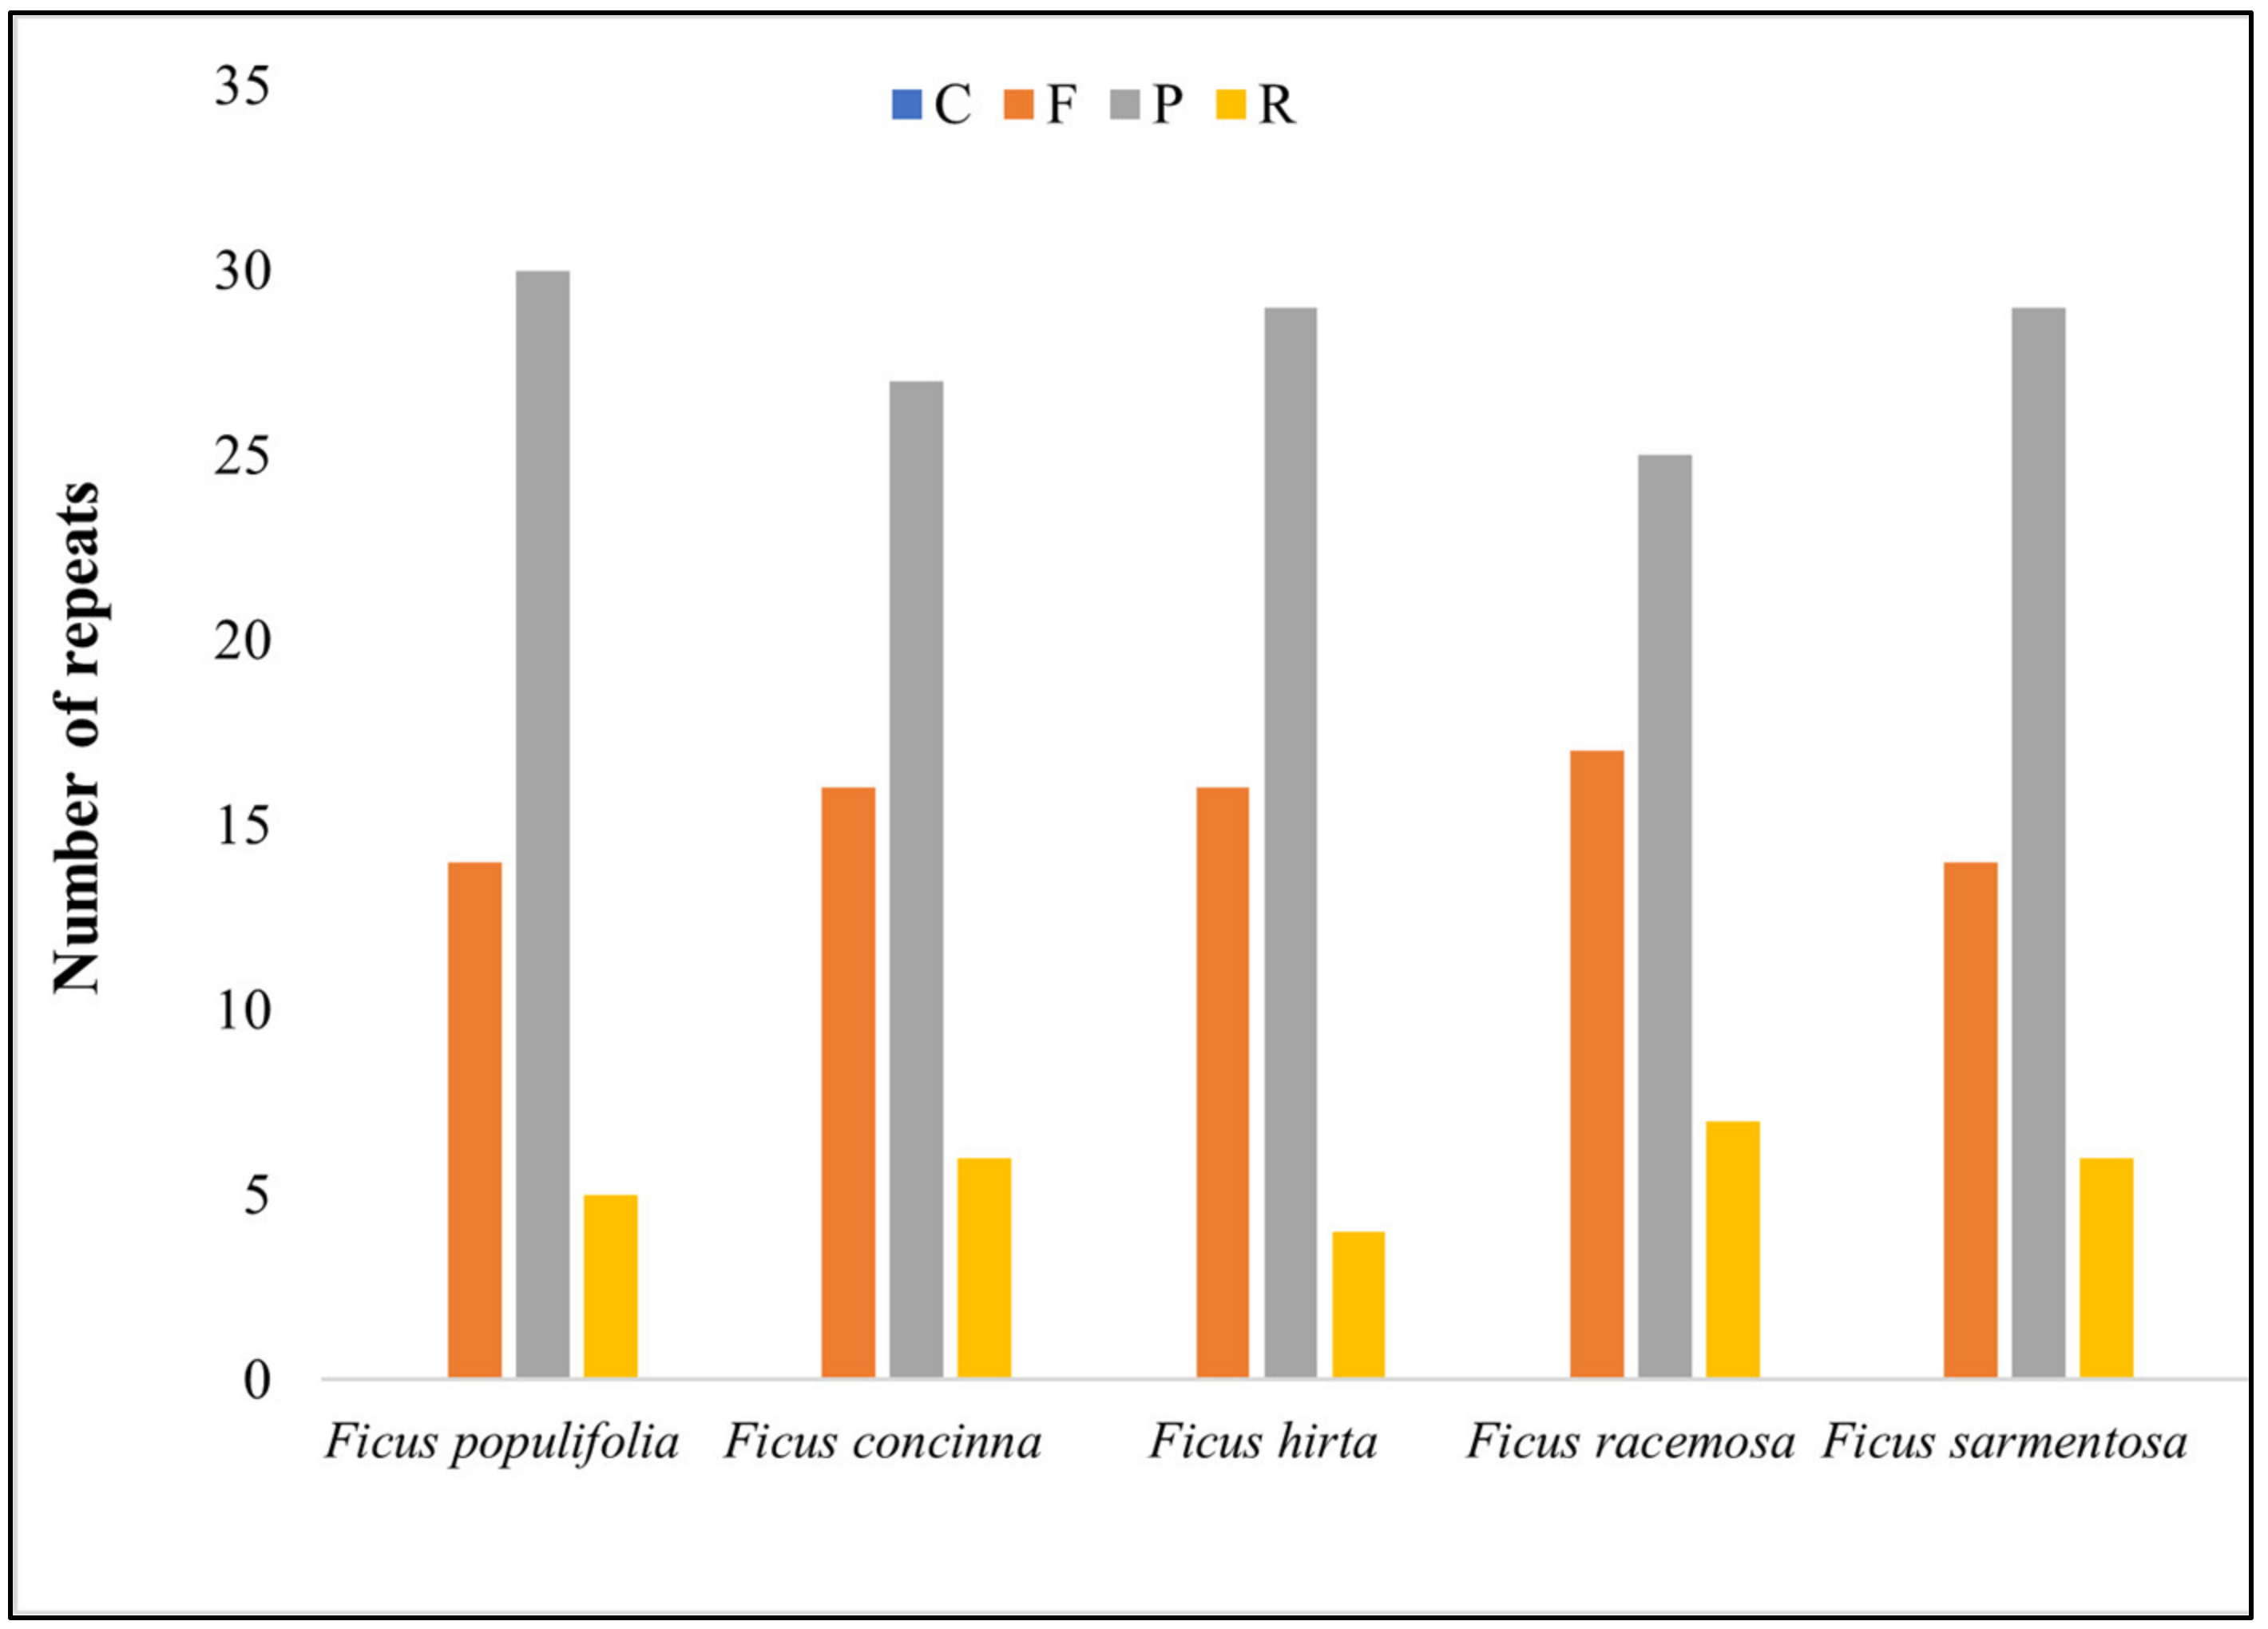
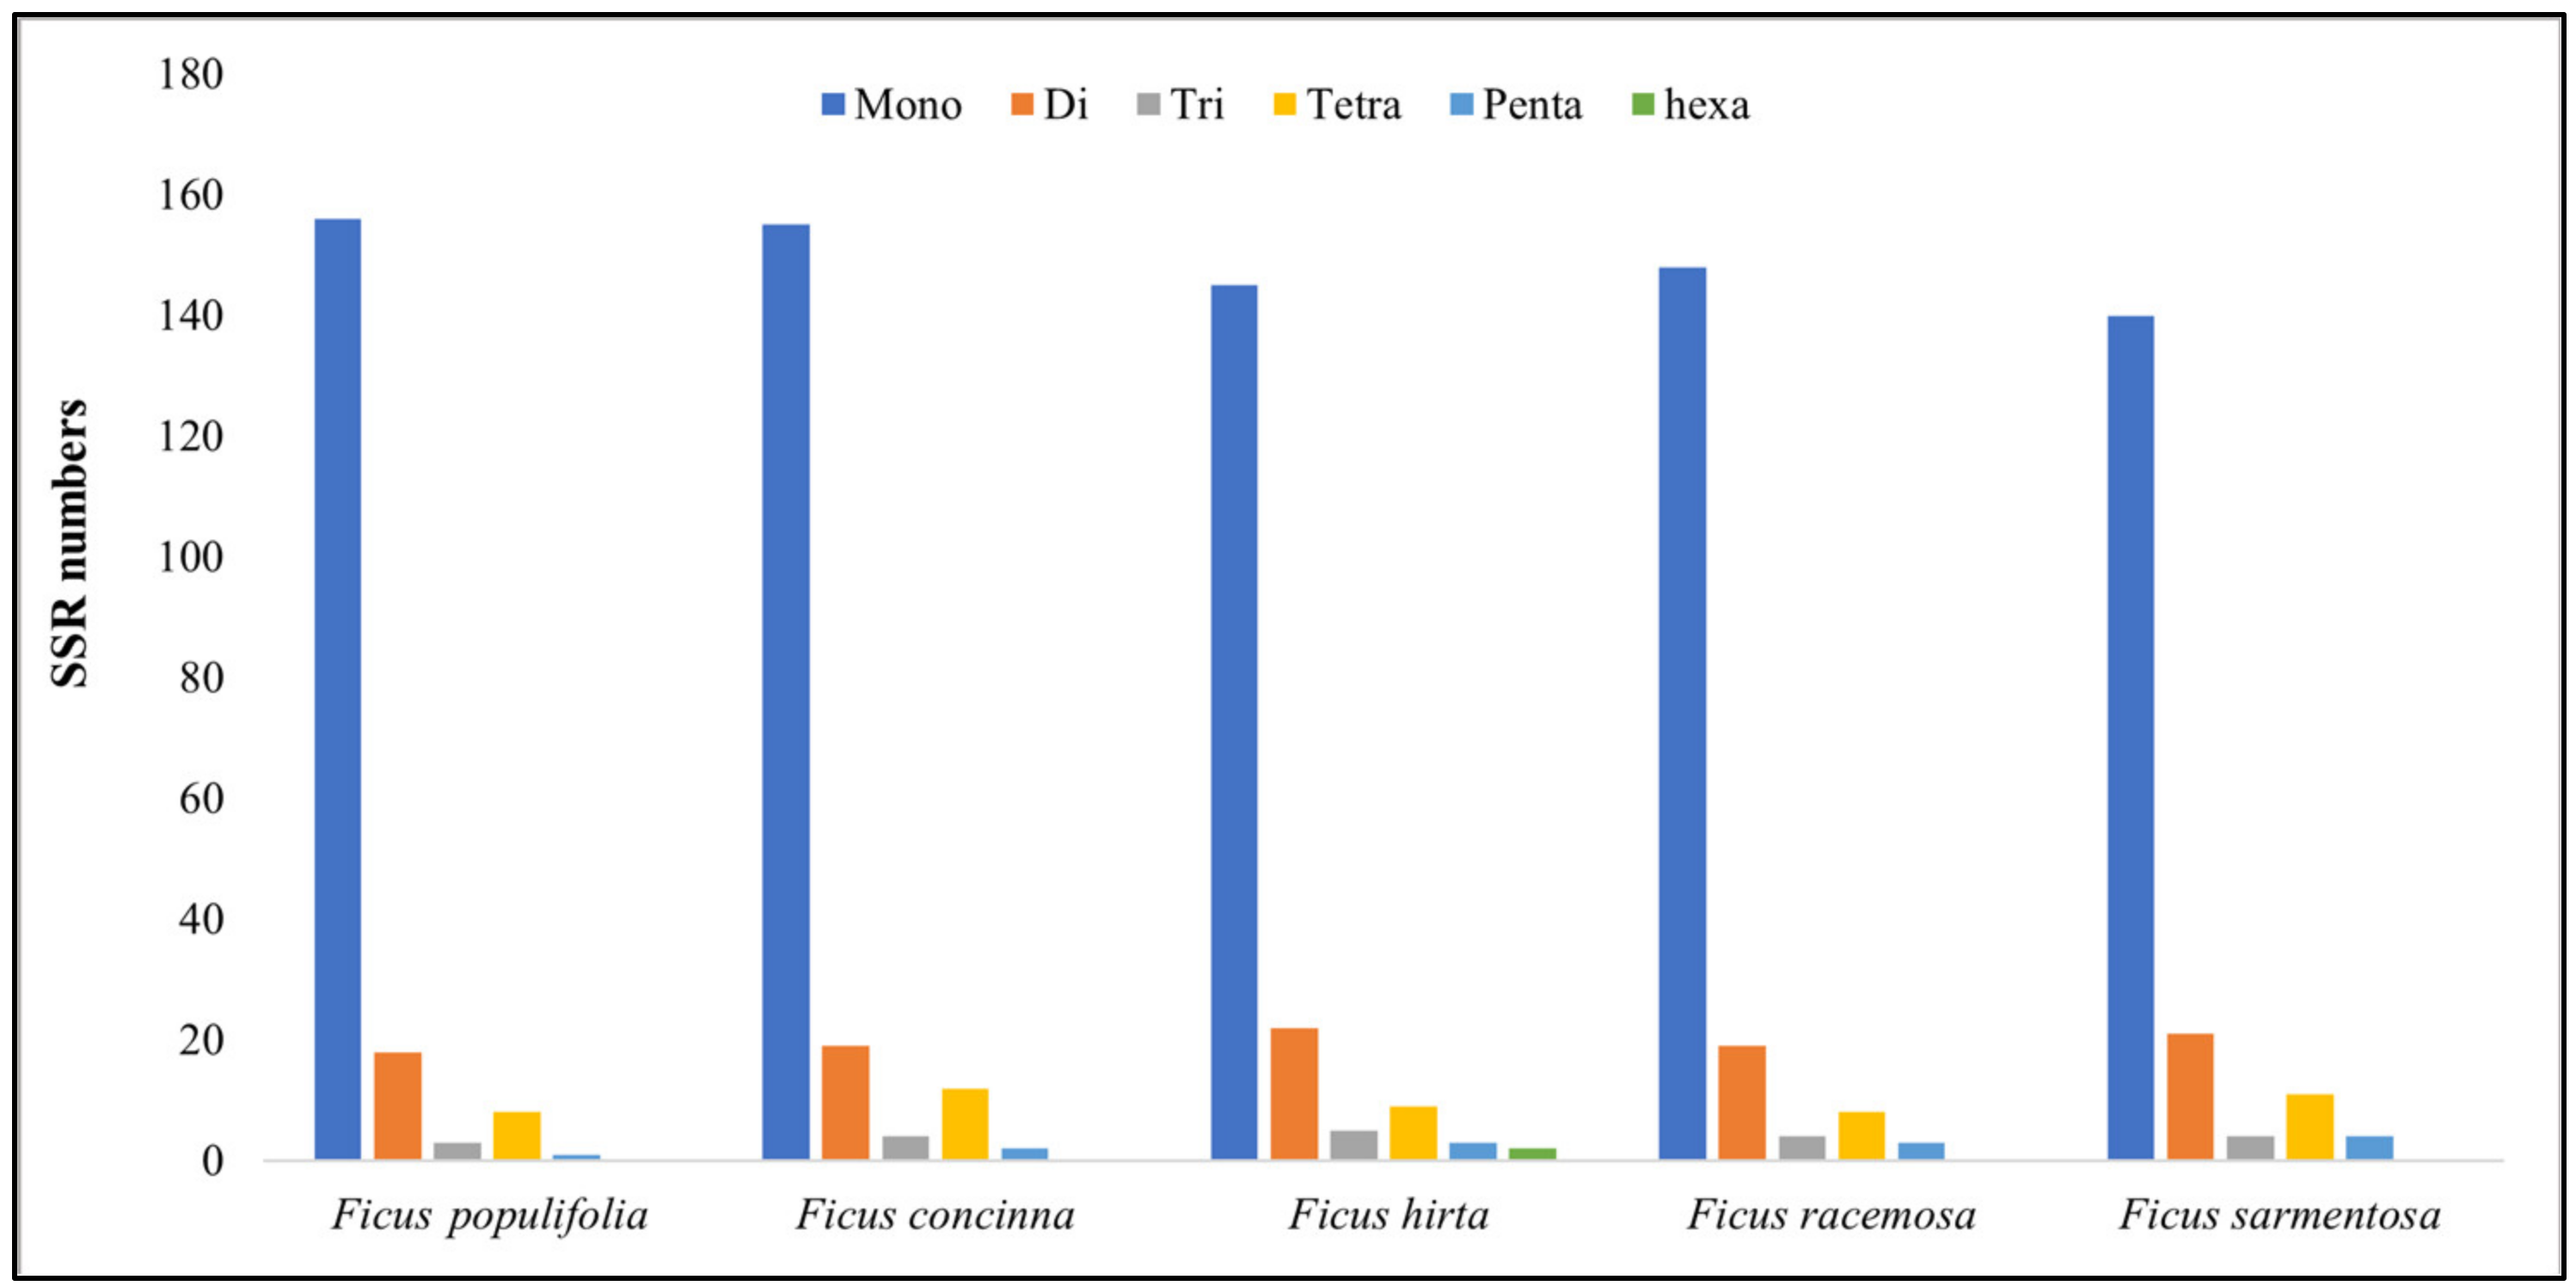
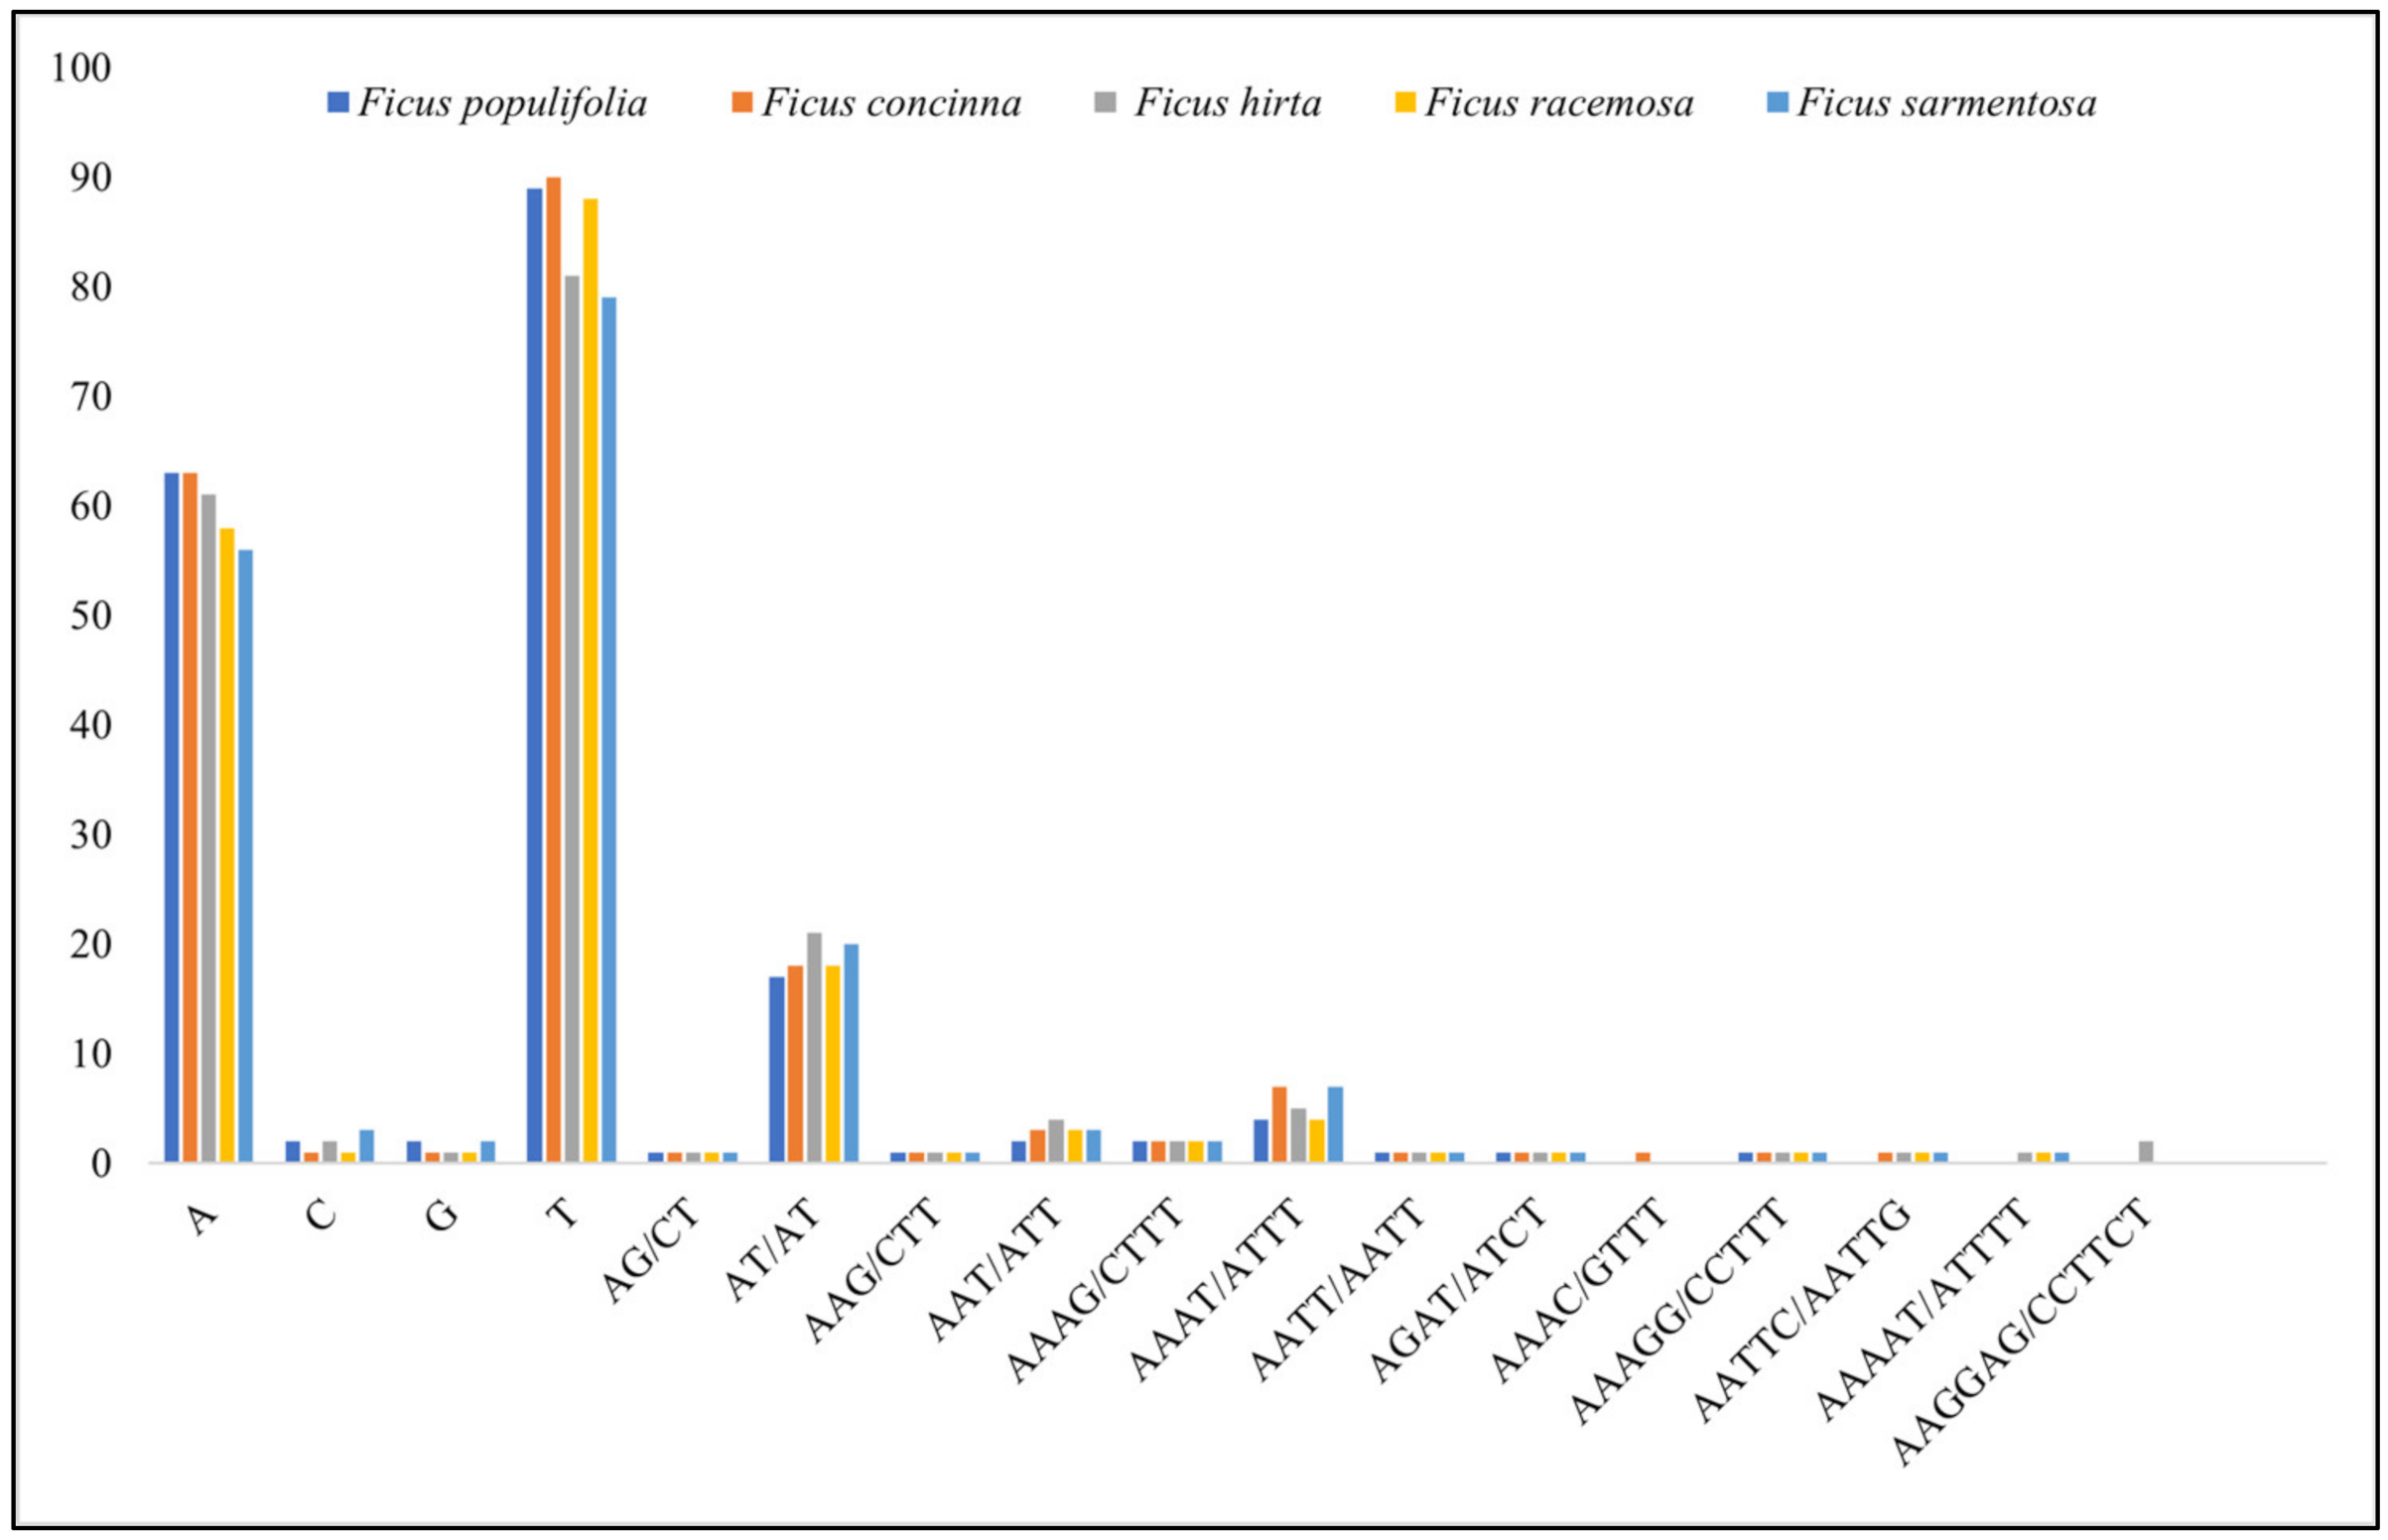
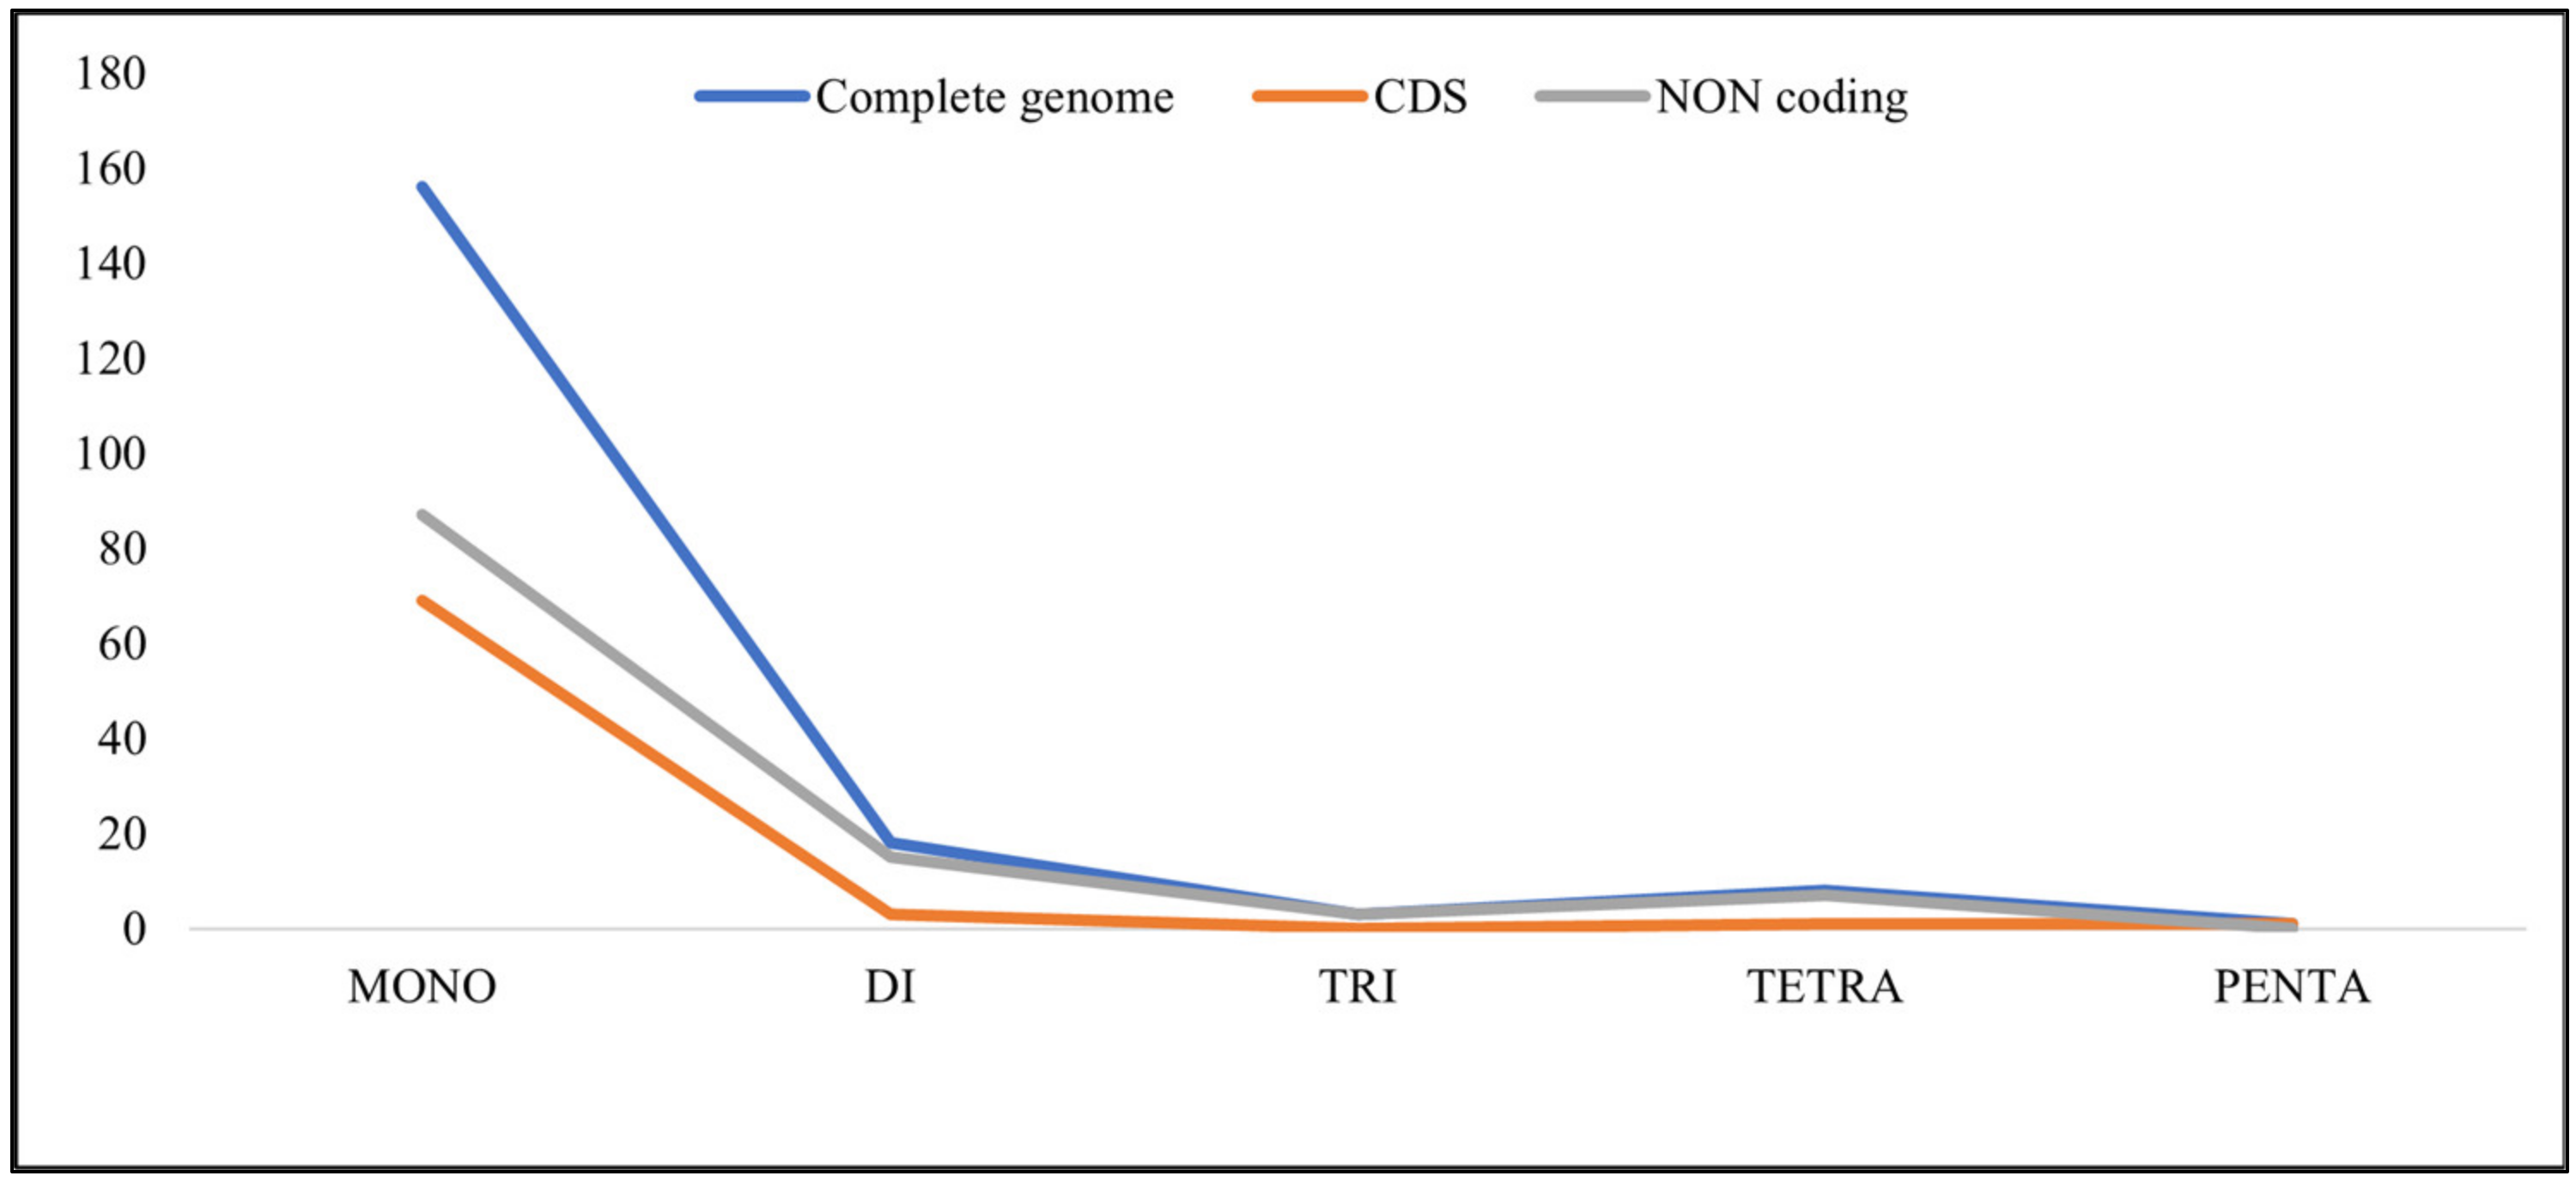
3.1.4. Repeat Analysis

The plastome contains several repetitive sequences. These repeats play a key role in genomic rearrangements and expansions, contributing to the structural variation and stability of the plastome [64,65]. In this study, long repeats and SSRs were examined in the F. populifolia plastome and four related Ficus species: F. concinna, F. hirta, F. racemosa, and F. sarmentosa.
In the long repeat analysis, a total of 49 repeats were detected in the F. populifolia plastome (Figure 7, Table S5), including (30; 61.2%) palindromic (P) repeats, (14; 28.5%) forward (F) repeats, and (5; 10.2%) reverse (R) repeats. The majority of these repeats (81.6%) ranged from 20 to 29 bp, whereas 18.4% ranged from 30 to 39 bp. The intergenic spacer (IGS) sequences demonstrated the most repeats (29; 59.2 %), which is also the case in other Ficus species [22]. The tRNAs, on the other hand, showed the fewest repeats (5; 10.2%). The protein-coding genes, ycf3, ycf2, rbcL, ndhA, rps16, ndhC, and rps8, all showed 15 (30.6%) repeats, with the ycf2 gene showing the most (2 palindromic and 2 forward repeats). The results reveal that the palindromic was the most common repeat type in the Ficus species, followed by the forward, which is consistent with earlier findings [22,23]. There were no complement repeats observed; the highest palindromic repeats were found in F. populifolia, and the highest frequency of forward (17) and reverse repeats (7) were identified in F. racemosa.
SSRs, also known as microsatellites, are short-tandem repeats of one to six nucleotide motifs found in the genomes of all organisms [66]. Owing to their reproducibility, hypervariability, and relative abundance [67], these markers are widely used in gene flow analysis, populations’ genetic studies, species authentication, and the examination of genetic variations [67,68,69]. Here, the SSR types and frequencies were analyzed in the plastomes of F. populifolia and four Ficus species. A total of 179–192 SSRs with six types (mono-, di-, tri-, tetra-, penta-, and hexa-nucleotide repeats) were identified (Figure 8, Table S6). In F. populifolia, 186 SSRs were detected, and no hexanucleotide motifs were reported. Mononucleotides were the most abundant SSR types in all genomes, contributing more to the genetic diversity than others. Hexanucleotides were rare and only found in one species, F. hirta. Ficus populifolia had the most mononucleotides (156), F. hirta had the most dinucleotides and trinucleotides (22 and 5), F. concinna had the most tetranucleotides (12), and F. sarmentosa had the most pentanucleotides (4). All these tandem repeats showed higher levels of T or A (Figure 9), resulting in a base composition bias on the plastome that matches the overall A-T percentage in the F. populifolia plastome (64.14%). These findings are comparable to previous results that demonstrated that chloroplast SSRs (cpSSRs) consist mainly of polythymine (polyT) or polyadenine (polyA) repeats rather than polycytosine (polyC) or polyguanine (polyG) [70,71,72]. The results obtained here were similar to those of other plants [23,55,56] in that the cpSSRs were more frequently found in noncoding regions, such as the intergenic spacer (IGS) (60.22%), than the coding regions (39.78%), as shown in Figure 10. The cpSSRs and long repeats identified in this study revealed variation among the Ficus species and could be used to develop biomarkers for population genetics studies on F. populifolia.

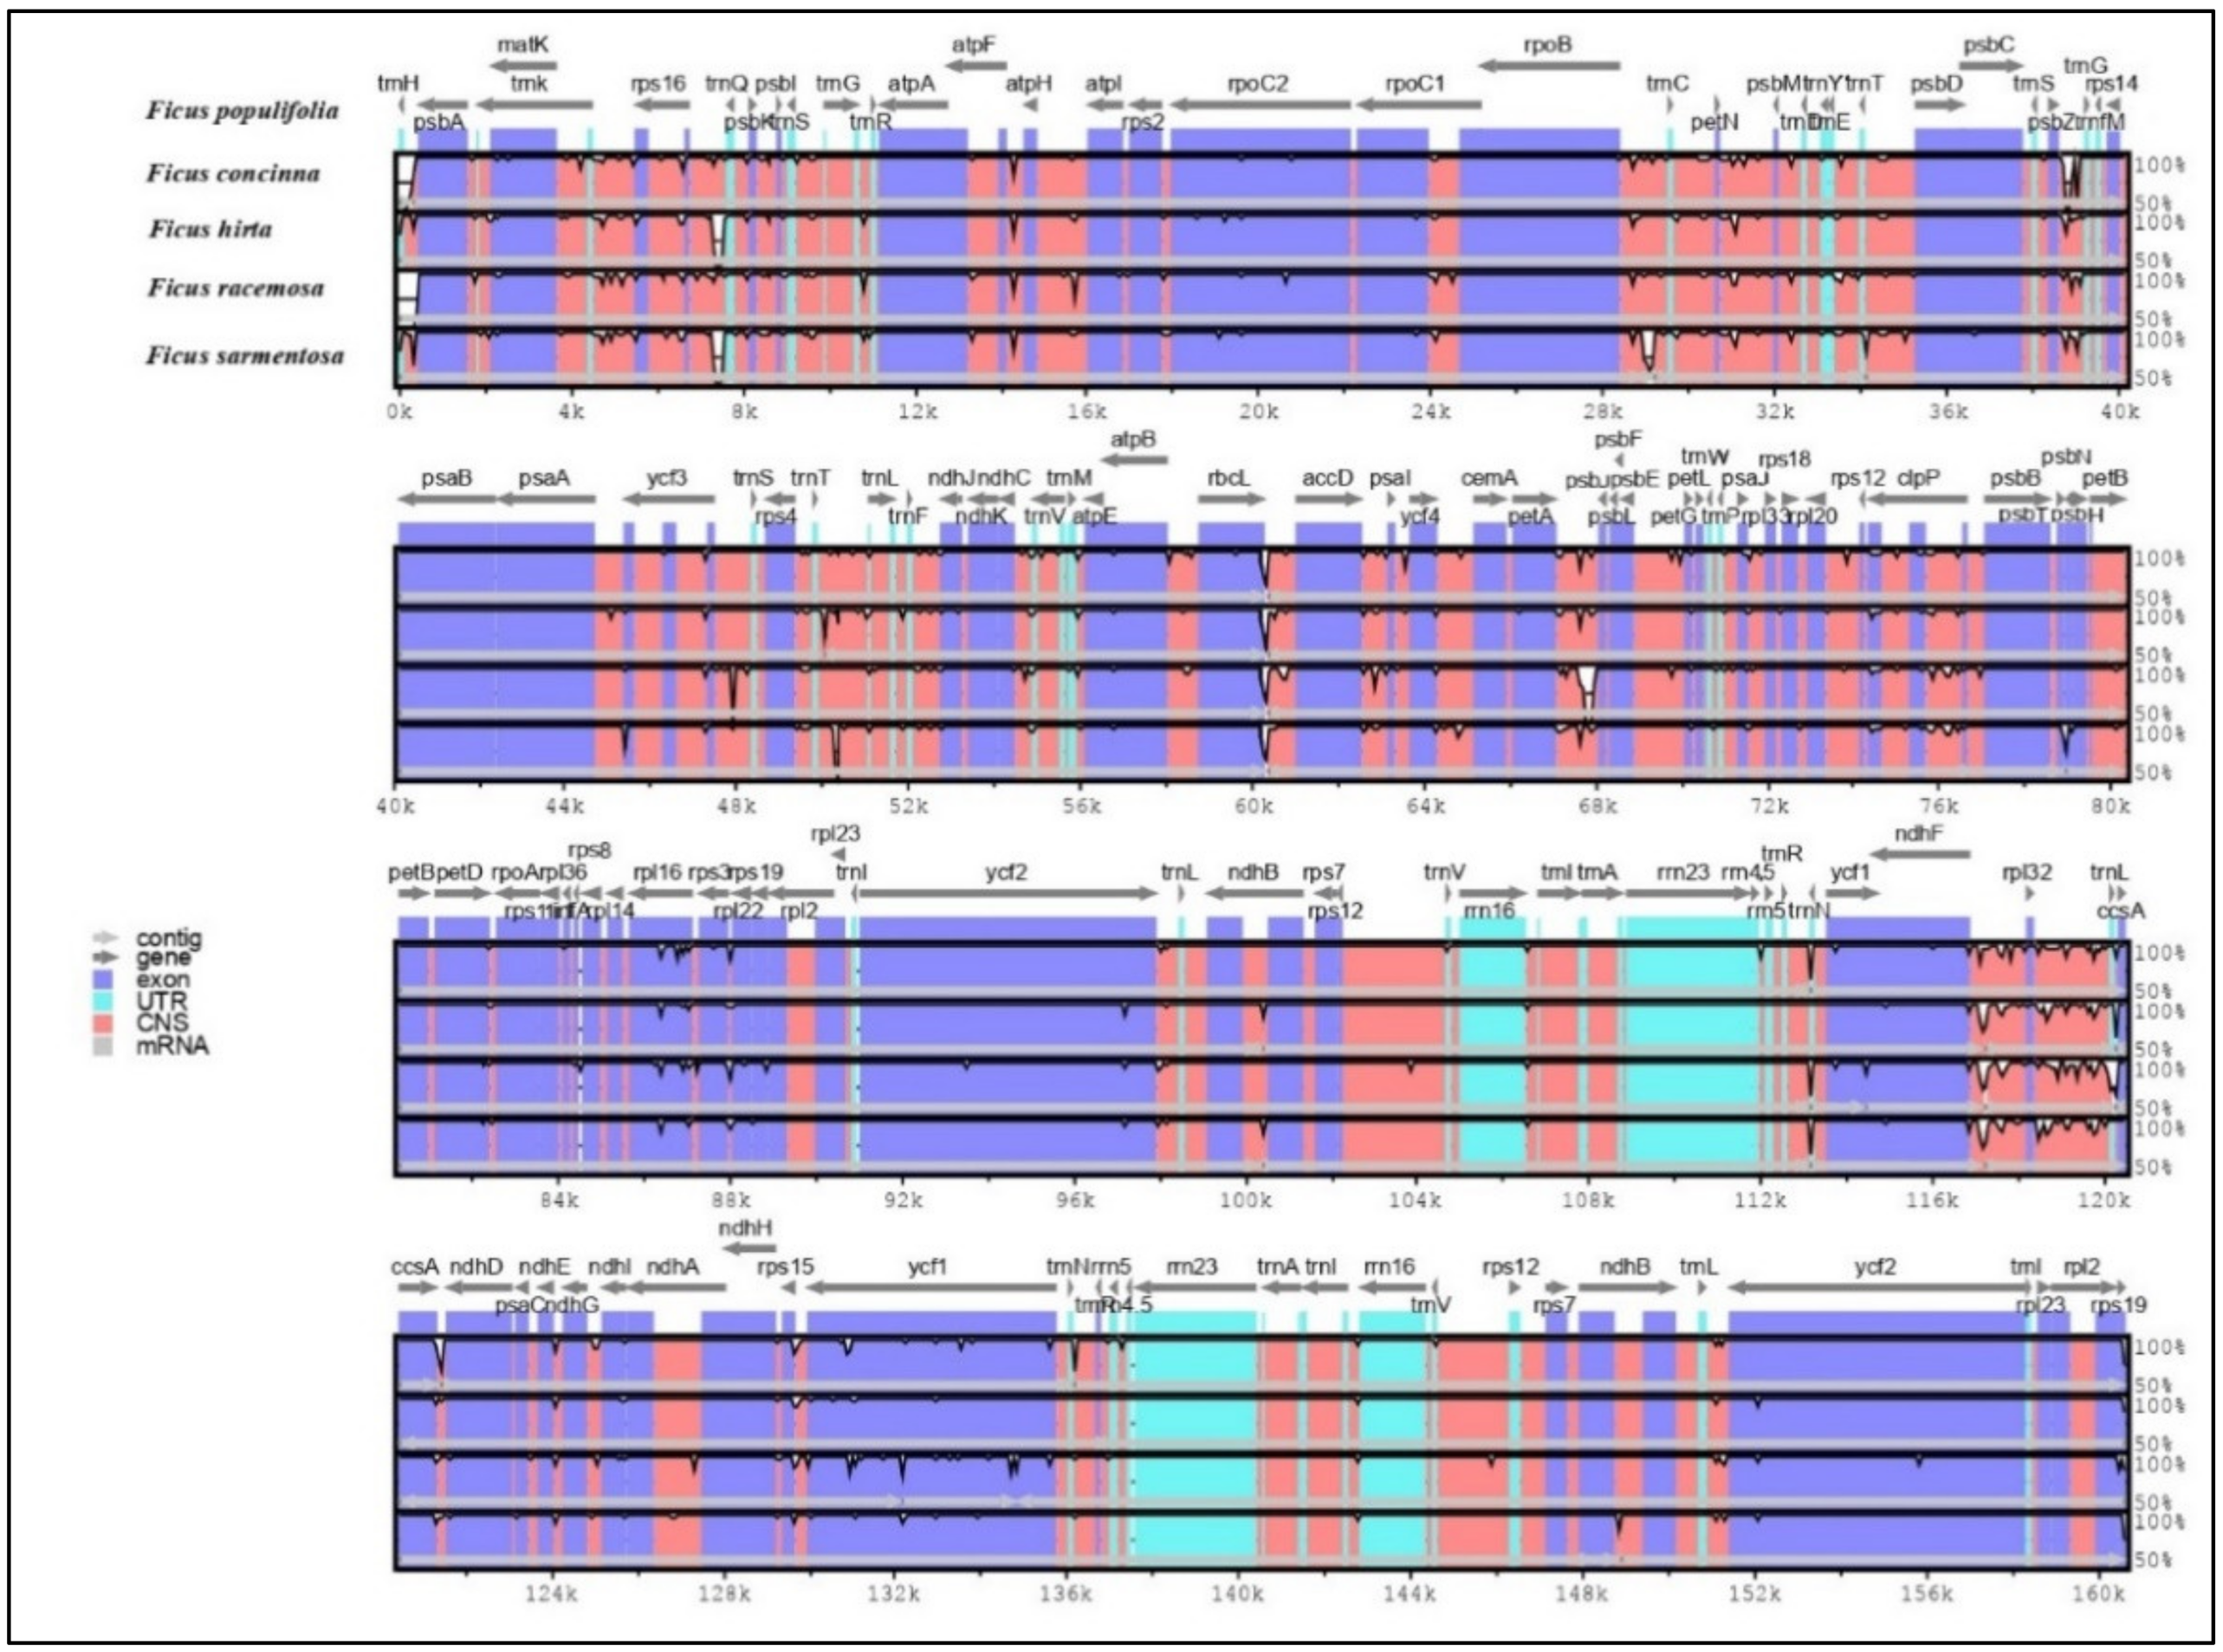
3.1.5. Sequence Divergence

To determine the hypervariable regions in the F. populifolia plastome, it was compared to four related species using the mVISTA program. The alignment in Figure 11 revealed that there were few variable regions, and the genomes were highly conserved. This is consistent with findings from higher plant plastomes, in which noncoding regions were more variable than coding ones [20,73]. The IR regions were found to be less variable than LSC and SSC, which is in accordance with previous findings [53,74]. The highly diverged noncoding regions were trnK-UUU-rps16, rps16-trnQ-UUG, atpF-atpH, atpH-atpI, rpoB-trnC-GCA, petN-psbM, trnD-GUC-tRNA-GIu, psbZ-trnG-GCC, ysf3-trnS-GGA, ndhK-trnV-UAC, atpB-rbcL, rbcL-accD, accD-psaI, petA-psbL, clpP1-psbB, rpI16-rps3, rps12-trnV-GAC, ndhF-rpI32, rpI32-trnL-UAG, ndhE-ndhG, and trn-CAA-ycf2.
The protein-coding genes were mostly conserved except for rpoC2, ycf2, ycf1, ndhF, and ndhA. Several of these divergence markers have previously been used to identify and resolve the evolutionary history of several plant groups [75,76,77]. The identification of these highly informative regions in F. populifolia could help in developing species-specific DNA markers.

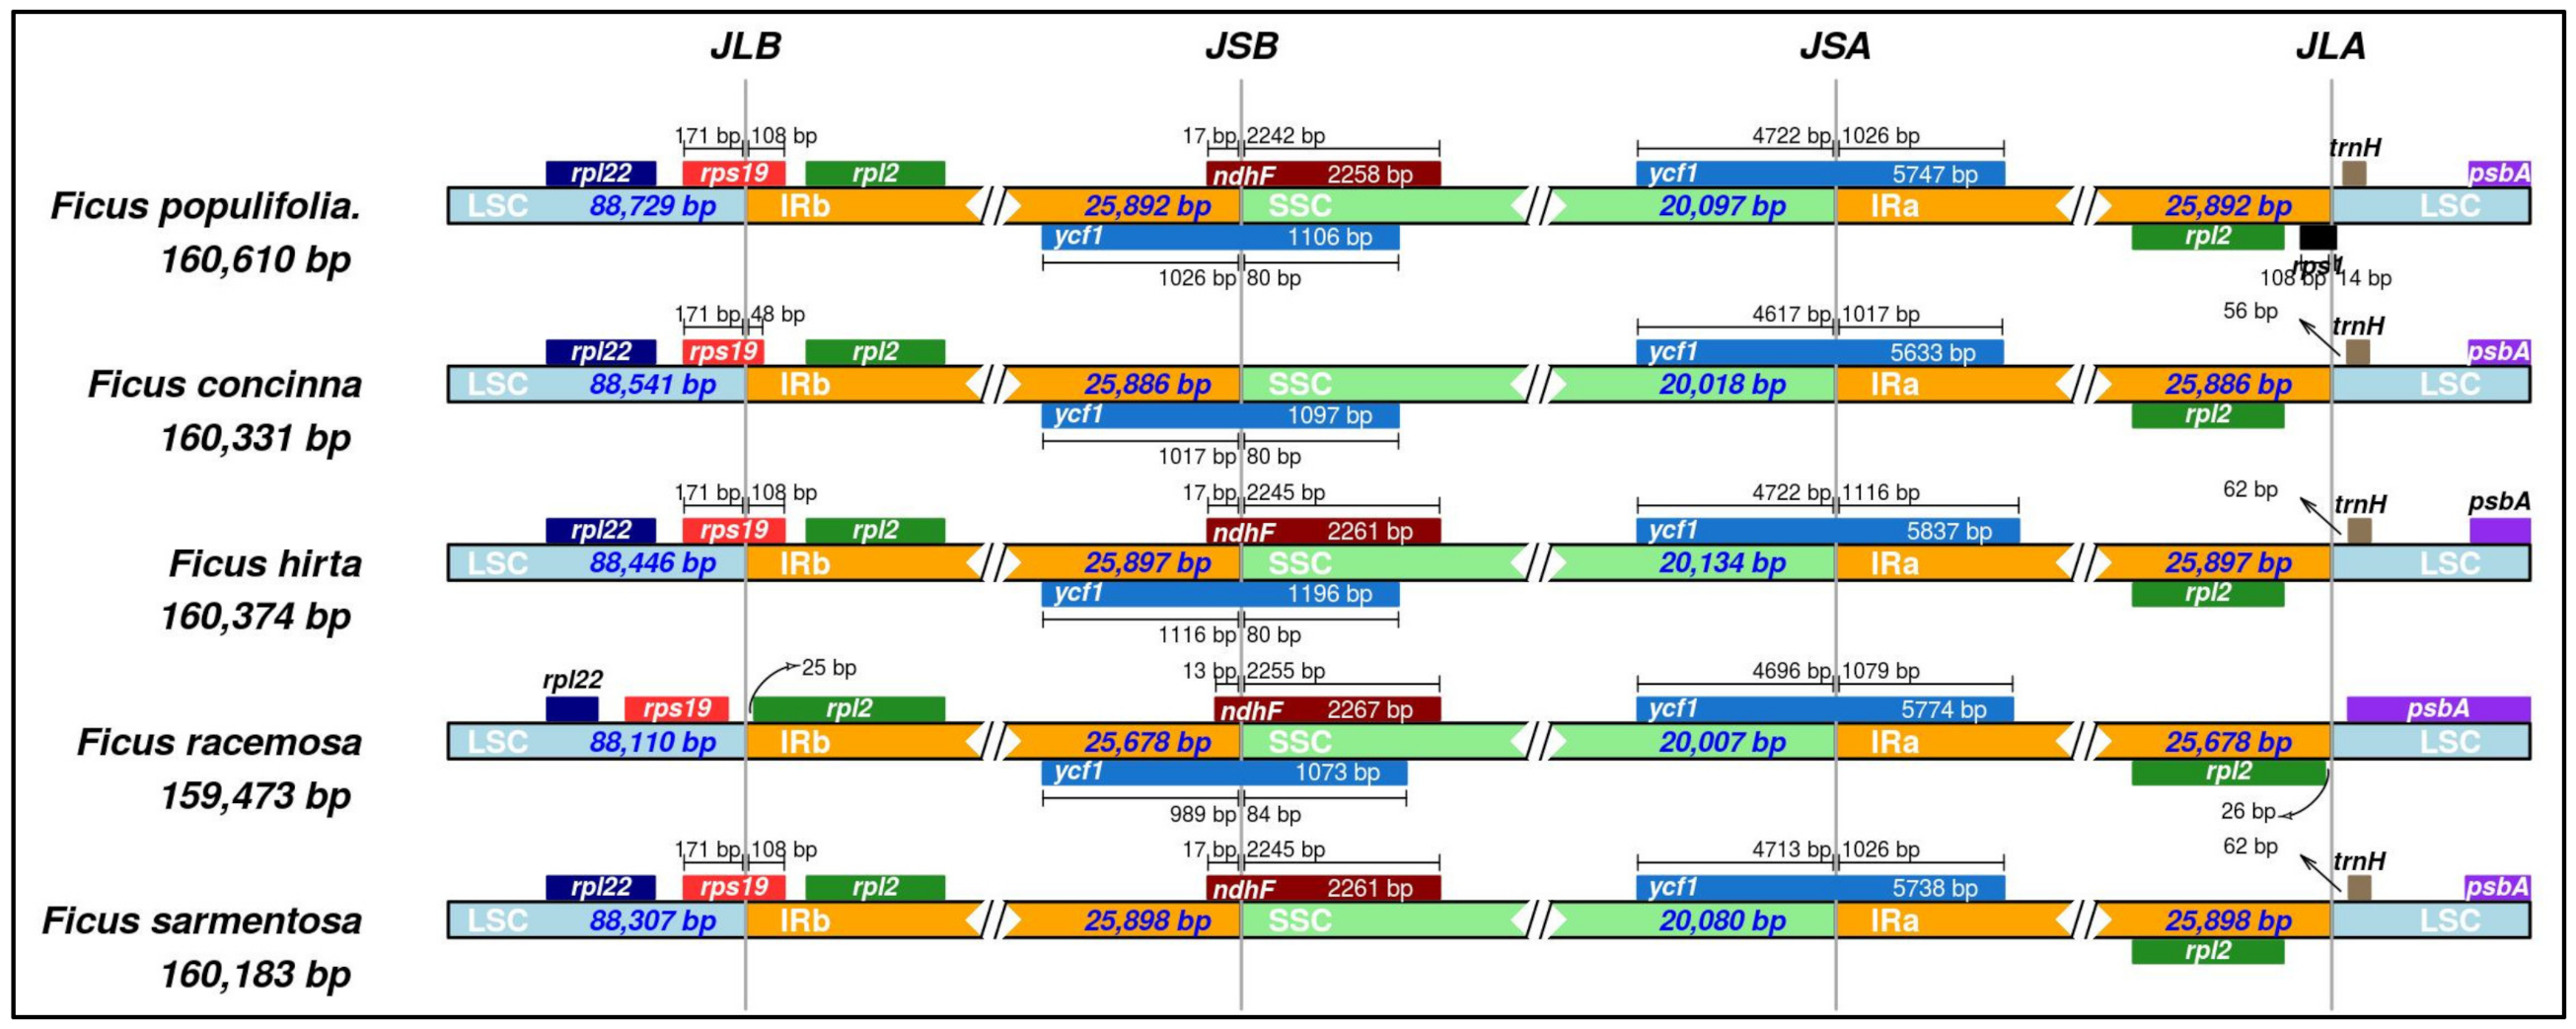
3.1.6. Contraction and Expansion of the Inverted Repeat Region

The stability of the plastome structure is promoted by the inverted repeat through the intramolecular recombination of the two IR copies [20]. Despite the conserved nature of the angiosperm plastomes, the contraction and expansion of the IR regions are believed to be the main causes of genome size variation through gene deletion, duplication, and the creation of pseudogenes [78,79]. In this research, the four junction sites between the IR regions and the single-copy regions of F. populifolia were compared with plastomes of related species (Figure 12). The boundaries of the SSC/IR and LSC/IR regions in the five plastomes were highly conserved, with minor variations, aligning with previous reports for the Ficus species [22,23]. Five protein-coding genes can normally be found close to or at the borders of IRs: rps19, ndhF, ycf1, trnH, and psbA. Yet, the genes trnH and psbA were located entirely within the LSC region in all species.
A relatively large IR region was found in F. sarmentosa, followed by F. hirta, F. populifolia, and F. concinna, resulting in the spanning of the IRb/LSC junction on the rps19 gene and the creation of a pseudogene (ψrps19) at the IRa/LSC junction with 108 bp (in F. sarmentosa, F. hirta, and F. populifolia) and 48 bp (in F. concinna). Meanwhile, in F. racemosa, which has the smallest IR, the rps19 gene was located entirely in the LSC region. The SSC/IRa junction, in all species, expanded across the ycf1 gene, leading to the creation of the ycf1 pseudogene (ψycf1) on the IRb/SSC border with a size that varied from 1026 (in F. sarmentosa and F. populifolia) to 989 bp (F. racemosa). The integration of the ndhF gene into IRb was noted in all species except for F. concinna, with 17 bp of length in F. populifolia, F. hirta, and F. sarmentosa, and 13 bp in F. racemosa. The length variations in the studied plastome sequences could be attributable to the contraction and expansion of the IR regions.

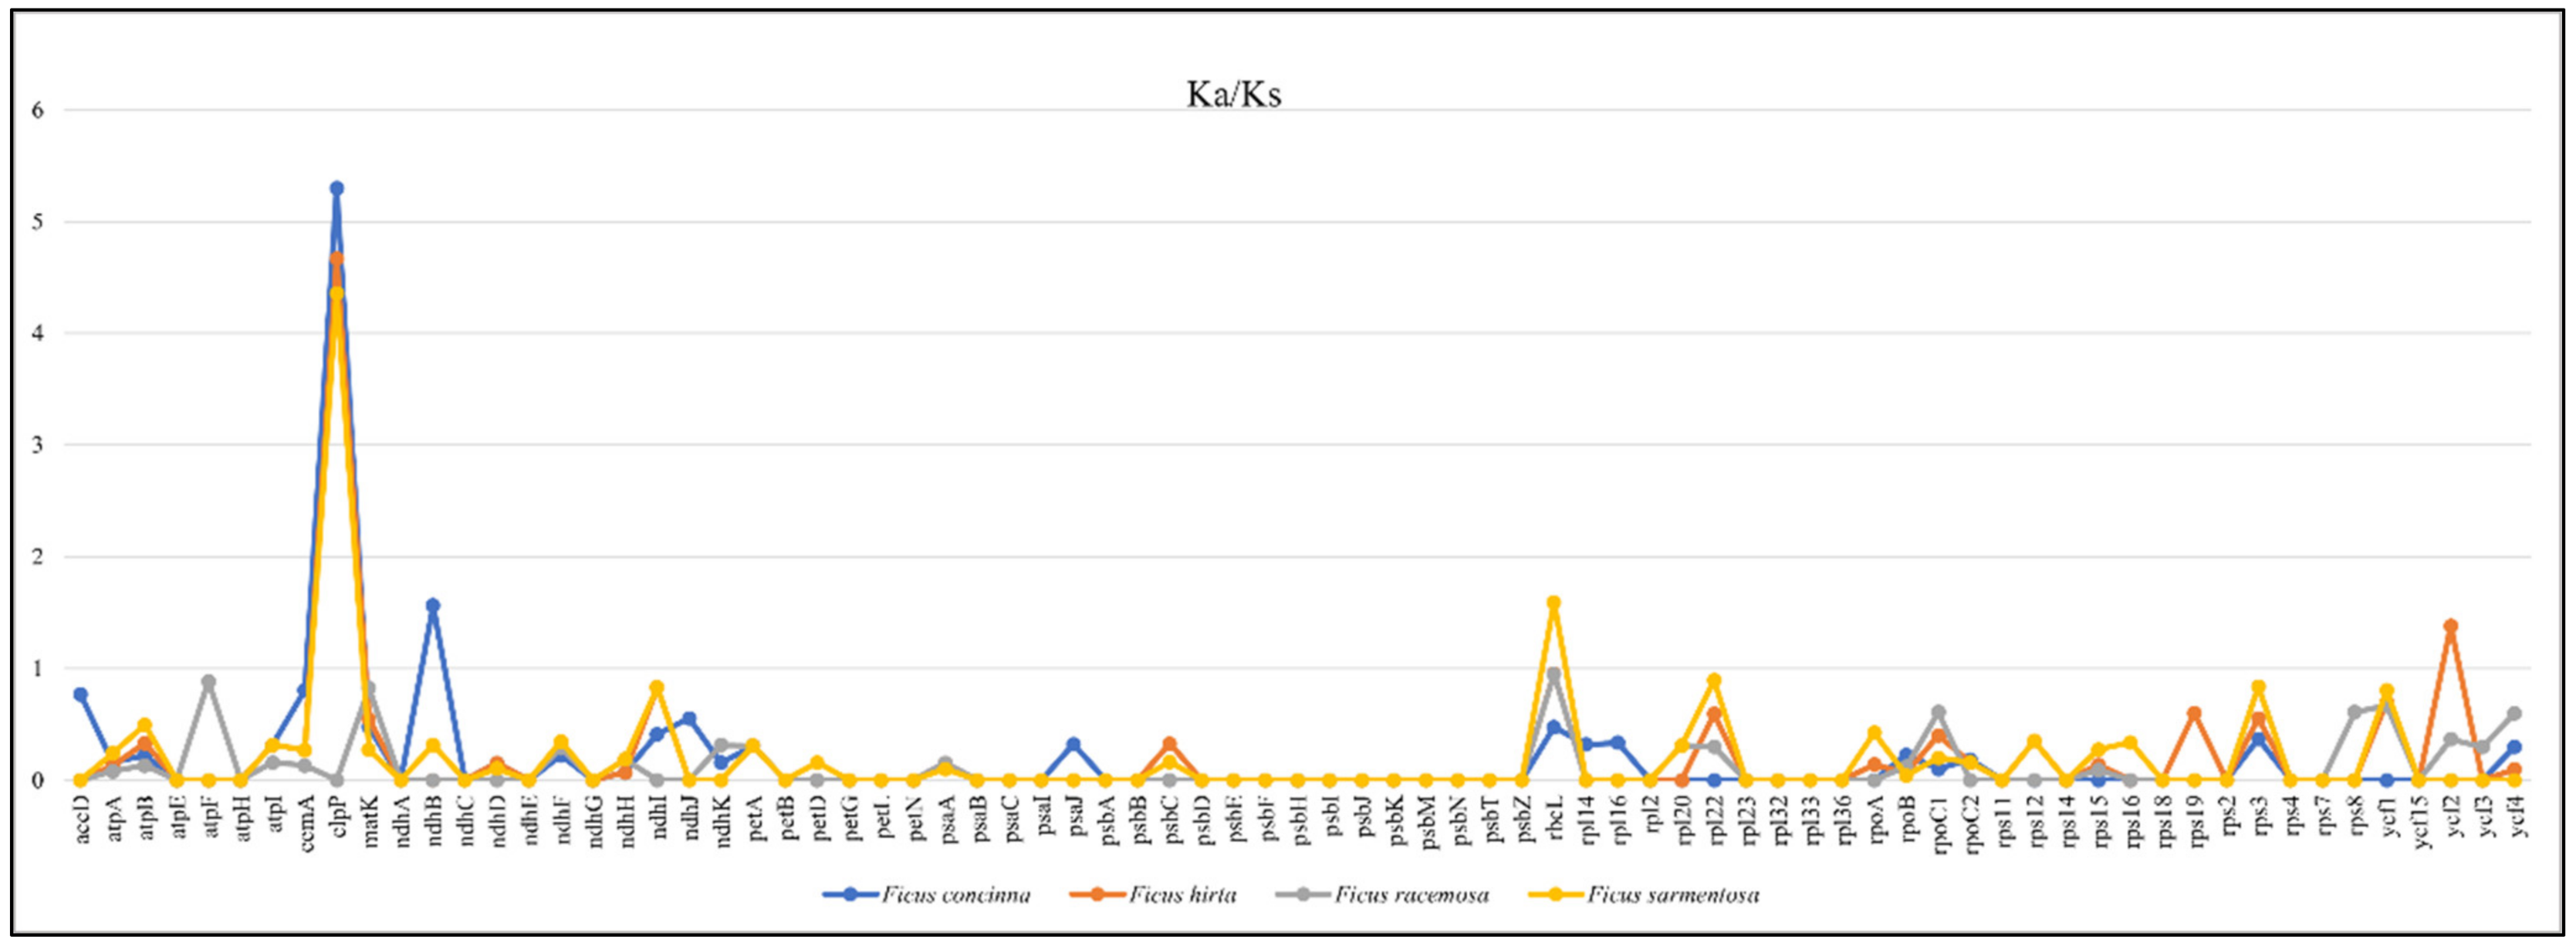
3.1.7. Characterization of Substitution Rate

The Ka to Ks substitution ratio is an important indicator of the evolutionary rates of protein-coding genes [80]. It is widely used to study their selection patterns and adaptive evolution [81]. This ratio measures natural selection on protein genes, with a Ka/Ks of more than one indicating purifying selection, a Ka/Ks of less than one indicating positive selection, and a Ka/Ks of nearly one indicating neutral evolution [82]. In this study, the Ka/Ks ratio was computed within the 77 common protein genes in the plastome of F. populifolia and four related species, F. concinna, F. hirta, F. racemosa, and F. sarmentosa, to evaluate the selective pressure.
The results showed that the Ka/Ks ratio was <1 in all genes except four (Figure 13), indicating a strong purifying selection. The positively selected genes were related to the rubisco (rbcL), NADH-dehydrogenase (ndhB), protease (clpP), and unknown function (ycf2) genes. These genes have functions in photosynthesis and the genetic system [57]. According to Bock, Andrew [83], the rbcL gene is the target of selection in response to drought, fluctuations in temperature, and CO2 concentrations. Genes such as clpP and ycf2 are associated with cellular metabolism and plant development [84,85], and they have been shown to have high rates of evolution in other plastomes [57,86]. Ficus populifolia has adapted to arid environments and may have developed several coping mechanisms. Positively selected genes likely aid F. populifolia to adapt to arid environmental conditions.

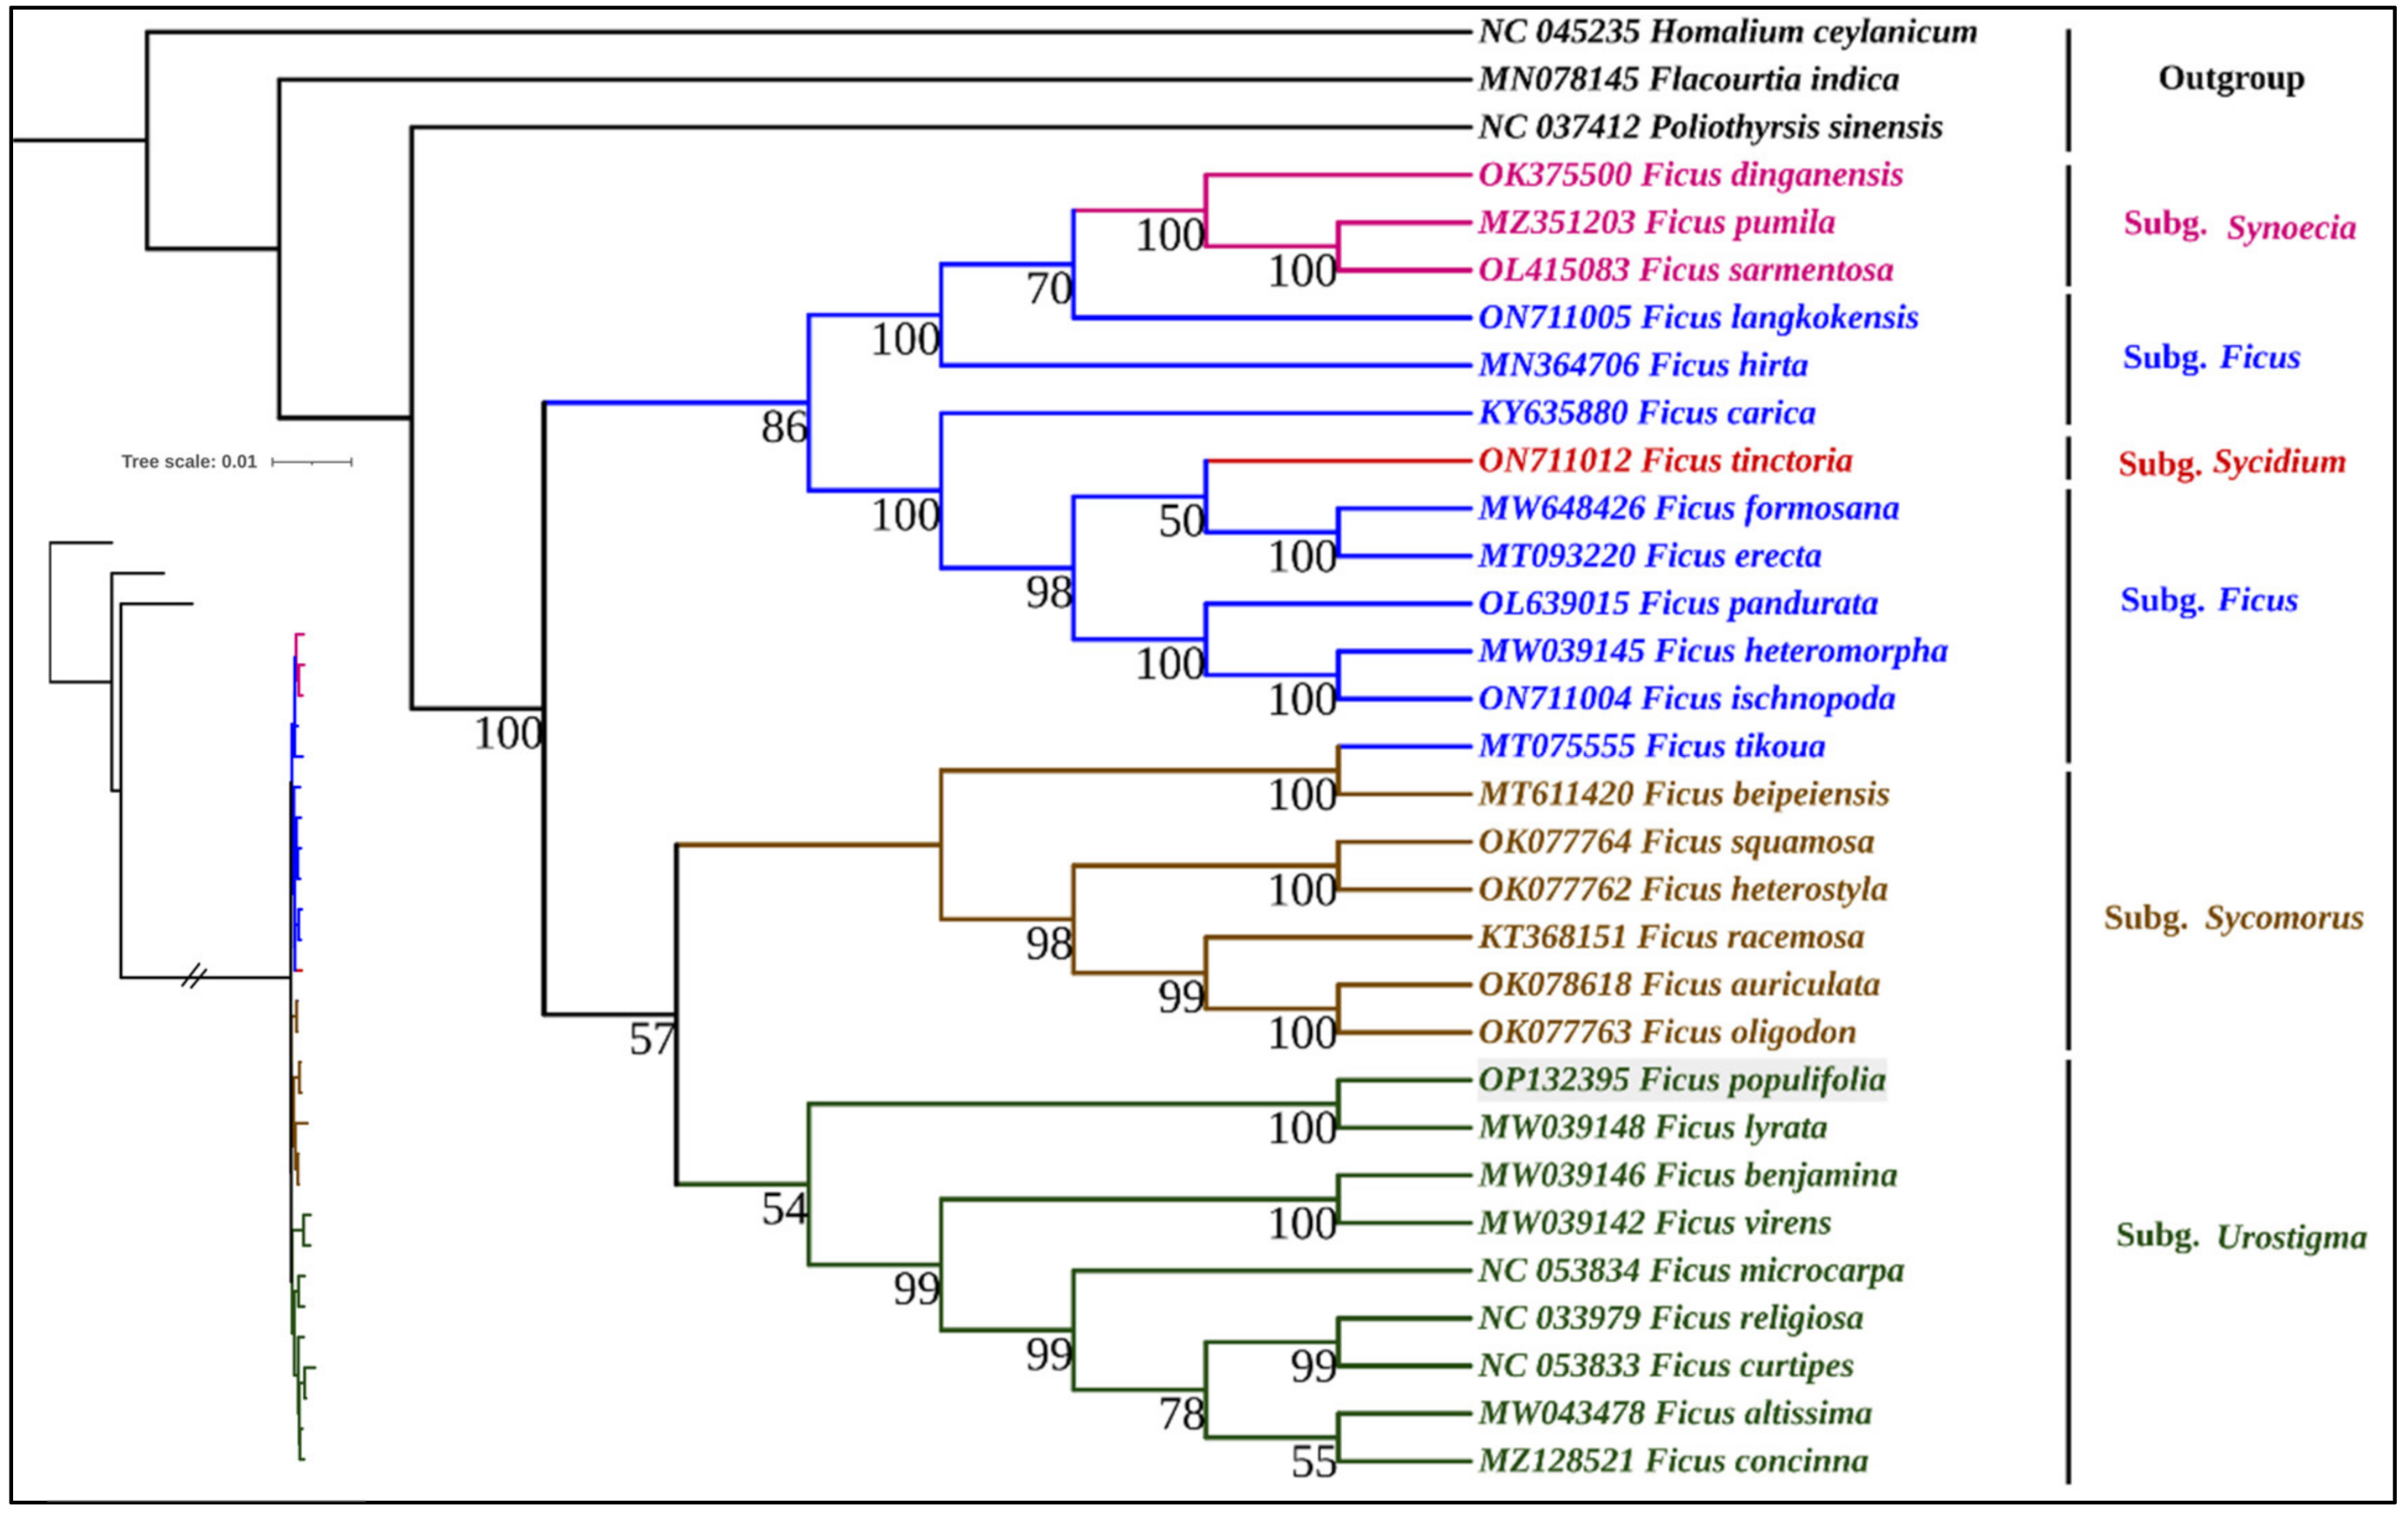
3.1.8. Phylogenomic Analysis

The chloroplast genomic data are of great value in addressing evolutionary plant relationships [54,65,87]. In contrast with previous studies that relied on only a few genes [2,88,89], plastome data have confidently resolved the relationships between Ficus subgenera [90]. In this study, the phylogenomic relationships of F. populifolia within the genus Ficus were examined based on 78 CDS regions extracted from 31 plastomes using ML and the BI. Both methods produced similar topologies, with the exception that the internal nodes of the genus Ficus remained unresolved in the BI tree (Figure S1). The monophyly of the genus Ficus was strongly supported and indicated by the results (Figure 14 and Figure S1), corresponding to the previously published phylogenomics [22,23,90]. The analysis revealed a close relationship between F. populifolia and F. lyrata, which form a strongly supported monophyletic group (ML bootstrap (BP) values = 100% and Bayesian posterior probabilities (PP) = 1.00). Both species belong to the Ficus sect. Galoglychia, which is largely restricted to the African floristic region [91,92]. Previous phylogenetic analysis of the section Galoglychia based on nuclear data has confirmed this relatedness [4]. The results also showed that the section Galoglychia subclade received moderate bootstrap support (54%) as a sister to all of the other subgenus Urostigma species. Prior work on Ficus phylogeny suggested the nonmonophyly of the subgenus Urostigma [89,90,93] as the section Galoglychia and Americana were paraphyletic with respect to other subgenus Urostigma subsections. As the taxon sampling in this study is quite limited, these paraphyletic relationships are not clearly revealed, and the subgenus Urostigma forms a moderately supported monophyletic group (Figure 14).

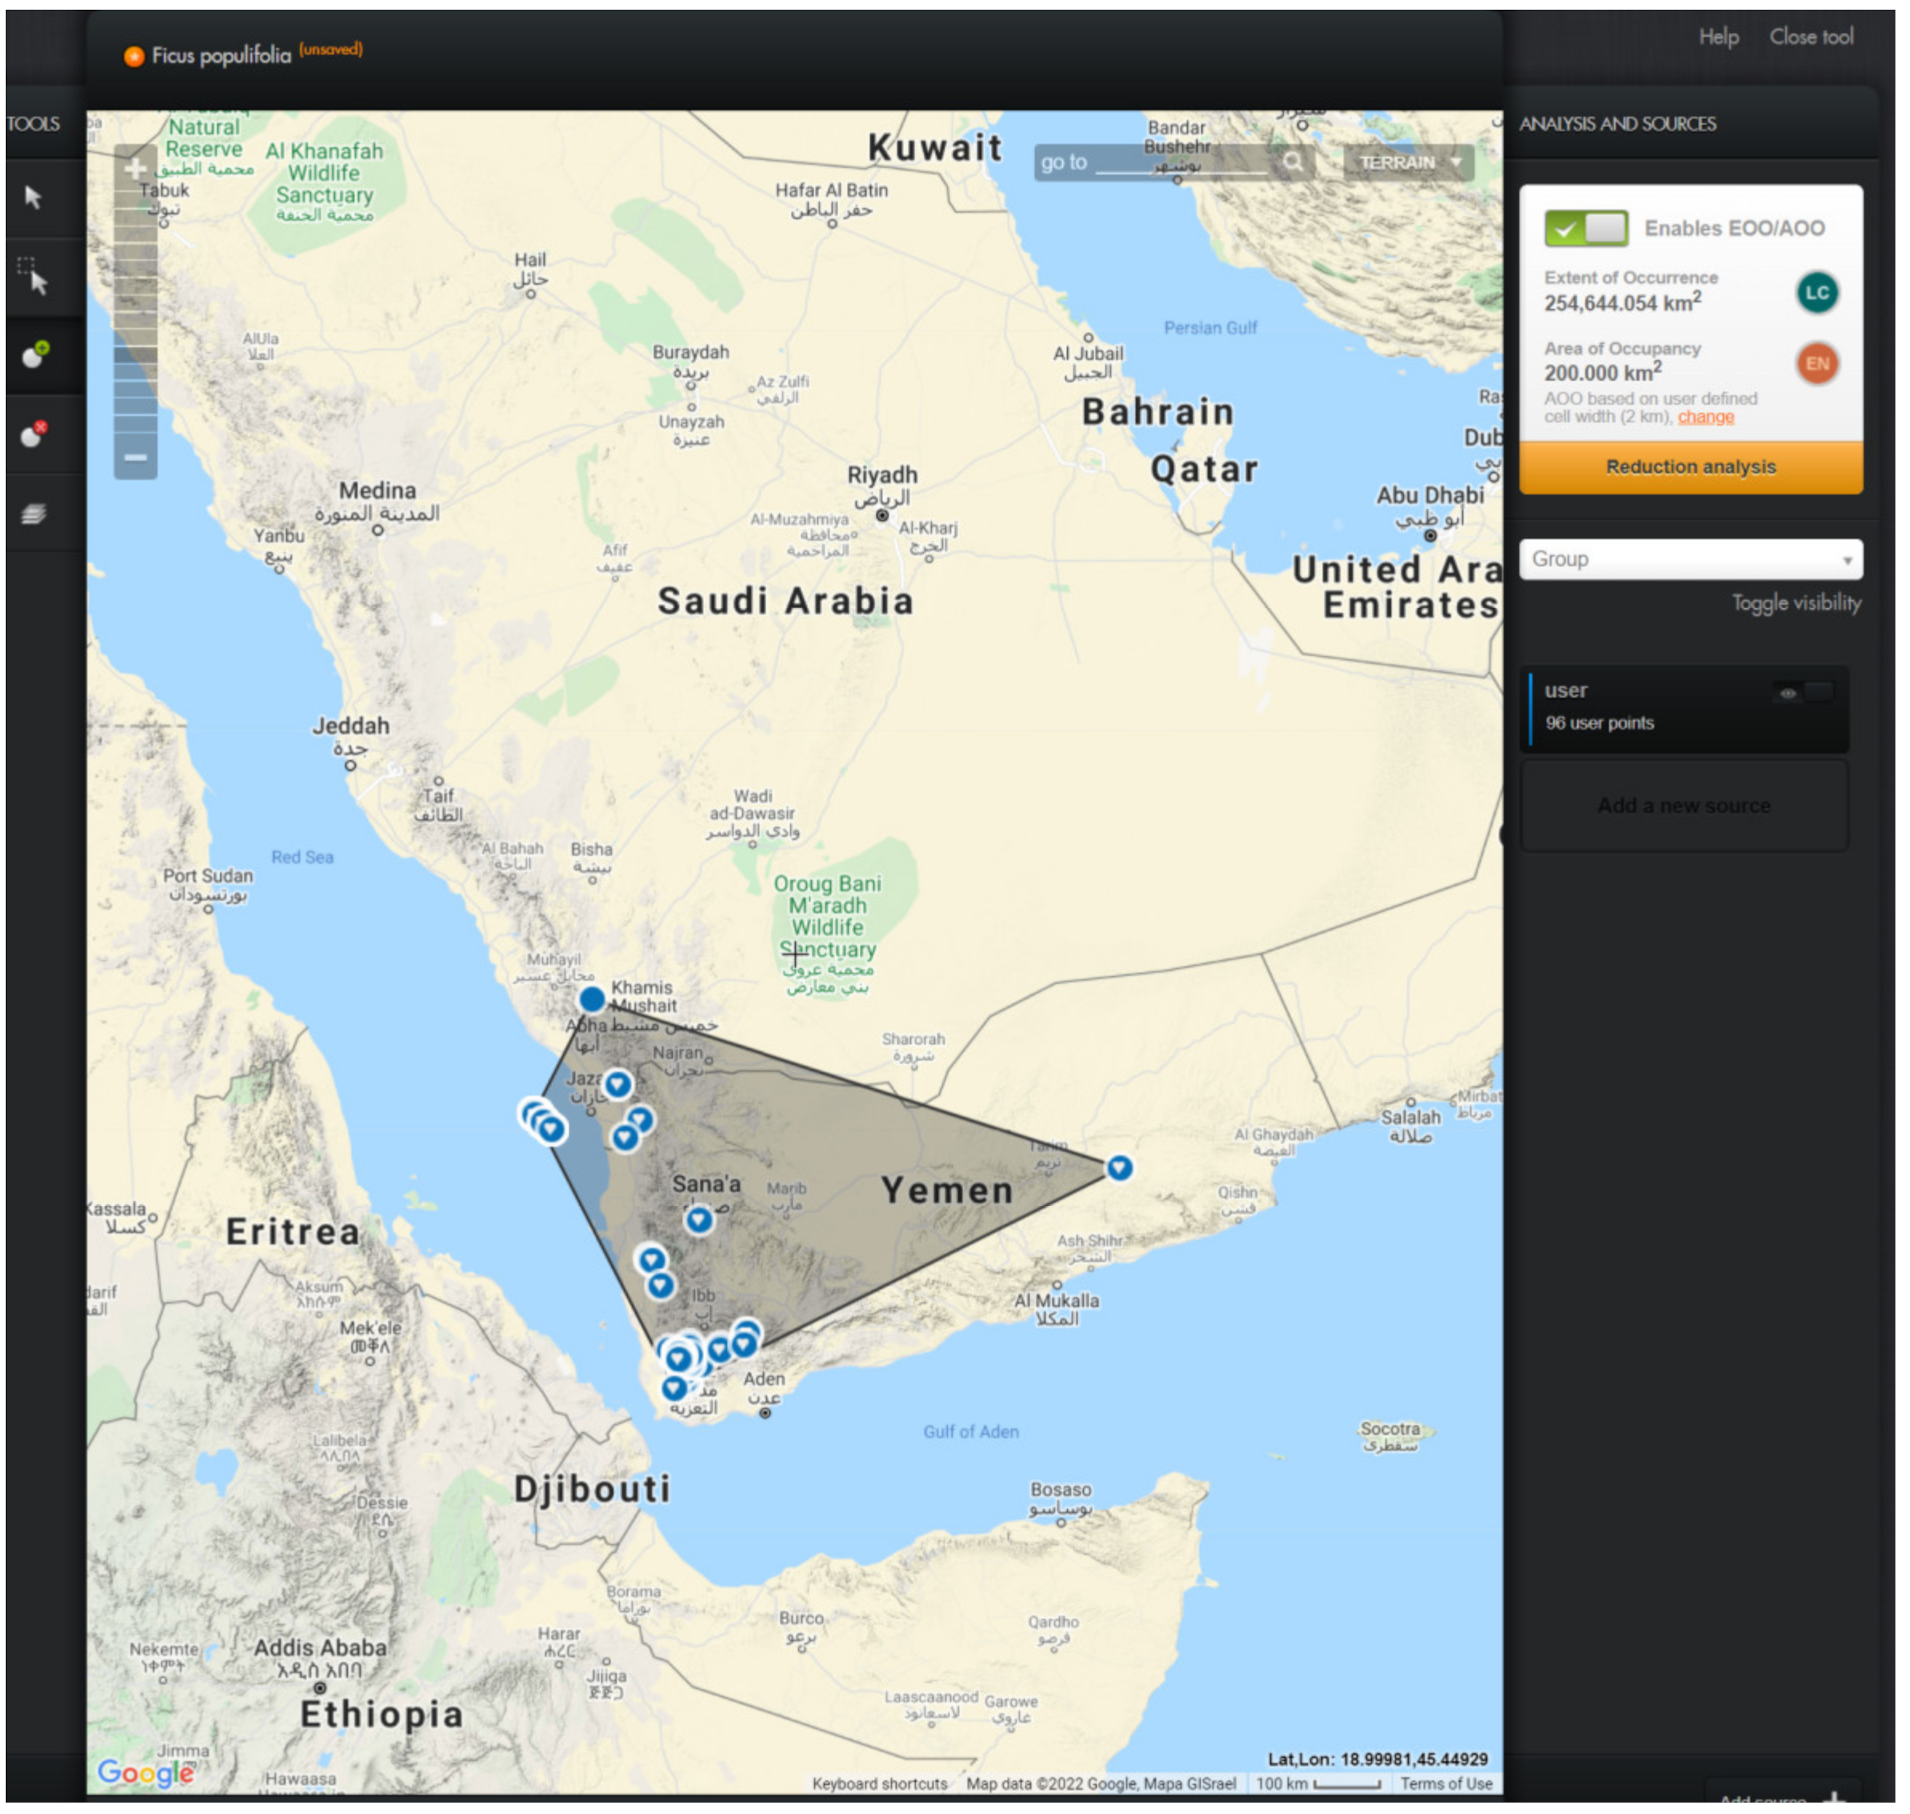
3.2. Conservation Assessment

Ficus populifolia has an EOO of 254,644.054 km2 in the Arabian Peninsula (which would place it in the Least Concern (LC) category) and an AOO of 200 km2 (which would place it in the Endangered (EN) category) (Figure 15). However, the impact of the ongoing war in Yemen on the population size and number of locations is not well-known. As a result, the taxon may be classified as Data Deficient (DD).

4. Conclusions

This paper provided the first complete plastome sequence of F. populifolia, a peripherally isolated plant population in the Arabian Peninsula. The comparative genomic analysis revealed that the plastome was highly conserved in structure, gene content, size, and organization, with 21 hotspot mutation areas that could be potential DNA makers for species authentication. Moreover, the long repeats and SSRs identified here could be employed in future studies to explore molecular breeding, genetic variations, and conservation of this threatened Arabian wild population. Furthermore, the plastome data studied could be a useful genetic resource to understand the evolution of the Ficus species in arid environments.

Supplementary Materials

The following supporting information can be downloaded at: https://www.mdpi.com/article/10.3390/f13122063/s1, Table S1: Plastomes sequences downloaded from GenBank used for phylogenomic analysis; Table S2: List of genes encoded by F. populifolia plastome; Table S3: Codon–anticodon recognition patterns and codon usage of the F. populifolia plastome; Table S4: Predicted RNA editing site in the F. populifolia plastome; Table S5: Repeat sequences present in the F. populifolia plastome; Table S6: SSRs detected in five Ficus plastomes. Figure S1. Phylogenomic relationship of 28 Ficus species based on 78 coding genes inferred from BI analysis.

Author Contributions

Conceptualization, S.A.A.; methodology, S.A.A., W.S.A. and E.J.A.; software, S.A.A., W.S.A. and E.J.A.; validation, S.A.A., W.S.A. and E.J.A.; formal analysis, S.A.A., W.S.A. and E.J.A.; investigation, S.A.A., W.S.A. and E.J.A.; resources, S.A.A., W.S.A. and E.J.A.; data curation, S.A.A.; writing—original draft preparation, S.A.A., W.S.A. and E.J.A.; writing—review and editing, S.A.A., W.S.A. and E.J.A.; visualization, S.A.A., W.S.A. and E.J.A.; supervision, S.A.A.; project administration, S.A.A. All authors have read and agreed to the published version of the manuscript.

Funding

This research received no external funding.

Data Availability Statement

The data generated in this study are available in the article and Supplementary Material. The whole plastome sequence of Ficus populifolia is available for download from GenBank at https://www.ncbi.nlm.nih.gov/, (accessed on 3 August 2022) (accession NO.: OP132395).

Acknowledgments

The authors would like to thank Othman S. S. Al-Hawshabi from the University of Aden, Yemen, for providing us with F. populifolia occurrence data from Yemen. We would like to thank Simon van Noort for granting us permission to reproduce the F. populifolia distribution map from www.figweb.org (accessed on 14 February 2022). We are grateful to the Saudi Wildlife Authority (SWA) staff in the Farasan Islands for their assistance and in facilitating access to the Farasan Protected Area. We would also like to thank Noha Alharbi for her assistance in preparing some of the graphs.

Conflicts of Interest

The authors declare no conflict of interest.

Abbreviations

IUCN: International Union for Conservation of Nature; NCBI: National Center for Biotechnology Information; CTAB: cetrimonium bromide; RSCU: relative synonymous codon usage; SSRs: simple sequence repeats; Ks: synonymous; Ka: nonsynonymous; CDS protein-coding genes; ML: maximum likelihood; BI: Bayesian inference; BP: bootstrap percentage; EOO: extent of occurrence; AOO: area of occupancy; LSC: large single copy region; SSC: small single copy region; IR: inverted repeat; GC: guanine–cytosine; AT: adenine–thymine; cpSSRs: chloroplast simple sequence repeats; IGS: intergenic spacer; CNS: conserved non coding sequence; PP: posterior probability.

References

  1. Berg, C.C.; Corner, E.J.H. Flora Malesiana. Series I, Seed Plants. Volume 17, Part 2: Moraceae (Ficus); Nationaal Herbarium Nederland: Leiden, The Netherlands, 2005; Volume 17. [Google Scholar]
  2. Cruaud, A.; Rønsted, N.; Chantarasuwan, B.; Chou, L.S.; Clement, W.L.; Couloux, A.; Cousins, B.; Genson, G.; Harrison, R.D.; Hanson, P.E. An extreme case of plant–insect codiversification: Figs and fig-pollinating wasps. Syst. Biol. 2012, 61, 1029–1047. [Google Scholar] [CrossRef] [PubMed] [Green Version]
  3. Harrison, R.D. Figs and the Diversity of Tropical Rainforests. BioScience 2005, 55, 1053–1064. [Google Scholar] [CrossRef]
  4. Ronsted, N.; Salvo, G.; Savolainen, V. Biogeographical and phylogenetic origins of African fig species (Ficus section Galoglychia). Mol. Phylogenet. Evol. 2007, 43, 190–201. [Google Scholar] [CrossRef] [PubMed]
  5. Miller, A.G.; Cope, T.A. Flora of the Arabian Peninsula and Socotra Volume 1; Edinburgh University Press in Association with Royal Botanic Garden: Edinburgh, UK, 1996; Volume 1. [Google Scholar]
  6. Beentje, H.J. Fig Trees (Ficus, Moraceae) of Kenya; East Africa Natural History Soc.: Nairobi, Kenya, 1988; Volume 76. [Google Scholar]
  7. Aweke, G. Revision of the Genus Ficus L. (Moraceae) in Ethiopia; (Primitiae Africanae XI); Meded. Landbouwhogeschool: Wageningen, The Netherlands, 1979; pp. 79–83. [Google Scholar]
  8. Quattrocchi, U. CRC World Dictionary of Medicinal and Poisonous Plants: Common Names, Scientific Names, Eponyms, Synonyms, and Etymology; CRC Press: Boca Raton, FL, USA, 2016. [Google Scholar]
  9. Abeli, T.; Gentili, R.; Rossi, G.; Bedini, G.; Foggi, B. Can the IUCN criteria be effectively applied to peripheral isolated plant populations? Biodivers. Conserv. 2009, 18, 3877–3890. [Google Scholar] [CrossRef]
  10. Zhou, R.; Ling, S.; Zhao, W.; Osada, N.; Chen, S.; Zhang, M.; He, Z.; Bao, H.; Zhong, C.; Zhang, B.; et al. Population genetics in nonmodel organisms: II. Natural selection in marginal habitats revealed by deep sequencing on dual platforms. Mol. Biol. Evol. 2011, 28, 2833–2842. [Google Scholar]
  11. Arnaud-Haond, S.; Teixeira, S.; Massa, S.I.; Billot, C.; Saenger, P.; Coupland, G.; Duarte, C.M.; Serrão, E.A. Genetic structure at range edge: Low diversity and high inbreeding in Southeast Asian mangrove (Avicennia marina) populations. Mol. Ecol. 2006, 15, 3515–3525. [Google Scholar] [CrossRef]
  12. Fady, B.; Aravanopoulos, F.A.; Alizoti, P.; Mátyás, C.; von Wühlisch, G.; Westergren, M.; Belletti, P.; Cvjetkovic, B.; Ducci, F.; Huber, G. Evolution-based approach needed for the conservation and silviculture of peripheral forest tree populations. For. Ecol. Manag. 2016, 100, 66–75. [Google Scholar] [CrossRef] [Green Version]
  13. Alleaume-Benharira, M.; Pen, I.R.; Ronce, O. Geographical patterns of adaptation within a species’ range: Interactions between drift and gene flow. J. Evol. Biol. 2006, 19, 203–215. [Google Scholar] [CrossRef]
  14. UNDP. National Biodiversity Strategy and Action Plan II “Achieving a Resilient, Productive and Sustainable Socio-Ecosystem by 2050”; Ministry of Water and Environment and Environment Protection Authority (EPA): Yemen, 2017; Available online: https://andp.unescwa.org/sites/default/files/2020-10/National%20Biodiversity%20Strategy%20and%20Action%20Plan%202-achieving%20a%20resilient%2C%20productive%20and%20sustainable%20socio-ecosystem%20by%202050.pdf (accessed on 14 February 2022).
  15. Planta Europa. A Sustainable Future for Europe; The European Strategy for Plant Conservation 2008–2014; Plantlife International: Salisbury, UK; The Council of Europe: Strasbourg, France, 2008. [Google Scholar]
  16. Botanic Gardens Conservation International (BGCI); IUCN SSC Global Tree Specialist Group. Ficus Populifolia; The IUCN Red List of Threatened Species: Gland, Switzerland, 2019; e.T143276998A143294738. [Google Scholar] [CrossRef]
  17. IUCN Standards and Petitions Committee. Guidelines for Using the IUCN Red List Categories and Criteria. Version 15.1; Prepared by the Standards and Petitions Committee: Cambridge, UK, 2022. [Google Scholar]
  18. IUCN. Guidelines for Application of IUCN Red List Criteria at Regional and National Levels: Version 4.0; IUCN: Gland, Switzerland; Cambridge, UK, 2012. [Google Scholar]
  19. Li, X.; Yang, Y.; Henry, R.J.; Rossetto, M.; Wang, Y.; Chen, S. Plant DNA barcoding: From gene to genome. Biol. Rev. 2015, 90, 157–166. [Google Scholar] [CrossRef]
  20. Jansen, R.K.; Ruhlman, T.A. Plastid genomes of seed plants. In Genomics of Chloroplasts and Mitochondria; Springer: Berlin/Heidelberg, Germany, 2012; pp. 103–126. [Google Scholar]
  21. Van Noort, S.; Rasplus, J. Figweb: Figs and Fig Wasps of the World. Available online: www.figweb.org (accessed on 20 February 2022).
  22. Huang, Y.; Li, J.; Yang, Z.; An, W.; Xie, C.; Liu, S.; Zheng, X. Comprehensive analysis of complete chloroplast genome and phylogenetic aspects of ten Ficus species. BMC Plant Biol. 2022, 22, 253. [Google Scholar] [CrossRef]
  23. Xia, X.; Peng, J.; Yang, L.; Zhao, X.; Duan, A.; Wang, D. Comparative Analysis of the Complete Chloroplast Genomes of Eight Ficus Species and Insights into the Phylogenetic Relationships of Ficus. Life 2022, 12, 848. [Google Scholar] [CrossRef] [PubMed]
  24. Doyle, J.; Doyle, J. A rapid DNA isolation procedure for small quantities of fresh leaf tissue. Phyotochem. Bull. 1987, 19, 11–15. [Google Scholar]
  25. Bolger, A.M.; Lohse, M.; Usadel, B. Trimmomatic: A flexible trimmer for Illumina sequence data. Bioinformatics 2014, 30, 2114–2120. [Google Scholar] [CrossRef] [PubMed] [Green Version]
  26. Dierckxsens, N.; Mardulyn, P.; Smits, G. NOVOPlasty: De novo assembly of organelle genomes from whole genome data. Nucleic Acids Res. 2017, 45, e18. [Google Scholar] [CrossRef] [Green Version]
  27. Lohse, M.; Drechsel, O.; Bock, R. OrganellarGenomeDRAW (OGDRAW): A tool for the easy generation of high-quality custom graphical maps of plastid and mitochondrial genomes. Curr. Genet. 2007, 52, 267–274. [Google Scholar] [CrossRef]
  28. Kumar, S.; Stecher, G.; Tamura, K. MEGA7: Molecular evolutionary genetics analysis version 7.0 for bigger datasets. Mol. Biol. Evol. 2016, 33, 1870–1874. [Google Scholar] [CrossRef] [Green Version]
  29. Mower, J.P. The PREP suite: Predictive RNA editors for plant mitochondrial genes, chloroplast genes and user-defined alignments. Nucleic Acids Res. 2009, 37, 253–259. [Google Scholar] [CrossRef]
  30. Kurtz, S.; Choudhuri, J.V.; Ohlebusch, E.; Schleiermacher, C.; Stoye, J.; Giegerich, R. REPuter: The manifold applications of repeat analysis on a genomic scale. Nucleic Acids Res. 2001, 29, 4633–4642. [Google Scholar] [CrossRef] [Green Version]
  31. Thiel, T.; Michalek, W.; Varshney, R.; Graner, A. Exploiting EST databases for the development and characterization of gene-derived SSR-markers in barley (Hordeum vulgare L.). Theor. Appl. Genet. 2003, 106, 411–422. [Google Scholar] [CrossRef]
  32. Mayor, C.; Brudno, M.; Schwartz, J.R.; Poliakov, A.; Rubin, E.M.; Frazer, K.A.; Pachter, L.S.; Dubchak, I. VISTA: Visualizing global DNA sequence alignments of arbitrary length. Bioinformatics 2000, 16, 1046. [Google Scholar] [CrossRef] [Green Version]
  33. Amiryousefi, A.; Hyvönen, J.; Poczai, P. IRscope: An online program to visualize the junction sites of chloroplast genomes. Bioinformatics 2018, 34, 3030–3031. [Google Scholar] [CrossRef] [PubMed]
  34. Wang, D.; Zhang, Y.; Zhang, Z.; Zhu, J.; Yu, J. KaKs_Calculator 2.0: A Toolkit Incorporating Gamma-Series Methods and Sliding Window Strategies. Genom. Proteom. Bioinform. 2010, 8, 77–80. [Google Scholar] [CrossRef] [PubMed] [Green Version]
  35. Kearse, M.; Moir, R.; Wilson, A.; Stones-Havas, S.; Cheung, M.; Sturrock, S.; Buxton, S.; Cooper, A.; Markowitz, S.; Duran, C.; et al. Geneious Basic: An integrated and extendable desktop software platform for the organization and analysis of sequence data. Bioinformatics 2012, 28, 1647–1649. [Google Scholar] [CrossRef] [Green Version]
  36. Edgar, R.C. MUSCLE: Multiple sequence alignment with high accuracy and high throughput. Nucleic Acids Res 2004, 32, 1792–1797. [Google Scholar] [CrossRef] [PubMed] [Green Version]
  37. Miller, M.A.; Pfeiffer, W.; Schwartz, T. Creating the CIPRES Science Gateway for inference of large phylogenetic trees. In Proceedings of the 2010 Gateway Computing Environments Workshop (GCE), New Orleans, LA, USA, 14 November 2010; pp. 1–8. [Google Scholar]
  38. Darriba, D.; Taboada, G.; Doallo, R.; Posada, D. jModelTest 2: More models, new heuristics and parallel computing. Nat. Methods 2012, 9, 772. [Google Scholar] [CrossRef] [PubMed] [Green Version]
  39. Akaike, H. A new look at the statistical model identification. In Selected Papers of Hirotugu Akaike; Springer: Berlin/Heidelberg, Germany, 1974; pp. 215–222. [Google Scholar]
  40. Stamatakis, A. RAxML version 8: A tool for phylogenetic analysis and post-analysis of large phylogenies. Bioinformatics 2014, 30, 1312–1313. [Google Scholar] [CrossRef] [Green Version]
  41. Huelsenbeck, J.P.; Ronquist, F. MRBAYES: Bayesian inference of phylogeny. Bioinformatics 2001, 17, 754–755. [Google Scholar] [CrossRef] [PubMed] [Green Version]
  42. Rambaut, A.; Drummond, A.J.; Xie, D.; Baele, G.; Suchard, M.A. Posterior Summarization in Bayesian Phylogenetics Using Tracer 1.7. Syst. Biol. 2018, 67, 901–904. [Google Scholar] [CrossRef] [Green Version]
  43. Letunic, I.; Bork, P. Interactive Tree OF Life (iTOL) v5: An online tool for phylogenetic tree display and annotation. Nucleic Acids Res. 2021, 49, W293–W296. [Google Scholar] [CrossRef]
  44. El-Shabasy, A.; Kasem, W. Systematic composition, species diversity and plant chorology at Wadi Tashar, Jazan, Saudi Arabia. J. Med. Plants Stud. 2018, 6, 83–88. [Google Scholar]
  45. Gabali, S.A.; Al-Gifri, A.N. Flora of South Yemen—Angiospermae A provisional checklist. Feddes Repert. 1990, 101, 373–383. [Google Scholar] [CrossRef]
  46. Hamed, M.A.; Kasem, W.T.; Shalabi, L.F. Floristic diversity and vegetation-soil correlations in Wadi Qusai, Jazan, Saudi Arabia. Int. J. Plant Soil Sci. 2018, 1–18. [Google Scholar] [CrossRef]
  47. Kasem, W.T.; Marei, A. Floristic Compositions and its affinities to phytogeographical regions in Wadi Khulab of Jazan, Saudi Arabia. Int. J. Plant Soil Sci. 2017, 16, 1–11. [Google Scholar] [CrossRef] [Green Version]
  48. Bachman, S.; Moat, J.; Hill, A.W.; de Torre, J.; Scott, B. Supporting Red List threat assessments with GeoCAT: Geospatial conservation assessment tool. ZooKeys 2011, 150, 117–126. [Google Scholar] [CrossRef] [PubMed] [Green Version]
  49. IUCN. IUCN Red List Categories and Criteria: Version 3.1, 2nd ed.; IUCN: Gland, Switzerland; Cambridge, UK, 2012. [Google Scholar]
  50. Wicke, S.; Schneeweiss, G.M.; Depamphilis, C.W.; Müller, K.F.; Quandt, D. The evolution of the plastid chromosome in land plants: Gene content, gene order, gene function. Plant Mol. Biol. 2011, 76, 273–297. [Google Scholar] [CrossRef] [PubMed] [Green Version]
  51. Zhang, P.H.; Hou, Z. The complete chloroplast genome sequence of Ficus concinna (Moraceae) from Sichuan province. Mitochondrial DNA B Resour 2022, 7, 390–392. [Google Scholar] [CrossRef]
  52. Liu, Y.; Chen, W.; Li, F.; Li, C.; Xie, X.; Chao, Z.; Tian, E. The complete chloroplast genome sequence of Ficus hirta (Moraceae). Mitochondrial DNA Part B 2019, 4, 4041–4042. [Google Scholar] [CrossRef] [Green Version]
  53. Dobrogojski, J.; Adamiec, M.; Luciński, R. The chloroplast genome: A review. Acta Physiol. Plant. 2020, 42, 98. [Google Scholar] [CrossRef]
  54. Asaf, S.; Ahmad, W.; Al-Harrasi, A.; Khan, A.L. Uncovering the first complete plastome genomics, comparative analyses, and phylogenetic dispositions of endemic medicinal plant Ziziphus hajarensis (Rhamnaceae). BMC Genom. 2022, 23, 83. [Google Scholar] [CrossRef]
  55. Al-Juhani, W.S.; Alharbi, S.A.; Al Aboud, N.M.; Aljohani, A.Y. Complete chloroplast genome of the desert date (Balanites aegyptiaca (L.) Del. comparative analysis, and phylogenetic relationships among the members of Zygophyllaceae. BMC Genom. 2022, 23, 626. [Google Scholar] [CrossRef]
  56. Zhang, Y.; Wang, Z.; Guo, Y.; Chen, S.; Xu, X.; Wang, R. Complete chloroplast genomes of Leptodermis scabrida complex: Comparative genomic analyses and phylogenetic relationships. Gene 2021, 791, 145715. [Google Scholar] [CrossRef]
  57. Li, C.-J.; Wang, R.-N.; Li, D.-Z. Comparative analysis of plastid genomes within the Campanulaceae and phylogenetic implications. PLoS ONE 2020, 15, e0233167. [Google Scholar] [CrossRef]
  58. Shaul, O. How introns enhance gene expression. Int. J. Biochem. Cell Biol. 2017, 91, 145–155. [Google Scholar] [CrossRef] [PubMed]
  59. Alzahrani, D.; Albokhari, E.; Abba, A.; Yaradua, S. The first complete chloroplast genome sequences in Resedaceae: Genome structure and comparative analysis. Sci. Prog. 2021, 104, 003685042110599. [Google Scholar] [CrossRef] [PubMed]
  60. Quax, T.E.S.; Claassens, N.J.; Söll, D.; van der Oost, J. Codon Bias as a Means to Fine-Tune Gene Expression. Mol. Cell 2015, 59, 149–161. [Google Scholar] [CrossRef] [Green Version]
  61. Mazumdar, P.; Binti Othman, R.; Mebus, K.; Ramakrishnan, N.; Ann Harikrishna, J. Codon usage and codon pair patterns in non-grass monocot genomes. Ann. Bot. 2017, 120, 893–909. [Google Scholar] [CrossRef] [PubMed] [Green Version]
  62. Tang, W.; Luo, C. Molecular and Functional Diversity of RNA Editing in Plant Mitochondria. Mol. Biotechnol. 2018, 60, 935–945. [Google Scholar] [CrossRef] [PubMed]
  63. Shikanai, T. RNA editing in plant organelles: Machinery, physiological function and evolution. Cell. Mol. Life Sci. CMLS 2006, 63, 698–708. [Google Scholar] [CrossRef] [PubMed]
  64. Williams, A.V.; Miller, J.T.; Small, I.; Nevill, P.G.; Boykin, L.M. Integration of complete chloroplast genome sequences with small amplicon datasets improves phylogenetic resolution in Acacia. Mol. Phylogenet. Evol. 2016, 96, 1–8. [Google Scholar] [CrossRef] [Green Version]
  65. Jansen, R.K.; Raubeson, L.A.; Boore, J.L.; Depamphilis, C.W.; Chumley, T.W.; Haberle, R.C.; Wyman, S.K.; Alverson, A.J.; Peery, R.; Herman, S.J. Methods for obtaining and analyzing whole chloroplast genome sequences. Methods Enzymol. 2005, 395, 348–384. [Google Scholar]
  66. Li, Y.-C.; Korol, A.B.; Fahima, T.; Beiles, A.; Nevo, E. Microsatellites: Genomic distribution, putative functions and mutational mechanisms: A review. Mol. Ecol. 2002, 11, 2453–2465. [Google Scholar] [CrossRef] [PubMed]
  67. Kalia, R.K.; Rai, M.K.; Kalia, S.; Singh, R.; Dhawan, A.K. Microsatellite markers: An overview of the recent progress in plants. Euphytica 2011, 177, 309–334. [Google Scholar] [CrossRef]
  68. Ebert, D.; Peakall, R. Chloroplast simple sequence repeats (cpSSRs): Technical resources and recommendations for expanding cpSSR discovery and applications to a wide array of plant species. Mol. Ecol. Resour. 2009, 9, 673–690. [Google Scholar] [CrossRef] [PubMed]
  69. Yang, A.H.; Zhang, J.J.; Yao, X.H.; Huang, H.W. Chloroplast microsatellite markers in Liriodendron tulipifera (Magnoliaceae) and cross-species amplification in L. chinense. Am. J. Bot. 2011, 98, e123–e126. [Google Scholar] [CrossRef]
  70. Liu, F.; Movahedi, A.; Yang, W.; Xu, L.; Xie, J.; Zhang, Y. The complete chloroplast genome and characteristics analysis of Callistemon rigidus R. Br. Mol. Biol. Rep. 2020, 47, 5013–5024. [Google Scholar] [CrossRef]
  71. Xie, D.-F.; Yu, Y.; Deng, Y.-Q.; Li, J.; Liu, H.-Y.; Zhou, S.-D.; He, X.-J. Comparative Analysis of the Chloroplast Genomes of the Chinese Endemic Genus Urophysa and Their Contribution to Chloroplast Phylogeny and Adaptive Evolution. Int. J. Mol. Sci. 2018, 19, 1847. [Google Scholar] [CrossRef] [Green Version]
  72. Song, W.; Chen, Z.; Shi, W.; Han, W.; Feng, Q.; Shi, C.; Engel, M.S.; Wang, S. Comparative Analysis of Complete Chloroplast Genomes of Nine Species of Litsea (Lauraceae): Hypervariable Regions, Positive Selection, and Phylogenetic Relationships. Genes 2022, 13, 1550. [Google Scholar] [CrossRef]
  73. Perry, A.S.; Wolfe, K.H. Nucleotide substitution rates in legume chloroplast DNA depend on the presence of the inverted repeat. J. Mol. Evol. 2002, 55, 501–508. [Google Scholar] [CrossRef] [PubMed]
  74. Clegg, M.T.; Gaut, B.S.; Learn, G.H.; Morton, B.R. Rates and patterns of chloroplast DNA evolution. Proc. Natl. Acad. Sci. USA 1994, 91, 6795–6801. [Google Scholar] [CrossRef] [Green Version]
  75. Schutze, P.; Freitag, H.; Weising, K. An integrated molecular and morphological study of the subfamily Suaedoideae Ulbr. (Chenopodiaceae). Plant Syst. Evol. 2003, 239, 257–286. [Google Scholar] [CrossRef]
  76. Dong, W.; Xu, C.; Li, C.; Sun, J.; Zuo, Y.; Shi, S.; Cheng, T.; Guo, J.; Zhou, S. ycf1, the most promising plastid DNA barcode of land plants. Sci. Rep. 2015, 5, 8348. [Google Scholar] [CrossRef] [Green Version]
  77. Awad, M.; Fahmy, R.M.; Mosa, K.A.; Helmy, M.; El-Feky, F.A. Identification of effective DNA barcodes for Triticum plants through chloroplast genome-wide analysis. Comput. Biol. Chem. 2017, 71, 20–31. [Google Scholar] [CrossRef] [PubMed]
  78. Zhu, A.; Guo, W.; Gupta, S.; Fan, W.; Mower, J.P. Evolutionary dynamics of the plastid inverted repeat: The effects of expansion, contraction, and loss on substitution rates. New Phytol. 2016, 209, 1747–1756. [Google Scholar] [CrossRef]
  79. Wang, R.-J.; Cheng, C.-L.; Chang, C.-C.; Wu, C.-L.; Su, T.-M.; Chaw, S.-M. Dynamics and evolution of the inverted repeat-large single copy junctions in the chloroplast genomes of monocots. BMC Evol. Biol. 2008, 8, 36. [Google Scholar] [CrossRef] [PubMed] [Green Version]
  80. Jeffares, D.C.; Tomiczek, B.; Sojo, V.; Dos Reis, M. A Beginners Guide to Estimating the Non-Synonymous to Synonymous Rate Ratio of all Protein-Coding Genes in a Genome; Springer: New York, NY, USA, 2015; pp. 65–90. [Google Scholar] [CrossRef]
  81. Kosiol, C.; Vinař, T.; Da Fonseca, R.R.; Hubisz, M.J.; Bustamante, C.D.; Nielsen, R.; Siepel, A. Patterns of Positive Selection in Six Mammalian Genomes. PLoS Genet. 2008, 4, e1000144. [Google Scholar] [CrossRef] [PubMed] [Green Version]
  82. Kimura, M. The neutral theory of molecular evolution and the world view of the neutralists. Genome 1989, 31, 24–31. [Google Scholar] [CrossRef] [PubMed]
  83. Bock, D.G.; Andrew, R.L.; Rieseberg, L.H. On the adaptive value of cytoplasmic genomes in plants. Mol. Ecol. 2014, 23, 4899–4911. [Google Scholar] [CrossRef]
  84. Drescher, A.; Ruf, S.; Calsa, T.; Carrer, H.; Bock, R. The two largest chloroplast genome-encoded open reading frames of higher plants are essential genes. Plant J. 2000, 22, 97–104. [Google Scholar] [CrossRef]
  85. Kuroda, H.; Maliga, P. The plastid clpP1 protease gene is essential for plant development. Nature 2003, 425, 86–89. [Google Scholar] [CrossRef]
  86. Sloan, D.B.; Triant, D.A.; Forrester, N.J.; Bergner, L.M.; Wu, M.; Taylor, D.R. A recurring syndrome of accelerated plastid genome evolution in the angiosperm tribe Sileneae (Caryophyllaceae). Mol. Phylogenet. Evol. 2014, 72, 82–89. [Google Scholar] [CrossRef]
  87. Tavares, J.C.C.; Achakkagari, S.R.; Archambault, A.; Strömvik, M.V. The plastome of Arctic Oxytropis arctobia (Fabaceae) is significantly different from that of O. splendens and other related species. Genome 2022, 65, 301–313. [Google Scholar] [CrossRef]
  88. Ronsted, N.; Weiblen, G.D.; Clement, W.; Zerega, N.J.; Savolainen, V. Reconstructing the phylogeny of figs (Ficus, Moraceae) to reveal the history of the fig pollination mutualism. Symbiosis 2008, 45, 45. [Google Scholar]
  89. Ronsted, N.; Weiblen, G.D.; Cook, J.M.; Salamin, N.; Machado, C.A.; Savolainen, V. 60 million years of co-divergence in the fig-wasp symbiosis. Proc. Biol. Sci. 2005, 272, 2593–2599. [Google Scholar] [CrossRef]
  90. Bruun-Lund, S.; Clement, W.L.; Kjellberg, F.; Ronsted, N. First plastid phylogenomic study reveals potential cyto-nuclear discordance in the evolutionary history of Ficus L. (Moraceae). Mol. Phylogenet. Evol. 2017, 109, 93–104. [Google Scholar] [CrossRef] [PubMed]
  91. Berg, C.C.; Wiebes, J.T. African Fig Trees and Fig Wasps; Koninklijke Nederlandse Akademie van Wetenschappen, Verhandelingen Afdeling Natuurkunde, Tweede Reeks: Amsterdam, The Netherlands, 1992; Volume 89. [Google Scholar]
  92. Berg, C.C. Subdivision of Ficus subg. Urostigma sect. Galoglychia (Moraceae). Misc. Publ. Univ. Utrecht Herb. 1986, 1, 121–127. [Google Scholar]
  93. Cruaud, A.; Jabbour-Zahab, R.; Genson, G.; Ungricht, S.; Rasplus, J.-Y. Testing the Emergence of New Caledonia: Fig Wasp Mutualism as a Case Study and a Review of Evidence. PLoS ONE 2012, 7, e30941. [Google Scholar] [CrossRef] [PubMed]
Figure 1. (A) Ficus populifolia Vahl. tree in its natural habitat. Photo by S. Alharbi from the Farasan Islands, the Red Sea (Saudi Arabia); (B) distribution map produced by Simon van Noort (Iziko Museums of South Africa), www.figweb.org (accessed on 14 February 2022).
Forests 13 02063 g001
Figure 2. Map of the plastome of Ficus populifolia. The inner dark and light grey circle represent GC and AT content, respectively. Different colours distinguish functional sets of genes, with those outside the circle transcribed counter-clockwise and those inside transcribed clockwise. Genes marked with * have introns.
Forests 13 02063 g002
Figure 3. The frequencies of amino acids in Ficus populifolia plastome.
Forests 13 02063 g003
Figure 4. Codon composition for the 20 amino acids in the plastome of Ficus populifolia.
Forests 13 02063 g004
Figure 5. Predicted RNA editing site in the coding genes of the Ficus populifolia plastome.
Forests 13 02063 g005
Figure 6. The frequency of amino acids conversions in the Ficus populifolia plastome. A = Ala; V = Val; H = His; L = Leu; F = Phe; P = Pro; S = Ser; R = Arg; C = Cys; W = Trp; T = Thr; M = Met.
Forests 13 02063 g006
Figure 7. Number of different repeats in the five plastomes of Ficus. P = palindromic, F = forward, R = reverse, and C = complement.
Forests 13 02063 g007
Figure 8. Number of different SSR types in the five Ficus plastomes.
Forests 13 02063 g008
Figure 9. The frequency of microsatellite motifs in plastomes of five Ficus species.
Forests 13 02063 g009
Figure 10. Number of different SSR types in Ficus populifolia plastome.
Forests 13 02063 g010
Figure 11. Visual alignment of five Ficus plastomes using Ficus populifolia as a reference. The y-axis displays the identity percentage (50%–100%), whereas the x-axis displays the genomic coordinate. The upper arrows represent the direction and position of each gene. CNS = conserved non-coding regions, UTR = untranslated region. The plot was created using the mVISTA program [32].
Forests 13 02063 g011
Figure 12. Comparison of boundaries between single copies (SCs) and the inverted repeats (IR) among the five Ficus plastomes.
Forests 13 02063 g012
Figure 13. The Ka/Ks ratio of CDS genes from Ficus populifolia against Ficus concinna, Ficus hirta, Ficus racemosa, and Ficus sarmentosa.
Forests 13 02063 g013
Figure 14. Phylogenomic relationship of 28 Ficus species based on 78 coding genes inferred from ML analysis. Bootstrap values are present below the lines.
Forests 13 02063 g014
Figure 15. Point occurrence map of Ficus populifolia in the Arabian Peninsula based on field observations and literature, generated by the GeoCAT software [48].
Forests 13 02063 g015
Table 1. Features of Ficus populifolia Vahl. plastome.
FeatureF. populifoliaFeatureF. populifolia
Plastome size (bp)160,610T (U) %32.44
Inverted repeat (IR) region (bp)25,892C %18.22
Large single-copy (LSC) region (bp)88,729A %31.70
Small single-copy (SSC) region (bp)20,097G %17.62
Total number of genes130 (113)Overall GC content %35.84
rRNA8 (4)GC content in LSC %33.47
tRNA37 (30)GC content in SSC %28.91
Protein-coding genes85 (79)GC content in IR %42.58
The number of unique genes is shown in parentheses.
Table 2. List of the intron-containing genes in the plastome of Ficus populifolia along with the lengths of their introns and exons.
GeneLocationExon I
(bp)
Entron I
(bp)
Exon II
(bp)
Entron II
(bp)
Exon III
(bp)
rps16LSC22991039
atpFLSC409770144
rpoC1LSC1616806431
ycf3LSC123785229752152
ndhKLSC600740
clpPLSC70903291701263
petBLSC5803641
petDLSC7736474
rpl16LSC81071398
rpI2IR390676433
ndhBIR755676594
rps12IR25537231
ndhASSC5401173550
trnK-UUULSC34258836
trnG-UCCLSC2272247
trnL-UAALSC3650149
trnV-UACLSC3661936
trnI-GAUIR34946117
trnA-UGCIR3780345
Publisher’s Note: MDPI stays neutral with regard to jurisdictional claims in published maps and institutional affiliations.

