Article

Chances and Limitations of Mixed Oak Regeneration under Continuous Canopy Cover—Evidence from Long-Term Observations

1
Chair of Forest Growth and Yield Science, Technical University of Munich, Hans-Carl-von-Carlowitz-Platz 2, D-85354 Freising, Germany
2
Bavarian State Institute of Forestry, Hans-Carl-von-Carlowitz-Platz 1, D-85354 Freising, Germany
*
Author to whom correspondence should be addressed.
Forests 2022, 13(12), 2052; https://doi.org/10.3390/f13122052
Submission received: 29 September 2022 / Revised: 25 November 2022 / Accepted: 30 November 2022 / Published: 2 December 2022
(This article belongs to the Special Issue Climate Change Effect on Mixed-Species Forest Management)

Abstract

:
Traditionally, due to its light ecology, oak is regenerated on clear cuts or areas where the crown coverage is heavily reduced. Thus, the regeneration phase is relatively short. Recently, selective long-term regeneration phases avoiding large gaps in the canopy but fostering mixed-species stands have been advocated as being more in keeping with close-to-nature forestry in Central European forests. However, examples of the successful regeneration of oak in mixtures following this type of regeneration are largely missing. Here, we report the results of long-term experiments located in three different forest types, where oak was long-term regenerated under different mixing and canopy cover situations. The observation periods reached from 26 to 36 years. We focused on the dynamics of stem number reduction, as well as the height and biomass development of oaks and their interaction with interspecific competition and canopy density. The probability of oaks occurring in the regeneration basically decreased over the duration of the regeneration period. Despite this, considerable regeneration biomass growth could be observed, especially in the case of the lower standing volume of the mature stand. The development of beech as the main competitor is scarcely slowed down by the canopy cover compared to oak. Increasing canopy cover noticeably impeded oak regeneration in the considered mixed stands. The model results suggest that a reduction in competition within the regeneration by lowering the proportion of beech below 30% enhanced the success of oak regeneration in the long run even in small patches. The productivity of the remaining stand was primarily driven by standing volume. However, a negative trend of its productivity emerged with high regeneration biomasses. The study results show that small-scale oak regeneration with prolonged regeneration duration is possible in principle. However, oak regeneration requires active and continuous silvicultural assistance, which has to be adjusted to the specific site conditions.

1. Introduction

Sessile (Quercus petraea (Matt.) Liebl) and pedunculate (Quercus robur L.) oaks are two of the most widespread native broadleaved tree species in Central Europe [1] and are expected to be suitable for coping with the predicted climatic changes in the future [2,3,4]. Based on their broad ecological amplitude and high drought tolerance, they can be an important component of climate-resilient mixed species forests [5,6], which are considered as an option to meet the challenges of climate change [7,8,9,10].
Furthermore, the genus oak, with its large species abundance [11,12], enhances forest biodiversity, which has recently become an increasingly important management goal [13,14,15]. More generally, both oak species seem to be suitable for multifunctional forest management [14,16], including valuable wood production as one major management goal of oak silviculture [17,18,19]. Frequently, oak is either simultaneously or at a later stage underplanted with more shade-tolerant tree species, such as European beech (Fagus sylvatica L.) or hornbeam (Carpinus betulus L.), which are commonly used as serving trees to ensure high-quality oak wood production [17,18].
However, in addition to the multitude of positive characteristics that oak species provide as a component of multifunctional forest management [14], they require silvicultural assistance on most sites due to more competitive admixed tree species [20,21]. Thus, their current occurrence in temperate forests in Central Europe is strongly dependent on the past human land use systems and forest management practices [18,22,23,24]. Furthermore, both oak species occur naturally as dominant tree species primarily in their own ecological niches, in stands with extreme or distinctive site conditions [20].
One decisive component of an appropriate future oak participation in mature mixed stands is determined by the type of regeneration. So far, due to the comparatively high light requirements of oaks compared to those of admixed tree species, stand establishment has usually been carried out with large crown openings combined with short- to mid-term regeneration periods [18,25]. Consequently, in recent years, these large-scale shelterwood and clearcutting systems have also been increasingly criticized in the course of oak management [26,27].
In particular, in the course of close-to-nature silviculture clear cuts should be largely avoided [28,29]. In addition, other core principles of close-to-nature silviculture are the promotion of site-adapted tree species, the establishment of structured mixed stands, and the promotion of natural regeneration [30]. These principles can be implemented in practice, especially by using single-tree selection, group selection, or shelterwood systems [28]. However, the utilization of natural processes, as a core element of close-to-nature silviculture in particular, puts native oaks at an additional disadvantage compared to their mostly more shade-tolerant admixed tree species [18,23,31,32]. This appears to further weaken oaks in their relative competitive strength on many sites, often resulting in a decline in vitality or loss of oaks in young and mature stands.
In this context, previous studies particularly addressed light availability and its effect on the success of oak regeneration [18,33,34,35]. Lüpke [18] suggested the need for at least 15% of full light for survival and 40% for the optimal height growth of oak. Furthermore, the light requirements of oaks were higher in the later development stages [33,36], which indicates continuous silvicultural interferences in the canopy cover. However, Ligot et al. [34] demonstrated that beech outperformed oak throughout the light gradient and concluded that silvicultural control of the canopy cover is not sufficient in mixed oak and beech regenerations. Consequently, to keep survival rates high the management of mixed oak regenerations has to consider competing woody species [37,38] and ground vegetation [39,40,41].
Most studies cover short- to mid-term regeneration periods. Long-term studies for oak that cover regeneration periods of up to 20 years and longer are scarcely available [33,38]. However, prolonged regeneration after the first years of successful stand initiation is often decisive for future tree species composition and wood quality in the mature stand. This is especially true for close-to-nature silviculture and long regeneration periods of 30 years or more. In addition, the results of the studies are often limited to specific site conditions and cannot be readily applied to other stand situations or site conditions [38].
The objective of this study is to assess the success and constraints of the regeneration of oak established in mixtures under continuous canopy cover. In detail, we first analyze the survival probability of oaks over time and hypothesize that survival is dependent on the forest site. Secondly, we evaluate the course of species-specific regenerated tree density and biomass. Here, we test the hypothesis that the development of density and biomass is species-specific and modified by the degree of canopy cover. In the next step, we quantify the height growth rates of oaks to answer the hypothesis that the height growth of oaks is negatively influenced by canopy cover and interspecific competition. Lastly, we analyze the effect of advanced regeneration on the productivity of the remaining stand following the hypothesis that high rates of regeneration biomass reduce the productivity of the remaining stand. From the result, we deduce the silvicultural recommendations for the successful regeneration of oaks within continuous cover forestry.
We make use of experimental plots where regeneration has been monitored and measured for up to 36 years. The experimental plots have been established in monospecific pine and mixed oak stands. The regeneration was initiated by planting in the case of the pine stands. In the mixed oak stands, the crown cover was reduced selectively over the existing natural regeneration. Following the aforementioned objectives, the study focused on four main questions:
i.
What are the survival probabilities of oak in small-scale and long-term regenerated stands and do they differ between different forest types?
ii.
What is the long-term development of the regenerated tree species’ density and the effect of canopy cover on regeneration biomass?
iii.
How does canopy cover and interspecific competition modify the heights of regenerated oaks?
iv.
Is there a feedback effect of advanced regeneration on the productivity of the mature stand?

2. Materials and Methods

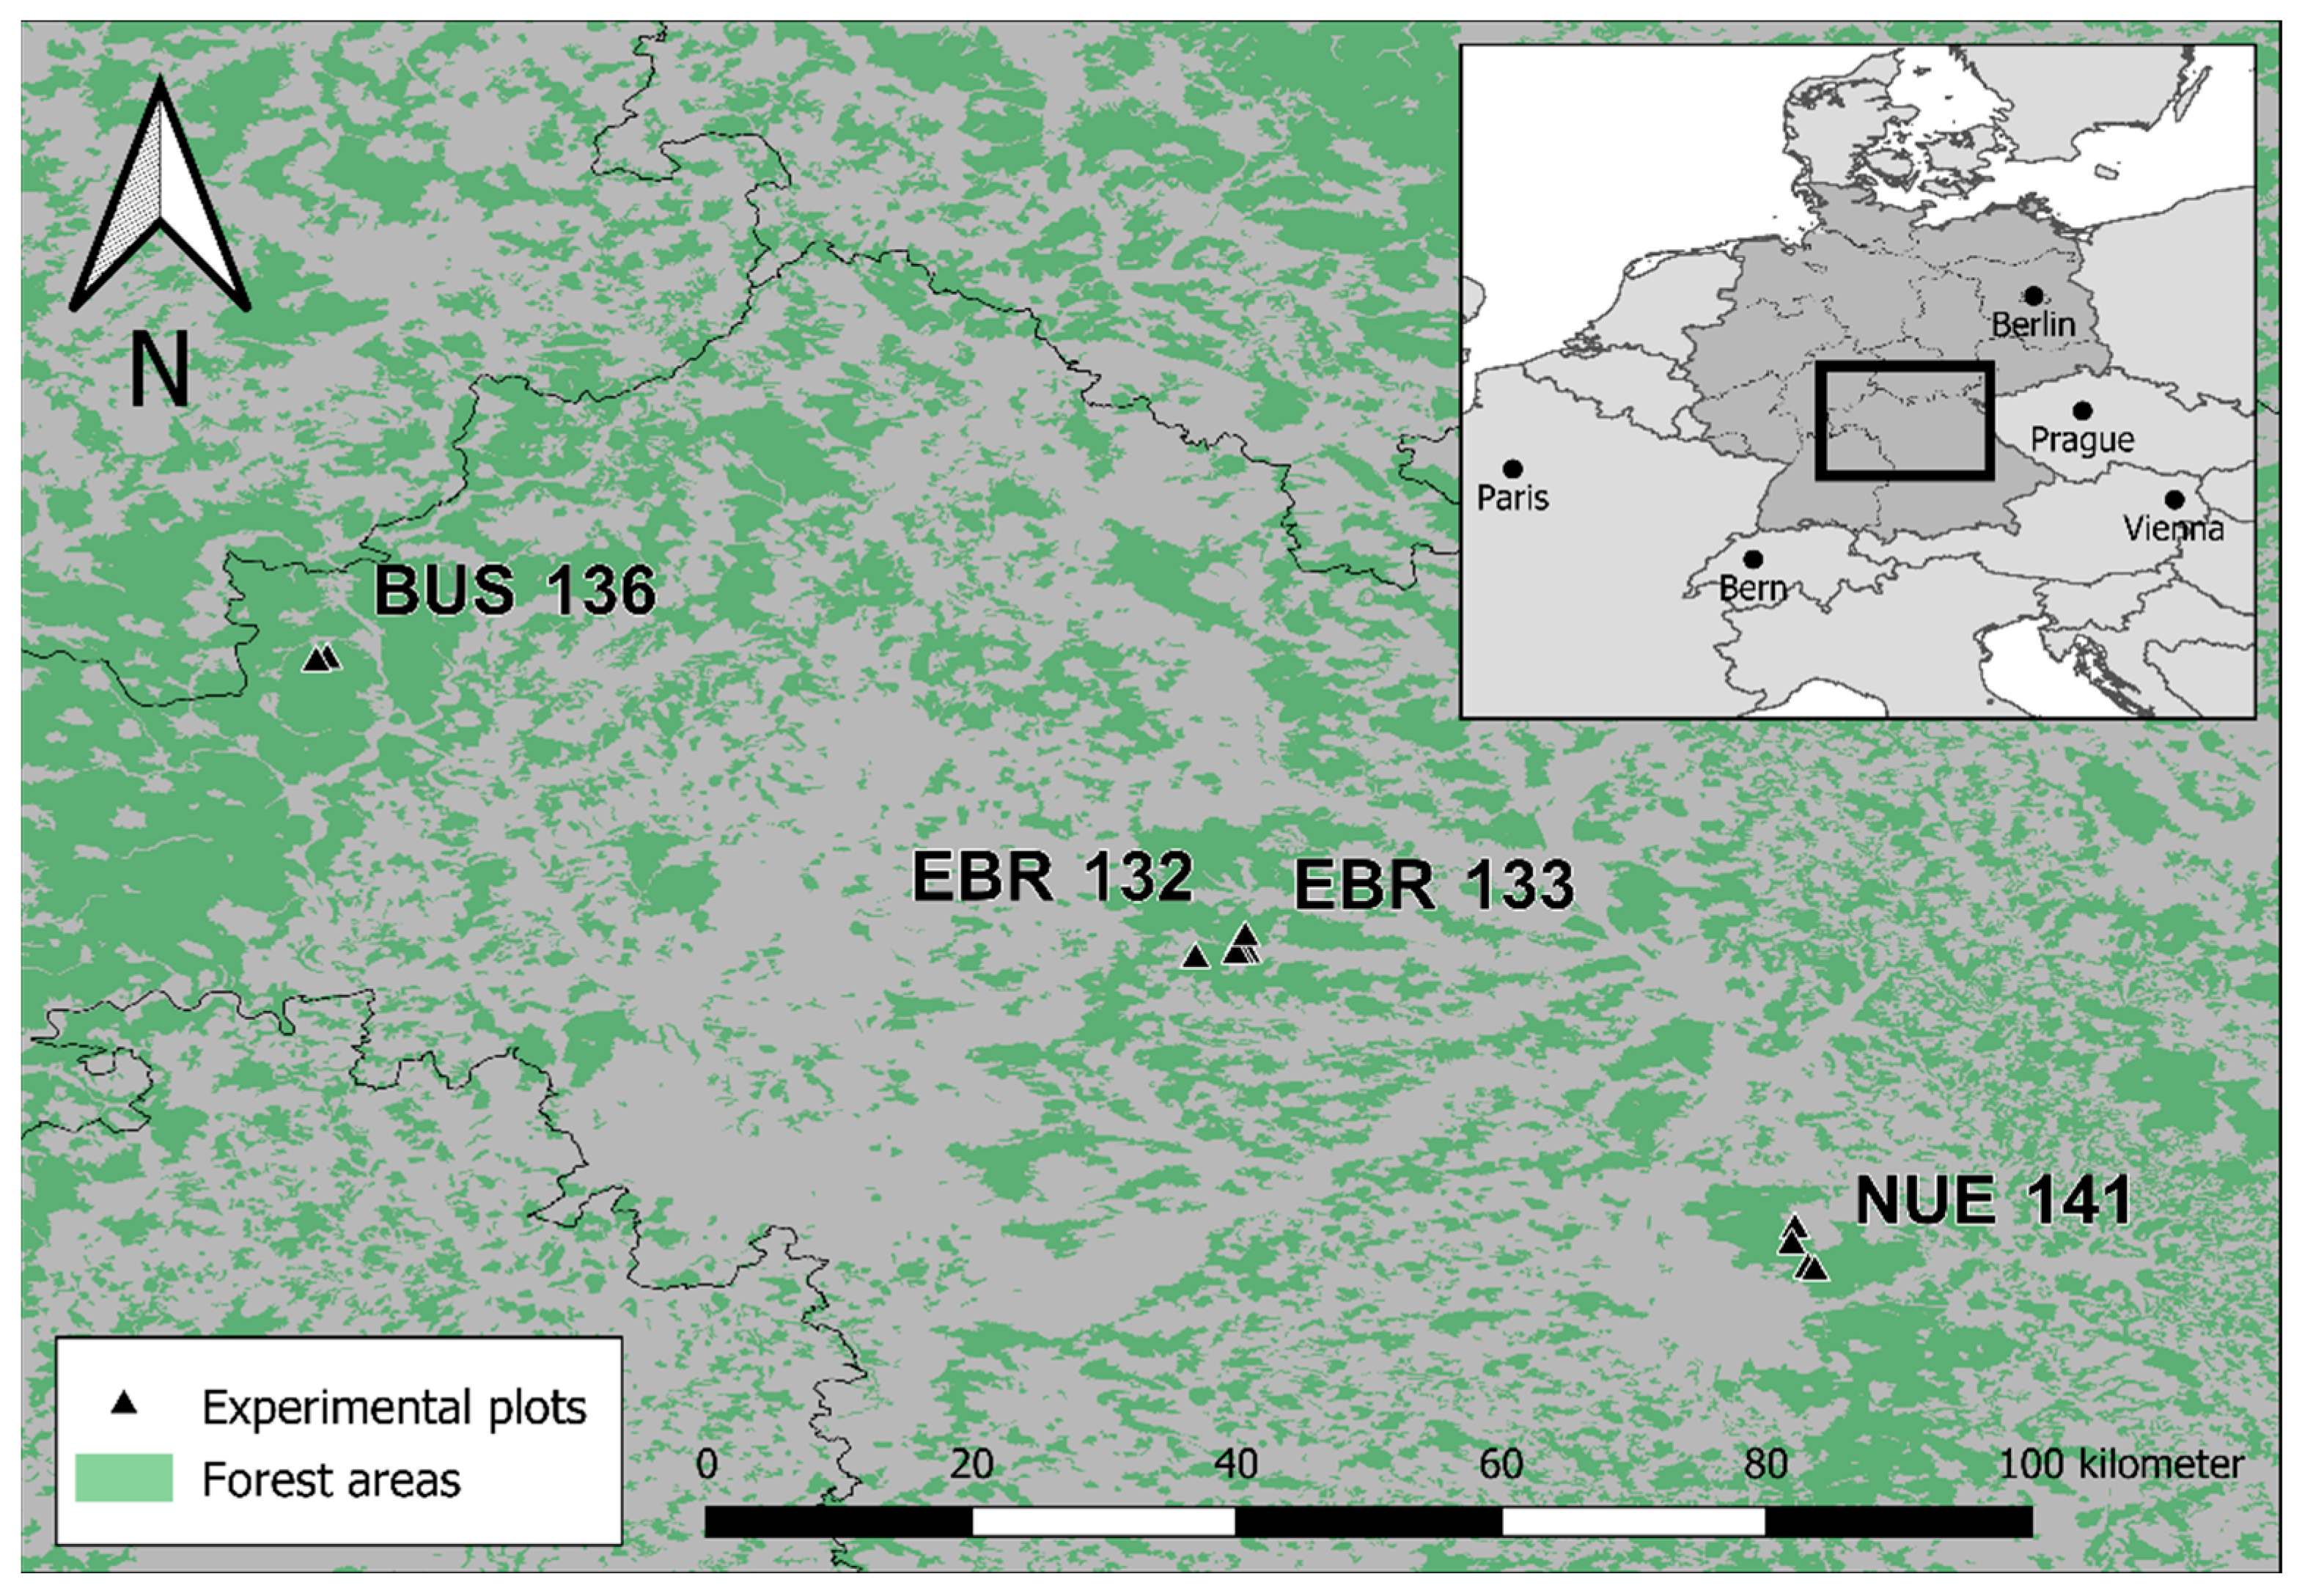
2.1. Long-Term Experiments

We used the data of 12 regenerated experimental plots, each located in a different stand; they are a part of four long-term experiments in southern and central Germany (Figure 1). The size of the individual experimental plots varies between 0.1 and 1.0 ha. The investigated stands are located in three different woodland regions and sites, namely Spessart, Steigerwald, and Nuremberg, which are further referred to using their experiment codes BUS, EBR, and NUE, respectively. The stands represent mixed oak and monospecific Scots pine stands. The mixed mature stands are composed of sessile oak and European beech in the case of BUS and sessile oak and European beech and Scots pine (Pinus sylvestris L.) in the case of EBR (Table 1); these are denoted as oak, beech, and pine in the following. The mixed stands in BUS and EBR were mainly regenerated naturally; the planting of oaks occurred only marginally. In contrast, the monospecific pine stands in the Nuremberg region were regenerated by sowing and underplanting oak and beech, respectively. The experimental plots were established to test the different overstorey stand densities and their effect on regeneration by applying single-tree and group selection systems. The considered stands cover a broad range of small-scale canopy gaps, from approximately 0.01 to 0.25 ha, and different light situations.
The first measurements of the experimental plots were carried out between 1982 and 1991. In total, the mature stands and their respective regeneration have been measured three times since then. Thus, a unique database on the development of oak regeneration under different conditions covering a 36-year regeneration period was established.

2.2. Yield Data of the Mature Stand

To quantify wood volume V (m3 ha−1), stand basal area BA (m2 ha−1), dominant tree diameter D100 (cm), dominant height H100 (m), and the periodic annual basal area and wood volume increment PAIBA (m2 ha−1 yr−1), as well as PAIV (m3 ha−1 yr−1), respectively, the DESER-standards [42] were applied. The stand basal area BA and standing wood volume V at the beginning of the measurements ranged from 5.1 to 28.7 m2 ha−1 and from 83.5 to 428.5 m3 ha−1. The respective periodic annual basal area and volume increment varied from 0.1 to 0.2 m2 ha−1 yr−1 and 1.0 to 5.2 m3 ha−1 yr−1 (Table 2).
In addition, the canopy cover CC (%) was calculated for all the surveys. Based on 8 measurements per tree crown, the maps were plotted with crown shape approximations by cubic splines. From this, the corresponding area covered by tree crowns was calculated for the total stand and the regeneration squares (see Section 2.3), respectively. The canopy cover varied from 22 to 77% in the first survey and from 9 to 57% in the last survey (Table 2).

2.3. Regeneration Data

The regeneration on each experimental plot was fully inventoried three times using a grid of 5 × 5 m squares. Thus, the data of 1 916 squares were obtained per survey, making 5748 in total. Of these, 4112, 1200, and 432 were located in EBR, BUS, and NUE, respectively. A total of 482,012 saplings (trees) or 275,300 oaks were recorded during the regeneration surveys. For the analyses, the regeneration data, tree height, and biomass were aggregated and summarized by each square, survey, and tree species. In addition to the most abundant tree species, oak, beech, hornbeam, and pine, all the other occurring tree species were summarized under the term “Others” (Table S1). All occurring regeneration plants were recorded. Saplings smaller than 2 m were assigned to 4 height classes (0–50 cm, 51–100 cm, 101–150 cm, 151–200 cm). Additionally, for plants taller than 2 m, the diameter at breast height (dbh) was measured. For saplings taller than 1.3 m and smaller than 2 m, the dbh were estimated as a function of the height using a logarithmic model.
The regeneration biomass was calculated for each tree using the formula of Forrester et al. [43].
ln(bm) = ln(β0) + β1ln(D) + ε
where the calculated biomass (bm) was the aboveground biomass of the individual tree in kg. D was the diameter in cm of the corresponding tree. β0 and β1 were the species-specific function parameters.
A descriptive summary of the plot and species-specific regeneration data for the first and last surveys is provided in Table 3.

2.4. Statistical Analyses

To describe the occurrence probability of oak in long-term and small-scale regenerated stands in general (i), a logistic model was set up across all the investigated stands. Oak abundance was set as a function of the duration of the regeneration period (dur) and the corresponding experimental site (site). The predicted probability was based on the occurrence of oaks in the respective regeneration square. Each square was categorized by the binary variable as either 1 (oak occurs) or 0 (oak does not occur).
logit[E(Yijk|durik, sitei)]=
pijk/1 − pijk = a0 + a1 durik + a2 sitei + bi + bij + εijk
Indices i, j, and k denoted the plot, the regeneration square, and the survey, respectively. a0, a1, and a2 represented the estimated fixed effects parameters. With the regeneration squares lying next to each other and repeatedly recorded, the corresponding random effects were bi and bij, to account for the spatial and temporal autocorrelation. εijk are i.i.d. errors (εijk~N(0; σ 3 2 ).
To answer the further research questions (ii–iv), linear mixed effects models were set up to account for the potential autocorrelation due to the assumed spatial and temporal dependencies, as described above [44]. In each case, the models were adjusted for the individual experimental site. The respective models with the considered interactions between the covariates were determined by the research questions and applied equally for each experimental site.
First, the regeneration density (d) was estimated for each species as a function of regeneration age, as described by the following model function.
ln(dijk) = a0 + a1 × ln(A) + a2 × S + a3 × (ln(A) × S) + bi + bij + εijk
where A is the respective regeneration age and S is the regenerated tree species. The corresponding random effects were bi and bij, to account for the spatial and temporal autocorrelation. εijk are i.i.d. errors (εijk~N(0; σ 3 2 ).
Second, the regeneration biomass (bm) was set as a function of regeneration age and canopy cover (CC), as described by the following adjusted model function.
ln(bmijk) = a0 + a1 × ln(A) + a2 × S + a3 × CC + a4 × (S × CC) + bi + bij + εijk
Third, the maximum heights (h) were estimated using the extended model, which additionally accounted for the interspecific competition within the regeneration. Therefore, the proportion of the admixed tree species, which was in all cases primarily constituted by beech, was additionally included in the model (BE_perc). The following model was set up:
ln(hijk) = a0 + a1 × ln(A) + a2 × S + a3 × CC + a4 × BE_perc + a5 × (S × CC) + a6 × (S × BE_perc) + bi + bij + εijk
To describe the effect of the regeneration biomass on the productivity of the overstorey (PAIV), the periodic annual increment was estimated as a function of the standing volume and the total regeneration biomass on a plot level.
ln(PAIVik) = a0 + a1 × ln(Vik) + a2 × bm_regik + a3 × (ln(Vik) × bm_regik) + bi + εik
Here, the independent variables were the standing volume of the overstorey (V) and the aggregated biomass of regeneration on a plot level (bm_reg). The corresponding random effect was bi, to account for temporal autocorrelation. εik are i.i.d. errors (εik~N(0; σ 2 2 ).
All statistical analyses were performed using the statistical program R and the package lme4 [45,46].

3. Results

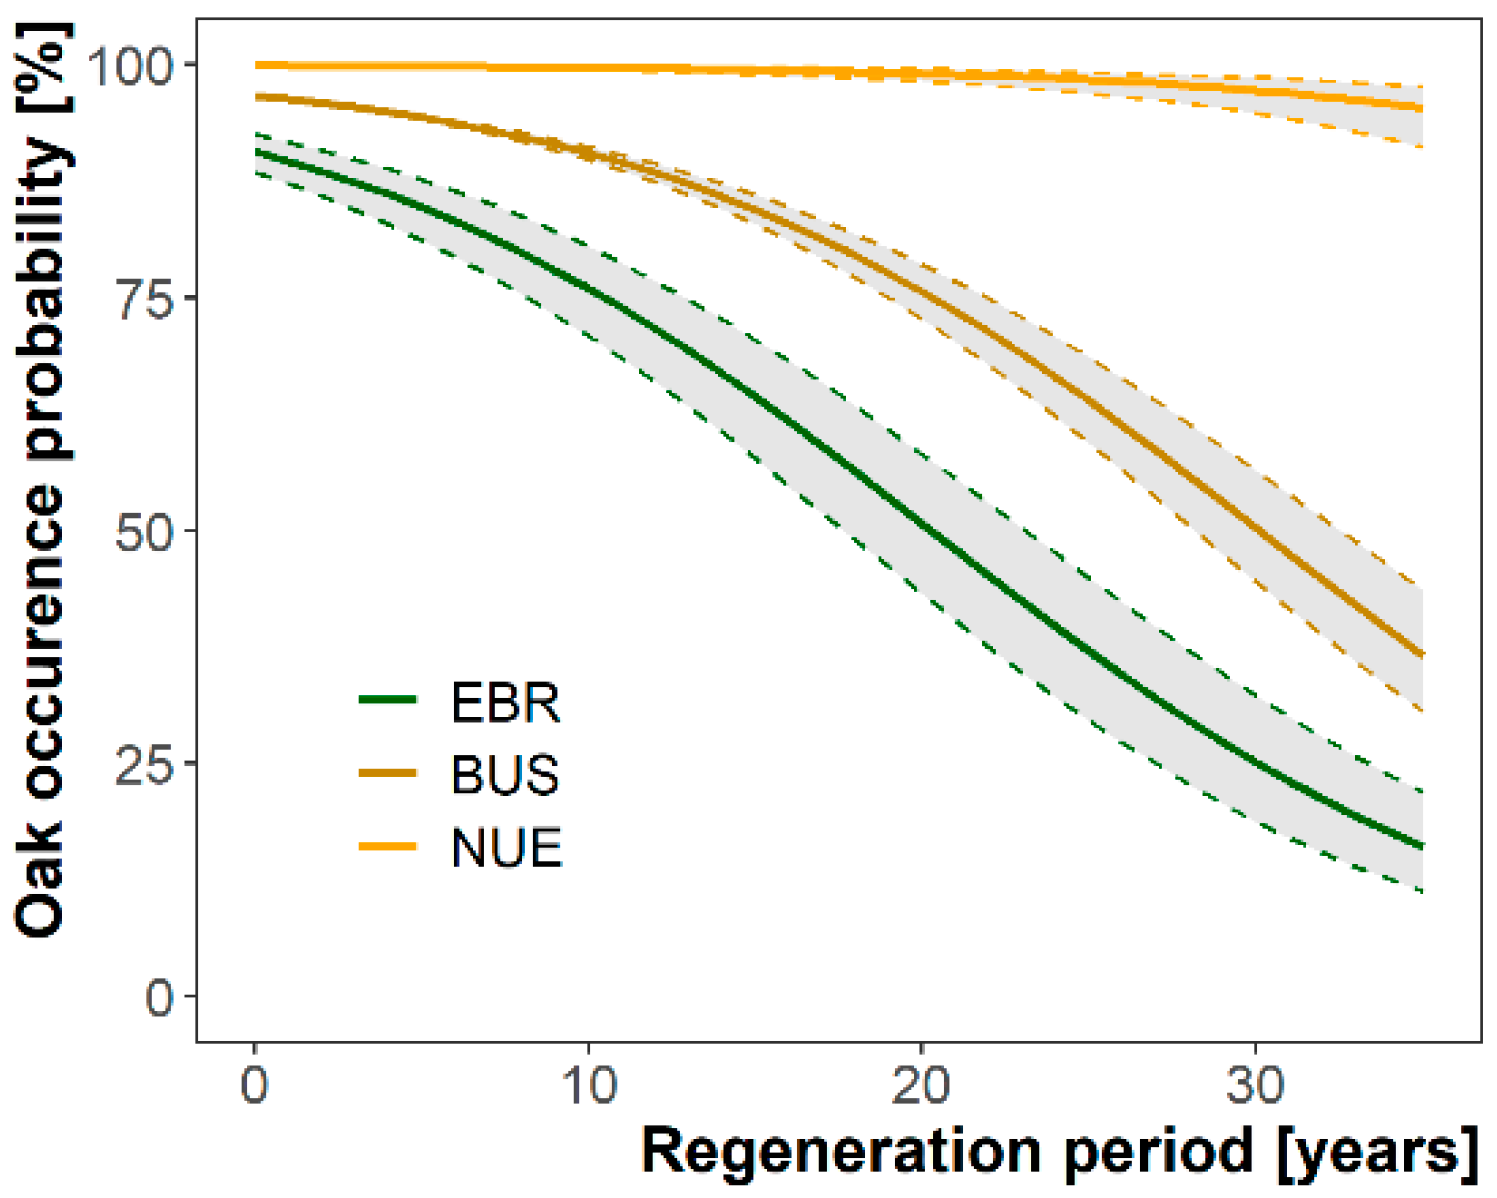
3.1. Oak Occurrence Probabilities

At the end of the observation periods, oak was present on 34%, 44%, and 71% of the regeneration squares in EBR, BUS, and NUE, respectively, which represents a decline in oak in 55%, 52%, and 29% of the squares after 36, 26, and 28 years. Correspondingly, the regeneration period had a most significant effect on oak occurrence in the considered small-scale regenerated stands. With an odds ratio (OR) of 0.89 (p < 0.001), the probability of oak presence in the regeneration decreased with the increasing regeneration period. Similarly, there were significant differences between the three forest types. The highest oak occurrence was found in the monospecific pine stands in NUE (OR = 35.44) (Figure 2). Thus, survival was much lower in the beech–oak–pine stands in EBR (OR = 0.33) (Figure 2). The reference was the oak–beech stands in BUS. Overall, in NUE, the oak presence was still high after 30 years, even in the long-term and small-scale regenerated stands. For the mixed oak stands in EBR and BUS, the estimated decrease was much earlier and more pronounced (Figure 2).

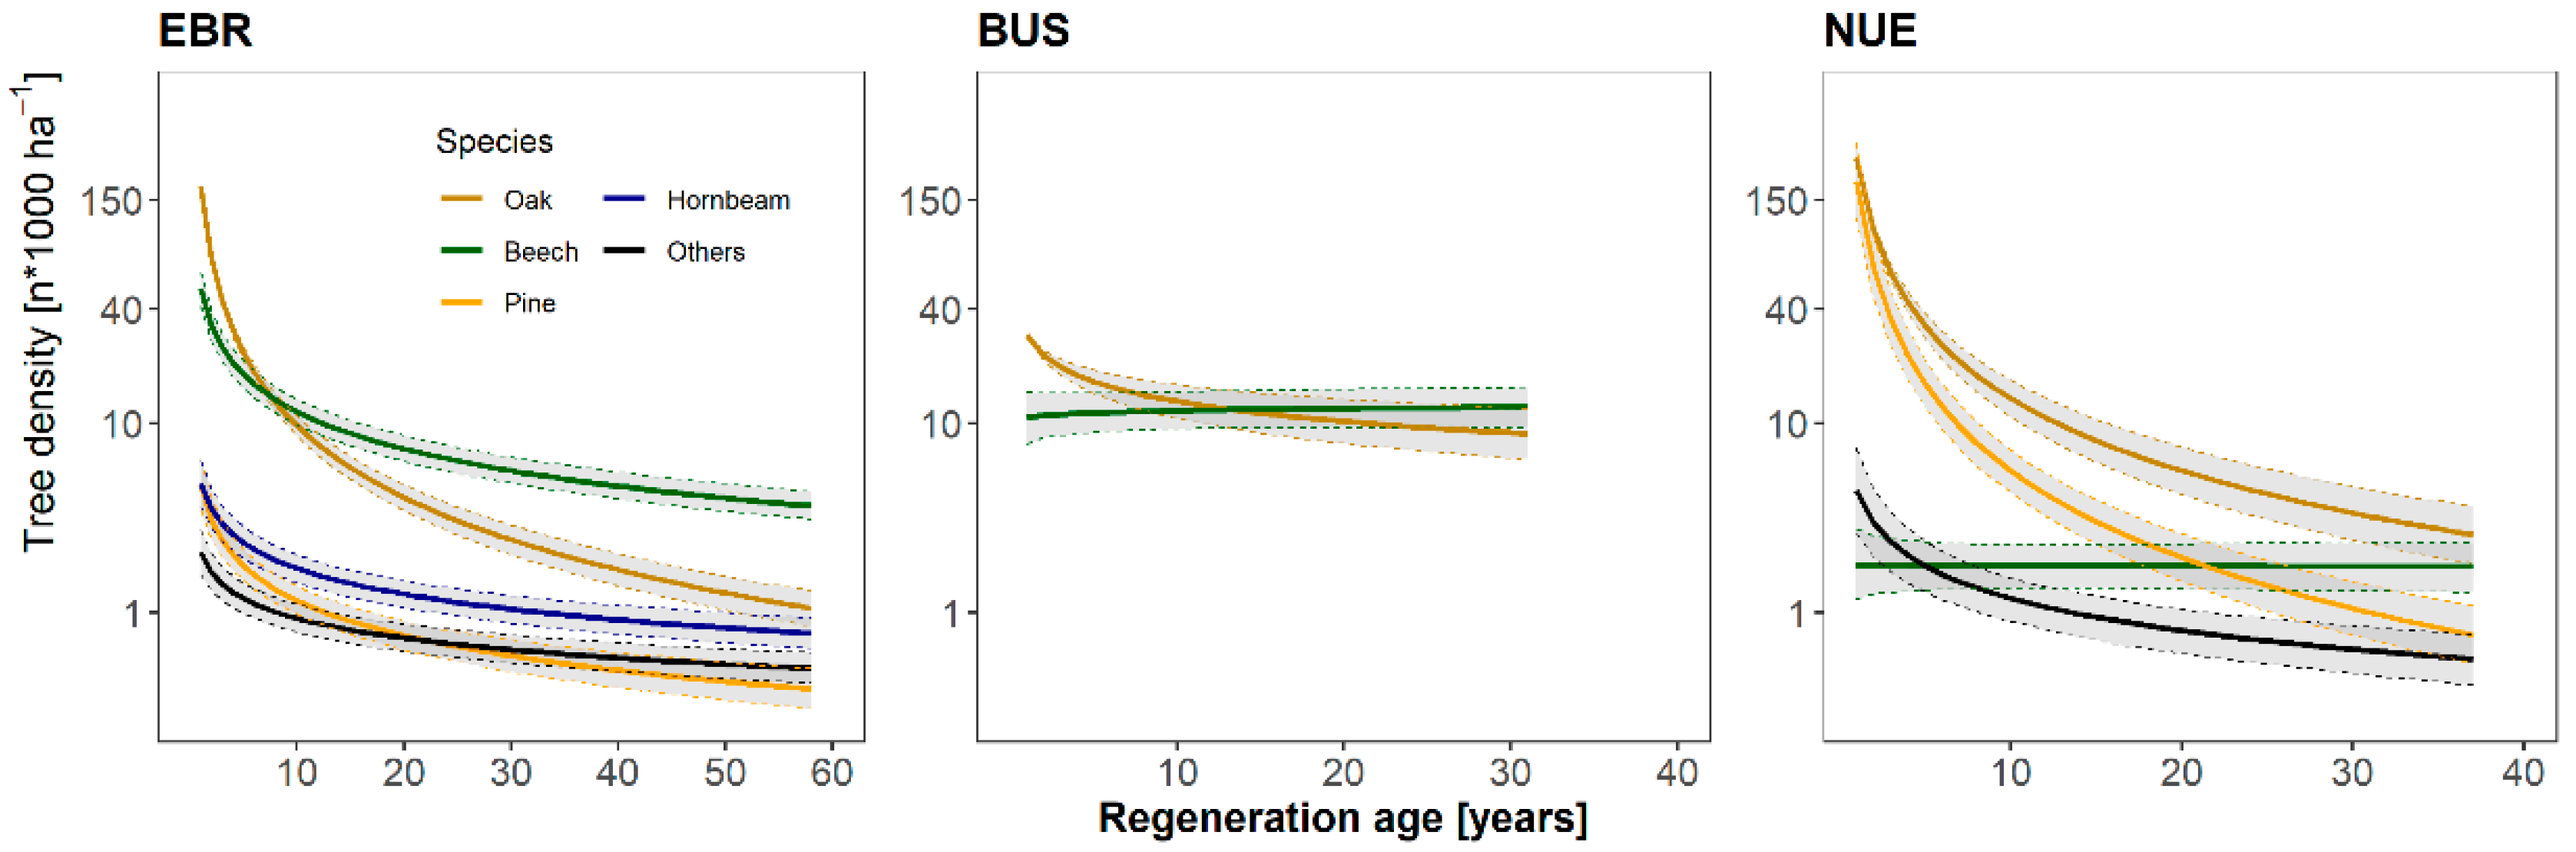
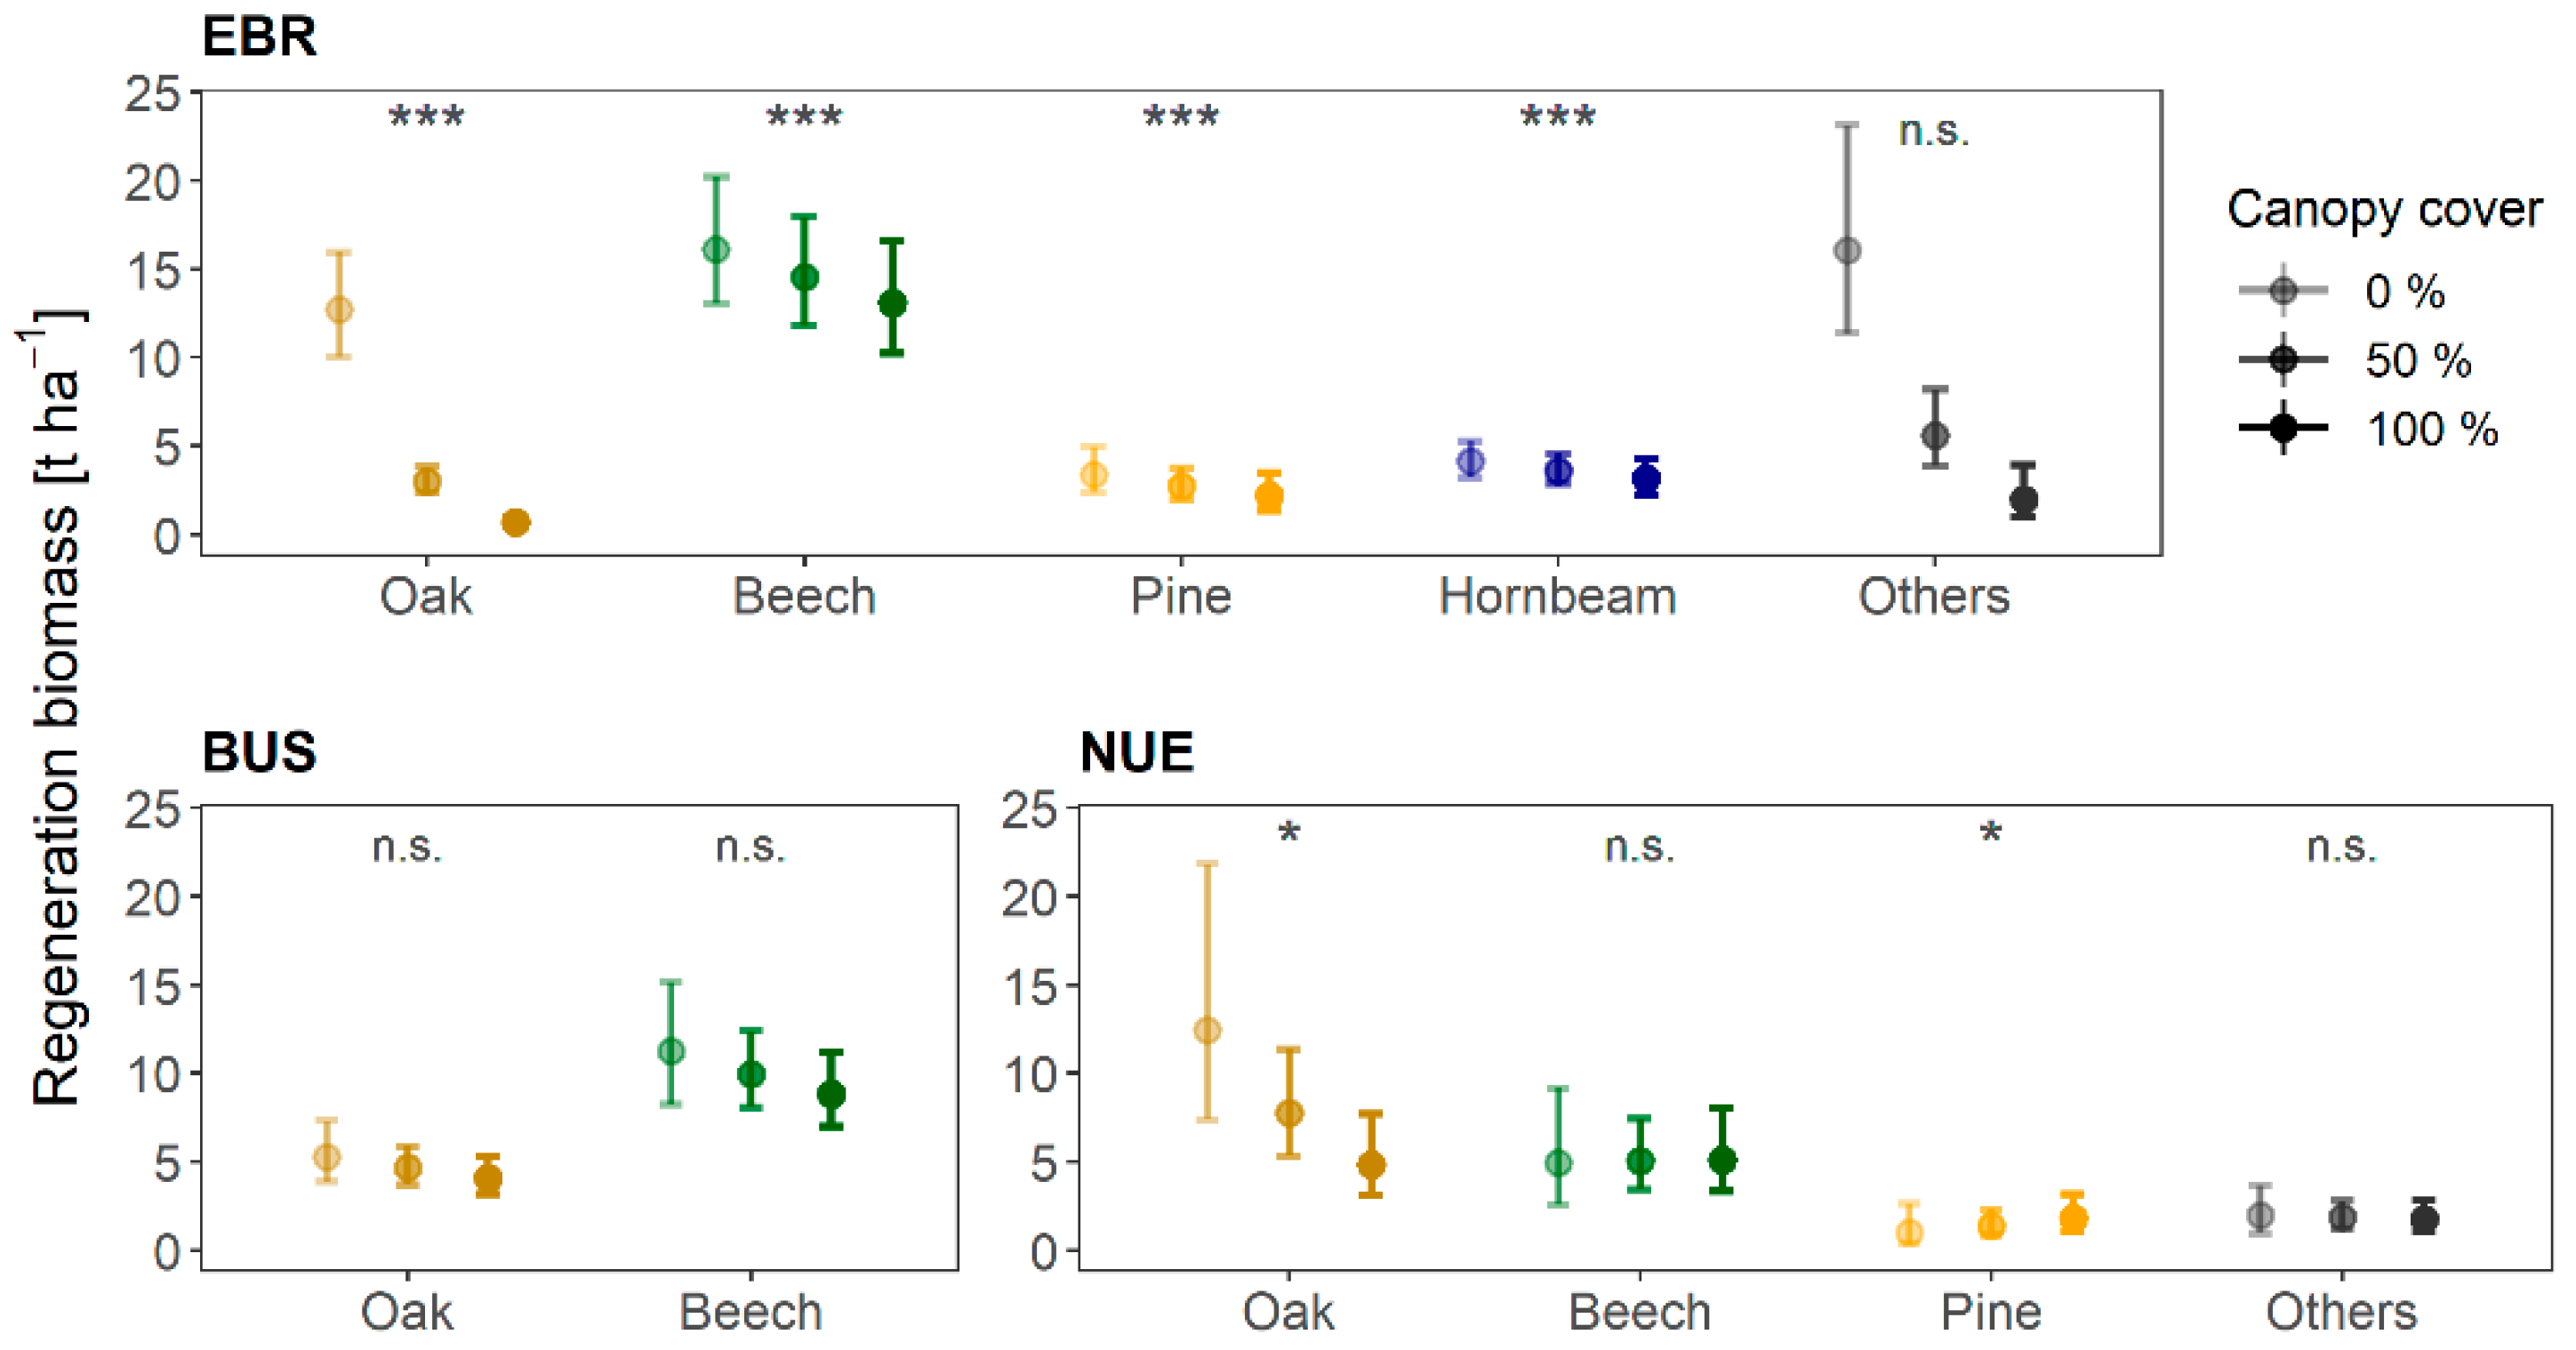
3.2. Regeneration Density and the Effect of Canopy Cover on Regeneration Biomass

The regeneration tree density decreased significantly with the duration of the regeneration period or the respective regeneration age. The estimated trajectories showed species-specific differences (Figure 3). With the exception of pine in NUE, the oak tree numbers decreased the most with age on all sites relative to all admixed tree species. The estimated coefficients were −1.26, −0.35, and −1.27 in EBR, BUS, and NUE, respectively. In contrast, the density reduction was the lowest for beech in all the investigated stands, although a slight increase was observed for beech in BUS. The reduced estimates appeared to be due to masting during the observation period (Table 4).
The biomass of the regenerated plants was affected by canopy cover. Closed canopy stand situations mostly resulted in lower regeneration biomasses. For the experimental site EBR and the oak, beech, pine, and hornbeam species, respectively, the effect was significant. In NUE, only oak biomass was significantly and negatively affected by canopy cover (Table 5). However, in BUS, the effect was not significant for either the oak or the beech species.
Accordingly, oak biomass increased by 12.1 t ha−1, 1.3 t ha−1, and 7.3 t ha−1 in EBR, BUS, and NUE, respectively, at the age of 30 from non- to fully canopied stand situations.
When there was no canopy cover, the oaks in EBR reached approximately the biomass of the beech regeneration. In BUS, however, the values of the beech biomass were not reached by oak in any canopy cover situation. In contrast, in NUE, the oak biomass exceeded the beech biomass in almost every canopy cover situation (Figure 4).

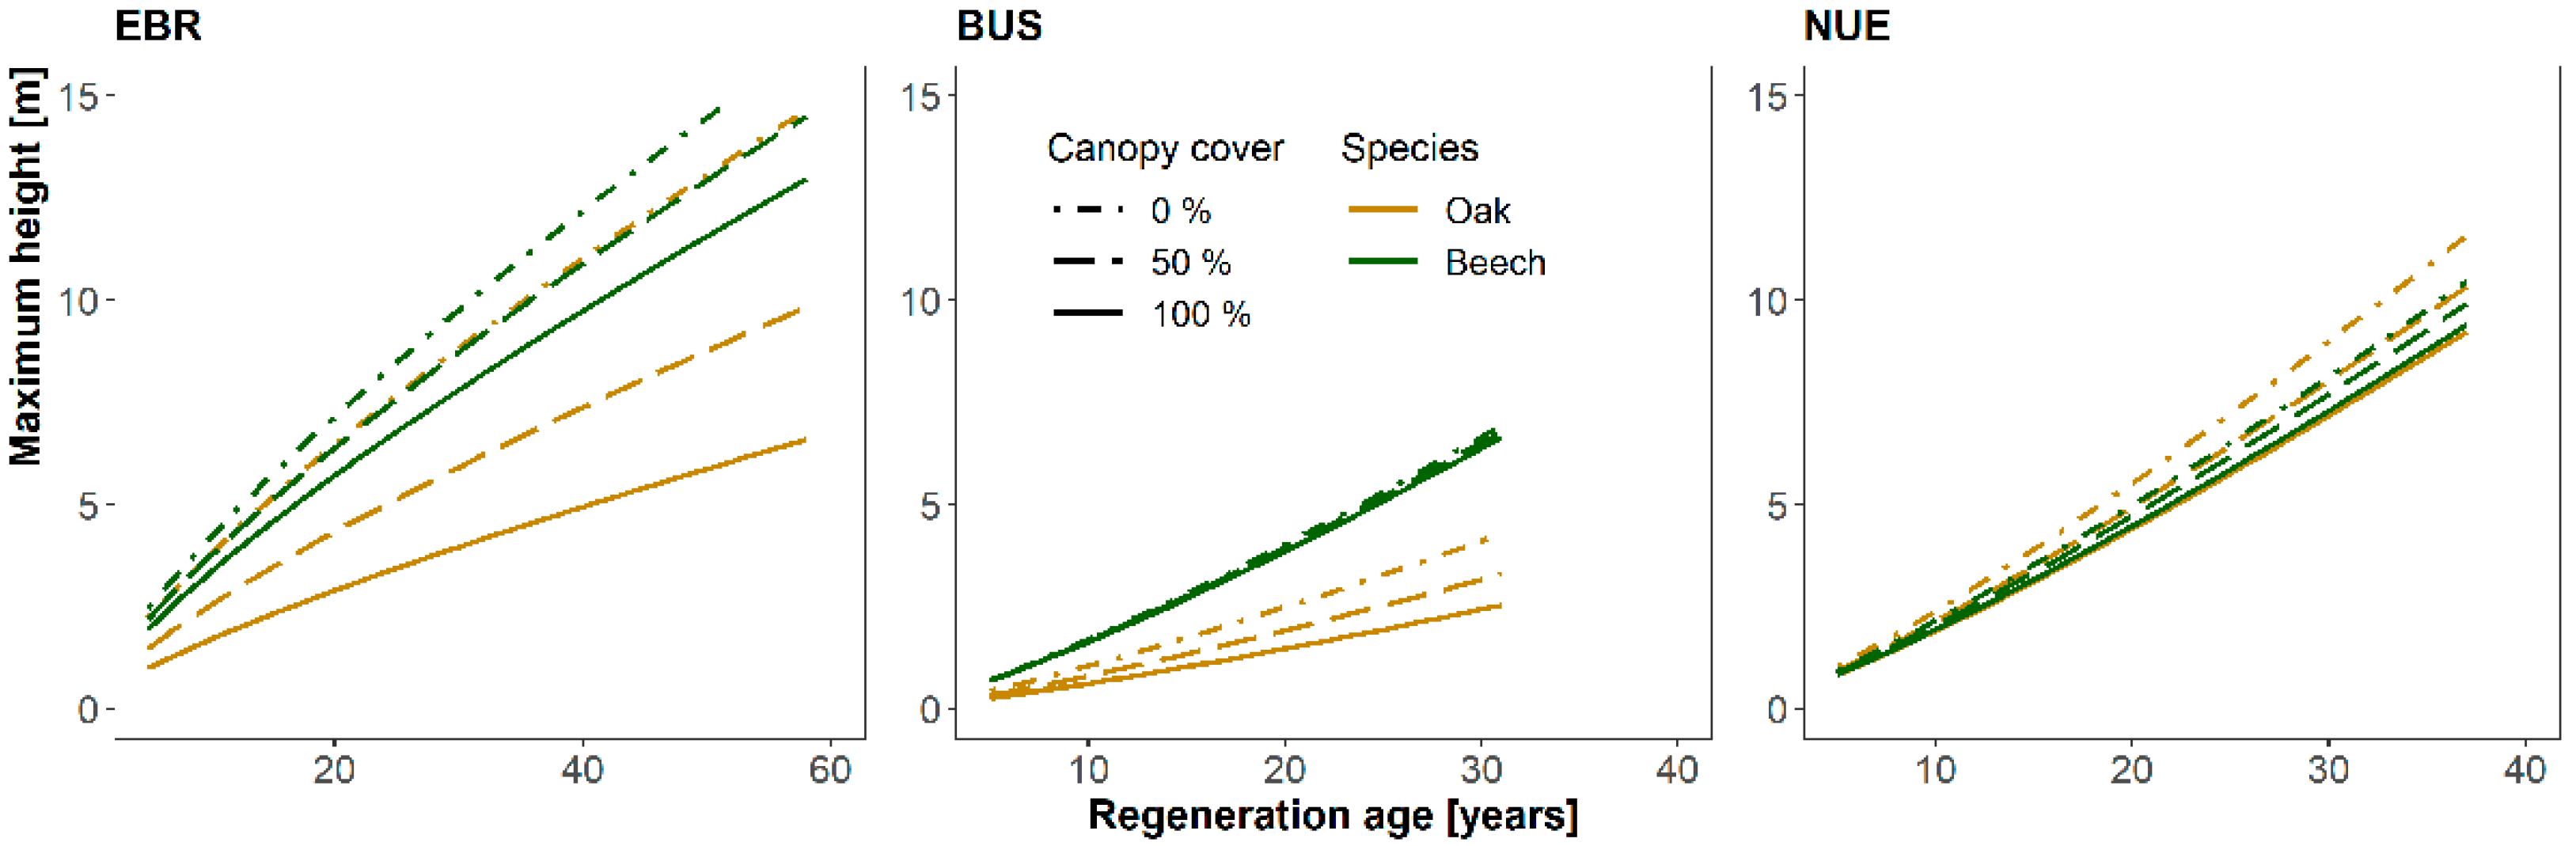
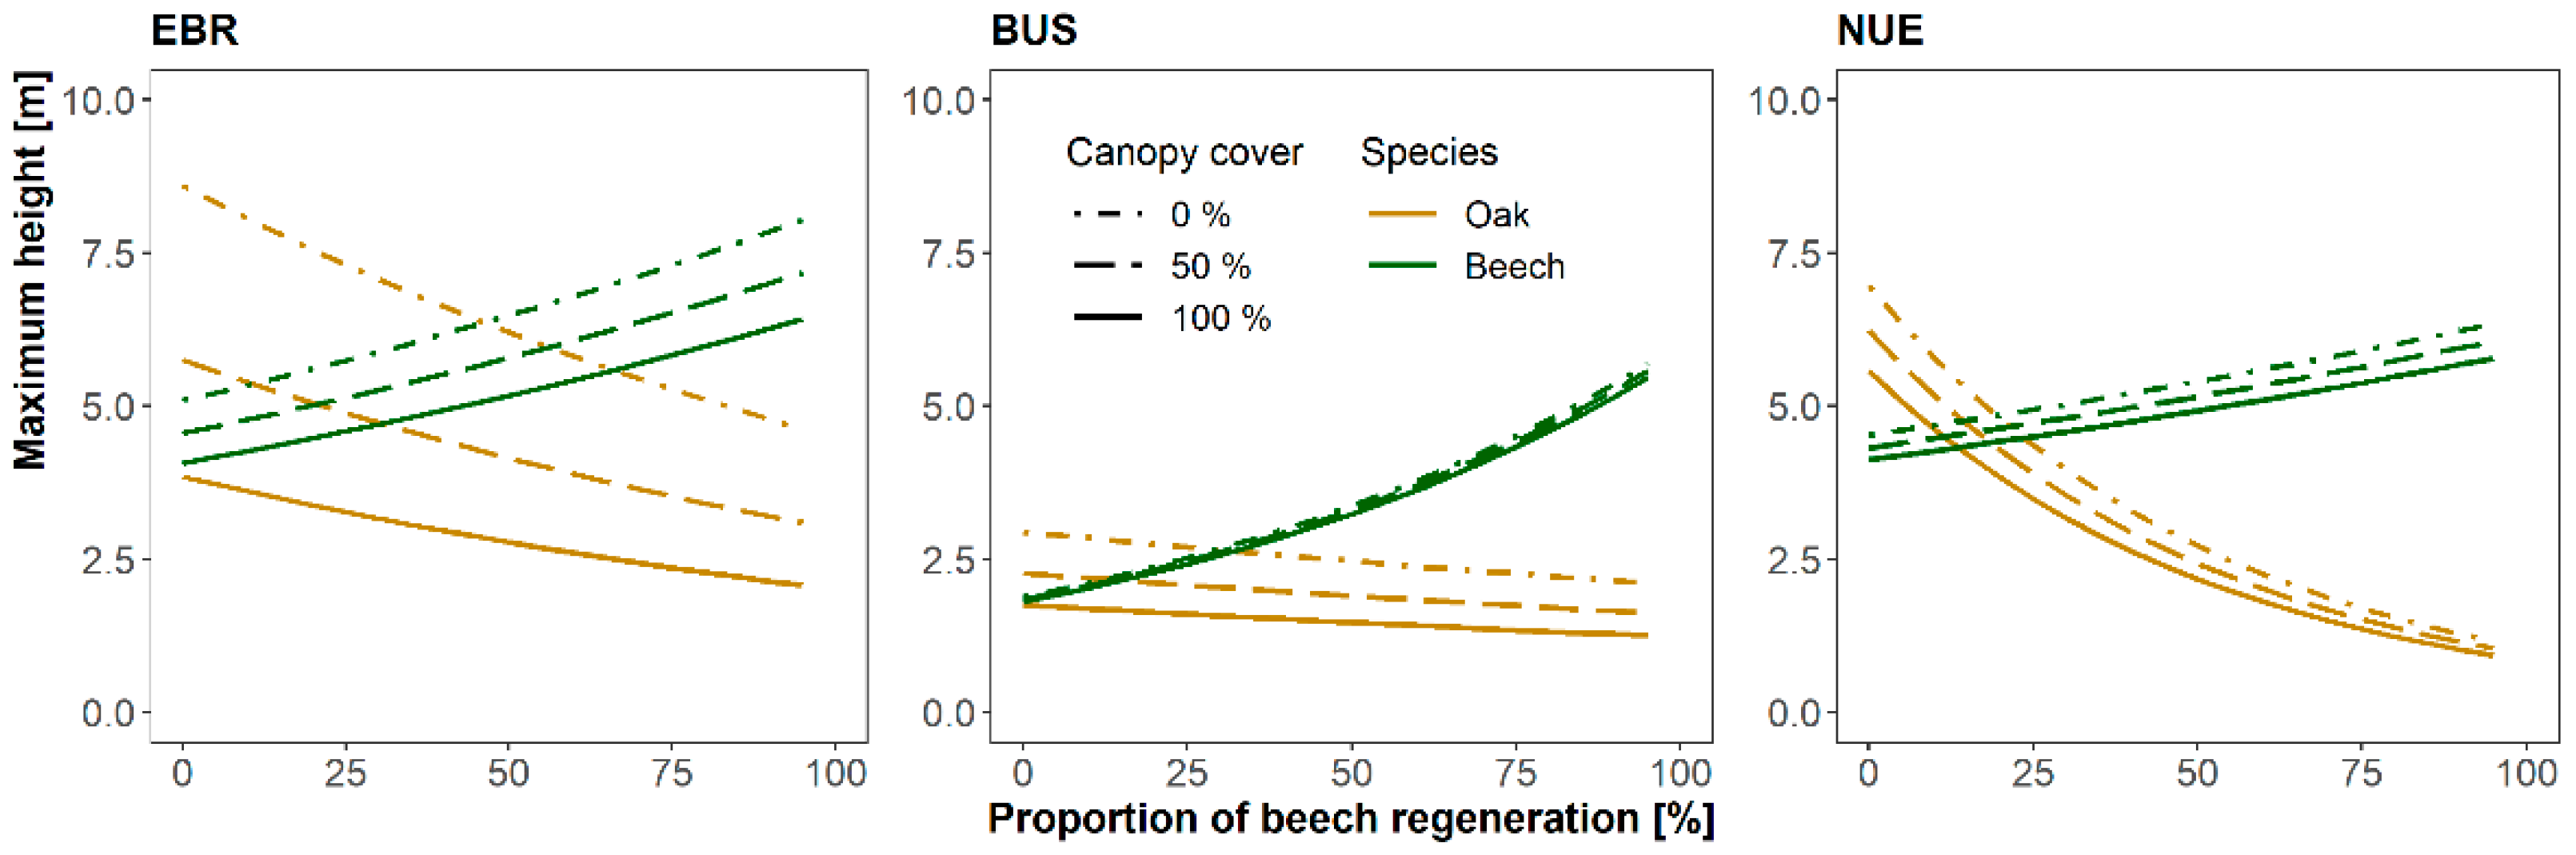
3.3. Influence of Canopy Cover and Interspecific Competition on Oaks’ Maximum Heights

In addition to the canopy cover of the old stand, the observed maximum heights of the regeneration were additionally influenced by the interspecific competition. The interspecific competition with the oak regeneration in the studied stands was almost exclusively by the admixed beech (see Figure 4); thus, the beech admixture was considered to be the competition factor (Table 6).
For the mixed stands in BUS and EBR, respectively, the effect of canopy cover was significant (Table 6). In particular, the effects were different between the considered tree species, as shown below for the oak and admixed beech (Table 6, Figure 5).
The heights of the oaks were negatively affected by the canopy cover of all the investigated stands. The estimated coefficients were −0.80, −0.50, and −0.2 for EBR, BUS, and NUE, respectively. However, in the monospecific stands, this coefficient estimate was not significant. The strongest negative effect of the canopy cover could therefore be found for the mixed stands of EBR. There, the 50% canopy cover reduced the oak heights by 33% compared to the non-canopied stand situations, which corresponds to an average reduction of 1.7 m at the regeneration age of 15 years. For BUS and NUE, the oaks were 23% and 11% smaller, respectively (Figure 5).
Consequently, the canopy cover had a stronger effect on the oak than on the beech regeneration at all the sites (Table 6, Figure 5). Assuming a canopy cover of 50% indicates that beech trees outperform oak trees at a regeneration age of 15 years by 1.5 m and 1.4 m in the mixed oak stands in BUS and EBR, respectively. Even for the stand situations without a canopy cover, a certain advantage for beech is shown for both experimental sites. A negative height relation between oak and beech is always evident.
In the monospecific pine stands (NUE), both tree species reached comparable heights, with a visible, but not significant, height advantage for oak. There, the characteristics of oak as a light-demanding tree species became more evident. A canopy cover below 60% resulted in a positive height relation with oak as compared to beech.
The canopy cover of the mature stand and the interspecific competition in the regeneration showed strong effects on the heights of the oak regeneration. Increasing the beech admixture led to decreasing heights of the neighboring oaks (Figure 6). This effect was observed across all experimental sites. For the most vigorous sites in EBR, the height relation of oak compared to beech was still positive up to a beech proportion of 47% in the non-canopied stand situations. At a canopy cover of 50%, the positive height relation could only be observed at beech proportions of 20%. In BUS, these values were 30% and 14% and in NUE 19% and 16%, respectively.

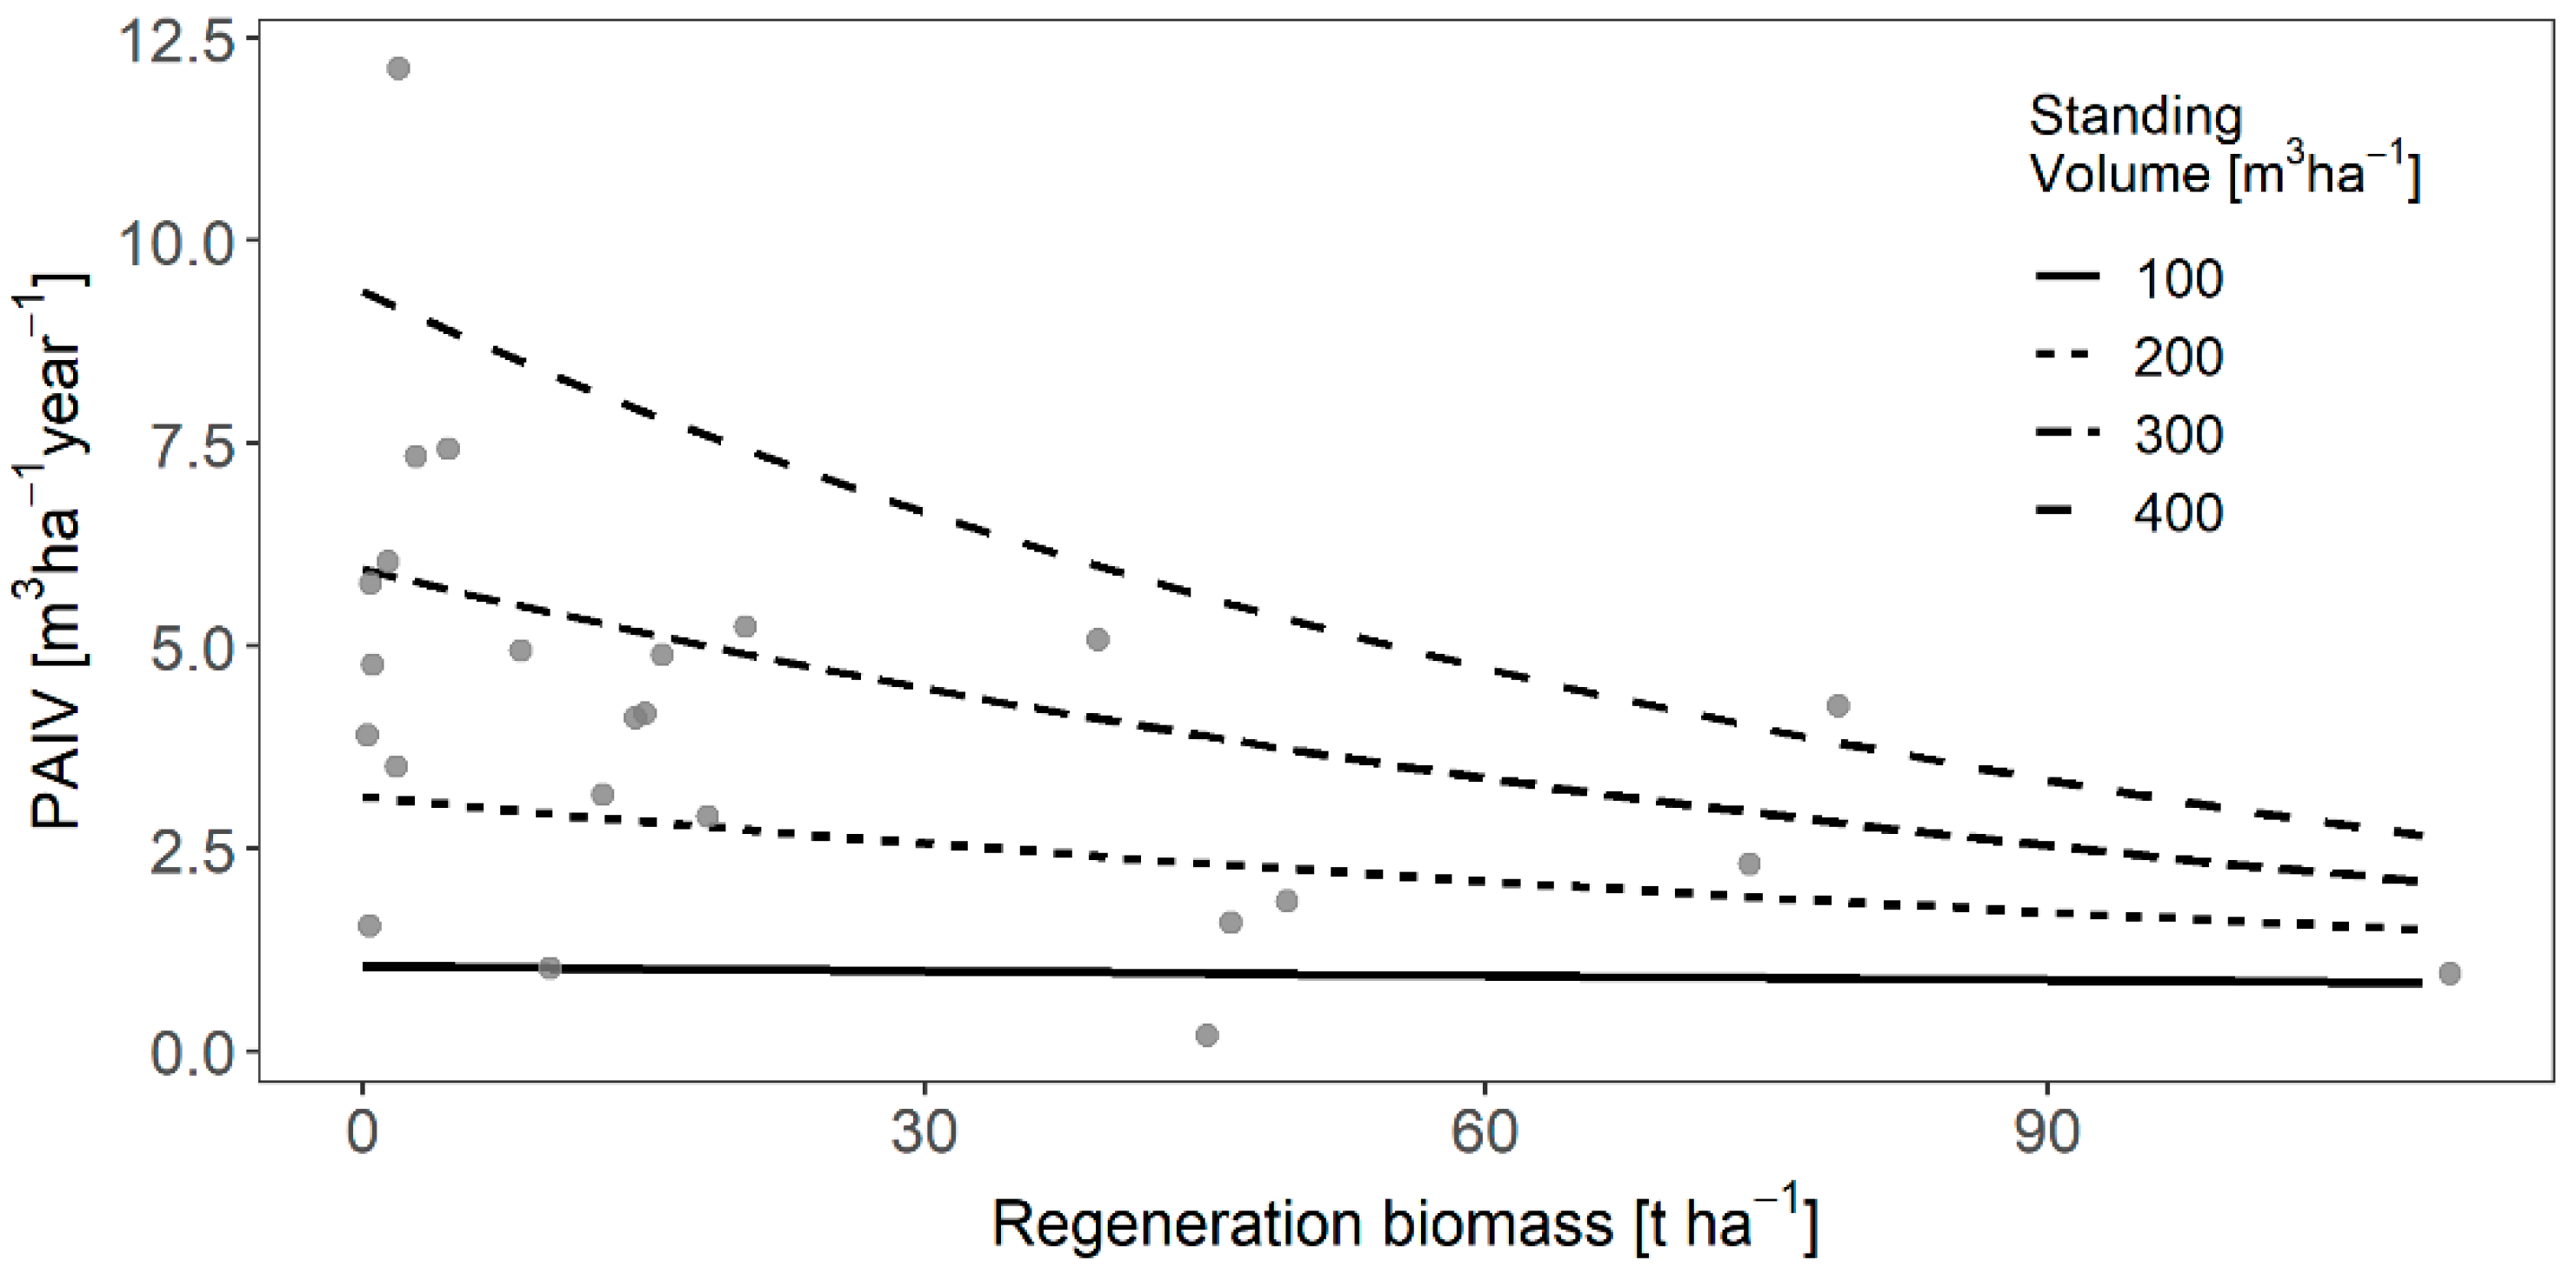
3.4. Feedback of Regeneration on Main Stand Productivity

The periodic annual increment was mainly dependent on the stand volume, which was statistically significant (Table 7). An increase in standing volume by 100 m3 ha−1 in the mature stand resulted in higher stand increments by an average of 1.8 to 2.7 m3 ha−1 year−1 (Figure 7).
The effect of the regeneration biomass was not significant. However, a negative trend was visible, which was amplified with the increasing stand volumes in the main stand (Figure 7). The periodic annual increment of the main stand seemed to decrease by an average of 23% and 40% at a regeneration biomass of 30 and 60 t ha−1, respectively. In absolute values, this corresponded to reductions in the old-growth stand increments of 1.0 and 1.8 m3 ha−1 year−1, respectively, as compared to the non-regenerated stands. This trend was more pronounced in the percentage, as well as in the absolute terms, of the stands with higher standing volumes compared to the stands with low standing volume.

4. Discussion

4.1. Valuable Insights from Long-Term Observations as Research Basis

A recent literature review [38] concluded that oak regeneration is in principle possible even in small areas, but at the same time, it noted that the underlying data for this conclusion are still very limited, especially when the long-term developments of oak regeneration are considered. With the present study, the regeneration data covering a period beyond 15 years and reaching up to 36 years could be used. To our knowledge, the present study is the only study of oak regeneration that covers an observation period of more than 25 years.
Furthermore, full surveys of stand regeneration in experimental stands of up to 1.0 ha in size are very rare. Here, a unique dataset encompassing half a million single data of regenerated trees could be used. In connection with the information available for the mature trees, the data cover a wide range of regeneration situations, i.e., gap sizes, species mixture, and canopy cover characteristics, as well as site conditions (see Section 2.1).

4.2. Long-Term Development and Survival of the Regeneration

The results showed that close-to-nature silviculture with long-term (>25 years) and small-scale (0.01–0.25 ha) regeneration methods can be one option for the regeneration of oak. However, the range of regeneration development within the stands and between sites was wide, ranging from the total loss of oak to an increase in oak proportions over the entire regeneration period (see Table 2). High percentages of oak in the regeneration at the beginning of the regeneration period favor the success of oak regeneration, but do not necessarily lead to a corresponding percentage of oak at the beginning of the stem exclusion stage (see Table 2 and Table 3). The conclusions drawn from previous studies, namely that oak regeneration can succeed even with small-scale regeneration methods [33,38,39], could be corroborated for the long run by the present results. However, it was also revealed that at certain sites, beech is able to become dominant or even outcompete oak sooner or later [18,34,47,48].
This insight was also evident when considering the survival rates of oak. In particular, the decreasing survival probabilities indicated the need for silvicultural assistance in the given stand situations (see Figure 2). Accordingly, the participation of oak in a mixture with beech was not stable throughout the regeneration period and confirmed the results of some studies [18,19,39,49], which can also be found in the early silvicultural principles for oak management [18,25,50]. Differences between experimental sites and forest stand types were clearly recognizable and should be considered in pre-commercial thinnings. Small-scale and long-term regeneration methods are especially promising in low-growth sites and/or monospecific pine stands. The competitive ability of oaks seemed to benefit from the higher light availability under more light-transmitting pine canopies. Lower site quality additionally reduced beech growth. The observed survival probabilities of 30% and more after 20 years of regeneration initialization (see Figure 2) also showed the remarkable potential of young oaks when small-scale regeneration methods were applied. However, when interpreting the results, it should also be noted that the survival rates represent the occurrence and not the dominance of oak in the regeneration.
The observed regeneration biomass showed an enormous growth potential. Even the apparently low-growing sites in NUE showed a considerable growth potential of oak and reached maximum biomass values that were similar to those of the more vigorous sites in EBR (see Figure 4). However, without appropriate silvicultural interferences in the main stand and pre-commercial thinnings in the advanced regeneration in favor of oak, this potential remained unused. Uniformly high or increasing stand volume in the main stand counteracted this (see Table 2 and Table 3). This was also true for the development of the appreciable oak proportions after early regeneration until the stem exclusion stage.
Equally apparent was the potential of natural oak regeneration, which was the basis of the observed oak regeneration in the majority of stands. Together with the findings by Löf et al. [41], who evaluated the costs for oak natural regeneration and found them to be the lowest, this results in an additional potential for operational savings or at least compensation.

4.3. Influence of Canopy Cover and Interspecific Competition

Sessile oak, as a light-demanding tree species, reacted more strongly to the canopy cover reduction than beech at all the sites. Thus, the results match those of several studies that observed a similar trend [18,35,51]. Interestingly, beech was still superior to oak irrespective of the canopy cover in the considered mixed stands in EBR and BUS (see Figure 5). This observation suggested that successful oak regeneration in the mixed regenerations was apparently not possible by controlling the canopy cover alone. A similar conclusion was drawn by Modrow et al. [35], who recommended controlling mixed tree species regardless of the regeneration gap size. At the same time, this resulted in the greatest scope for promoting oak in EBR, which may indicate that competition for light rather than soil-based resources was occurring at this site, whereas in BUS the nutrients seemed limiting. In NUE, the effect of canopy cover reduction was the lowest, which suggests that water and nutrients may be the limiting factors. Furthermore, NUE was the only experimental site where oak appeared to be superior to beech in height growth. These height relations indicated that oak’s superiority compared to beech was strongly dependent on monospecific pine stands with sparse site conditions. However, it is precisely these stands that should be urgently adapted to the rapidly changing climate [52]. These observations were also made for even younger oak regenerations [34,53]. Accordingly, oak requires the support of the silvicultural regulation of woody competitors for successful establishment in many sites [18,49,54].
The revealed competition of beech with the height development of oak regeneration deepens the conclusions drawn from studies considering shorter regeneration periods, which suggest a reduction in competition in favor of oak [35,38]. For example, Hauskeller-Bullerjahn [55] found that height growth in oak was reduced by 24% on average by competition and 30% of full light. The competition exerted by the admixture of beech was, in addition to the control of canopy cover, the most important factor for the successful establishment of oak in the considered stands. The observed competition effect by beech seemed to be influenced, on the one hand, by higher light availability and thus less by the influence of canopy cover [56] and, on the other hand, by increased root competition [57] due to lower nutrient and water availability.
Accordingly, high oak percentages at the beginning of the regeneration period and correspondingly lower beech competition showed positive effects on the development of oak regeneration (see Table 3). The increase in beech proportions in the regeneration resulted in a decrease in the positive competition relation of oak towards beech. This appeared to be due to the interspecific competitive pressure of beech on oak [36]. Therefore, the relations between oak and the mixed (competitor) species should be given special attention when creating the mixture. This is important for the success of the specific species mixture and the appropriate maintenance efforts, taking into account the natural development. For example, Meesenburg et al. [58] recommend a group mixture of tree species, which should have a minimum size of 0.3 ha. As a conclusion of the present study, oak regeneration can be successfully practiced even in smaller areas, assuming that the silvicultural goal is oak and that the thinnings are focused on assisting oak.

4.4. Influence of Regeneration on Old-Growth Productivity

Due to the long-term regeneration periods, with regeneration ages reaching 58 years, regeneration biomasses up to more than 100 t ha−1 could be observed in the investigated stands (see Table 3). At the same time, the remaining main stand continued to produce wood increments throughout the entire regeneration period. This is particularly important for deciding on the silvicultural approach.
Productivity was thus primarily determined by the standing volume (see Table 7). The effect of regeneration biomass on the productivity of the main stand was not significant. However, a negative trend was visible (see Figure 7). Accordingly, as biomass increased old-growth productivity decreased. In particular, this appeared to be due to increased belowground competition for resources between old growth and regeneration [59,60]. This conclusion is further supported by the observation that the effect was more pronounced with higher standing volumes. Conversely, this also meant that high regeneration biomasses could partially compensate for the resulting increment losses, due to the volume reduction by the harvesting of single mature trees.
However, so that the influence of regeneration on the overstorey can be conclusively assessed, further studies on the observed trend should be carried out. Particularly for the management of multi-layered stands, the consideration of the feedback of advanced regeneration on the remaining stand seems to be highly relevant.

4.5. Silvicultural Consequences

How oak stands or forests in general are managed is basically very much determined by the production objective in the respective stand. This also applies to the proportion of oak in the tree species portfolio of future forest stands. If oak is to be maintained or established in appreciable proportions for timber production [14,19] or as an ecological admixture [24], appropriate pre-commercial thinnings are necessary. The chosen silvicultural approach is therefore not a static system but should change with the site and stand conditions as well as with the corresponding operational objective. In principle, sessile oaks can make a valuable contribution in establishing climate-stable and structured mixed stands [4,5]. In this regard, it is important to emphasize the potential of oak for converting monospecific pine stands into mixed pine–oak stands.
The single tree and group selection systems considered in this study are one option for the establishment of oak while maintaining a balanced forest interior climate at the same time. Current climatic trends indicate that clear-cut climates should be avoided in any case. The outlined results therefore show a way to maintain or establish oak in the tree species portfolio as well as the small-scale regeneration methods in the long term.
For this to succeed, it is recommended that the standing volume of mature stands, including the serving tree layers in the area to be regenerated, should be consistently reduced. In this case, gap size or the area to be regenerated may be 0.1 ha. Depending on site conditions, the remaining stand volume should optimally be less than 250 m3 ha−1 in mixed beech–oak stands and 300 m3 ha−1 in monospecific pine stands, respectively (see Table 2). During the regeneration period, a renewed volume build-up must be avoided. The priority goal in the respective patches has to be the regeneration of oak. Ideally, there is no advanced regeneration of admixed tree species. If mixed tree species are present, increased management in favor of oak must be calculated since regulation of the old stand alone is not sufficient. Mixed tree species proportions, especially those of beech, that exceed 30% significantly impair oak in early regeneration until the stem exclusion stage.
Against the backdrop of rapidly advancing climate change, preparing European forests by creating mixed and structured stands is the order of the day. In particular, mixed stands with oak participation can make an important contribution to more resilient stands in the future.

Supplementary Materials

The following supporting information can be downloaded at: https://www.mdpi.com/article/10.3390/f13122052/s1, Table S1: list of tree species, summarized under the general term “Others”, Table S2: model statistics of oak survival rates.

Author Contributions

Conceptualization, K.S., E.U. and H.P.; methodology, K.S.; formal analysis, K.S.; investigation, K.S.; resources, H.P.; data curation, K.S.; writing—original draft preparation, K.S.; writing—review and editing, K.S., E.U. and H.P.; visualization, K.S.; supervision, H.P.; funding acquisition, E.U. and H.P. All authors have read and agreed to the published version of the manuscript.

Funding

This publication is part of the project “Growth potential of oak in managed and unmanaged forests dependent on stand structure and site conditions (W045)” [grant number 7831–27295-2017] that was supported by the Bavarian State Ministry of Nutrition, Agriculture and Forestry. The experimental plots are part of the network of long-term yield trials of Bavaria which are funded by the Bavarian State Ministry of Nutrition, Agriculture and Forestry [grant number W007 7831-26625-2017].

Data Availability Statement

The data used in this study are available on request from the corresponding author.

Acknowledgments

We would like to thank the Bavarian Forest Enterprise (BaySF), particularly the branch offices in Nuremberg and Ebrach and the community of Burgsinn for providing the research opportunities.

Conflicts of Interest

The authors declare no conflict of interest.

References

  1. Eaton, E.; Caudullo, G.; Oliveira, S.; de Rigo, D. Quercus robur and Quercus petraea in Europe: Distribution, habitat, usage and threats. In European Atlas of Forest Tree Species; San-Miguel-Ayanz, J., de Rigo, D., Caudullo, G., Houston Durrant, T., Mauri, A., Eds.; Publications Office of the European Union: Luxembourg, 2016; pp. 160–163. ISBN 978-92-79-52833-0. [Google Scholar]
  2. Mette, T.; Dolos, K.; Meinardus, C.; Bräuning, A.; Reineking, B.; Blaschke, M.; Pretzsch, H.; Beierkuhnlein, C.; Gohlke, A.; Wellstein, C. Climatic turning point for beech and oak under climate change in Central Europe. Ecosphere 2013, 4, 1–19. [Google Scholar] [CrossRef]
  3. Mette, T.; Brandl, S.; Kölling, C. Climate Analogues for Temperate European Forests to Raise Silvicultural Evidence Using Twin Regions. Sustainability 2021, 13, 6522. [Google Scholar] [CrossRef]
  4. Schroeder, H.; Nosenko, T.; Ghirardo, A.; Fladung, M.; Schnitzler, J.-P.; Kersten, B. Oaks as Beacons of Hope for Threatened Mixed Forests in Central Europe. Front. For. Glob. Chang. 2021, 4, 78. [Google Scholar] [CrossRef]
  5. Albert, M.; Nagel, R.-V.; Nuske, R.; Sutmöller, J.; Spellmann, H. Tree Species Selection in the Face of Drought Risk—Uncertainty in Forest Planning. Forests 2017, 8, 363. [Google Scholar] [CrossRef] [Green Version]
  6. Pretzsch, H.; Bielak, K.; Block, J.; Bruchwald, A.; Dieler, J.; Ehrhart, H.-P.; Kohnle, U.; Nagel, J.; Spellmann, H.; Zasada, M.; et al. Productivity of mixed versus pure stands of oak (Quercus petraea (Matt.) Liebl. and Quercus robur L.) and European beech (Fagus sylvatica L.) along an ecological gradient. Eur. J. For. Res. 2013, 132, 263–280. [Google Scholar] [CrossRef]
  7. Ammer, C. Unraveling the Importance of Inter- and Intraspecific Competition for the Adaptation of Forests to Climate Change. In Progress in Botany Vol. 78; Cánovas, F.M., Lüttge, U., Matyssek, R., Eds.; Springer International Publishing: Cham, Switzerland, 2017; pp. 345–367. ISBN 978-3-319-49489-0. [Google Scholar]
  8. Bolte, A.; Ammer, C.; Löf, M.; Madsen, P.; Nabuurs, G.-J.; Schall, P.; Spathelf, P.; Rock, J. Adaptive forest management in central Europe: Climate change impacts, strategies and integrative concept. Scand. J. For. Res. 2009, 24, 473–482. [Google Scholar] [CrossRef]
  9. Lindner, M.; Maroschek, M.; Netherer, S.; Kremer, A.; Barbati, A.; Garcia-Gonzalo, J.; Seidl, R.; Delzon, S.; Corona, P.; Kolström, M.; et al. Climate change impacts, adaptive capacity, and vulnerability of European forest ecosystems. For. Ecol. Manag. 2010, 259, 698–709. [Google Scholar] [CrossRef]
  10. Puettmann, K.J.; Messier, C. Simple Guidelines to Prepare Forests for Global Change: The Dog and the Frisbee. NWSC 2019, 93, 209. [Google Scholar] [CrossRef]
  11. Brändle, M.; Brandl, R. Species richness of insects and mites on trees: Expanding Southwood. J. Anim. Ecol. 2001, 70, 491–504. [Google Scholar] [CrossRef]
  12. Manos, P.S.; Stanford, A.M. The Historical Biogeography of Fagaceae: Tracking the Tertiary History of Temperate and Subtropical Forests of the Northern Hemisphere. Int. J. Plant Sci. 2001, 162, S77–S93. [Google Scholar] [CrossRef]
  13. Brockerhoff, E.G.; Barbaro, L.; Castagneyrol, B.; Forrester, D.I.; Gardiner, B.; González-Olabarria, J.R.; Lyver, P.O.; Meurisse, N.; Oxbrough, A.; Taki, H.; et al. Forest biodiversity, ecosystem functioning and the provision of ecosystem services. Biodivers Conserv. 2017, 26, 3005–3035. [Google Scholar] [CrossRef] [Green Version]
  14. Löf, M.; Brunet, J.; Filyushkina, A.; Lindbladh, M.; Skovsgaard, J.P.; Felton, A. Management of oak forests: Striking a balance between timber production, biodiversity and cultural services. Int. J. Biodivers. Sci. Ecosyst. Serv. Manag. 2016, 12, 59–73. [Google Scholar] [CrossRef] [Green Version]
  15. van der Plas, F.; Ratcliffe, S.; Ruiz-Benito, P.; Scherer-Lorenzen, M.; Verheyen, K.; Wirth, C.; Zavala, M.A.; Ampoorter, E.; Baeten, L.; Barbaro, L.; et al. Continental mapping of forest ecosystem functions reveals a high but unrealised potential for forest multifunctionality. Ecol. Lett. 2018, 21, 31–42. [Google Scholar] [CrossRef] [PubMed] [Green Version]
  16. Weaver, G.T.; Spiecker, H. Silviculture of high-quality oaks: Questions and future research needs. Ann. Sci. 1993, 50, 531–534. [Google Scholar] [CrossRef] [Green Version]
  17. Attocchi, G. Silviculture of Oak for High-Quality Wood Production: Effects of Thinning on Crown size, Volume Growth and Stem Quality in Even-Aged Stands of Pedunculate oak (Quercus robur L.) in Northern Europe; Southern Swedish Forest Research Centre, Swedish University of Agricultural Sciences: Alnarp, Sweden, 2015; ISBN 978-91-576-8277-2. [Google Scholar]
  18. von Lüpke, B. Silvicultural methods of oak regeneration with special respect to shade tolerant mixed species. For. Ecol. Manag. 1998, 106, 19–26. [Google Scholar] [CrossRef]
  19. Mölder, A.; Sennhenn-Reulen, H.; Fischer, C.; Rumpf, H.; Schönfelder, E.; Stockmann, J.; Nagel, R.-V. Success factors for high-quality oak forest (Quercus robur, Q. petraea) regeneration. For. Ecosyst. 2019, 6, 262. [Google Scholar] [CrossRef] [Green Version]
  20. Ellenberg, H.H.; Strutt, G.K. Vegetation Ecology of Central Europe; Cambridge University Press: Cambridge, UK, 1988; ISBN 9780521236423. [Google Scholar]
  21. Manthey, M.; Leuschner, C.; Härdtle, W. Buchenwälder und Klimawandel. Nat. Landsch. 2007, 82, 441–445. [Google Scholar]
  22. Aas, G. Quercus petraea (Matt.) Liebl., Traubeneiche. In Enzyklopädie der Holzgewächse; Roloff, A., Weisgerber, H., Lang, U., Stimm, B., Eds.; Wiley-VCH: Weinheim, Germany, 2000. [Google Scholar]
  23. Krahl-Urban, J. Die Eichen: Forstliche Monographie der Traubeneiche und der Stieleiche; P. Parey: Hamburg, Germany, 1959. [Google Scholar]
  24. Mölder, A.; Meyer, P.; Nagel, R.-V. Integrative management to sustain biodiversity and ecological continuity in Central European temperate oak (Quercus robur, Q. petraea) forests: An overview. For. Ecol. Manag. 2019, 437, 324–339. [Google Scholar] [CrossRef]
  25. Fleder, W. Vom unterfränkischen Verjüngungsbetrieb. Allg. Forstz. 1983, 38, 1013–1014. [Google Scholar]
  26. Jedicke, E.; Hakes, W. Management von Eichenwäldern im Rahmen der FFH-Richtlinie. Nat. Landsch. 2005, 37, 37–45. [Google Scholar]
  27. Meyer, P. Forstwirtschaft und Naturschutz—Konfliktpotenzial und Synergien am Beispiel von Natura 2000. In Natura 2000 im Wald—Lebensraumtypen, Erhaltungszustand, Management, Naturschutz und Biologische Vielfalt; Lehrke, S., Ellwanger, G., Buschmann, A., Frederking, W., Paulsch, C., Schröder, E., Ssymank, A., Eds.; Landwirtschaftsverlag: Münster, Germany, 2013; pp. 177–197. [Google Scholar]
  28. Brang, P.; Spathelf, P.; Larsen, J.B.; Bauhus, J.; Boncina, A.; Chauvin, C.; Drossler, L.; Garcia-Guemes, C.; Heiri, C.; Kerr, G.; et al. Suitability of close-to-nature silviculture for adapting temperate European forests to climate change. Forestry 2014, 87, 492–503. [Google Scholar] [CrossRef] [Green Version]
  29. Puettmann, K.J.; Wilson, S.M.; Baker, S.C.; Donoso, P.J.; Drössler, L.; Amente, G.; Harvey, B.D.; Knoke, T.; Lu, Y.; Nocentini, S.; et al. Silvicultural alternatives to conventional even-aged forest management—What limits global adoption? For. Ecosyst. 2015, 2, 8. [Google Scholar] [CrossRef] [Green Version]
  30. Spathelf, P.; Bolte, A.; van der Maaten, E.C.D. Is Close-to-Nature Silviculture (CNS) an adequate concept to adapt forests to climate change? Landbauforsch.-Appl. Agric. For. Res. 2015, 65, 161–170. [Google Scholar] [CrossRef]
  31. Maleki, K.; Zeller, L.; Pretzsch, H. Oak often needs to be promoted in mixed beech-oak stands—The structural processes behind competition and silvicultural management in mixed stands of European beech and sessile oak. iForest 2020, 13, 80–88. [Google Scholar] [CrossRef] [Green Version]
  32. Mosandl, R.; Abt, A. Waldbauverfahren in Eichenwäldern gestern und heute. AFZ-Der Wald 2016, 20, 28–32. [Google Scholar]
  33. Březina, I.; Dobrovolný, L. Natural regeneration of sessile oak under different light conditions. J. For. Sci. 2011, 57, 359–368. [Google Scholar] [CrossRef] [Green Version]
  34. Ligot, G.; Balandier, P.; Fayolle, A.; Lejeune, P.; Claessens, H. Height competition between Quercus petraea and Fagus sylvatica natural regeneration in mixed and uneven-aged stands. For. Ecol. Manag. 2013, 304, 391–398. [Google Scholar] [CrossRef]
  35. Modrow, T.; Kuehne, C.; Saha, S.; Bauhus, J.; Pyttel, P.L. Photosynthetic performance, height growth, and dominance of naturally regenerated sessile oak (Quercus petraea [Mattuschka] Liebl.) seedlings in small-scale canopy openings of varying sizes. Eur. J. For. Res. 2019, 116, 346. [Google Scholar] [CrossRef]
  36. Annighöfer, P.; Beckschäfer, P.; Vor, T.; Ammer, C. Regeneration patterns of European oak species (Quercus petraea (Matt.) Liebl., Quercus robur L.) in dependence of environment and neighborhood. PLoS ONE 2015, 10, e0134935. [Google Scholar] [CrossRef]
  37. Kanjevac, B.; Krstić, M.; Babić, V.; Govedar, Z. Regeneration Dynamics and Development of Seedlings in Sessile Oak Forests in Relation to the Light Availability and Competing Vegetation. Forests 2021, 12, 384. [Google Scholar] [CrossRef]
  38. Kohler, M.; Pyttel, P.; Kuehne, C.; Modrow, T.; Bauhus, J. On the knowns and unknowns of natural regeneration of silviculturally managed sessile oak (Quercus petraea (Matt.) Liebl.) forests—A literature review. Ann. For. Sci. 2020, 77, 101. [Google Scholar] [CrossRef]
  39. Kuehne, C.; Pyttel, P.; Modrow, T.; Kohnle, U.; Bauhus, J. Seedling development and regeneration success after 10 years following group selection harvesting in a sessile oak (Quercus petraea [Mattuschka] Liebl.) stand. Ann. For. Sci. 2020, 77, 71. [Google Scholar] [CrossRef]
  40. Löf, M. Establishment and growth in seedlings of Fagus sylvatica and Quercus robur: Influence of interference from herbaceous vegetation. Can. J. For. Res. 2000, 30, 855–864. [Google Scholar] [CrossRef]
  41. Löf, M.; Barrere, J.; Engman, M.; Petersson, L.K.; Villalobos, A. The influence of fencing on seedling establishment during reforestation of oak stands: A comparison of artificial and natural regeneration techniques including costs. Eur. J. For. Res. 2021, 140, 807–817. [Google Scholar] [CrossRef]
  42. Johann, K. DESER-Norm 1993. Normen der Sektion Ertragskunde im Deutschen Verband Forstlicher Forschungsanstalten zur Aufbereitung von waldwirtschaftlichen Dauerversuchen. Ber. Jahrestag. Dtsch. Verb. Forstl. Sekt. Ertragskunde 1993, 96–104. [Google Scholar]
  43. Forrester, D.I.; Tachauer, I.; Annighoefer, P.; Barbeito, I.; Pretzsch, H.; Ruiz-Peinado, R.; Stark, H.; Vacchiano, G.; Zlatanov, T.; Chakraborty, T.; et al. Generalized biomass and leaf area allometric equations for European tree species incorporating stand structure, tree age and climate. For. Ecol. Manag. 2017, 396, 160–175. [Google Scholar] [CrossRef]
  44. Zuur, A.F.; Ieno, E.N.; Walker, N.; Saveliev, A.A.; Smith, G.M. Mixed Effects Models and Extensions in Ecology with R; Springer: New York, NY, USA, 2009; ISBN 978-0-387-87457-9. [Google Scholar]
  45. R Core Team. R: A Language and Environment for Statistical Computing; R Foundation for Statistical Computing: Vienna, Austria, 2018. [Google Scholar]
  46. Bates, D.; Mächler, M.; Bolker, B.; Walker, S. Fitting Linear Mixed-Effects Models Using lme4. J. Stat. Soft. 2015, 67, 1–48. [Google Scholar] [CrossRef]
  47. Petritan, A.M.; Bouriaud, O.; Frank, D.C.; Petritan, I.C. Dendroecological reconstruction of disturbance history of an old-growth mixed sessile oak-beech forest. J. Veg. Sci. 2017, 28, 117–127. [Google Scholar] [CrossRef]
  48. Dietz, L.; Gégout, J.-C.; Dupouey, J.-L.; Lacombe, E.; Laurent, L.; Collet, C. Beech and hornbeam dominate oak 20 years after the creation of storm-induced gaps. For. Ecol. Manag. 2022, 503, 119758. [Google Scholar] [CrossRef]
  49. Manso, R.; Ligot, G.; Fortin, M. A recruitment model for beech–oak pure and mixed stands in Belgium. For. Int. J. For. Res. 2020, 93, 124–132. [Google Scholar] [CrossRef]
  50. Vanselow, K. Die Waldbautechnik der Eiche im bayerischen Spessart in geschichtlicher Betrachtung. Forstwiss. Cent. 1960, 79, 270–286. [Google Scholar] [CrossRef]
  51. von Lüpke, B. Einfluss unterschiedlicher Hiebsformen auf die Naturverjüngung eines Traubeneichen-Buchen-Mischbestandes. Forstarchiv 2008, 79, 4–15. [Google Scholar]
  52. Leuschner, C.; Förster, A.; Diers, M.; Culmsee, H. Are northern German Scots pine plantations climate smart? The impact of large-scale conifer planting on climate, soil and the water cycle. For. Ecol. Manag. 2022, 507, 120013. [Google Scholar] [CrossRef]
  53. von Lüpke, B.; Hauskeller-Bullerjahn, K. Beitrag zur Modellierung der Jungwuchsentwicklung am Beispiel von Traubeneichen-Buchen-Mischverjüngungen. Allg. Forst. U J. Ztg 2004, 175, 61–69. [Google Scholar]
  54. Mölder, A.; Nagel, R.-V.; Meyer, P.; Schmidt, M.; Rumpf, H.; Spellmann, H. Historischer Rückblick auf die Verjüngung von Eichen im Spessart des 19. Jahrhunderts–Bedeutung der angewandten Verfahren für die heutige Eichenwirtschaft. Forstarchiv 2017, 88, 67–78. [Google Scholar]
  55. Hauskeller-Bullerjahn, K. Wachstum Junger Eichen Unter Schirm. Ph.D. Dissertation, Universität Göttingen, Göttingen, Germany, 1997. [Google Scholar]
  56. Skrzyszewski, J.; Pach, M. Crookedness of pedunculate oak (Quercus robur L.) growing under a canopy of Scots pine (Pinus sylvestris L.). Scand. J. For. Res. 2015, 30, 688–698. [Google Scholar] [CrossRef]
  57. Leuschner, C.; Hertel, D.; Coners, H.; Büttner, V. Root competition between beech and oak: A hypothesis. Oecologia 2001, 126, 276–284. [Google Scholar] [CrossRef]
  58. Meesenburg, H.; Schmidt, M.; Sutmöller, J.; Albert, M. Klimaanpassung ist Vorsorge für den Wald. proWald 2015, 11, 4–10. [Google Scholar]
  59. Pretzsch, H.; Biber, P.; Uhl, E.; Dauber, E. Long-term stand dynamics of managed spruce–fir–beech mountain forests in Central Europe: Structure, productivity and regeneration success. Forestry 2015, 88, 407–428. [Google Scholar] [CrossRef]
  60. Knapp, E. Zur Wuchsleistung der Unterbaubuche im ungleichaltrigen Kiefern-Buchen-Mischbestand vor und nach ihrer Übernahme als Hauptbestand auf Standorten des nordostdeutschen Tieflandes. Ber. Jahrestag. 1991, 96–110. [Google Scholar]
Figure 1. Geographic location of the experimental plots in southern and central Germany.
Forests 13 02052 g001
Figure 2. Estimated occurrence probability of oak for the studied sites depending on the regeneration period (Equation (2); for model statistics see Table S2).
Forests 13 02052 g002
Figure 3. Estimated tree densities of the regenerated tree species (Equation (3)); note the logarithmic scaling of the y-axis and the different scaling of the x-axes.
Forests 13 02052 g003
Figure 4. Regenerated biomass of oak, beech, pine, hornbeam, and other broadleaf tree species as a function of canopy cover at the age of 30 (Equation (4)); asterisks denote the significance levels of the canopy cover effect, *** p < 0.001, * p < 0.05, n.s. not significant.
Forests 13 02052 g004
Figure 5. Estimated maximum heights of oak and beech regeneration as a function of regeneration age and canopy cover (Equation (5)); shown are the height trajectories of oak and the most competitive beech species. Note the different scaling of the x-axes.
Forests 13 02052 g005
Figure 6. Estimated maximum heights of oak and beech regeneration as a function of the proportion of beech regeneration and canopy cover at the age of 20 (Equation (5)); shown are the height trajectories of oak and the most competitive beech species. Note the different scaling of the x-axes.
Forests 13 02052 g006
Figure 7. Periodic annual increment of the main stand as a function of regeneration biomass (not significant) and volume (most significant) (Equation (6)).
Forests 13 02052 g007
Table 1. General description of the long-term experiments; Exp—experiment (code); Nr—experiment number; n—number of plots; Size—plot sizes [ha]; Comp—species composition; RT—type of regeneration; Surveys—measurement years; Per—regeneration period [yrs]; Lat—latitude; Lon—longitude; P—annual precipitation [mm yr−1]; T—annual mean temperature [°C]; Alt—altitude [m.a.s.l.].
ExpNrnSizeComp 1RT 2SurveysPerLatLonSoilPTAlt
BUS13620.5Oa-Benat1986, 1995, 20122650.1299.593Cambisol7967.8445
EBR13210.5Oa-Be-Pinat1982, 1993, 20193649.83610.547Cambisol6838.1338
EBR13351.0Oa-Be-(Pi)nat/art1983, 1999, 20193649.85310.547Cambisol—(Pseudogley)6757.9385
NUE14140.1Pinat/art1991, 1998, 20192849.49911.144Cambisol/Pseudogley7598.7333
1 Oa—sessile oak; Be—European beech; Pi—Scots pine; 2 nat—natural regeneration; art—artificially regenerated.
Table 2. Yield data of the main stand for the first and latest survey; S—tree species; Age—stand age [yrs]; N—number of trees [n ha−1]; H100—dominant height [m]; D100—dominant diameter [cm]; BA—basal area [m2 ha−1]; V—volume [m3 ha−1]; CC—canopy cover [%]; PAIBA—periodic annual basal area increment [m2 ha−1 yr−1]; PAIV—periodic annual volume increment [m3 ha−1 yr−1]; Per—observation period [yrs].
First SurveyLast Survey
Exp (Nr)PlotSAgeNH100D100BA VCC AgeNH100D100BAVPAIBAPAIVCCPer
EBR (132)1Pi1472130.953.34.6566.14371841233.2765.014.1563.150.050.763036
Be1474231.3445.126.66110.21842133.0569.67.93138.810.11.76
Oa147431.5946.90.7212.26184432.7867.41.4926.990.020.38
total 67 12.03188.61 37 13.56228.940.172.9
EBR (133)2Pi143827.0351.641.6620.9860178232.0752.20.395.790.010.114336
Be1437732.4447.1512.24209.081785334.7864.3715.44282.880.194.09
Oa1431429.02462.3336.711781332.6562.13.9471.180.051.05
total 99 16.23266.78 68 19.77359.840.245.24
4Be1644434.8849.358.42159.51221993335.170.1112.74237.990.163.354336
Oa1641233.5546.742.0637.181991233.3361.53.5665.380.040.87
Hb164124.3830.70.070.92199128.4442.50.142.1100.04
total 57 10.55197.61 46 16.44305.480.24.27
6Pi1621127.0953.142.430.2162197928.6860.382.4432.490.020.185436
Be1624428.7246.564.9271.821973431.2960.435.64107.130.071.51
Oa1626728.6743.79.46145.151976230.9154.6914.58241.670.153.33
Hb1621023.5322.540.241.811971020.3728.980.494.7300.07
total 132 17.02249 115 23.98386.030.245.08
7Sp146127.55470.172.18221811628.550.853.2542.90.030.553036
Pi1462427.0241.363.2240.31 0------
Be1462530.1244.643.9162.531811927.7658.435.0974.790.060.72
Oa1461825.9740.382.332.221811726.4457.234.3764.480.061.04
total 68 9.61137.25 52 12.72182.170.152.31
8Be1531332.8148.842.4442.3325188426.2164.181.2918.110.010.11936
Oa1531929.3441.732.640.891881527.6755.33.655.220.050.85
Hb153121.72180.030.26 0------
total 33 5.0683.48 19 4.973.330.060.96
BUS (136)1Be1924024.9743.522.5230.5867218427.0139.60.425.520.020.33826
Oa1926629.3160.1218.74305.772185231.3470.5820.34356.570.193.82
total 106 21.26336.35 56 20.76362.090.214.11
2Be20210628.0844.767.0388.29672282627.7849.973.7853.80.080.944126
Oa2027428.186121.63340.192284830.9268.5417.71305.720.163.24
total 180 28.66428.48 74 21.48359.520.244.17
NUE (141)1Pi8840024.135.7627.07287.456611614426.7739.9916.69203.990.233.523528
2Pi9740025.5235.9529.53332.25771252333043.8329.25389.240.457.445728
3Pi12518927.5747.5627.62346.416315311130.1952.6723.59327.320.294.954228
4Pi13013331.6548.822.46324.85571584429.7954.3310.3141.560.11.032328
Oa—sessile oak; Be—European beech; Pi—Scots pine; Hb—hornbeam; Sp—Norway spruce.
Table 3. Regeneration data for the first and latest survey; S—tree species; A—age of regeneration [yrs]; d—plant density [n ha−1]; bm—regeneration biomass [kg ha−1]; h—mean height [m].
First SurveyLast Survey
Exp (Nr)PlotSAdbmhAdbmh
EBR (132)1Pi435041820.6740420216.07
Be18,30820331.05349255,7457.41
Oa22,1045621.0727111,01513.45
Hb33836051.2135492357.99
Others350331.554268.19
EBR (133)2Pi6366220.89420--
Be15,46417671.11370927,6967.1
Oa88921650.8756811.48
Hb130161.74671615.48
Others6971182.8559330512.06
4Pi22600.62580--
Be30,55461003.19239491,38111.4
Oa1 140151.44627913.97
Hb197281.646103818
Others284604.719832,29919.89
6Pi610040.364251259.27
Be15,79110560.65528049,3075.72
Oa119,0098330.32989217.12
Hb6990.879520339.87
Others153151.0777871410.21
7Pi1121981611.444759467213.24
Be19,28428631.71397249,1367.13
Oa17,4024791.8461343,18214.41
Hb29255941.6745379739.51
Others36094772.0318496559.54
8Pi137051.364916234016.55
Be76348911.53320329,1035.72
Oa41,57014831.892500102,44710.07
Hb36428972.14155333,5057.81
Others219272.3722669914.86
BUS (136)1Be515,87810520.673111,62812,6442.8
Oa54,28616860.3667810,1423.52
2Be312,2458120.6429817523,5053.9
Oa13,3024110.255267.13
NUE (141)1Pi331,9118490.331213327532.77
Be12781300.32147886536.35
Oa18,8897850.45244466963.1
Others5441620.4735617144.67
2Pi586,96724290.3233122922.81
Be11221290.43356746,9488.17
Oa42,91117420.5382231205.09
Others156470.382229506.14
3Pi923001570.88370--
Be501110951.75262276,35310.96
Oa40,21142301.5689390014.34
Others708930601.2232213,31310.41
4Pi918001280.89370--
Be322540.9450038883.58
Oa23,91125171.541733100,86111.58
Others16336701.2225664976.86
Oa—sessile oak; Be—European beech; Pi—Scots pine; Hb—hornbeam.
Table 4. Model statistics for tree density as a function of regeneration age (A) (Equation (3)); the reference tree species is oak; Est—estimated value; SE—standard error; pp-value; significant values are written in bold.
EBRBUSNUE
Fixed EffectsEst (SE)pEst (SE)pEst (SE)p
(Intercept)12.09 (0.16)<0.00110.28 (0.28)<0.00112.43 (0.25)<0.001
ln (A)−1.26 (0.03)<0.001−0.35 (0.05)<0.001−1.27 (0.07)<0.001
Be−1.24 (0.12)<0.001−1.00 (0.17)<0.001−4.94 (0.26)<0.001
Be × ln (A)0.61 (0.04)<0.0010.39 (0.10)<0.0011.26 (0.10)<0.001
Pi−3.63 (0.17)<0.001--−0.28 (0.2)0.316
Pi × ln (A)0.65 (0.06)<0.001--−0.26 (0.11)0.020
Hb−3.61 (0.15)<0.001----
Hb × ln (A)0.81 (0.05)<0.001----
Others−4.45 (0.14)<0.001--−4.04 (0.30)<0.001
Others × ln (A)0.92 (0.05)<0.001--0.70 (0.11)<0.001
Random Effects
σ21.161.551.00
τ00 Squ:P0.030.330.04
τ00 P0.110.120.11
N Squ25620036
N P624
N measurements10,59921011405
AIC31,971.77215.14084.5
Table 5. Model statistics for biomass development as a function of regeneration age (A) and canopy cover (CC) (Equation (4)); the reference tree species is oak; Est—estimated value; SE—standard error; pp-value; significant values are written in bold.
EBRBUSNUE
Fixed EffectsEst (SE)pEst (SE)pEst (SE)p
(Intercept)−3.71 (0.29)<0.001−3.99 (0.34)<0.001−3.04 (0.47)<0.001
ln (A)2.11 (0.08)<0.0011.93 (0.10)<0.0011.90 (0.12)<0.001
CC−2.90 (0.13)<0.001−0.26 (0.19)0.168−0.95 (0.38)0.013
Be0.24 (0.08)0.0020.76 (0.17)<0.001−0.93 (0.38)0.015
Be × CC2.69 (0.15)<0.0010.01 (0.24)0.9550.99 (0.54)0.065
Pi−1.32 (0.17)<0.001--−2.51 (0.55)<0.001
Pi × CC2.46 (0.32)<0.001--1.53 (0.75)0.041
Hb−1.13 (0.09)<0.001----
Hb × CC2.64 (0.21)<0.001----
Others0.22 (0.17)0.194--−1.85 (0.40)<0.001
Others × CC0.81 (0.42)0.056--0.84 (0.58)0.144
Random Effects
σ22.612.152.50
τ00 Squ:P0.100.180.00
τ00 P0.070.010.09
N Squ25620036
N P624
N measurements51951307772
AIC19,983.34829.52931.8
Table 6. Results on the height model as a function of regeneration age (A), canopy cover (CC), and proportion of beech regeneration (BE_perc) (Equation (5)); the reference species is oak; Est—estimated value; SE—standard error; pp-value. Significant values are written in bold.
EBRBUSNUE
Fixed EffectsEst (SE)pEst (SE)pEst (SE)P
(Intercept)−0.20 (0.10)0.251−2.60 (0.30)<0.001−1.70 (0.40)<0.001
ln (A)0.77 (0.00)<0.0011.24 (0.00)<0.0011.20 (0.10)<0.001
CC−0.80 (0.10)<0.001−0.50 (0.10)<0.001−0.20 (0.30)0.387
Be_perc−0.70 (0.10)<0.001−0.40 (0.10)0.001−1.90 (0.70)0.008
Be−0.50 (0.00)<0.001−0.50 (0.10)<0.001−0.40 (0.30)0.077
Be × Be_perc1.13 (0.10)<0.0011.52 (0.10)<0.0012.25 (0.70)0.001
Be × CC0.58 (0.10)<0.0010.48 (0.10)<0.0010.12 (0.30)0.703
Pi0.01 (0.10)0.932--−0.80 (0.40)0.052
Pi × Be_perc−0.20 (0.20)0.546--0.15 (1.00)0.880
Pi × CC0.69 (0.20)<0.001--−0.20 (0.50)0.631
Hb−0.50 (0.10)<0.001----
Hb × Be_perc0.66 (0.10)<0.001----
Hb × CC0.66 (0.10)<0.001----
Others−0.10 (0.10)0.147--−1.10 (0.30)<0.001
Others × Be_perc0.43 (0.20)0.010--0.90 (0.80)0.242
Others × CC0.12 (0.20)0.425--0.33 (0.40)0.354
Random Effects
σ20.270.330.53
τ00 Squ:P0.030.070.06
τ00 P0.030.180.06
N Squ25620036
N P624
N measurements35191266464
AIC5752.02423.01103.3
Table 7. Results of the model on periodic annual increment of the main stand as a function of the standing volume (V) and the regeneration biomass (bm_reg) (Equation (6)); Est—estimated value; SE—standard error; pp-value; significant values are written in bold.
Fixed EffectsEst (SE)p
(Intercept)−7.23 (1.79)<0.001
bm_reg0.03 (0.03)0.358
ln (V)1.58 (0.33)<0.001
ln (V) × bm_reg−0.01 (0.01)0.279
Random Effects
σ20.23
τ00 P0
N P7
N measurements24
AIC62.5
Publisher’s Note: MDPI stays neutral with regard to jurisdictional claims in published maps and institutional affiliations.

