Review

Water in Wood: A Review of Current Understanding and Knowledge Gaps

by
Emil Engelund Thybring
1,*,
Maria Fredriksson
2,
Samuel L. Zelinka
3 and
Samuel V. Glass
3
1
Bioresource Chemistry & Technology, Department of Geosciences and Natural Resource Management, University of Copenhagen, Rolighedsvej 23, DK-1958 Frederiksberg C, Denmark
2
Building Materials, Department of Building and Environmental Technology, Lund University, P.O. Box 118, SE-22100 Lund, Sweden
3
Building and Fire Sciences, US Forest Service Forest Products Laboratory, Madison, WI 53726, USA
*
Author to whom correspondence should be addressed.
Forests 2022, 13(12), 2051; https://doi.org/10.3390/f13122051
Submission received: 2 November 2022 / Revised: 25 November 2022 / Accepted: 28 November 2022 / Published: 2 December 2022
(This article belongs to the Special Issue Reviews on Structure and Physical and Mechanical Properties of Wood)

Abstract

:
Wood-water interactions are central to the utilization of wood in our society since water affects many important characteristics of wood. This topic has been investigated for more than a century, but new knowledge continues to be generated as a result of improved experimental and computational methods. This review summarizes our current understanding of the fundamentals of water in wood and highlights significant knowledge gaps. Thus, the focus is not only on what is currently known but equally important, what is yet unknown. The review covers locations of water in wood; phase changes and equilibrium states of water in wood; thermodynamics of sorption; terminology including cell wall water (bound water), capillary water (free water), fiber saturation point, and maximum cell wall moisture content; shrinkage and swelling; sorption hysteresis; transport of water in wood; and kinetics of water vapor sorption in the cell wall.

Graphical Abstract

1. Introduction

Products made of wood are key components in modern society and can be found everywhere around us in our daily lives. We use wood to build houses, furniture, and tools. Wood fibers are used for paper, packaging, and insulation materials, energy for heating our homes can come from wood logs or wood pellets, and we can even use wood to make biofuels and biochemicals. For all applications of wood, the material is exposed to water in the form of vapor in the air and sometimes also in the form of liquid water (e.g., outdoor wood structures exposed to rain). Similar to many biomaterials, wood attracts water molecules from its surroundings and absorbs them within the material structure. This water dramatically affects material characteristics which are important for all applications of wood. For instance, water affects the structural use of wood by changing the mechanical properties (stiffness, strength, creep) and dimensions of the material [1,2,3,4,5]. Water also changes the heat capacity and thermal conductivity [6,7,8,9], hereby impacting the performance of wood and wood-based insulation materials. Wood products in the built environment are required to have a long service life, but water can affect this since high moisture contents facilitate degradation by decay fungi [10,11,12]. On the other hand, the production of fibers or biochemicals from wood requires efficient decomposition of the material, which is assisted by water in the processing of the wood biomass [13,14]. Additionally, the transport of water in wood is important for example within the field of wood drying. Thus, the interaction of water with wood is central to all aspects of the utilization of wood in our society.
Because of the importance of wood-water interactions, the topic has been studied for more than a century [4,10,15,16] and several books and reviews have summarized existing data and knowledge over the years [17,18,19,20,21,22,23,24,25]. New and improved experimental and computational methods have been introduced to the field of wood science, a development that continues to this day. This evolution continues to generate data that contradicts, reaffirms, or brings new nuances to our existing ideas about water in wood. This forces us to regularly rethink and reformulate our understanding of water in wood. In doing so, we should not only reflect on what we currently think we know but what is equally important—what we currently do not know or understand. This review summarizes our current understanding of the fundamentals of water in wood and highlights significant knowledge gaps that need to be addressed to advance this area of wood science.

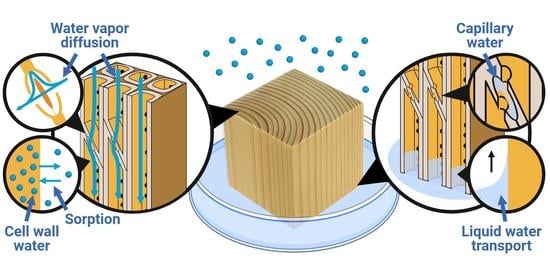
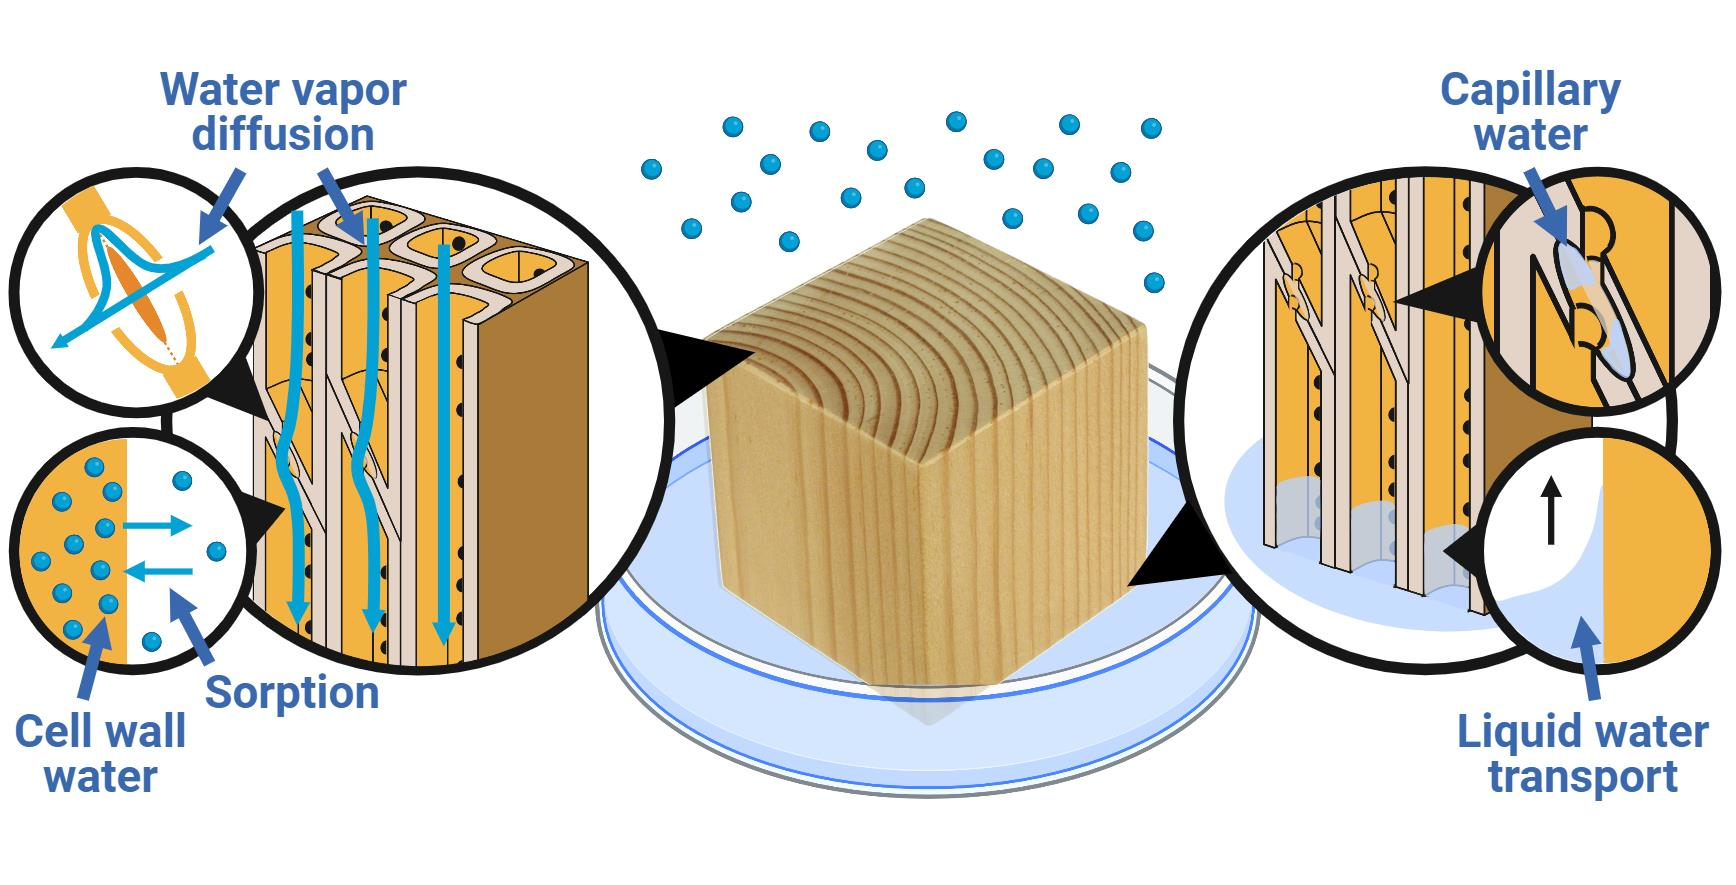
2. Where Is the Water?

Water in wood can be present both within cell walls and in the porous, macro-void structure of the material, as depicted in Figure 1. Within cell walls, water molecules are commonly referred to as “cell wall water” or “bound water” as they closely interact with the cell wall polymers. Water in the macro-void structure is called “capillary water” or “free water” and interacts with wood through surface forces. Although “free water” is often used in the literature, this term is misleading because capillary water is constrained within and interacts with the wood structure albeit by other mechanisms than cell wall water [26]. The following sections discuss the state and location of water within cell walls and the macro-void structure of wood.

2.1. Cell Wall Water

Water molecules inside the solid cell walls are located in transient nano-pores and closely interact with the cell wall polymers (cellulose, hemicelluloses, and lignin), mainly by hydrogen bonding to the hydroxyl (OH) groups [27,28] (Figure 1). Although cellulose has the highest concentration of hydroxyls [17,29], the most accessible cell wall constituents for hydrogen bonding with water are the hemicelluloses. This is because a large fraction of the cellulose hydroxyls is found inside the aggregated cellulose microfibrils that are impenetrable to water under normal environmental conditions [30,31].
The concentration of hydroxyls interacting with water is termed the “hydroxyl accessibility”. Typically, the hydroxyl accessibility for various wood species is found in the range of 6–10 millimoles of water per gram of dry solid (mmol g−1) [29,32,33,34,35,36]. However, these values are slightly underestimated because of methodological limitations. Hydroxyl accessibility is commonly determined by deuterium exchange [30,34,37] where the hydrogen on water-interacting hydroxyls is replaced by its heavier isotope, deuterium. This is done by continuously supplying the wood with heavy water, also known as deuterium oxide (D2O). Hereby, hydroxyls that interact via their hydrogen, i.e., act as acceptors in a hydrogen bond with D2O molecules will exchange hydrogen atoms and become heavier. However, those hydroxyls that can only interact via their oxygen, i.e., act as hydrogen-bond donors, because of steric hindrance, will not exchange hydrogen with D2O [38]. Therefore, about one-third of the water-accessible hydroxyls on the surfaces of the cellulose microfibrils cannot be deuterated [38] and thus the measured hydroxyl accessibility is underestimated. For example, the underestimation of the accessibility from water-accessible cellulose hydroxyls is estimated to be 0.7 mmol g−1 for Norway spruce [39]. Previously, hydroxyl accessibility was thought to increase with moisture content [37], but recent results show that this is a consequence of methodological artifacts since the rate of deuteration and re-protonation is higher at higher moisture contents [40].
Whether or not cell wall water could be differentiated into different populations based on unique properties has been a topic of much debate in the literature. For decades it was thought that cell wall water consisted of two different types of water molecules with distinctly different properties. One type called “primary (bound) water” was envisioned to consist of water molecules that hydrogen-bond directly with sorption sites (hydroxyls); the other type called “secondary (bound) water” was thought to hydrogen-bond only with other water molecules (including with primary water). This idea arose from the theoretical sorption isotherm models that describe the number of water molecules taken up by wood as a function of the surrounding environment (Section 3.3). The idea was strengthened in the 1980s by experimental data from differential scanning calorimetry (DSC) which found two types of “bound water” in cellulosic materials: freezing and non-freezing [41,42,43]. The freezing water was found to exhibit a phase change around −20 to −10 °C during cooling, whereas the non-freezing water did not change phase when cooling further down to −70 °C [42]. However, in the last 15 years, further work using DSC [44,45] as well as other experimental techniques [46,47] have failed to observe primary or secondary water in wood cell walls. Furthermore, Zelinka et al. [45] showed the observed phase change in DSC measurements was a result of sample preparation and not two distinct cell wall water populations. More recently, two distinct populations of cell wall water have been observed in wood with other experimental techniques such as 2D low-field nuclear magnetic resonance (NMR) spectroscopy [48,49,50,51] and Quasielastic Neutron Scattering (QENS) [52]. While the QENS and NMR results may appear to conflict with the absence of two types of water in DSC measurements, it should be noted that the size and scale of the hypothesized types of cell wall water vary greatly across the techniques. Currently, an understanding of what the types of cell wall water represent is lacking, but suggestions include water clusters [48] and water molecules in locations that differ in their chemical environment [49,50,52].
It appears reasonable to expect that the distribution of the different water populations relates to the size and chemistry of the transient nano-pores occupied by cell wall water, including the strength and abundance of hydrogen bond interactions. However, it is currently not known how the available volume within cell walls and its spatial distribution or hydroxyl accessibility affect the distribution of the different water populations. It may be possible to better understand these water populations by using various chemical modifications [53,54]. Chemical modification can change the hydroxyl accessibility of wood by reaction with chemicals that replace hydroxyls with another functional group, e.g., acetyl groups formed by reaction with acetic anhydride [55]. Such reactions also fill some of the available space for water with the volume of the added chemical entities [56]. It is therefore possible to independently tune the hydroxyl accessibility and available space for water within cell walls by using chemicals that differ in size and/or ability to replace one or more hydroxyls [39]. Similarly, different chemicals can be used to change the spatial distribution of the available space on the nano-scale [57], whereas the micro-scale distribution of cell wall water can be tuned by targeted modification [58].

2.2. Capillary Water

Water in the porous, macro-void structure of wood interacts through surface forces at the interface between the solid cell walls and the type of void (pits, lumina, etc.). This capillary water can enter wood either by capillary condensation or capillary action. Capillary condensation is the mechanism describing that condensation of water vapor can occur in small voids at relative humidity (RH) levels below 100% [59]. The relative humidity at which capillary condensation occurs depends on the size and geometry of the voids [60] (Section 3.4). Capillary action describes the flow of liquid water in the porous structure which is assisted by the adhesive forces between the liquid and the solid surfaces. The size, geometry, and continuity of the porous, macro-void structure all affect the flow rate of liquids by capillary action (Section 7.3).
The interaction between liquid water and wood is often characterized by methods that determine interfacial forces or wetting properties of bulk wood surfaces [61,62]. While these are relevant for practical applications of wood such as the wetting of surfaces by adhesives or coatings, they do not necessarily describe the surface properties relevant to capillary water within the wood structure. These occur at the surfaces of the cell walls inside the lumina, pit chambers, and other voids, whereas the wetting properties of bulk wood surfaces also include contributions from the cut-open cell walls. Thus, the characterization of surface forces within the macro-void structure of wood requires in situ measurement on the micro-scale. This has, for instance, been done using atomic force microscopy (AFM) [63,64,65]. Alternatively, the contact angle of capillary water in the macro-void structure could be determined in situ by X-ray tomography which has been done to characterize fluids in porous rocks [66,67]. While several studies have employed AFM to characterize the surfaces inside wood lumina, so far no studies have determined the in situ contact angle of capillary water in wood.

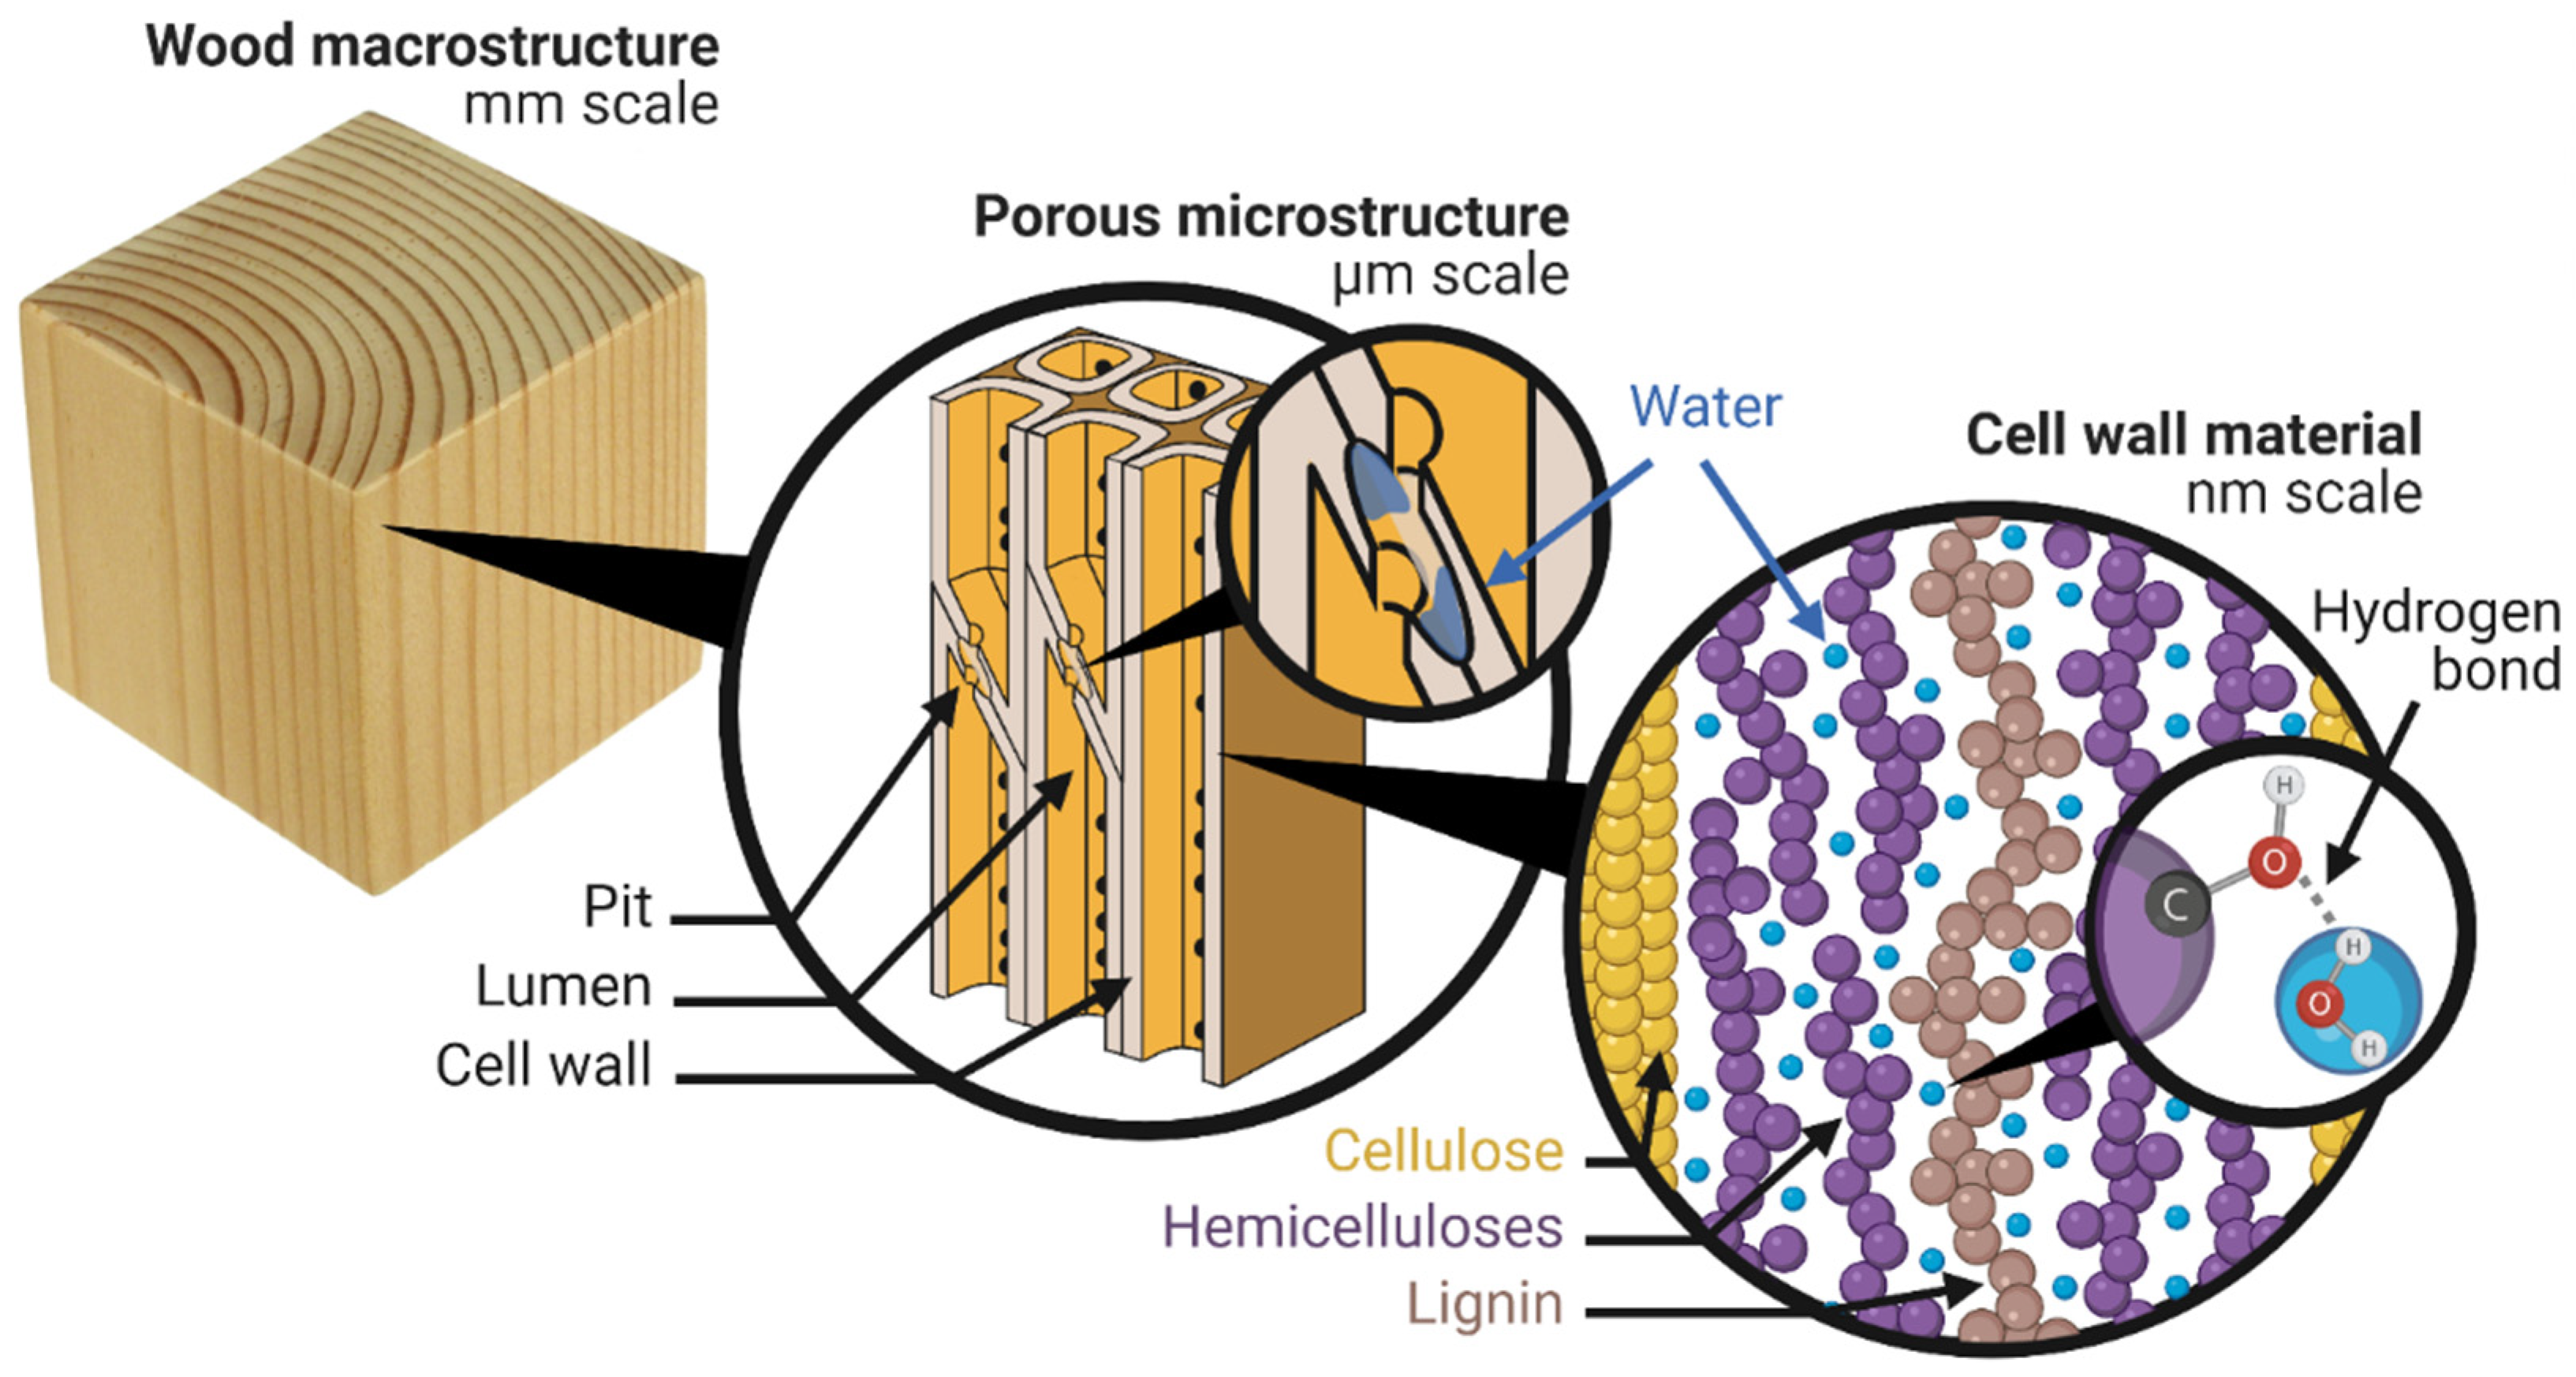
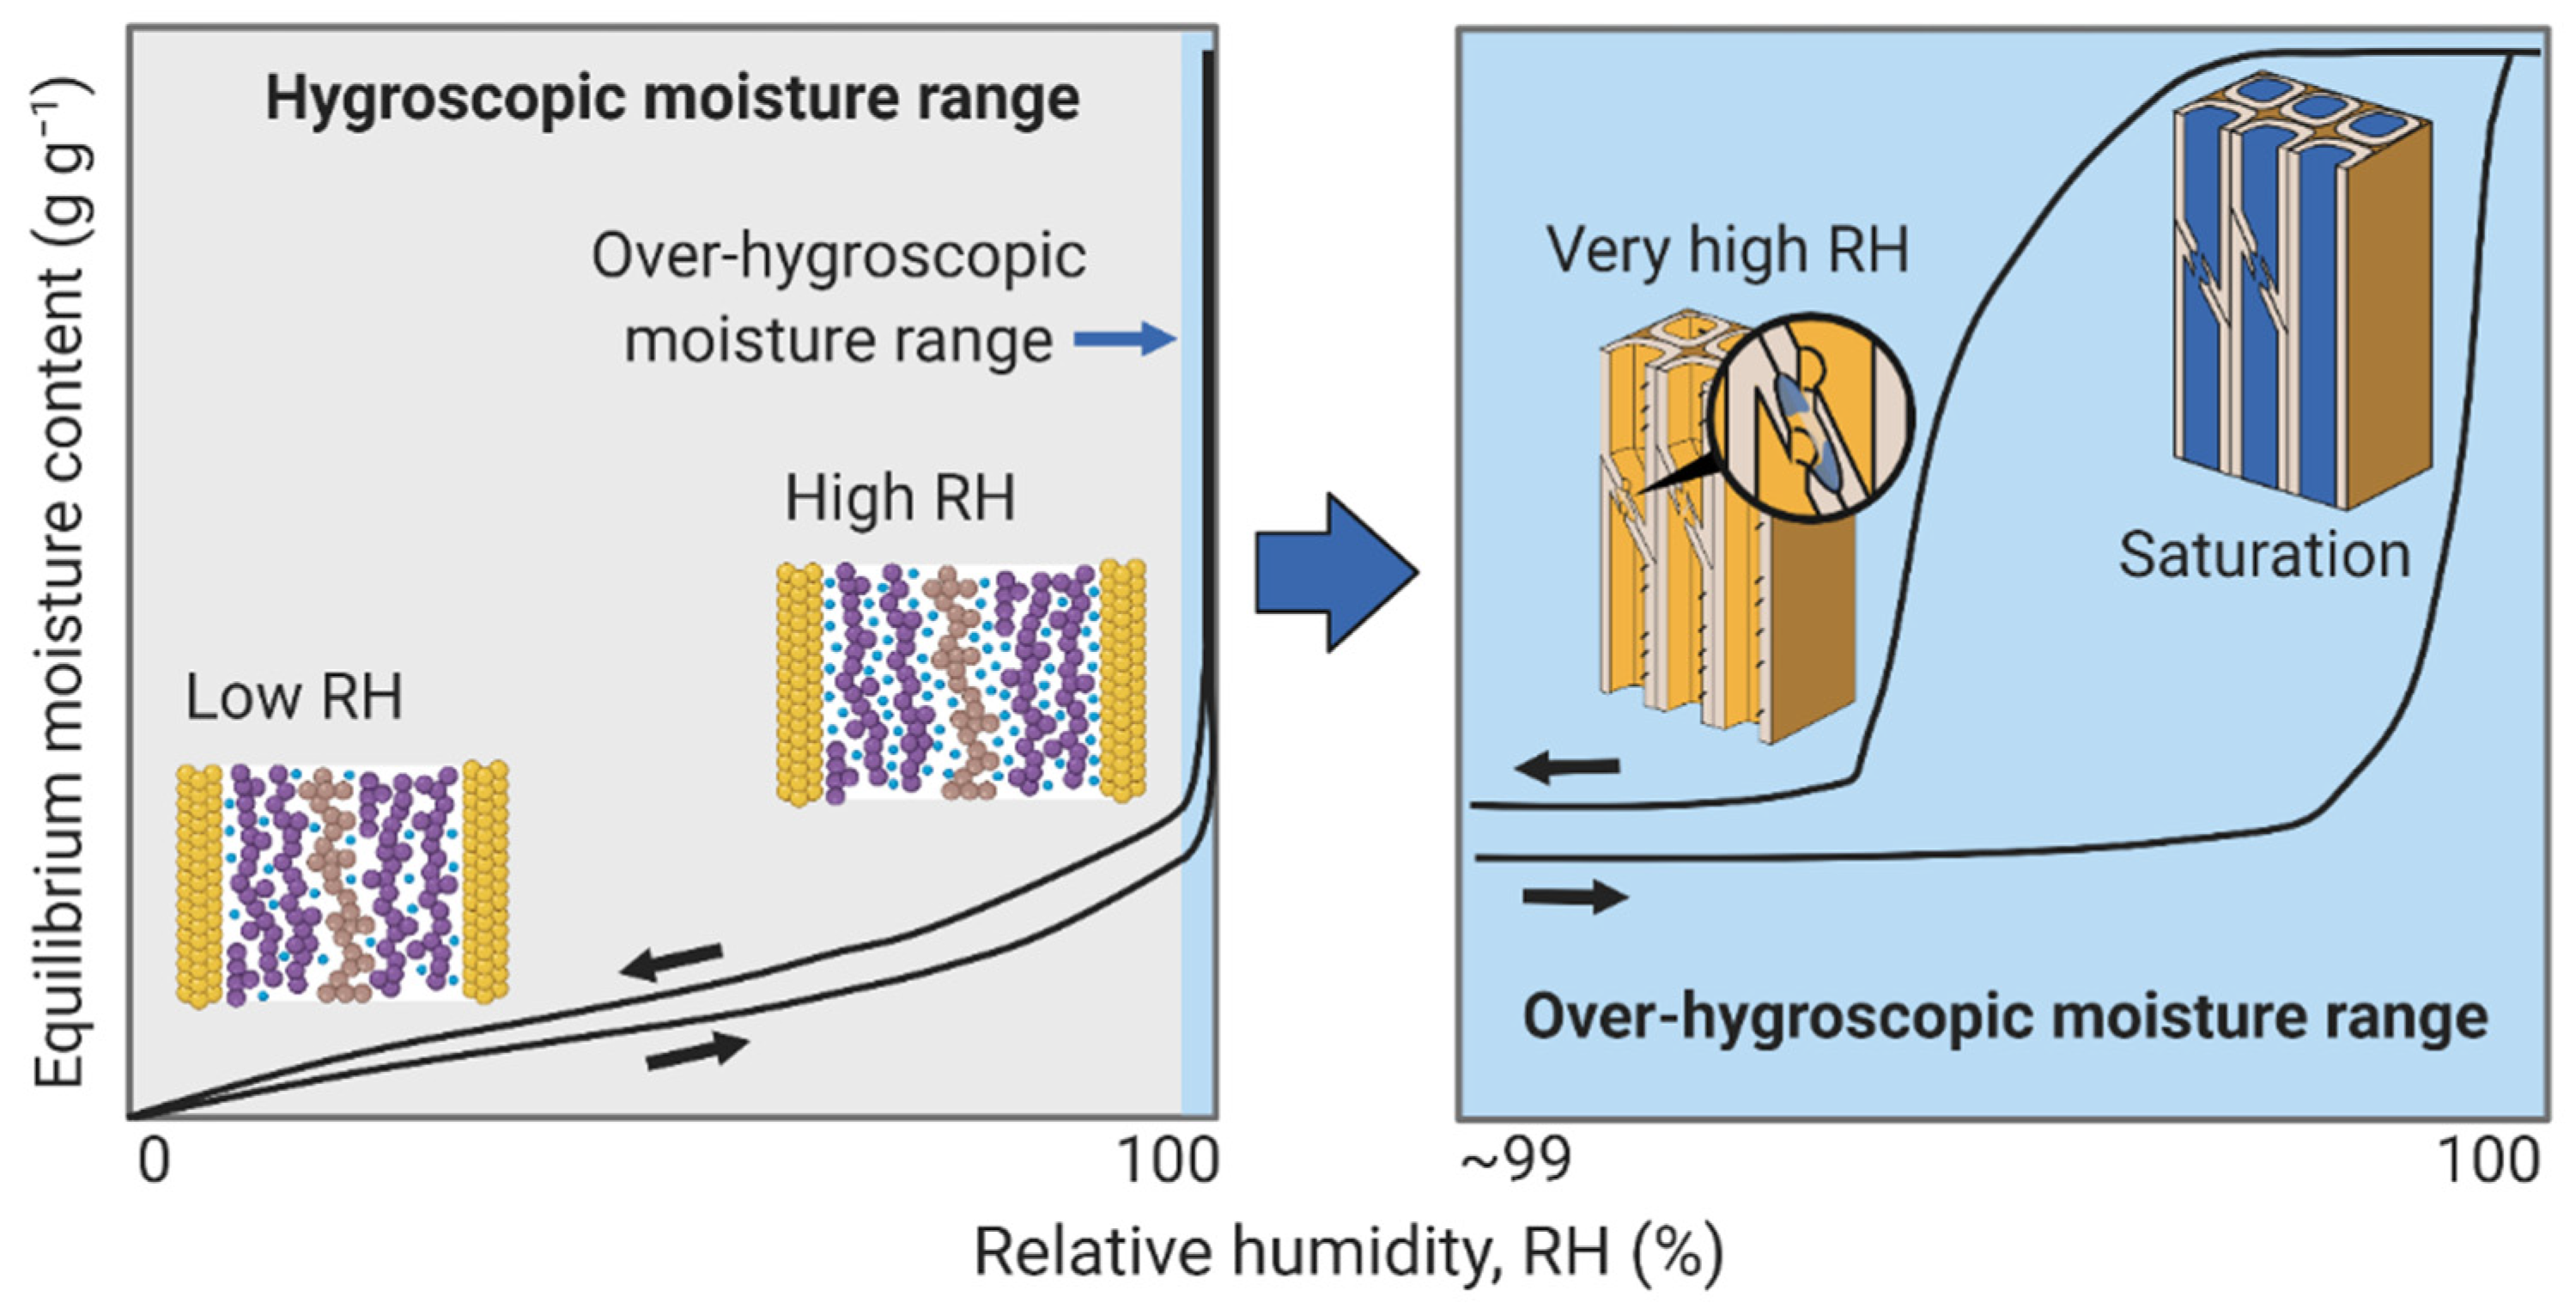
3. Wood–Water Equilibrium States

When placing a dry piece of wood in a climate with a certain RH and temperature, the wood will start to absorb water vapor from the air and the mass of the wood will increase. This will occur until the piece of wood is in equilibrium with the ambient RH and temperature. The wood has then reached its equilibrium state and the mass will no longer change as long as the climate is kept constant. The uptake of water occurs by water vapor sorption. This refers to the change in phases of water molecules from the vapor phase to a condensed phase in wood, where the water molecules are located within the cell wall or the capillary structure (Section 2).
The sorption process involves the creation or disruption of strong intermolecular attractions between water molecules and wood polymers. The exchange of water molecules occurs in both directions: absorption refers to water vapor uptake by wood and desorption refers to the release of absorbed water to the vapor phase. In much of the wood science literature, the absorption of water vapor is often referred to as adsorption. However, the term adsorption strictly refers to processes at an interface according to consensus definitions by IUPAC (International Union of Pure and Applied Chemistry). The sorption of water molecules in the bulk of the wood cell walls and the macro-void structure is more consistent with the term absorption.
The moisture content of wood is defined as the mass ratio of water to dry solid material (g g−1). In this review, moisture content is given the symbol u, and the moisture content at equilibrium is denoted ueq. Moisture content is also commonly expressed as a percentage of dry solid mass. The relationship between ueq and RH of the environment at a given temperature is known as the water vapor sorption isotherm, as illustrated in Figure 2. This relationship is fundamental to the understanding of wood-water interactions.
The full range of RH values from 0 to 100% is commonly divided into two sections: the hygroscopic and the over-hygroscopic range. This division reflects differences in the dominant sorption mechanisms as well as the experimental techniques for moisture conditioning of samples. The hygroscopic range extends from 0% to about 95%–98% RH; the upper limit of this range may depend on the specific material and does not necessarily reflect an abrupt transition (Figure 2). In the hygroscopic range, water is primarily located within the wood cell walls, interacting with polymers by hydrogen bonding. The over-hygroscopic range extends above about 95%–98% RH to full saturation, where the additional water is largely capillary water in the macro-void structure (Figure 2).
Cell wall water interacts strongly with cellulose, hemicelluloses, and lignin, mainly by hydrogen bonding with the hydroxyl groups (Section 2; see also [68,69]). The absorption of water in the cell wall involves several physicochemical phenomena that may affect the equilibrium state. These include the release of heat as water molecules change from the vapor state to the absorbed state (Section 3.2), the mechanics of the cell wall as it swells (Section 5), diffusion of water molecules into the solid cell walls (Section 7.2), and glass transition of the amorphous polymers that are plasticized by water [70]. In addition, water sorption in wood exhibits hysteresis in both the hygroscopic range and the over-hygroscopic range (Section 6). Further influential factors include the relative proportions of ordered cellulose, amorphous cellulose, hemicelluloses, and lignin, and the amounts of mineral ions and extractives in the wood cell wall [24,71,72,73,74,75]. The understanding of these phenomena continues to advance as new insights are gained, in part because of the development and refinement of experimental techniques and analytical tools. The following sections discuss the need for reliability when measuring wood–water equilibrium states, thermodynamic relations, and sorption models for the hygroscopic range, followed by a discussion of the over-hygroscopic range.

3.1. Care When Measuring at Moisture Equilibrium States

Experimental measurements are fundamental for describing the relationships between ueq, RH, and temperature. Reliable measurements provide a basis for thermodynamic analysis (Section 3.2) and for validating empirical and theoretical sorption models (Section 3.3). Additionally, the measurement of equilibrium states is important for relating dimensional changes to ueq (Section 5) and characterizing sorption hysteresis (Section 6). It is therefore critical that care is taken when conditioning specimens to equilibrium and taking measurements. This section highlights several important considerations that influence data quality. Further information on measurement techniques can be found in recent reviews [76,77,78].
Reliable measurements of equilibrium states depend on several key criteria [78]. Foremost is the operational definition of equilibrium; most often a mass stability criterion is used, meaning that the moisture content is assumed to be sufficiently close to equilibrium when the rate of change in mass under constant environmental conditions with time becomes arbitrarily small. Definitions differ in two aspects: the size of the mass change and the time interval over which the criterion is applied. For manual measurements, time intervals up to 24 h or more with a change in mass of less than 0.1% are typical [79]. For automated instruments, an often-reported criterion is a rate of change in moisture content less than 0.002% min−1 (20 µg g−1 min−1) over a 10-min period [80,81]. Moisture contents reached when this criterion is met are claimed to be within 0.001 g g−1 of the equilibrium value measured at the extended time [80], although no supporting data have been presented to verify this claim. The criterion has, however, been found to yield much larger errors than previously thought when compared to extended measurements where the change in mass was on the order of the inherent mass stability of the instrument [82]. Further discussion and recommendations for minimizing error can be found in [78,82].
Additional criteria that affect the quality of sorption measurements are the calibration accuracy of mass, temperature, and RH measurements, and the stability of temperature and RH conditions [78]. In general, in situ weighing is preferred to avoid disturbances from specimen exposure to the surrounding environment. The effects of sorption history are discussed in Section 6.

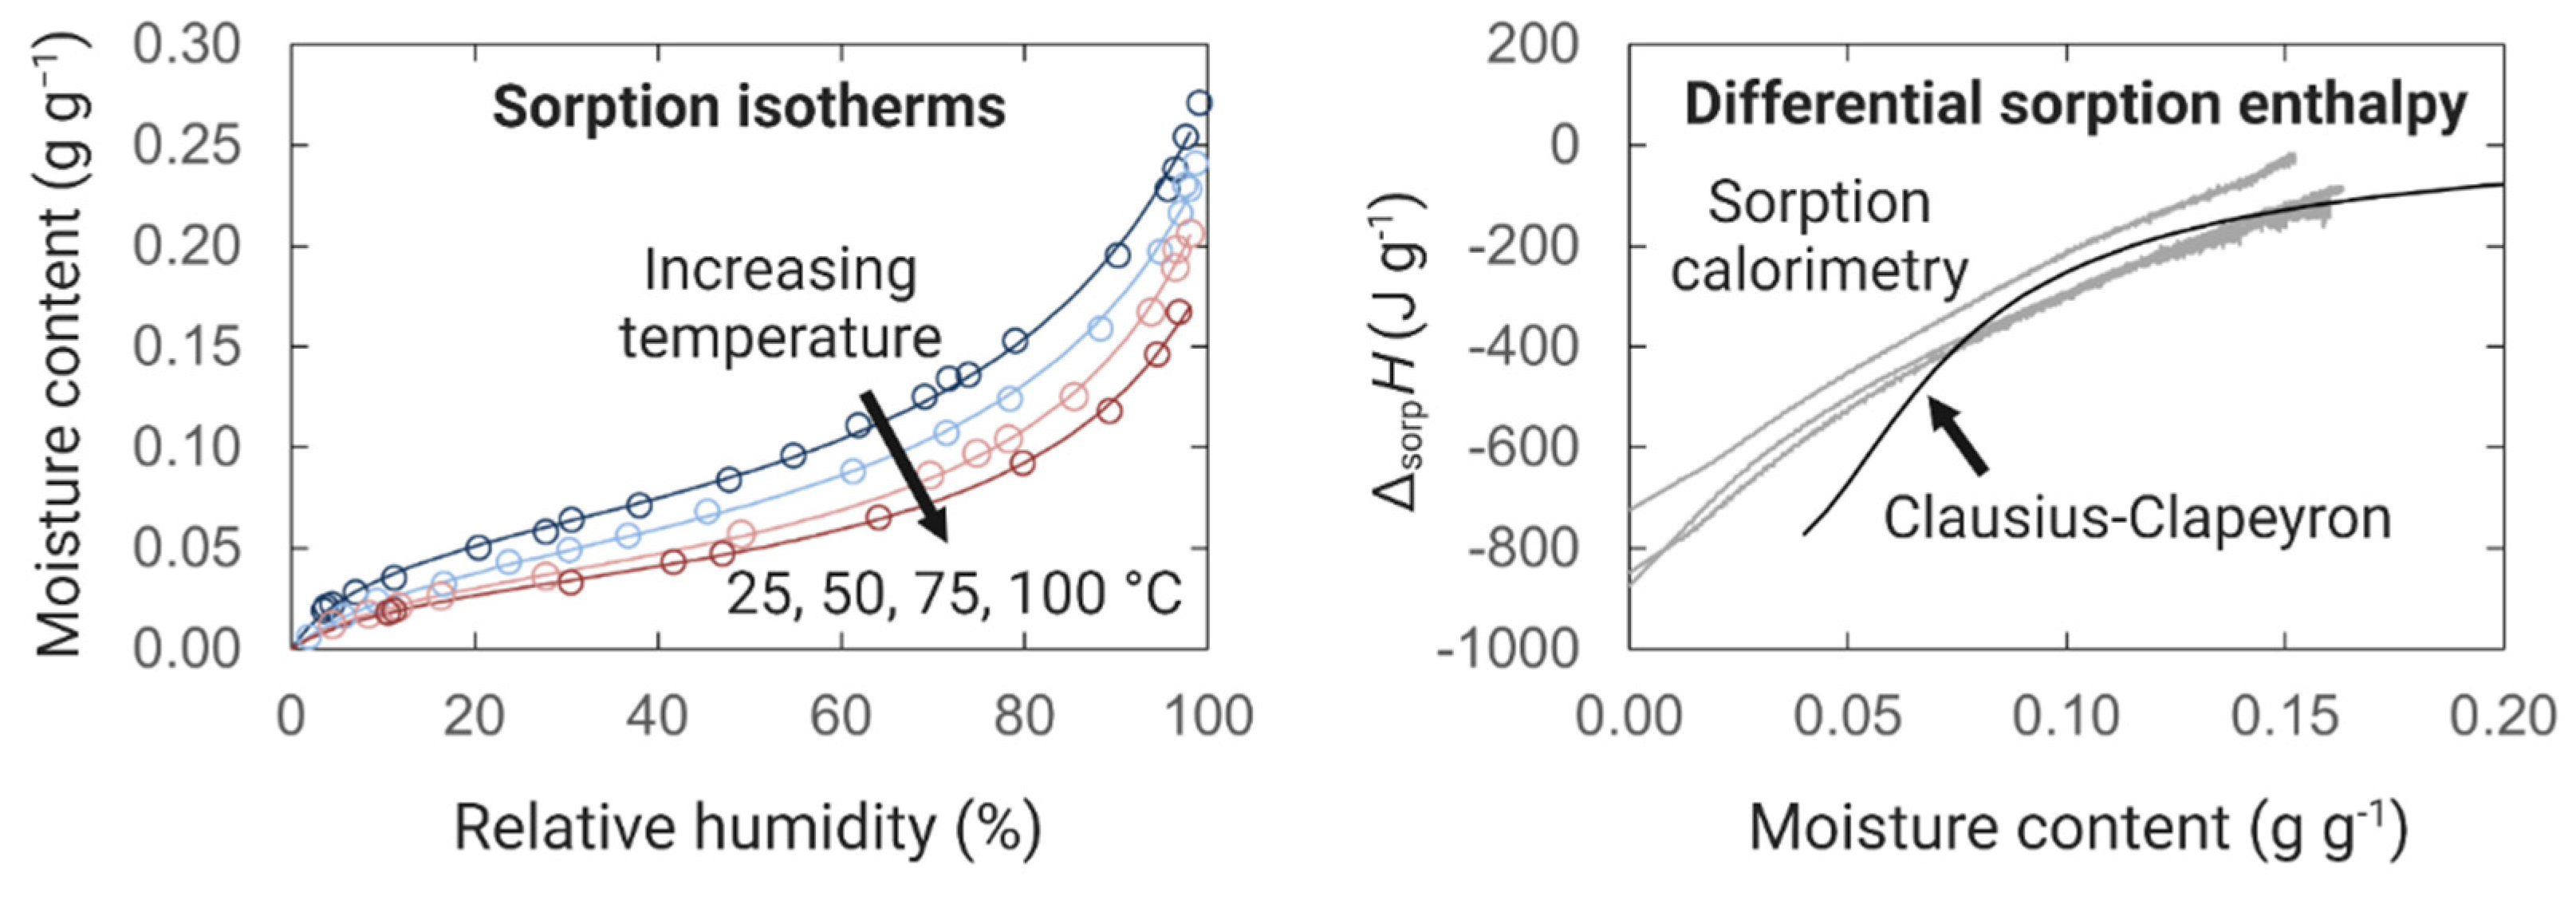
3.2. Thermodynamics of Sorption

Thermodynamic equilibrium refers to the condition of a system in which there is no net flow of heat or mass. Sorption isotherms are not strictly reversible but exhibit hysteresis (Section 6), so thermodynamic relations discussed in this section need to be treated with care. Nonetheless, they do provide insight into wood–water interactions.
Two general approaches are used for measuring the energy of interaction between water and wood [83,84]. The first is calorimetry, which involves the direct measurement of heat given off by a process. Various types of calorimetry have been used for studying water in wood, including sorption calorimetry, solution calorimetry, and isothermal calorimetry [15,84]. Several quantities can be measured. For the absorption process starting from an initially dry solid and reaching equilibrium moisture content ueq, the integral enthalpy of sorption refers to the total heat given off, expressed per gram of dry solid. At a particular value of ueq, the differential enthalpy of sorption ΔsorpH is the derivative of the integral enthalpy of sorption with respect to ueq; it is also the difference between the enthalpy of absorbed water in wood at ueq and pure liquid water at the same temperature (Figure 3). The differential enthalpy is expressed per mole of water or per gram of water (also known as mixing enthalpy in [84]). The enthalpy of wetting refers to the total heat given off when a solid starting at some initial ueq is brought to full water saturation; this quantity is expressed per gram of dry solid.
The second approach involves the analysis of sorption data acquired at multiple temperatures (Figure 3). Water activity, aw, (or relative humidity) is the ratio of the partial pressure of water vapor in equilibrium with the material at a constant temperature to the water vapor saturation pressure (vapor in equilibrium with pure liquid water) at the same temperature. The natural logarithm of the water activity required to achieve a specified ueq is plotted versus inverse absolute temperature. The differential enthalpy of sorption, ΔsorpH (J mol−1), for a given ueq can then be calculated by the Clausius-Clapeyron equation:
Δ sorp H = R d ln a w   d ( 1 / T ) | u eq
where R (8.31446 J mol−1 K−1) is the gas constant and T (K) is the absolute temperature. Equation (1) relies on the assumption that water vapor can be described by the ideal gas law and that the molar volume of absorbed water is negligible compared to the molar volume of water vapor. These assumptions are reasonable approximations below 100 °C but introduce error at higher temperatures. Another limitation of Equation (1) in practice is that the enthalpy is not independent of temperature over large temperature ranges. For example, the enthalpy of vaporization of pure water changes by 8% between 25 °C and 100 °C. It should be noted that the Clausius-Clapeyron equation requires water activity values at constant ueq, which often necessitates interpolation between measured data.
In addition to enthalpy values, an important thermodynamic quantity is the Gibbs energy of sorption, ΔsorpG, expressed per mole of water or per gram of water. This quantity is the difference between the chemical potential of absorbed water in wood at ueq and pure liquid water at the same temperature. The Gibbs energy of sorption, ΔsorpG (J mol−1), is calculated as
Δ sorp G = R T ln a w
The Gibbs energy of sorption is negative, indicating that the sorption process is spontaneous; absorbed water in wood is thermodynamically more favorable than pure liquid water. As the water activity approaches unity, ΔsorpG goes to zero. The differential entropy of sorption, ΔsorpS, describes the degree of disorder of absorbed water in wood relative to pure liquid water. It can be calculated from the general relationship
Δ sorp G = Δ sorp H T Δ sorp S
Direct enthalpy measurements of water sorption in wood by calorimetry are scarce in the literature [6,15,87,88], and most enthalpy values of water sorption in wood are derived from the Clausius-Clapeyron equation [89,90,91,92]. However, the development of sorption calorimetry [93,94,95] in the last two decades provides new opportunities for direct measurements that could improve our understanding of wood-water interactions [84], not only for native wood but also for modified wood of various kinds.

3.3. Equilibrium Sorption Models

Equilibrium sorption models are often used for predicting the equilibrium moisture content in specific environments and for the physical interpretation of wood–water interactions. These models describe ueq as a function of temperature and RH. Numerous models exist in published literature. For instance, van den Berg and Bruin [96] reviewed 77 different models, and multiple models have been developed since then. Various empirical models have been evaluated for goodness of fit to sorption data for wood [97,98,99,100]. Other models are derived from theories describing the sorption process in an idealized physical system, including well-known models such as the Guggenheim-Anderson-de Boer (GAB) [101,102,103,104], Hailwood-Horrobin [105], and Dent [106] isotherm models. In the scientific literature, these models are often used to predict properties of wood such as the monolayer capacity, which is a representation of the number of available sorption sites in the material. Thybring et al. [107] fitted twelve equilibrium sorption models, including the GAB, Hailwood-Horrobin, and Dent isotherm models, to high-quality water vapor sorption isotherm data for wood at multiple temperatures. Physical properties predicted by the models were compared with independently measured values of hydroxyl accessibility, relative amounts of primary and secondary water, and differential enthalpy of sorption. None of the models accurately predicted any of the physical properties. Uncertainty analysis showed that the disagreement between predicted values and experimental measurements could not be attributed to experimental error. Therefore, it must be concluded that these equilibrium sorption models are not valid for water in wood cell walls despite the good fit they provide. However, these models can be reduced to a common mathematical form
a w u eq = A a w 2 + B a w + C
where A, B, and C are independent fitting parameters. Zelinka et al. [85] suggested that this “ABC isotherm” can be useful for empirical fitting and is free of the (incorrect) theoretical frameworks associated with these other models.
Many additional models applied to water vapor sorption in wood were reviewed in the 1980s [19,98,99]. Although some of these models provide good empirical fits, none have been independently validated for water sorption in wood. Several models have since been developed and applied to wood. The excess surface work model [108,109] is based on a thermodynamic function calculated directly from measured values; however, interpretation of the model involves the problem described above, that the monolayer capacity for water in wood obtained from the model is relatively similar to those found by the GAB, Hailwood-Horrobin, and Dent isotherm models, which do not agree with independent measurements of hydroxyl accessibility.
The sorption site occupancy model [110,111] is roughly consistent with hydroxyl accessibility measurements, explains the temperature dependence of water sorption isotherms, and offers a way to quantify sorption hysteresis. Another model uses an equation of state approach [112] based on balancing chemical, colloidal, and mechanical forces at multiple length scales using simplified, idealized geometries to represent cell wall polymers; it explains the temperature dependence of water sorption isotherms and sorption-induced swelling but does not address sorption hysteresis. While these approaches seem promising, the sorption data at multiple temperatures used for comparison have been found to be unreliable [78]. Further development and investigation of these approaches and comparison with reliable independent measurements are needed. In summary, a valid physical model would correctly account for molecular sorption sites, distinct populations of cell wall water, and the energy of interaction between water and wood. In addition, it would elucidate the role of water-induced swelling, glass transition of amorphous polymers, and sorption hysteresis.

3.4. Over-Hygroscopic Range

Wood in equilibrium with high levels of RH will not only contain cell wall water, but also capillary water in the macro-void structure, e.g., cell lumina and pit chambers. The amount of water taken up in the macro-void structure is closely related to the density of the wood, since lower density corresponds with a larger macro-void volume available for liquid water. Equilibrium between liquid capillary water and RH is described by the Kelvin equation [113]:
ln ( a w ) = γ M w cos θ R ρ w T ( 1 r 1 + 1 r 2 )
where aw (−) is water activity (or equilibrium RH), γ (N m−1) is the surface tension of water, Mw (0.018 kg mol−1) is the molar mass of water, θ (rad) is the contact angle, ρw (kg m−3) is the density of water, and r1 and r2 (m) are the two principal radii of curvature of the vapor-liquid interface. For a slit-shaped void r2 = ∞, whereas for a cylindrical void r1 = r2.
Liquid water in capillaries can thus be in equilibrium with relative humidity levels less than 100% if the water-containing void is smaller than the size defined by the principal radii of curvature. If this condition is met, capillary water will arise in porous materials by capillary condensation, i.e., water vapor will condense to liquid water in the voids. The higher the RH, the larger voids can contain capillary water in equilibrium with the surrounding climate. The voids in the wood structure are predominantly found in the micrometer range, and therefore equilibrium between capillary water in these voids and RH is only found at very high levels of humidity above 99% RH [26,114].
Investigating equilibrium states in the over-hygroscopic moisture range requires different experimental techniques for moisture conditioning than in the hygroscopic range. This is because of the difficulties in maintaining stable humidity conditions close to saturation which cannot be achieved with conventional moisture conditioning methods such as saturated salt solutions [26,78]. Instead, the pressure plate and pressure membrane techniques are needed, which were originally developed for use in soil science. The two techniques rely on the control of the curvature of water menisci by an applied pressure to produce a specific very high RH which is related to the applied pressure by:
ln ( a w ) = M w Δ P R T ρ w
where ΔP is the pressure relative to the atmospheric pressure (Pa). The maximum pressure in the pressure plate technique is around 15 bar which corresponds with 98.9% RH at 20 °C, whereas the pressure membrane technique can handle applied pressures up to 100 bar corresponding with around 92.9% RH [26]. In order to construct sorption isotherms in the over-hygroscopic moisture range, specimens are conditioned to several levels of pressure (relative humidity) and their equilibrium mass is determined.

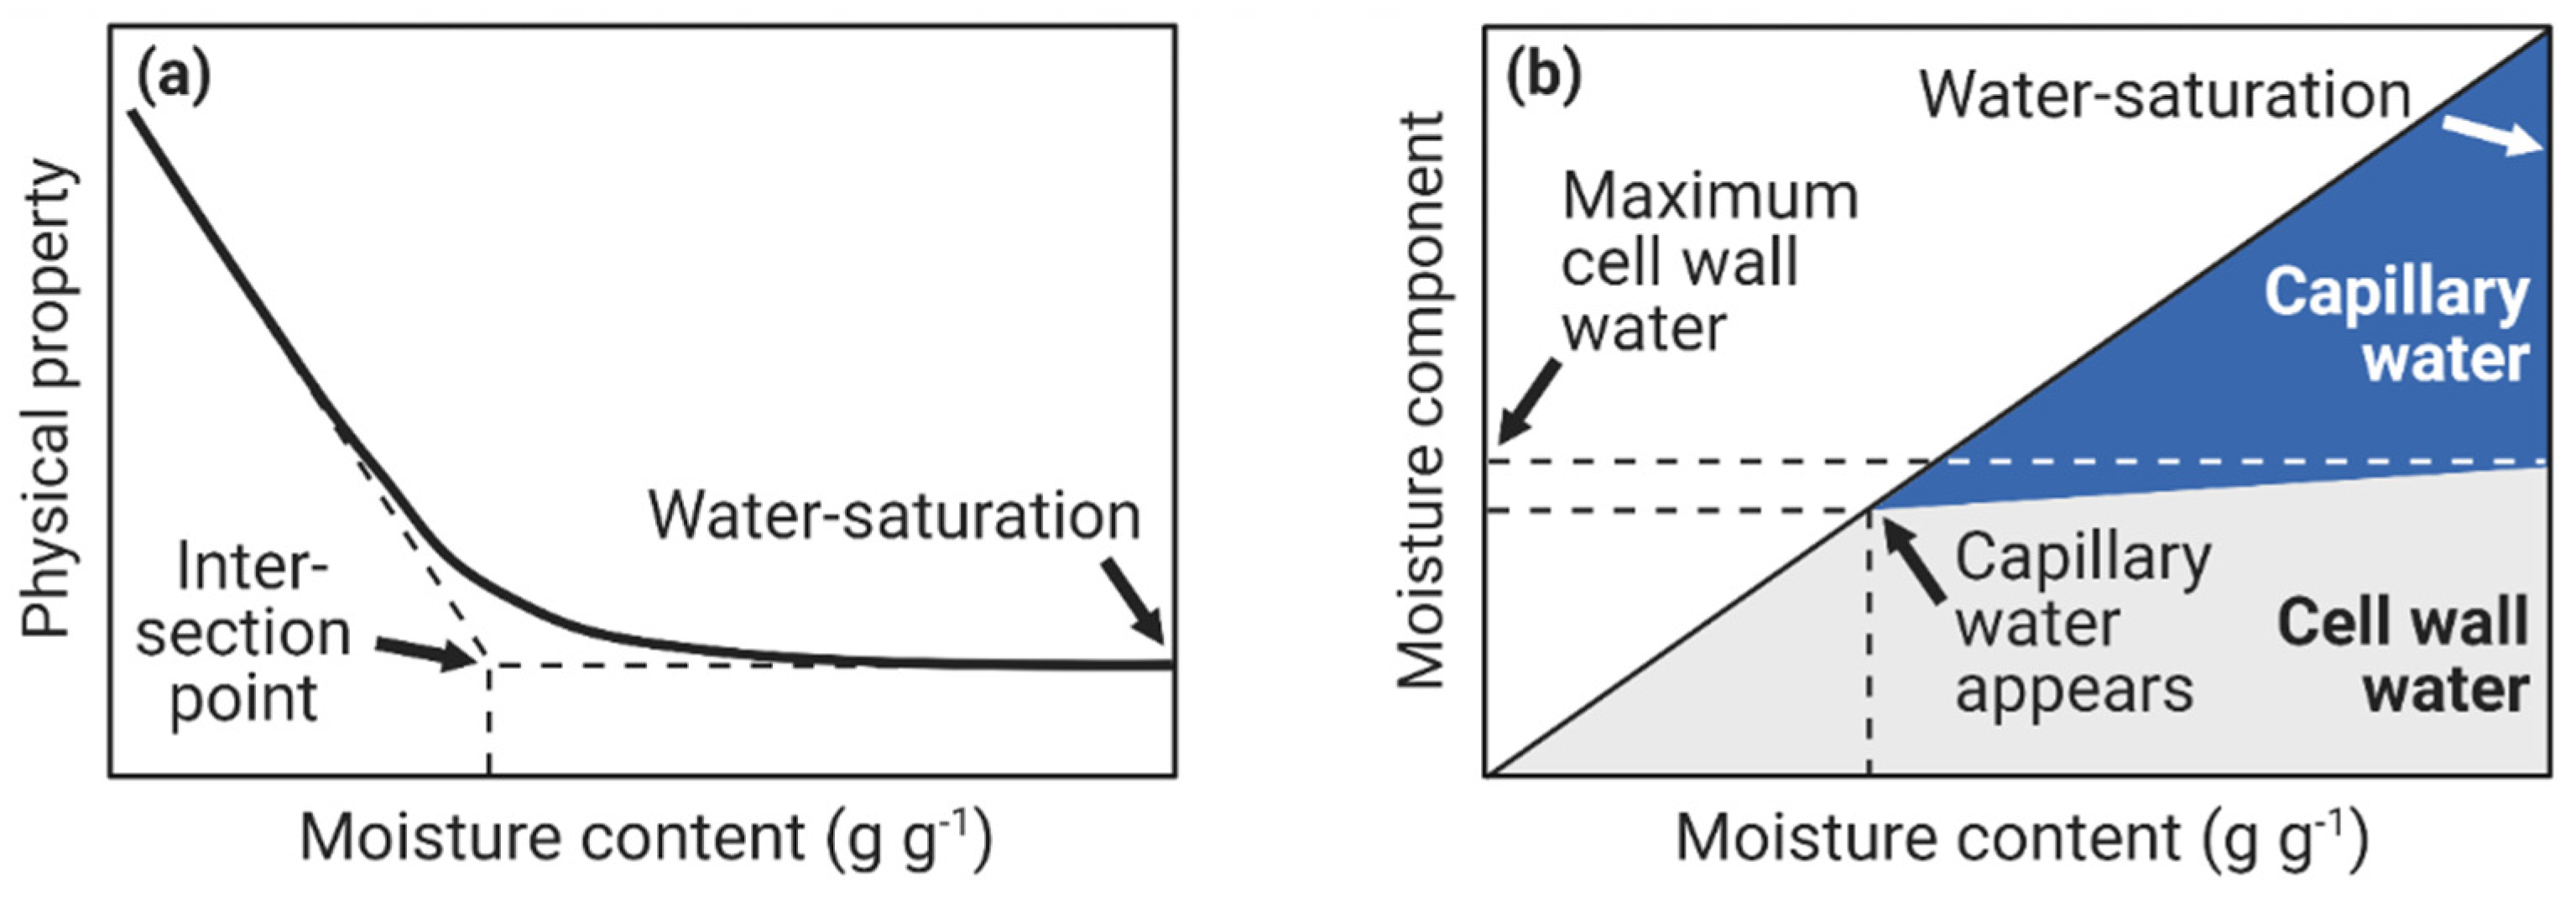
4. Fiber Saturation Point and Maximum Cell Wall Moisture Content

The “fiber saturation point” (or FSP) is an important concept in wood-moisture relations. Despite its practical and theoretical importance, there is little consensus in the wood literature about how the FSP should be defined and measured. Below, we discuss the original definition of the fiber saturation point and how this definition may be partially responsible for the lack of consensus in the literature.

4.1. Original Definition of the Fiber Saturation Point

FSP was originally defined by Tiemann in 1906 [4] who examined the effect of moisture on the strength and stiffness of wood. Tiemann observed that the crushing strength of wood did not depend upon moisture content above a certain value. Below this threshold of moisture content, the strength became moisture-dependent. Tiemann used this observed threshold in the crushing strength to define FSP in the following words,
“In drying out a piece of wet wood, since the free water must evidently evaporate before the absorbed moisture in the cell walls can begin to dry out, there will be a period during which the strength remains constant although varying degrees of moisture are indicated. But just as soon as the free water has disappeared and the cell walls begin to dry the strength will begin to increase. This point I designate the fiber-saturation point.”
These three sentences were the first description of the FSP and they have been interpreted and reinterpreted many ways throughout the wood literature. Importantly, it should be noted that Tiemann’s definition actually describes three different states and implicitly assumes that they are found at the same moisture content. He describes a state at which the strength begins to change with decreasing moisture content. This is what he observed in his experiment. Tiemann’s definition of the FSP assumes that the state at which property changes begin represents the same state where no capillary water is present in the wood as well as the state where the cell walls are fully saturated. Since the work of Tiemann over 100 years ago, it has been shown experimentally that the moisture content at which physical properties, such as dimensions, begin to change is not the same moisture content at which the cell walls are fully saturated [114,115,116,117]. Therefore, it must be concluded that the fiber saturation point as Tiemann described it cannot actually exist. However, the FSP is often measured and reported for different wood species and wood modifications. Not surprisingly, there is a wide range of reported FSPs and many proposed measurement techniques.

4.2. Subsequent Interpretations of the Fiber Saturation Point

Many different methods have been used to determine FSP. Each of these methods contains implicit assumptions about what the FSP is since the definition is not consistent. Tiemann based his FSP of observations on the strength of wood. However, many wood properties exhibit a change in behavior around a given moisture content. Researchers have determined the FSP from strength or stiffness [4,118], dimensional changes [119,120], and electrical conductivity [121,122,123]. These techniques focused on the part of Tiemann’s definition, which describes a change in property. Hence, in these studies, the FSP was identified as the moisture content at the intersection point between the moisture content range in which the physical property changes and the range in which it is constant, as illustrated in Figure 4a.
In contrast, other methods focused on measuring the saturation moisture content of the wood cell wall, which was invoked in Tiemann’s speculative explanation. These methods include DSC [124,125,126,127], low-field NMR relaxometry [128,129,130,131,132], and solute exclusion [126,133,134,135]. In these methods, a fully water-saturated sample at its maximum moisture content is normally used. All three methods calculate the amount of capillary water in the sample, and by subtracting this quantity from the total moisture content, the cell wall moisture content can be determined. If the wood is fully water-saturated, these techniques determine the maximum cell wall moisture content, as illustrated in Figure 4b. Some of the techniques can also measure the cell wall moisture content in non-saturated states, e.g., DSC and low-field NMR, and determine the amount of capillary water present. Hereby, the state hypothesized by Tiemann where capillary water first appears in significant amounts could be determined (Figure 4b). However, this requires careful conditioning of samples to avoid moisture gradients which would give erroneous results.

4.3. Maximum Cell Wall Moisture Content

The previous sections highlight the complications with using the term “fiber saturation point”. The original definition contained an implicit equivalence between three states of water in wood that was later shown to be incorrect. Therefore, it is necessary to distinguish between the intersection point for property changes and the maximum cell wall moisture content. For clarity, if it is the cell wall moisture content in the water-saturated state that is measured by e.g., DSC, low field NMR, or solute exclusion, it is advantageous to consistently call this moisture content “the maximum cell wall moisture content”. The use of the term “FSP” should perhaps be reserved for measurements related to changes in mechanical properties and dimensions to avoid further confusion.

5. Moisture-Induced Shrinkage and Swelling

Shrinkage and swelling can refer to a change in volume or a change in a single dimension (e.g., length in the radial, tangential, or longitudinal direction). Swelling is defined as the change in volume or length relative to the value in the dry state, whereas shrinkage is defined as the change in volume or length relative to the value in the water-saturated state. When water is absorbed by the cell wall, the wood swells, and when water is removed from the cell wall, the wood shrinks. In the dry state, the wood cell walls are virtually non-porous [136,137,138]. Therefore, the absorption of water molecules in the cell walls creates nano-pores [139] and causes an expansion of the material (swelling). Subsequent desorption of water causes the nano-pores to collapse and results in a contraction (shrinkage). The following sections discuss the physical mechanisms involved in shrinkage and swelling on multiple scales and its anisotropy.

5.1. Shrinkage and Swelling on Multiple Scales

Shrinkage and swelling can be observed on all length scales of wood, from the nano-scale to the bulk scale. For bulk wood, the dimensional changes are approximately linearly correlated with moisture content in the range from 0.05 g g−1 to 0.25–0.30 g g−1 [140,141,142]. In the over-hygroscopic range, the uptake of water occurs simultaneously in the cell walls and macro-void structure, but only uptake in cell walls causes dimensional changes. Therefore, shrinkage and swelling as a function of moisture content decrease in the over-hygroscopic range as the capillary water becomes increasingly dominant, and the dimensional changes eventually diminish at moisture contents above 0.40–0.45 g g−1 [140,141,142].
On the nano-scale, swelling results in an increased distance between the cellulose microfibrils, since water molecules do not penetrate the interior of these [52,143]. However, the forces generated within the cell wall during shrinkage and swelling will cause deformation of the microfibrils [144,145] (Figure 5e,f).

5.2. Anisotropy in Shrinkage and Swelling

The various anatomical directions of wood do not expand or contract equally; in fact, wood exhibits significant swelling anisotropy, i.e., differences in swelling between different material directions. In the longitudinal direction of wood, the dimensional changes are typically much smaller than in the radial and tangential directions (Figure 5a). The reason for the smaller changes in the longitudinal direction is the orientation of the cellulose microfibrils. The majority of the cellulose microfibrils are oriented with only a small angle to the longitudinal direction, which has a stiffening effect. This angle between the longitudinal direction and the orientation of the microfibrils is called the microfibril angle (MFA). Some wood cells, e.g., compression wood in softwoods or juvenile wood, have a larger MFA than normal mature wood (Figure 5b). These wood cells have larger dimensional changes in the longitudinal direction, but smaller dimensional changes in the radial and tangential directions because of increased stiffening from the microfibrils [147,149,150].
Swelling anisotropy cannot be understood from microfibrillar orientation alone. Swelling and shrinkage also differ between the radial and tangential directions with the tangential swelling being about twice as large as the radial. This swelling anisotropy is observed on several length scales, from isolated micro-pillars of cell wall material [151] to isolated tissues of early- and latewood [148,152,153] to bulk wood [154,155]. On the cell wall scale, the arrangement of the microfibrils in concentric lamellas [156] might cause the swelling anisotropy observed for isolated cell wall material. However, this cannot explain why the swelling in thickness of tangential cell walls is about twice as high as in radial cell walls [157,158,159].
On the tissue scale, isolated material of earlywood exhibits a larger anisotropy than isolated latewood [148,152,153,159,160] (Figure 5c,d). This could be a result of a stiffening effect from the radially aligned ray cells which are relatively stiffer compared with earlywood than with latewood tissue [152,160]. When placed adjacent to each other in bulk wood, the shrinkage and swelling of earlywood and the relatively stiffer latewood will interact and affect the overall swelling anisotropy [148,152,158] (Figure 5c,d). Thus, there are structural organisations and differences in mechanical stiffness between wood elements (cell wall biopolymers, cell wall layers, tissue types, etc.) that can affect the dimensional changes on multiple length scales. This complicates the study of dimensional changes induced by water and the analysis of the fundamental mechanical and other physical causes controlling it [161].

5.3. Changing Shrinkage and Swelling by Modification

To further study the underlying mechanisms controlling swelling and its anisotropy, it is possible to use wood modification as a tool to tune the cell wall properties [53]. Since the cell wall mechanics and hereby the swelling of wood depend on the cell wall chemistry, modification can affect both of these. One of the initial targets of wood modification was to create a more dimensionally stable material [162]. Therefore, a lot of the modifications that limit the available space for water within cell walls exhibit smaller dimensional changes as a result of reduced water uptake. However, it is also possible to modify the internal space for water in cell walls by selective removal of cell wall components [133] or thermal modification [163]. For the latter, swelling depends on the process conditions, which can be tuned to either increase or decrease swelling by controlling the extent of cross-linking reactions during modification [163]. Cross-linking affects the cell wall stiffness and limits stress relaxation, which can also be achieved by chemical reaction of hydroxyls with for example glyoxal or glutaraldehyde [164]. Thus, the swelling of the cell wall material can be manipulated by tuning properties such as the cell wall mechanics and internal space for water, even while increasing the hydroxyl accessibility of the modified cell walls [165].

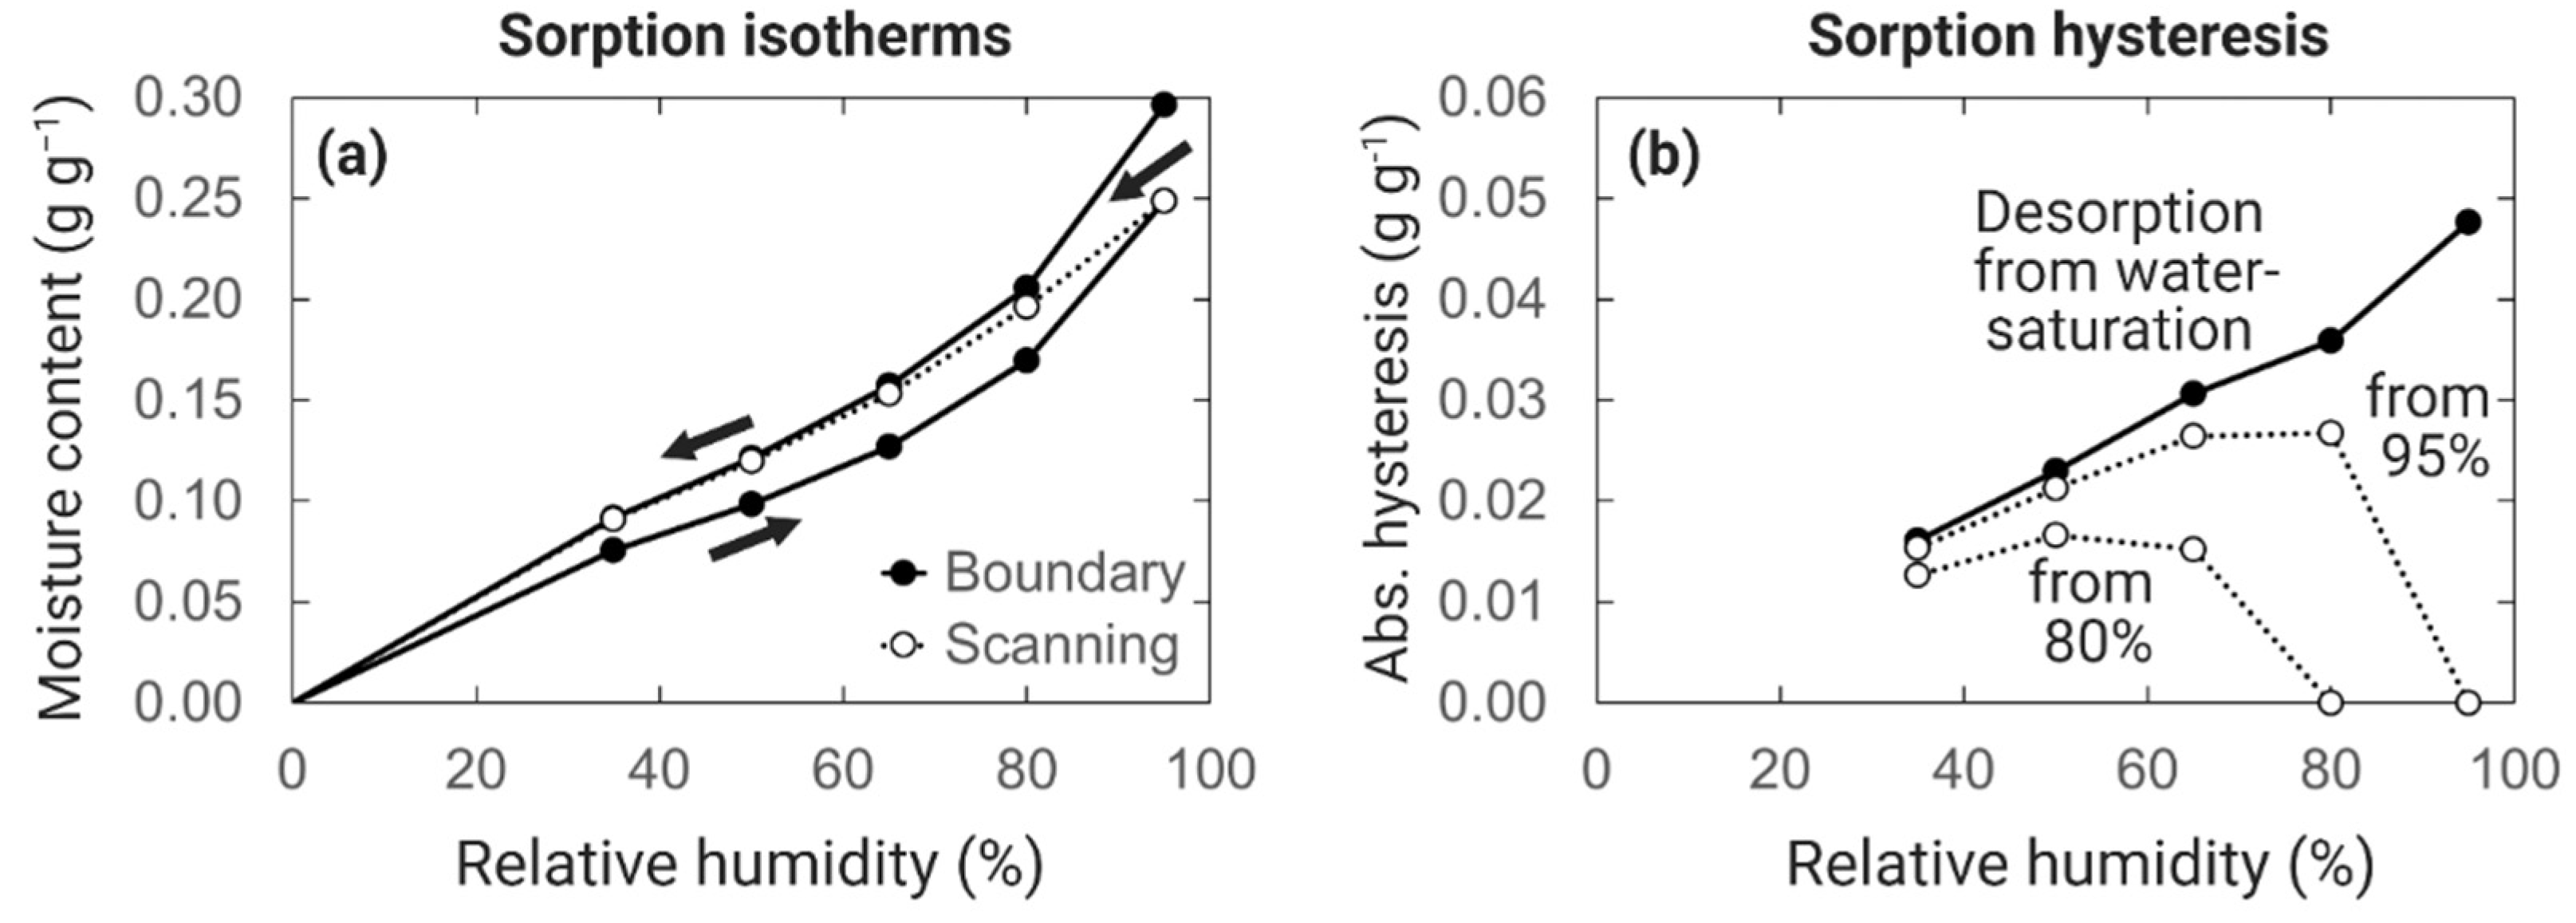
6. Moisture History Dependence

One of the complexities of studying water in wood is that the moisture state of wood is path-dependent, i.e., the state depends on the moisture history. Thus, the moisture content in equilibrium with a specific RH depends not just upon the level of RH, but also on whether the wood approached equilibrium by desorption from a higher RH or by absorption from a lower RH. This path dependence, called sorption hysteresis, is also observed in porous materials that do not swell with changes in moisture content. Moreover, wood appears to exhibit swelling hysteresis on the bulk scale, i.e., its volumetric changes with moisture depend on whether equilibrium is reached by absorption or desorption. The following sections discuss the underlying mechanisms behind sorption hysteresis in the entire moisture range and important methodological aspects for investigating sorption hysteresis and hysteresis models, as well as swelling hysteresis.

6.1. Sorption Hysteresis

Although sorption hysteresis is observed throughout the whole moisture range, the mechanisms that give rise to it are different for cell wall water and capillary water.
Sorption hysteresis in the wood cell walls in the hygroscopic region is widely acknowledged in the wood literature, but the exact mechanisms of hysteresis remain elusive. In the past decade, several different theories have been proposed. Hill et al. [166] suggested that the equilibrium moisture contents were the result of a glass transition in certain wood polymers at higher moisture contents. In this framework, rubbery polymers allow redistribution of moisture, further allowing more available hydroxyl groups. Chen et al. [69] used molecular dynamic simulations to examine hysteresis and found that the hydrogen bond network and cellulose energy landscapes are different in absorption and desorption. Engelund et al. [17] also hypothesized that the energy state was different in absorption and desorption, and attributed these differences to a mechano-sorptive effect where mechanical constraints caused by swelling affect the equilibrium moisture content.
The mechanism of sorption hysteresis in liquid (capillary) water is relatively well understood, yet there is little data on its magnitude. Capillary absorption is governed by the Kelvin equation, see Equation (5), which is a relationship between the radius of curvature of the vapor-liquid interface and the equilibrium RH [26,59] (Section 3.4). Given that many of the smallest pores in wood outside of the cell wall are on the order of 1 µm in radius, capillary condensation only contributes appreciably to the wood moisture content above 99% RH [167]. The Kelvin equation predicts that porous materials, including wood, will exhibit hysteresis at high levels of RH when a large pore has a small opening. This is the case in wood where lumina with large radii (greater than 10 µm) are connected to other cell lumina through bordered pits. This phenomenon is called the “ink bottle effect” and has been widely studied [168,169,170]. Given that most of the pore volume in wood is comprised of cell lumina connected with small bottleneck openings, the magnitude of the sorption hysteresis is much greater in the over-hygroscopic region than in the hygroscopic region [26].
Measuring hysteresis in the over-hygroscopic range is more complicated than collecting a hygroscopic sorption isotherm (Section 3.4), and less data are therefore available in the literature [168]. Fredriksson and Thybring did absorption and desorption pressure plate measurements and looked at hysteresis in the over-hygroscopic range [114]. However, because of methodological aspects, thin samples were used which allowed full access to all tracheids and eliminated the ink-bottle effects from lumen-to-lumen moisture flow through bordered pits. Hence, the focus of the study was on hysteresis in cell wall moisture content while the magnitude of the hysteresis in capillary water was underestimated in these measurements.

6.2. Care When Measuring Desorption Isotherms

One important aspect of sorption hysteresis involves the collection of desorption isotherms. Currently, most reported water vapor sorption data use an automated sorption balance (often referred to as dynamic vapor sorption or DVS) [77,81,82]. These measurements are performed with an instrument where a sample is exposed to a constant flow of gas with a known RH while the mass is continuously recorded. Such instruments allow researchers to collect data in the hygroscopic regime (0%–95% RH) very easily. Typically, these measurements present data collected in 5% or 10% RH steps, beginning with 0% RH, increasing to 90% or 95% RH, and then decreasing the RH over the same steps until 0% RH is reached. The data from increasing steps are plotted as the absorption curve and the data collected starting at 95% (or 90%) are labeled as the desorption isotherm. However, since the cell walls are not fully saturated in this moisture range [26,114], the desorption isotherm collected from 0%–95%–0% RH is not the same as an isotherm collected from a fully water-saturated state [114], as shown in Figure 6a. As a result, sorption hysteresis is underestimated, especially at higher humidity levels: at 90% RH the difference in moisture content can be as much as 0.02 g g−1 [114] (Figure 6b).
Therefore, while the desorption isotherms collected using automated sorption balances are often reported as “desorption” measurements, it should be understood that they are technically scanning desorption measurements, and the boundary desorption curve will lie above the desorption curve collected in this manner (Figure 6a).
Another important consideration for collecting desorption isotherms concerns comparing the desorption of kiln-dried or oven-dried wood to green wood. For many years, the wood science literature stated that the first (initial) desorption caused an irreversible loss of hygroscopicity (see for example [171]). In other words, once a piece of green lumber was dried, its desorption isotherm could never again approach the initial desorption isotherm. This assertion in the literature points back to the work of Spalt [172] who found differences in sorption isotherms above 70% RH in the initial and subsequent desorption cycles. However, careful work by Hoffmeyer et al. [173] showed with several different experimental techniques that if the samples are properly rehydrated to full saturation using pressure and vacuum cycles, it is possible to recreate the initial desorption isotherm. Therefore, the most recent research on this topic suggests that these apparent differences are an artifact of the measurement techniques used in early experiments on the topic.

6.3. Sorption Hysteresis Models for Wood

Several researchers have developed numeric models for sorption hysteresis in wood. These models can be used in hygrothermal (heat and moisture) or HAM (heat, air, and moisture) models that predict wood moisture content in buildings in response to the environment [175,176,177]. Many of the models can be traced back to fundamental work in the 1950s by Everett who developed a model for all materials that exhibit sorption hysteretic behavior [178]. The independent domain framework developed by Everett was further advanced by Peralta in the 1990s [179,180]. Since that time several new hysteretic models have been developed [181,182]. While these models of hysteresis may improve the accuracy of hygrothermal or HAM models, they were developed based upon isotherms collected in the hygroscopic region and do not account for the large difference between absorption and desorption isotherms in the over-hygroscopic region.

6.4. Swelling Hysteresis

The equilibrium moisture content of wood under specific climatic conditions can vary as a result of sorption hysteresis. From this follows that the wood volume under similar climatic conditions can vary as a result of the moisture history. However, the swelling of wood on the bulk scale can differ slightly at similar moisture content, for the same piece of wood, depending on whether equilibrium is reached by absorption or desorption [146,183,184,185,186] (Figure 5a). The difference in swelling is small and sometimes not observed [187]. Swelling hysteresis is also hardly seen on the tissue scale when wood swelling is studied with X-ray tomography [148,188] (Figure 5c,d). Similarly, at the nano-scale there appears to be no swelling hysteresis in the deformation of cellulose microfibrils [144] (Figure 5e,f). Therefore, the phenomenon of swelling hysteresis might only arise on the bulk scale from yet-unknown effects.

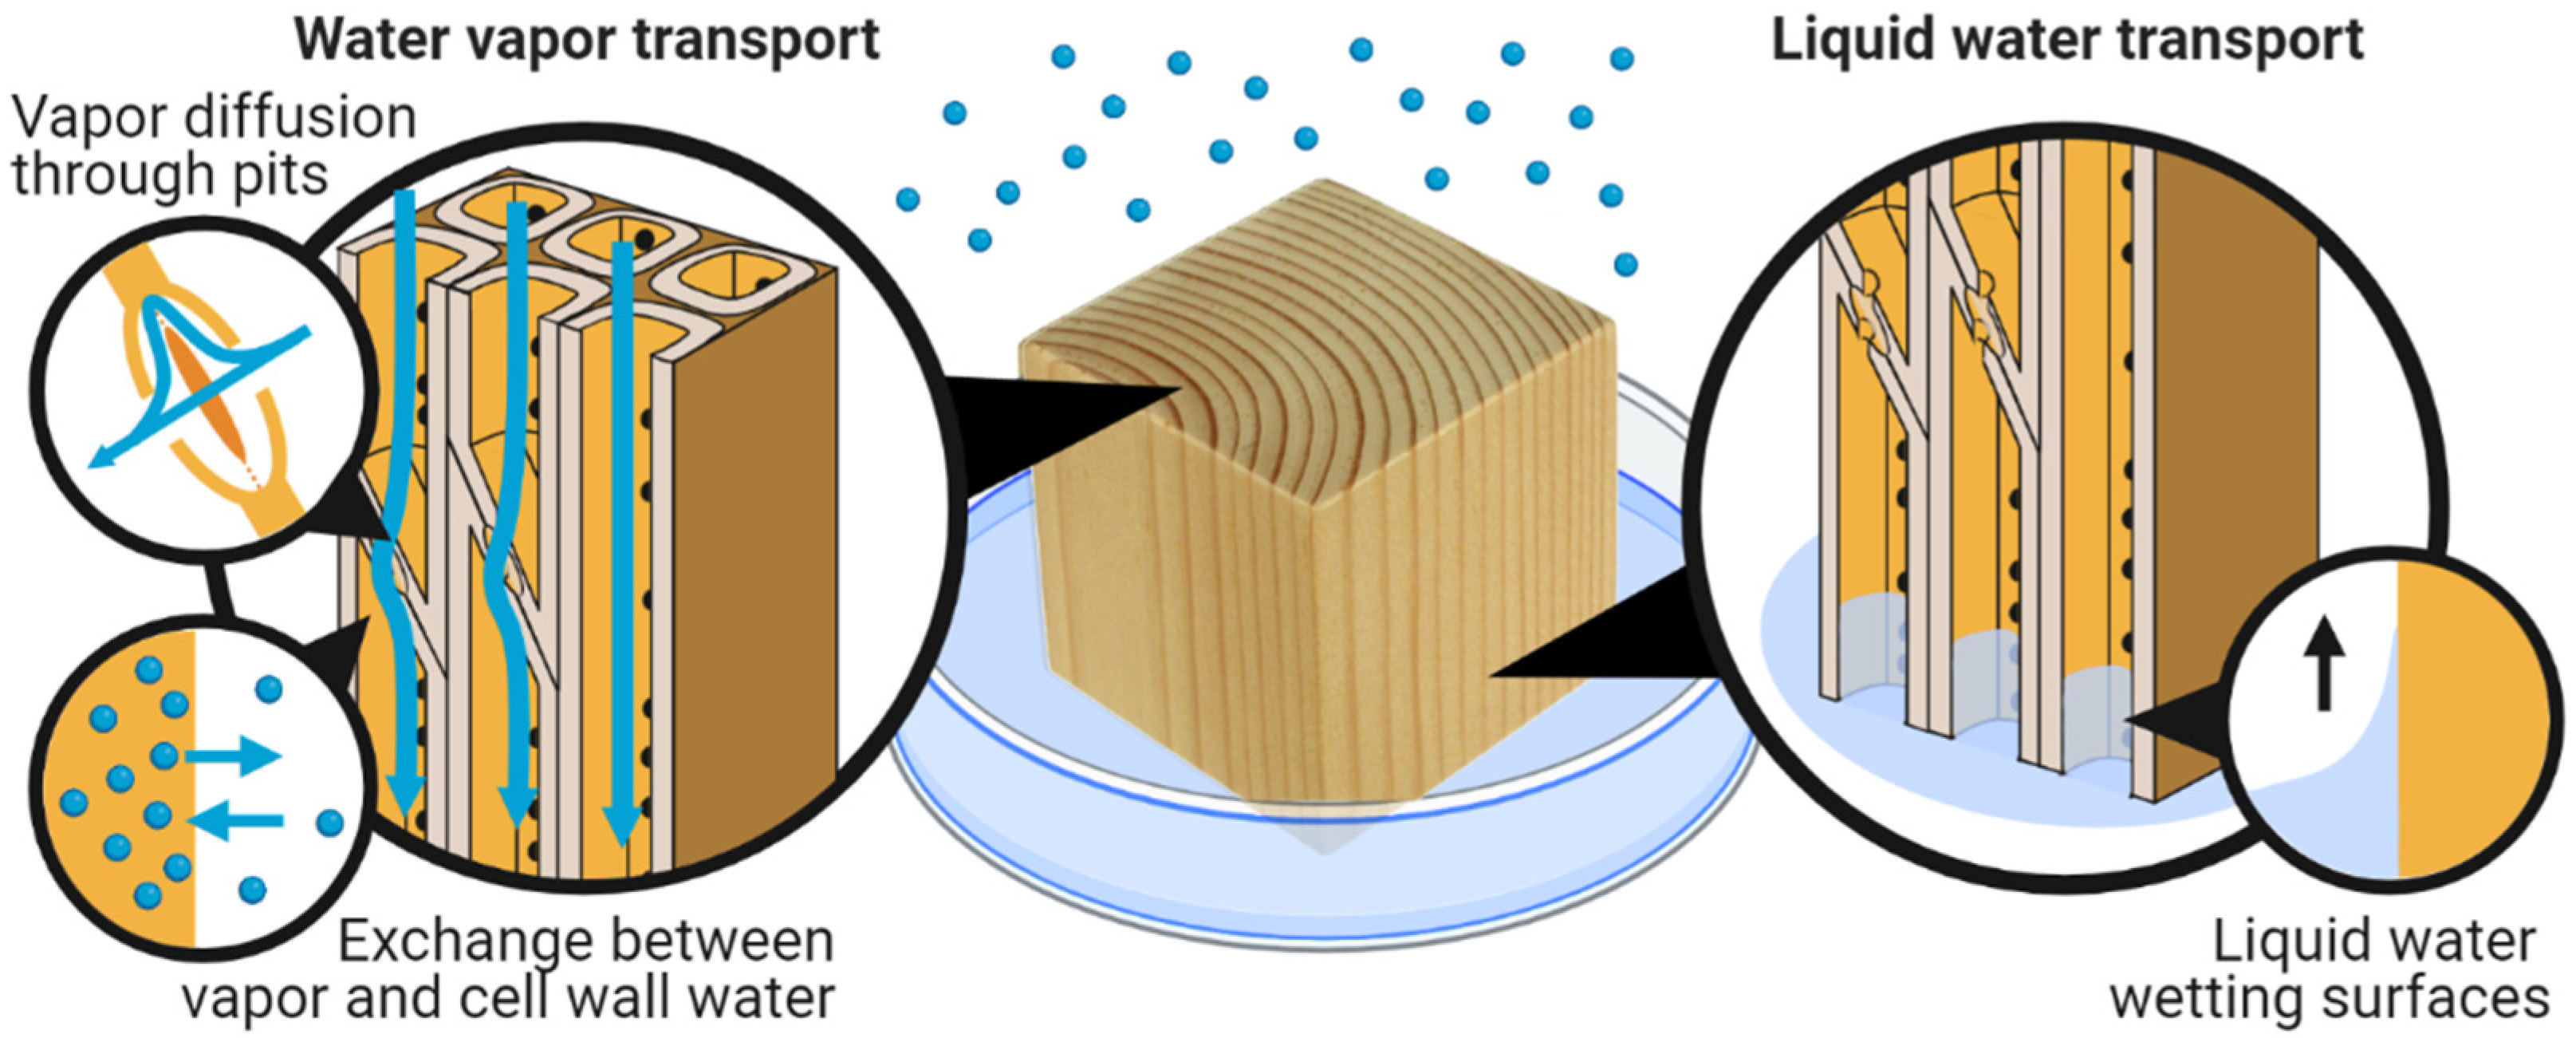
7. Transport of Water in Wood

Water transport in wood occurs by several pathways, depending on the phase of water and location within the wood structure, as illustrated in Figure 7. Transport of water in wood can therefore be divided into water vapor diffusion, cell wall water diffusion, and capillary water transport. Diffusion refers to a net flow of mass caused by random molecular motions. Diffusion can occur in the vapor phase and within the wood cell wall. At constant temperature, the overall diffusion of water through wood in the hygroscopic range can be described mathematically in terms of the gradient in various assumed potentials, including concentration, moisture content, vapor pressure, relative humidity, chemical potential, osmotic pressure, and spreading pressure [189,190]. Transport of water by diffusion is often described by Fick’s law [191,192] which relates the flux of water to the gradient in potential and a coefficient describing the ability of the diffusing substance to move within the material. For steady-state conditions with constant gradient, the relationship is described by
J = D α d α d x
where J (kg m−2 s−1) is the flux of water, x (m) is the distance in the direction of the flux, α is the driving potential for transport, and Dα is the diffusion coefficient corresponding to that specific potential. Thus, the flux depends on both the gradient in driving potential, dα/dx, and the diffusion coefficient which is a material property.
A difference in potential, e.g., in vapor pressure, results in water being transported from the side with high vapor pressure to the side with lower vapor pressure. However, also in the absence of gradients, water molecules are in continuous motion, but there is no net migration. When a temperature gradient is present, the situation is more complex and mathematical description of diffusion may involve multiple potentials [189]. However, an analysis of non-isothermal water vapor diffusion in porous building materials found that using vapor pressure alone as the driving potential is sufficient [193].
Liquid water transport is usually described by Darcy’s law [194] which is of similar mathematical form as Fick’s law for steady-state conditions:
J = ρ w k µ Δ d p d x
where J (kg m−2 s−1) is the flux of water, x (m) is the distance in the direction of the flux, p (Pa) is pressure, k (m2) is material permeability, ρw (kg m−3) is water density, and µ (Pa s) is the dynamic viscosity of liquid water.
Although water vapor diffusion, cell wall water diffusion, and capillary water transport are described in separate sections below, these should not be viewed as isolated processes because they are usually coupled. In the hygroscopic range, water molecules continuously exchange between the vapor phase and the cell wall by absorption and desorption (Section 8); see Figure 7. In the over-hygroscopic range, continuous exchange occurs among water vapor, cell wall water, and capillary water. For both diffusion and capillary water transport, there are differences in the longitudinal, radial, and tangential directions. This is further discussed in each of the subsections below.

7.1. Water Vapor Diffusion in the Macro-Void Structure

The rate of water vapor diffusion through still air (without convection) depends on the speed of molecular translational motion and the mean free path between collisions of water molecules with other molecules, including nitrogen, oxygen, carbon dioxide, etc. The mean free path depends on the total air pressure: the lower the pressure, the greater the mean free path. At constant pressure, the rate of diffusion increases with temperature because of the greater mean molecular speed.
The dominant cells in softwoods are axial tracheids, which contain long tubular macro-voids (cell lumina) oriented in the longitudinal direction. In hardwoods, the dominant cells are vessels and fiber tracheids, which are also oriented in the longitudinal direction. Due to the fact that the length is generally much greater than the diameter, these voids present a greater continuous pathway for water vapor diffusion in the longitudinal direction than in the radial and tangential directions (see Figure 7). Ray cells offer a similar pathway in the radial direction but make up a small percentage of the cross-sectional area. Measurements generally indicate faster rates of water vapor transmission in the longitudinal direction than in the radial and tangential directions [195,196,197,198,199,200,201].
In addition to direction, the diffusion of water vapor through wood depends on the connectivity of the void structure. The pathway of least resistance between adjacent cells is through pits. Bordered pits are the most important type of pits for fluid transport in softwoods because they connect conducting tracheid cells [202]. If the pits are not aspirated, molecules can diffuse through voids between microfibrillar strands that form the margo of the pit membrane. However, in aspirated pits, the torus blocks the direct passage of water molecules in the vapor phase, thus increasing the resistance to transport. To cross the torus, water molecules must adsorb from the vapor phase on one surface of the torus, diffuse through the torus, and desorb into the vapor phase from the opposite surface.

7.2. Diffusion of Water in the Cell Wall

Molecular dynamics simulations of absorbed water in model polymer systems including amorphous cellulose, amorphous hemicellulose, and a composite of ordered cellulose with hemicellulose, indicate that water diffusion coefficients increase approximately exponentially with water content [203,204]. These studies find that water molecules are either stationary, where they form hydrogen bonds with polymer hydroxyl groups, or undergoing translational movement. As the moisture content increases, several phenomena give rise to an increase in water mobility: the polymer systems swell with an accompanying increase in porosity, the tortuosity of the environment for water movement decreases, the connectivity between water molecules increases, and the activation energy needed to break a hydrogen bond at a polymer sorption site decreases [203,204]. These phenomena in molecular dynamics simulations are consistent with measurements indicating that water softens the polymers in the wood cell wall [70] and that the strength of interaction between water and cell wall polymers decreases as moisture content increases [15,83,84,87,89] (Section 3.2). Furthermore, diffusion coefficients measured with NMR for absorbed water in cellulose fibers increase exponentially with moisture content [205].
The diffusion of water in the wood cell wall is challenging to measure on its own, given the couplings with water vapor and capillary water in the macro-void structure. Stamm [206,207] attempted to isolate cell wall water diffusion by filling the voids with a metal alloy of low melting point. It is not clear whether the diffusion measurements represent cell wall water alone given that the alloy did not completely fill the voids. An additional difficulty is that the alloy could have restrained the swelling of the cell wall. As an alternative, Thybring and Fredriksson [53] suggested filling the voids with hydrophobic, flexible polymers grafted to cell wall surfaces by chemical modification [208,209]. Despite the uncertainties of Stamm’s data, his measured diffusion coefficients increased exponentially with moisture content, a trend that is consistent with molecular dynamics simulations and NMR measurements as discussed above. The diffusion coefficients measured by Stamm were greater in the longitudinal direction than in the transverse direction. Additionally, the logarithm of the diffusion coefficients varied linearly with inverse absolute temperature, indicating that the diffusion process requires energy to overcome an activation barrier (such as Arrhenius kinetics). Stamm [210,211] observed the same trends with moisture content and temperature for water diffusion in thin films of regenerated cellulose based on steady-state transmission and time-dependent vapor sorption measurements.

7.3. Liquid Water Transport in the Macro-Void Structure

In the over-hygroscopic range, liquid water is present in the macro-void structure (Section 2.2). The flow of liquid water is driven by a gradient in capillary pressure. In some cases, capillary uptake has the same dependence on the square root of time as diffusion, and out of convenience liquid water transport is often described mathematically by Fick’s law, Equation (7), with a diffusion coefficient even though it is not a diffusive phenomenon. The proper term for quantifying liquid transport is permeability, which describes the rate at which a fluid flows through a porous material under a pressure gradient; see Equation (8).
Liquid water flow in wood requires the void structure to be connected, for example through bordered pits in softwoods (Figure 7). Given the structure and orientation of the dominant cells, liquid water transport is much faster in the longitudinal direction than in the radial and tangential directions [212,213] as for water vapor diffusion (Section 7.1). Different wood species vary considerably in liquid water permeability [212,214], and within a given species, liquid water permeability is usually greater in sapwood than heartwood because the latter has a higher degree of pit aspiration and encrustation with extractives [213].
In softwoods, the dominant cell types are axial tracheids oriented longitudinally and ray cells oriented radially. In the longitudinal direction, liquid water transport is faster in the latewood than in the earlywood, giving rise to non-uniform profiles [214,215,216,217]. This is generally attributed to latewood cells being more interconnected, as the degree of pit aspiration in latewood is less than that in earlywood [218,219] because of the thicker cell walls and more rigid pit membranes. Additionally, the voids in latewood cells are narrower than the voids in earlywood cells, causing a larger capillary pressure difference. The structure of hardwoods is more complex and varied than that of softwoods. In the longitudinal direction, liquid flow is primarily through the vessels. Here, liquid water permeability depends on whether tyloses are present [220].
The imbibition of water in wood is often quantified by the water absorption coefficient, which is determined from the slope of a plot of water uptake vs. the square root of time. For many materials, such data are bi-linear, and the capillary absorption coefficient is evaluated from the slope of the initial part of the curve. However, water uptake in wood is often non-linear [195,197,214,216,217] which makes the evaluation less straightforward. Non-linearity may be a result of different rates of liquid water transport in latewood and earlywood, as discussed above. Additionally, multiphase transport occurs in wood, and the cell wall moisture content has been observed to increase spatially well ahead of the capillary water [221,222]. When using a non-swelling liquid instead of water, a linear behavior is observed also for wood [195], indicating that the non-linear behavior is related to water uptake of the cell walls.

7.4. Models for Multi-Phase Transport

The fact that water in wood is transported in multiple phases which individually are described by different transport equations, and with a constant exchange between phases, makes modeling complex. Several approaches have been used to try to simplify the mathematical description of the phenomenon. Steady-state transport of water, i.e., with a constant gradient, can be captured with a single diffusion coefficient. This, however, does not provide any understanding of the underlying transport pathways and their magnitude. Some studies have therefore tried to understand differences in water transport between anatomical directions by combining transport equations for different phases. An early theoretical attempt to account for the different pathways for diffusion of water vapor and cell wall water was an electrical circuit analogy involving series or parallel resistances based on the approximate anatomy of softwood axial tracheids [223].
For transient cases where the moisture content changes over time, the use of a single Fickian equation to describe isothermal water transport in wood breaks down. This is for instance seen by differences in calculated diffusion coefficients with specimen thickness, sorption direction (ab-/desorption), and between steady-state and transient conditions [224,225,226,227,228]. Instead, several studies have used two Fickian equations to describe the diffusion of water vapor and cell wall water separately together with a coupling term that describes the exchange between phases [229,230,231,232,233]. These studies, however, only considered water transport in cases without liquid water present.
Modeling of liquid water transport has practical relevance for wood drying after harvesting, treatment of wood by preservatives or chemical modification agents, as well as for the performance of wood structures, and several models have attempted to describe this. Krabbenhøft and Damkilde [234] tried to separate the transport in the three phases by three Fickian equations, some of which had coupling terms but highlighted the difficulty in obtaining all needed material parameters for such an approach.
Recently, Autengruber and co-workers [235] attempted a physical description of the combined transport of both water vapor and cell wall water described by Fickian equations, Equation (7), and liquid water transport described by Darcy’s law, Equation (8), including the continuous exchange between phases. The developed model was able to describe observations from multiple experimental studies in the literature. However, as for the study by Krabbenhøft and Damkilde [234], a large number of model parameters need to be determined and validated experimentally.

8. Water Vapor Sorption Kinetics in the Cell Wall

Sorption kinetics describes the path to moisture equilibrium. For larger wood specimens, the approach to moisture equilibrium involves moisture transport both in the porous microstructure and cell walls (Section 7). However, this section focuses on sorption kinetics in the cell walls, i.e., the approach to moisture equilibrium between cell walls and the local, surrounding climate. Sorption kinetics are typically investigated gravimetrically on small specimens by the same experimental techniques used to characterize moisture equilibrium (Section 3).
A common parameter for describing the approach to moisture equilibrium is the fractional change in moisture content, E, given by
E ( t ) = u ( t ) u 0 u eq u 0
where u(t) (g g−1) is the moisture content at time t (s), u0 (g g−1) is the initial moisture content at t = 0, and ueq (g g−1) is the final moisture content at equilibrium. Since sorption kinetic data are collected by the same gravimetric technique as equilibrium measurements, many of the same concerns about the reliability and data quality of equilibrium measurements (Section 3.1) apply to kinetic data as well. For instance, the correct identification of the final equilibrium state of the wood, i.e., ueq in Equation (9), affects the analysis and interpretation of the sorption kinetics (Section 8.2). The following sections discuss the physical mechanisms of sorption kinetics as well as models and methods to analyze sorption kinetic data.

8.1. Physical Phenomena Involved in Sorption Kinetics

Water sorption in wood involves several physical phenomena resulting in complex behavior. For instance, water sorption causes an increase of stresses from shrinkage/swelling and subsequent stress relaxation (Section 5), temperature changes from the uptake/release of heat (Section 3.2), as well as diffusion of cell wall water between the interior and surface of the cell walls (Section 7.2). Moreover, the internal state of the amorphous wood polymers, hemicelluloses, and lignin, may change during moisture sorption if these polymers pass their glass transition temperature (also termed “softening point”). Finally, the experimental conditions may affect the observed sorption kinetics, because of the external resistance to vapor transfer in the thin stagnant air layer close to the material surfaces. The thickness of this layer depends on the flow of water vapor across the surfaces which again depends on the experimental setup [236,237]. The effect on the kinetic measurements is particularly relevant for experiments with thin specimens, where neglecting the external resistance can lead to significant underestimations of the actual sorption kinetics of the specimen [236].
Internal stresses from shrinkage and swelling arise from the mechanical constraints of the stiff cellulose microfibrils (Section 5), and reducing these will cause a slightly higher moisture content under similar environmental conditions [238]. Over time, the viscoelastic properties of the cell wall material will result in stress relaxation, gradually decreasing the internal stresses. The effect of internal stresses on the sorption kinetics can be seen in the experimental results of Christensen and co-workers [238,239,240,241] performed in a vacuum sorption balance. For instance, the rate of absorption was shown to depend positively on the size of the increase in RH [239] which corresponds with larger internal stresses. On the other hand, increasing the stress relaxation time by keeping wood specimens longer at 53% RH prior to an increase in RH was found to reduce the rate of sorption [241].
Water sorption changes the temperature of the surface at which water molecules change phases between vapor and cell wall water. This causes a change in the RH at the surface because the saturation vapor pressure depends on the temperature. As a result, the temperature change will affect the driving potential for moisture transfer at the surface [242,243]. The effect of temperature changes on the rate of sorption is difficult to gauge from the experimental data available in the literature since detailed data on surface temperatures is very rarely reported. This presents a current barrier to a deeper understanding of how temperature changes affect sorption kinetics.
Diffusion of cell wall water plays a role only at lower moisture contents [239]. Thus, in a series of experiments in a vacuum sorption balance, Christensen [239] found that for thin wood specimens, with a tangential thickness between 20 µm and 3 mm, the sorption rate did not depend on thickness above 60% RH. Since these experiments were performed in a vacuum, the external resistance to moisture transfer was removed. Below 60% RH, the sorption rate was affected by specimen thickness indicating an effect of diffusion of cell wall water.
The internal state of the wood polymers is not a direct mechanism to explain sorption kinetics; however, it is a parameter that may affect other mechanisms [70]. At low moisture contents, the amorphous wood polymers, hemicelluloses and lignin, are in a “glassy” state characterized by low mobility. As the moisture content increases, water molecules break internal hydrogen bonds between wood polymers, thereby increasing the probability for polymer fragments to re-orient [244]. At room temperature, the hemicelluloses will reach their glass transition (softening point) around 0.1–0.2 g g−1 moisture content corresponding with 55%–90% RH [70,77] in which range the polymer mobility will increase markedly. Lignin, on the other hand, will only soften at temperatures above 50 °C at high moisture contents [70,77]. Softening of amorphous wood polymers will increase the diffusion of cell wall water [70] as well as increase the rate of stress relaxation [245], thus affecting other physical phenomena involved in sorption kinetics. It is, therefore, difficult to link the internal state of the wood polymer directly to specific sorption kinetic behavior.

8.2. Sorption Kinetic Models

A variety of theoretical models have been developed to explain sorption kinetics in wood and other cellulosic materials [229,242,246,247,248]. Sorption kinetics in wood is often claimed to exhibit exponential behavior [249,250,251,252,253] similar to many other physical phenomena such as first-order chemical reactions and radioactive decay. Therefore, many of the sorption kinetic models are found in the same family of exponential functions [254] described by
E = u ( t ) u 0 u eq u 0 = 1 n = 1 N A n exp ( t τ n )
where t (s) is time, N is the number of exponential components in the model, τn (s) is the characteristic relaxation time of the nth exponential component, and An (−) is the relative weight of this component.
Many sorption kinetic models have been claimed to fit well with experimental data, indicating the possibility that the models capture the physical mechanisms governing sorption. For instance, the popular Parallel Exponential Kinetics (PEK) model [246], N = 2 in Equation (10), is often found to provide fits with high goodness-of-fit, R2, in studies using automated sorption balances [255,256,257]. However, the fits in these studies were performed on sorption data that was interrupted before equilibrium when a certain mass stability criterion was met. This is problematic since the PEK model only fits well when sorption is interrupted by a loose stability criterion resulting in a relatively short hold time under constant environmental conditions [258]. Thus, the fit of the PEK model becomes poorer and poorer as the data acquisition time increases with stricter mass stability criteria [258], highlighting the importance of appropriate experimental protocols for sorption kinetic studies.
A novel methodology for analyzing sorption kinetic data without relying on a specific model was introduced by Glass and co-workers [254,258]. They suggested using multi-exponential decay analysis (MEDEA) as often done in NMR relaxometry. The fundamental assumption is that sorption kinetics exhibit exponential behavior as described by Equation (10), but otherwise, no model-specific constraints about the number of exponential components or their relative weights are introduced. While this approach cannot elucidate the fundamental physical mechanisms involved in sorption, it provides a robust description of the dominant time scales of sorption kinetics. Hereby, the methodology can act as a tool to evaluate theoretical sorption kinetic models. Each of these models has a specific “fingerprint”, i.e., a combination of a number of exponential components with specific relaxation times and relative weights. For instance, the popular PEK model has two exponential components, i.e., N = 2 in Equation (10), whereas the Fickian diffusion model can be described by an infinite sum of exponentials with one component dominating at a long relaxation time and an infinite series of shorter relaxation times with rapidly diminishing weights [254]. The fingerprints of these models can thus be compared with the fingerprint derived from the experimental sorption kinetic data by MEDEA, as shown in Figure 8. This allows a test of how well the models capture the fundamental nature of the experimental data.
Unfortunately, none of the available theoretical models are able to describe the experimental data for wood and other cellulosic materials as indicated in Figure 8 and documented in [254,258]. The experimental sorption kinetic data indicates a more complex behavior than any of the common theoretical models can describe. Therefore, experimental investigations and model development are needed, guided by MEDEA as a model evaluation tool.

9. Summary and Outlook

This review describes the current understanding of water in wood based on available data from experimental and computational methods. This understanding has evolved over the course of time as new data have gradually emerged. However, as discussed in each of the sections of this review, a range of knowledge gaps persist about water in wood. For instance, the fundamental state of cell wall water and the potential different pools or types of it remains elusive. Similarly, important details are missing about the physical mechanisms controlling basic aspects of water in wood such as the equilibrium moisture state, multi-scale shrinkage and swelling, hysteresis, and sorption kinetics.
Given these persisting knowledge gaps, it is not surprising that the available theoretical models for describing basic wood-water relations are often found to be physically invalid. Thus, there is a need for developing realistic theoretical models for describing moisture equilibrium (sorption isotherms), sorption kinetics, sorption hysteresis, and moisture transport in multiple phases based on solid theories and experimental evidence. This development needs support from new and improved experimental methods that can investigate wood at even smaller length scales or with even better data quality than before, backed by refined computational methods. Moreover, chemical modification presents an opportunity to manipulate the physical and chemical properties of the wood material. This could help elucidate fundamental aspects of water in wood and close some of the existing knowledge gaps.

Author Contributions

Conceptualization, E.E.T., M.F., S.L.Z. and S.V.G.; methodology, E.E.T., M.F., S.L.Z. and S.V.G.; formal analysis, E.E.T., M.F., S.L.Z. and S.V.G.; investigation, E.E.T., M.F., S.L.Z. and S.V.G.; resources, E.E.T., M.F., S.L.Z. and S.V.G.; data curation, E.E.T., M.F., S.L.Z. and S.V.G.; writing—original draft preparation, E.E.T., M.F., S.L.Z. and S.V.G.; writing—review and editing, E.E.T., M.F., S.L.Z. and S.V.G.; visualization, E.E.T.; project administration, E.E.T.; funding acquisition, E.E.T., M.F., S.L.Z. and S.V.G. All authors have read and agreed to the published version of the manuscript.

Funding

This research was funded by the European Union Interreg Öresund-Kattegat-Skagerrak “MODUWOOD” project, the University of Copenhagen, and the US Forest Service.

Data Availability Statement

Not applicable.

Conflicts of Interest

The authors declare no conflict of interest.

References

  1. Gerhards, C.C. Effect of moisture-content and temperature on the mechanical-properties of wood—An analysis of immediate effects. Wood Fiber 1982, 14, 4–36. [Google Scholar]
  2. Armstrong, L.D.; Kingston, R.S.T. The effect of moisture content changes on the deformation of wood under stress. Aust. J. Appl. Sci. 1962, 13, 257–276. [Google Scholar]
  3. Gibson, E.J. Creep of Wood—Role of Water and Effect of A Changing Moisture Content. Nature 1965, 206, 213–215. [Google Scholar] [CrossRef]
  4. Tiemann, H.D. Effect of Moisture upon the Strength and Stiffness of Wood; Bulletin 70; US Department of Agriculture, Forest Service: Washington, DC, USA, 1906.
  5. Markwardt, L.J.; Wilson, T.R.C. Strength and Related Properties of Woods Grown in the United States; US Department of Agriculture: Washington, DC, USA, 1935.
  6. Hearmon, R.F.S.; Burcham, J.N. Specific heat and heat of wetting of wood. Nature 1955, 176, 978. [Google Scholar] [CrossRef]
  7. Kühlmann, G. Untersuchung der thermischen Eigenschaften von Holz und Spanplatten in Abhängigkeit von Feuchtigkeit und Temperatur im hygroskopischen Bereich. Holz Roh Werkst. 1962, 20, 259–270. [Google Scholar] [CrossRef]
  8. Sonderegger, W.; Hering, S.; Niemz, P. Thermal behaviour of Norway spruce and European beech in and between the principal anatomical directions. Holzforschung 2011, 65, 369–375. [Google Scholar] [CrossRef]
  9. MacLean, J.D. Thermal conductivity of wood. Heat. Pip. Air Cond. 1941, 13, 380–391. [Google Scholar]
  10. Zeller, S.M. Humidity in relation to moisture imbibition by wood and to spore germination on wood. Ann. Mo. Bot. Gard. 1920, 7, 51–74. [Google Scholar] [CrossRef]
  11. Griffin, D.M. Water potential and wood-decay fungi. Annu. Rev. Phytopathol. 1977, 15, 319–329. [Google Scholar] [CrossRef]
  12. Brischke, C.; Alfredsen, G. Wood-water relationships and their role for wood susceptibility to fungal decay. Appl. Microbiol. Biotechnol. 2020, 104, 3781–3795. [Google Scholar] [CrossRef]
  13. Amidon, T.E.; Liu, S. Water-based woody biorefinery. Biotechnol. Adv. 2009, 27, 542–550. [Google Scholar] [CrossRef]
  14. Liu, S.; Lu, H.; Hu, R.; Shupe, A.; Lin, L.; Liang, B. A sustainable woody biomass biorefinery. Biotechnol. Adv. 2012, 30, 785–810. [Google Scholar] [CrossRef]
  15. Volbehr, B.F.K.J. Untersuchungen über die Quellung der Holzfaser. In Philosophischen Fakultät; Universität Kiel: Kiel, Germany, 1896; pp. 1–37. [Google Scholar]
  16. Carrington, H. The elastic constants of spruce as influenced by moisture content. Aeronaut. J. 1922, 26, 462–471. [Google Scholar]
  17. Engelund, E.T.; Thygesen, L.G.; Svensson, S.; Hill, C.A.S. A critical discussion of the physics of wood-water interactions. Wood Sci. Technol. 2013, 47, 141–161. [Google Scholar] [CrossRef]
  18. Venkateswaran, A. Sorption of aqueous and nonaqueous media by wood and cellulose. Chem. Rev. 1970, 70, 619–637. [Google Scholar] [CrossRef]
  19. Skaar, C. Theories of water sorption by wood. In Wood-Water Relations; Springer: Berlin/Heidelberg, Germany, 1988; pp. 86–121. [Google Scholar]
  20. Siau, J.F. Basic Wood-Moisture Relationships. In Transport Processes in Wood; Springer: Berlin/Heidelberg, Germany, 1984; pp. 1–34. [Google Scholar]
  21. Hawley, L.F. Wood-Liquid Relations; Technical Bulletin 248; US Department of Agriculture: Washington, DC, USA, 1931; pp. 1–34.
  22. Tarkow, H. Interaction of Moisture and Wood; Report No. 2198; US Department of Agriculture, Forest Service, Forest Products Laboratory: Madison, WI, USA, 1960; pp. 1–8.
  23. Wangaard, F.F.; Wengert, E.M.; Mitchell, P.H.; Rosen, H.N.; Skaar, C.; Simpson, W.T.; Beall, F.C.; Spalt, H.A.; Arganbright, D.M.; Stewart, H.A.; et al. Proceedings of the Wood Moisture Content—Temperature and Humidity Relationships Symposium, Blacksburg, Virginia, 29 October 1979; Rosen, H.N., Simpson, W.T., Wengert, E.M., Eds.; USDA Forest Service, Forest Products Laboratory: Madison, WI, USA, 1979.
  24. Stamm, A.J. Wood and Cellulose Science; The Ronald Press Company: New York, NY, USA, 1964. [Google Scholar]
  25. Glass, S.V.; Zelinka, S.L. Chapter 4. Moisture Relations and Physical Properties of Wood. In Wood Handbook. Wood as an Engineering Material; FPL-GTR-282; Ross, R.J., Ed.; U.S. Department of Agriculture, Forest Service, Forest Products Laboratory: Madison, WI, USA, 2021. [Google Scholar]
  26. Fredriksson, M. On wood–water interactions in the over-hygroscopic moisture range—Mechanisms, methods, and influence of wood modification. Forests 2019, 10, 779. [Google Scholar] [CrossRef] [Green Version]
  27. Matthews, J.F.; Skopec, C.E.; Mason, P.E.; Zuccato, P.; Torget, R.W.; Sugiyama, J.; Himmel, M.E.; Brady, J.W. Computer simulation studies of microcrystalline cellulose I beta. Carbohydr. Res. 2006, 341, 138–152. [Google Scholar] [CrossRef]
  28. Lindh, E.L.; Terenzi, C.; Salmen, L.; Furo, I. Water in cellulose: Evidence and identification of immobile and mobile adsorbed phases by 2H MAS NMR. Phys. Chem. Chem. Phys. 2017, 19, 4360–4369. [Google Scholar] [CrossRef] [Green Version]
  29. Thybring, E.E.; Thygesen, L.G.; Burgert, I. Hydroxyl accessibility in wood cell walls as affected by drying and re-wetting procedures. Cellulose 2017, 24, 2375–2384. [Google Scholar] [CrossRef] [Green Version]
  30. Hofstetter, K.; Hinterstoisser, B.; Salmén, L. Moisture uptake in native cellulose—The roles of different hydrogen bonds: A dynamic FT-IR study using deuterium exchange. Cellulose 2006, 13, 131–145. [Google Scholar] [CrossRef]
  31. Salmén, L.; Bergström, E. Cellulose structural arrangement in relation to spectral changes in tensile loading FTIR. Cellulose 2009, 16, 975–982. [Google Scholar] [CrossRef]
  32. Beck, G.; Strohbusch, S.; Larnøy, E.; Militz, H.; Hill, C. Accessibility of hydroxyl groups in anhydride modified wood as measured by deuterium exchange and saponification. Holzforschung 2017, 72, 17–23. [Google Scholar] [CrossRef]
  33. Sumi, Y.; Hale, R.D.; Meyer, J.A.; Leopold, B.; Rånby, B.G. Accessibility of wood and wood carbohydrates measured with tritiated water. Tappi 1964, 47, 621–624. [Google Scholar]
  34. Tarmian, A.; Burgert, I.; Thybring, E.E. Hydroxyl accessibility in wood by deuterium exchange and ATR-FTIR spectroscopy: Methodological uncertainties. Wood Sci. Technol. 2017, 51, 845–853. [Google Scholar] [CrossRef]
  35. Digaitis, R.; Thybring, E.E.; Künniger, T.; Thygesen, L.G. Synergistic effects of enzymatic decomposition and mechanical stress in wood degradation. Wood Sci. Technol. 2017, 51, 1067–1080. [Google Scholar] [CrossRef]
  36. Popescu, C.M.; Hill, C.A.S.; Curling, S.; Ormondroyd, G.A.; Xie, Y. The water vapour sorption behaviour of acetylated birch wood: How acetylation affects the sorption isotherm and accessible hydroxyl content. J. Mater. Sci. 2014, 49, 2362–2371. [Google Scholar] [CrossRef]
  37. Taniguchi, T.; Harada, H.; Nakato, K. Determination of water-adsorption sites in wood by a hydrogen-deuterium exchange. Nature 1978, 272, 230–231. [Google Scholar] [CrossRef]
  38. Lindh, E.L.; Bergenstråhle-Wohlert, M.; Terenzi, C.; Salmén, L.; Furó, I. Non-exchanging hydroxyl groups on the surface of cellulose fibrils: The role of interaction with water. Carbohydr. Res. 2016, 434, 136–142. [Google Scholar] [CrossRef]
  39. Thybring, E.E.; Piqueras, S.; Tarmian, A.; Burgert, I. Water accessibility to hydroxyls confined in solid wood cell walls. Cellulose 2020, 27, 5617–5627. [Google Scholar] [CrossRef]
  40. Altgen, M.; Rautkari, L. Humidity-dependence of the hydroxyl accessibility in Norway spruce wood. Cellulose 2021, 28, 45–58. [Google Scholar] [CrossRef]
  41. Berthold, J.; Desbrieres, J.; Rinaudo, M.; Salmén, L. Types of adsorbed water in relation to the ionic groups and their counterions for some cellulose derivatives. Polymer 1994, 35, 5729–5736. [Google Scholar] [CrossRef]
  42. Berthold, J.; Rinaudo, M.; Salmén, L. Association of water to polar groups; Estimations by an adsorption model for ligno-cellulosic materials. Colloids Surf. A-Physicochem. Eng. Asp. 1996, 112, 117–129. [Google Scholar] [CrossRef]
  43. Nakamura, K.; Hatakeyama, T.; Hatakeyama, H. Studies on bound water of cellulose by differential scanning calorimetry. Text. Res. J. 1981, 51, 607–613. [Google Scholar] [CrossRef]
  44. Kärenlampi, P.P.; Tynjälä, P.; Ström, P. Phase transformations of wood cell wall water. J. Wood Sci. 2005, 51, 118–123. [Google Scholar] [CrossRef]
  45. Zelinka, S.L.; Lambrecht, M.J.; Glass, S.V.; Wiedenhoeft, A.C.; Yelle, D.J. Examination of water phase transitions in Loblolly pine and cell wall components by differential scanning calorimetry. Thermochim. Acta 2012, 533, 39–45. [Google Scholar] [CrossRef]
  46. Thygesen, L.G.; Engelund, E.T.; Hoffmeyer, P. Water sorption in wood and modified wood at high values of relative humidity. Part I: Results for untreated, acetylated, and furfurylated Norway spruce. Holzforschung 2010, 64, 315–323. [Google Scholar]
  47. Czihak, C.; Muller, M.; Schober, H.; Vogl, G. Ice formation in amorphous cellulose. Physica B 2000, 276, 286–287. [Google Scholar] [CrossRef]
  48. Cox, J.; McDonald, P.J.; Gardiner, B.A. A study of water exchange in wood by means of 2D NMR relaxation correlation and exchange. Holzforschung 2010, 64, 259–266. [Google Scholar] [CrossRef] [Green Version]
  49. Bonnet, M.; Courtier-Murias, D.; Faure, P.; Rodts, S.; Care, S. NMR determination of sorption isotherms in earlywood and latewood of Douglas fir. Identification of bound water components related to their local environment. Holzforschung 2017, 71, 481. [Google Scholar] [CrossRef]
  50. Jeoh, T.; Karuna, N.; Weiss, N.D.; Thygesen, L.G. Two-dimensional 1H-Nuclear Magnetic Resonance relaxometry for understanding biomass recalcitrance. ACS Sustain. Chem. Eng. 2017, 5, 8785–8795. [Google Scholar] [CrossRef]
  51. Rostom, L.; Courtier-Murias, D.; Rodts, S.; Care, S. Investigation of the effect of aging on wood hygroscopicity by 2D 1H NMR relaxometry. Holzforschung 2020, 74, 400–411. [Google Scholar] [CrossRef] [Green Version]
  52. Plaza Rodriguez, N.Z. Neutron Scattering Studies of Nano-Scale Wood-Water Interactions; Department of Materials Science and Engineering, University of Wisconsin Madison: Madison, WI, USA, 2017; pp. 1–165. [Google Scholar]
  53. Thybring, E.E.; Fredriksson, M. Wood modification as a tool to understand moisture in wood. Forests 2021, 12, 372. [Google Scholar] [CrossRef]
  54. Zelinka, S.L.; Altgen, M.; Emmerich, L.; Guigo, N.; Keplinger, T.; Kymäläinen, M.; Thybring, E.E.; Thygesen, L.G. Review of wood modification and wood functionalization, technologies. Forests 2022, 13, 1004. [Google Scholar] [CrossRef]
  55. Fuchs, W. Zur Kenntnis des genuinen Lignins, I.: Die Acetylierung des Fichtenholzes. Ber. Dtsch. Chem. Ges. 1928, 61, 948–951. [Google Scholar] [CrossRef]
  56. Papadopoulos, A.N.; Hill, C.A.S.; Gkaraveli, A. Analysis of the swelling behaviour of chemically modified softwood: A novel approach. Holz Roh Werkst. 2004, 62, 107–112. [Google Scholar] [CrossRef]
  57. Ibach, R.E.; Plaza, N.Z.; Pingali, S.V. Small angle neutron scattering reveals wood nanostructural features in decay resistant chemically modified wood. Front. For. Glob. Chang. 2022, 4, 814086. [Google Scholar] [CrossRef]
  58. Ponzecchi, A.; Thybring, E.E.; Digaitis, R.; Fredriksson, M.; Solsona, S.P.; Thygesen, L.G. Raman micro-spectroscopy of two types of acetylated Norway spruce wood at controlled relative humidity. Front. Plant Sci. 2022, 13, 986578. [Google Scholar] [CrossRef]
  59. Thomson, W. On the equilibrium of vapour at a curved surface of liquid. Lond. Edinb. Dublin Philos. Mag. J. Sci. 1871, 42, 448–452. [Google Scholar] [CrossRef]
  60. Sing, K.S.W.; Rouquerol, F.; Rouquerol, J.; Llewellyn, P. 8—Assessment of mesoporosity. In Adsorption by Powders and Porous Solids, 2nd ed.; Rouquerol, F., Rouquerol, J., Sing, K.S.W., Llewellyn, P., Maurin, G., Eds.; Academic Press: Oxford, UK, 2014; pp. 269–302. [Google Scholar]
  61. Sedighi Moghaddam, M.; Wålinder, M.E.P.; Claesson, P.M.; Swerin, A. Multicycle Wilhelmy plate method for wetting properties, swelling and liquid sorption of wood. Langmuir 2013, 29, 12145–12153. [Google Scholar] [CrossRef]
  62. Gindl, M.; Sinn, G.; Gindl, W.; Reiterer, A.; Tschegg, S. A comparison of different methods to calculate the surface free energy of wood using contact angle measurements. Colloids Surf. A Physicochem. Eng. Asp. 2001, 181, 279–287. [Google Scholar] [CrossRef]
  63. Frybort, S.; Obersriebnig, M.; Müller, U.; Gindl-Altmutter, W.; Konnerth, J. Variability in surface polarity of wood by means of AFM adhesion force mapping. Colloids Surf. A Physicochem. Eng. Asp. 2014, 457, 82–87. [Google Scholar] [CrossRef]
  64. Jin, X.; Kasal, B. Adhesion force mapping on wood by atomic force microscopy: Influence of surface roughness and tip geometry. R. Soc. Open Sci. 2016, 3, 160248. [Google Scholar] [CrossRef] [PubMed] [Green Version]
  65. Mao, J.; Abushammala, H.; Kasal, B. Monitoring the surface aging of wood through its pits using atomic force microscopy with functionalized tips. Colloids Surf. A Physicochem. Eng. Asp. 2021, 609, 125871. [Google Scholar] [CrossRef]
  66. Andrew, M.; Bijeljic, B.; Blunt, M.J. Pore-scale contact angle measurements at reservoir conditions using X-ray microtomography. Adv. Water Resour. 2014, 68, 24–31. [Google Scholar] [CrossRef] [Green Version]
  67. AlRatrout, A.; Raeini, A.Q.; Bijeljic, B.; Blunt, M.J. Automatic measurement of contact angle in pore-space images. Adv. Water Resour. 2017, 109, 158–169. [Google Scholar] [CrossRef]
  68. Plaza, N.Z. On the experimental assessment of the molecular-scale interactions between wood and water. Forests 2019, 10, 616. [Google Scholar] [CrossRef]
  69. Chen, M.; Coasne, B.; Guyer, R.; Derome, D.; Carmeliet, J. Role of hydrogen bonding in hysteresis observed in sorption-induced swelling of soft nanoporous polymers. Nat. Commun. 2018, 9, 3507. [Google Scholar] [CrossRef]
  70. Jakes, J.E.; Hunt, C.G.; Zelinka, S.L.; Ciesielski, P.N.; Plaza, N.Z. Effects of moisture on diffusion in unmodified wood cell walls: A phenomenological polymer science approach. Forests 2019, 10, 1084. [Google Scholar] [CrossRef] [Green Version]
  71. Christensen, G.N.; Kelsey, K.E. Sorption of water vapour by constituents of wood: Determination of sorption isotherms. Aust. J. Appl. Sci. 1958, 9, 265–282. [Google Scholar]
  72. Barbetta, A.; Fratzl, P.; Zemb, T.; Bertinetti, L. Impregnation and swelling of wood with salts: Ion specific kinetics and thermodynamics effects. Adv. Mater. Interfaces 2017, 4, 1600437. [Google Scholar] [CrossRef]
  73. Thybring, E.E. Water relations in untreated and modified wood under brown-rot and white-rot decay. Int. Biodeterior. Biodegrad. 2017, 118, 134–142. [Google Scholar] [CrossRef]
  74. Vahtikari, K.; Rautkari, L.; Noponen, T.; Lillqvist, K.; Hughes, M. The influence of extractives on the sorption characteristics of Scots pine (Pinus sylvestris L.). J. Mater. Sci. 2017, 52, 10840–10852. [Google Scholar] [CrossRef]
  75. Wangaard, F.F.; Granados, L.A. The effect of extractives on water-vapor sorption by wood. Wood Sci. Technol. 1967, 1, 253–277. [Google Scholar] [CrossRef]
  76. Thybring, E.E.; Kymäläinen, M.; Rautkari, L. Experimental techniques for characterising water in wood covering the range from dry to fully water-saturated. Wood Sci. Technol. 2018, 52, 297–329. [Google Scholar] [CrossRef] [Green Version]
  77. Thybring, E.E.; Glass, S.V.; Zelinka, S.L. Kinetics of water vapor sorption in wood cell walls: State of the art and research needs. Forests 2019, 10, 704. [Google Scholar] [CrossRef] [Green Version]
  78. Zelinka, S.L.; Glass, S.V.; Thybring, E.E. Evaluation of previous measurements of water vapor sorption in wood at multiple temperatures. Wood Sci. Technol. 2020, 54, 769–786. [Google Scholar] [CrossRef]
  79. ISO 12571; Hygrothermal Performance of Building Materials and Products—Determination of Hygroscopic Sorption Properties. ISO: Geneva, Switzerland, 2000; pp. 1–15.
  80. Hill, C.A.S.; Norton, A.; Newman, G. The water vapor sorption behavior of natural fibers. J. Appl. Polym. Sci. 2009, 112, 1524–1537. [Google Scholar] [CrossRef]
  81. Glass, S.V.; Boardman, C.R.; Zelinka, S.L. Short hold times in dynamic vapor sorption measurements mischaracterize the equilibrium moisture content of wood. Wood Sci. Technol. 2017, 51, 243–260. [Google Scholar] [CrossRef]
  82. Glass, S.V.; Boardman, C.R.; Thybring, E.E.; Zelinka, S.L. Quantifying and reducing errors in equilibrium moisture content measurements with dynamic vapor sorption (DVS) experiments. Wood Sci. Technol. 2018, 52, 909–927. [Google Scholar] [CrossRef] [Green Version]
  83. Skaar, C. Moisture Sorption Thermodynamics. In Wood-Water Relations; Springer: Berlin/Heidelberg, Germany, 1988; pp. 46–85. [Google Scholar]
  84. Nopens, M.; Wadsö, L.; Ortmann, C.; Fröba, M.; Krause, A. Measuring the heat of interaction between lignocellulosic materials and water. Forests 2019, 10, 674. [Google Scholar] [CrossRef] [Green Version]
  85. Zelinka, S.L.; Glass, S.V.; Thybring, E.E. Myth versus reality: Do parabolic sorption isotherm models reflect actual wood–water thermodynamics? Wood Sci. Technol. 2018, 52, 1701–1706. [Google Scholar] [CrossRef]
  86. Weichert, L. Investigations on sorption and swelling of spruce, beech and compressed beech wood at temperatures between 20 C and 100 C. Holz Roh Werkst. 1963, 21, 290–300. [Google Scholar] [CrossRef]
  87. Kelsey, K.E.; Clarke, L.N. The heat of sorption of water by wood. Aust. J. Appl. Sci. 1956, 7, 160–175. [Google Scholar]
  88. Kelsey, K.E.; Clarke, L.N. Effect of temperature and initial moisture content on the heat of wetting of wood. Nature 1955, 176, 83–84. [Google Scholar] [CrossRef]
  89. Stamm, A.J.; Loughborough, W.K. Thermodynamics of the swelling of wood. J. Phys. Chem. 1935, 39, 121–132. [Google Scholar] [CrossRef]
  90. Simón, C.; Esteban, L.G.; de Palacios, P.; Fernández, F.G.; Martín-Sampedro, R.; Eugenio, M.E. Thermodynamic analysis of water vapour sorption behaviour of juvenile and mature wood of Abies alba Mill. J. Mater. Sci. 2015, 50, 7282–7292. [Google Scholar] [CrossRef]
  91. Esteban, L.G.; de Palacios, P.; Fernández, F.G.; Guindeo, A.; Cano, N.N. Sorption and thermodynamic properties of old and new Pinus sylvestris wood. Wood Fiber Sci. 2008, 40, 111–121. [Google Scholar]
  92. Weichert, L. Untersuchungen Über das Sorptions—Und Quellungsverhalten von Fichte, Buche und Buchenpressvollholz bei Temperaturen zwischen 20 °C und 100 °C, in Fakultät für Maschinenwesen und Elektrotechnik; TH München: Munich, Germany, 1963; pp. 1–96. [Google Scholar]
  93. Wadsö, L.; Markova, N. A method to simultaneously determine sorption isotherms and sorption enthalpies with a double twin microcalorimeter. Rev. Sci. Instrum. 2002, 73, 2743–2754. [Google Scholar] [CrossRef]
  94. Markova, N.; Sparr, E.; Wadsö, L. On application of an isothermal sorption microcalorimeter. Thermochim. Acta 2001, 374, 93–104. [Google Scholar] [CrossRef]
  95. Wadsö, L.; Markova, N. A double twin isothermal microcalorimeter. Thermochim. Acta 2000, 360, 101–107. [Google Scholar] [CrossRef]
  96. Van den Berg, C.; Bruin, S. Water activity and its estimation in food systems: Theoretical aspects. In Water Activity: Influences on Food Quality; Stewart, G.F., Ed.; Academic Press: Cambridge, MA, USA, 1981; pp. 1–61. [Google Scholar]
  97. Simpson, W.T. Predicting equilibrium moisture content of wood by mathematical models. Wood Fiber Sci. 1973, 5, 41–49. [Google Scholar]
  98. Simpson, W. Sorption theories applied to wood. Wood Fiber 1980, 12, 183–195. [Google Scholar]
  99. Avramidis, S. Evaluation of 3-variable models for the prediction of equilibrium moisture-content in wood. Wood Sci. Technol. 1989, 23, 251–257. [Google Scholar] [CrossRef]
  100. Glass, S.V.; Zelinka, S.L.; Johnson, J.A. Investigation of Historic Equilibrium Moisture Content Data from the Forest Products Laboratory; US Department of Agriculture, Forest Service, Forest Products Laboratory: Madison, WI, USA, 2014.
  101. Anderson, R.B. Modifications of the Brunauer, Emmett and Teller equation. J. Am. Chem. Soc. 1946, 68, 686–691. [Google Scholar] [CrossRef]
  102. Anderson, R.B.; Hall, W.K. Modifications of the Brunauer, Emmett and Teller equation II. J. Am. Chem. Soc. 1948, 70, 1727–1734. [Google Scholar] [CrossRef] [PubMed]
  103. Guggenheim, E.A. (Ed.) Chapter 11. Localized monolayer and multilayer adsorption of gases. In Applications of Statistical Mechanics; Clarendon Press: Oxford, UK, 1966; pp. 186–206. [Google Scholar]
  104. De Boer, J.H. (Ed.) Chapter 5. The quantity: Unimolecular and multimolecular adsorption. In The Dynamical Character of Adsorption; The Clarendon Press: Oxford, UK, 1953; pp. 54–89. [Google Scholar]
  105. Hailwood, A.J.; Horrobin, S. Absorption of water by polymers: Analysis in terms of a simple model. Trans. Faraday Soc. 1946, 42, B084–B092. [Google Scholar] [CrossRef]
  106. Dent, R.W. Multilayer theory for gas sorption. 1. Sorption of a single gas. Text. Res. J. 1977, 47, 145–152. [Google Scholar] [CrossRef]
  107. Thybring, E.E.; Boardman, C.R.; Zelinka, S.L.; Glass, S.V. Common sorption isotherm models are not physically valid for water in wood. Colloids Surf. A Physicochem. Eng. Asp. 2021, 627, 127214. [Google Scholar] [CrossRef]
  108. Adolphs, J.; Setzer, M.J. A model to describe adsorption isotherms. J. Colloid Interface Sci. 1996, 180, 70–76. [Google Scholar] [CrossRef]
  109. Adolphs, J.; Setzer, M.J. Energetic classification of adsorption isotherms. J. Colloid Interface Sci. 1996, 184, 443–448. [Google Scholar] [CrossRef]
  110. Willems, W. The water vapor sorption mechanism and its hysteresis in wood: The water/void mixture postulate. Wood Sci. Technol. 2014, 48, 499–518. [Google Scholar] [CrossRef]
  111. Willems, W. A critical review of the multilayer sorption models and comparison with the sorption site occupancy (SSO) model for wood moisture sorption isotherm analysis. Holzforschung 2015, 69, 67–75. [Google Scholar] [CrossRef]
  112. Bertinetti, L.; Fratzl, P.; Zemb, T. Chemical, colloidal and mechanical contributions to the state of water in wood cell walls. New J. Phys. 2016, 18, 083048. [Google Scholar] [CrossRef] [Green Version]
  113. Gregg, S.J.; Sing, K.S.W. Adsorption, Surface Area and Porosity; Academic Press: London, UK, 1967; p. 371. [Google Scholar]
  114. Fredriksson, M.; Thybring, E.E. On sorption hysteresis in wood: Separating hysteresis in cell wall water and capillary water in the full moisture range. PLoS ONE 2019, 14, e0225111. [Google Scholar] [CrossRef]
  115. Hernandez, R.E.; Caceres, C.B. Magnetic resonance microimaging of liquid water distribution in sugar maple wood below fiber saturation point. Wood Fiber Sci. 2010, 42, 259–272. [Google Scholar]
  116. Passarini, L.; Malveau, C.; Hernández, R. Water state study of wood structure of four hardwoods below fiber saturation point with nuclear magnetic resonance. Wood Fiber Sci. 2014, 46, 480–488. [Google Scholar]
  117. Almeida, G.; Gagne, S.; Hernandez, R.E. A NMR study of water distribution in hardwoods at several equilibrium moisture contents. Wood Sci. Technol. 2007, 41, 293–307. [Google Scholar] [CrossRef]
  118. Wilson, T.R.C. Strength-Moisture Relations for Wood; Technical Bulletin 282; US Departmnent of Agriculture: Washington, DC, USA, 1932; pp. 1–88.
  119. Stamm, A.J. Shrinking and swelling of wood. Ind. Eng. Chem. 1935, 27, 401–406. [Google Scholar] [CrossRef]
  120. Shupe, T.F.; Chow, P. Sorption, shrinkage, and fiber saturation point of kempas (Koompassia malaccensis). For. Prod. J. 1996, 46, 94. [Google Scholar]
  121. Stamm, A.J. The fiber-saturation point of wood as obtained from electrical conductivity measurements. Ind. Eng. Chem. Process Des. Dev. 1929, 1, 94–97. [Google Scholar] [CrossRef]
  122. James, W.L. Electric Moisture Meters for Wood; U.S. Forest Service Research Note FPL-08; US Forest Service Forest Products Laboratory: Madison, WI, USA, 1963; p. 24. [Google Scholar]
  123. James, W.L. Electric Moisture Meters for Wood; Forest Products Laboratory General Technical Report FPL-GTR-6; US Forest Service Forest Products Laboratory: Madison, WI, USA, 1988; p. 17. [Google Scholar]
  124. Repellin, V.; Guyonnet, R. Evaluation of heat-treated wood swelling by differential scanning calorimetry in relation to chemical composition. Holzforschung 2005, 59, 28–34. [Google Scholar] [CrossRef] [Green Version]
  125. Simpson, L.A.; Barton, A.F.M. Determination of the fibre saturation point in whole wood using differential scanning calorimetry. Wood Sci. Technol. 1991, 25, 301–308. [Google Scholar] [CrossRef]
  126. Thybring, E.E.; Digaitis, R.; Nord-Larsen, T.; Beck, G.; Fredriksson, M. How much water can wood cell walls hold? A triangulation approach to determine the maximum cell wall moisture content. PLoS ONE 2020, 15, e0238319. [Google Scholar]
  127. Zauer, M.; Kretzschmar, J.; Großmann, L.; Pfriem, A.; Wagenführ, A. Analysis of the pore-size distribution and fiber saturation point of native and thermally modified wood using differential scanning calorimetry. Wood Sci. Technol. 2014, 48, 177–193. [Google Scholar] [CrossRef]
  128. Thygesen, L.G.; Elder, T. Moisture in untreated, acetylated, and furfurylated Norway spruce studied during drying using Time Domain NMR. Wood Fiber Sci. 2008, 40, 309–320. [Google Scholar]
  129. Thygesen, L.G.; Elder, T. Moisture in untreated, acetylated, and furfurylated norway spruce monitored during drying below fiber saturation using time domain NMR. Wood Fiber Sci. 2009, 41, 194–200. [Google Scholar]
  130. Beck, G.; Thybring, E.E.; Thygesen, L.G.; Hill, C. Characterization of moisture in acetylated and propionylated radiata pine using low-field nuclear magnetic resonance (LFNMR) relaxometry. Holzforschung 2018, 72, 225. [Google Scholar] [CrossRef]
  131. Fredriksson, M.; Thygesen, L.G. The states of water in Norway spruce (Picea abies (L.) Karst.) studied by low-field nuclear magnetic resonance (LFNMR) relaxometry: Assignment of free-water populations based on quantitative wood anatomy. Holzforschung 2017, 71, 77–90. [Google Scholar] [CrossRef] [Green Version]
  132. Kekkonen, P.M.; Ylisassi, A.; Telkki, V.V. Absorption of water in thermally modified pine wood as studied by nuclear magnetic resonance. J. Phys. Chem. C 2013, 118, 2146–2153. [Google Scholar] [CrossRef]
  133. Stone, J.E.; Scallan, A.M. A structural model for the cell wall of water-swollen wood pulp fibres based on their accessibility to macromolecules. Cellul. Chem. Technol. 1968, 2, 343–358. [Google Scholar]
  134. Ahlgren, P.A.; Wood, J.R.; Goring, D.A.I. Fiber saturation point of various morphological subdivisions of Douglas-fir and aspen wood. Wood Sci. Technol. 1972, 6, 81–84. [Google Scholar] [CrossRef]
  135. Feist, W.C.; Tarkow, H. A new procedure for measuring fiber saturation points. For. Prod. J. 1967, 17, 65–68. [Google Scholar]
  136. Salmén, L.; Fahlén, J. Reflections on the ultrastructure of softwood fibers. Cellul. Chem. Technol. 2006, 40, 181–185. [Google Scholar]
  137. Papadopoulos, A.N.; Hill, C.A.S.; Gkaraveli, A. Determination of surface area and pore volume of holocellulose and chemically modified wood flour using the nitrogen adsorption technique. Holz Roh Werkst. 2003, 61, 453–456. [Google Scholar] [CrossRef]
  138. Fahlén, J.; Salmén, L. Pore and matrix distribution in the fiber wall revealed by atomic force microscopy and image analysis. Biomacromolecules 2005, 6, 433–438. [Google Scholar] [CrossRef]
  139. Kulasinski, K.; Guyer, R.; Derome, D.; Carmeliet, J. Water adsorption in wood microfibril-hemicellulose system: Role of the crystalline–amorphous interface. Biomacromolecules 2015, 16, 2972–2978. [Google Scholar] [CrossRef]
  140. Hernandez, R.E.; Bizon, M. Changes in shrinkage and tangential compression strength of sugar maple below and above the fiber saturation point. Wood Fiber Sci. 1994, 26, 360–369. [Google Scholar]
  141. Almeida, G.; Hernandez, R.E. Changes in physical properties of yellow birch below and above the fiber saturation point. Wood Fiber Sci. 2006, 38, 74–83. [Google Scholar]
  142. Almeida, G.; Hernández, R.E. Changes in physical properties of tropical and temperate hardwoods below and above the fiber saturation point. Wood Sci. Technol. 2006, 40, 599–613. [Google Scholar] [CrossRef]
  143. Leppänen, K.; Bjurhager, I.; Peura, M.; Kallonen, A.; Suuronen, J.P.; Penttilä, P.; Love, J.; Fagerstedt, K.; Serimaa, R. X-ray scattering and microtomography study on the structural changes of never-dried silver birch, European aspen and hybrid aspen during drying. Holzforschung 2011, 65, 865–873. [Google Scholar] [CrossRef]
  144. Zabler, S.; Paris, O.; Burgert, I.; Fratzl, P. Moisture changes in the plant cell wall force cellulose crystallites to deform. J. Struct. Biol. 2010, 171, 133–141. [Google Scholar] [CrossRef] [PubMed]
  145. Toba, K.; Yamamoto, H.; Yoshida, M. Mechanical interaction between cellulose microfibrils and matrix substances in wood cell walls induced by repeated wet-and-dry treatment. Cellulose 2012, 19, 1405–1412. [Google Scholar] [CrossRef]
  146. Seifert, J. Sorption and swelling of wood and wood base materials. 2. Swelling behavior of wood and wood base materials. Holz Roh Werkst. 1972, 30, 294–303. [Google Scholar]
  147. Harris, J.M.; Meylan, B.A. The influence of microfibril angle on longitudinal and tangential shrinkage in Pinus radiata. Holzforschung 1965, 19, 144. [Google Scholar] [CrossRef]
  148. Patera, A.; Van den Bulcke, J.; Boone, M.N.; Derome, D.; Carmeliet, J. Swelling interactions of earlywood and latewood across a growth ring: Global and local deformations. Wood Sci. Technol. 2018, 52, 91–114. [Google Scholar] [CrossRef]
  149. Barber, N.F.; Meylan, B.A. The anisotropic shrinkage of wood. A theoretical model. Holzforschung 1964, 18, 146. [Google Scholar] [CrossRef]
  150. Meylan, B.A. Influence of microfibril angle on longitudinal shrinkage-moisture content relationship. Wood Sci. Technol. 1972, 6, 293–301. [Google Scholar] [CrossRef]
  151. Rafsanjani, A.; Stiefel, M.; Jefimovs, K.; Mokso, R.; Derome, D.; Carmeliet, J. Hygroscopic swelling and shrinkage of latewood cell wall micropillars reveal ultrastructural anisotropy. J. R. Soc. Interface 2014, 11, 20140126. [Google Scholar] [CrossRef]
  152. Patera, A.; Derome, D.; Griffa, M.; Carmeliet, J. Hysteresis in swelling and in sorption of wood tissue. J. Struct. Biol. 2013, 182, 226–234. [Google Scholar] [CrossRef]
  153. Murata, K.; Masuda, M. Microscopic observation of transverse swelling of latewood tracheid: Effect of macroscopic/mesoscopic structure. J. Wood Sci. 2006, 52, 283–289. [Google Scholar] [CrossRef]
  154. Noack, D.; Schwab, E.; Bartz, A. Characteristics for a judgment of sorption and swelling behavior of wood. Wood Sci. Technol. 1973, 7, 218–236. [Google Scholar] [CrossRef]
  155. Keylwerth, R. Untersuchungen über freie und behinderte Quellung von Holz—Erste Mitteilung: Freie Quellung. Holz Roh Werkst. 1962, 20, 252–259. [Google Scholar] [CrossRef]
  156. Fahlén, J.; Salmén, L. On the lamellar structure of the tracheid cell wall. Plant Biol. 2002, 4, 339–345. [Google Scholar] [CrossRef]
  157. Gu, H.; Zink-Sharp, A.; Sell, J. Hypothesis on the role of cell wall structure in differential transverse shrinkage of wood. Holz Roh Werkst. 2001, 59, 436–442. [Google Scholar] [CrossRef] [Green Version]
  158. Ishimaru, Y.; Iida, I. Transverse swelling behavior of hinoki (Chamaecyparis obtusa) revealed by the replica method. J. Wood Sci. 2001, 47, 178–184. [Google Scholar] [CrossRef]
  159. Sakagami, H.; Matsumura, J.; Oda, K. Shrinkage of tracheid cells with desorption visualized by confocal laser scanning microscopy. IAWA J. 2007, 28, 29–37. [Google Scholar] [CrossRef] [Green Version]
  160. Derome, D.; Griffa, M.; Koebel, M.; Carmeliet, J. Hysteretic swelling of wood at cellular scale probed by phase-contrast X-ray tomography. J. Struct. Biol. 2011, 173, 180–190. [Google Scholar] [CrossRef]
  161. Arzola-Villegas, X.; Lakes, R.; Plaza, N.Z.; Jakes, J.E. Wood moisture-induced swelling at the cellular scale—Ab intra. Forests 2019, 10, 996. [Google Scholar] [CrossRef] [Green Version]
  162. Stamm, A.J.; Burr, H.K.; Kline, A.A. Staybwood—Heat-stabilized wood. Ind. Eng. Chem. 1946, 38, 630–634. [Google Scholar] [CrossRef]
  163. Altgen, M.; Hofmann, T.; Militz, H. Wood moisture content during the thermal modification process affects the improvement in hygroscopicity of Scots pine sapwood. Wood Sci. Technol. 2016, 50, 1181–1195. [Google Scholar] [CrossRef]
  164. Akitsu, H.; Norimoto, M.; Morooka, T.; Rowell, R.M. Effect of humidity on vibrational properties of chemically modified wood. Wood Fiber Sci. 1993, 25, 250–260. [Google Scholar]
  165. Emmerich, L.; Altgen, M.; Rautkari, L.; Militz, H. Sorption behavior and hydroxyl accessibility of wood treated with different cyclic N-methylol compounds. J. Mater. Sci. 2020, 55, 16561–16575. [Google Scholar] [CrossRef]
  166. Hill, C.A.S.; Keating, B.A.; Jalaludin, Z.; Mahrdt, E. A rheological description of the water vapour sorption kinetics behaviour of wood invoking a model using a canonical assembly of Kelvin-Voigt elements and a possible link with sorption hysteresis. Holzforschung 2012, 66, 35–47. [Google Scholar] [CrossRef]
  167. Engelund, E.T.; Thygesen, L.G.; Hoffmeyer, P. Water sorption in wood and modified wood at high values of relative humidity. Part 2: Appendix. Theoretical assessment of the amount of capillary water in wood microvoids. Holzforschung 2010, 64, 325–330. [Google Scholar] [CrossRef]
  168. Fortin, Y. Moisture Content-Matric Potential Relationship and Water Flow Properties of Wood at High Moisture Contents; Department of Forestry, University of British Columbia: Vancouver, BC, Canada, 1979; p. 187. [Google Scholar]
  169. McBain, J.W. An Explanation of Hysteresis in the Hydration and Dehydration of Gels. J. Am. Chem. Soc. 1935, 57, 699–700. [Google Scholar] [CrossRef]
  170. Ravikovitch, P.I.; Neimark, A.V. Experimental confirmation of different mechanisms of evaporation from ink-bottle type pores:  Equilibrium, pore blocking, and cavitation. Langmuir 2002, 18, 9830–9837. [Google Scholar] [CrossRef]
  171. Skaar, C. Wood Moisture and the Environment. In Wood-Water Relations; Springer: Berlin/Heidelberg, Germany, 1988; pp. 1–45. [Google Scholar]
  172. Spalt, H.A. The fundamentals of water sorption by wood. For. Prod. J. 1958, 8, 288–295. [Google Scholar]
  173. Hoffmeyer, P.; Engelund, E.T.; Thygesen, L.G. Equilibrium moisture content (EMC) in Norway spruce during the first and second desorptions. Holzforschung 2011, 65, 875–882. [Google Scholar] [CrossRef] [Green Version]
  174. Fredriksson, M.; Thybring, E.E. Scanning or desorption isotherms? Characterising sorption hysteresis of wood. Cellulose 2018, 25, 4477–4485. [Google Scholar]
  175. Karagiozis, A. Advanced numerical models for hygrothermal research. In Moisture Analysis and Condensation Control in Building Envelopes; Treschel, H.R., Ed.; ASTM International: West Conshohocken, PA, USA, 2001; pp. 90–106. [Google Scholar]
  176. Straube, J.; Burnett, E. Overview of hygrothermal (HAM) analysis methods. In Moisture Analysis and Condensation Control in Building Envelopes; Trechsel, H., Ed.; ASTM International: West Conshohocken, PA, USA, 2001; pp. 81–89. [Google Scholar]
  177. Glass, S.V.; TenWolde, A.; Zelinka, S.L. Hygrothermal simulation: A tool for building envelope design analysis. Wood Des. Focus 2013, 23, 18–25. [Google Scholar]
  178. Everett, D.H. A general approach to hysteresis. Part 4. An alternative formulation of the domain model. Trans. Faraday Soc. 1955, 51, 1551–1557. [Google Scholar] [CrossRef]
  179. Peralta, P. Moisture Sorption Hysteresis and The Independent-domain Theory: The Moisture Distribution Function. Wood Fiber Sci. 1996, 28, 406–410. [Google Scholar]
  180. Peralta, P.N. Modeling wood moisture sorption hysteresis using the independent-domain theory. Wood Fiber Sci. 1995, 27, 250–257. [Google Scholar]
  181. Patera, A.; Derluyn, H.; Derome, D.; Carmeliet, J. Influence of sorption hysteresis on moisture transport in wood. Wood Sci. Technol. 2016, 50, 259–283. [Google Scholar] [CrossRef]
  182. Merakeb, S.; Dubois, F.; Petit, C. Modeling of the sorption hysteresis for wood. Wood Sci. Technol. 2009, 43, 575. [Google Scholar] [CrossRef]
  183. Arevalo, R.; Hernandez, R.E. Influence of moisture sorption on swelling of mahogany (Swietenia macrophylla King) wood. Holzforschung 2001, 55, 590–594. [Google Scholar] [CrossRef]
  184. Chauhan, S.S.; Aggarwal, P. Effect of moisture sorption state on transverse dimensional changes in wood. Holz Roh Werkst. 2004, 62, 50–55. [Google Scholar] [CrossRef]
  185. Hartley, I.D.; Avramidis, S. Static dimensional changes of Sitka spruce and Western hemlock influenced by sorption conditions. J. Inst. Wood Sci. 1996, 14, 83–88. [Google Scholar]
  186. Hernandez, R.E. Influence of moisture sorption history on the swelling of Sugar maple wood and some tropical hardwoods. Wood Sci. Technol. 1993, 27, 337–345. [Google Scholar] [CrossRef]
  187. Ishimaru, Y.; Arai, K.; Mizutani, M.; Oshima, K.; Iida, I. Physical and mechanical properties of wood after moisture conditioning. J. Wood Sci. 2001, 47, 185–191. [Google Scholar] [CrossRef]
  188. Derome, D.; Zillig, W.; Carmeliet, J. Variation of measured cross-sectional cell dimensions and calculated water vapor permeability across a single growth ring of spruce wood. Wood Sci. Technol. 2012, 46, 827–840. [Google Scholar] [CrossRef]
  189. Skaar, C. Moisture movement in the wood cell wall. In Wood-Water Relations; Springer: Berlin/Heidelberg, Germany, 1988; pp. 177–206. [Google Scholar]
  190. Siau, J.F. Steady-State Moisture Movement. In Transport Processes in Wood; Springer: Berlin/Heidelberg, Germany, 1984; pp. 151–174. [Google Scholar]
  191. Fick, A. Ueber Diffusion. Ann. Der Phys. 1855, 170, 59–86. [Google Scholar] [CrossRef]
  192. Fick, A. On liquid diffusion. Philos. Mag. Ser. 4 1855, 10, 30–39. [Google Scholar] [CrossRef]
  193. Janssen, H. Thermal diffusion of water vapour in porous materials: Fact or fiction? Int. J. Heat Mass Transf. 2011, 54, 1548–1562. [Google Scholar] [CrossRef] [Green Version]
  194. Darcy, H. Les Fontaines Publiques de la Ville de Dijon (The Public Fountains of the City of Dijon); Dalmont: Paris, France, 1856. [Google Scholar]
  195. Zillig, W. Moisture transport in wood using a multiscale approach. In Building Physics; Katholieke Universiteit Leuven: Leuven, Belgium, 2009. [Google Scholar]
  196. Sonderegger, W.; Vecellio, M.; Zwicker, P.; Niemz, P. Combined bound water and water vapour diffusion of Norway spruce and European beech in and between the principal anatomical directions. Holzforschung 2011, 65, 819–828. [Google Scholar] [CrossRef] [Green Version]
  197. Zelinka, S.L.; Glass, S.V.; Boardman, C.R.; Derome, D. Moisture storage and transport properties of preservative treated and untreated southern pine wood. Wood Mater. Sci. Eng. 2016, 11, 228–238. [Google Scholar] [CrossRef]
  198. Pidgeon, L.M.; Maass, O. The penetration of water vapor into wood. Can. J. Res. 1930, 2, 318–326. [Google Scholar] [CrossRef]
  199. Buckman, S.J.; Rees, L.W. Moisture movement in coniferous wood below the fiber-saturation point. In Technical Bulletin; University of Minnesota: St. Paul, MN, USA, 1935; p. 19. [Google Scholar]
  200. Choong, E.T. Movement of moisture through softwood in hygroscopic range. For. Prod. J. 1963, 13, 489–498. [Google Scholar]
  201. Choong, E.T.; Fogg, P.J. Moisture movement in six wood species. For. Prod. J. 1968, 18, 66–70. [Google Scholar]
  202. Petty, J.A.; Preston, R.D. Permeability and structure of the wood of Sitka spruce. Proc. R. Soc. London. Ser. B. Biol. Sci. 1970, 175, 149–166. [Google Scholar]
  203. Kulasinski, K.; Guyer, R.; Derome, D.; Carmeliet, J. Water diffusion in amorphous hydrophilic systems: A stop and go process. Langmuir 2015, 31, 10843–10849. [Google Scholar] [CrossRef] [PubMed]
  204. Kulasinski, K.; Keten, S.; Churakov, S.V.; Guyer, R.; Carmeliet, J.; Derome, D. Molecular mechanism of moisture-induced transition in amorphous cellulose. ACS Macro Lett. 2014, 3, 1037–1040. [Google Scholar] [CrossRef]
  205. Topgaard, D.; Söderman, O. Diffusion of water absorbed in cellulose fibers studied with H-1-NMR. Langmuir 2001, 17, 2694–2702. [Google Scholar] [CrossRef]
  206. Stamm, A.J. Bound water diffusion into wood in the fiber direction. For. Prod. J. 1959, 9, 27–32. [Google Scholar]
  207. Stamm, A.J. Bound-water diffusion into wood in across-the-fiber directions. For. Prod. J. 1960, 10, 524–528. [Google Scholar]
  208. Keplinger, T.; Cabane, E.; Chanana, M.; Hass, P.; Merk, V.; Gierlinger, N.; Burgert, I. A versatile strategy for grafting polymers to wood cell walls. Acta Biomater. 2015, 11, 256–263. [Google Scholar] [CrossRef]
  209. Keplinger, T.; Cabane, E.; Berg, J.K.; Segmehl, J.S.; Bock, P.; Burgert, I. Smart hierarchical bio-based materials by formation of stimuli-responsive hydrogels inside the microporous structure of wood. Adv. Mater. Interfaces 2016, 3, 1600233. [Google Scholar] [CrossRef]
  210. Stamm, A.J. Diffusion of water into uncoated cellophane. 1. From rates of water vapor adsorption, and liquid water absorption. J. Phys. Chem. 1956, 60, 76–82. [Google Scholar] [CrossRef]
  211. Stamm, A.J. Diffusion of water into uncoated cellophane. 2. From steady-state diffusion measurements. J. Phys. Chem. 1956, 60, 83–86. [Google Scholar] [CrossRef]
  212. Siau, J.F. Permeability. In Transport Processes in Wood; Springer: Berlin/Heidelberg, Germany, 1984; pp. 73–104. [Google Scholar]
  213. Hansmann, C.; Gindl, W.; Wimmer, R.; Teischinger, A. Permeability of wood—A review. Wood Res. 2002, 47, 1–16. [Google Scholar]
  214. Sedighi-Gilani, M.; Griffa, M.; Mannes, D.; Lehmann, E.; Carmeliet, J.; Derome, D. Visualization and quantification of liquid water transport in softwood by means of neutron radiography. Int. J. Heat Mass Transf. 2012, 55, 6211–6221. [Google Scholar] [CrossRef]
  215. Almeida, G.; Leclerc, S.; Perre, P. NMR imaging of fluid pathways during drainage of softwood in a pressure membrane chamber. Int. J. Multiph. Flow 2008, 34, 312–321. [Google Scholar] [CrossRef]
  216. Sedighi-Gilani, M.; Vontobel, P.; Lehmann, E.; Carmeliet, J.; Derome, D. Liquid uptake in Scots pine sapwood and hardwood visualized and quantified by neutron radiography. Mater. Struct. 2014, 47, 1083–1096. [Google Scholar] [CrossRef]
  217. Desmarais, G.; Sedighi-Gilani, M.; Vontobel, P.; Carmeliet, J.; Derome, D. Transport of polar and nonpolar liquids in softwood imaged by neutron radiography. Transp. Porous Media 2016, 113, 383–404. [Google Scholar] [CrossRef]
  218. Liese, W.; Bauch, J. On the closure of bordered pits in conifers. Wood Sci. Technol. 1967, 1, 1–13. [Google Scholar] [CrossRef]
  219. Phillips, E.W.J. Movement of the pit membrane in coniferous woods, with special reference to preservative treatment. For. Int. J. For. Res. 1933, 7, 109–120. [Google Scholar] [CrossRef]
  220. Siau, J.F. Wood Structure and Chemical Composition. In Transport Processes in Wood; Springer: Berlin/Heidelberg, Germany, 1984; pp. 35–72. [Google Scholar]
  221. Gezici-Koç, Ö.; Erich, S.J.F.; Huinink, H.P.; van der Ven, L.G.J.; Adan, O.C.G. Bound and free water distribution in wood during water uptake and drying as measured by 1D magnetic resonance imaging. Cellulose 2017, 24, 535–553. [Google Scholar] [CrossRef] [Green Version]
  222. Sandberg, K.; Salin, J.G. Liquid water absorption in dried Norway spruce timber measured with CT scanning and viewed as a percolation process. Wood Sci. Technol. 2012, 46, 207–219. [Google Scholar] [CrossRef]
  223. Stamm, A.J. Passage of Liquids, Vapors and Dissolved Materials through Softwoods; Technical Bulletin 929; US Department of Agriculture: Washington, DC, USA, 1946; pp. 1–80.
  224. Comstock, G.L. Moisture diffusion coefficients in wood as calculated from adsorption, desorption, and steady state data. For. Prod. J. 1963, 13, 97–103. [Google Scholar]
  225. Skaar, C.; Prichananda, C.; Davidson, R.W. Some aspects of moisture sorption dynamics in wood. Wood Sci. 1970, 2, 179–185. [Google Scholar]
  226. Wadsö, L. Measurements of water-vapor sorption in wood. 2. Results. Wood Sci. Technol. 1993, 28, 59–65. [Google Scholar] [CrossRef]
  227. Wadsö, L. Unsteady-state water-vapor adsorption in wood—An experimental study. Wood Fiber Sci. 1994, 26, 36–50. [Google Scholar]
  228. Wadsö, L. Describing non-fickian water-vapor sorption in wood. J. Mater. Sci. 1994, 29, 2367–2372. [Google Scholar] [CrossRef]
  229. Krabbenhøft, K.; Damkilde, L. A model for non-Fickian moisture transfer in wood. Mater. Struct. 2004, 37, 615–622. [Google Scholar] [CrossRef]
  230. Frandsen, H.L.; Damkilde, L.; Svensson, S. A revised multi-Fickian moisture transport model to describe non-Fickian effects in wood. Holzforschung 2007, 61, 563–572. [Google Scholar] [CrossRef]
  231. Eitelberger, J.; Hofstetter, K.; Dvinskikh, S.V. A multi-scale approach for simulation of transient moisture transport processes in wood below the fiber saturation point. Compos. Sci. Technol. 2011, 71, 1727–1738. [Google Scholar] [CrossRef]
  232. Eitelberger, J.; Hofstetter, K. A comprehensive model for transient moisture transport in wood below the fiber saturation point: Physical background, implementation and experimental validation. Int. J. Therm. Sci. 2011, 50, 1861–1866. [Google Scholar] [CrossRef]
  233. Konopka, D.; Kaliske, M. Transient multi-Fickian hygro-mechanical analysis of wood. Comput. Struct. 2018, 197, 12–27. [Google Scholar] [CrossRef]
  234. Krabbenhøft, K.; Damkilde, L. Double porosity models for the description of water infiltration in wood. Wood Sci. Technol. 2004, 38, 641–659. [Google Scholar] [CrossRef]
  235. Autengruber, M.; Lukacevic, M.; Füssl, J. Finite-element-based moisture transport model for wood including free water above the fiber saturation point. Int. J. Heat Mass Transf. 2020, 161, 120228. [Google Scholar] [CrossRef]
  236. Thorell, A.; Wadsö, L. Determination of external mass transfer coefficients in dynamic sorption (DVS) measurements. Dry. Technol. 2018, 36, 332–340. [Google Scholar] [CrossRef] [Green Version]
  237. Wadsö, L. Surface mass transfer coefficients for wood. Dry. Technol. 1993, 11, 1227–1249. [Google Scholar] [CrossRef]
  238. Christensen, G.N. Kinetics of sorption of water vapour by wood. Aust. J. Appl. Sci. 1960, 11, 295–304. [Google Scholar]
  239. Christensen, G.N. The rate of sorption of water vapour by wood and pulp. Appita J. 1959, 13, 112–123. [Google Scholar]
  240. Christensen, G.N.; Kelsey, K.E. The rate of sorption of water vapor by wood. Holz Roh Werkst. 1959, 17, 178–188. [Google Scholar] [CrossRef]
  241. Christensen, G.N.; Hergt, H.F.A. Effect of previous history on kinetics of sorption by wood cell walls. J. Polym. Sci. Part A 1 Polym. Chem. 1969, 7, 2427–2430. [Google Scholar] [CrossRef]
  242. Willems, W. Thermally limited wood moisture changes: Relevance for dynamic vapour sorption experiments. Wood Sci. Technol. 2017, 51, 751–770. [Google Scholar] [CrossRef]
  243. Willems, W. Heuristic study on the interaction between heat exchange and slow relaxation processes during wood moisture content changes. Holzforschung 2021, 75, 303–312. [Google Scholar] [CrossRef]
  244. Chen, W.; Lickfield, G.C.; Yang, C.Q. Molecular modeling of cellulose in amorphous state. Part I: Model building and plastic deformation study. Polymer 2004, 45, 1063–1071. [Google Scholar] [CrossRef]
  245. Matsuoka, S.; Bair, H.E.; Bearder, S.S.; Kern, H.E.; Ryan, J.T. Analysis of non-linear stress relaxation in polymeric glasses. Polym. Eng. Sci. 1978, 18, 1073–1080. [Google Scholar] [CrossRef]
  246. Kohler, R.; Dück, R.; Ausperger, B.; Alex, R. A numeric model for the kinetics of water vapor sorption on cellulosic reinforcement fibers. Compos. Interfaces 2003, 10, 255–276. [Google Scholar] [CrossRef]
  247. Murr, A.; Lackner, R. Analysis on the influence of grain size and grain layer thickness on the sorption kinetics of grained wood at low relative humidity with the use of water vapour sorption experiments. Wood Sci. Technol. 2018, 52, 753–776. [Google Scholar] [CrossRef] [Green Version]
  248. Olek, W.; Perré, P.; Weres, J. Inverse analysis of the transient bound water diffusion in wood. Holzforschung 2005, 59, 38–45. [Google Scholar] [CrossRef]
  249. Guo, X.; Wu, Y.; Xie, X. Water vapor sorption properties of cellulose nanocrystals and nanofibers using dynamic vapor sorption apparatus. Sci. Rep. 2017, 7, 14207. [Google Scholar] [CrossRef] [Green Version]
  250. Himmel, S.; Mai, C. Water vapour sorption of wood modified by acetylation and formalisation—Analysed by a sorption kinetics model and thermodynamic considerations. Holzforschung 2016, 70, 203–213. [Google Scholar] [CrossRef]
  251. Simón, C.; Esteban, L.G.; de Palacios, P.; Fernández, F.G.; García-Iruela, A. Sorption/desorption hysteresis revisited. Sorption properties of Pinus pinea L. analysed by the parallel exponential kinetics and Kelvin-Voigt models. Holzforschung 2017, 71, 171. [Google Scholar] [CrossRef]
  252. Hill, C.A.S.; Norton, A.; Newman, G. Analysis of the water vapour sorption behaviour of Sitka spruce [Picea sitchensis (Bongard) Carr.] based on the parallel exponential kinetics model. Holzforschung 2010, 64, 469–473. [Google Scholar]
  253. Zaihan, J.; Hill, C.A.S.; Curling, S.; Hashim, W.S.; Hamdan, H. The kinetics of water vapour sorption: Analysis using parallel exponential kinetics model on six Malaysian hardwoods. J. Trop. For. Sci. 2010, 22, 107–117. [Google Scholar]
  254. Glass, S.V.; Zelinka, S.L.; Thybring, E.E. Exponential decay analysis: A flexible, robust, data-driven methodology for analyzing sorption kinetic data. Cellulose 2021, 28, 153–174. [Google Scholar] [CrossRef]
  255. Belbekhouche, S.; Bras, J.; Siqueira, G.; Chappey, C.; Lebrun, L.; Khelifi, B.; Marais, S.; Dufresne, A. Water sorption behavior and gas barrier properties of cellulose whiskers and microfibrils films. Carbohydr. Polym. 2011, 83, 1740–1748. [Google Scholar] [CrossRef]
  256. Jalaludin, Z.; Hill, C.A.S.; Samsi, H.W.; Husain, H.; Xie, Y.J. Analysis of water vapour sorption of oleo-thermal modified wood of Acacia mangium and Endospermum malaccense by a parallel exponential kinetics model and according to the Hailwood-Horrobin model. Holzforschung 2010, 64, 763–770. [Google Scholar] [CrossRef]
  257. Xie, Y.J.; Hill, C.A.S.; Jalaludin, Z.; Curling, S.F.; Anandjiwala, R.D.; Norton, A.J.; Newman, G. The dynamic water vapour sorption behaviour of natural fibres and kinetic analysis using the parallel exponential kinetics model. J. Mater. Sci. 2011, 46, 479–489. [Google Scholar] [CrossRef]
  258. Thybring, E.E.; Boardman, C.R.; Glass, S.V.; Zelinka, S.L. The parallel exponential kinetics model is unfit to characterize moisture sorption kinetics in cellulosic materials. Cellulose 2019, 26, 723–735. [Google Scholar] [CrossRef]
Figure 1. Water in different locations in wood. Cell wall water is found inside the solid cell walls where it interacts with the hydroxyls of the constituent polymers (cellulose, hemicelluloses, lignin) by hydrogen bonds. Capillary water is found in the porous microstructure of wood, e.g., in pits and lumina.
Forests 13 02051 g001
Figure 2. Schematic illustration of sorption isotherms in the hygroscopic and over-hygroscopic moisture ranges. Both absorption (right-pointing arrows) and desorption (left-pointing arrows) isotherms are illustrated. The right diagram is a zoom of the over-hygroscopic moisture range. In the hygroscopic range, water is predominantly found within the cell walls interacting with the wood polymers. In the over-hygroscopic range, the dominating sorption mechanism is capillary condensation in the macro-void structure.
Forests 13 02051 g002
Figure 3. Differential sorption enthalpy (right) derived from the Clausius-Clapeyron equation on sorption isotherm data (left) after fitting the ABC isotherm (Equation (4), Section 3.3) [85]. Additionally shown is differential sorption enthalpy determined directly from sorption calorimetry. Sorption isotherm data for spruce [86] and sorption calorimetric data for Scots pine [84].
Forests 13 02051 g003
Figure 4. Different moisture states related to literature definitions of the fiber saturation point (FSP) from (a) the measurement of the physical property and (b) the partitioning of the water in wood into capillary water and cell wall water. In (a) FSP is defined as the moisture content at the intersection point of the two linear regimes, whereas in (b) FSP is defined as the maximum cell wall moisture content or as the moisture state where capillary water appears. Note that the various definitions do not refer to the same moisture state of the wood.
Forests 13 02051 g004
Figure 5. Multiple phenomena involved in the swelling of wood from macro-scale to nano-scale. On the macro-scale, bulk wood exhibits swelling hysteresis (a) which results in differences in dimensions at similar moisture contents depending on moisture history (arrows show sorption direction). On the micro-scale, the dominant microfibrillar orientation (b), i.e., the microfibril angle, affects the swelling in different directions of the cell (illustrated by the tangential and longitudinal swelling), and the interaction between earlywood tissue and stiffer latewood tissue affects the swelling in the tangential (c) and radial (d) directions. On the nano-scale, swelling stresses arising from changes in moisture content cause deformation of the cellulose microfibrils in the axial (e) and transverse (f) directions. Experimental data: (a) spruce [146], (b) Radiata pine [147], (c,d) Norway spruce [148], (e,f) Norway spruce [144]. Note that swelling data in (b) are calculated from data for the total shrinkage from green to oven-dry conditions, whereas swelling data in (c,d) are reported relative to the dimensions in equilibrium with 25% RH and not to those in the dry state.
Forests 13 02051 g005
Figure 6. (a) Moisture sorption isotherms, and (b) absolute hysteresis curves for wood of Norway spruce [174]. Desorption isotherms are determined either from full water saturation (boundary curves) or from conditioning in absorption to either 95% or 80% RH (scanning desorption).
Forests 13 02051 g006
Figure 7. Transport of water in wood. The porous, macro-void structure (lumina, pits, etc.) facilitates the transport of both water vapor by diffusion and liquid water by capillary action (wetting). Cell wall water is transported in the solid cell walls by diffusion (not shown). There is a continuous exchange of water molecules at the interface between cell walls and macro-voids, here exemplified by the exchange between vapor and cell wall water.
Forests 13 02051 g007
Figure 8. (a) Moisture sorption data for loblolly pine during absorption from 70% to 80% RH [81,82], and (b) the fingerprints of the experimental data analyzed by multi-exponential decay analysis (MEDEA) as well as fingerprints of the Parallel Exponential Kinetics (PEK) model and Fickian diffusion model after optimization of the fit to data [254,258].
Forests 13 02051 g008
Publisher’s Note: MDPI stays neutral with regard to jurisdictional claims in published maps and institutional affiliations.

