Article

Effects of Water Deficit Stress on Growth Parameters of Robinia pseudoacacia L. Selected Clones under In Vitro Conditions

1
Department of Silviculture and Forest Tree Genetics, Forest Research Institute, 3 Braci Leśnej St., Sękocin Stary, 05-090 Raszyn, Poland
2
Laboratory of Dendrometry and Forest Productivity, Department of Forest Management Planning, Dendrometry and Forest Economics, Institute of Forest Sciences, Warsaw University of Life Sciences, Nowoursynowska 159, 02-776 Warsaw, Poland
3
Department of Renewable Resources, University of Alberta, 442 Earth Sciences Building, Edmonton, AB T6G 2E3, Canada
*
Author to whom correspondence should be addressed.
Forests 2022, 13(12), 1979; https://doi.org/10.3390/f13121979
Submission received: 7 November 2022 / Revised: 21 November 2022 / Accepted: 22 November 2022 / Published: 23 November 2022
(This article belongs to the Special Issue Abiotic Stress in Tree Species)

Abstract

:
Rapid screening methods for drought-resistant genotypes are urgently needed in tree improvement programs in the face of current climate change. We used a plant tissue culture technique to assess the phenotypic response of three highly productive genotypes of Robinia pseudoacacia to water deficit induced by mannitol and sucrose in a range of water potentials from 0 MPa to −1.5 MPa in an eight-week experiment. Our study showed genotype-specific responses to induced drought stress, indicating the potential for tree improvement in productivity and stress tolerance. Considering that all plantlets were constantly supplied with carbon, from the medium during the drought-induced experiment, our results suggest that hydraulic failure rather than carbon starvation may be the main cause of drought-induced mortality. Furthermore, our results showed different metabolic pathways of sucrose depending on the concentration of sucrose in the medium and different responses to osmoticum (mannitol vs. sucrose) and its concentration among the clones tested. We believe, that for large-scale breeding programs wanting to select for drought-tolerant genotypes, the use of culture media containing 90 gL−1 mannitol or 90 gL−1 sucrose at an early selection stage should provide satisfactory screening results. However, lab-based screening should be supported by further field trials, preferably at multiple sites, to assess the long-term impact and phenotypic stability of the early selection strategies.

1. Introduction

Drought episodes caused by climate change have underpinned many large-scale forest dieback events in recent years, often in combination with other abiotic and biotic factors [1,2]. Today, there is undoubtedly ample evidence that forests are dying either directly or indirectly due to heat and drought [3,4,5,6,7]. Recent evidence suggests that rising global temperatures are already exacerbating drought-induced forest changes and affecting terrestrial net primary productivity [8]. The other consequences of prolonged droughts and higher temperatures include potential shifts in species distribution ranges and a reduction in the sustainability of forests and their benefits for ecological and social needs [2,9,10]. The understanding of drought effects on trees is thus vital for the proper management and conservation of forest ecosystems [11].
Drought stress is a multifaceted phenomenon that can be analysed at physiological, metabolomic, and genetic levels. In general, plants experience drought when water availability to the root system becomes limited or when the transpiration rate becomes so high that an imbalance between water uptake and water loss occurs [12], resulting in cavitation.
The first measurable consequence of drought stress is a reduction in growth caused by a decrease in cellular expansion [13]. The cellular expansion process and carbohydrate wall synthesis are highly dependent on water deficit [14,15], and the reduction in growth is a consequence of the shedding of these cells [16]. The duration of drought is one of the critical factors that can have a particularly negative impact on forest communities [1]. The wide range of plant adaptation mechanisms and survival strategies depends on plant species, and genotypes within species, which developed under different climatic and environmental conditions. In general, two different water management strategies have evolved in plants: an isohydric strategy and an anisohydric strategy. Previous studies have shown that differences in the behaviour of isohydric and anisohydric plants are due to differences in the sensitivity of their respective guard cells to a critical leaf threshold [17]. As a result, under both optimal conditions and mild-to-moderate drought conditions, anisohydric plants maintain higher stomatal conductance and CO2 assimilation compared to isohydric plants and, therefore, remain more productive under drought stress conditions [17]. However, the recent advances in drought response research suggest that the traditional classification of plants as iso/anisohydric has shown large differences in their isohydrocity [18] and multi-species comparisons have shown that species are ordered on a continuum rather than a dichotomy. Very few species, if any at all, conform strictly to the definitions of isohydric or anisohydric strategies [18,19,20]. Nonetheless, sensitivity to drought is fundamental to the geographic distribution of individual species as well as communities [9,21] and thus there are an increasing number of studies that provide species distribution models based on climatic variables. Recent studies in Central Europe indicate that most native tree species will face a significant decrease in suitable habitat area, while future climatic conditions are likely to favour the occurrence of introduced species such as black locust (Robinia pseudoacacia L.) [9,22,23], which is still relatively rare in Central and Northeastern Europe.
R. pseudoacacia is a light-demanding competitive pioneer species native to North America which was introduced into Europe at the beginning of the 17th century. This non-native species has become economically important due to its multipurpose use [22,23,24,25,26], providing important timber and non-timber ecosystem products (e.g., honey production [27], regulating services (nitrogen fixation in wasteland and in the reclamation of surface mines, erosion prevention and control, carbon sequestration, soil formation and stabilization [24] and cultural ecosystem services (aesthetics, biotherapeutic and recreational value, especially in urban areas [26]. However, the combination of high productivity, and rapid growth with high wood density, which is rare among woody plant species [24], gave this species an advantage that has attracted worldwide interest and seems to outweigh the negative aspects of its introductions (e.g., invasiveness).
Current climate change provides an additional incentive to improve the growth rates and wood properties of black locust in sustainably managed plantations in Central Europe to limit the uncertainties of long rotation periods of native forest species and provide an additional source of woody biomass, reducing timber harvesting from natural forests. Essential for the efficient improvement of R. pseudoacacia is the selection of high-yielding clones, but it is evident that improved drought stress resistance is also required [28].
Drought resistance is defined as enhanced productivity under the unfavourable conditions of water deficit. R. pseudoacacia is a good candidate to meet these criteria as it is considered a very drought-resistant species [24]. Black locust can adapt to prolonged drought by reducing water loss through both reduced transpiration and leaf size [29] and due to an extensive root system that can access water in deeper soil layers [30]. Interestingly, R. pseudoacacia is also classified as an anisohydric species, characterized by the maintenance of a high transpiration rate independent of soil moisture levels until there is little water left to withdraw; however, the degree of drought tolerance within the species is genotype-specific [31,32].
To study changes in plant growth under drought, several authors have successfully used the technique of plant tissue culture as an alternative to field experiments [33,34]. This artificial setup offers advantages such as tight control of experimental conditions, and the ability to grow many plants in a limited space [35,36]. Therefore, most of the knowledge on stress physiology is based on the use of these types of artificial stress conditions [37,38].
In such studies, sucrose, mannitol, polyethylene glycol (PEG), or sorbitol have been used frequently to simulate drought stress, reducing the water potential in the plant medium to mimic soil drying [39]. These agents have no toxic effects on plants and their use is a standard procedure for screening drought-resistant clones [33,34]. The application of different concentrations of osmotic agents allows for the exploration of plant responses from mild to life-threatening stress.
The water deficit induced by mannitol or sucrose is analogous to drought conditions in the natural environment [38] and can be characterized by a decrease in soil water potential (Ψ). Values of Ψ from 0 to −0.3 MPa are typical for well-watered plants, whereas values below −0.4 MPa corresponds to moderate water stress, and values from −1.5 to −2.0 MPa represent severe stress and permanent loss of turgor in most plant species [40]. Water potentials below −2.0 MPa are likely to cause severe vascular embolism [41]. It should be noted, however, that these values vary depending on the species and drought model [42] and not only Ψ-decrease affects the plant, but also its duration affects the extent of damage [43].
In the present study, we selected three highly productive genotypes of R. pseudoacacia that we vegetatively propagated. We compared the effect of osmotic stress induced by mannitol and sucrose, which we used to mimic drought conditions, on two growth parameters, total shoot length and fresh weight, as well as mortality of R. pseudoacacia vegetative cuttings in the in vitro cultures. To evaluate the phenotypic response of the plants on stress, we exposed them to a range of water potentials (−0.0 MPa to −1.5 MPa) through the manipulation of the media. Specifically, the following factors were tested depending on the Robinia genotype: the dose-dependent and the time-dependent effects. In addition, we were also able to investigate the osmoticum-dependent effects on the plants. The aim of our study was to measure the variation in genotype response to a drought-induced event in order to gain a better understanding of behavioural patterns and to support the future selection of drought-resistant clones of R. pseudoacacia.

2. Materials and Methods

2.1. Plant Material and Experimental Design

Three genotypes of R. pseudoacacia characterized by desirable traits such as stem form (straightness), high productivity (well above the average for the region), and vigour [44], originating from forest stands in the Krosno Forest District of western Poland, were selected for the drought stress experiment (Table 1). All three genotypes of R. pseudoacacia were selected earlier as plus trees by the National Commission and phenotyped according to the National Standards for the Selection of Forest Trees. Plus trees are selected only in selected seed stands or at least in production seed stands of selected species where the species is dominant. The stands from which these tree genotypes originated (plus trees) have been naturalized in the Polish landscape for over 200 years making them a potentially ideal source of propagation material. These stands are used commercially in various forestry practices providing seeds for reforestation; breeding activities have also been carried out for the past 20 years.
Dormant axillary buds were collected in February from each of the three selected clones (4SO, 6SO, 10PT) and used for micropropagation. Initially, explants were cultured on Murashige and Skoog medium (MS) [45], supplemented with 2% sucrose, 0.4 mgL−1 of BAP (6-benzylaminopurine) and 0.1 mgL−1 of NAA (naphthalene-1-acetic) and mixed with 5 gL−1 agar, to solidify the media, the pH was adjusted to 5.8 in 8 cm jars according to Szyp-Borowska et al. [46]. Micropropagated plantlets (five in each jar) were grown at 25 °C day temperature and 20 °C night temperature under a 16-h-day and 8-h-night photoperiod. The photosynthetically active radiation (PhAR) light level was approximately 300–400 µmol m−2s−1, and the humidity was maintained at 70%.
After three subcultures, sufficient plant material (explants) was propagated from each of the three clones and the osmotic drought treatment was applied once shoots reached approximately 3 cm in height. Since there are no reports in the literature on the response of black locust to osmotic stress in vitro, we added two commonly used osmotic agents to the medium, i.e., sucrose and mannitol, to replicate the experimental conditions that are often used in studies with abiotic stress in vitro. Sucrose is accumulated in cells as an osmoprotectant during heat and drought stress [7,47]. In turn, mannitol can mimic drought stress conditions and is usually added to the media at concentrations ranging from 9 to 127 g, depending on the genotype of the plant under study [48]. To separate the osmotic effect of sugar in the medium from its role as a carbon source, we used both mannitol and sucrose in the following combinations: five explants from each clone were transferred to one of the seven treatments which induced osmotic potentials from 0.0 MPa (control) to −1.5 MPa, mimicking different intensities of drought stress conditions (Table 2). This water potential range also mirrors the viable soil water potential range for plants [36]. Each treatment (seven) included six replicate jars for a total of 210 explants per genotype and a total of 630 plants in the experiment. The cultures were maintained for eight weeks to investigate their growth potential and response to drought stress. To analyse growth parameters, total shoot length (TSL) and total fresh weight (FW) were measured for all plants in all treatments. These measurements were taken every two weeks from the beginning of the treatment. TSL (cm) was measured from the surface of the medium to the tip of the shoot using a ruler. During the same period, all plants were weighed separately to determine FW (g), before subculture to fresh medium. Mortality M (%) was estimated as the percent ratio of dead to live plants at a given time (i.e., weeks 2, 4, 6, and 8).

2.2. Statistical Analysis

To determine the influence of osmotic agents, and time of drought stress exposure on mortality (M) of the tested clones, we used a generalized linear model (Model 1) as follows:
g(µijk) = Ci + Oj + Tk + COij + CTik + OTjk
where g(μijk) is the log link function, μijk is the mean M for the ith clone (C) (i = 1, 2, 3) and jth osmoticum treatment (O) (j = 1, …, 7), ijlth jar in the kth week time point (k = 0, 2, 4, 6, 8), Ci is the main effect of the ith clone, Oj is the main effect of the jth osmoticum, Tk is the main effect of the jth time point (repeated measures effect), COij is the clone × osmoticum interaction effect, CTik is the clone × time interaction effect and OTjk is the osmoticum × time interaction effect. In Model 1 there is no third order interaction effect because the full model (with second and third-order interactions) did not converge.
In order to examine the impact of the above-mentioned effects on TSL and FW, we used a generalized linear model (Model 2) that includes a third-degree interaction effect as follows:
g(µijk) = Ci + Oj + Tk + COij + CTik + OTjk + COTijk
where g(μijk) is the identity link function, μijk is the mean TSL or mean FW for the ith clone (i = 1, 2, 3) and jth treatment (osmoticum) (j = 1, …, 7) for the ijmth plant in the kth week time point (k = 0, 2, 4, 6, 8), COTijk is the clone × osmoticum × time interaction effect and other effects are the same as in Model 1.
The analysis of a generalized linear repeated measures model, as in the case of this study (five time points every two weeks: 0, 2, 4, 6, 8), should consider the possible correlation of the data at the jar or plant level—cluster (in case of mortality—105 jars—clusters; in the case of TSL and FW—519 surviving plants—clusters). It was important to identify a specified structure in the data, and thus to fit an appropriate covariance matrix. This was possible by analysing the model using generalized estimation equations GEE methodology [49]. To identify robust GEE solutions for which the covariance model provides the best approximation for the purpose of evaluating model effects, we tested the following covariance structure matrices [50]: variance components (VC), compound symmetry (CS), autoregressive of first order (AR (1)), Toeplitz (Toep), and unstructured (UN). According to the GEE fit criteria (QIC criterion) [51] the best fitting model for M was the CS matrix, for TSL it was the UN matrix, while for FW the Toep matrix was best. For significant model effects, pairwise comparisons were made between least square means with Tukey’s posthoc test and the Tukey–Kramer correction for unequal sample sizes. All statistical analyses were performed using the GENMOD, GEE and MIXED procedures of SAS/STAT®® v. 14.3 (Cary, NC, US.: SAS Institute Inc., 2017).

3. Results

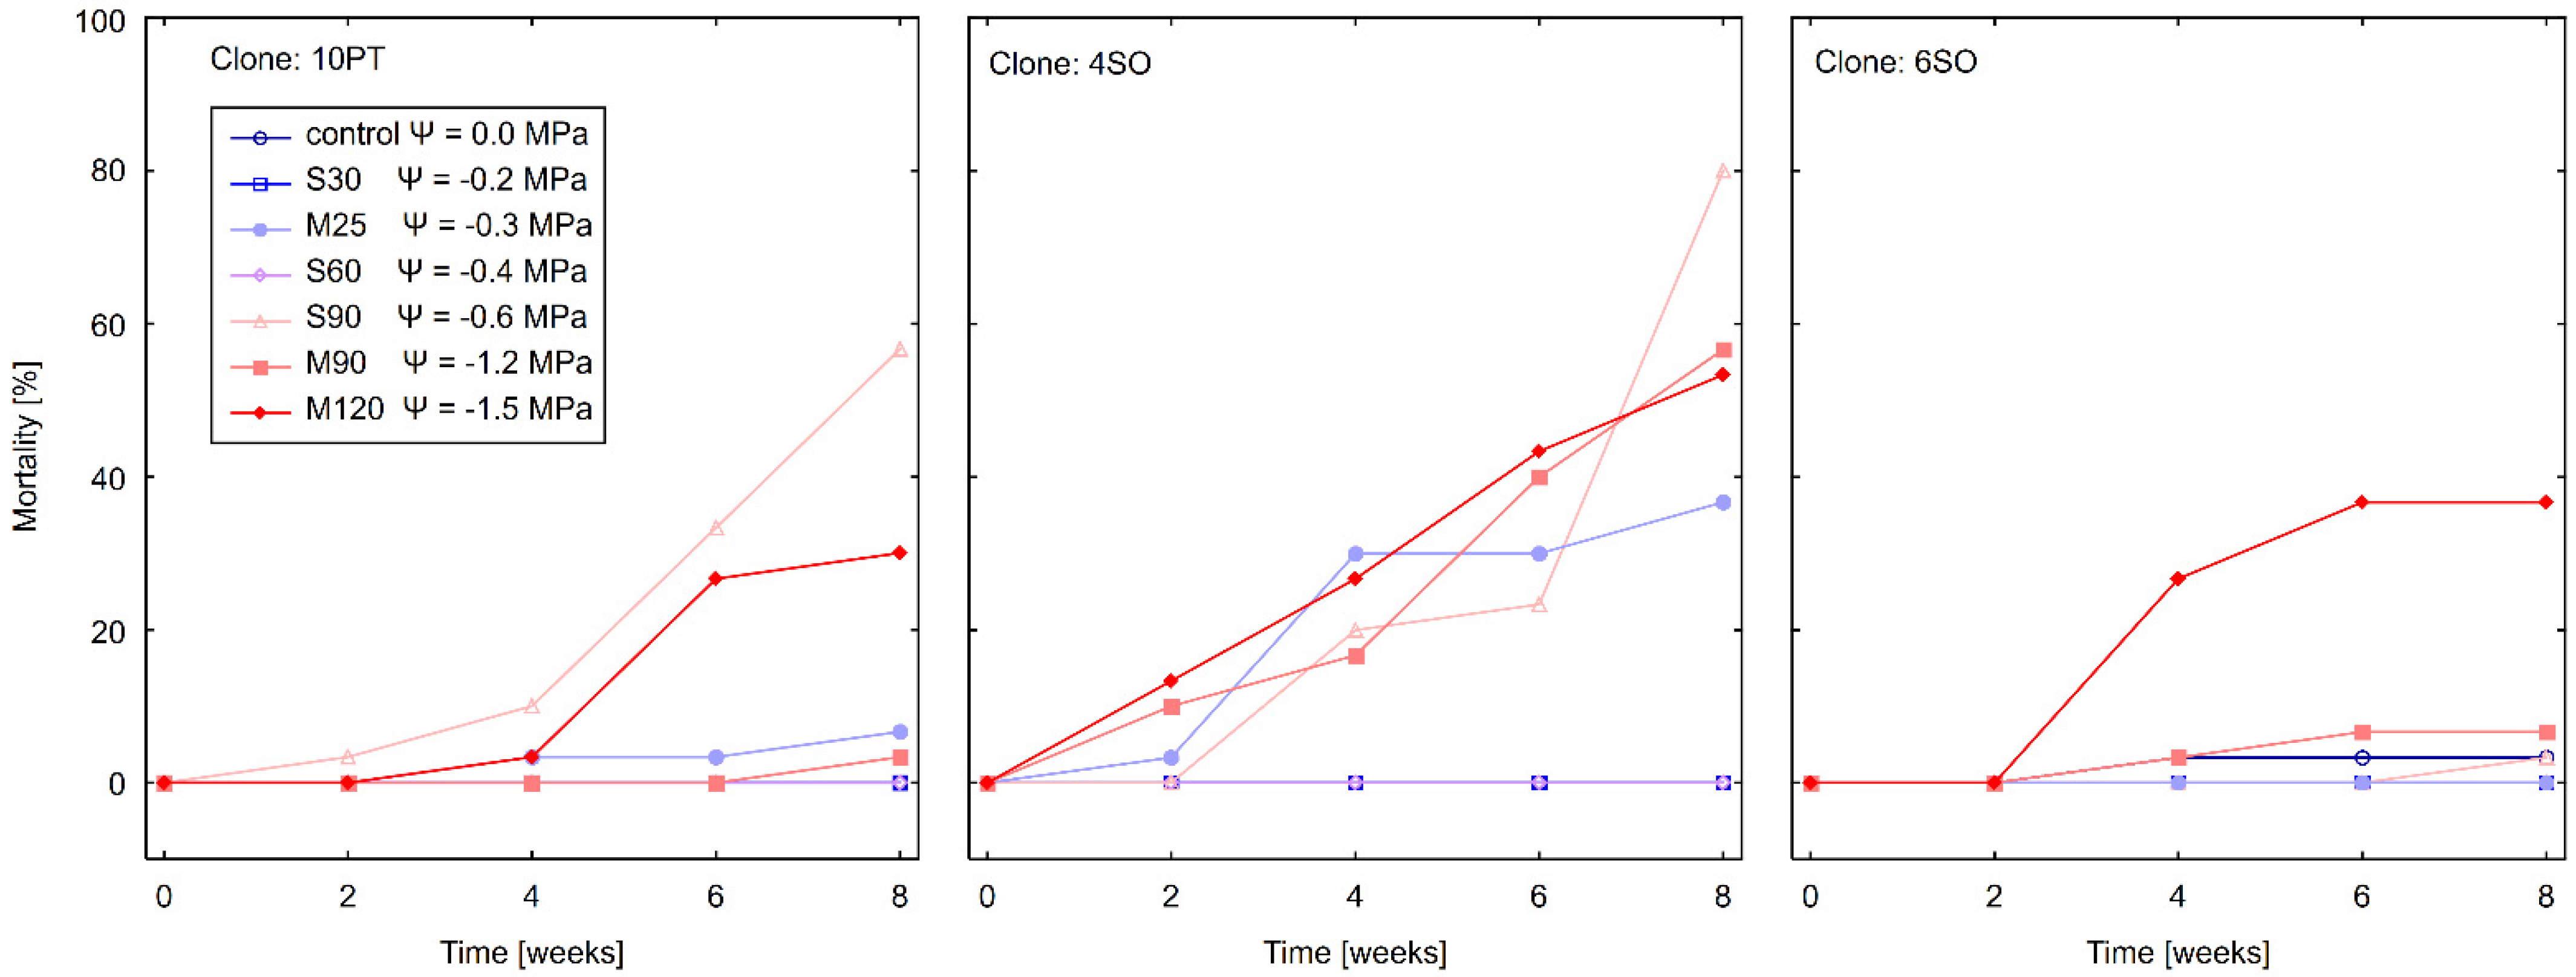
3.1. Effect of Water Stress on Mortality

All three R. pseudoacacia genotypes studied showed different behaviour in terms of mortality rate depending on the duration of drought stress, osmoticum type and its concentration (Table 3).
The highest mortality rate was observed for clone 4SO (Table 4), especially for the osmoticum below −0.6 MPa. After only four weeks of stress, the percentage of dead plants observed for this clone was 13%, i.e., ten times higher than for 10PT and almost three times higher than for 6SO (Table 5). After eight weeks, the mortality rate for 4SO was 37%, and 9% (10PT) and 7% (6SO) for the remaining clones. Clones 10PT and 6SO were less sensitive to the moderate osmotic potential and the mean rate of M was at the same level for both (Table 4). The highest mannitol concentration (120 gL−1) caused a plant mortality rate of 20% in 6SO and 12% in 10PT, which was also sensitive to the highest concentration of sucrose (S90). The mortality rate of these clones increased after six weeks of treatment and remained at this level until the end of the eight-week experiment (Table 5).
There was a significant genotype by osmoticum interaction across the seven treatments (Table 4, Figure 1). Plant mortality did not occur with the application of S60, regardless of genotype and treatment duration (Table 6). The deleterious effect of the sucrose dose was observed only for the highest concentration of this osmotic agent (S90, which corresponded to −0.6 MPa), by week four. In contrast, mannitol caused mortality in plants regardless of its concentration in the medium, or treatment duration (Table 5), with mortality increasing with increasing concentration from M25 to M120 and after the first four weeks of treatment, even at the lowest (M25, −0.3 MPa) concentration of this osmotic agent in 4SO and 10PT genotypes. The interaction effects on the mortality of the clones, relative to both the osmoticum concentration and time, are presented in Figure 1.

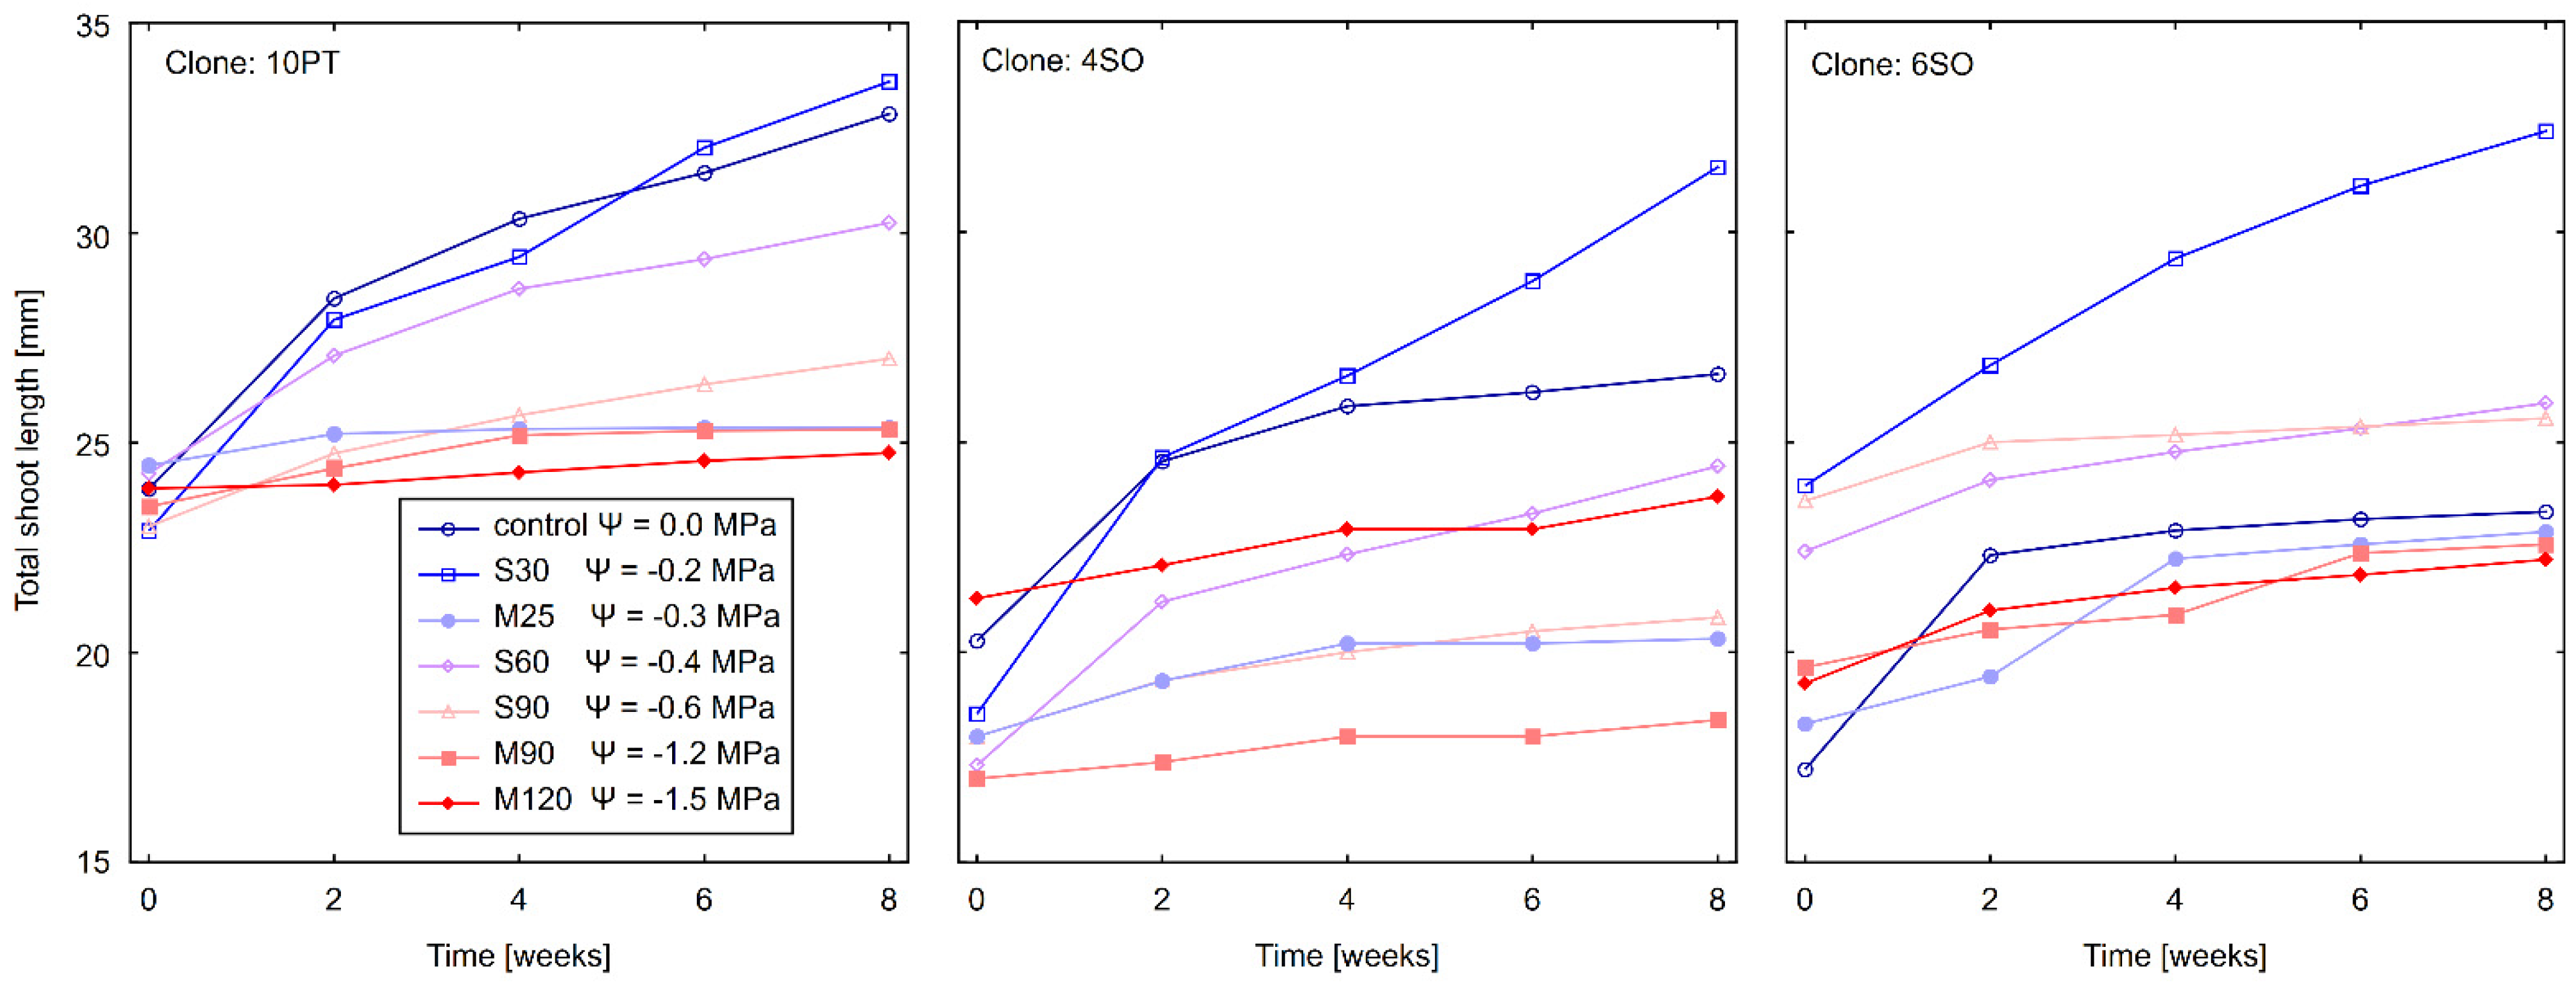
3.2. Effect of Drought Stress on Total Shoot Length (TSL)

After eight weeks of growth on the different media, TSL varied significantly for all terms in the model except for the clone × time interaction effect (Table 7).
The longest absolute TSL was recorded for the 10PT clone (2.66 cm), followed by 6SO (2.34 cm) and finally 4SO (2.17cm) (Table 8). However, the largest relative TSL increment under stress conditions was observed with the 6SO clone (Figure 2; Tables S1–S3 Supplementary). This clone maintained its growth even under the lowest water potentials in the medium, increasing its TSL by 13% compared with the initial TSL in M120 and M90 media, while growth was most inhibited in S90, increasing by only 8% of the initial TSL. The TSL increment in the control medium was 26% for 6SO. In contrast to 6SO, the 10PT clone was much more sensitive to drought during the eight-week stress exposure and a significant reduction in TSL growth was observed in this clone. The TSL increment was only 3% in M120, 7% in M90 and 4% in the M25 osmoticum compared with the initial TSL. In turn, sucrose S90 in the 10PT clone did not cause such an inhibitory effect as observed in the 6SO clone. The TSL increment in the control medium for 10PT during the eight-week experiment was 27% longer compared with the initial TSL and was slightly shorter than in the S30 treatment (TSL increment by 32%). The 4SO clone was characterized by an intermediate response to the stress condition compared to 6SO and 10PT. InterestingLy, the TSL increment for the 4SO clone in S30 osmoticum was almost twice as long (41%) compared to the control (24%) during the eight-week experiment. This TSL increase is generally consistent with the overall results for the drought-induced agents (Table 8). The TSL increment of all clones was supported by the supply of sucrose in the media at a concentration of 30 gL−1. The TSL of all clones in S30 was significantly greater (p < 0.05) than that of all other osmoticum and control treatments. In contrast, mannitol caused a significant inhibitory effect on the TSL in all clones (p < 0.05). The TSL was less in all clones, which became evident by week four when growth was significantly suppressed for all mannitol treatments (Table 9, Figure 2).

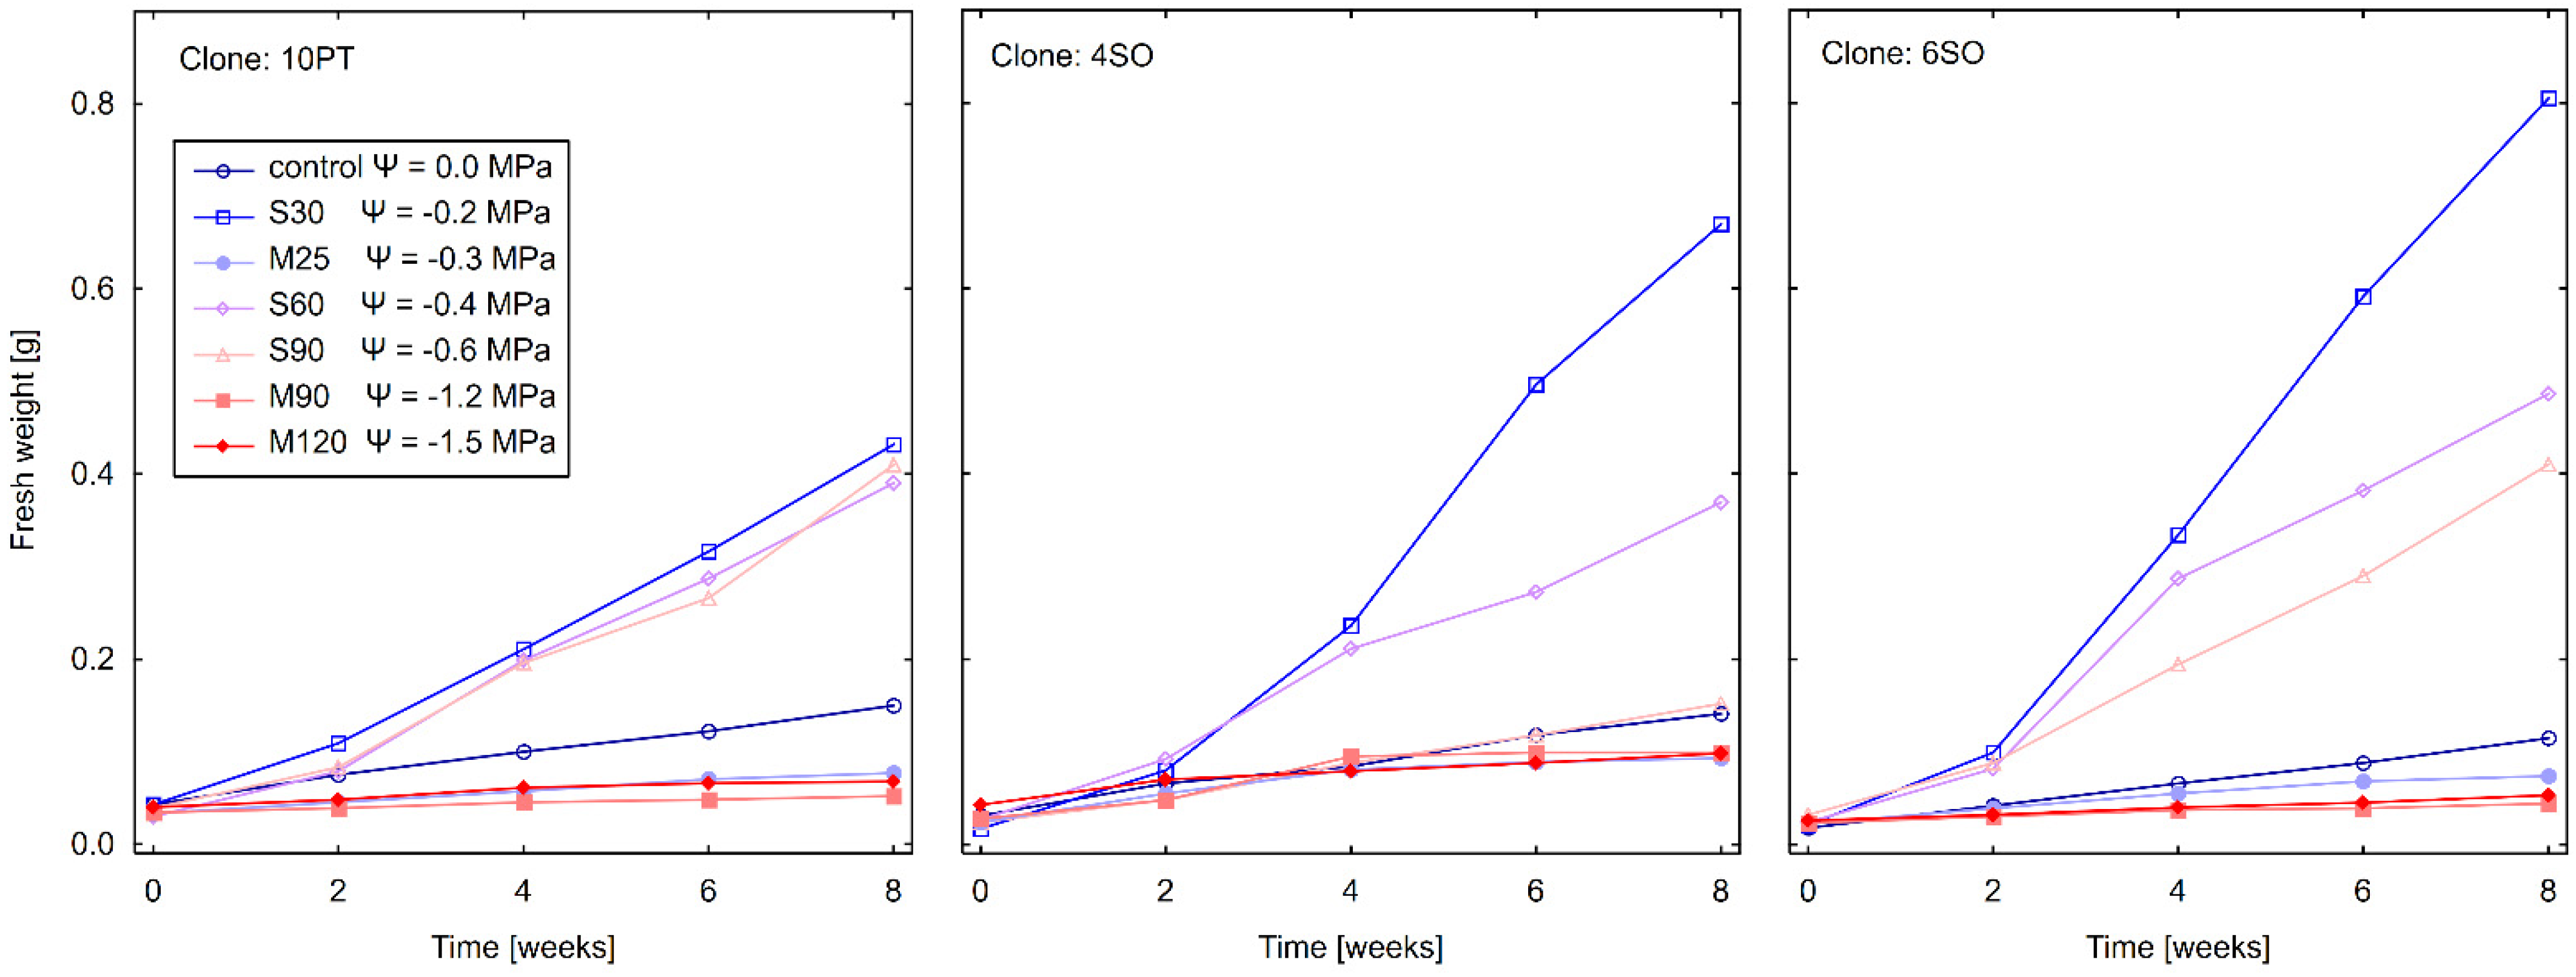
3.3. Effect of Drought Stress on Total Fresh Weight (FW)

Based on the model used to analyse the total fresh weight, all effects were significant except for the clone (Table 7). During the eight-week experiment clones almost doubled their fresh weight but the FW increment was osmoticum dependent. The most significant increase in FW was recorded for sucrose osmoticum, in particular, the concentration of 30 gL−1 produced the highest results of FW, which was particularly evident for 4SO and 6SO clones (Table 10).
Significant differences were observed in FW between the treatments and duration of drought stress exposure (Table 11). The FW was lowest for mannitol regardless of its dose and treatment duration, while the effect of sucrose on FW changed over time, reflecting variations in the dose effect. After two weeks, there was a significant increase in FW for S30 compared to control and mannitol treatments. At four weeks, there was a significantly lower increase in FW for S90 compared to S30 and S60. After week six, the lowest FW was measured for S90, higher for S60 and the highest for S30. See Figure 3 and Tables S4–S6 in Supplementary Materials for a fuller depiction of the interaction effects of clone, time and osmoticum treatment on FW.

4. Discussion

Increased drought stress tolerance of forest trees will be a key feature in maintaining functional forest cover in the face of climate change. When breeding for drought resistance, morphological traits, such as growth, yield, mortality, and physiological traits, including water use efficiency (WUE), stomatal conductance, cavitation of conductive tissue, photosynthetic ability, leaf wilting, leaf water potential, and osmotic regulation, can be used as target traits for selection. However, most of these traits require considerable effort and time to measure and are thus less suitable for large-scale screening in breeding programs [52]. Although in vitro experimental setups are inherently imperfect [1,36], it allows for tight control over imposed stress levels induced by different osmotic agents, such as sucrose and mannitol, and their concentration in the media. In our preliminary study, despite all three genotypes having been selected for fast growth and straight form, the R. pseudoacacia explants showed clone-dependent responses to stress conditions for all traits studied. These results indicate that it is possible to both maintain tree productivity and survivability under stress conditions and that these results are clone dependent for the measured traits including mortality, TSL and FW.
As described earlier, R. pseudoacacia is considered in many studies to be an anisohydric (drought tolerant) species [31,32] with a more variable Ψ-leaf, maintaining open stomata and high photosynthetic rates for extended periods of time, even when leaf water potential declines [3]. This risk-taking behaviour can be beneficial when water is abundant, even under mild to moderately stressful conditions, which in our experiment corresponded to water potentials between −0.2 MPa and −0.4 MPa. However, under more intense drought conditions, of −0.4 MPa to −1.5 MPa, this behaviour can threaten the survival of R. pseudoacacia clones, exceeding the species’ physiological range of tolerance. Under the lowest water potential (−1.5 MPa), mortality was observed in all studied clones, although tolerance to stress varied widely among the three clones. In fact, clone 6SO showed little mortality until exposed to the most severe stress conditions −1.5 MPa), whereas clone 4SO was far less tolerant to stress with mortality occurring at only −0.3 MPa.
McDowell et al. [53] showed that isohydric species are more likely to die during prolonged droughts of moderate intensity, while anisohydric trees such as R. pseudoacacia are more likely to die during intense, even short, droughts. In our study R. pseudoacacia clones showed considerable variation in their response to drought and its duration. The 6SO clone was characterized by maintaining the highest survival rate among the clones tested throughout the experimental period and the occurrence of mortality was noted only under the most severe drought stress conditions beginning in the fourth week, while the 4SO suffered drought-induced death as early as the second week under mild to moderate drought. Although we did not consider stomatal conductance and xylem cavitation in our study, the varied mortality and growth responses to drought of the clones studied in our experiment support the hypothesis that genotypes rather than species should be considered with respect to specific physiological strategies.
Further consideration should be given to the cause of the drought-induced mortality, which may have been caused by either hydraulic failure and/or carbon starvation [54]. Reduced soil water content or increased transpiration rate can impede water transport causing cavitation of the xylem vessels (filling with air), which stops water flow and leads to dehydration. Hydraulic failure is particularly likely to occur during intense drought, while carbon starvation is a relatively slow process and may occur during the later stages of prolonged drought [53]. Carbon starvation occurs when stomata close to prevent hydraulic failure. This process reduces carbon uptake through photosynthesis and starves the plant due to continuous metabolic carbohydrate demand. The results of the study by Dai et al. [27] indeed confirm the possible cause of the combination of hydraulic failure and carbon starvation for the drought-induced mortality of R. pseudoacacia saplings. Although we should be cautious about the results of our study in this context, considering that all plantlets had a constant supply of carbon from the medium during the drought-induced experiment, our results suggest that hydraulic failure rather than carbon starvation is the main driver for the drought-induced mortality observed.
By exposing the R. pseudoacacia clones in our study to a wide range of water potentials, some of which were not immediately life-threatening but negatively affected growth and productivity [4], it was possible to identify patterns in growth traits under stress conditions. Shoot growth is the most important and visible trait and is a very sensitive indicator of stress [16,39]. Many studies have attempted to determine the threshold water potential that suppresses plant growth [55,56,57]. For woody plants, a soil water potential threshold below −0.3 MPa can be expected to inhibit plant growth [57]. Ridolfi and Dreyer [58] found a drought threshold of −0.6 MPa for Populus × canadensis ‘Robusta’. This negative plant response threshold can be used as a guide for selecting tolerant genotypes, below which fast-growing trees lose their advantage. Our study showed that intense drought indeed triggered a rapid inhibition of shoot length growth, while under mild stress (−0.2 MPa) all clones studied achieved greater TSL versus the control treatment, indicating an increase in water use efficiency under mild stress or an effect of the specific osmotic agent (sucrose) discussed below. Importantly, the responses of the three black locust clones studied were nuanced and depended on the clone (genotype), the type of osmotic agent, and its concentration, combined with the exposure time under stress conditions. The 4SO clone was the most drought sensitive among the clones studied. It was characterized by the lowest TSL increment and the highest mortality rate under moderate stress conditions (80% at week eight at a water potential of −0.6 MPa). The 10PT clone was characterized by an intermediate response to stress-induced conditions. Clone 10PT showed stable growth at a water potential of −0.6 MPa; however, mortality reached 57% after eight weeks under moderate stress conditions (at a water potential of −0.6 MPa). The highest drought resistance among the clones studied was shown by clone 6SO, which not only achieved the greatest TSL during eight weeks of drought, but also had the lowest mortality (3% at a water potential of −0.6 MPa).
The three clones also responded differently to the osmoticum and its concentration. In general, mannitol had a stronger inhibitory effect on TSL and FW increment on the black locust clones compared with sucrose. Our experiment showed that the TSL and FW increment was suppressed immediately after exposure to mannitol, regardless of its concentration in the medium (120, 90 and 25 gL−1). In the case of mannitol exposure, our results are consistent with the findings of Claeys et al. [36], who indicated that plant growth is extremely sensitive to mannitol and that growth rates decreased rapidly when plants are exposed to even low concentrations.
In the present study, mannitol not only suppressed plant growth but was also responsible for the sharp increase in mortality of R. pseudoacacia clones, confirming that sucrose and mannitol play different roles in plant metabolism [59]. Mannitol, added to a nutrient solution, mimics a drought-stress condition and does not produce phytotoxic effects. Unlike mannitol, sucrose can be taken up and metabolized by the plant. At low concentrations (2% and 4%), sucrose is necessary for optimal growth and reproduction [60,61] and can increase dry weights [62]. All growth media used in our experiment contained 2% (w/v) sucrose. However, sucrose is known to increase stress tolerance and affect ABA signal transduction [63] and, therefore, may counteract the negative effects of oxidative stress on photosynthesis that can potentially limit growth [64]. The fact that we observed growth inhibition at low-stress levels with sucrose-containing media (S90), fits with the common view that stress-induced growth inhibition is an active process that is not dependent on carbon restriction, as was the case in our experimental conditions, where sucrose acted as a carbon source in the plant medium, significantly promoting the growth of clones in in vitro culture at a concentration of 30 gL−1 (S30). However, further increasing the sucrose supply reduced the water potential in the leaves in a dose-dependent manner in the leaf tissue. A concentration of 90 gL−1 (S90~−0.6 MPa) caused a negative effect, as evidenced by significantly lower TSL and FW growth compared to the S30 treatment, while significantly increasing tree mortality. The results obtained are consistent with the previous findings of Hoekstra et al. [65], who showed that prolonged heat and drought stress leads to a progressive accumulation of sucrose, a high concentration of which reduced the growth rate in the plants. In this context, our results showed different metabolic pathways for sucrose, depending on the concentration of sucrose in the medium, and generally different responses to the osmoticum treatments and the overall concentrations among the three clones tested, with clone 6SO being the most tolerant to drought stress, regardless of osmoticum or concentration.
As our preliminary screening showed, the relationship between productivity and drought response cannot be generalized within a species because trees of the same species can have different water conservation strategies [66]. Desirable clones for short-rotation forestry should combine increased productivity and drought stress tolerance. A full understanding of the relationship between drought response traits would be invaluable for predicting how tree species and genotypes within species will respond to future droughts. This knowledge could be used to develop tools for phenotyping in tree breeding aimed at improving drought resistance.

5. Conclusions

Our in vitro experiment, in which we used a wide range of water potentials, allowed for the rapid screening of three R. pseudoacacia clones under mild to life-threatening drought stress conditions. Our study revealed genotype-specific responses to induced drought stress, indicating the potential for tree improvement programs to select on both productivity and stress tolerance, which is particularly important in light of climate change with more frequent drought events. Considering that all plantlets were constantly supplied with carbon from the media, during the drought-induced experiment, our results suggest that hydraulic failure rather than carbon starvation may be the main driver for the drought-induced mortality. Furthermore, our results showed both different metabolic pathways of sucrose depending on its concentration in the medium and generally different responses to osmoticum (mannitol vs. sucrose). Nevertheless, we believe that for large-scale breeding programs designed to select for drought-tolerant genotypes, the use of culture media containing 90 gL−1 mannitol or 90 gL−1 sucrose at an early selection stage should provide early screening results. The first reliable plant responses to stress can be observed within four weeks of treatment application and exposure.
Yet, it is important to note that while in vitro screening provides precise control of stress conditions, it does not reflect the full complexity of environmental conditions affecting tree growth and survival. Therefore, we think that the potential applicability of the in vitro rapid screening method in tree improvement programs should be further confirmed by testing under field conditions, preferably at multiple test sites, to evaluate genotype-by-environment interactions and assess the long-term impact of utilizing this early selection strategy.

Supplementary Materials

The following are available online at https://www.mdpi.com/article/10.3390/f13121979/s1, Table S1. Total shoot length means TSL (cm) of 10PT clone of R. pseudoacacia in different osmotic treatments measured after 0, 2, 4, 6, and 8 weeks of drought stress exposition. Different treatments are denoted: “control”—medium without osmoticum, “S30”—medium with 30 gL−1 of sucrose, “S60”—medium with 60 gL−1 of sucrose, “S90”—medium with 900 gL−1 of sucrose, “M25”—medium with 25 gL−1 of mannitol, “M90” medium with 90 gL−1 of mannitol, “M120” medium with 120 gL−1 of mannitol. Effect of Clone × Osmoticum × Time. Table S2. Total shoot length means TSL (cm) of 4SO clone of R. pseudoacacia in different osmotic treatments measured after 0, 2, 4, 6, and 8 weeks of drought stress exposition. Different treatments are denoted: “control”—medium without osmoticum, “S30”—medium with 30 gL−1 of sucrose, “S60”—medium with 60 gL−1 of sucrose, “S90”—medium with 900 gL−1 of sucrose, “M25”—medium with 25 gL−1 of mannitol, “M90” medium with 90 gL−1 of mannitol, “M120” medium with 120 gL−1 of mannitol. Effect of Clone × Osmoticum × Time. Table S3. Total shoot length means TSL (cm) of 6SO clone of R. pseudoacacia in different osmotic treatments measured after 0, 2, 4, 6, and 8 weeks of drought stress exposition. Different treatments are denoted: “control”—medium without osmoticum, “S30”—medium with 30 gL−1 of sucrose, “S60”—medium with 60 gL−1 of sucrose, “S90”—medium with 900 gL−1 of sucrose, “M25”—medium with 25 gL−1 of mannitol, “M90” medium with 90 gL−1 of mannitol, “M120” medium with 120 gL−1 of mannitol. Effect of Clone × Osmoticum × Time. Table S4. Fresh weight (FW) (g) of R. pseudoacacia clone (10PT) for different treatments measured after 0, 2, 4, 6, and 8 weeks of drought stress exposition. Different treatments are denoted: “control”—medium without osmoticum, “S30”—medium with 30 gL−1 of sucrose, “S60”—medium with 60 gL−1 of sucrose, “S90”—medium with 90 gL−1 of sucrose, “M25”—medium with 25 gL−1 of mannitol, “M90” medium with 90 gL−1 of mannitol, “M120” medium with 120 gL−1 of mannitol. Effect of Clone × Osmoticum × Time. Table S5. Fresh weight (FW) (g) of R. pseudoacacia clone (4SO) for different treatments measured after 0, 2, 4, 6, and 8 weeks of drought stress exposition. Different treatments are denoted: “control”—medium without osmoticum, “S30”—medium with 30 gL−1 of sucrose, “S60”—medium with 60 gL−1 of sucrose, “S90”—medium with 90 gL−1 of sucrose, “M25”—medium with 25 gL−1 of mannitol, “M90” medium with 90 gL−1 of mannitol, “M120” medium with 120 gL−1 of mannitol. Effect of Clone × Osmoticum × Time. Table S6. Fresh weight (FW) (g) of R. pseudoacacia clone (6SO) for different treatments measured after 0, 2, 4, 6, and 8 weeks of drought stress exposition. Different treatments are denoted: “control”—medium without osmoticum, “S30”—medium with 30 gL−1 of sucrose, “S60”—medium with 60 gL−1 of sucrose, “S90”—medium with 90 gL−1 of sucrose, “M25”—medium with 25 gL−1 of mannitol, “M90” medium with 90 gL−1 of mannitol, “M120” medium with 120 gL−1 of mannitol. Effect of Clone × Osmoticum × Time.

Author Contributions

Conceptualization, I.S.-B.; Data curation, I.S.-B. and J.U.; Formal analysis, J.U.; Funding acquisition, T.W. and M.N.; Investigation, I.S.-B.; Methodology, I.S.-B. and J.U.; Project administration, T.W. and I.S.-B.; Supervision, M.N. and J.U., Visualization, M.N., I.S.-B. and J.U.; Writing—original draft, I.S.-B., M.N. and J.U.; Writing—review and editing, all the authors (I.S.-B., J.U., M.N., T.W. and B.R.T.) All authors have read and agreed to the published version of the manuscript.

Funding

This research was funded by the State Forests National Forest Holding (Poland), grant numbers 240234 and 500468. This manuscript was developed under a scholarship grant to Marzena Niemczyk within a Scholarship Fund of the Forest Research Institute, pursuant to the decision of the Head of the Institute dated 14 April 2022 (based on an agreement concluded on 14 April 2022). May 2018.

Data Availability Statement

Not applicable.

Conflicts of Interest

The authors declare no conflict of interest. The funders had no role in the design of the study; in the collection, analyses, or interpretation of data; in the writing of the manuscript, or in the decision to publish the results.

References

  1. Li, Q.; Zhao, M.; Wang, N.; Liu, S.; Wang, J.; Zhang, W.; Yang, N.; Fan, P.; Wang, R.; Wang, H.; et al. Water use strategies and drought intensity define the relative contributions of hydraulic failure and carbohydrate depletion during seedling mortality. Plant Physiol. Biochem. 2020, 153, 106–118. [Google Scholar] [CrossRef]
  2. Choat, B.; Jansen, S.; Brodribb, T.J.; Cochard, H.; Delzon, S.; Bhaskar, R.; Bucci, S.J.; Feild, T.S.; Gleason, S.M.; Hacke, U.G.; et al. Global convergence in the vulnerability of forests to drought. Nature 2012, 491, 752–755. [Google Scholar] [CrossRef] [PubMed] [Green Version]
  3. Williams, A.P.; Allen, C.D.; Millar, C.I.; Swetnam, T.W.; Michaelsen, J.; Still, C.J.; Leavitt, S.W. Forest responses to increasing aridity and warmth in the southwestern United States. Proc. Natl. Acad. Sci. USA 2010, 107, 21289–21294. [Google Scholar] [CrossRef] [Green Version]
  4. Hartmann, H.; Moura, C.F.; Anderegg, W.R.L.; Ruehr, N.K.; Salmon, Y.; Allen, C.D.; Arndt, S.K.; Breshears, D.D.; Davi, H.; Galbraith, D.; et al. Research frontiers for improving our understanding of drought-induced tree and forest mortality. New Phytol. 2018, 218, 15–28. [Google Scholar] [CrossRef] [PubMed] [Green Version]
  5. Horton, R.M.; Mankin, J.S.; Lesk, C.; Coffel, E.; Raymond, C. A Review of Recent Advances in Research on Extreme Heat Events. Curr. Clim. Chang. Rep. 2016, 2, 242–259. [Google Scholar] [CrossRef] [Green Version]
  6. Crouchet, S.E.; Jensen, J.; Schwartz, B.F.; Schwinning, S. Tree Mortality After a Hot Drought: Distinguishing Density-Dependent and -Independent Drivers and Why It Matters. Front. For. Glob. Chang. 2019, 2, 1–14. [Google Scholar] [CrossRef] [Green Version]
  7. Rizhsky, L.; Liang, H.; Shuman, J.; Shulaev, V.; Davletova, S.; Mittler, R. When defense pathways collide. The response of arabidopsis to a combination of drought and heat stress. Plant Physiol. 2004, 134, 1683–1696. [Google Scholar] [CrossRef] [Green Version]
  8. Zhao, M.; Running, S.W. Drought-Induced Reduction in Global Terrestrial Net Primary Production from 2000 Through 2009. Science 2010, 329, 940–943. [Google Scholar] [CrossRef] [PubMed] [Green Version]
  9. Dyderski, M.K.; Paź, S.; Frelich, L.E.; Jagodziński, A.M. How much does climate change threaten European forest tree species distributions? Glob. Chang. Biol. 2018, 24, 1150–1163. [Google Scholar] [CrossRef] [PubMed]
  10. Lindner, M.; Maroschek, M.; Netherer, S.; Kremer, A.; Barbati, A.; Garcia-Gonzalo, J.; Seidl, R.; Delzon, S.; Corona, P.; Kolström, M.; et al. Climate change impacts, adaptive capacity, and vulnerability of European forest ecosystems. For. Ecol. Manag. 2010, 259, 698–709. [Google Scholar] [CrossRef]
  11. Robakowski, P.; Wyka, T.P.; Kowalkowski, W.; Barzdajn, W.; Pers-Kamczyc, E.; Jankowski, A.; Politycka, B. Practical implications of different phenotypic and molecular responses of evergreen conifer and broadleaf deciduous forest tree species to regulated water deficit in a container nursery. Forests 2020, 11, 1011. [Google Scholar] [CrossRef]
  12. Reddy, A.R.; Chaitanya, K.V.; Vivekanandan, M. Drought-induced responses of photosynthesis and antioxidant metabolism in higher plants. J. Plant Physiol. 2004, 161, 1189–1202. [Google Scholar] [CrossRef]
  13. Kramer, P.J. Fifty Years of Progress in Water Relations Research. Plant Physiol. 1974, 54, 463–471. [Google Scholar] [CrossRef] [PubMed]
  14. Aliche, E.B.; Theeuwen, T.P.J.M.; Oortwijn, M.; Visser, R.G.F.; van der Linden, C.G. Carbon partitioning mechanisms in POTATO under drought stress. Plant Physiol. Biochem. 2020, 146, 211–219. [Google Scholar] [CrossRef] [PubMed]
  15. Sanders, G.J.; Arndt, S.K. Osmotic adjustment under drought conditions. In Plant Responses to Drought Stress; Springer: Berlin/Heidelberg, Germany, 2012; pp. 199–229. [Google Scholar] [CrossRef]
  16. Hsiao, T.C. Plant Responses to Water Stress. Annu. Rev. Plant Physiol. 1973, 24, 519–570. [Google Scholar] [CrossRef]
  17. Sade, N.; Gebremedhin, A.; Moshelion, M. Risk-taking plants: Anisohydric behavior as a stress-resistance trait. Plant Signal. Behav. 2012, 7, 767–770. [Google Scholar] [CrossRef] [Green Version]
  18. Hochberg, U.; Rockwell, F.E.; Holbrook, N.M.; Cochard, H. Iso/Anisohydry: A Plant–Environment Interaction Rather Than a Simple Hydraulic Trait. Trends Plant Sci. 2018, 23, 112–120. [Google Scholar] [CrossRef] [PubMed]
  19. Klein, T. The variability of stomatal sensitivity to leaf water potential across tree species indicates a continuum between isohydric and anisohydric behaviours. Funct. Ecol. 2014, 28, 1313–1320. [Google Scholar] [CrossRef]
  20. Martínez-Vilalta, J.; Poyatos, R.; Aguadé, D.; Retana, J.; Mencuccini, M. A new look at water transport regulation in plants. New Phytol. 2014, 204, 105–115. [Google Scholar] [CrossRef]
  21. Engelbrecht, B.M.J.; Comita, L.S.; Condit, R.; Kursar, T.A.; Tyree, M.T.; Turner, B.L.; Hubbell, S.P. Drought sensitivity shapes species distribution patterns in tropical forests. Nature 2007, 447, 80–82. [Google Scholar] [CrossRef]
  22. Puchałka, R.; Dyderski, M.K.; Vítková, M.; Sádlo, J.; Klisz, M.; Netsvetov, M.; Prokopuk, Y.; Matisons, R.; Mionskowski, M.; Wojda, T.; et al. Black locust (Robinia pseudoacacia L.) range contraction and expansion in Europe under changing climate. Glob. Chang. Biol. 2021, 27, 1587–1600. [Google Scholar] [CrossRef] [PubMed]
  23. Klisz, M.; Puchałka, R.; Netsvetov, M.; Prokopuk, Y.; Vítková, M.; Sádlo, J.; Matisons, R.; Mionskowski, M.; Chakraborty, D.; Olszewski, P.; et al. Variability in climate-growth reaction of Robinia pseudoacacia in Eastern Europe indicates potential for acclimatisation to future climate. For. Ecol. Manag. 2021, 492, 119194. [Google Scholar] [CrossRef]
  24. Nicolescu, V.N.; Rédei, K.; Mason, W.L.; Vor, T.; Pöetzelsberger, E.; Bastien, J.C.; Brus, R.; Benčať, T.; Đodan, M.; Cvjetkovic, B.; et al. Ecology, growth and management of black locust (Robinia pseudoacacia L.), a non-native species integrated into European forests. J. For. Res. 2020, 31, 1081–1101. [Google Scholar] [CrossRef] [Green Version]
  25. Vítková, M.; Sádlo, J.; Roleček, J.; Petřík, P.; Sitzia, T.; Müllerová, J.; Pyšek, P. Robinia pseudoacacia-dominated vegetation types of Southern Europe: Species composition, history, distribution and management. Sci. Total Environ. 2020, 707, 134857. [Google Scholar] [CrossRef]
  26. Vítková, M.; Müllerová, J.; Sádlo, J.; Pergl, J.; Pyšek, P. Black locust (Robinia pseudoacacia) beloved and despised: A story of an invasive tree in Central Europe. For. Ecol. Manag. 2017, 384, 287–302. [Google Scholar] [CrossRef] [PubMed]
  27. Dai, Y.; Wang, L.; Wan, X. Relative contributions of hydraulic dysfunction and carbohydrate depletion during tree mortality caused by drought. AoB Plants 2018, 10, plx069. [Google Scholar] [CrossRef] [PubMed]
  28. Polle, A.; Chen, S.L.; Eckert, C.; Harfouche, A. Engineering drought resistance in forest trees. Front. Plant Sci. 2019, 9, 1875. [Google Scholar] [CrossRef] [PubMed] [Green Version]
  29. Mantovani, D.; Veste, M.; Freese, D. Black locust (Robinia pseudoacacia L.) ecophysiological and morphological adaptations to drought and their consequence on biomass production and water-use efficiency. N. Z. J. For. Sci. 2014, 44, 1–11. [Google Scholar] [CrossRef] [Green Version]
  30. Grünewald, H.; Böhm, C.; Quinkenstein, A.; Grundmann, P.; Eberts, J.; von Wühlisch, G. Robinia pseudoacacia L.: A lesser known tree species for biomass production. Bioenergy Res. 2009, 2, 123–133. [Google Scholar] [CrossRef]
  31. Inman-Bamber, N.G.; Smith, D.M. Water relations in sugarcane and response to water deficits. Field Crops Res. 2005, 92, 185–202. [Google Scholar] [CrossRef]
  32. Pimentel, D.; Berger, B.; Filiberto, D.; Newton, M.; Wolfe, B.; Karabinakis, E.; Clark, S.; Poon, E.; Abbett, E.; Nandagopal, S. Water resources: Agricultural and environmental issues. Food Energy Soc. Third Ed. 2007, 54, 183–200. [Google Scholar] [CrossRef]
  33. Demeter, Z.; Kanalas, P.; Máthé, C.; Cseke, K.; Szollosi, E.; M-Hamvas, M.; Jámbrik, K.; Kiss, Z.; Mészáros, I. Osmotic stress responses of individual white oak (Quercus section, Quercus subgenus) genotypes cultured in vitro. J. Plant Physiol. 2014, 171, 16–24. [Google Scholar] [CrossRef] [PubMed] [Green Version]
  34. Kovalikova, Z.; Jiroutova, P.; Toman, J.; Dobrovolna, D.; Drbohlavova, L. Physiological Responses of Apple and Cherry In Vitro Culture under Different Levels of Drought Stress. Agronomy 2020, 10, 1689. [Google Scholar] [CrossRef]
  35. Lawlor, D.W. Genetic engineering to improve plant performance under drought: Physiological evaluation of achievements, limitations, and possibilities. J. Exp. Bot. 2013, 64, 83–108. [Google Scholar] [CrossRef] [Green Version]
  36. Claeys, H.; Van Landeghem, S.; Dubois, M.; Maleux, K.; Inzé, D. What Is Stress? Dose-response effects in commonly used in vitro stress assays. Plant Physiol. 2014, 165, 519–527. [Google Scholar] [CrossRef] [PubMed] [Green Version]
  37. Gill, S.S.; Tuteja, N. Polyamines and abiotic stress tolerance in plants. Plant Signal. Behav. 2010, 5, 26–33. [Google Scholar] [CrossRef] [Green Version]
  38. Deikman, J.; Petracek, M.; Heard, J.E. Drought tolerance through biotechnology: Improving translation from the laboratory to farmers’ fields. Curr. Opin. Biotechnol. 2012, 23, 243–250. [Google Scholar] [CrossRef]
  39. Verslues, P.E.; Agarwal, M.; Katiyar-Agarwal, S.; Zhu, J.; Zhu, J.-K. Methods and concepts in quantifying resistance to drought, salt and freezing, abiotic stresses that affect plant water status. Plant J. 2006, 45, 523–539. [Google Scholar] [CrossRef] [PubMed]
  40. Osmolovskaya, N.; Shumilina, J.; Kim, A.; Didio, A.; Grishina, T.; Bilova, T.; Keltsieva, O.A.; Zhukov, V.; Tikhonovich, I.; Tarakhovskaya, E.; et al. Methodology of drought stress research: Experimental setup and physiological characterization. Int. J. Mol. Sci. 2018, 19, 4089. [Google Scholar] [CrossRef] [PubMed]
  41. Taiz, L.; Zeiger, E.O. Plant Physiology, 3rd ed.; Sinauer Associates Incorporated: Franklin County, MA, USA, 2003; Volume 91, p. 750. [Google Scholar] [CrossRef] [Green Version]
  42. Haswell, E.S.; Verslues, P.E. The ongoing search for the molecular basis of plant osmosensing. J. Gen. Physiol. 2015, 145, 389–394. [Google Scholar] [CrossRef] [PubMed]
  43. Wang, Z.; Li, G.; Sun, H.; Ma, L.; Guo, Y.; Zhao, Z.; Gao, H.; Mei, L. Effects of drought stress on photosynthesis and photosynthetic electron transport chain in young apple tree leaves. Biol. Open 2018, 7, bio035279. [Google Scholar] [CrossRef] [PubMed] [Green Version]
  44. Wojda, T.; Klisz, M.; Jastrzębowski, S.; Mionskowski, M.; Szyp-Borowska, I.; Szczygieł, K. The Geographical Distribution Of The Black Locust (Robinia Pseudoacacia L.) In Poland And Its Role On Non-Forest Land. Pap. Glob. Chang. IGBP 2015, 22, 101–113. [Google Scholar] [CrossRef]
  45. Murashige, T.; Skoog, F. A Revised Medium for Rapid Growth and Bio Assays with Tobacco Tissue Cultures. Physiol. Plant. 1962, 15, 473–497. [Google Scholar] [CrossRef]
  46. Szyp-Borowska, I.; Banha, C.; Wojda, T.; Szczygiel, K. Micropropagation of black locust (Robinia pseudoacacia L.) and genetic stability of long term cultivated plants. Folia For. Pol. Ser. A 2016, 58, 13–19. [Google Scholar] [CrossRef] [Green Version]
  47. Chaudhary, S.; Devi, P.; Bhardwaj, A.; Jha, U.C.; Sharma, K.D.; Prasad, P.V.V.; Siddique, K.H.M.; Bindumadhava, H.; Kumar, S.; Nayyar, H. Identification and Characterization of Contrasting Genotypes/Cultivars for Developing Heat Tolerance in Agricultural Crops: Current Status and Prospects. Front. Plant Sci. 2020, 11, 587264. [Google Scholar] [CrossRef] [PubMed]
  48. Kulpa, D.; Gawlik, A.; Matuszk-Slamani, R.; Włodarczyk, M.; Bejger, R.; Sienkiewicz, M.; Gołębiowska, D.; Semeniuk, A. Effect of Mannitol and Sorbitol on Soybean in Vitro Development. Folia Pomeranae Univ. Technol. Stetin. Agric. Aliment. Piscaria Zootech. 2018, 341, 41–48. [Google Scholar] [CrossRef]
  49. Zeger, S.L.; Liang, K.Y. Longitudinal Data Analysis for Discrete and Continuous Outcomes. Biometrics 1986, 42, 121–130. [Google Scholar] [CrossRef] [PubMed] [Green Version]
  50. Stokes, D. Entrepreneurial marketing: A conceptualisation from qualitative research. Qual. Mark. Res. An Int. J. 2000, 3, 47–54. [Google Scholar] [CrossRef]
  51. Pan, W. Akaike’s Information Criterion in Generalized Estimating Equations. Biometrics 2001, 57, 120–125. [Google Scholar] [CrossRef]
  52. Takashima, Y.; Hiraoka, Y.; Matsushita, M.; Takahashi, M. Evaluation of responsivity to drought stress using infrared thermography and chlorophyll fluorescence in potted clones of cryptomeria japonica. Forests 2021, 12, 55. [Google Scholar] [CrossRef]
  53. McDowell, N.; Pockman, W.T.; Allen, C.D.; Breshears, D.D.; Cobb, N.; Kolb, T.; Plaut, J.; Sperry, J.; West, A.; Williams, D.G.; et al. Mechanisms of plant survival and mortality during drought: Why do some plants survive while others succumb to drought? New Phytol. 2008, 178, 719–739. [Google Scholar] [CrossRef] [PubMed]
  54. Hammond, W.M.; Adams, H.D.; Yu, K.; Wilson, L.A.; Will, R.E.; Anderegg, W.R.L. Dead or dying? Quantifying the point of no return from hydraulic failure in drought-induced tree mortality. New Phytol. 2019, 223, 1834–1843. [Google Scholar] [CrossRef] [PubMed] [Green Version]
  55. Jovovic, M.; Govedarica-lucic, A.; Tesanovic, D.; Tunguz, V. Influence of Salt and Osmotic Stress on Germination of Different Wheat Cultivars. Int. J. Crops Sci. Technol. 2015, 1. [Google Scholar]
  56. dos Santos, C.L.; de Borja Reis, A.F.; Mazzafera, P.; Favarin, J.L. Determination of the water potential threshold at which rice growth is impacted. Plants 2018, 7, 48. [Google Scholar] [CrossRef] [PubMed] [Green Version]
  57. Pallardy, S.G. Chapter 11 Absorption of Water and Ascent of Sap. In Phisiology of Woody Plants, 3rd ed.; Academic Press: Cambridge, MA, USA, 2008; pp. 287–323. [Google Scholar]
  58. Ridolfi, M.; Dreyer, E. Responses to water stress in an ABA-unresponsive hybrid poplar (Populus koreana × trichocarpa cv. Peace) III. Consequences for photosynthetic carbon assimilation. New Phytol. 1997, 135, 31–40. [Google Scholar] [CrossRef] [PubMed]
  59. Moysset, L.; Llambrich, E.; López-Iglesias, C.; Simón, E. Microautoradiographic localisation of [3H]sucrose and [3H]mannitol in Robinia pseudoacacia pulvinar tissues during phytochrome-mediated nyctinastic closure. Protoplasma 2006, 229, 63–73. [Google Scholar] [CrossRef]
  60. George, E. Plant Propagation by Tissue Culture: Handbook and Directory of Commercial Laboratories; Exegetics Ltd.: Hampshire, UK, 1984; ISBN 9780950932507. [Google Scholar]
  61. Hazarika, B.N. Acclimatization of tissue cultured plants. Curr. Sci. 2003, 85, 1704–1712. [Google Scholar]
  62. Kishor, P.B.K.; Dange, V. Sucrose metabolism in callus cultures of cotton during growth. Indian J. Exp. Biol. 1990, 28, 352–355. [Google Scholar]
  63. Finkelstein, R.R.; Gibson, S.I. ABA and sugar interactions regulating development: Cross-talk or voices in a crowd? Curr. Opin. Plant Biol. 2002, 5, 26–32. [Google Scholar] [CrossRef] [PubMed]
  64. Ramel, F.; Sulmon, C.; Cabello-Hurtado, F.; Taconnat, L.; Martin-Magniette, M.-L.; Renou, J.-P.; Amrani, A.E.; Couée, I.; Gouesbet, G. Genome-wide interacting effects of sucrose and herbicide-mediated stress in Arabidopsis thaliana: Novel insights into atrazine toxicity and sucrose-induced tolerance. BMC Genom. 2007, 8, 450. [Google Scholar] [CrossRef] [PubMed] [Green Version]
  65. Hoekstra, F.A.; Golovina, E.A.; Buitink, J. Mechanisms of plant desiccation tolerance. Trends Plant Sci. 2001, 6, 431–438. [Google Scholar] [CrossRef] [PubMed]
  66. Zhang, S.; Kang, H.; Yang, W. Climate change-induced water stress suppresses the regeneration of the critically endangered forest tree Nyssa yunnanensis. PLoS ONE 2017, 12, e0182012. [Google Scholar] [CrossRef] [PubMed]
Figure 1. Effect of duration and magnitude of osmotic agents on mortality (%) of R. pseudoacacia clones (10PT, 4SO, 6SO) in in vitro culture conditions over 8-weeks of exposure to seven treatments. Different treatments are denoted as: “control”—medium without osmoticum, “S30”—medium with 30 gL−1 of sucrose, “S60”—medium with 60 gL−1 of sucrose, “S90”—medium with 90 gL−1 of sucrose, “M25”—medium with 25 gL−1 of mannitol, “M90” medium with 90 gL−1 of mannitol, “M120” medium with 120 gL−1 of mannitol.
Forests 13 01979 g001
Figure 2. Effect of different osmoticum treatments on total shoot length TSL of Robinia pseudoacacia clones (10PT, 4SO, 6SO) during 8 weeks of treatment. Different treatments are denoted by the water potential (Ψ) and the osmotic agent and its concentration in the medium as follows: “control”—medium without osmoticum, “S30”—medium with 30 gL−1 of sucrose, “S60”—medium with 60 gL−1 of sucrose, “S90”—medium with 90 gL−1 of sucrose, “M25”—medium with 25 gL−1 of mannitol, “M90” medium with 90 gL−1 of mannitol, “M120” medium with 120 gL−1 of mannitol.
Forests 13 01979 g002
Figure 3. Effect of different osmoticum on fresh weight of R. pseudoacacia clones (10PT, 4SO, 6SO) for 8 weeks treatment. Different treatments are denoted: “control”—medium without osmoticum, “S30”—medium with 30 gL−1 of sucrose, “S60”—medium with 60 gL−1 of sucrose, “S90”—medium with 90 gL−1 of sucrose, “M25”—medium with 25 gL−1 of mannitol, “M90” medium with 90 gL−1 of mannitol, “M120” medium with 120 gL−1 of mannitol.
Forests 13 01979 g003
Table 1. Name and number of selected clones of black locust.
Clone NameClone Number
4SO9757
6SO9735
10PT9755
Table 2. Osmotic treatment number (No.), water potential (Ψ level) and the amount and type of osmotic agent used (Sucrose or Mannitol) and associated treatment abbreviations used in the eight-week experiment on black locust explants.
No.Ψ Level (MPa)Sucrose Concentration (gL−1)Mannitol Concentration (gL−1)Abbreviation *
1000Control (MS)
2−0.230-S30
3−0.3-25M25
4−0.460-S60
5−0.690-S90
6−1.2-90M90
7−1.5-120M120
* MS—Murashige and Skoog medium, M—mannitol, S—sucrose.
Table 3. ANOVA table for mortality with Wald statistics for GEE analysis (DF—degrees of freedom; chi-square—test statistics; pp-values).
Model EffectDFChi-Squarep
Clone228.02<0.001
Osmoticum677.12<0.001
Time456.19<0.001
Clone × Osmoticum1168.61<0.001
Clone × Time840.43<0.001
Osmoticum × Time2359.55<0.001
Table 4. Mean ± SE mortality rate (%) of R. pseudoacacia clones (10PT, 4SO, 6SO) after exposure to seven osmoticum treatments. Different treatments are denoted as: “control”—medium without osmoticum, “S30”—medium with 30 gL−1 of sucrose, “S60”—medium with 60 gL−1 of sucrose, “S90”—medium with 90 gL−1 of sucrose, “M25”—medium with 25 gL−1 of mannitol, “M90” medium with 90 gL−1 of mannitol, “M120” medium with 120 gL−1 of mannitol. Effect of Clone × Osmoticum.
OsmoticumClone
10PT 4SO 6SO Total for Osmoticum
control0.0 ± 0.0aA5.3 ± 1.6bB2.0 ± 1.1aA2.4 ± 0.7b
S30 0.0 ± 0.0aA4.0 ± 4.0abA0.0 ± 0.0aA1.3 ± 1.3ab
M25 2.7 ± 1.6aA18 ± 4.9bB0.0 ± 0.0aA6.9 ± 1.9bc
S60 0.0 ± 0.0aA0.0 ± 0.0aA0.0 ± 0.0aA0.0 ± 0.0a
S90 10.0 ± 5.5bA24.7 ± 8.7cB0.0 ± 0.0aA11.6 ± 3.6cd
M90 0.7 ± 0.7aA24.7 ± 5.5cB3.3 ± 1.4aA9.6 ± 2.3cd
M120 12.0 ± 5.4bA27.3 ± 4.9cA20.0 ± 7.6bA19.8 ± 3.6d
Total for clone3.6 ± 1.2 A14.9 ± 2.1 B3.6 ± 1.2 A
Means with the same lowercase letter within a column or means with the same uppercase letter within a row are not significantly different at p ≤ 0.05; SE—standard error.
Table 5. Mean ± SE mortality rate M (%) of R. pseudoacacia clones (10PT, 4SO, 6SO) after 2, 4, 6, and 8 weeks of drought stress exposure. Effect of Clone × Time.
CloneTime (weeks)
2 4 6 8
10PT0.0 ± 0.0aA1.4 ± 0.8aA7.6 ± 3.9aB9.1 ± 4.1aB
4SO3.3 ± 1.6aA13.3 ± 3.5bB20.5 ± 4.2bC37.2 ± 6.7bD
6SO0.0 ± 0.0aA4.7 ± 3.1abA6.7 ± 3.7aB6.7 ± 3.7aB
Total for time1.1 ± 0.6 A6.5 ± 1.6 B11.6 ± 2.3 C17.6 ± 3.2 D
Means with the same lowercase letter within a column or means with the same uppercase letter within a row are not significantly different at p ≤ 0.05; SE—standard error.
Table 6. Mean ± SE mortality rate M (%) of R. pseudoacacia clones (10PT, 4SO, 6SO) for different treatments measured after 2, 4, 6, and 8 weeks of drought stress exposure. Different treatments are denoted by the water potential (Ψ) and the osmotic agent and its concentration in the medium. “control”—medium without osmoticum, “S30”—medium with 30 gL−1 of sucrose, “S60”—medium with 60 gL−1 of sucrose, “S90”—medium with 90 gL−1 of sucrose, “M25”—medium with 25 gL−1 of mannitol, “M90” medium with 90 gL−1 of mannitol, “M120” medium with 120 gL−1 of mannitol. Effect of Osmoticum × Time.
OsmoticumTime (weeks)
2 4 6 8
control 0.0 ± 0.0aA2.2 ± 1.5aA4.4 ± 1.9abA5.6 ± 2.1aA
S30 0.0 ± 0.0aA0.0 ± 0.0aA0.0 ± 0.0aA6.7 ± 6.7abA
M25 0.0 ± 0.0aA10.0 ± 4.2bB10.0 ± 4.24bB14.4 ± 7.1aB
S60 0.0 ± 0.0aA0.0 ± 0.0aA0.0 ± 0.0aA0.0 ± 0.0aA
S90 0.0 ± 0.0aA7.8 ± 6.7abAB15.6 ± 8.9bcB34.4 ± 12.4bcB
M90 3.3 ± 2.4aA6.7 ± 2.7bAB15.6 ± 5.5cAB22.2 ± 8.2bB
M120 4.4 ± 3.0aA18.9 ± 6.9cB35.6 ± 9.2cC40.0 ± 10.1cC
Total for time1.1 ± 0.6 A6.5 ± 1.6 B11.6 ± 2.3 C17.6 ± 3.2 D
Means with the same lowercase letter within a column or means with the same uppercase letter within a row are not significantly different at p ≤ 0.05; SE—standard error.
Table 7. ANOVA table for total shoot length TSL and total fresh weight FW for the GEE analysis of R. pseudoacacia (DF—degrees of freedom, F—test statistics; pp-values).
Model EffectDFTSLFW
FpFp
Clone252.05<0.0012.350.096
Osmoticum622.7<0.00172.21<0.001
Time4157.7<0.001257.53<0.001
Clone × Osmoticum123.87<0.0013.91<0.001
Clone × Time80.840.5685.18<0.001
Osmoticum × Time2415.29<0.00151.93<0.001
Clone × Osmoticum × Time482.52<0.0014.46<0.001
Table 8. Mean ± SE total shoot length TSL (cm) of R. pseudoacacia clones (10PT, 4SO, 6SO) for different osmotic treatments. Different treatments are denoted by the water potential (Ψ) and the osmotic agent and its concentration in the medium and denoted as: “control”—medium without osmoticum, “S30”—medium with 30 gL−1 of sucrose, “S60”—medium with 60 gL−1 of sucrose, “S90”—medium with 900 gL−1 of sucrose, “M25”—medium with 25 gL−1 of mannitol, “M90” medium with 90 gL−1 of mannitol, “M120” medium with 120 gL−1 of mannitol. Effect of Clone × Osmoticum.
OsmoticumClone
10PT 4SO 6SO Total for Osmoticum
control 2.94 ± 0.08bC2.47 ± 0.08bcB2.18 ± 0.08aA2.53 ± 0.05b
S30 2.92 ± 0.08bB2.60 ± 0.09cA2.87 ± 0.08cB2.79 ± 0.05c
M25 2.51 ± 0.08aB1.96 ± 0.10aA2.11 ± 0.08aA2.19 ± 0.05a
S60 2.79 ± 0.08bC2.17 ± 0.08bA2.45 ± 0.08bB2.47 ± 0.04b
S90 2.54 ± 0.09aB1.97 ± 0.17aA2.49 ± 0.08bB2.33 ± 0.07b
M90 2.47 ± 0.08aC1.77 ± 0.12aA2.1 ± 0.08aB2.12 ± 0.05a
M120 2.43 ± 0.09aB2.26 ± 0.11bA2.12 ± 0.10aA2.27 ± 0.06a
Total for clone2.66 ± 0.03 C2.17 ± 0.04 A2.33 ± 0.03 B
Means with the same lowercase letter within a column or means with the same uppercase letter within a row are not significantly different at p ≤ 0.05; SE—standard error.
Table 9. Mean ± SE total shoot length TSL (cm) of R. pseudoacacia clones (10PT, 4SO, 6SO) for different treatments measured after 0, 2, 4, 6, and 8- weeks of drought stress exposure. Different treatments are denoted by the water potential (Ψ) and the osmotic agent and its concentration in the medium and denoted as “control”—medium without osmoticum, “S30”—medium with 30 gL−1 of sucrose, “S60”—medium with 60 gL−1 of sucrose, “S90”—medium with 900 gL−1 of sucrose, “M25”—medium with 25 gL−1 of mannitol, “M90” medium with 90 gL−1 of mannitol, “M120” medium with 120 gL−1 of mannitol. Effect of Osmoticum × Time.
OsmoticumTime (weeks)
0 2 4 6 8
control 2.05 ± 0.05aA2.51 ± 0.05cB2.64 ± 0.05cC2.69 ± 0.05cD2.76 ± 0.05cE
S30 2.18 ± 0.05aA2.65 ± 0.05dB2.85 ± 0.05dC3.07 ± 0.05dD3.25 ± 0.05dE
M25 2.03 ± 0.05aA2.13 ± 0.05abB2.26 ± 0.05abC2.27 ± 0.05abC2.28 ± 0.06abC
S60 2.13 ± 0.05aA2.41 ± 0.05cB2.53 ± 0.05cC2.60 ± 0.05cD2.69 ± 0.05cE
S90 2.15 ± 0.07aA2.30 ± 0.07bcB2.36 ± 0.07bcB2.41 ± 0.08bB2.45 ± 0.08bB
M90 2.00 ± 0.06aA2.08 ± 0.06aB2.14 ± 0.06aC2.19 ± 0.06aD2.21 ± 0.06aD
M120 2.15 ± 0.06aA2.24 ± 0.06abB2.29 ± 0.06abC2.31 ± 0.06abC2.36 ± 0.07abC
Total for time 2.09 ± 0.02 A2.33 ± 0.02 B2.44 ± 0.02 C2.50 ± 0.02 D2.57 ± 0.02 E
Means with the same lowercase letter within a column or means with the same uppercase letter within a row are not significantly different at p ≤ 0.05; SE—standard error.
Table 10. Mean ± SE fresh weight FW (g) of R. pseudoacacia clones (10PT, 4SO, 6SO) for different osmotic treatments. Different treatments are denoted as: “control”—medium without osmoticum, “S30”—medium with 30 gL−1 of sucrose, “S60”—medium with 60 gL−1 of sucrose, “S90”—medium with 90 gL−1 of sucrose, “M25”—medium with 25 gL−1 of mannitol, “M90” medium with 90 gL−1 of mannitol, “M120” medium with 120 gL−1 of mannitol. Effect of Clone × Osmoticum.
Osmoticum Clone
10PT 4SO 6SO Total for Sugar
control 0.09 ± 0.02bA0.089 ± 0.02aA0.07 ± 0.02aA0.08 ± 0.01a
S30 0.22 ± 0.02cA0.30 ± 0.02cB0.37 ± 0.02cC0.29 ± 0.01c
M25 0.06 ± 0.02abA0.07 ± 0.02aA0.05 ± 0.02aA0.06 ± 0.01a
S60 0.19 ± 0.02cA0.19 ± 0.02bA0.25 ± 0.02bB0.21 ± 0.01b
S90 0.19 ± 0.02cB0.09 ± 0.04aA0.20 ± 0.02bB0.16 ± 0.02b
M90 0.04 ± 0.02aA0.07 ± 0.03aA0.03 ± 0.02aA0.05 ± 0.01a
M120 0.06 ± 0.02abA0.08 ± 0.03aA0.04 ± 0.02aA0.06 ± 0.01a
Total for clone0.12 ± 0.01 A0.13 ± 0.01 A0.14 ± 0.01 A
Means with the same lowercase letter within a column or means with the same uppercase letter within a row are not significantly different at p ≤ 0.05; SE—standard error.
Table 11. Mean ± SE fresh weight (FW) (g) of R. pseudoacacia clones (10PT, 4SO, 6SO) for different treatments measured after 0, 2, 4, 6, and 8 weeks of drought stress exposure. Different treatments are denoted as “control”—medium without osmoticum, “S30”—medium with 30 gL−1 of sucrose, “S60”—medium with 60 gL−1 of sucrose, “S90”—medium with 90 gL−1 of sucrose, “M25”—medium with 25 gL−1 of mannitol, “M90” medium with 90 gL−1 of mannitol, “M120” medium with 120 gL−1 of mannitol. Effect of Osmoticum × Time.
OsmoticumTime (weeks)
0 2 4 6 8
control 0.03 ± 0.01aA0.06 ± 0.01abB0.08 ± 0.01aC0.11 ± 0.01bD0.13 ± 0.01bE
S30 0.03 ± 0.01aA0.09 ± 0.01cB0.26 ± 0.01cC0.47 ± 0.01eD0.63 ± 0.01eE
M25 0.03 ± 0.01aA0.05 ± 0.01aB0.06 ± 0.01aC0.08 ± 0.01abC0.08 ± 0.01aC
S60 0.03 ± 0.01aA0.08 ± 0.01bcB0.23 ± 0.01cC0.31 ± 0.01dD0.41 ± 0.01dE
S90 0.03 ± 0.02aA0.07 ± 0.02bcB0.16 ± 0.02bC0.22 ± 0.02cD0.32 ± 0.02cE
M90 0.03 ± 0.01aA0.04 ± 0.01aA0.06 ± 0.01aB0.06 ± 0.01aB0.06 ± 0.01aB
M120 0.04 ± 0.02aA0.05 ± 0.02abA0.06 ± 0.02aA0.07 ± 0.02aA0.07 ± 0.02aA
Total for time 0.03 ± 0.01 A0.06 ± 0.01 B0.13 ± 0.01 C0.19 ± 0.01 D0.25 ± 0.01 E
Means with the same lowercase letter within a column or means with the same uppercase letter within a row are not significantly different at p ≤ 0.05; SE—standard error.
Publisher’s Note: MDPI stays neutral with regard to jurisdictional claims in published maps and institutional affiliations.

