
Fire Severity in Reburns Depends on Vegetation Type in Arizona and New Mexico, U.S.A.


Abstract
:1. Introduction
2. Materials and Methods
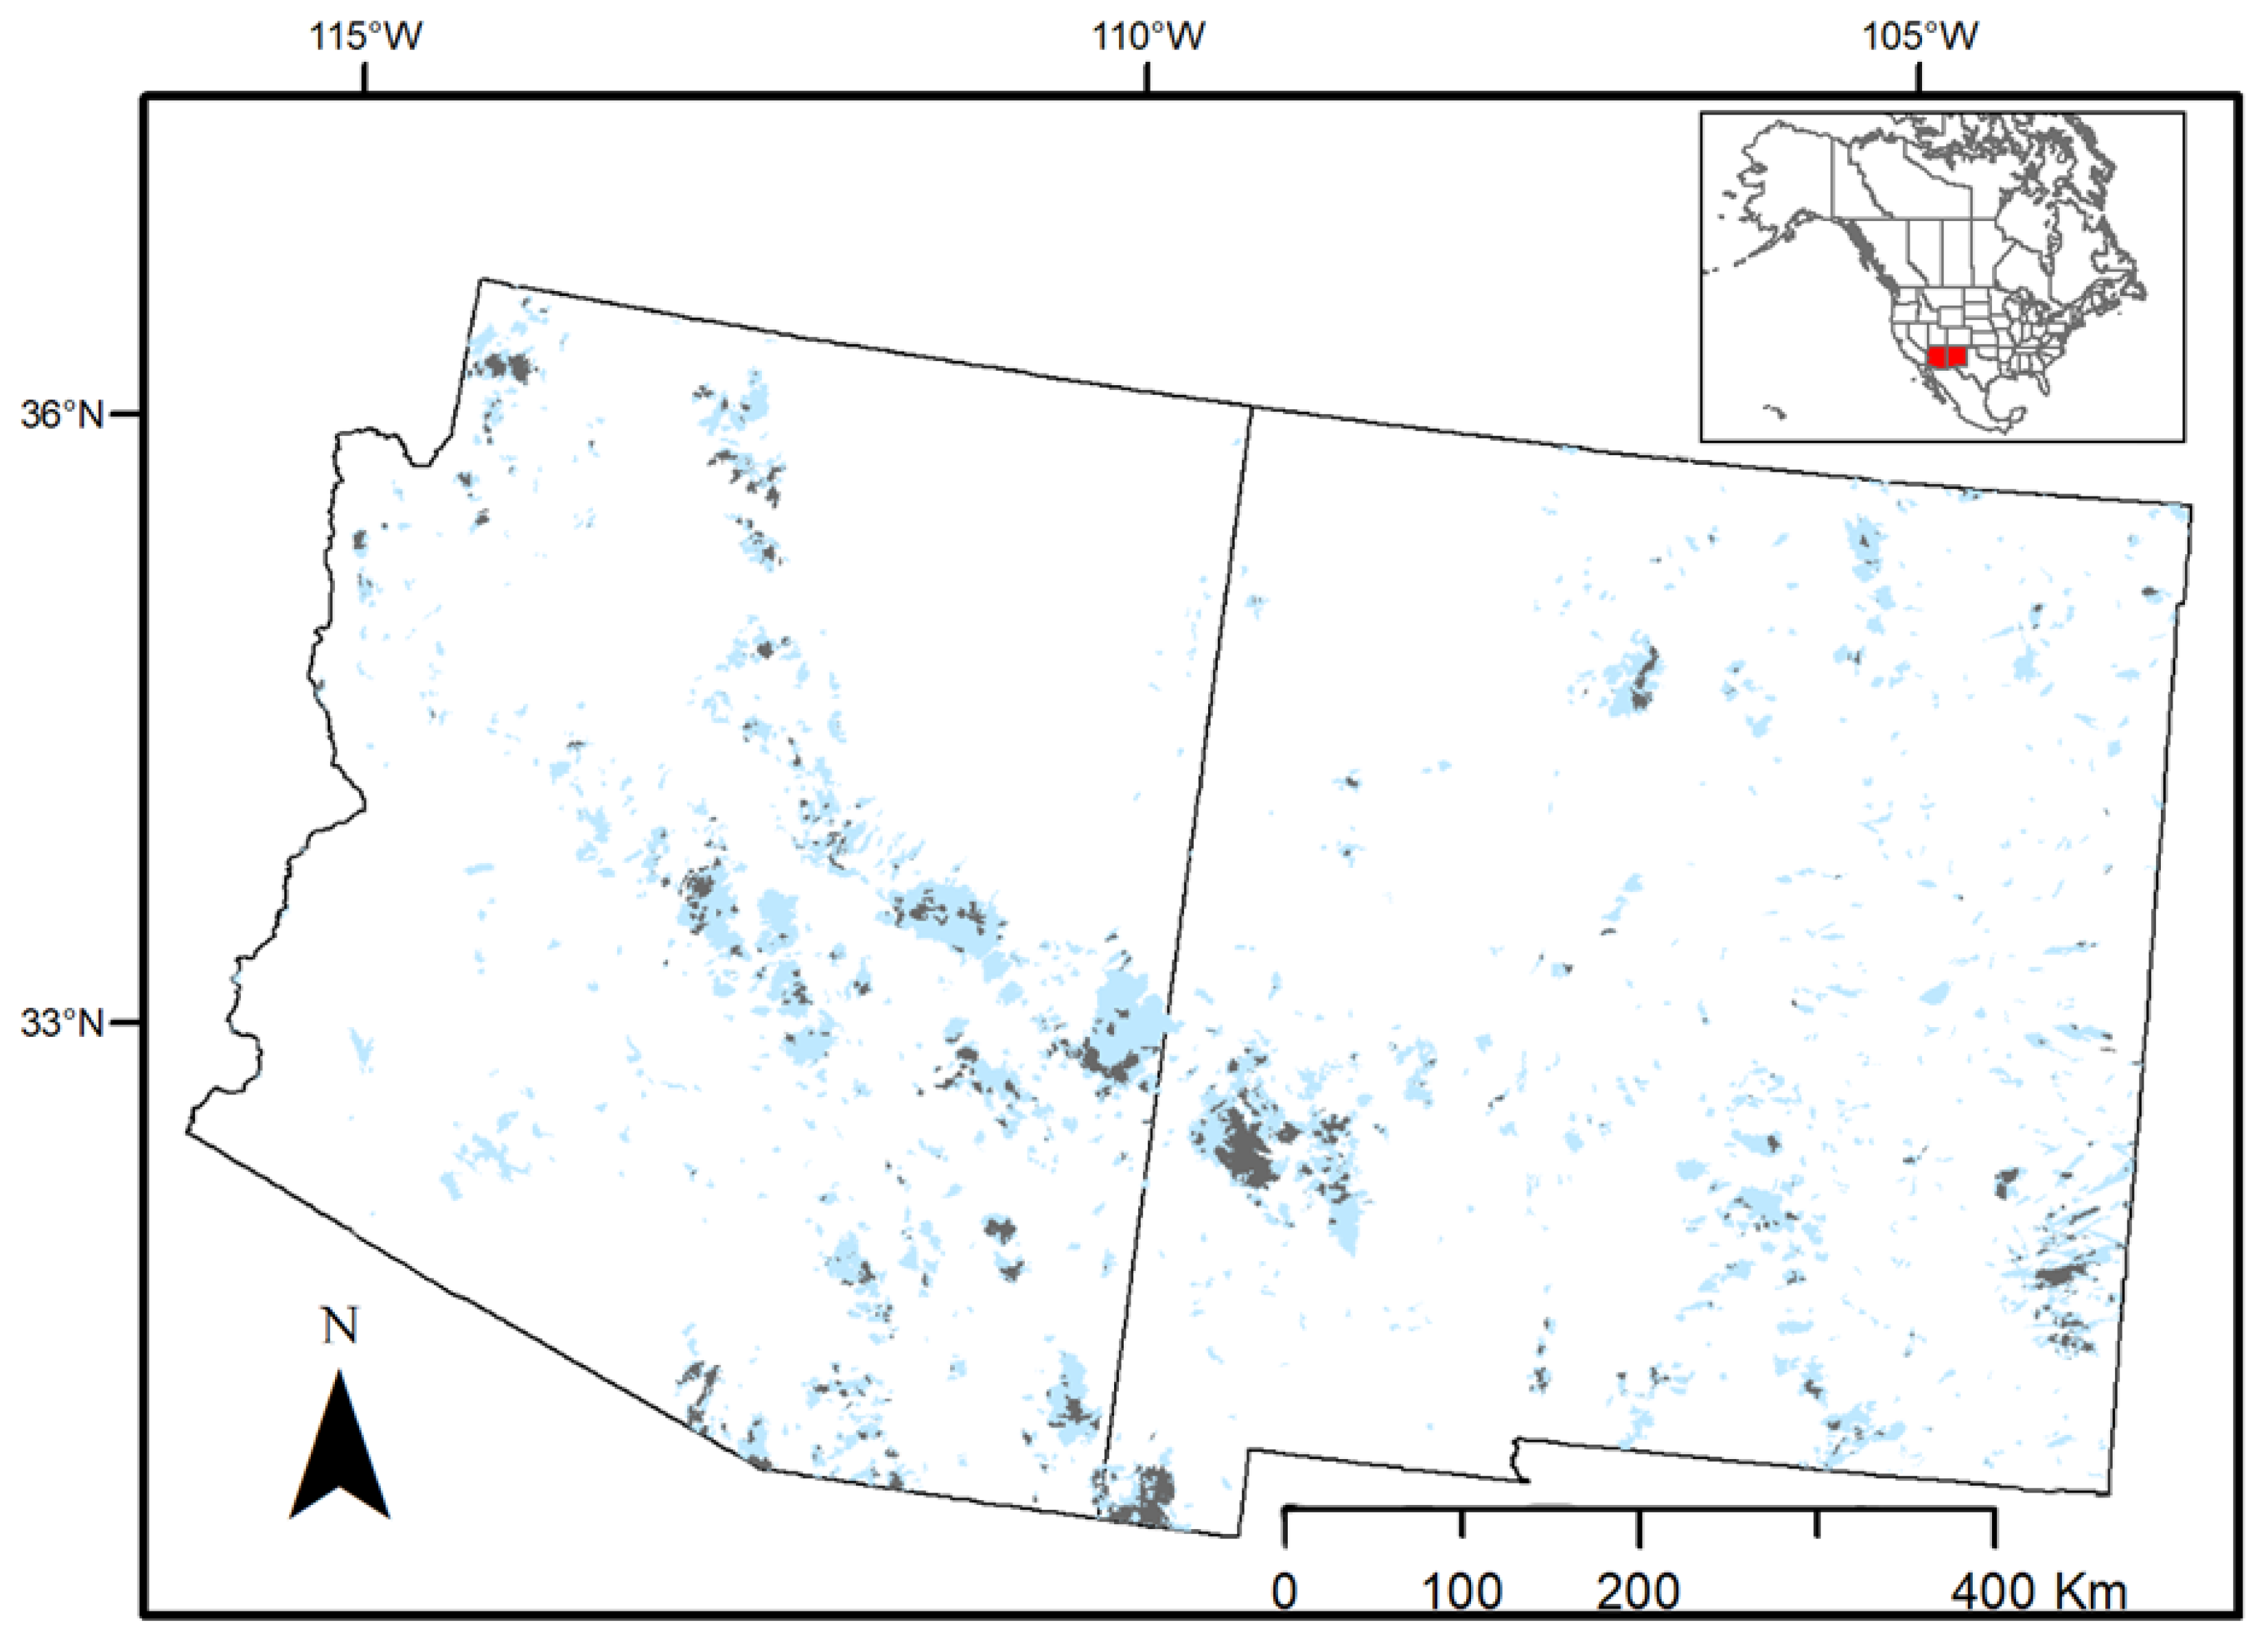
2.1. Study Area
2.2. Datasets and Data Extraction
2.3. Data Analysis
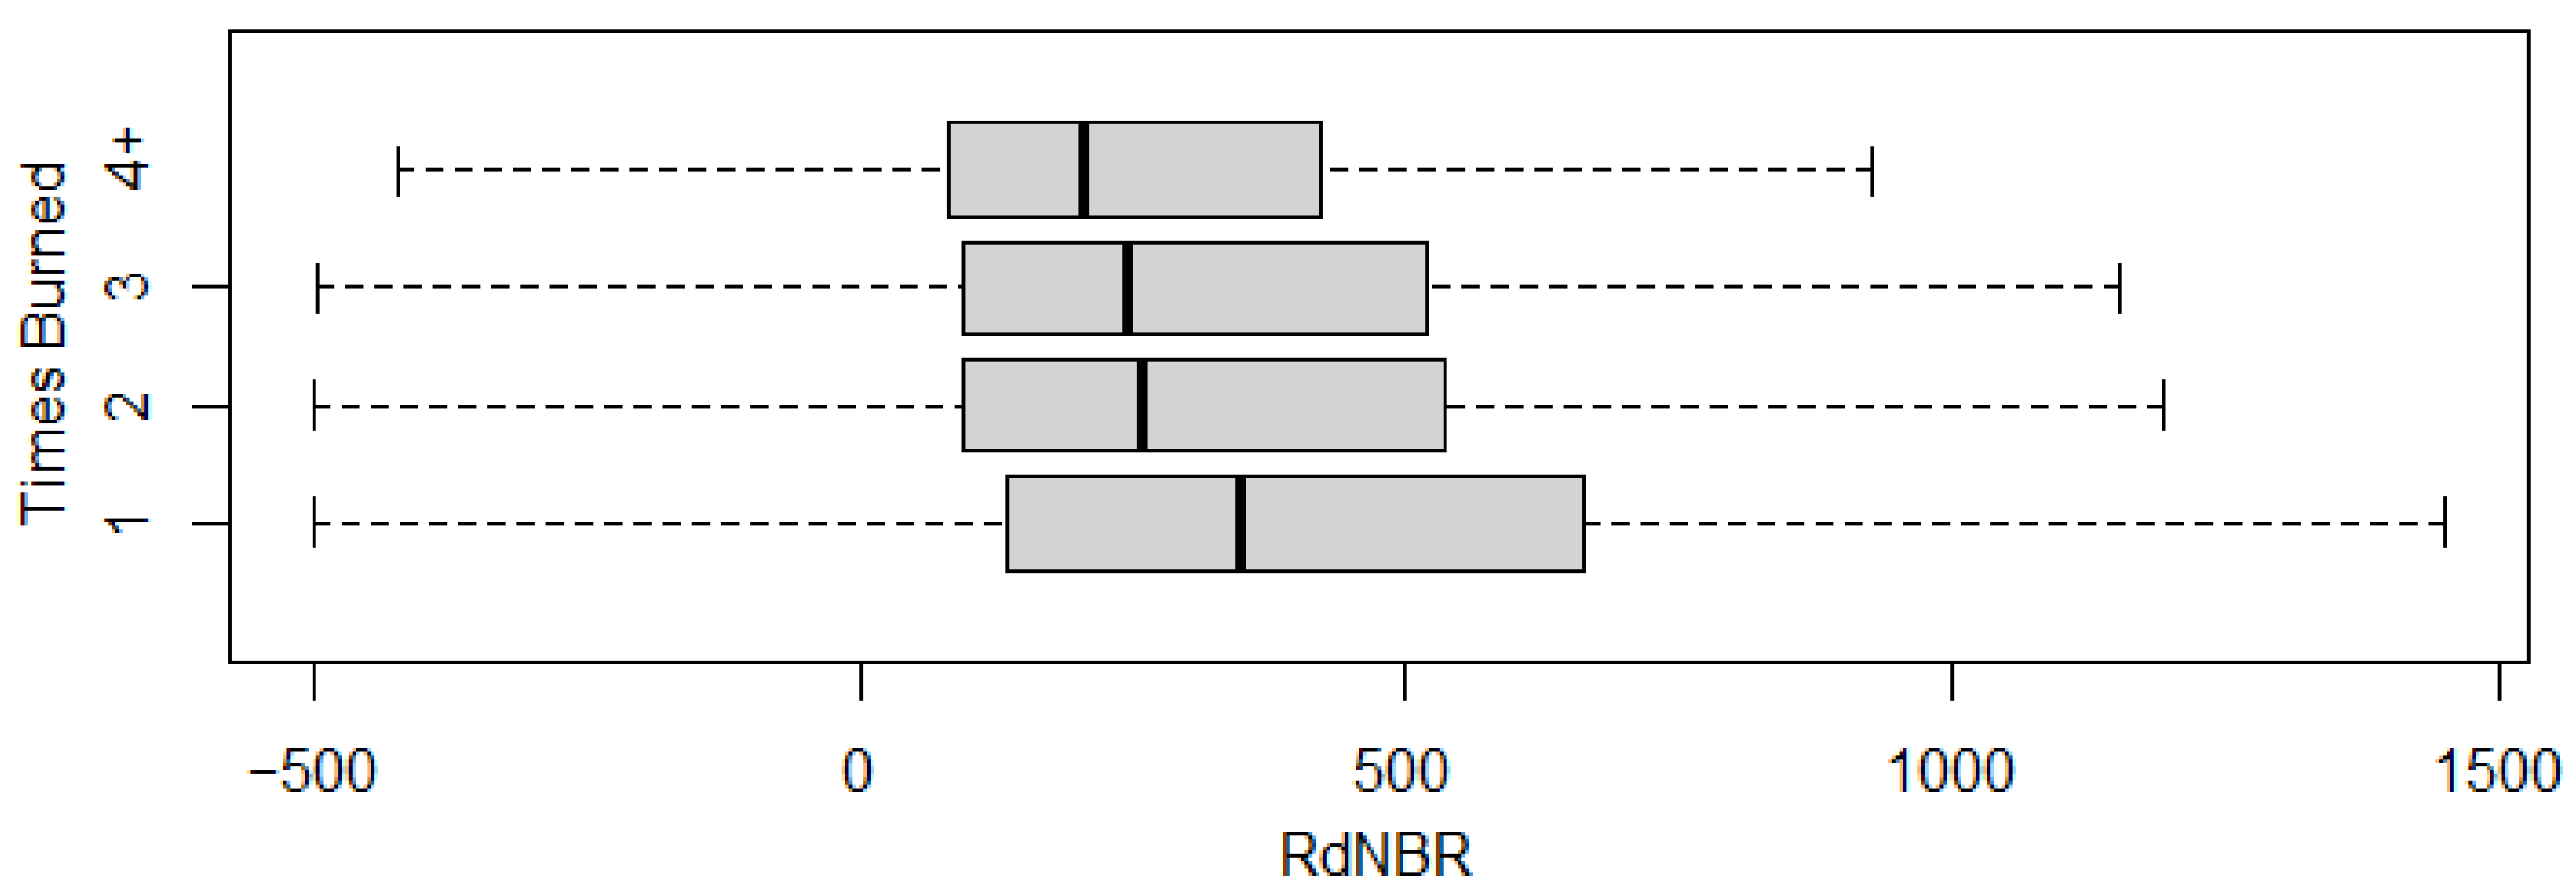
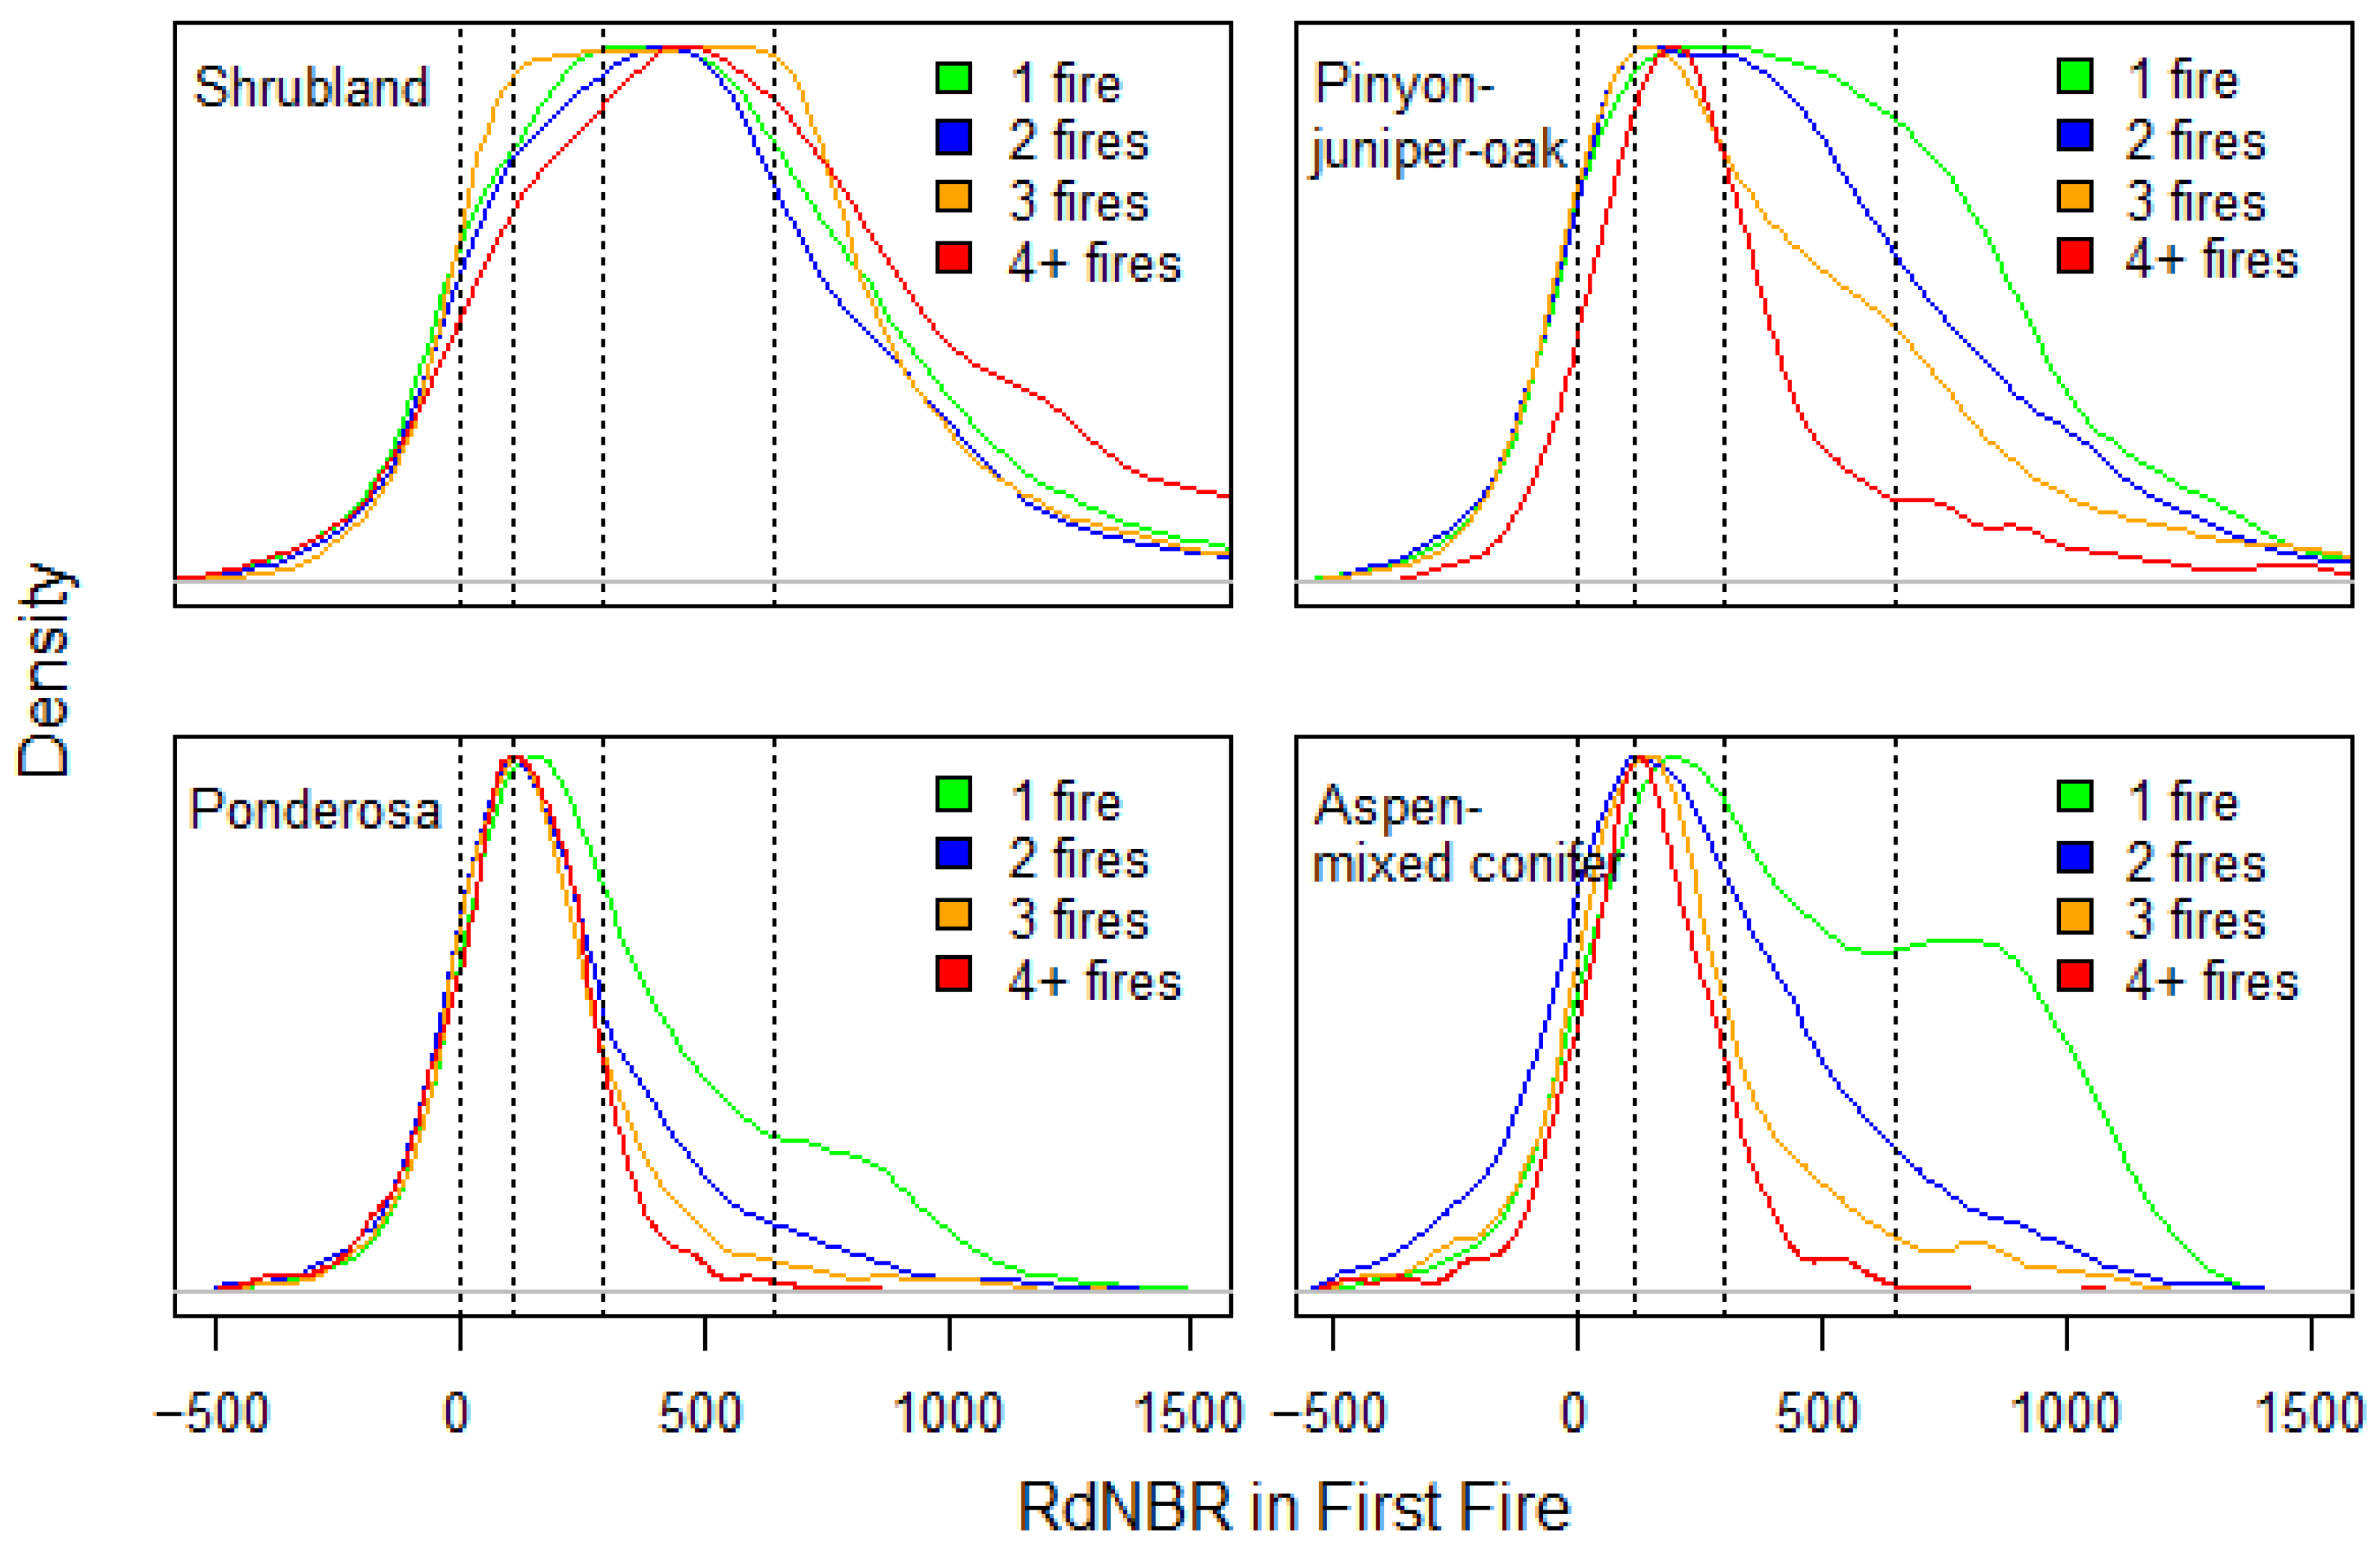
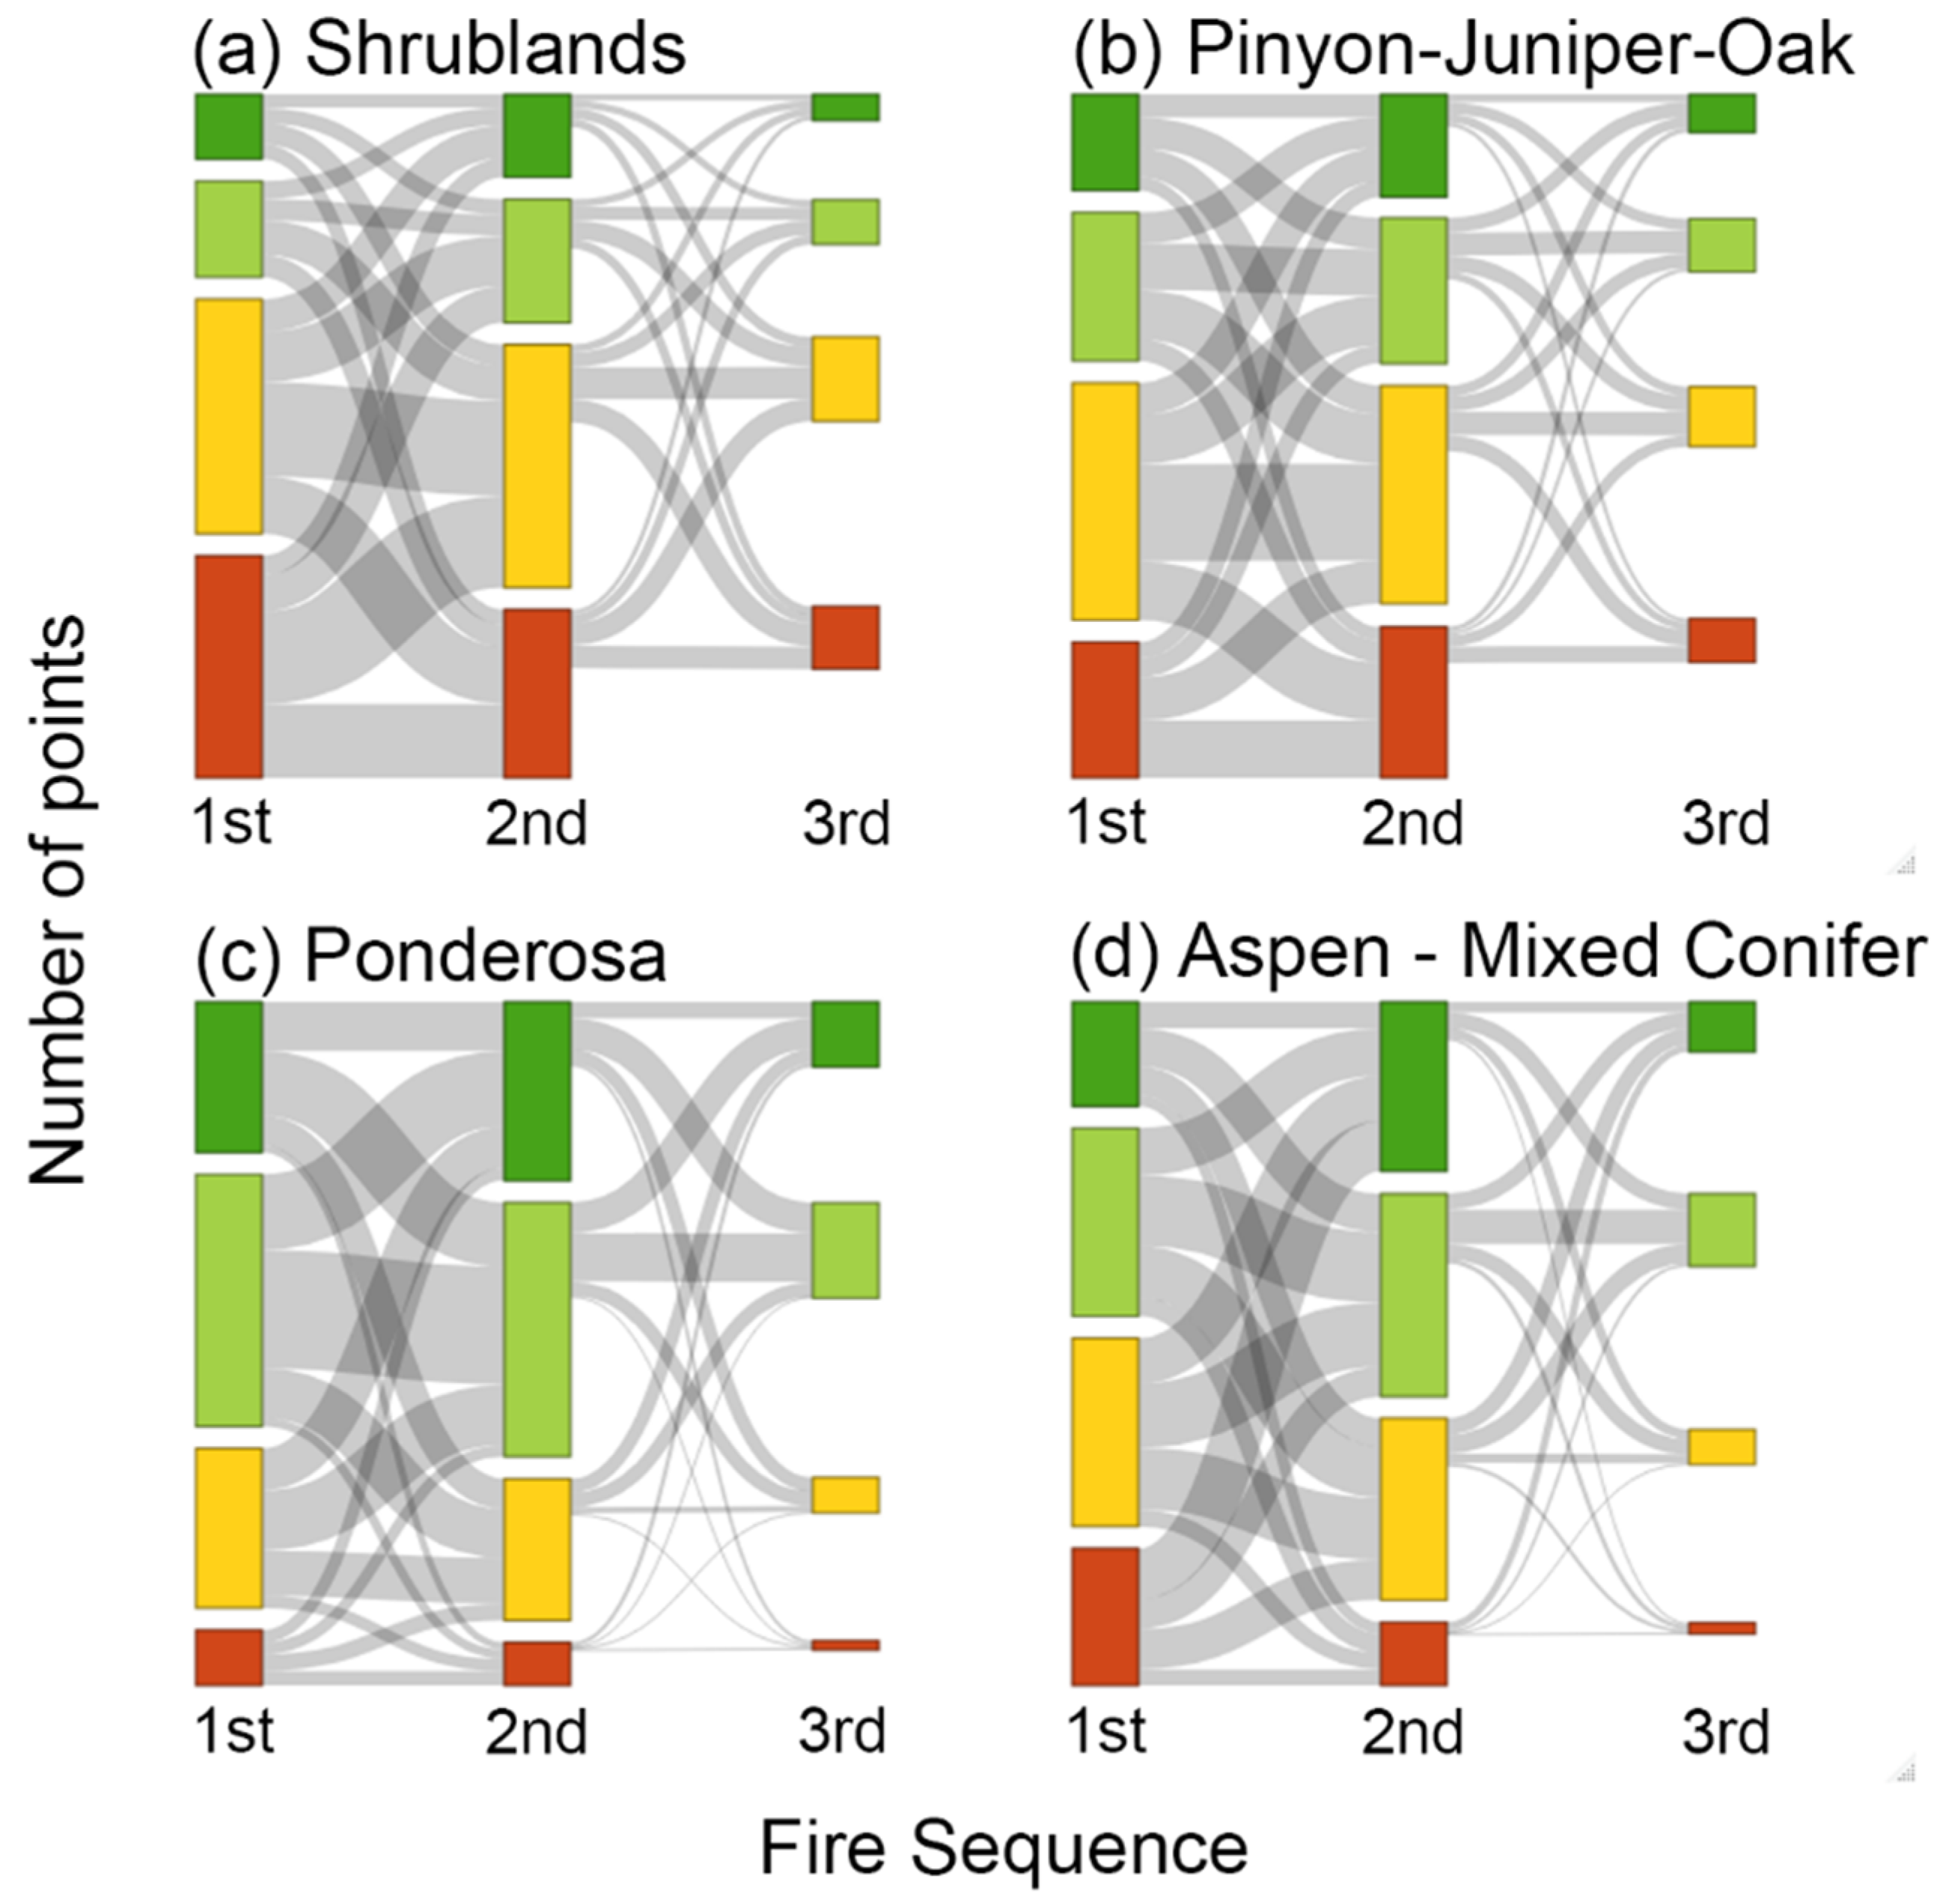
3. Results
4. Discussion
5. Conclusions
Author Contributions
Funding
Data Availability Statement
Conflicts of Interest
References
- Holden, Z.A.; Swanson, A.; Luce, C.H.; Jolly, W.M.; Maneta, M.; Oyler, J.W.; Warren, D.A.; Parsons, R.; Affleck, D. Decreasing Fire Season Precipitation Increased Recent Western US Forest Wildfire Activity. Proc. Natl. Acad. Sci. USA 2018, 115, E8349–E8357. [Google Scholar] [CrossRef] [PubMed] [Green Version]
- Iglesias, V.; Balch, J.K.; Travis, W.R. U.S. Fires Became Larger, More Frequent, and More Widespread in the 2000s. Sci. Adv. 2022, 8, eabc0020. [Google Scholar] [CrossRef] [PubMed]
- Swetnam, T.W.; Baisan, C.H. Historical Fire Regime Patterns in the Southwestern United States Since AD 1700. In Fire Effects in Southwestern Forests: The Second La Mesa Fire Symposium; Allen, C.D., Ed.; General Technical Report RM-286; USDA Forest Service: Los Alamos, NM, USA; Fort Collins, CO, USA, 1996; pp. 11–32. [Google Scholar]
- Huffman, D.W.; Sánchez Meador, A.J.; Stoddard, M.T.; Crouse, J.E.; Roccaforte, J.P. Efficacy of Resource Objective Wildfires for Restoration of Ponderosa Pine (Pinus Ponderosa) Forests in Northern Arizona. For. Ecol. Manag. 2017, 389, 395–403. [Google Scholar] [CrossRef] [Green Version]
- Singleton, M.P.; Thode, A.E.; Sánchez Meador, A.J.; Iniguez, J.M. Increasing Trends in High-Severity Fire in the Southwestern USA from 1984 to 2015. For. Ecol. Manag. 2019, 433, 709–719. [Google Scholar] [CrossRef]
- Haffey, C.; Sisk, T.D.; Allen, C.D.; Thode, A.E.; Margolis, E.Q. Limits to Ponderosa Pine Regeneration Following Large High-Severity Forest Fires in the United States Southwest. Fire Ecol. 2018, 14, 143–163. [Google Scholar] [CrossRef]
- Neary, D.G.; Gottfried, G.J.; DeBano, L.F.; Tecle, A. Impacts of Fire on Watershed Resources. J. Ariz. Nev. Acad. Sci. 2003, 35, 23–41. [Google Scholar]
- Lydersen, J.M.; Collins, B.M.; Coppoletta, M.; Jaffe, M.R.; Northrop, H.; Stephens, S.L. Fuel Dynamics and Reburn Severity Following High-Severity Fire in a Sierra Nevada, USA, Mixed-Conifer Forest. Fire Ecol. 2019, 15, 43. [Google Scholar] [CrossRef]
- Buma, B.; Weiss, S.; Hayes, K.; Lucash, M. Wildland Fire Reburning Trends across the US West Suggest Only Short-Term Negative Feedback and Differing Climatic Effects. Environ. Res. Lett. 2020, 15, 034026. [Google Scholar] [CrossRef]
- Holden, Z.A.; Morgan, P.; Hudak, A.T. Burn Severity of Areas Reburned by Wildfires in the Gila National Forest, New Mexico, USA. Fire Ecol. 2010, 6, 77–85. [Google Scholar] [CrossRef]
- Coop, J.D.; Parks, S.A.; McClernan, S.R.; Holsinger, L.M. Influences of Prior Wildfires on Vegetation Response to Subsequent Fire in a Reburned Southwestern Landscape. Ecol. Appl. 2016, 26, 346–354. [Google Scholar] [CrossRef]
- Prichard, S.J.; Stevens-Rumann, C.S.; Hessburg, P.F. Tamm Review: Shifting Global Fire Regimes: Lessons from Reburns and Research Needs. For. Ecol. Manag. 2017, 396, 217–233. [Google Scholar] [CrossRef]
- Fulé, P.Z.; Cocke, A.E.; Heinlein, T.A.; Covington, W.W. Effects of an Intense Prescribed Forest Fire: Is It Ecological Restoration?-Fulé-2004-Restoration Ecology-Wiley Online Library. Restor. Ecol. 2004, 12, 220–230. [Google Scholar]
- Passovoy, M.D.; Fulé, P.Z. Snag and Woody Debris Dynamics Following Severe Wildfires in Northern Arizona Ponderosa Pine Forests. For. Ecol. Manag. 2006, 223, 237–246. [Google Scholar] [CrossRef]
- Savage, M.; Mast, J.N. How Resilient Are Southwestern Ponderosa Pine Forests after Crown Fires? Can. J. For. Res. 2005, 35, 967–977. [Google Scholar] [CrossRef] [Green Version]
- Keeley, J.E.; McGinnis, T.W. Impact of Prescribed Fire and Other Factors on Cheatgrass Persistence in a Sierra Nevada Ponderosa Pine Forest*. Int. J. Wildland Fire 2007, 16, 96–106. [Google Scholar] [CrossRef]
- Moore, M.M.; Wallace Covington, W.; Fulé, P.Z. Reference Conditions and Ecological Restoration: A Southwestern Ponderosa Pine Perspective. Ecol. Appl. 1999, 9, 1266–1277. [Google Scholar] [CrossRef]
- Huffman, D.W.; Crouse, J.E.; Sánchez Meador, A.J.; Springer, J.D.; Stoddard, M.T. Restoration Benefits of Re-Entry with Resource Objective Wildfire on a Ponderosa Pine Landscape in Northern Arizona, USA. For. Ecol. Manag. 2018, 408, 16–24. [Google Scholar] [CrossRef]
- Fulé, P.Z.; Covington, W.W.; Moore, M.M. Determining Reference Conditions for Ecosystem Management of Southwestern Ponderosa Pine Forests. Ecol. Appl. 1997, 7, 895–908. [Google Scholar] [CrossRef]
- van Wagtendonk, J.W.; van Wagtendonk, K.A.; Thode, A.E. Factors Associated with the Severity of Intersecting Fires in Yosemite National Park, California, USA. Fire Ecol. 2012, 8, 11–31. [Google Scholar] [CrossRef]
- Parks, S.A.; Miller, C.; Nelson, C.R.; Holden, Z.A. Previous Fires Moderate Burn Severity of Subsequent Wildland Fires in Two Large Western US Wilderness Areas. Ecosystems 2014, 17, 29–42. [Google Scholar] [CrossRef] [Green Version]
- Coppoletta, M.; Merriam, K.E.; Collins, B.M. Post-fire Vegetation and Fuel Development Influences Fire Severity Patterns in Reburns. Ecol. Appl. 2016, 26, 686–699. [Google Scholar] [CrossRef] [PubMed]
- Margolis, E.Q.; Balmat, J. Fire History and Fire–Climate Relationships along a Fire Regime Gradient in the Santa Fe Municipal Watershed, NM, USA. For. Ecol. Manag. 2009, 258, 2416–2430. [Google Scholar] [CrossRef]
- McCord, M.; Reilly, M.J.; Butz, R.J.; Jules, E.S. Early Seral Pathways of Vegetation Change Following Repeated Short-Interval, High-Severity Wildfire in a Low-Elevation, Mixed Conifer – Hardwood Forest Landscape of the Klamath Mountains, California. Can. J. For. Res. 2020, 50, 13–23. [Google Scholar] [CrossRef]
- Harrington, M.G. Notes: The Effects of Spring, Summer, and Fall Burning on Gambel Oak in a Southwestern Ponderosa Pine Stand. For. Sci. 1985, 31, 156–163. [Google Scholar] [CrossRef]
- Collins, B.M.; Miller, J.D.; Thode, A.E.; Kelly, M.; van Wagtendonk, J.W.; Stephens, S.L. Interactions Among Wildland Fires in a Long-Established Sierra Nevada Natural Fire Area. Ecosystems 2009, 12, 114–128. [Google Scholar] [CrossRef]
- Rollins, M.G.; Morgan, P.; Swetnam, T. Landscape-Scale Controls over 20th Century Fire Occurrence in Two Large Rocky Mountain (USA) Wilderness Areas. Landsc. Ecol. 2002, 17, 539–557. [Google Scholar] [CrossRef]
- Barker, J.W.; Price, O.F. Positive Severity Feedback between Consecutive Fires in Dry Eucalypt Forests of Southern Australia. Ecosphere 2018, 9, e02110. [Google Scholar] [CrossRef]
- Wahlberg, M.M.; Triepke, F.J.; Robbie, W.A.; Stenger, S.H.; Vandendriesche, D.; Muldavin, E.H.; Malusa, J.R. Ecological Response Units of the Southwestern United States; USDA Forest Service Forestry Report FR-R3-XX-XX; Southwestern Region, Regional Office: Albuquerque, NM, USA, 2013; 201p.
- Kunkel, K.E.; Frankson, R.; Runkle, J.; Champion, S.M.; Stevens, L.E.; Easterling, D.R.; Stewart, B.C.; McCarrick, A.; Lemery, C.R. State Climate Summaries for the United States 2022. NOAA Technical Report NESDIS 150; NOAA/NESDIS: Silver Spring, MD, USA, 2022.
- Eidenshink, J.; Schwind, B.; Brewer, K.; Zhu, Z.-L.; Quayle, B.; Howard, S. A Project for Monitoring Trends in Burn Severity. Fire Ecol. 2007, 3, 3–21. [Google Scholar] [CrossRef]
- Harris, L.; Taylor, A.H. Previous Burns and Topography Limit and Reinforce Fire Severity in a Large Wildfire. Ecosphere 2017, 8, e02019. [Google Scholar] [CrossRef] [Green Version]
- R Core Team. R: A Language and Environment for Statistical Computing; R Foundation for Statistical Computing: Vienna, Austria, 2022. [Google Scholar]
- Hijmans, R.J.; van Etten, J.; Sumner, M.; Cheng, J.; Baston, D.; Bevan, A.; Bivand, R.; Busetto, L.; Canty, M.; Fasoli, B.; et al. Raster: Geographic Data Analysis and Modeling 2022.
- Miller, J.D.; Thode, A.E. Quantifying Burn Severity in a Heterogeneous Landscape with a Relative Version of the Delta Normalized Burn Ratio (DNBR). Remote Sens. Environ. 2007, 109, 66–80. [Google Scholar] [CrossRef]
- Picotte, J.J.; Bhattarai, K.; Howard, D.; Lecker, J.; Epting, J.; Quayle, B.; Benson, N.; Nelson, K. Changes to the Monitoring Trends in Burn Severity Program Mapping Production Procedures and Data Products. Fire Ecol. 2020, 16, 1–12. [Google Scholar] [CrossRef]
- Key, C.H.; Benson, N.C. Landscape Assessment: Ground Measure of Severity, the Composite Burn Index; and Remote Sensing of Severity, the Normalized Burn Ratio; USDA Forest Service, Rocky Mountain Research Station: Ft. Collins, CO, USA, 2006.
- Rollins, M.G. LANDFIRE: A Nationally Consistent Vegetation, Wildland Fire, and Fuel Assessment. Int. J. Wildland Fire 2009, 18, 235. [Google Scholar] [CrossRef]
- LANDFIRE LANDFIRE Project, U.S. Department of Agriculture, Forest Service; U.S. Department of Interior.
- Allaire, J.J.; Ellis, P.; Candrud, C.; Kuo, K.; Lewis, B.W.; Owen, J.; Russell, K.; Rogers, J.; Sese, C.; Yetman, C.J. NetworkD3: D3 JavaScript Network Graphs from R Version 0.4 from CRAN 2022.
- Ogle, D.; Doll, J.; Wheeler, P.; Dinno, A. FSA: Simple Fisheries Stock Assessment Methods 2022.
- Lyubchich, V.; Gel, Y.R. Funtimes: Functions for Time Series Analysis 2022.
- Thompson, J.R.; Spies, T.A.; Ganio, L.M. Reburn Severity in Managed and Unmanaged Vegetation in a Large Wildfire. Proc. Natl. Acad. Sci. USA 2007, 104, 10743–10748. [Google Scholar] [CrossRef] [PubMed] [Green Version]
- Godwin, D.R.; Kobziar, L.N. Comparison of Burn Severities of Consecutive Large-Scale Fires in Florida Sand Pine Scrub Using Satellite Imagery Analysis. Fire Ecol. 2011, 7, 99–113. [Google Scholar] [CrossRef]
- Marlon, J.R.; Bartlein, P.J.; Gavin, D.G.; Long, C.J.; Anderson, R.S.; Briles, C.E.; Brown, K.J.; Colombaroli, D.; Hallett, D.J.; Power, M.J.; et al. Long-Term Perspective on Wildfires in the Western USA. Proc. Natl. Acad. Sci. USA 2012, 109, E535–E543. [Google Scholar] [CrossRef] [PubMed] [Green Version]
- Paysen, T.E.; Ansley, R.J.; Brown, J.K. Fire in Western Shrubland, Woodland, and Grassland Ecosystems. In Wildland Fire in Ecosystems: Effects of Fire on Flora; U.S. Department of Agriculture, Forest Service, Rocky Mountain Research Station: Ft. Collins, CO, USA, 2000; pp. 121–159, RMRS-GTR-42-V2. [Google Scholar]
- Collins, L.; Hunter, A.; McColl-Gausden, S.; Penman, T.D.; Zylstra, P. The Effect of Antecedent Fire Severity on Reburn Severity and Fuel Structure in a Resprouting Eucalypt Forest in Victoria, Australia. Forests 2021, 12, 450. [Google Scholar] [CrossRef]
- Grabinski, Z.S.; Sherriff, R.L.; Kane, J.M. Controls of Reburn Severity Vary with Fire Interval in the Klamath Mountains, California, USA. Ecosphere 2017, 8. [Google Scholar] [CrossRef] [Green Version]
- Taylor, A.H.; Harris, L.B.; Drury, S.A. Drivers of Fire Severity Shift as Landscapes Transition to an Active Fire Regime, Klamath Mountains, USA. Ecosphere 2021, 12. [Google Scholar] [CrossRef]
- Romme, W.H.; Allen, C.D.; Bailey, J.D.; Baker, W.L.; Bestelmeyer, B.T.; Brown, P.M.; Eisenhart, K.S.; Floyd, M.L.; Huffman, D.W.; Jacobs, B.F.; et al. Historical and Modern Disturbance Regimes, Stand Structures, and Landscape Dynamics in Piñon–Juniper Vegetation of the Western United States. Rangel. Ecol. Manag. 2009, 62, 203–222. [Google Scholar] [CrossRef] [Green Version]
- Swetnam, T.W.; Brown, P.M. Climatic Inferences from Dendroecological Reconstructions. In Dendroclimatology: Progress and Prospects; Hughes, M.K., Swetnam, T.W., Diaz, H.F., Eds.; Developments in Paleoenvironmental Research; Springer: Dordrecht, The Netherlands, 2011; pp. 263–295. ISBN 978-1-4020-5725-0. [Google Scholar]
- McCauley, L.A.; Robles, M.D.; Woolley, T.; Marshall, R.M.; Kretchun, A.; Gori, D.F. Large-Scale Forest Restoration Stabilizes Carbon under Climate Change in Southwest United States. Ecol. Appl. 2019, 29, e01979. [Google Scholar] [CrossRef] [Green Version]
- Steel, Z.L.; Foster, D.; Coppoletta, M.; Lydersen, J.M.; Stephens, S.L.; Paudel, A.; Markwith, S.H.; Merriam, K.; Collins, B.M. Ecological Resilience and Vegetation Transition in the Face of Two Successive Large Wildfires. J. Ecol. 2021, 109, 3340–3355. [Google Scholar] [CrossRef]
- Fertel, H.M.; North, M.P.; Latimer, A.M.; Ng, J. Growth and Spatial Patterns of Natural Regeneration in Sierra Nevada Mixed-Conifer Forests with a Restored Fire Regime. For. Ecol. Manag. 2022, 519, 120270. [Google Scholar] [CrossRef]
- Larson, A.J.; Churchill, D. Tree Spatial Patterns in Fire-Frequent Forests of Western North America, Including Mechanisms of Pattern Formation and Implications for Designing Fuel Reduction and Restoration Treatments. For. Ecol. Manag. 2012, 267, 74–92. [Google Scholar] [CrossRef]
- Harris, L.B.; Drury, S.A.; Taylor, A.H. Strong Legacy Effects of Prior Burn Severity on Forest Resilience to a High-Severity Fire. Ecosystems 2021, 24, 774–787. [Google Scholar] [CrossRef]
- Falk, D.A.; van Mantgem, P.J.; Keeley, J.E.; Gregg, R.M.; Guiterman, C.H.; Tepley, A.J.; Young, D.J.N.; Marshall, L.A. Mechanisms of Forest Resilience. For. Ecol. Manag. 2022, 512, 120129. [Google Scholar] [CrossRef]
- Allen, C.D.; Savage, M.; Falk, D.A.; Suckling, K.F.; Swetnam, T.W.; Schulke, T.; Stacey, P.B.; Morgan, P.; Hoffman, M.; Klingel, J.T. Ecological Restoration of Southwestern Ponderosa Pine Ecosystems: A Broad Perspective. Ecol. Appl. 2002, 12, 1418–1433. [Google Scholar] [CrossRef]
- Rodman, K.C.; Andrus, R.A.; Butkiewicz, C.L.; Chapman, T.B.; Gill, N.S.; Harvey, B.J.; Kulakowski, D.; Tutland, N.J.; Veblen, T.T.; Hart, S.J. Effects of Bark Beetle Outbreaks on Forest Landscape Pattern in the Southern Rocky Mountains, U.S.A. Remote Sens. 2021, 13, 1089. [Google Scholar] [CrossRef]
- Mueller, S.E.; Thode, A.E.; Margolis, E.Q.; Yocom, L.L.; Young, J.D.; Iniguez, J.M. Climate Relationships with Increasing Wildfire in the Southwestern US from 1984 to 2015. For. Ecol. Manag. 2020, 460, 117861. [Google Scholar] [CrossRef]
- Graham, R.; Finney, M.; McHugh, C.; Cohen, J.; Calkin, D.; Stratton, R.; Bradshaw, L.; Nikolov, N. Fourmile Canyon Fire Findings. In Gen. Tech. Rep. RMRS-GTR-289; U.S. Department of Agriculture, Forest Service, Rocky Mountain Research Station: Fort Collins, CO, USA, 2012; 289; 110p. [Google Scholar] [CrossRef]
- Stevens-Rumann, C.S.; Kemp, K.B.; Higuera, P.E.; Harvey, B.J.; Rother, M.T.; Donato, D.C.; Morgan, P.; Veblen, T.T. Evidence for Declining Forest Resilience to Wildfires under Climate Change. Ecol. Lett. 2018, 21, 243–252. [Google Scholar] [CrossRef]
- Hunter, M.E.; Iniguez, J.M.; Lentile, L.B. Short- and Long-Term Effects on Fuels, Forest Structure, and Wildfire Potential from Prescribed Fire and Resource Benefit Fire in Southwestern Forests, USA. Fire Ecol 2011, 7, 108–121. [Google Scholar] [CrossRef]
- Seager, R.; Ting, M.; Held, I.; Kushnir, Y.; Lu, J.; Vecchi, G.; Huang, H.-P.; Harnik, N.; Leetmaa, A.; Lau, N.-C.; et al. Model Projections of an Imminent Transition to a More Arid Climate in Southwestern North America. Science 2007, 316, 1181–1184. [Google Scholar] [CrossRef] [PubMed]
- Stevens, J.T.; Haffey, C.M.; Coop, J.D.; Fornwalt, P.J.; Yocom, L.; Allen, C.D.; Bradley, A.; Burney, O.T.; Carril, D.; Chambers, M.E.; et al. Tamm Review: Postfire Landscape Management in Frequent-Fire Conifer Forests of the Southwestern United States. For. Ecol. Manag. 2021, 502, 119678. [Google Scholar] [CrossRef]


Publisher’s Note: MDPI stays neutral with regard to jurisdictional claims in published maps and institutional affiliations. |
© 2022 by the authors. Licensee MDPI, Basel, Switzerland. This article is an open access article distributed under the terms and conditions of the Creative Commons Attribution (CC BY) license (https://creativecommons.org/licenses/by/4.0/).
Share and Cite
Yocom, L.L.; Jenness, J.; Fulé, P.Z.; Thode, A.E. Fire Severity in Reburns Depends on Vegetation Type in Arizona and New Mexico, U.S.A. Forests 2022, 13, 1957. https://doi.org/10.3390/f13111957
Yocom LL, Jenness J, Fulé PZ, Thode AE. Fire Severity in Reburns Depends on Vegetation Type in Arizona and New Mexico, U.S.A. Forests. 2022; 13(11):1957. https://doi.org/10.3390/f13111957
Chicago/Turabian StyleYocom, Larissa L., Jeff Jenness, Peter Z. Fulé, and Andrea E. Thode. 2022. "Fire Severity in Reburns Depends on Vegetation Type in Arizona and New Mexico, U.S.A." Forests 13, no. 11: 1957. https://doi.org/10.3390/f13111957