
The Relative Importance of Niche and Neutral Processes for the Community Assembly of Subtropical Karst Forest Communities at Different Spatial Scales

Abstract
:1. Introduction
2. Materials and Methods
2.1. Study Area
2.2. Field Sampling
2.3. Measurement of Environmental Factors
2.4. Statistical Analyses
2.4.1. Niche Models
2.4.2. Neutral Models
3. Results
3.1. Patterns of Species Abundance Distributions
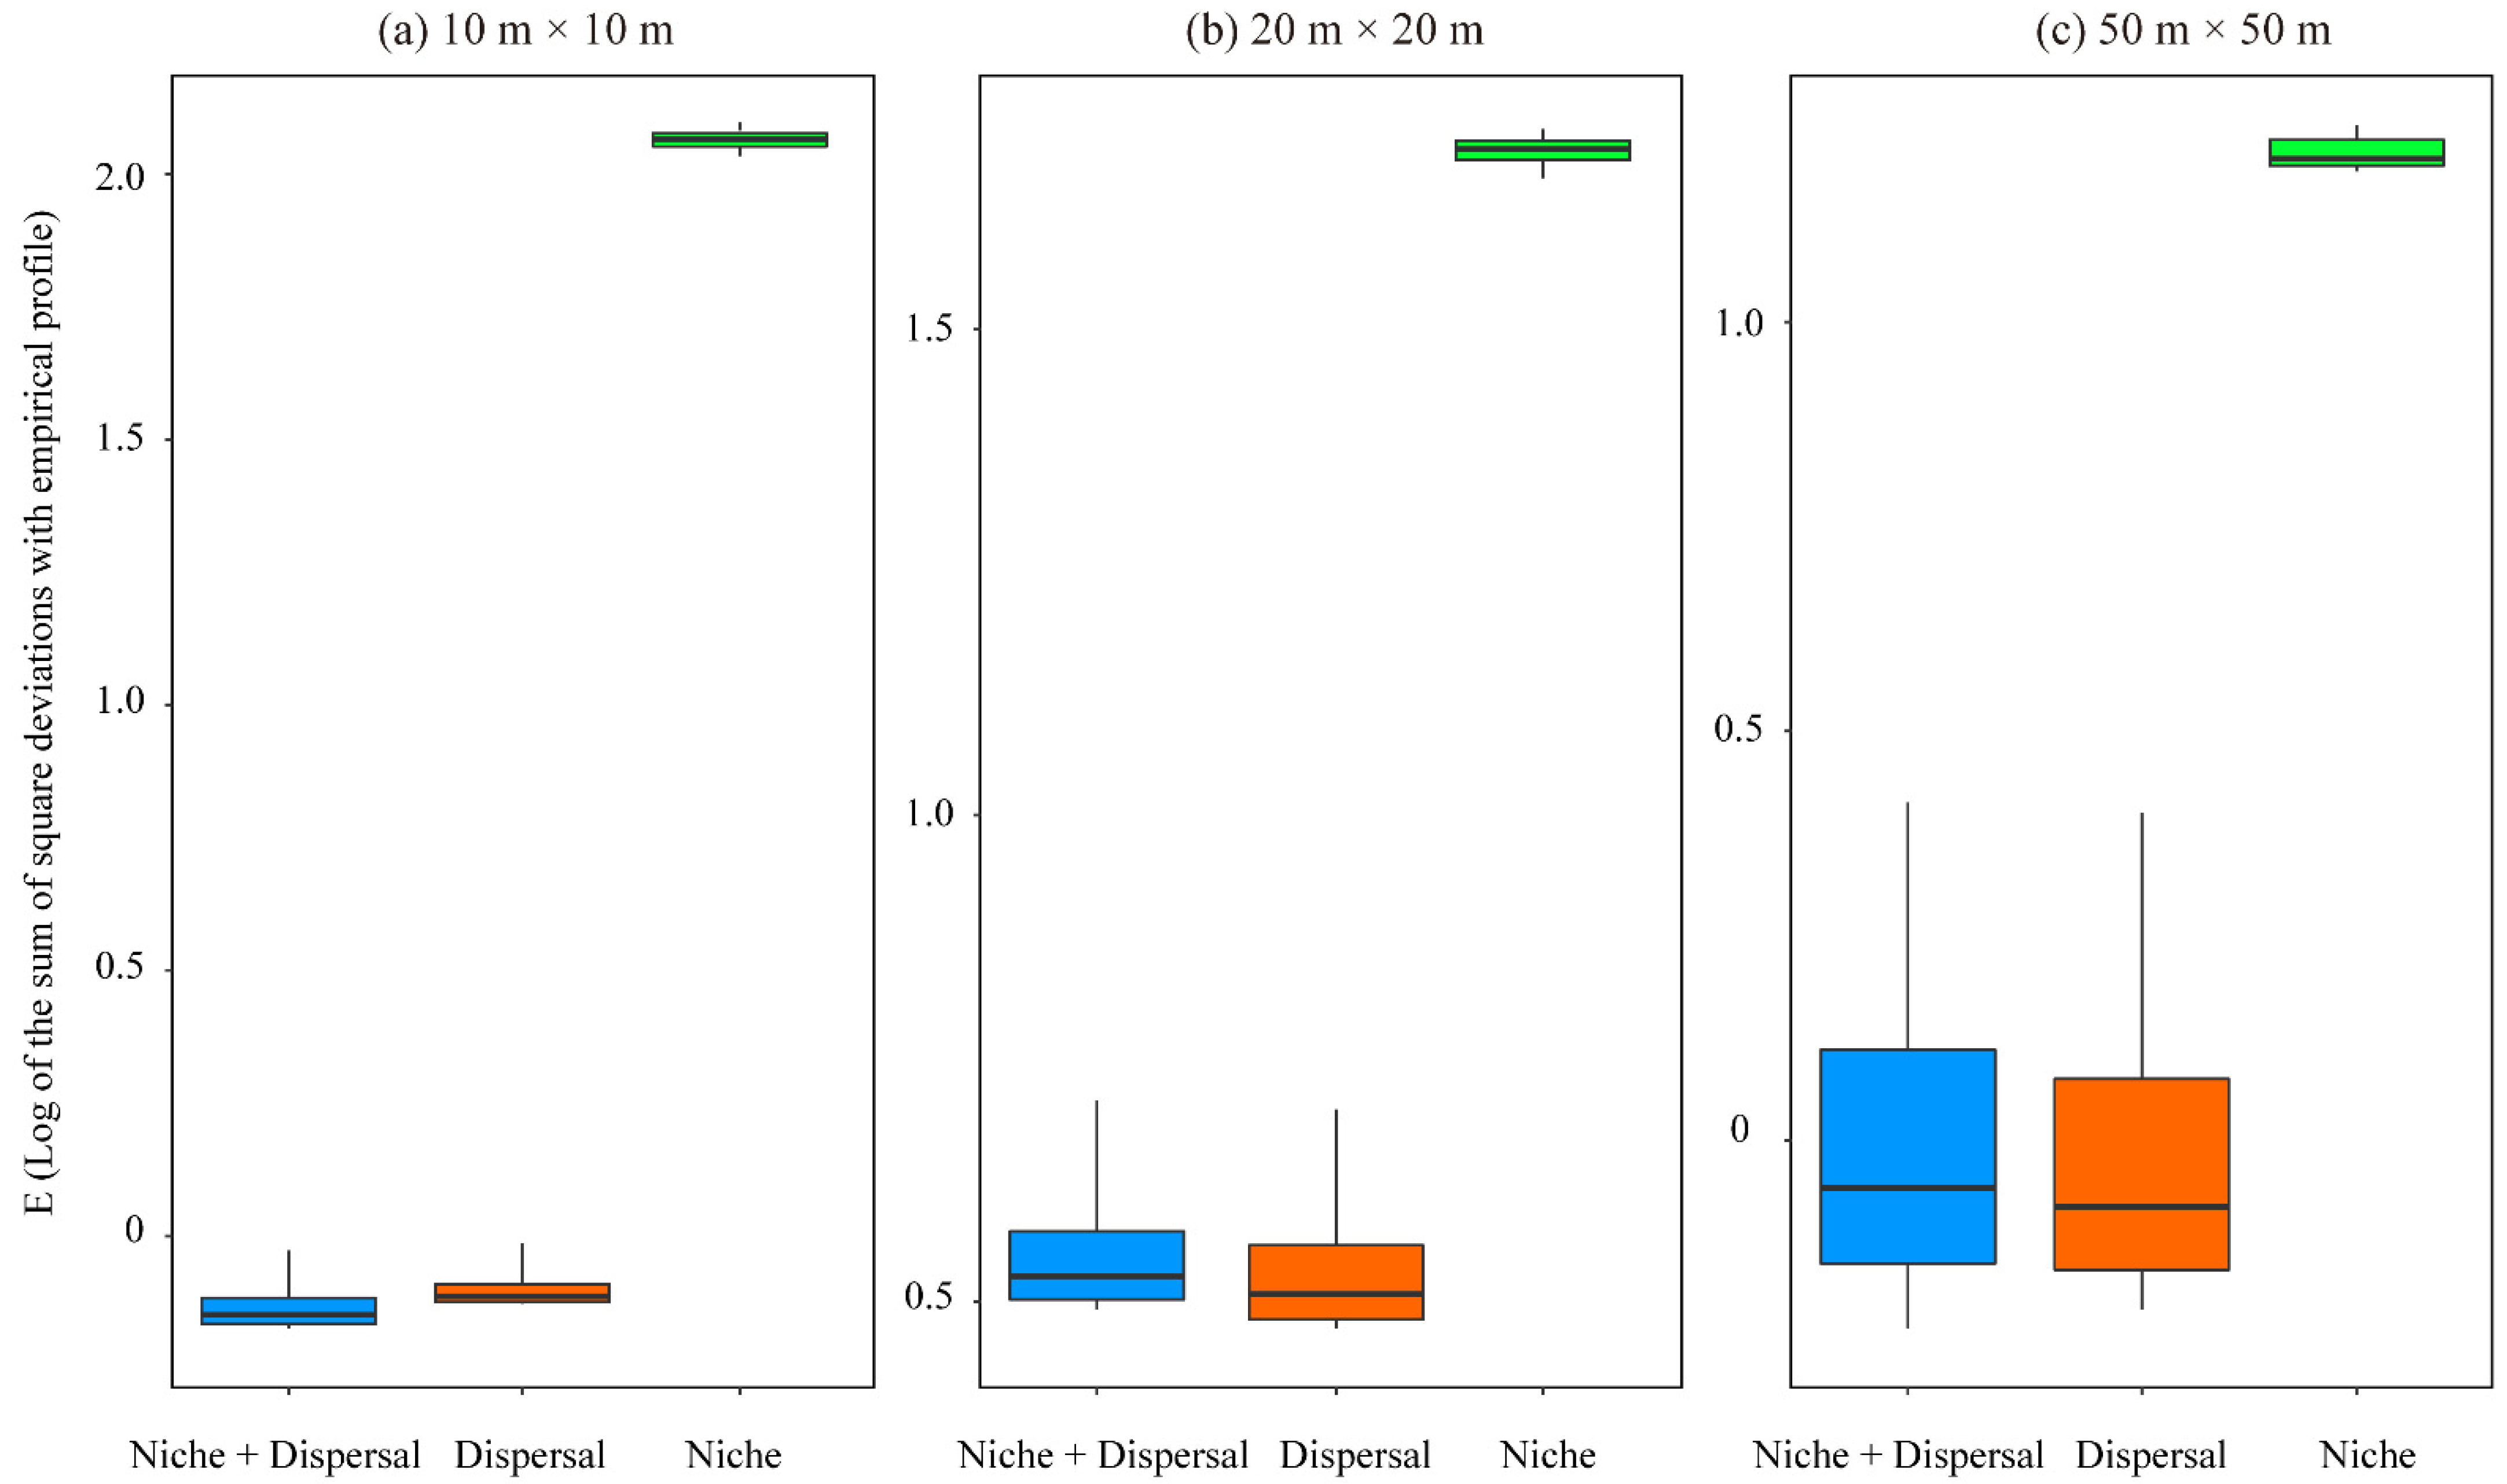
3.2. The PER-SIMPER Analysis of Simulated Species Distributions
4. Discussion
4.1. Scale Dependence of Community Assembly in Subtropical Karst Forests
4.2. The Neutral Process Plays a Dominant Role in Subtropical Karst Forests
5. Conclusions
Author Contributions
Funding
Institutional Review Board Statement
Informed Consent Statement
Data Availability Statement
Acknowledgments
Conflicts of Interest
Appendix A
Data Preparation before the PER-SIMPER Analysis

| Scale | Group | R2 | p |
|---|---|---|---|
| 10 m × 10 m | 2 | 0.026 | 0.001 *** |
| 20 m × 20 m | 2 | 0.429 | 0.001 *** |
| 50 m × 50 m | 2 | 0.538 | 0.048 * |
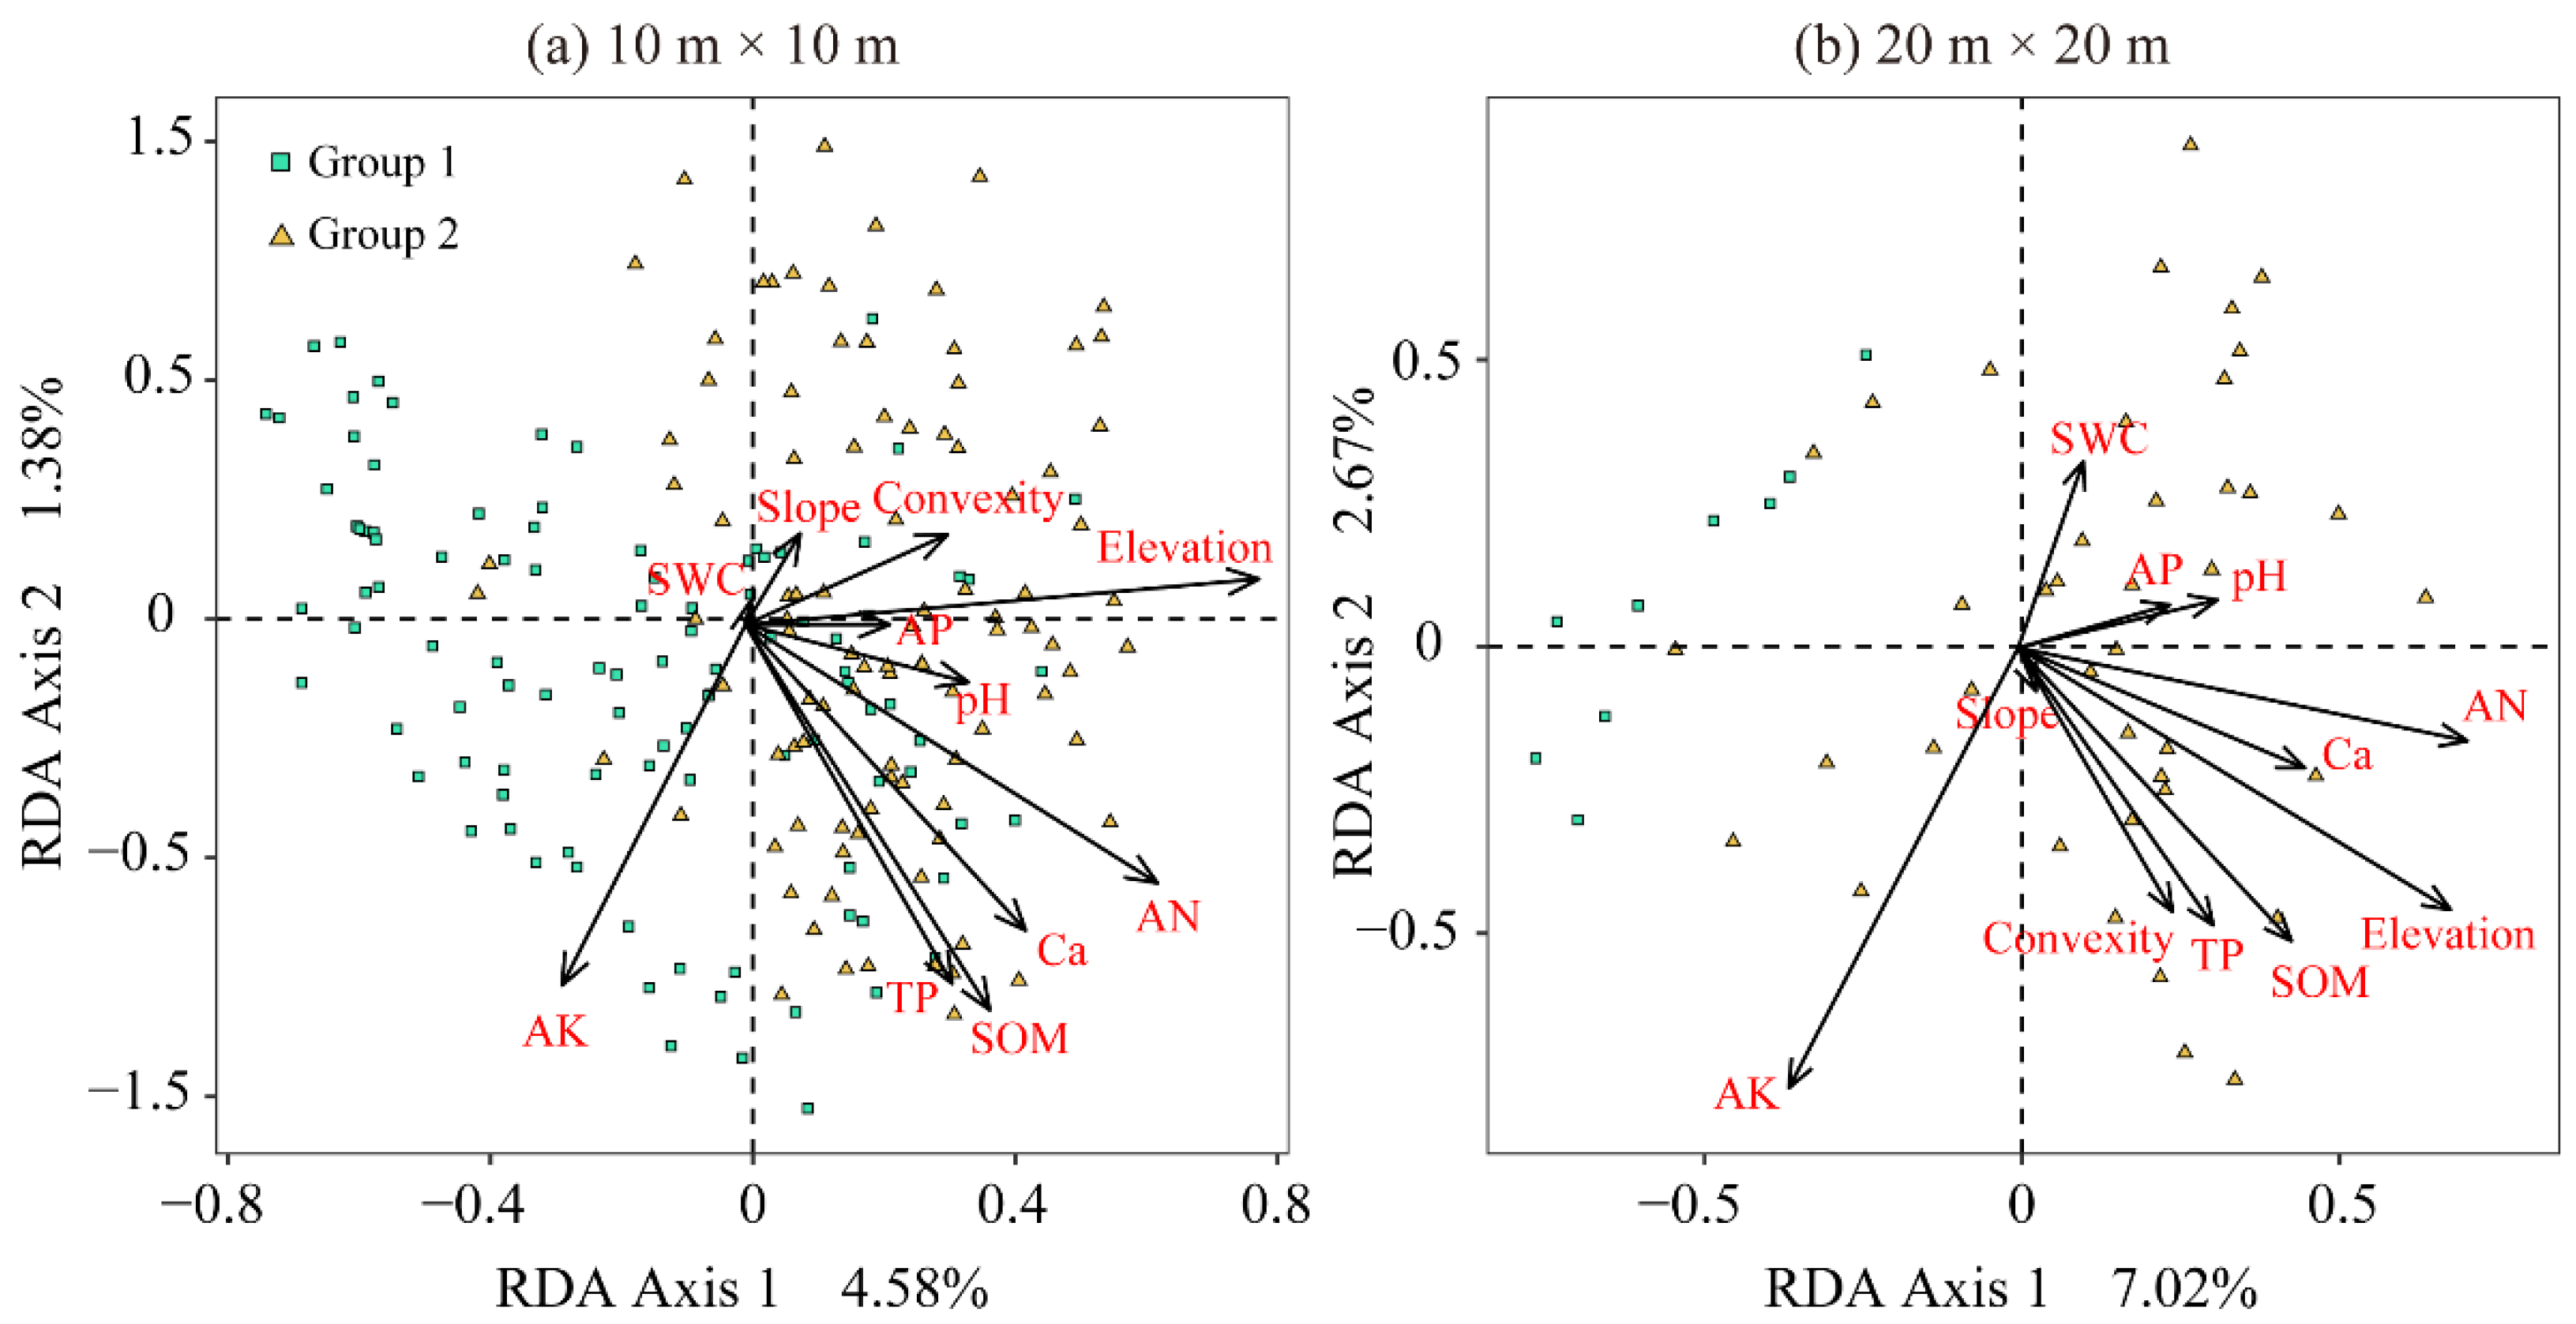
Appendix B
Redundancy Analysis (RDA) Ordination between SADs and Environmental Variables

References
- Meszéna, G.; Gyllenberg, M.; Pásztor, L.; Metz, J.A. Competitive exclusion and limiting similarity: A unified theory. Theor. Popul. Biol. 2006, 69, 68–87. [Google Scholar] [CrossRef] [PubMed] [Green Version]
- Albuquerque, U.P.; Nascimento, A.L.B.D.; Chaves, L.D.S.; Feitosa, I.S.; de Moura, J.M.B.; Gonçalves, P.H.S.; da Silva, R.H.; da Silva, T.C.; Ferreira, W.S. A brief introduction to niche construction theory for ecologists and conservationists. Biol. Conserv. 2019, 237, 50–56. [Google Scholar] [CrossRef]
- Koffel, T.; Daufresne, T.; Klausmeier, C.A. From competition to facilitation and mutualism: A general theory of the niche. Ecol. Monogr. 2021, 91, e01458. [Google Scholar] [CrossRef]
- Pos, E.; Guevara, J.E.; Molino, J.; Sabatier, D.; Bánki, O.; Pitman, N.C.; Mogollón, H.F.; García-Villacorta, R.; Neill, D.; Phillips, O.L.; et al. Scaling issues of neutral theory reveal violations of ecological equivalence for dominant Amazonian tree species. Ecol. Lett. 2019, 22, 1072–1082. [Google Scholar] [CrossRef] [PubMed]
- Anceschi, N.; Hidalgo, J.; Plata, C.A.; Bellini, T.; Maritan, A.; Suweis, S. Neutral and niche forces as drivers of species selection. J. Theor. Biol. 2019, 483, 109969. [Google Scholar] [CrossRef]
- Deng, N.; Song, Q.; Ma, F.; Tian, Y. Patterns and driving factors of diversity in the shrub community in central and southern China. Forests 2022, 13, 1090. [Google Scholar] [CrossRef]
- Huang, L.; Yang, H.; An, X.; Yu, Y.; Yu, L.; Huang, G.; Liu, X.; Chen, M.; Xue, Y. Species abundance distributions patterns between Tiankeng forests and nearby Non-Tiankeng forests in southwest China. Diversity 2022, 14, 64. [Google Scholar] [CrossRef]
- Tan, L.Z.; Zhang, P.; Zhao, X.H.; Fan, C.Y.; Zhang, C.Y.; Yan, Y.; Gadow, K.V. Analysing species abundance distribution patterns across sampling scales in three natural forests in Northeastern China. iForest-Biogeosci. For. 2020, 13, 482–489. [Google Scholar] [CrossRef]
- Adler, P.B.; Fajardo, A.; Kleinhesselink, A.R.; Kraft, N.J.B. Trait-based tests of coexistence mechanisms. Ecol. Lett. 2013, 16, 1294–1306. [Google Scholar] [CrossRef]
- Fang, X.F.; Shen, G.C.; Yang, Q.S.; Liu, H.L.; Ma, Z.P.; Deane, D.C.; Wang, X.H. Habitat heterogeneity explains mosaics of evergreen and deciduous trees at local-scales in a subtropical evergreen broad-leaved forest. J. Veg. Sci. 2017, 28, 379–388. [Google Scholar] [CrossRef]
- McGill, B.J.; Etienne, R.; Gray, J.S.; Alonso, D.; Anderson, M.J.; Benecha, H.K.; Dornelas, M.; Enquist, B.; Green, J.L.; He, F.; et al. Species abundance distributions: Moving beyond single prediction theories to integration within an ecological framework. Ecol. Lett. 2007, 10, 995–1015. [Google Scholar] [CrossRef] [PubMed]
- Shipley, B.; Paine, C.E.T.; Baraloto, C. Quantifying the importance of local niche-based and stochastic processes to tropical tree community assembly. Ecology 2012, 93, 760–769. [Google Scholar] [CrossRef] [PubMed] [Green Version]
- Wiegand, T.; Uriarte, M.; Kraft, N.; Shen, G.; Wang, X.; He, F. Spatially explicit metrics of species diversity, functional diversity, and phylogenetic diversity: Insights into plant community assembly processes. Annu. Rev. Ecol. Syst. 2017, 48, 329–351. [Google Scholar] [CrossRef] [Green Version]
- Condit, R.; Pitman, N.; Leigh, E.G.; Chave, J.; Terborgh, J.; Foster, R.B.; Núñez, P.; Aguilar, S.; Valencia, R.; Villa, G.; et al. Beta-diversity in tropical forest trees. Science 2002, 295, 666–669. [Google Scholar] [CrossRef] [PubMed] [Green Version]
- Guo, Y.; Wang, B.; Li, D.; Mallik, A.U.; Xiang, W.; Ding, T.; Wen, S.; Lu, S.; Huang, F.; He, Y.; et al. Effects of topography and spatial processes on structuring tree species composition in a diverse heterogeneous tropical karst seasonal rainforest. Flora 2017, 231, 21–28. [Google Scholar] [CrossRef]
- Wu, A.; Deng, X.; He, H.; Ren, X.; Jing, Y.; Xiang, W.; Ouyang, S.; Yan, W.; Fang, X. Responses of species abundance distribution patterns to spatial scaling in subtropical secondary forests. Ecol. Evol. 2019, 9, 5338–5347. [Google Scholar] [CrossRef] [PubMed]
- Villa, P.M.; Martins, S.V.; Rodrigues, A.C.; Safar, N.V.H.; Bonilla, M.A.C.; Ali, A. Testing species abundance distribution models in tropical forest successions: Implications for fine-scale passive restoration. Ecol. Eng. 2019, 135, 28–35. [Google Scholar] [CrossRef]
- Ulrich, W.; Soliveres, S.; Thomas, A.D.; Dougill, A.J.; Maestre, F.T. Environmental correlates of species rank—Abundance distributions in global drylands. Perspect. PlantEcol. Evol. Syst. 2016, 20, 56–64. [Google Scholar] [CrossRef] [Green Version]
- Liu, C.N.; Huang, Y.; Wu, F.; Liu, W.J.; Ning, Y.Q.; Huang, Z.R.; Tang, S.Q.; Liang, Y. Plant adaptability in karst regions. J. Plant Res. 2021, 134, 889–906. [Google Scholar] [CrossRef]
- Du, H.; Peng, W.X.; Song, T.Q.; Zeng, F.P.; Wang, K.L.; Song, M.; Zhang, H. Spatial pattern of woody plants and their environmental interpretation in the karst forest of southwest China. Plant Biosyst. Int. J. Deal. All Asp. Plant Biol. 2015, 149, 121–130. [Google Scholar] [CrossRef]
- He, Y.; Liang, S.; Liu, R.; Jiang, Y. Beta diversity patterns unlock the community assembly of woody plant communities in the riparian zone. Forests 2022, 13, 673. [Google Scholar] [CrossRef]
- Bao, S.D. Soil Agrochemical Analysis; China Agriculture Press: Beijing, China, 2000. (In Chinese) [Google Scholar]
- Harms, K.E.; Condit, R.; Hubbell, S.P.; Foster, R.B. Habitat associations of trees and shrubs in a 50-ha neotropical forest plot. J. Ecol. 2001, 89, 947–959. [Google Scholar] [CrossRef]
- Valencia, R.; Foster, R.B.; Villa, G.; Condit, R.; Svenning, J.C.; Hernández, C.; Romoleroux, K.; Losos, E.; Magård, E.; Balslev, H. Tree species distributions and local habitat variation in the Amazon: Large forest plot in eastern Ecuador. J. Ecol. 2004, 92, 214–229. [Google Scholar] [CrossRef]
- MacArthur, R.H. On the relative abundance of bird species. Proc. Natl. Acad. Sci. USA 1957, 43, 293–295. [Google Scholar] [CrossRef] [PubMed] [Green Version]
- Motonura, I. On the statistical treatment of communities. Zool. Mag. 1932, 44, 379–383. [Google Scholar]
- Hubbell, S.P. The Unified Neutral Theory of Biodiversity and Biogeography; Princeton University Press: Princeton, NJ, USA, 2001. [Google Scholar]
- Volkov, I.; Banavar, J.R.; Hubbell, S.P.; Maritan, A. Neutral theory and relative species abundance in ecology. Nature 2003, 424, 1035–1037. [Google Scholar] [CrossRef] [Green Version]
- Gibert, C.; Escarguel, G.; Lyons, K. PER-SIMPER—A new tool for inferring community assembly processes from taxon occurrences. Glob. Ecol. Biogeogr. 2019, 28, 374–385. [Google Scholar] [CrossRef]
- R Core Team. R: A Language and Environment for Statistical Computing; R Foundation for Statistical Computing: Vienna, Austria, 2021; Available online: https://www.R-project.org/ (accessed on 10 October 2021).
- Cayuela, L.; Macarro, I.; Stein, A.; Oksanen, J. Taxonstand: Taxonomic Standardization of Plant Species Names. R Package Version 2.4. 2021. Available online: https://CRAN.R-project.org/package=Taxonstand (accessed on 10 May 2021).
- Prado, P.I.; Miranda, M.D.; Chalom, A. SADs: Maximum Likelihood Models for Species Abundance Distributions. R Package Version 0.4.2. 2018. Available online: https://CRAN.R-project.org/package=sads (accessed on 16 June 2018).
- Chase, J.M. Spatial scale resolves the niche versus neutral theory debate. J. Veg. Sci. 2014, 25, 319–322. [Google Scholar] [CrossRef]
- Volkov, I.; Banavar, J.; He, F.; Hubbell, S.P.; Martin, A. Density dependence explains tree species abundance and diversity in tropical forests. Nature 2005, 438, 658–661. [Google Scholar] [CrossRef]
- Aarssen, L.W. Ecological combining ability and competitive combining ability in plants: Toward a general evolutionary theory of coexistence in systems of competition. Am. Nat. 1983, 122, 707–731. [Google Scholar] [CrossRef] [Green Version]
- Kim, D.; Ohr, S. Coexistence of plant species under harsh environmental conditions: An evaluation of niche differentiation and stochasticity along salt marsh creeks. J. Ecol. Environ. 2020, 44, 19. [Google Scholar] [CrossRef]
- Breugel, M.; Craven, D.; Lai, H.R.; Baillon, M.; Turner, B.L.; Hall, J.S. Soil nutrients and dispersal limitation shape compositional variation in secondary tropical forests across multiple scales. J. Ecol. 2019, 107, 566–581. [Google Scholar] [CrossRef]
- Gravel, D.; Canham, C.D.; Beaudet, M.; Messier, C. Reconciling niche and neutrality: The continuum hypothesis. Ecol. Lett. 2006, 9, 399–409. [Google Scholar] [CrossRef] [PubMed] [Green Version]
- Wang, X.Z.; Ellwood, M.D.F.; Ai, D.; Zhang, R.; Wang, G. Species abundance distributions as a proxy for the niche–neutrality continuum. J. Plant Ecol. 2018, 11, 445–452. [Google Scholar] [CrossRef] [Green Version]
- Furniss, T.J.; Larson, A.J.; Lutz, J.A. Reconciling niches and neutrality in a subalpine temperate forest. Ecosphere 2017, 8, e01847. [Google Scholar] [CrossRef]
- Matthews, T.J.; Whittaker, R.J. Fitting and comparing competing models of the species abundance distribution: Assessment and prospect. Front. Biogeogr. 2014, 6, 67–82. [Google Scholar] [CrossRef] [Green Version]
- Butaye, J.; Jacquemyn, H.; Honnay, O.; Hermy, M. The species pool concept applied to forests in a fragmented landscape: Dispersal limitation versus habitat limitation. J. Veg. Sci. 2002, 13, 27–34. [Google Scholar] [CrossRef]
- Lauri, L.; Riin, T.; Inga, H.; Robert, S.K.; Antonio, G.; Meelis, P. Microfragmentation concept explains non-positive environmental heterogeneity-diversity relationships. Oecologia 2013, 171, 217–226. [Google Scholar] [CrossRef]
- Herrera, J.M.; Garc’ia, D. Effects of forest fragmentation on seed dispersal and seedling establishment in ornithochorous trees. Conserv. Biol. 2010, 24, 1089–1098. [Google Scholar] [CrossRef]
- Zeleny, D. TwinspanR: Two-Way Indicator Species Analysis (and Its Modified Version) in R. R Package Version 0.22. 2021. Available online: https://github.com/zdealveindy/twinspanR (accessed on 19 February 2021).


| Scale | BSM | NPM | MZMM | VM | ||||
|---|---|---|---|---|---|---|---|---|
| AIC | D | AIC | D | AIC | D | AIC | D | |
| 10 m × 10 m | 89.65 | 0.30 | 90.94 | 0.30 | 30.97 | 0.10 | 32.89 | 0.10 |
| 20 m × 20 m | 464.52 | 0.22 | 464.69 | 0.32 | 96.08 | 0.05 | 97.89 | 0.05 |
| 50 m × 50 m | 3530.79 | 0.32 * | 3414.91 | 0.36 *** | 303.31 | 0.08 | 304.83 | 0.08 |
Publisher’s Note: MDPI stays neutral with regard to jurisdictional claims in published maps and institutional affiliations. |
© 2022 by the authors. Licensee MDPI, Basel, Switzerland. This article is an open access article distributed under the terms and conditions of the Creative Commons Attribution (CC BY) license (https://creativecommons.org/licenses/by/4.0/).
Share and Cite
He, Y.; Liang, S.; Jiang, Y.; Ning, W. The Relative Importance of Niche and Neutral Processes for the Community Assembly of Subtropical Karst Forest Communities at Different Spatial Scales. Forests 2022, 13, 1930. https://doi.org/10.3390/f13111930
He Y, Liang S, Jiang Y, Ning W. The Relative Importance of Niche and Neutral Processes for the Community Assembly of Subtropical Karst Forest Communities at Different Spatial Scales. Forests. 2022; 13(11):1930. https://doi.org/10.3390/f13111930
Chicago/Turabian StyleHe, Yan, Shichu Liang, Yong Jiang, and Wenyan Ning. 2022. "The Relative Importance of Niche and Neutral Processes for the Community Assembly of Subtropical Karst Forest Communities at Different Spatial Scales" Forests 13, no. 11: 1930. https://doi.org/10.3390/f13111930