


Assessing Social Values for Ecosystem Services in Rural Areas Based on the SolVES Model: A Case Study from Nanjing, China
School of Architecture, Southeast University, Nanjing 210096, China
*
Author to whom correspondence should be addressed.
Forests 2022, 13(11), 1877; https://doi.org/10.3390/f13111877
Submission received: 20 October 2022
/
Revised: 6 November 2022
/
Accepted: 8 November 2022
/
Published: 9 November 2022
(This article belongs to the Topic Sustainable Landscape in Rural Areas: Theories, Strategies, and Practices)
Abstract
:Assessing social values attributed to ecosystem services based on the Social Values for Ecosystem Services (SolVES) model helps ecosystems to provide services sustainably, including land and forest products and non-material services. Currently, urbanization has accelerated the deterioration of rural environments, which affects the supply of social values for rural ecosystem services. How to scientifically assess the social values for ecosystem services in rural areas remains to be studied. In addition, there are significant differences in the perceptions of social value among stakeholder groups. Therefore, this study aims to provide a complete and systematic approach to identify the social value of complex and specific rural ecosystem services and to fill the gap in the research of perceived differences among stakeholder groups in rural areas. On the basis of building environmental raster datasets on a village scale, this research applies the SolVES model to evaluate social values in the Paifang rural community. Results show that aesthetic, health care, recreation, and biodiversity values are highly regarded in rural areas. The normalized difference vegetation index, the distance to rural settlements, the distance to tourist attractions, and the distance to agricultural production spaces can improve the evaluation accuracy, and the level of social values can be predicted by certain environmental variables. The spatial distribution of social values and the degree of attention paid to the biodiversity value, and the trade-off between the aesthetic and biodiversity value are the main perception differences between villagers and tourists. This research contributes to ecological construction and sustainable development in rural areas.
1. Introduction
The term “ecosystem services (ES)” refers to the products or benefits that humans directly or indirectly obtain from the ecosystem for their survival and development [1], including tangible material resources and intangible spiritual services. This concept is related to human well-being and is an embodiment of ecosystem functions in human society [2]. As human activities exert an increasing pressure on the ecosystem, the assessment of the ES value is critical in the management of environmental resources such as forests [3]. A comprehensive assessment of ES is based on a wide variety of natural and social information [4]. However, scholars mostly rely on the economic evaluation methods, ignoring the non-market value perceived by humans that is difficult to quantify, namely the social value for ES, which usually corresponds to specific cultural ES, such as aesthetics and recreation [5,6]. This concept of social value evolved from the earlier idea of forest value [7]. After being modified and verified by Brown and Reed [8], the concept was gradually applied in obtaining social value information to support ES-based ecosystem management [9]. Human society is an important component of nature and is closely related to the ecosystem. However, traditional economics methods not only disconnect humankind from nature, but also fail to reflect the spatial heterogeneity of ES. Therefore, it is necessary to propose a non-monetary approach to assess ES value from the perspective of society and space.
The emergence of the SolVES model (Social Values for Ecosystem Services model) marks the shift of ES assessment from an economics approach to a focus on social attributes and spatial heterogeneity. It provides quantitative, spatially explicit indicators that can reflect stakeholder preferences, solving the shortcomings of the economics methods [3]. Currently, the SolVES model mainly covers objects such as national parks [6], national forests [10], urban riverfront space [11], and urban parks [12], but pays little attention to rural areas. Among the existing studies, Makovnikova J et al. guided the sustainable development of agricultural land by analyzing the recreation potential [13]. Petway et al. assessed the value of seven agricultural intangible cultural ecosystem services [14]. However, these studies on the social values for rural ES are still in the early stages, and the types of social value assessed lack completeness. Moreover, the SolVES model requires spatial data that accurately express the environmental characteristics of the study area; however, previous studies have not fully considered rural environment.
Since the beginning of the 21st century, rural sustainable development has received global attention, and industrialization and urban expansion have affected the diversity of the rural ecosystem [15]. Irrational rural construction will encroach on the capital on which people depend on for their livelihoods, such as land and forest products [16]. Rural areas are faced with the challenge of land conversion and shrinkage, which raises people’s concerns about the protection of arable land, loss of open space, and environmental degradation [17]. This is especially true in developing countries, such as China, where the village area reaches 53.7% of the total construction land area, and the rural population accounts for 36.1% of the total population, so people are increasingly aware of the significance of ecological quality improvement for sustainable rural development [18]. Ecological problems in rural areas have become a significant factor affecting the natural environment and economic development globally. Meanwhile, the ES value of the countryside is not only reflected as a production space, but as also an aesthetic object, a spiritual belonging, and a material carrier of environment protection, reflecting multiple values [19]. Therefore, in order to improve ecosystem functions and realize the sustainable development of ecology, society, and economy in rural areas, it is necessary to coordinate human perception with the ecological goals of rural areas and seek a better approach for scientifically evaluating the social values for rural ES.
Social values for ES are closely related to environmental variables. In applying the SolVES model, the selection of different variables in the environmental raster datasets have different impacts on the results of social value assessment [11], and a more accurate and comprehensive selection of variables can enhance the model’s credibility [20]. At present, on the basis of the research of Sherruse et al. [11], most studies screen the environmental factors for the SolVES model according to the environmental characteristics of different objects and generalize the evaluation results to other areas [21]. However, previous studies have failed to select suitable environmental variables for rural areas, and the spatial data involved are still factors applied to cities, such as elevation (ELEV), slope (SLPOE), and distance to road (DTR). The rural ecosystem is a complex ecosystem covering the relationships among humans, nature, and society in a specific region [22]. Natural factors related to terrain, hydrology, and vegetation, as well as human factors related to economy and culture are all important components of rural environmental factors. Assessing the social values for rural ESs needs to reflect the overall situation of the rural ecosystem. In addition, rural areas are significantly different from urban areas in terms of cultural background, production mode, and lifestyle, with environmental characteristics different from those of the highly artificial urban ecosystem. The practice of directly applying the urban environmental variables to rural areas ignores the particularity of rural ecosystems, which is not conducive to sustainable development. Perceiving and expressing the character of the rural community from a spatial perspective is a fundamental issue for conducting research on the rural ecosystem [23]. Therefore, it is necessary to establish a more complete environmental raster dataset from the aspects of the integrity and particularity of the rural ecosystem, so that the assessment results can be more realistic and fit the environmental characteristics of rural areas.
In addition, there is a spatial scale effect in rural ecology studies, where the scale affects the determination of the ES indicators [24], and the content and quantity of the spatial data also change with the scale. Therefore, environmental variables should be screened based on the premise of scale determination so that the datasets of the SolVES model can be better adapted to the regions with similar scales and environmental conditions. Villages are the basic socio-economic units of rural areas, representing the unique regional resources of each region. In the practice of space governance and land management in rural areas, the village scale is usually taken as the basic unit, and the rural spatial optimization at the village level promotes the improvement in the rural spatial governance system in which regions, villages and plots are interconnected [25]. Therefore, based on the objects of this case study, this paper aims to build environmental raster datasets on a village scale.
Furthermore, the perception of social values is influenced by stakeholders, who refer to individuals or groups that affect or are affected by ES. The perception differences among different stakeholder groups will affect the results of the assessment of social values for ES [26]. However, at present, the respondents in the assessment of social values for ES mainly come from a single group. A few studies compared the perception differences based on the attributes of individuals rather than at the level of different stakeholder groups [12,27], which cannot help to resolve the social conflicts that arise in the protection and restoration of ecosystem functions. Villagers and tourists are the two core stakeholder groups in rural areas, whose interests surrounding rural ecosystems are significantly different regarding environmental protection and economic development [28]. Therefore, it is necessary to distinguish between the perceptions of the two groups, and accurately fulfill the public will of different sources into rural planning and management.
In conclusion, based on the selection of the environmental variables evaluated by the SolVES model suitable for rural areas, we compare the differences in the perceptions of social values between villagers and tourists and then propose rural spatial optimization strategies aimed at enhancing the social values for ES from the decision-making level. This makes up for the shortcomings of previous studies, where the concept of landscape ecology is difficult to directly implement in ecosystem planning and management [29]. This paper focuses on the Paifang rural community in Nanjing, China, with the following main purposes: (1) developing improved environmental raster datasets for the assessment of social values for rural ES on a village scale, assessing the social values for rural ES in the Paifang rural community; (2) introducing the perspective of different stakeholder groups for the assessment of social values for ESs in rural areas; (3) proposing the rural spatial optimization recommendations based on the assessment of social values for ES to promote rural sustainable development.
2. Materials and Methods
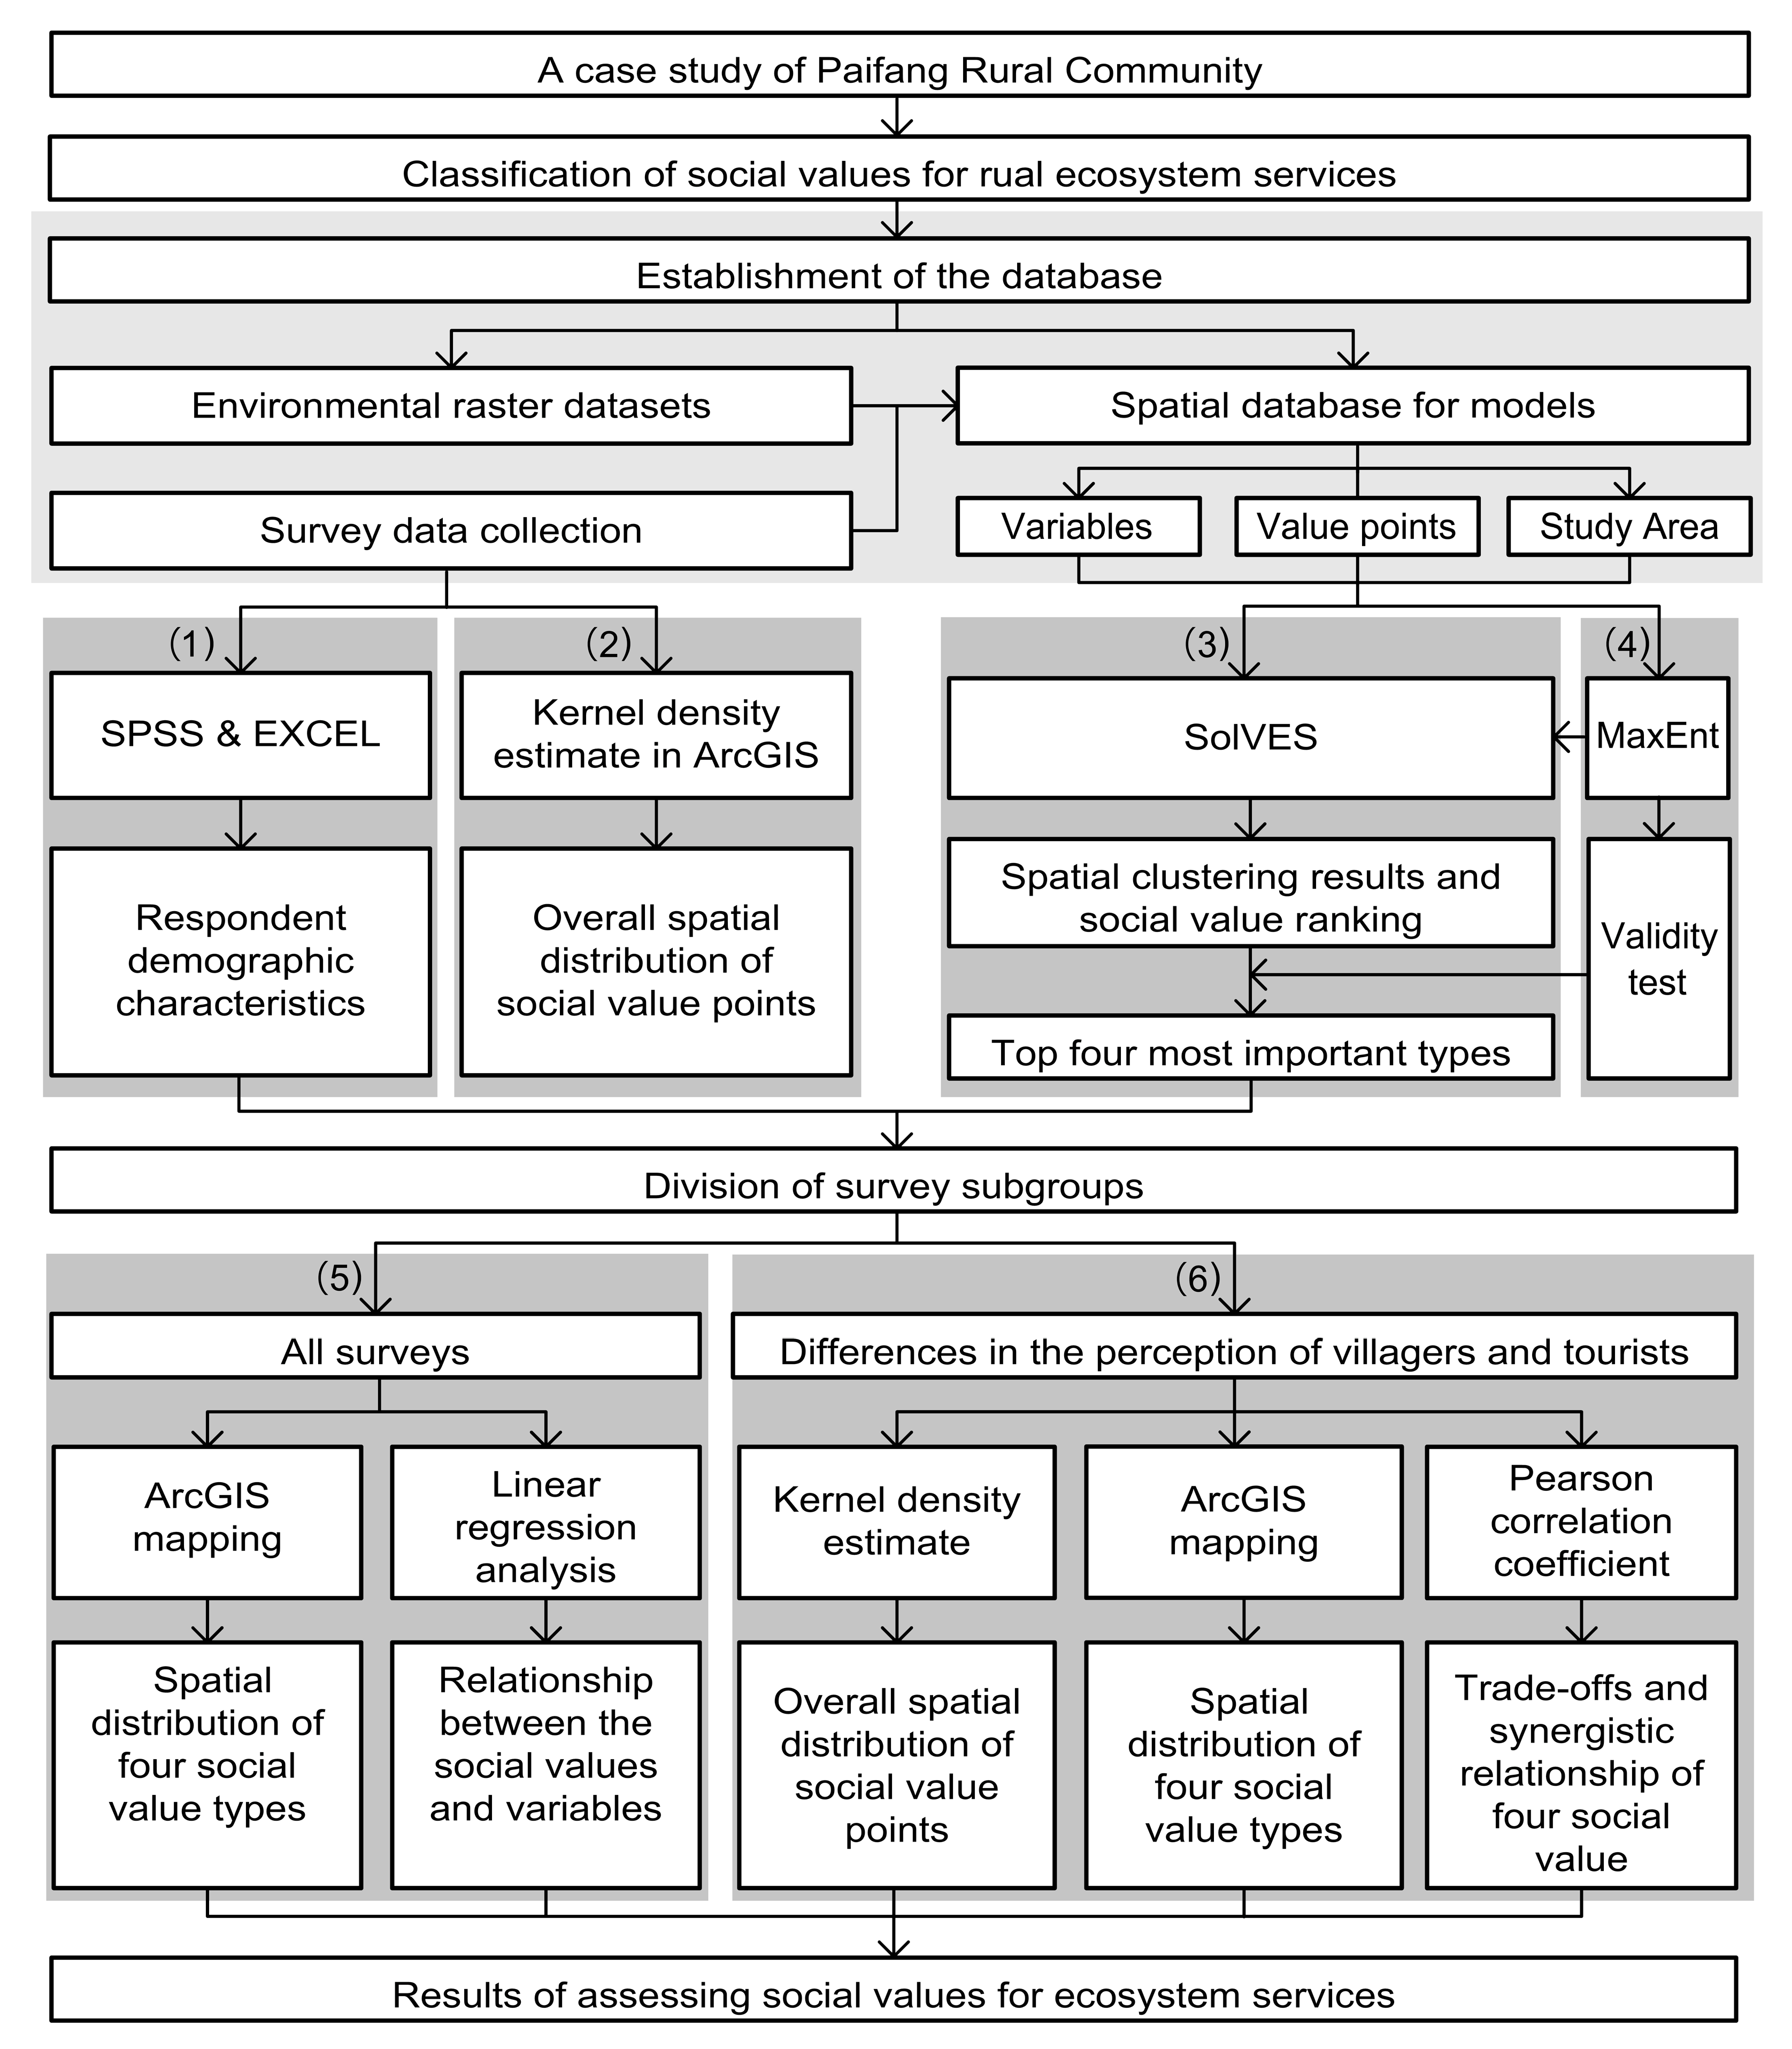
The research framework of assessing social values for rural ES was established in this paper, containing a complete process from the classification of social value types to the analysis of the data (Figure 1). The markers (1)–(6) in the figure correspond to the six steps of the data analysis. Additionally, all abbreviations in this section can be identified in p.
2.1. Types of Social Values for Rural Ecosystem Services
According to the definition and classification of cultural ES by the Millennium Ecosystem Assessment [4] and based on the widely applied value system in other studies [8,30], the social values for ES can be divided into more than a dozen types. However, the existing types of social value usually overlap and are correlated in connotation. For example, there is often synergy between cultural value and historic value. A more critical issue is that social values for rural ES enhancement needs to maintain the character of the rural community. Therefore, it is necessary to redefine the classification of the social values of rural ES with a description of each connotation.
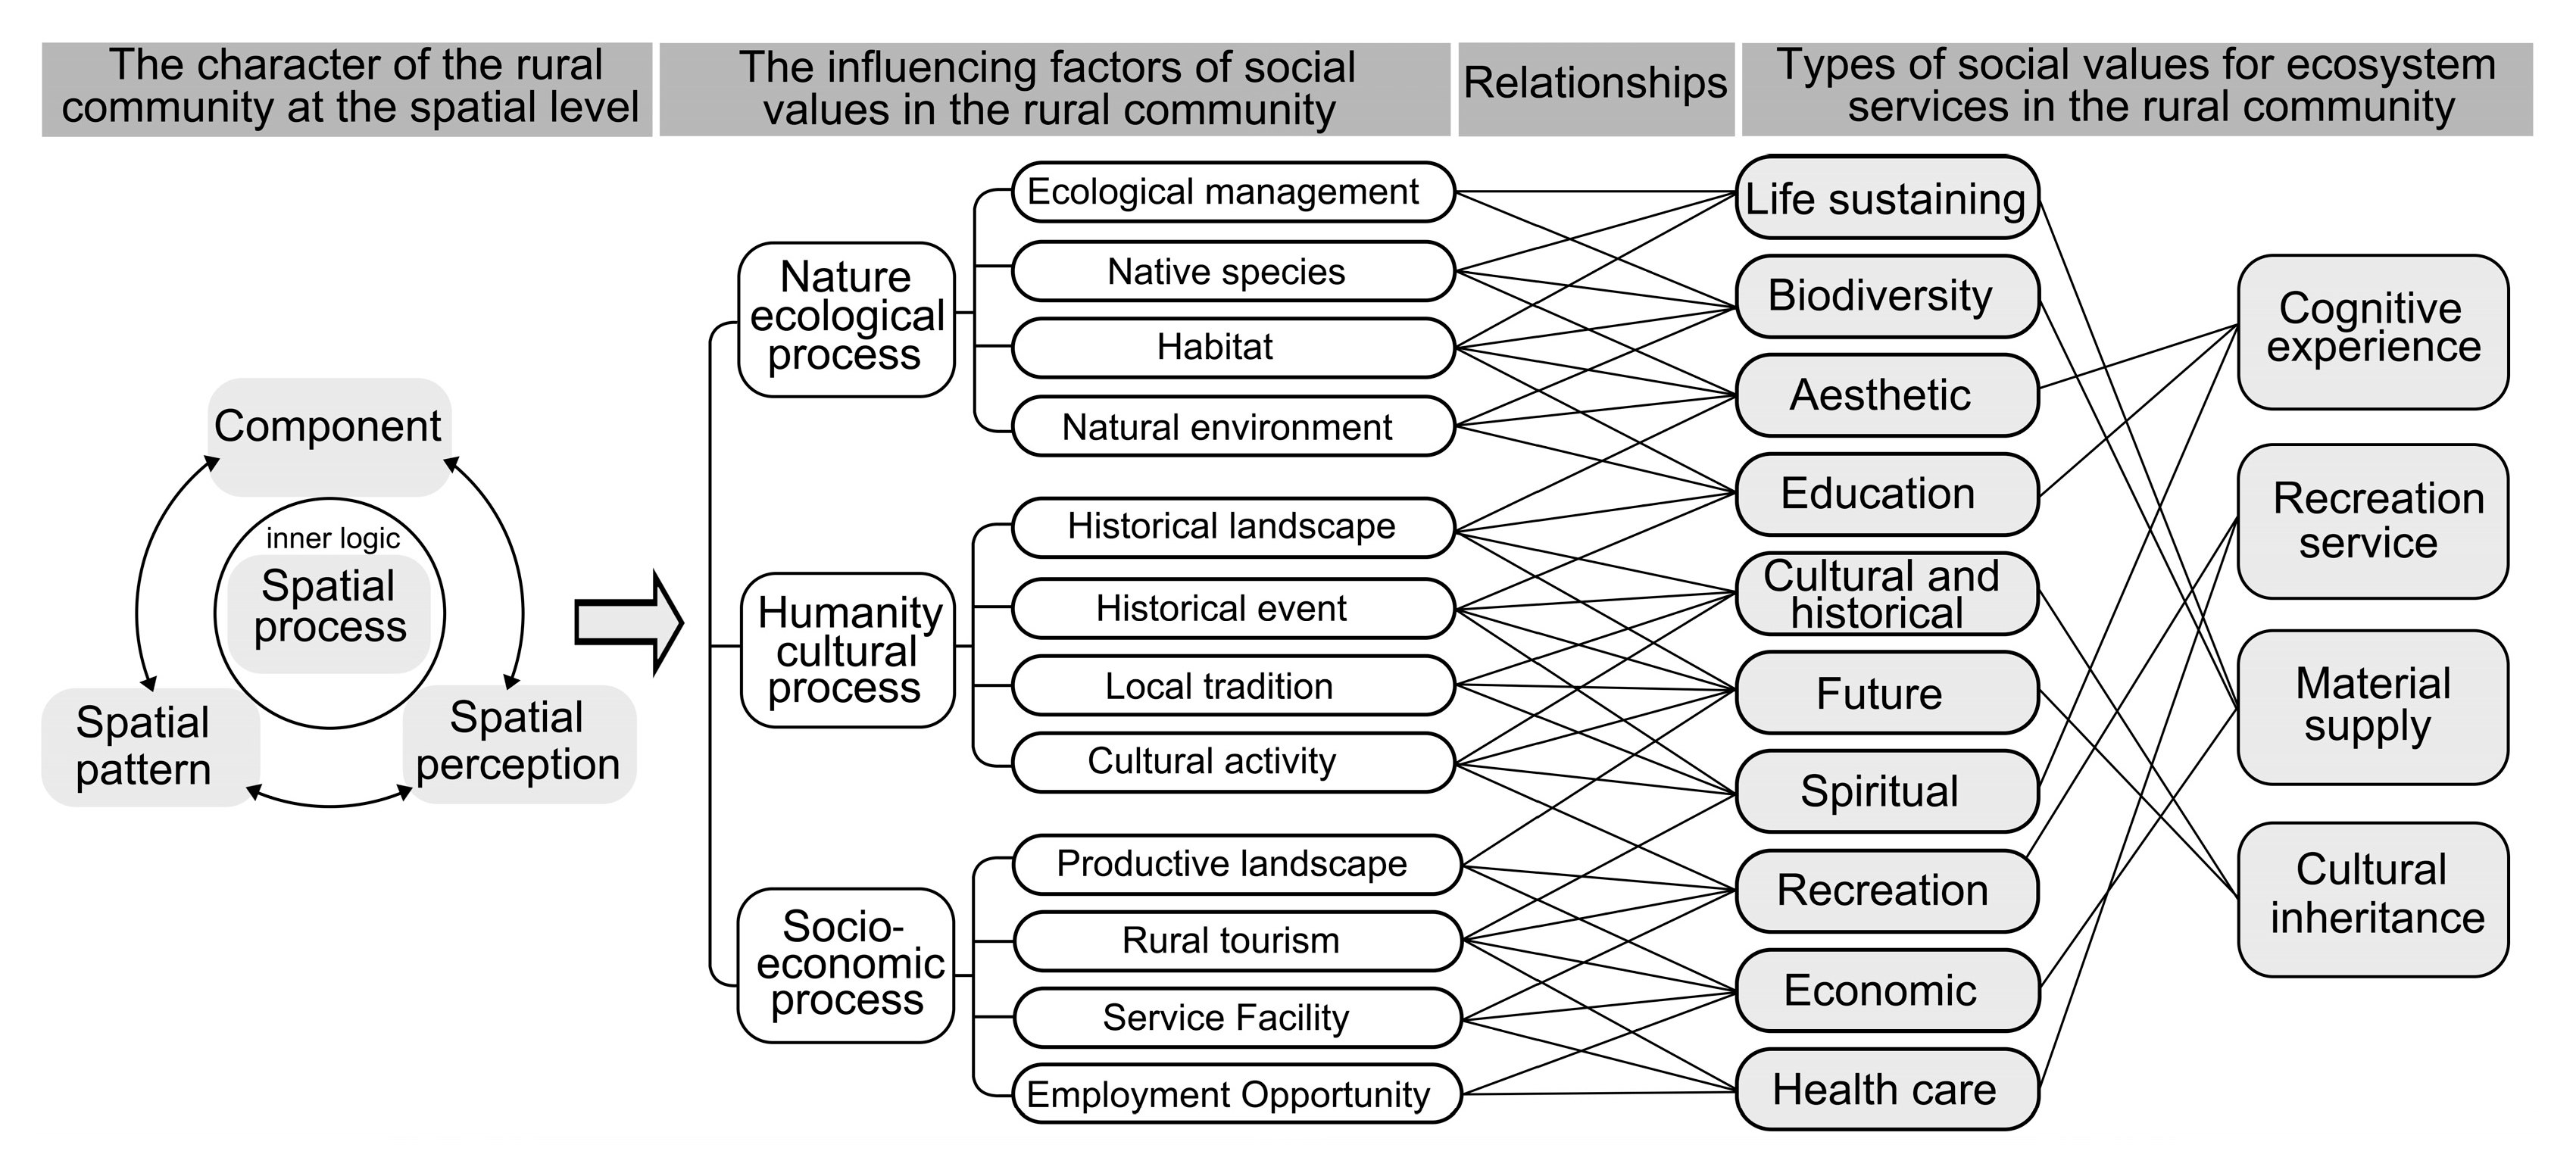
From the spatial perspective, the character of the rural community is mainly expressed in the rural landscape character in ecosystem management, and the rural landscape character is associated with the influencing factors of social values for rural ES. In the rural landscape character representation system [31], the component and spatial pattern are the core material factors that directly affect social values. The spatial perception can reflect the comprehensive evaluation of social values, and the spatial process reveals the dynamic laws of the ecosystem evolution process, which is the inner logic of the formation of the remaining three concepts. The spatial processes contain nature ecological processes, humanity cultural processes, and socio-economic processes [31], and the influencing factors of social values for rural ESs can be identified by sorting out spatial processes. This identification process can not only fully reveal the character of the rural community, but also build a bridge between the objective environmental conditions and ES functions. Therefore, this paper identified the influencing factors of social values for rural ES based on the rural landscape character representation system, and then adjusted the classification and connotation expression of social values for rural ES, finally dividing them into four levels, namely cultural inheritance, recreation service, cognitive experience, and material supply (Table 1). This classification system reflects the character of rural community in social values through influencing factors, and the relationship between them is depicted in Figure 2.
In the 10 secondary social value types, the value of the cultural and the historical, as well as the future value, are directly related to the humanistic component, which both emphasize the historical and cultural process of rural ecosystems, collectively referred to as the value of cultural inheritance. The recreation and health care values are related to similar component and spatial patterns, relying on rural public spaces as activity places, and can be summarized as the value of recreation service. The aesthetic, spiritual, and education value emphasize the intangible rural ES functions, such as rural image and homesickness, which are directly related to spatial perception, so they can be uniformly expressed as the value of the cognitive experience. The value of material supply covers sustainability of life, biodiversity, and economic value, which are directly related to the multiple ecological assets formed by spatial process.
2.2. The Environmental Raster Datasets for the SolVES Model in Rural Areas
Developed by the United States Geological Survey and Colorado State University, the SolVES model can be used to assess the social values for ESs based on the environmental raster datasets, vector data of study area, and survey data. According to a review on the application research of the SolVES model [6,10,12,13,14,31], the most commonly used variables in the environmental raster datasets include ELEV, SLOPE, DTR, distance to water (DTW), and land use and land cover (LULC). A few studies introduced variables such as landscape types (LT) and distance to coast (DTC) on this basis to improve the application of the model in some specific ecosystems [11,32]. The above variables are common in urban areas, but it is difficult to simply apply them to rural ecosystems.
According to the complex ecosystem theory, the rural ecosystem is composed of a rural resource subsystem, environment subsystem, society subsystem, and economic subsystem, and it not only has basic functions similar to the natural ecosystem but it is also significantly affected by human activities [22]. Therefore, in order to improve the environmental raster datasets for the assessment of social values for rural ES, it is necessary to reflect the overall situation of the rural ecosystem from both natural and anthropogenic variables. However, since there are many influencing factors for rural ecosystems, the datasets established should highlight the factors that play a leading role in rural areas. With the revival of the concept of rurality in recent years, definitions and measures of rurality are more and more widely used in the urban–rural division and rural space optimization [33], which helps to reflect the essential attributes of the rural ecosystem. Therefore, we improved the environmental raster datasets of the SolVES model by referring to the complex ecosystem theory and rurality measures.
Considering the environmental characteristics of rich vegetation resources in rural areas, among the natural variables, the normalized difference vegetation index (NDVI) is included to reflect the vegetation growth and coverage status, while the variables of ELEV, SLOPE, and DTW are retained to reflect the characteristics of complex terrain and numerous water bodies in rural areas. Rurality measures were found to represent the influence of human behavior and enhance the anthropogenic variables. Among the most common components used in rurality measures [34], the indicators related to population, land and industry are the core factors for the rurality measures on a small scale. Therefore, considering that distance is a parameter to effectively reflect the spatial relationship between social value points and variables, on the basis of selecting the common factors of LULC and DTR, this paper included the variables of distance to rural settlements (DTRS), distance to tourist attractions (DTTA), and distance to agricultural production space (DTAPS) as a supplement. Finally, the environmental raster datasets were established, consisting of two first-level variables and nine s-level variables (Table 2).
Among the newly included environmental factors, the NDVI can reveal the vegetation cover status of the land. Plants not only play the role of producers in the ecosystem, but are also some of the important elements constituting the rural ecological landscape. By reflecting the influence of vegetation cover on the perception of species diversity and plant landscape, NVDI is fundamental in the assessment of social values for rural ES. DTRS reflects the aggregation of rural population and the interaction process between human activities and the environment [35]. Rural settlements are important carriers of the historical and cultural evolution of rural areas, the distance to which affects the perception of social values regarding local customs and historical landscape, which is also related to the allocation of land resources. DTTA reflects the distribution of tourism resources in rural areas. Because rural tourism is regarded as an effective strategy of economic development in many countries nowadays [36], incorporating DTTA into the datasets helps promote the rural economy by guiding the rational utilization of characteristic building and cultural heritage, so as to enhance the diversified social values for ES. DTAPS reflects the distribution of the agricultural production space and plays a critical role in the social–ecological production landscape planning in rural areas [37]. At present, with the increasing contradiction between the expansion of construction land and the reduction in agricultural production space, DTAPS is one of the key factors to improve the ability of rural ecosystem to meet human needs.
2.3. Study Area
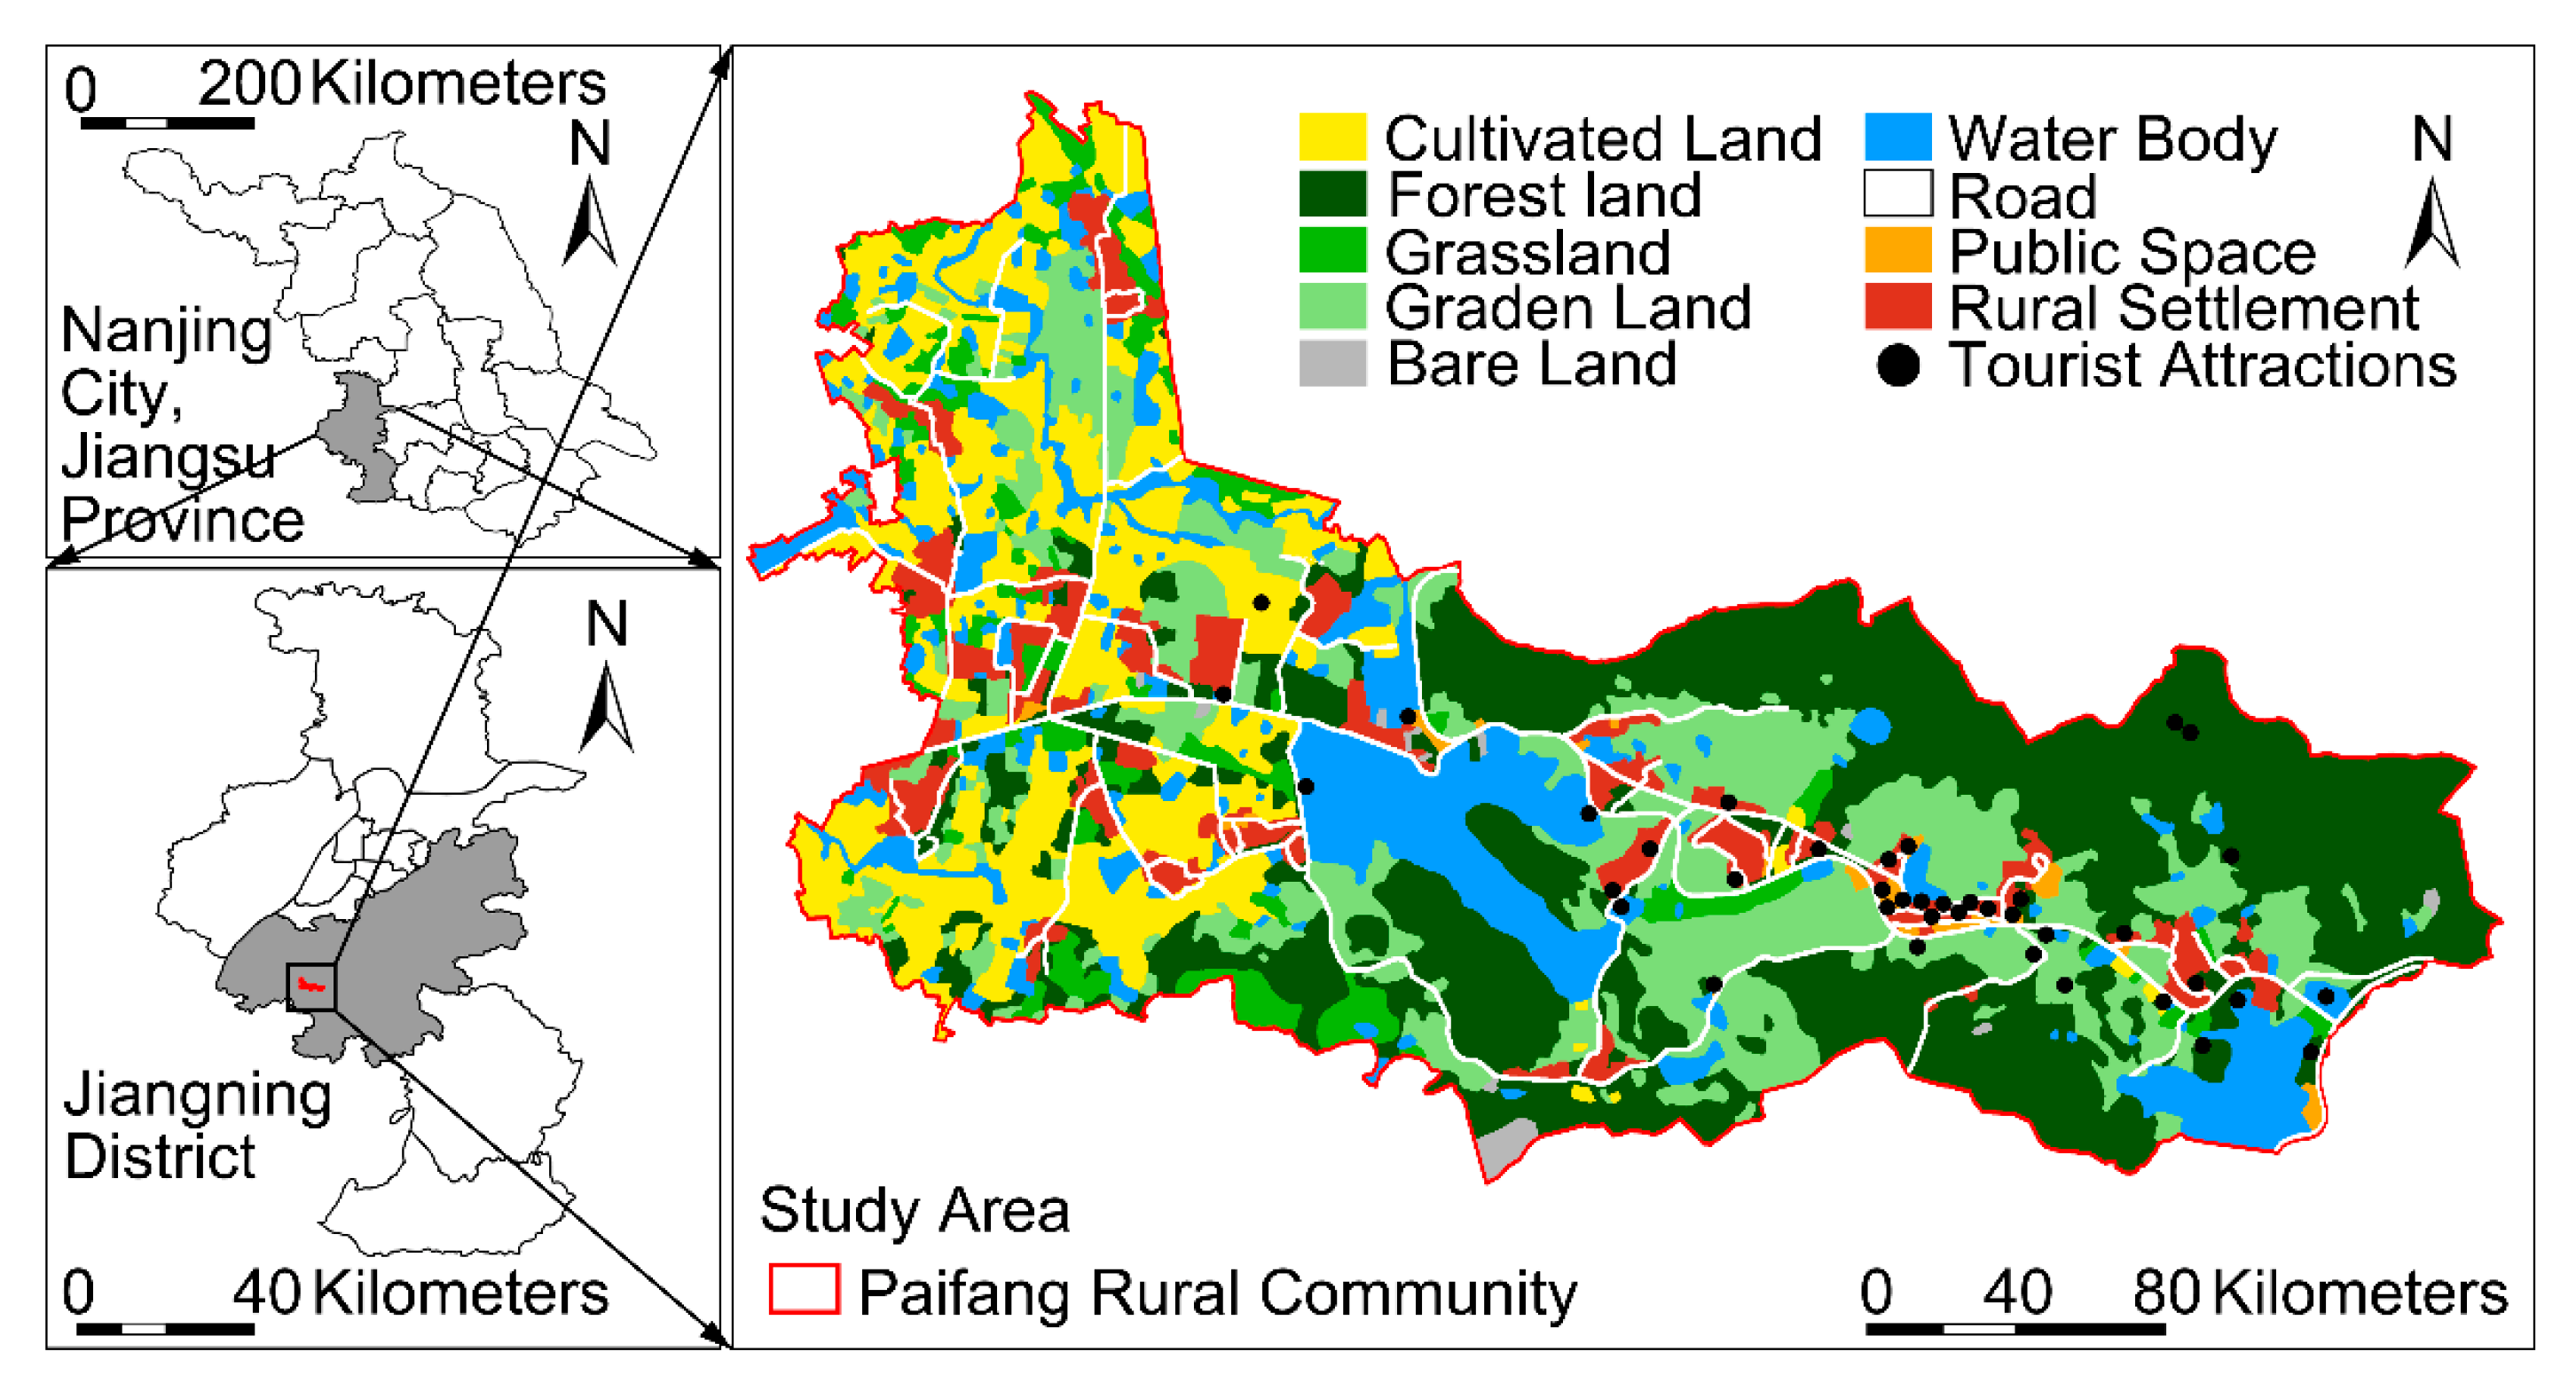
The Paifang rural community is located in the southwest of Jiangning District, Nanjing City, Jiangsu Province (Figure 3), which consists of 20 unincorporated villages with a population of 2154 and covers an area of 8.2 square kilometers. Huanglongxian, a national rural tourism village, is located in the region [23]. The Paifang rural community is rich in landscape resources, with scattered villages surrounded by bamboo forests, tea gardens, and reservoirs [23]. The beautiful scenery and characteristic tea culture expand the income channels of the villagers and provide tourists with an ideal destination for leisure and sightseeing. It possesses rich, unique local ecological wisdom, and is thus of high research and referential value.
2.4. Survey Data Collection
The survey data were collected through a field survey using a questionnaire. The questionnaire was designed according to the data requirements of the SolVES model and the actual circumstance of the study area, consisting of two parts. The first part was the collection of the basic information of respondents. The second part surveyed the allocation of social values among the respondents and invited respondents to mark the social value points. Respondents were asked to allocate an assumed RMB 100 to their preferred secondary social value types, and for each value with an amount allocated, they were asked to mark 1–4 points on the map that represented this value. From October to December 2021, 250 questionnaires were randomly handed out in Paifang Rural Community, of which 232 valid questionnaires were collected (116 from villagers and tourists, respectively). The effective response rate of the questionnaires was 92.8%, and 1347 social value points were obtained.
2.5. Data Analysis
The data analysis steps were as follows:
- We analyzed the 232 samples with SPSS and Excel to count the demographic characteristics of the respondents.
- We obtained the overall spatial distribution of the social value points with the kernel density estimate and identified the hotspot areas with high social value.
- We applied the SolVES model with the spatial data and the survey data. First, we performed the average nearest neighbor analysis, and obtained the spatial clustering results of social value points through the generated average nearest neighbor ratio and its multiple of standard deviation. Meanwhile, the weighted kernel density analysis of the social value points was conducted to obtain a kernel density surface. The required weight was the total amount allocated by the respondents to each social value. Then, a kernel density value index layer standardized to 0–10 was determined for each social value surface to identify the maximum value index in each layer. Finally, the result of the maximum value index multiplied by the logistic output from 0 to 1 was normalized to obtain a value index (VI) of 0–10 and the maximum value index (M-VI) for each social value. Based on M-VI and the number of social value points, the importance ranking of the 10 secondary social value types can be determined.
- Results from the SolVES model were interfaced with the maximum entropy (MaxEnt) model embedded in the SolVES model, which can produce additional statistics, such as the area under the receiver operating characteristic curve (AUC), to describe the performance of each model. In addition, the collinearity analysis of environmental variables was conducted using the variance inflation factors (VIF) and tolerance indicators to verify the reliability of the results. Then, the top four social values in the importance ranking will be selected for further analysis.
- For all surveys, the results of the SolVES model were output into ArcGIS to obtain the spatial distribution of social values. Then, by using the Origin software, linear regression analysis between nine environmental variables and the mean VI of four social value types output by the MaxEnt model was conducted to explore the correlation between variables and social values.
- We divided the respondents into groups of villagers and tourists. The kernel density estimate was used to obtain the density of social value points marked by the two groups. Next, the SolVES model was used to select the corresponding survey data and spatial data to compare the social value spatial distribution. To further compare the environmental behavior of villagers and tourists and their interests for rural ecosystem, the Pearson correlation coefficient was used to compare the trade-offs and synergistic relationships of each social value in different groups.
3. Results
3.1. Demographic Characteristics of the Respondents
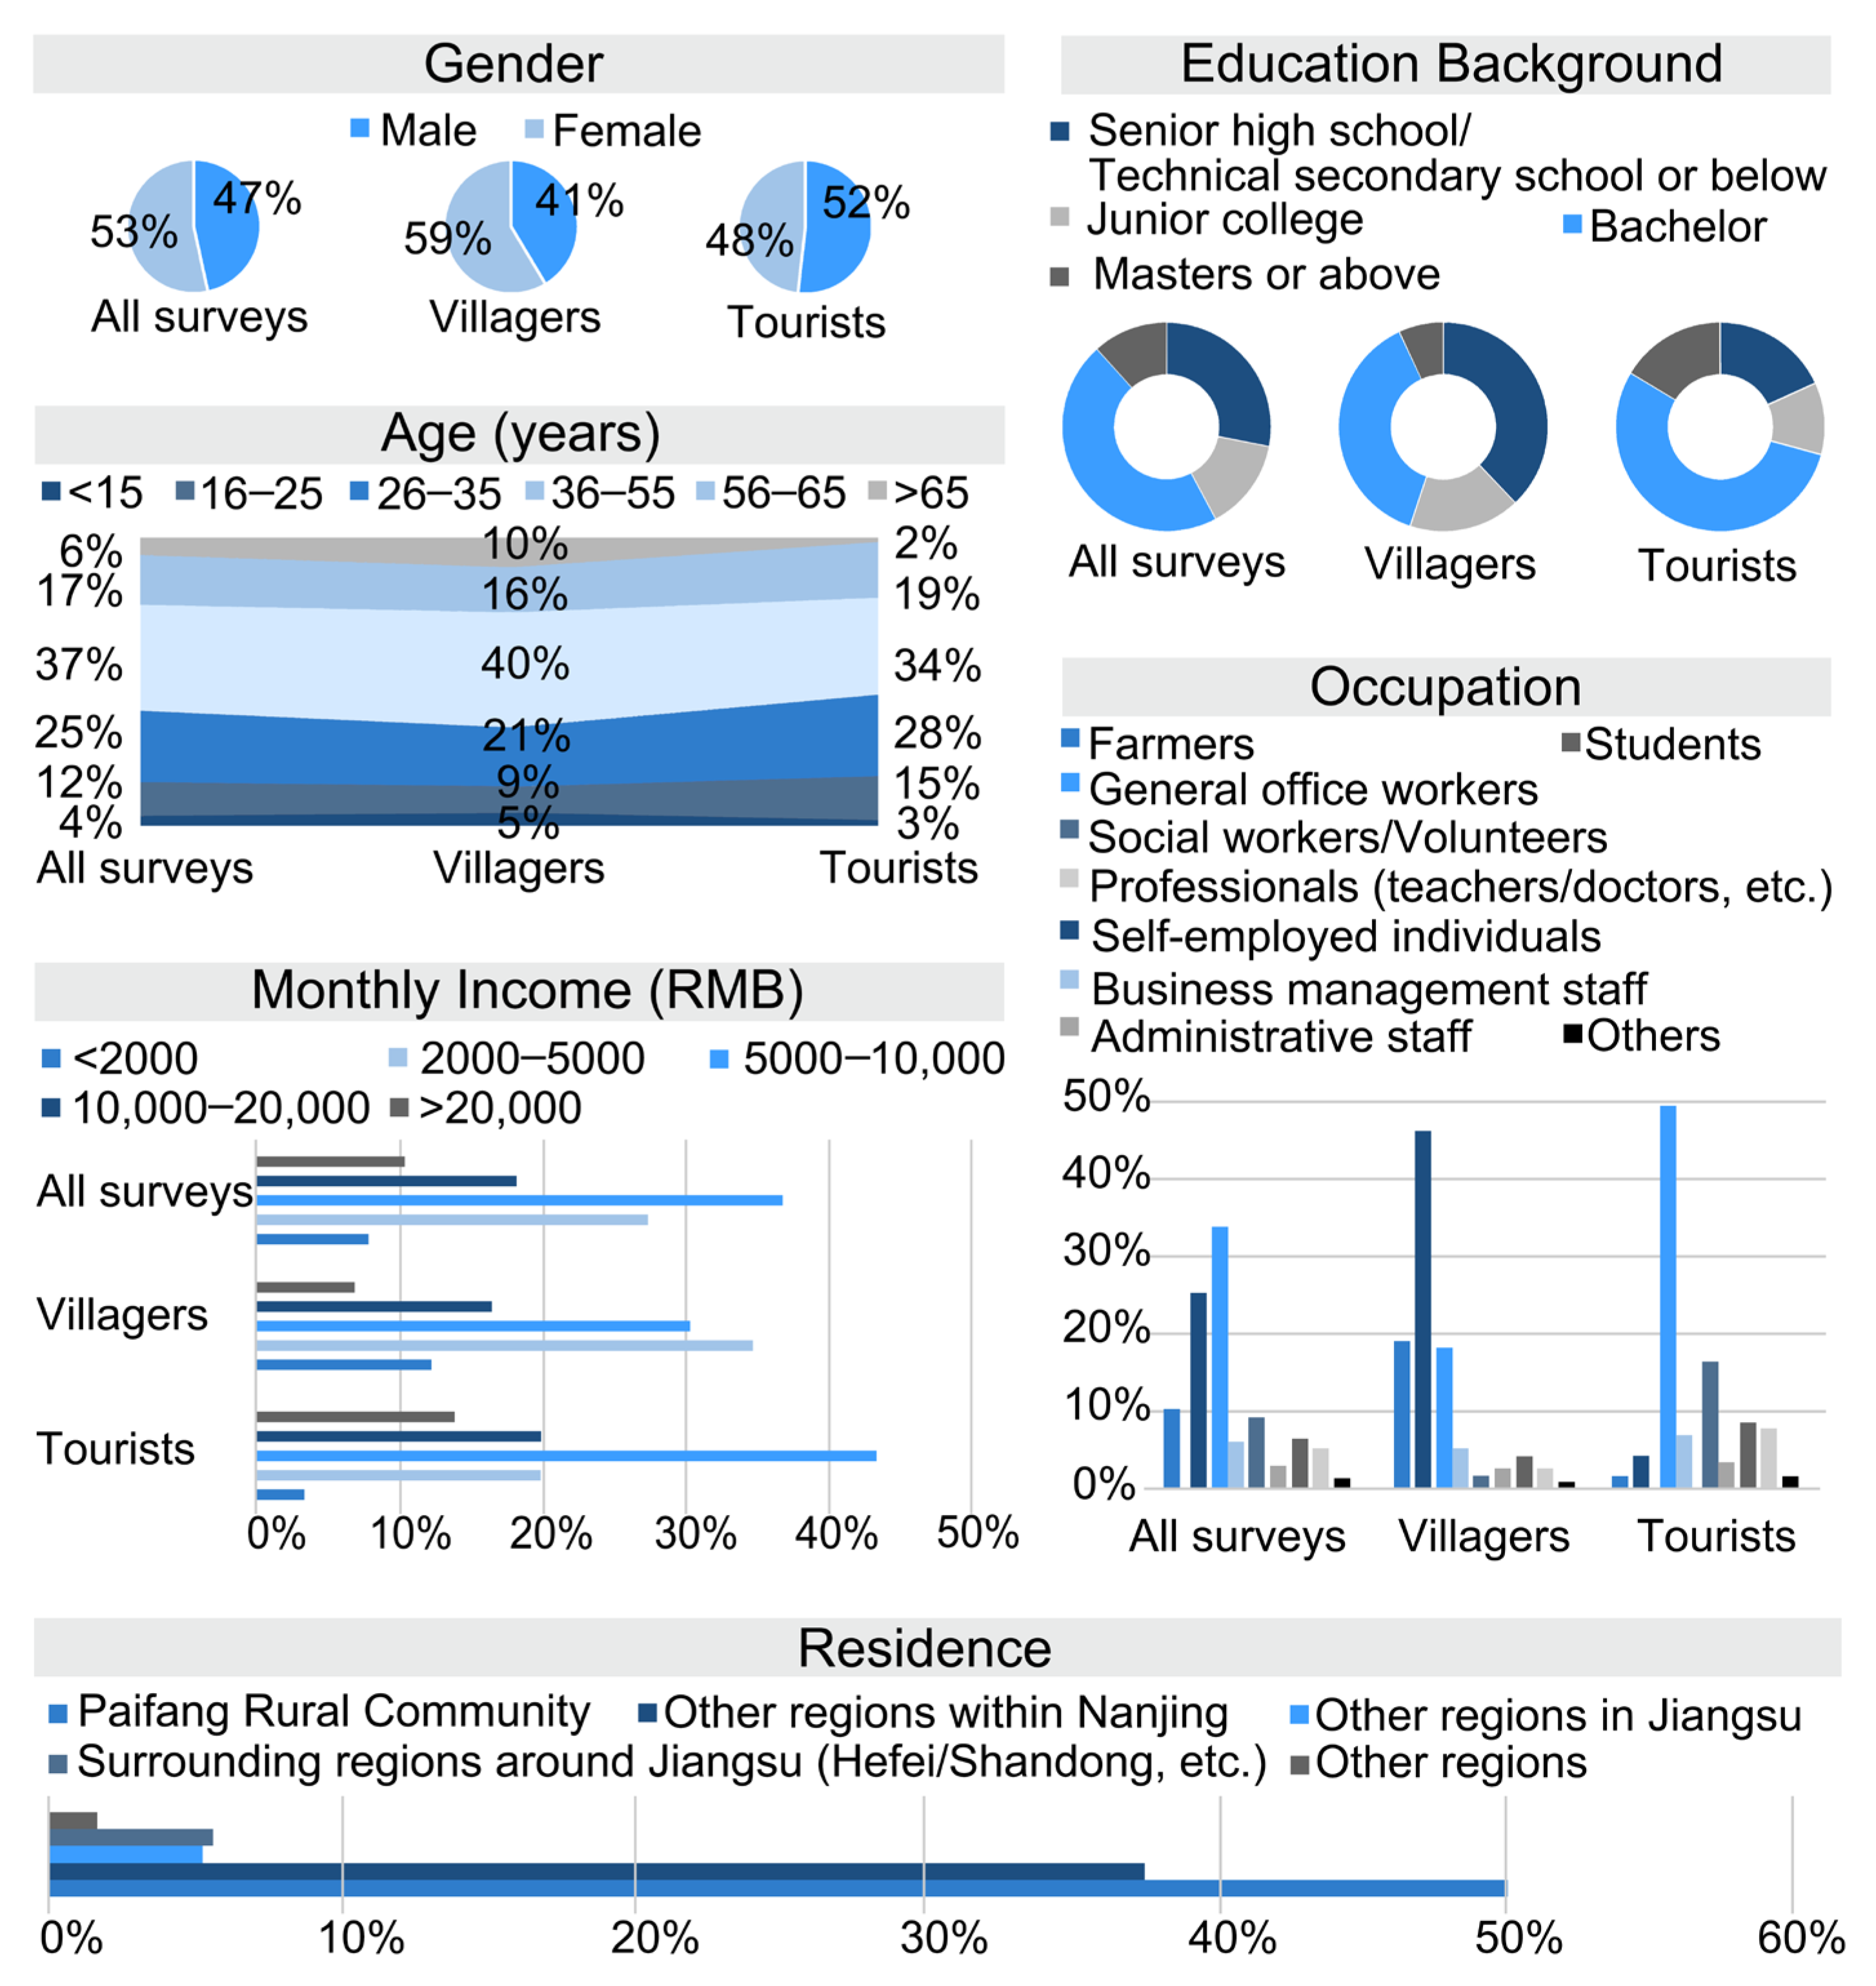
The demographic analysis results (Figure 4) indicate that the proportions of male and female were basically equal, covering all ages and the main jobs types in rural areas. The villagers are mainly self-employed and engaged in the tea industry, followed by farmers and general office, while the tourists are mainly general office workers, followed by social workers and volunteers, and also include a certain number of professionals in various industries, with higher education level and income. Tourists can better comprehend the questionnaire, while some lesser educated villagers answered through the interview format to reduce the interference of subjective factors. The tourists mainly come from Nanjing, but also approximately 5% come from other cities in Jiangsu Province and surrounding regions around Jiangsu Province, respectively. The samples of this survey can reliably reflect the actual circumstances of the daily visitors in the Paifang rural community.
3.2. The Overall Spatial Distribution of Social Value Points
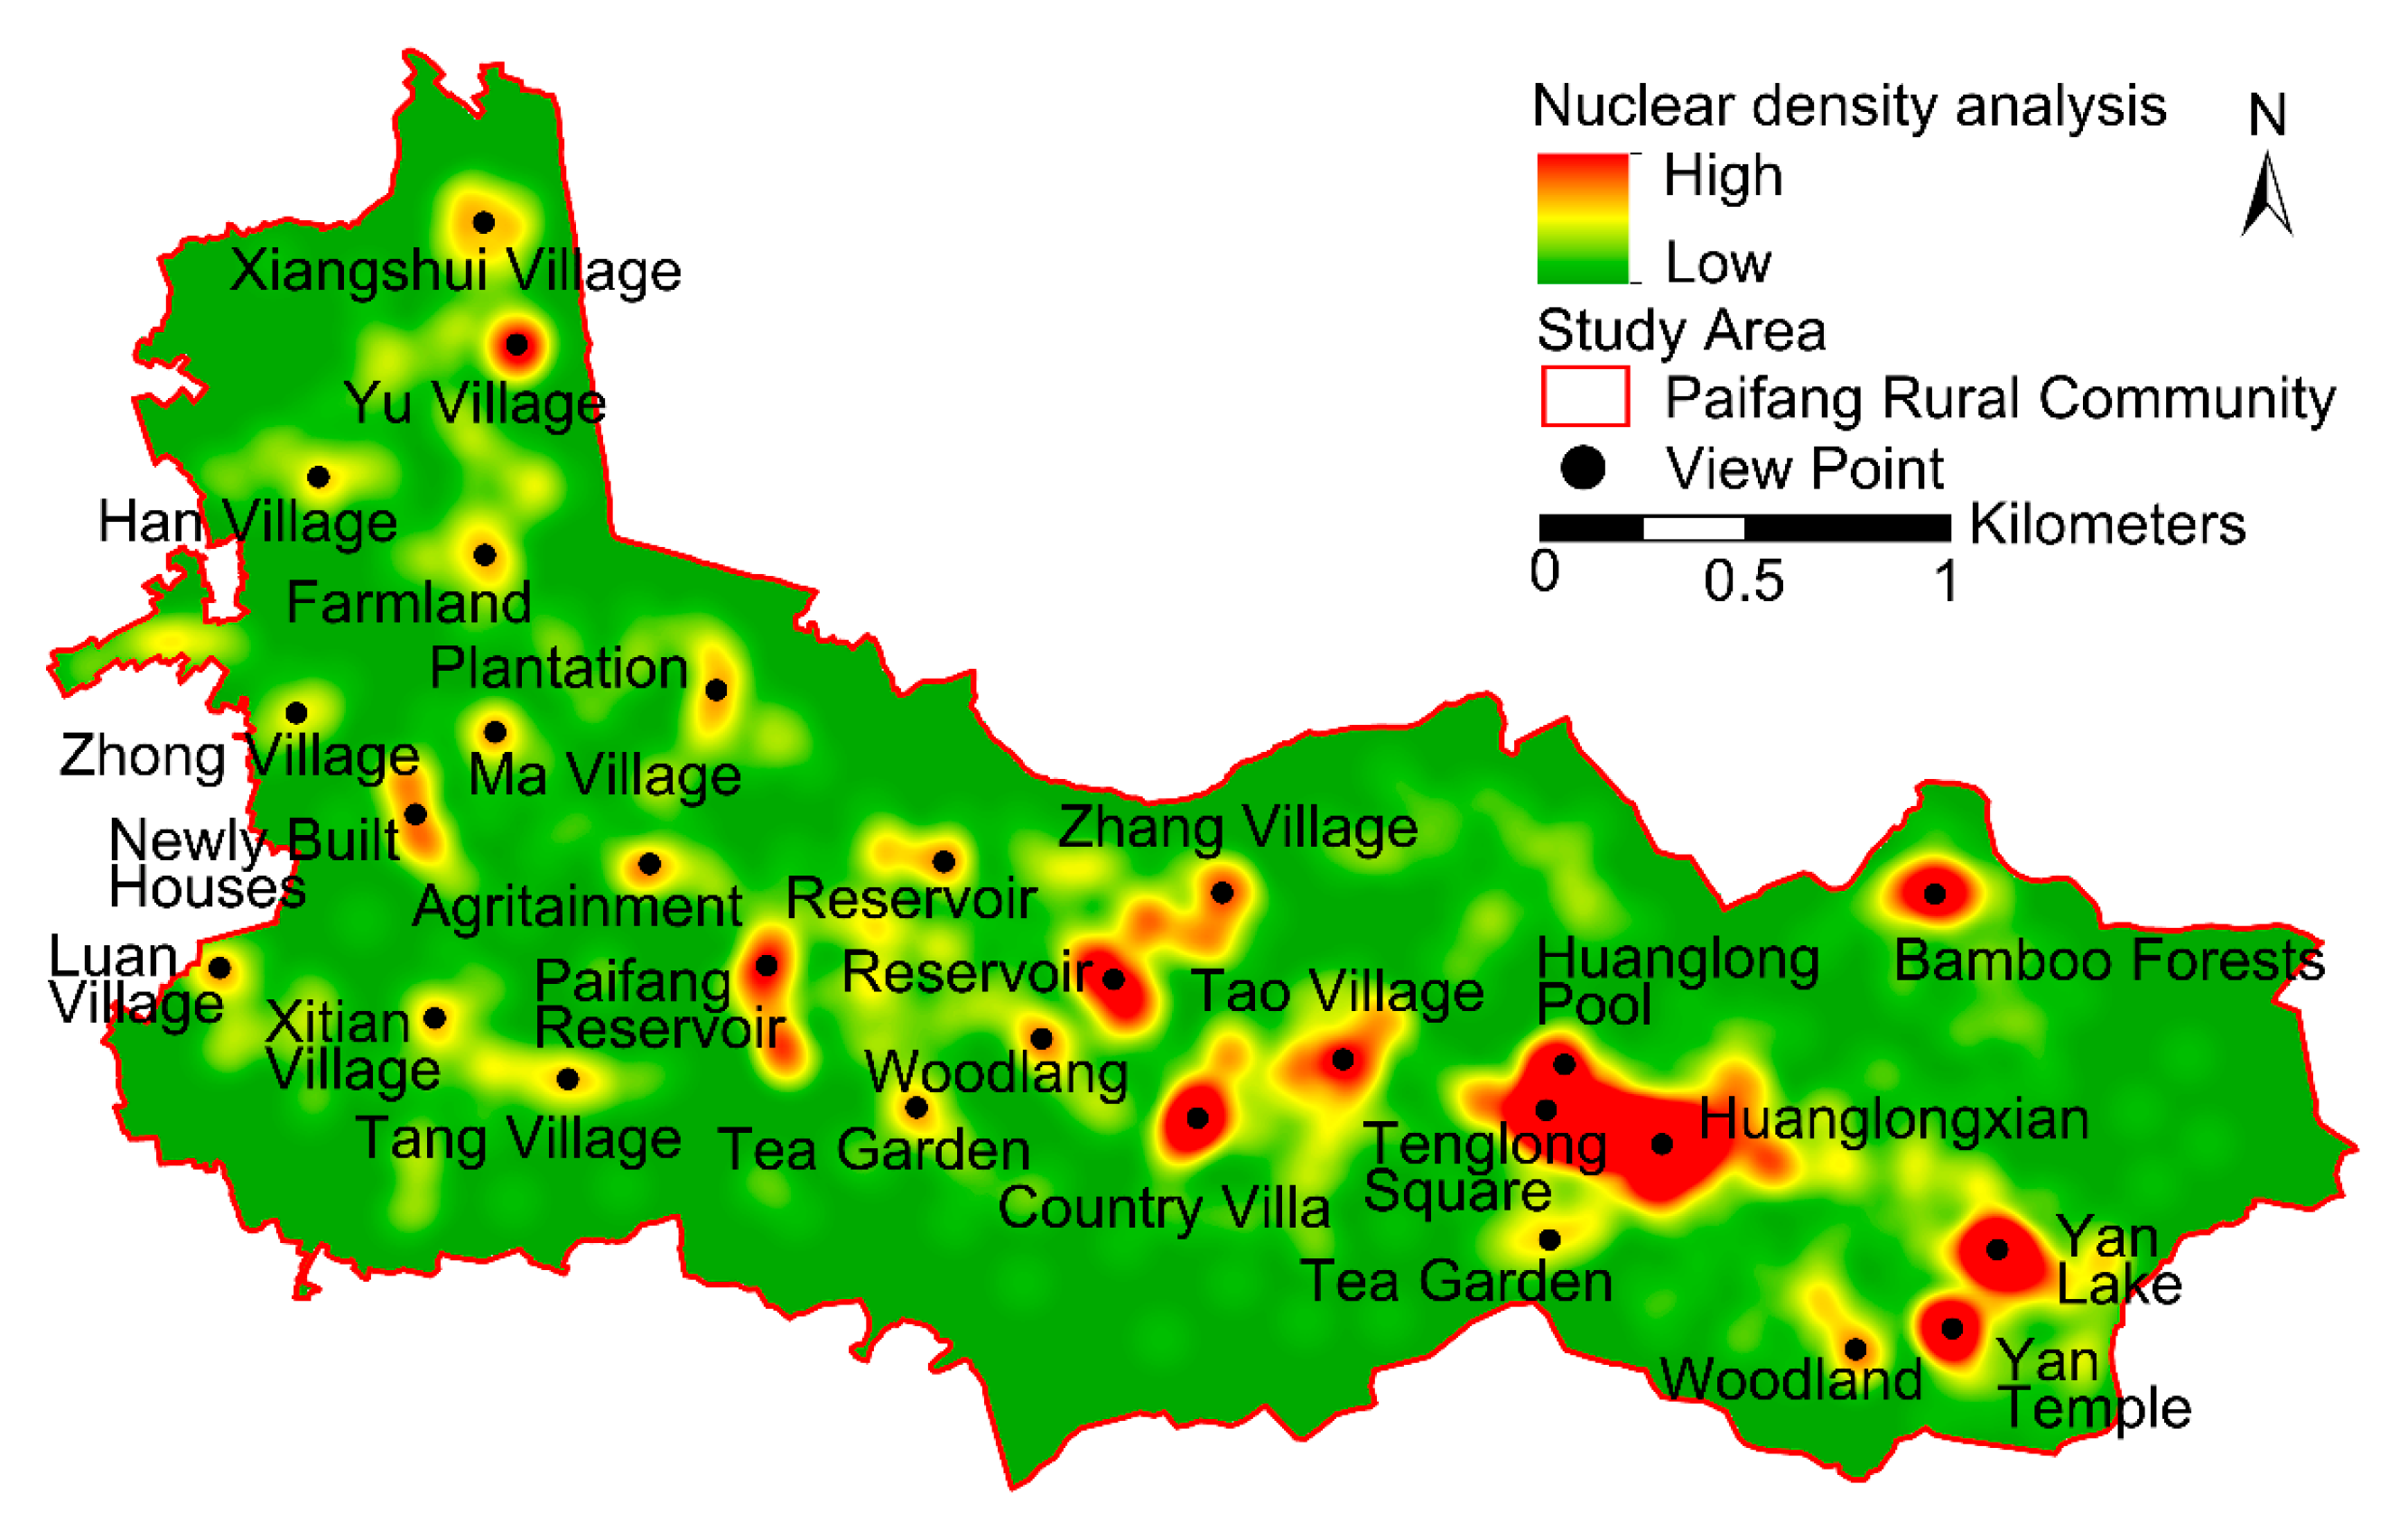
The kernel density estimate of the social value points was conducted with the SolVES model to identify the hotspot areas (Figure 5). The social value points are mainly distributed in Huanglongxian, Yan Lake, the mountain forests and tea gardens in the west of Paifang Reservoir, and Yu Village, among which the density of the social value points is highest in Huanglongxian and lowest in the mountainous areas on the southern boundary. Around Huanglongxian, the Huanglong Pool is an ideal place for angling, and the Tenglong Square provides open lawn space. The bamboo forest in the mountains in the northeast bears witness to the history of the region. As for the two largest water bodies, the Paifang Reservoir is surrounded by green hills and scattered villages, and Yan Lake provides plank roads to enjoy the waterscape. Yu Village is relatively far from other hotspots, but it is an important area for income sources, with many reservoirs and vegetable gardens.
3.3. Assessment of Social Values for Ecosystem Services
3.3.1. Spatial Clustering Analysis of Social Value Types
According to the statistical data shown in Table 3, the spatial distribution of 10 social values belong to the spatial clustering mode in the total samples (R < 1 and the absolute value of Z is relatively large). According to M-VI and the number of value points (N), the value of recreation services receives high attention, while the value of the cultural inheritance is relatively difficult to perceive. Among the secondary types, the respondents clearly prefer aesthetic, health care, recreation, and biodiversity value (M-VI > 5). Therefore, we focused on these four types to conduct further research.
3.3.2. Model Performance Evaluation and Collinearity Analysis of Variables
The test AUC obtained after the environmental variables are imported into the MaxEnt model can measure the accuracy of the assessment and verify whether the selected environmental variables are applicable in this study. When the test AUC is greater than 0.7, the assessment result is considered valid, and the closer the test AUC is to 1.0, the higher the reliability of the assessment [38]. According to Table 4, the test AUC levels are all greater than 0.7, and most of them exceed 0.9, indicating the high reliability of the assessment.
However, the above assessment method may not be correct if the variables are highly correlated, so it is necessary to conduct a collinearity test on the selected environmental variables [11]. VIF and tolerance were used to test the multicollinearity of the nine environmental factors. When the VIF is less than 5 and the tolerance is greater than 0.1, there is no multicollinearity between the variables. Otherwise, the collinearity is significant [39]. As shown in Table 5, the variables do not have multicollinearity and meet the modeling standards. To sum up, the environmental variables have good model running results, which can facilitate the further study.
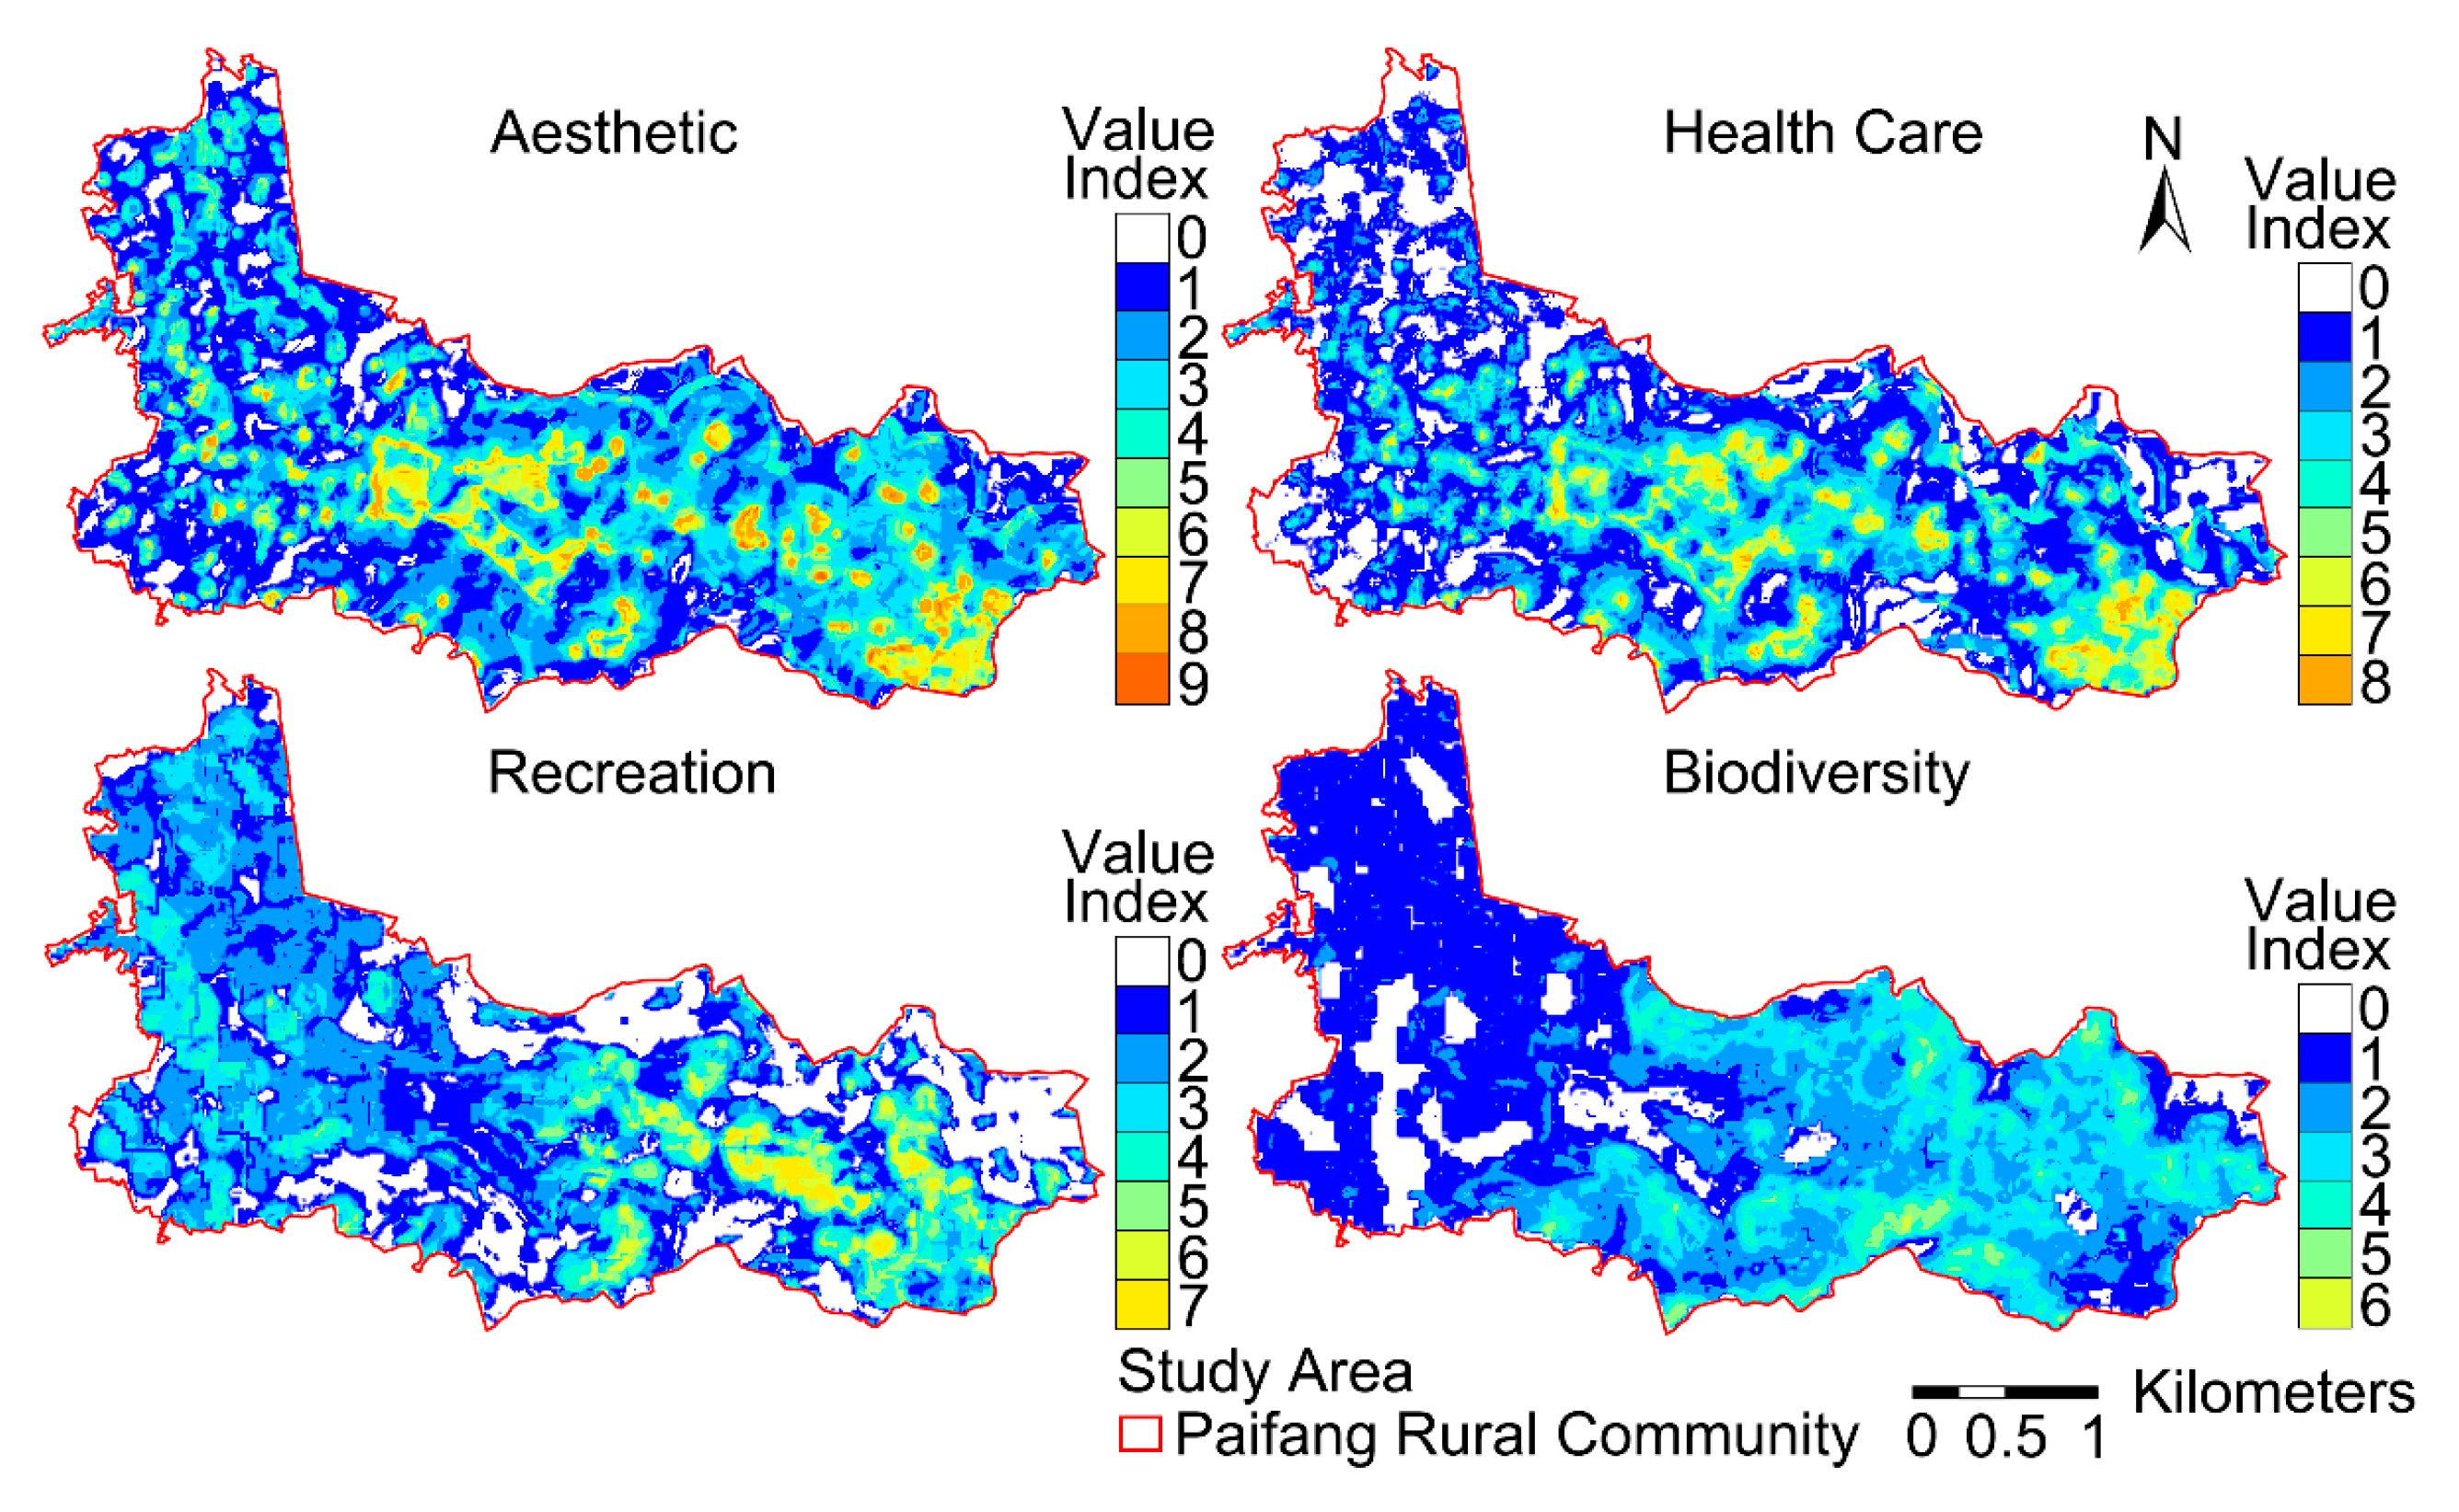
3.3.3. Spatial Distribution of Social Value Types
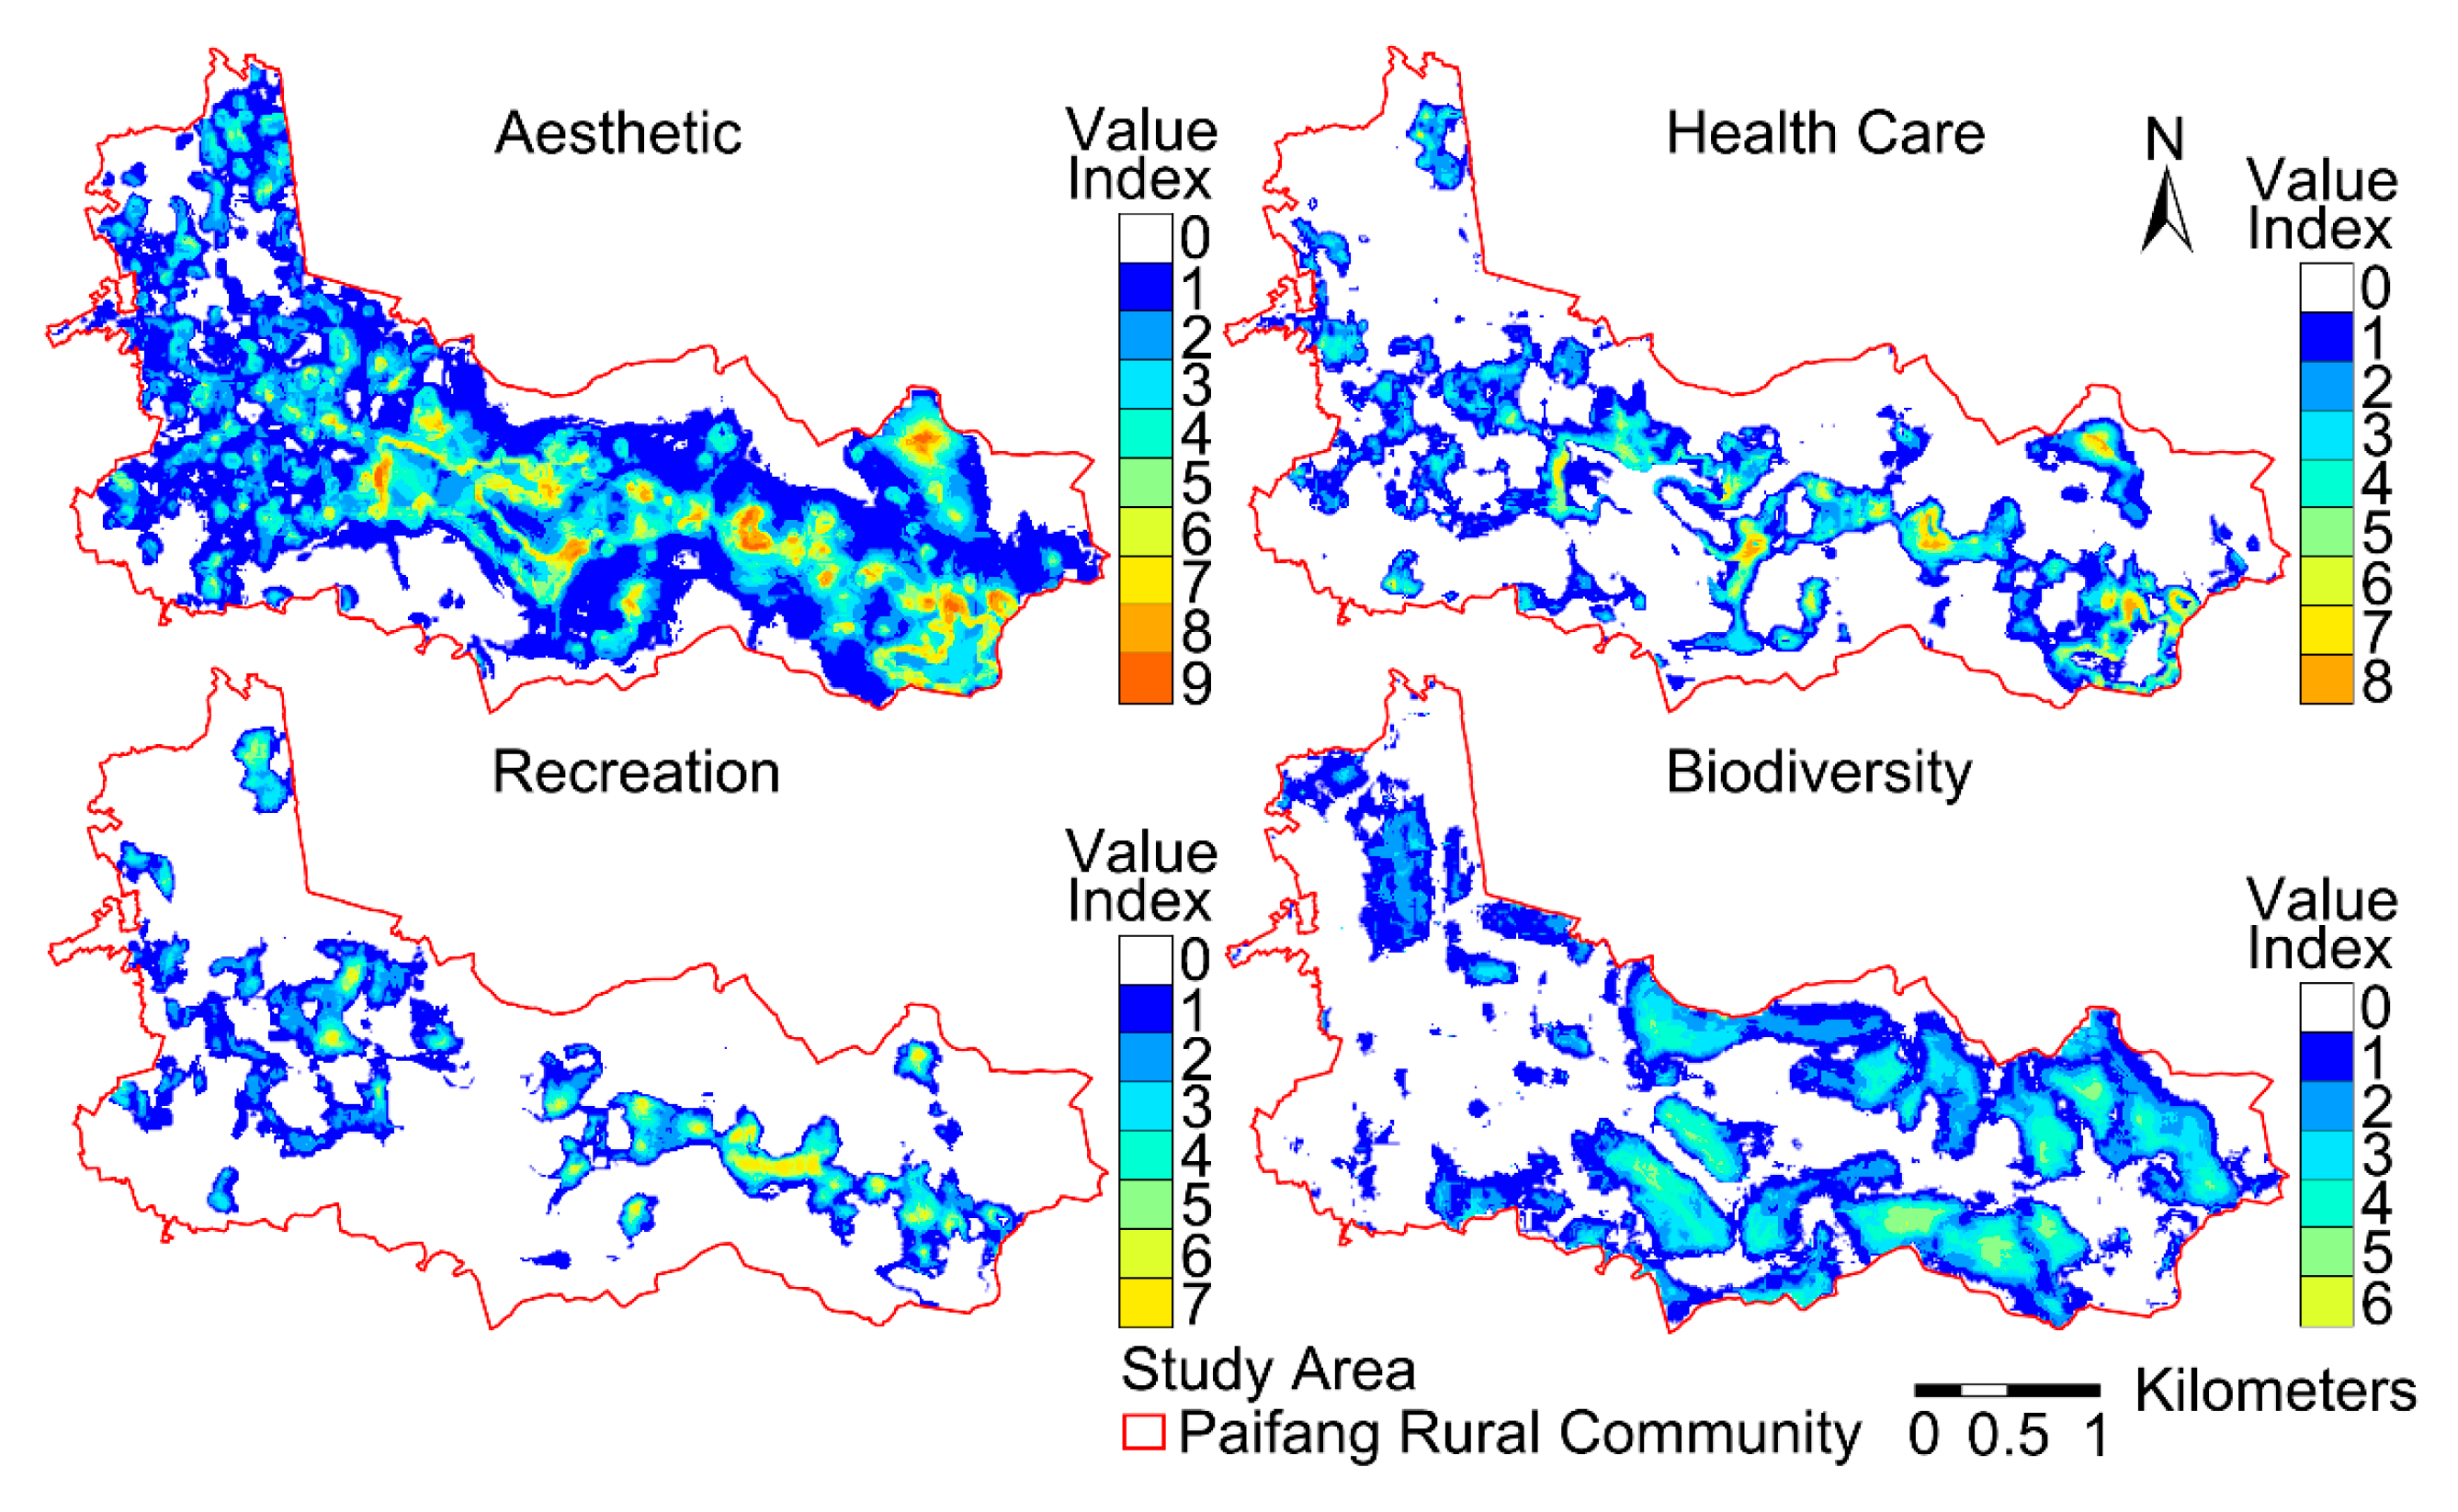
The value index map was exported into the ArcGIS (Figure 6). Aesthetic value covers almost the entire area, and places with high VI are mostly close to the water body or aggregate in a few villages. Areas with high health care value are concentrated in tourist attractions and some rural settlements, while this value is relatively low in the areas with poor housing conditions in the northwest, indicating that the recreation value is related to landscape quality and living environment. The distribution range of the recreation value is the smallest. Its high VI points are concentrated around Huanglongxian, which is related to activities such as tea drinking and angling. The biodiversity value is widely concentrated in the east with large mountain areas; however, in the west, due to the large areas of cultivated and construction land, the high VI points are sparsely scattered. In general, other than biodiversity value, the social value is higher in the regions with denser scenic spots, convenient transportation, and proximity to water bodies, and there is a greater potential for social value improvement in places with concentrated rural settlements, inconvenient transportation, and proximity to cultivated land.
3.3.4. Relationship between the Social Value Types and Environmental Variables
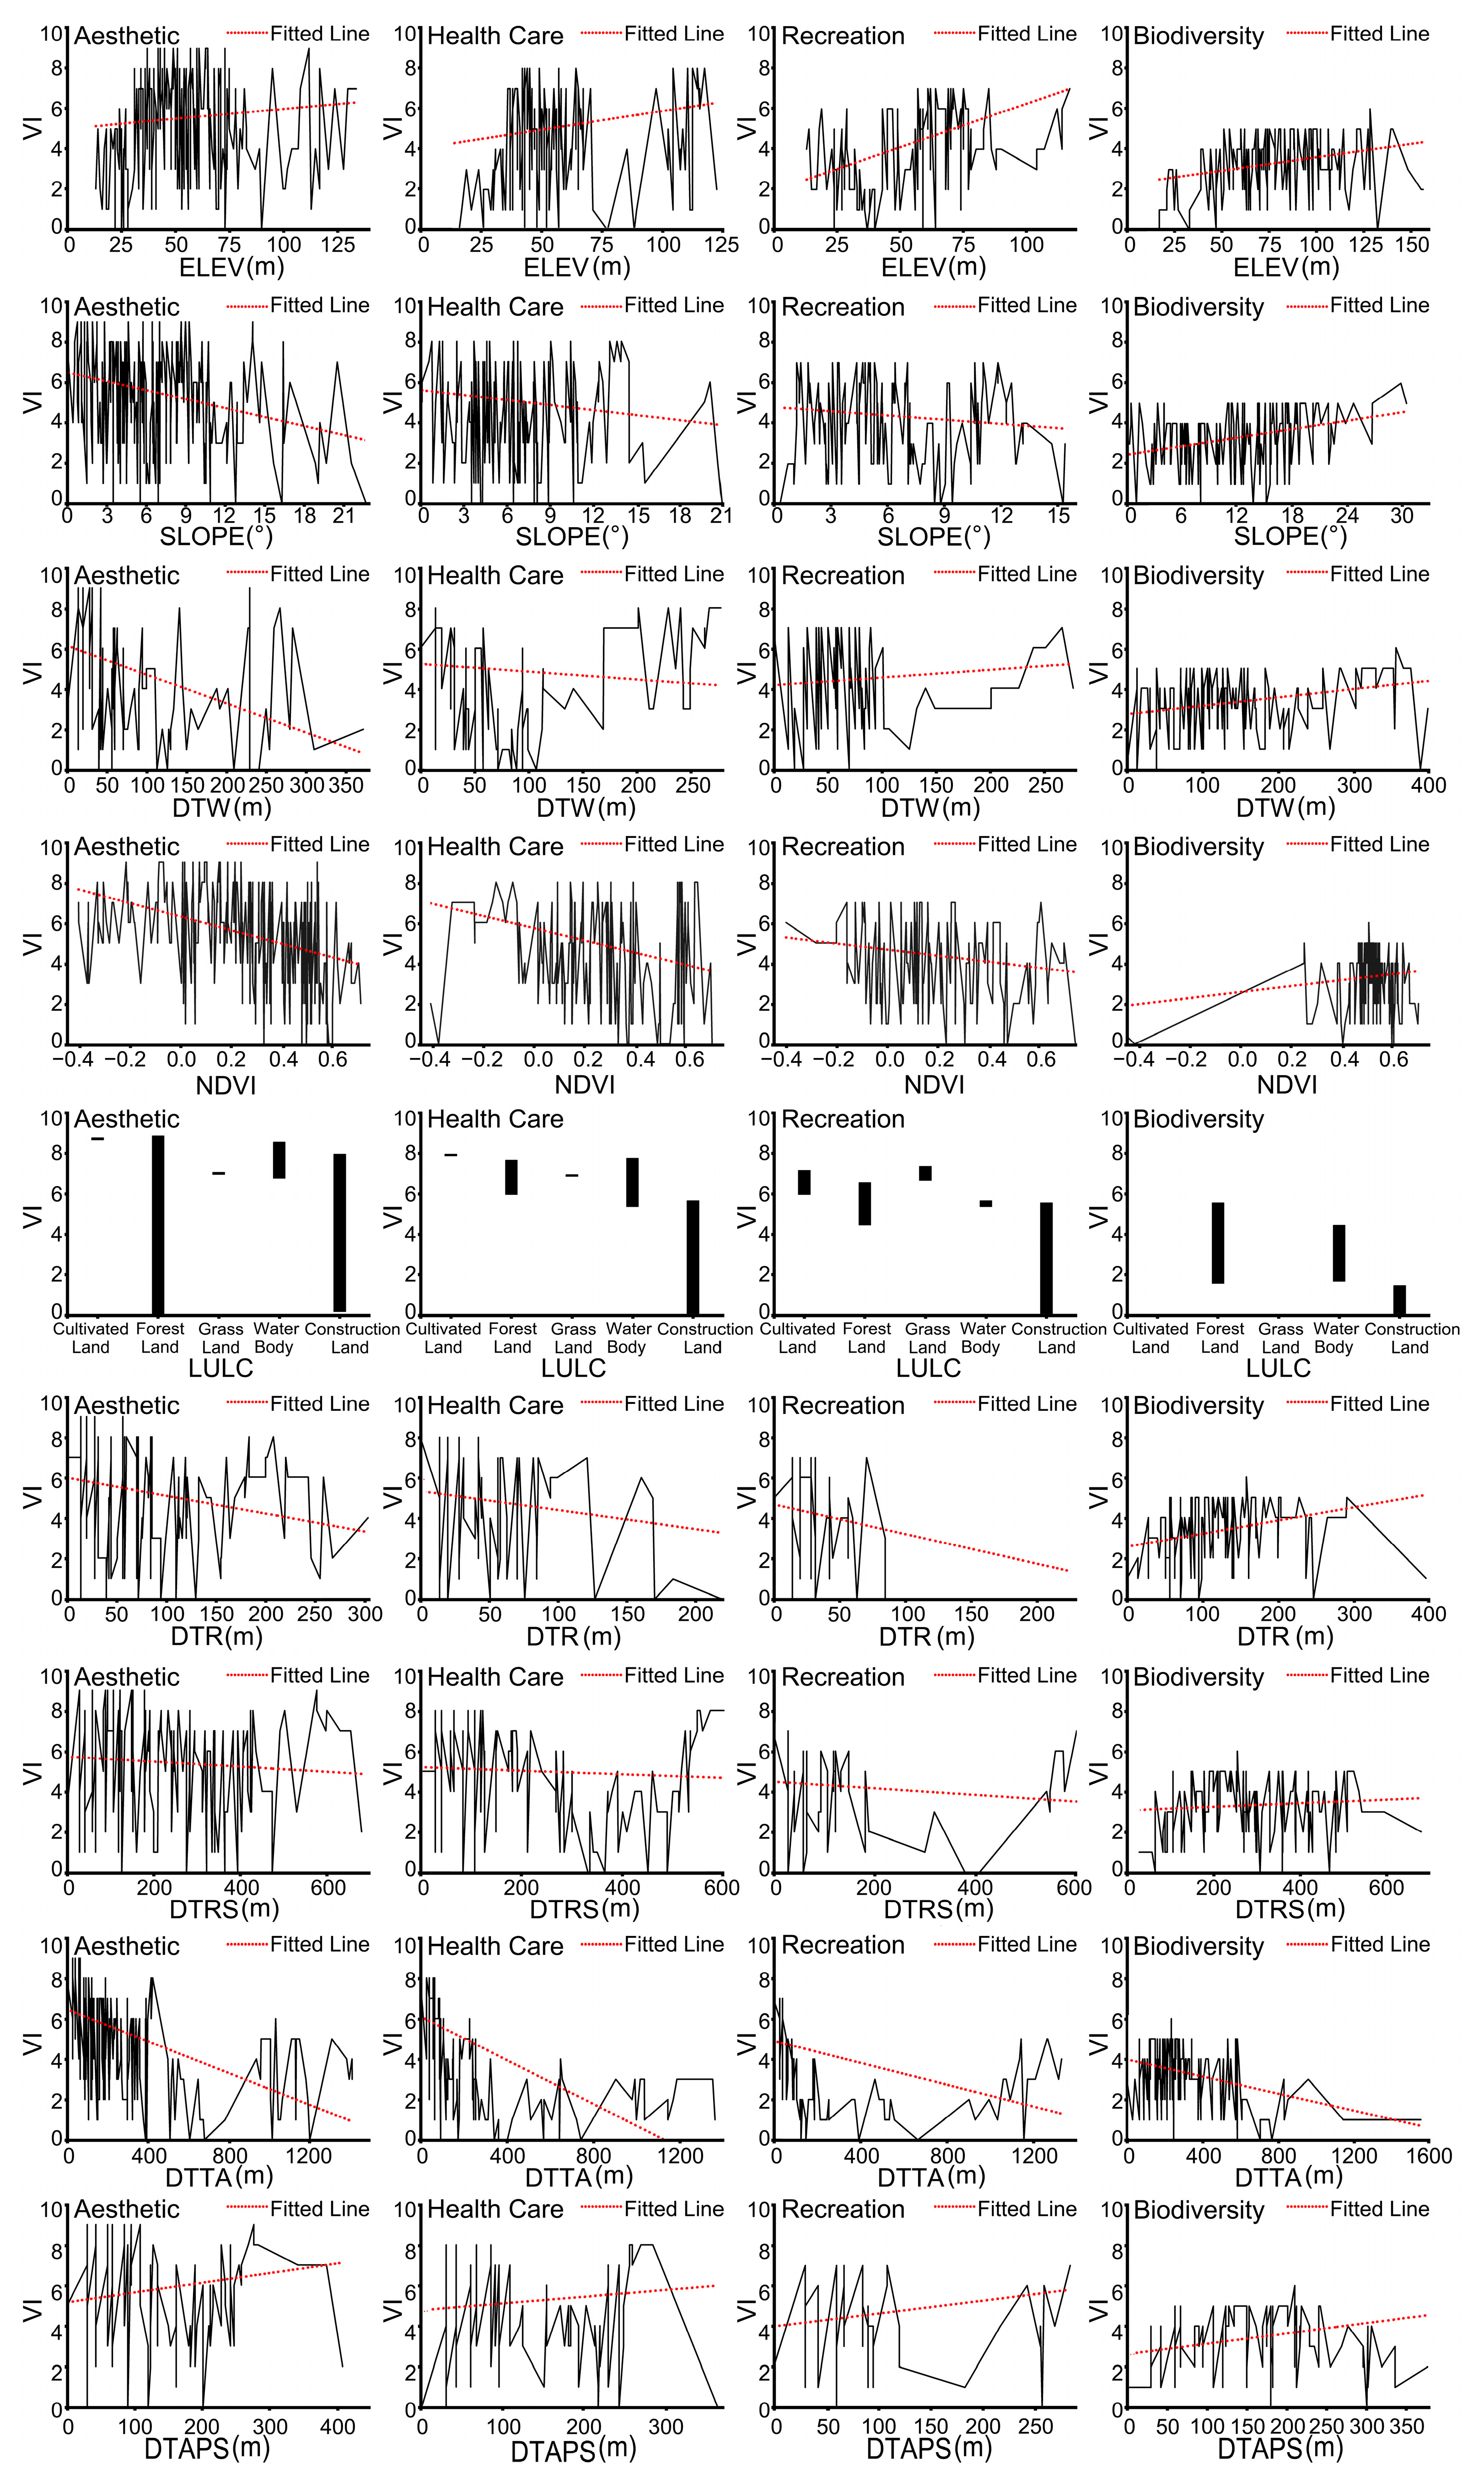
The results of the linear regression analysis are shown in Figure 7. Areas with a higher ELEV are generally attractive, but partially low, which is related to poor accessibility and reduced opportunities for careful observation. People can better enjoy the scenery and feel relaxed in places with a flat terrain, while areas with a higher SLOPE probably have better habitat conditions. DTW negatively correlates with the aesthetic and health care values, but when DTW reaches 200 m, a number of places are endowed with these two value types, probably because mountains become the main aesthetic objects and provide better therapeutic opportunities. Among the LULC, water bodies generally have higher social values, while cultivated land and grassland mainly reflect the aesthetic and recreation values, respectively. Forest land and construction land have a relatively wide range of VI due to their large areas. As for DTR, the recreation value is significantly low when DTR ≥ 100 m, possibly affected by the distribution of recreational facilities.
Among the newly introduced variables, DTTA has better fitting results with social values, and all value indexes clearly negatively correlate with DTTA. Therefore, the level of social value may be better inferred based on DTTA. Aesthetic and recreation values rise when DTTA > 1000 m, indicating that the western areas far away from scenic spots but with dense rural settlements have highly attractive spots. The health care value is higher within DTTA < 600 m, so that the existing tourist attractions can provide references for the construction of new ones, while there are few species resources around the tourist attractions, and the biodiversity value is lower in the northwest with large areas of cultivated land (DTTA > 1200 m). NDVI fits better with aesthetic value, and the aesthetic, recreation, and health care values are generally lower in areas with high vegetation coverage. The mountain forests with NDVI > 0.4 have a higher biodiversity value, though they have great potential for improvement in aesthetic value. The fitting results of DTRS and DTAPS with each social value are normal. High health care and recreation values are concentrated in places 200 m in distance from the rural settlements, while the biodiversity value of areas far away from rural settlements is higher. DTAPS positively correlates with social values. The health care value rises to the peak and then falls rapidly when DTAPS > 250 m, indicating that the northern mountains composed of non-economic forest tree varieties vary greatly in the health care functions, which may be affected by rural tourism.
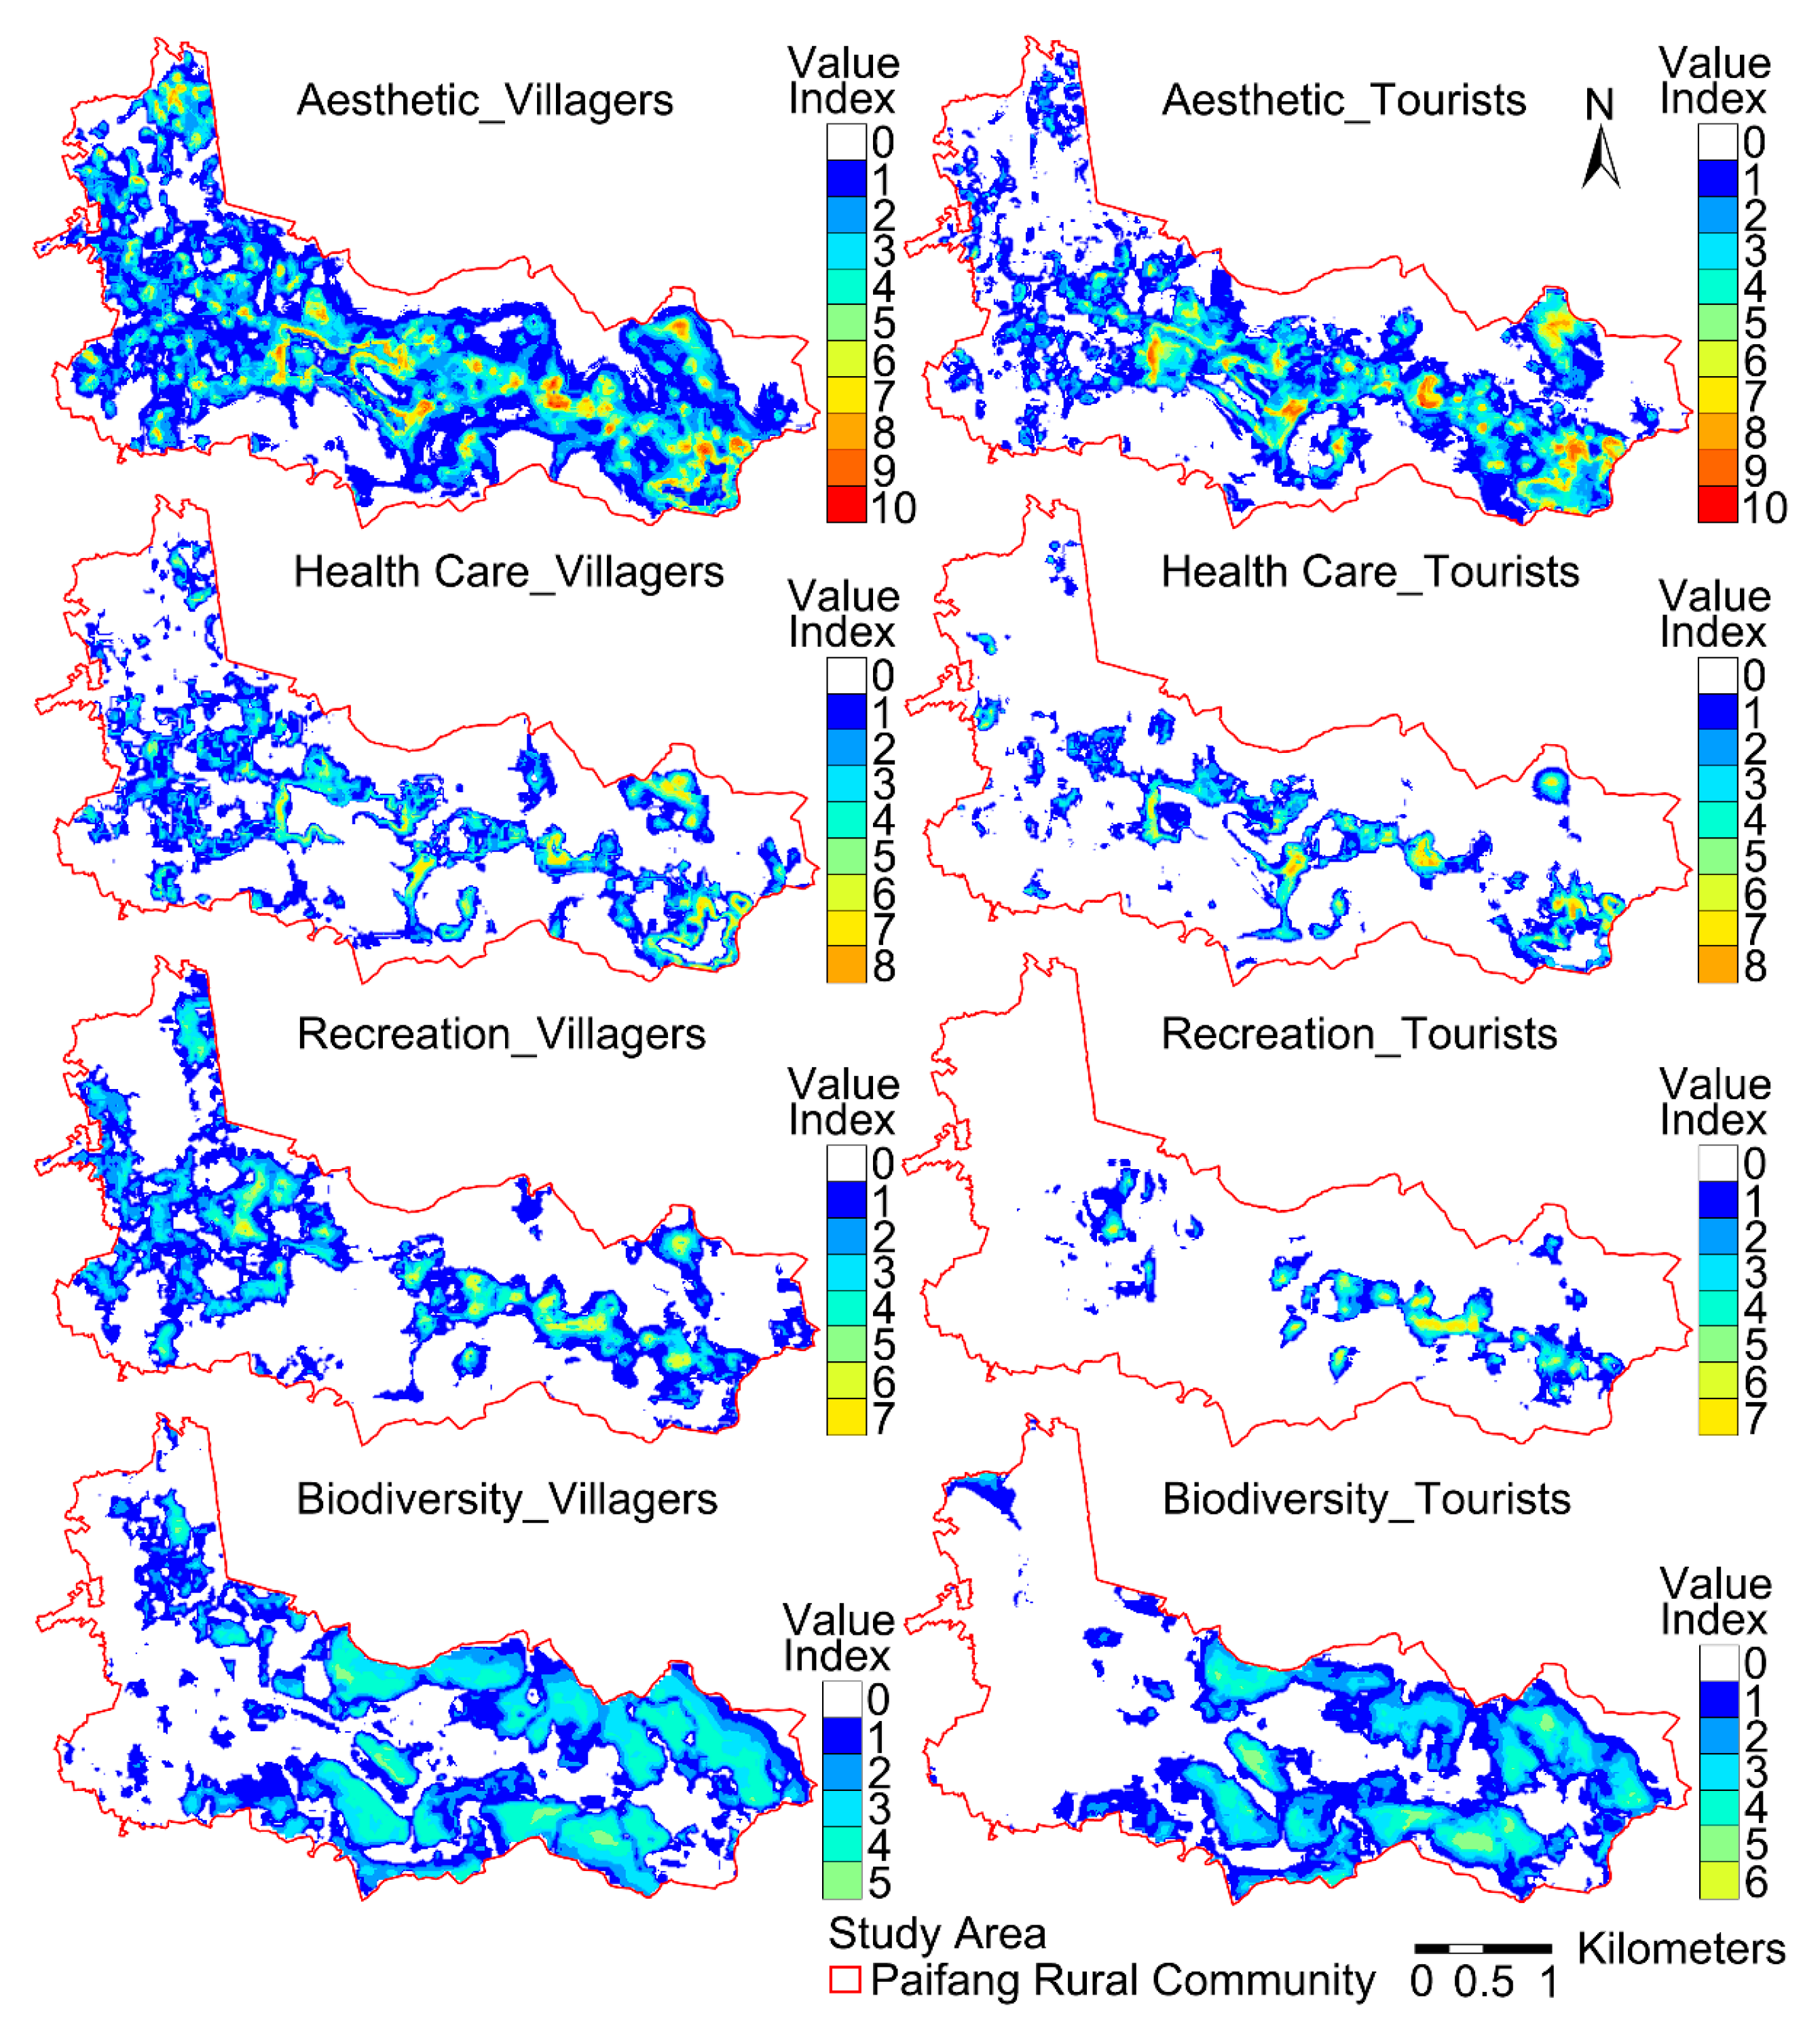
3.3.5. Differences in the Perception of Social Value by Villagers and Tourists
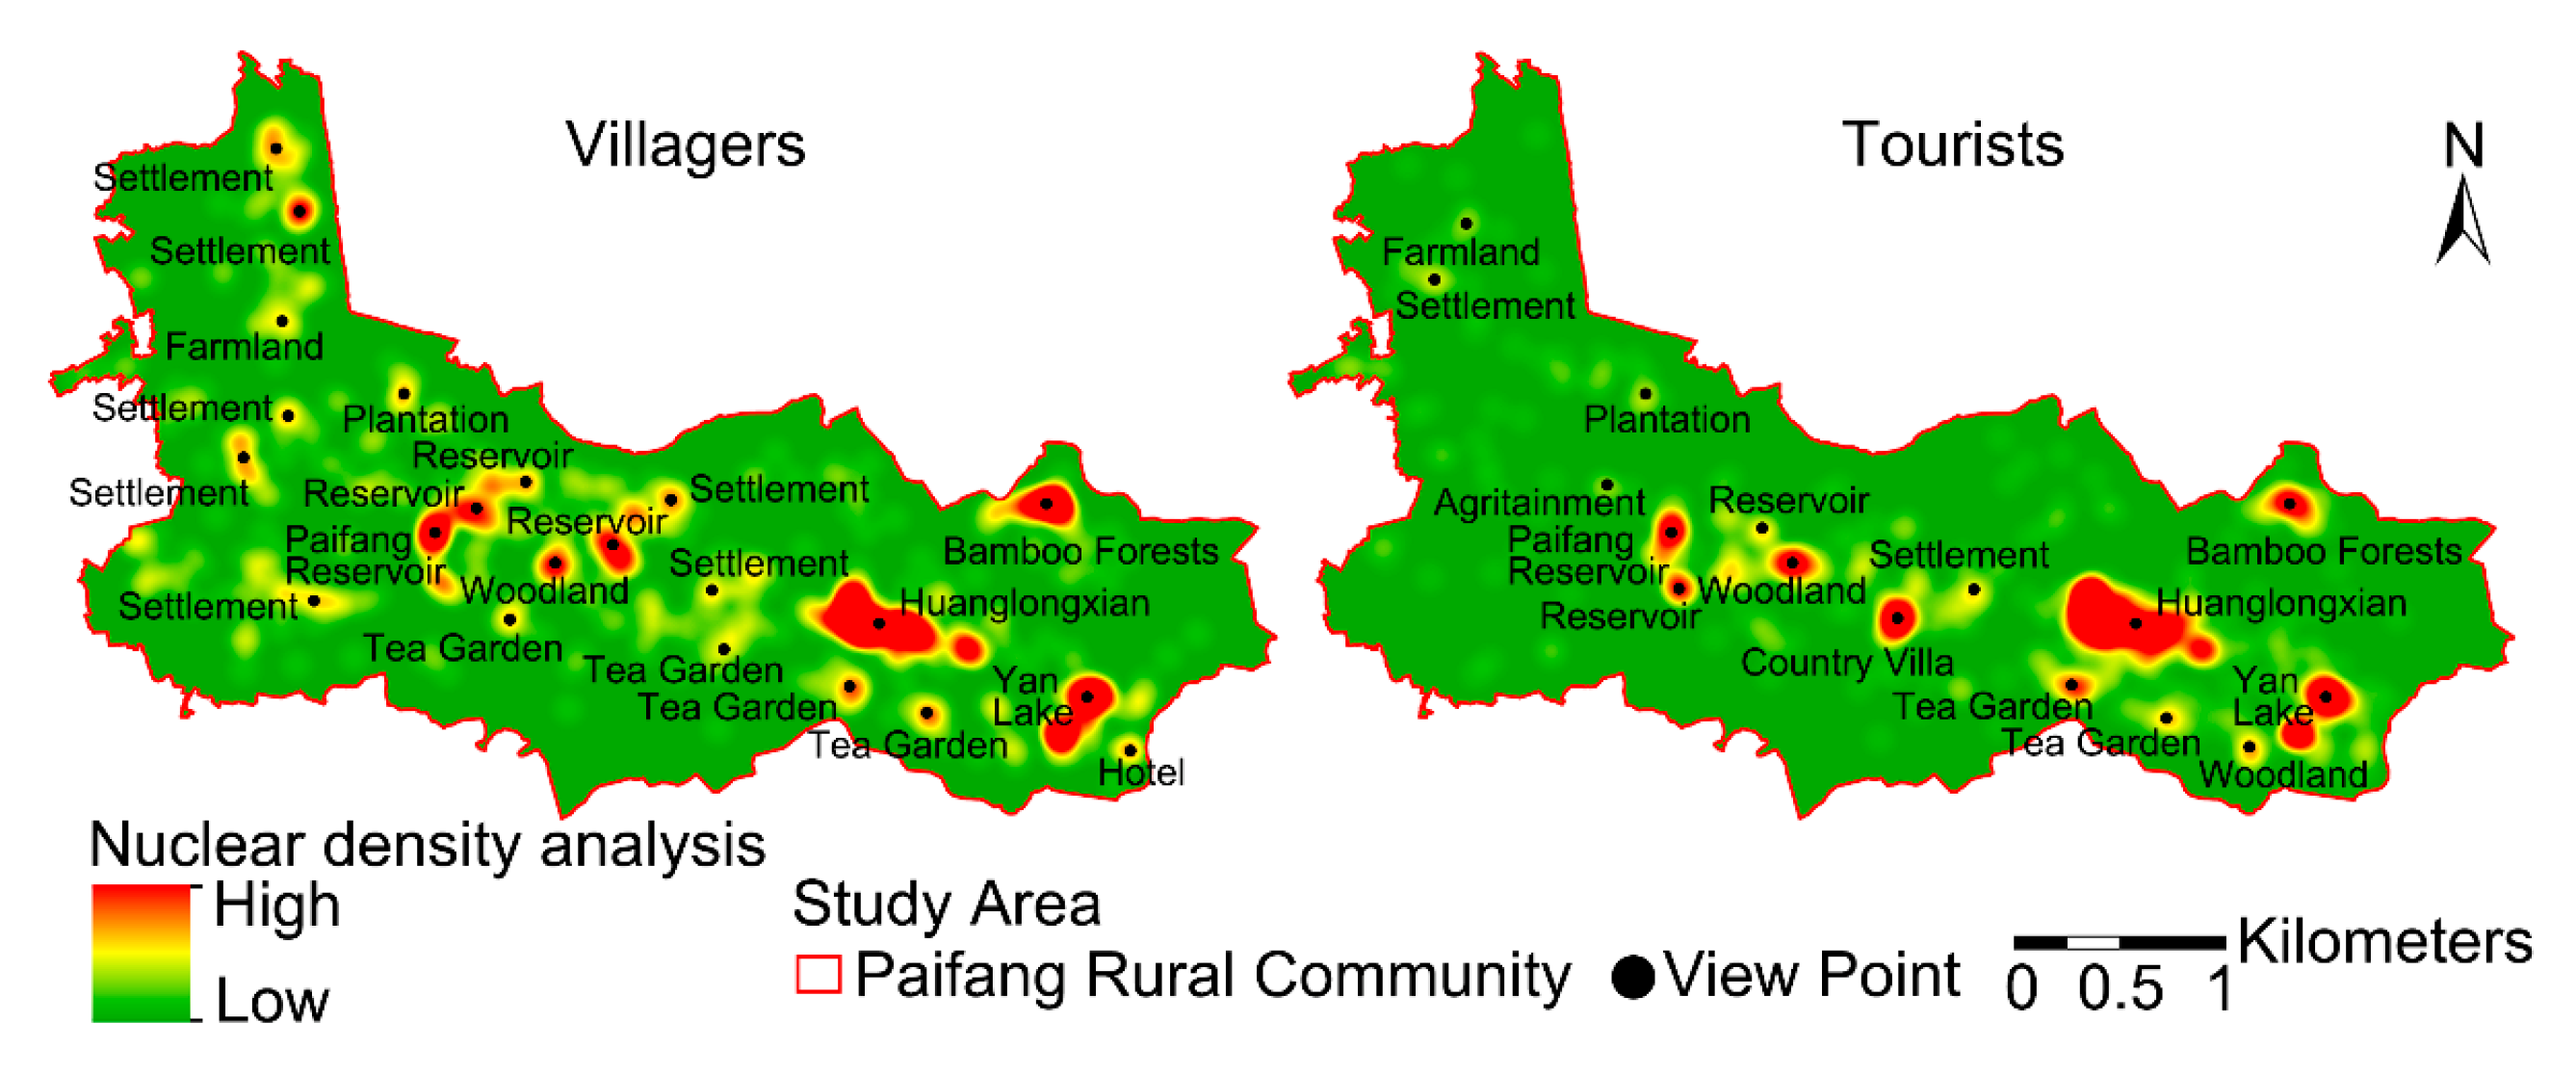
Villagers and tourists vary in their familiarity with and focus of attention towards rural areas, as well as their perception ability, which leads to changes in the spatial distribution of social values. According to the comparison of the spatial distribution of social value points marked by the two groups (Figure 8), there are four overlapping areas of social value hotspots perceived by villagers and tourists, namely Huanglongxian, the Paifang Reservoir, Yan Lake, and bamboo forests, while villagers can perceive a wider range of social values in their daily life scenes and production spaces, mainly in their attention to the numerous settlements in the west and tea gardens in the south. On the contrary, the social value points marked by tourists are relatively concentrated around tourist attractions, tending towards places with a mature service industry. From the perspective of four social value types, the perception differences are mainly reflected in the importance attached to biodiversity value and the spatial distribution of each social value (Figure 9).
The spatial distribution difference of aesthetic value is reflected in the way that villagers pay more attention to such areas as the large water bodies in the center, bamboo forests in the northeast, and large areas of cultivated land in the northwest, while tourists are clearly more interested in the beauty of scenic spots around tourist villages and water bodies. The bamboo forests are endowed with a higher health care value by the villagers, and some of the settlements with better landscape quality also provide health care value, although these places are somewhat insignificant compared to the natural environment, while the values preferred by the tourists are mainly concentrated in areas where artificial transformation of nature is evident, such as country villas and in Huanglongxian. The spatial distribution of the recreation value varies most significantly, as shown by the fact that the rural settlements in the west are far less attractive to tourists than Huanglongxian. Tourists attach more importance to the biodiversity value, especially preferring the mountain area in the southeast, which means that tourists can better consider habitat conservation when carrying out construction activities.
Moreover, there may be trade-off and synergistic relationships between the perceived social values of different groups, and this complex relationship not only indirectly reflects the environmental behaviors of villagers and tourists, but also provides rural decision makers with more reasonable solution strategies in management and in actual planning. According to Table 6, there are significant correlations among all types of social values, and both groups of perceived aesthetic and recreational values show the strongest positive correlations, indicating that they identify with the beautiful scenery of the beautiful scenery of Paifang rural community, with physical and mental pleasure at the same time. The biodiversity value shows negative correlations with the other three values, which inspires that tourism infrastructure should not be built at the cost of destroying habitat quality in order to promote the synergistic gain of all social values. Meanwhile, the difference in correlation coefficients between the aesthetic and biodiversity values is over 0.2 between the two groups, with a stronger perception by villagers. Considering that villagers prefer attractions in less well-known areas, the scope of ecological protection should not be limited only to areas with concentrated tourism resources, and further partition protection planning can be made by combing ecological sensitivity evaluation and other study.
4. Discussion
The rural ecosystem is an important part of the living environment, and its sustainability issues are closely related to global issues, such as ecosystem health and human well-being. Currently, the ability of rural ecosystem to provide services has attracted the attention of governments and ecologists due to the impact of rapid urbanization. In China, the rural areas have been studied and planned as an ecological space complex under the promotion of several policies, such as the beautiful countryside construction and the rural revitalization strategy. In this context, it is of great theoretical significance to reconsider the spatial interdependence of ES and the spatial perception processes in ES valuation.
The method system proposed in this research (Figure 1) is both universal and typical. The classification of value types (Table 1) and the establishment of the environmental raster datasets (Table 2) are consistent with the rules of the rural ecosystem composition and its character. Additionally, comparing the different perceptions among stakeholders can scientifically design incentives for ES provision by the public. Moreover, a deeper understanding of the social values for rural ES from a spatial ecological wisdom perspective requires the further discussion of two issues. Firstly, which environmental factors are relatively more important for social values enhancement? Secondly, how can the results of the evaluation to space optimization be applied?
4.1. Significance of Environmental Variables to the Model
The environmental factors affect the diversity and intensity of social values [21]. Analyzing the correlation between variables and value types alone makes it difficult to accurately select the geographical factors that contribute more significantly to ecosystem function enhancements in actual management practices, but may instead cause more serious damage to ecosystems due to drastic changes in numerous environmental conditions. Therefore, discussing the significance of the environmental variables to the model helps save ecological management costs and maximize the ecological benefits of variables.
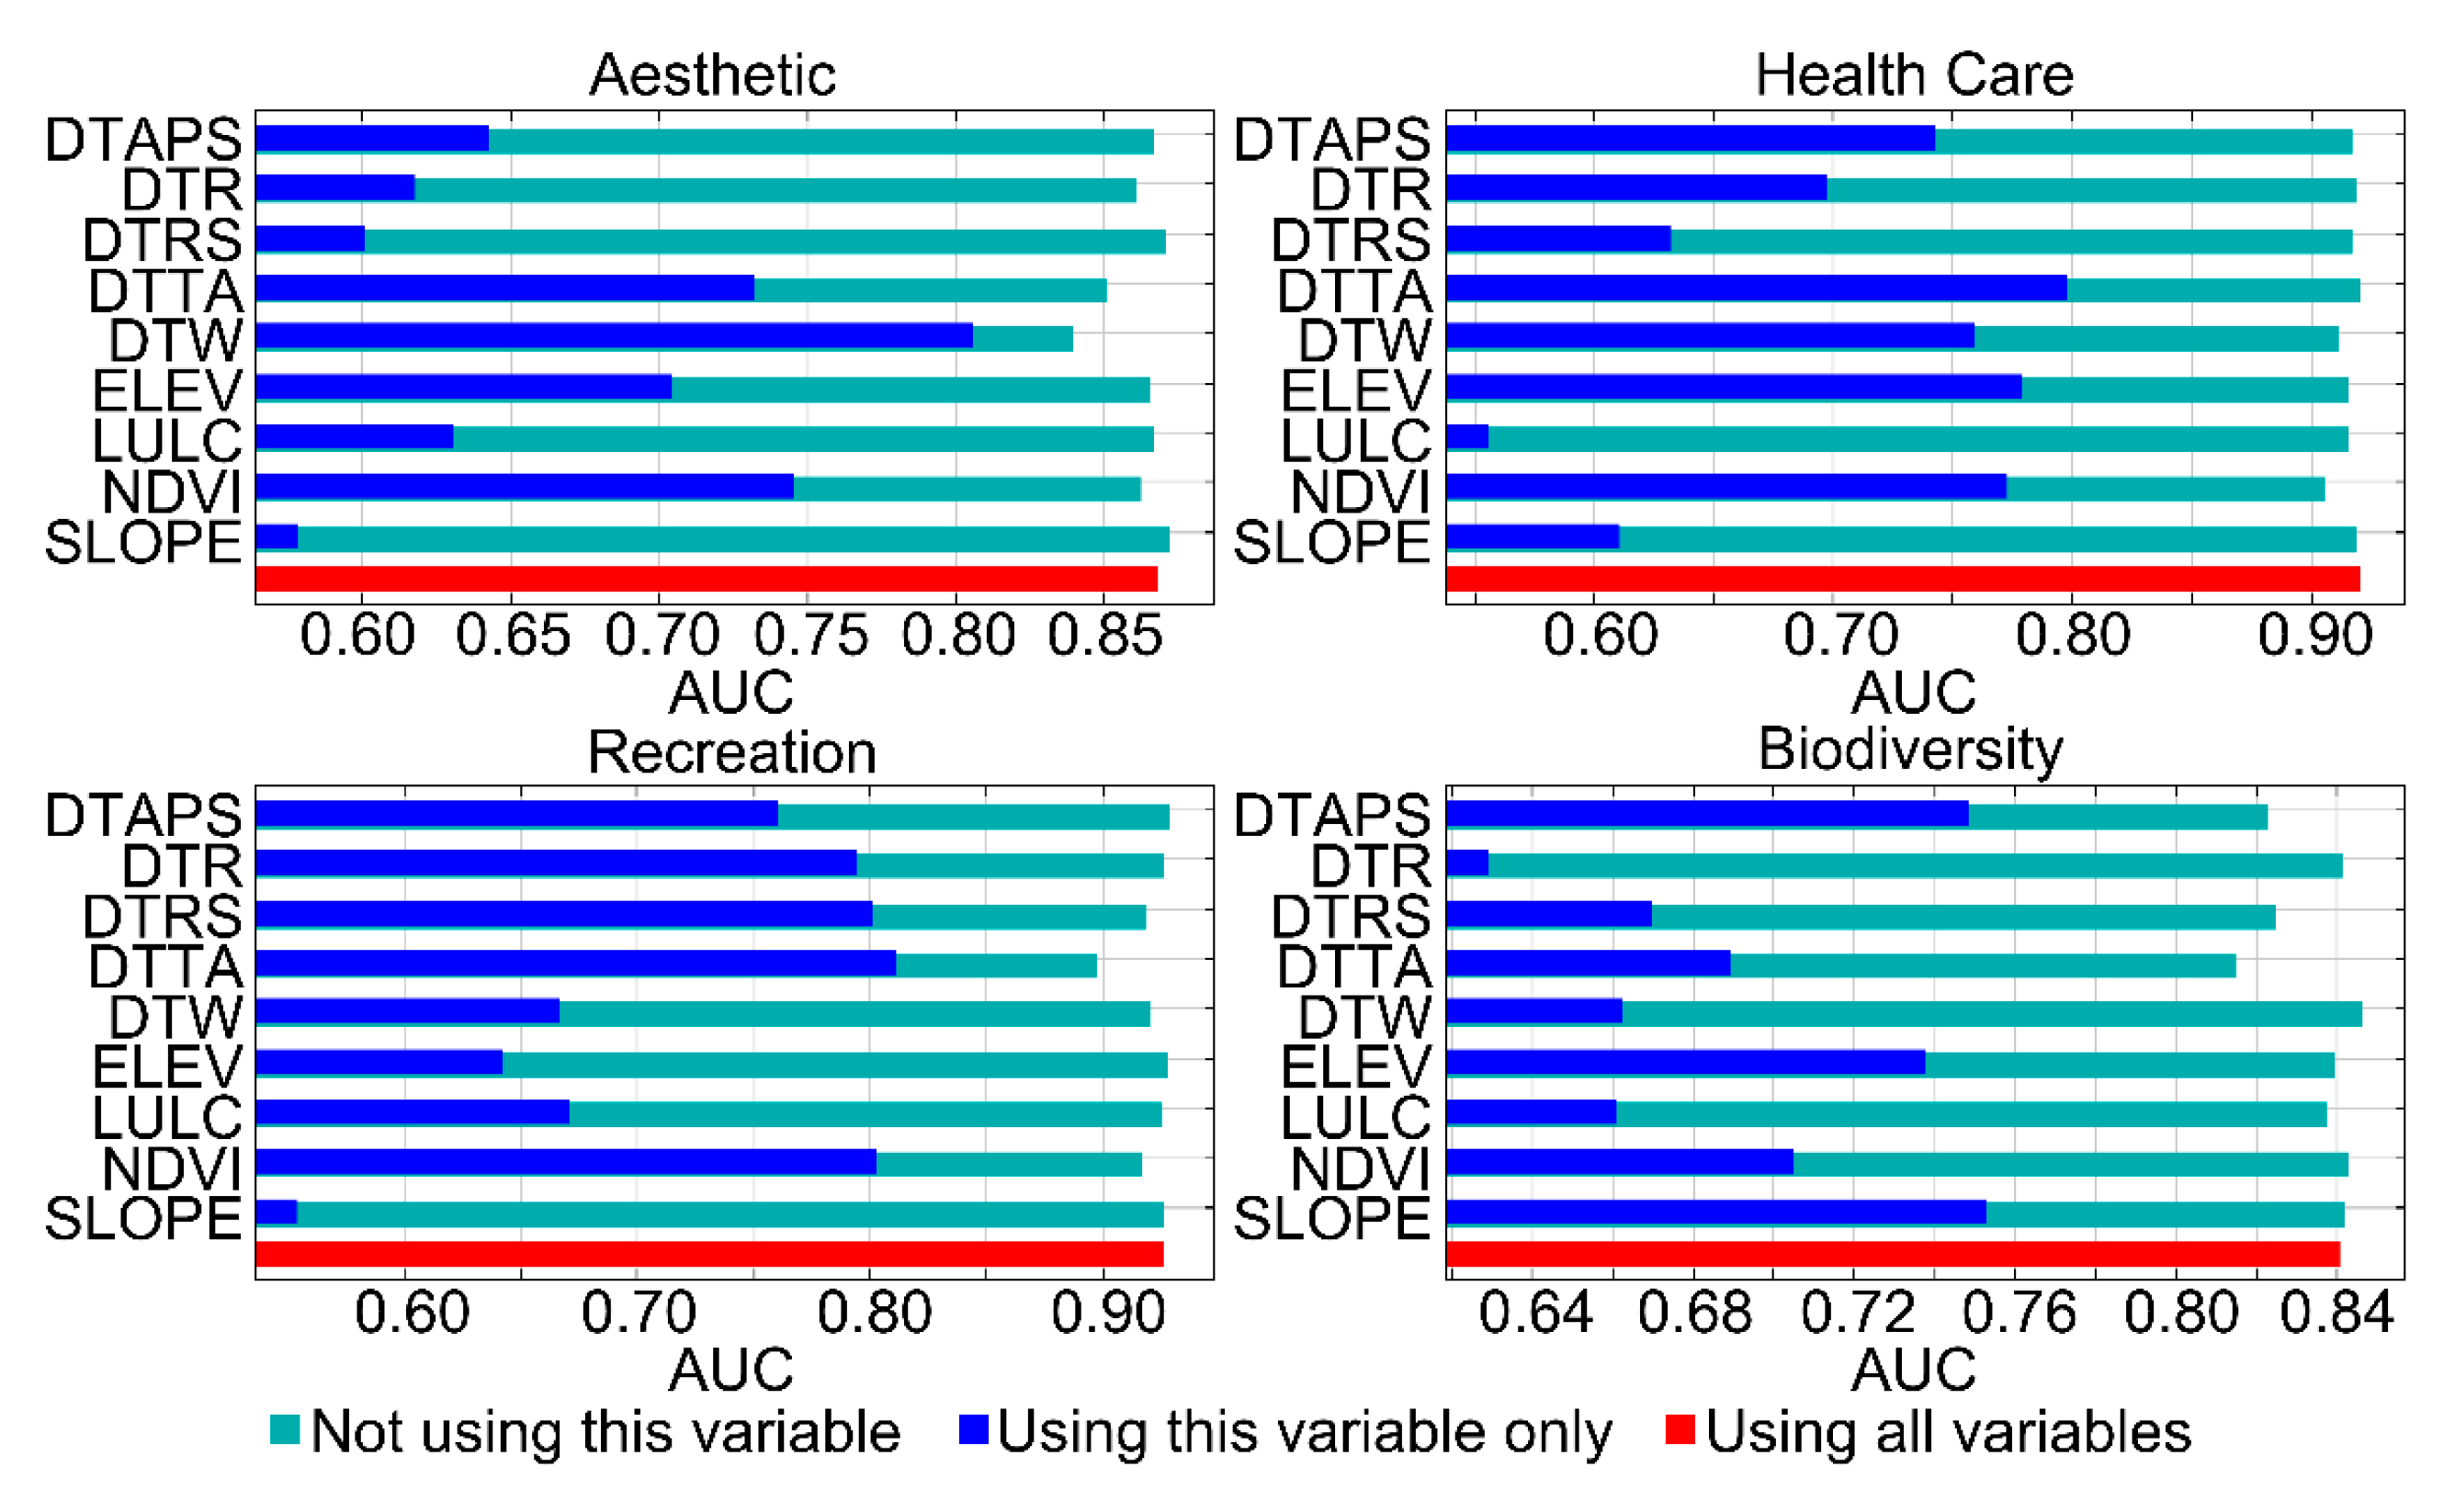
When the SolVES model is applied, the MaxEnt model uses the jackknife test to determine the significance of each variable on the distribution of social value types. The variable’s percent contribution, reported by the MaxEnt model, represents the contribution of environmental variables to the model, and the permutation importance is calculated to represent the irreplaceability of each variable (Table 7). Moreover, the results of the jackknife test are used to reflect the AUC changes of the model’s operation under three situations, namely using all environmental variables, using some environmental variables alone, or using all other variables except for the environmental variable to explore the impact of the environmental variables on the model’s operation (Figure 10).
Among all natural variables, DTW and NDVI both have greater significance in the model. NDVI has a high percentage contribution to the model, has a significant effect on the rise in the AUC, and shows the highest permutation importance (32.4%) in the health care value. The newly introduced anthropogenic variables all have an important impact on the operation of the model with more than one social value. Among them, DTRS has a strong irreplaceability in the model’s operation of recreation value, while DTAPS is a significant contributor to the biodiversity value only, showing the highest percent contribution (24.7%). DTTA plays the most prominent role in the model, with the highest permutation importance of biodiversity value (26.6%), and the highest percent contribution to aesthetic value (45.5%), health care value (43.9%), and recreation value (53.0%), and it ranks in the top three in AUC when using it alone.
In order to further explore the influence of the newly introduced environmental variables on the model’s operation results, the five most commonly used variables in previous studies were applied to rerun the SolVES model and generate new maps (Figure 11). Comparing Figure 6 and Figure 11, the accuracy of the results is greatly affected when the newly introduced variables are not applied. The high and low values of each VI are greatly expanded in the distribution range to different extents, with the most significant increase in VI on the western and southern sides. The aesthetic value, whose model operation results are greatly affected by DTTA, cannot form hotspot areas in bamboo forests in the northeast, and the recreation value, greatly affected by DTRS, cannot form hotspots in the rural settlements in the west. Meanwhile, the health care value, greatly affected by NDVI and DTTA, form wider hotspot areas in the central large water body and its surrounding forests, and the biodiversity value, whose model operation results with substantial contributions by DTAPS, form larger hotspots in the northern mountains. Therefore, the SolVES model is greatly affected by NDVI, DTRS, DTTA, and DTAPS in assessing social values for rural ES.
4.2. Reflection on Rural Space Optimization
Ecosystem functions are multiple in rural areas, but unreasonable construction or spatial planning can easily destroy the ecosystem and reduce its ability to provide services. Therefore, in order to promote rural sustainable development, it is necessary to explore approaches to optimize the rural space from an ecological perspective.
Social values reflect the social attributes and spatial heterogeneity of ES, which can reveal the spatial perception and express the character of the rural community, so taking the assessment of social values for ES as the reference can promote the diversification of ES values at the spatial level. The specific methods of optimization are reflected in four aspects, including planning orientation, spatial layout, distribution of factors, and public demands. First, the dominant social value types for ES in rural areas can be determined, including cultural inheritance, recreational service, cognitive experience and material supply, so that rural sustainable development goals can be perfected from the level of planning orientation; furthermore, the spatial layout in rural areas for ES values promotion can be defined according to the distribution of cold and hotspots of social value. For example, rural areas where material supply is the dominant social value should focus on the provision of ES, such as improving food production, carbon dioxide capture, and biodiversity, and providing more employment opportunities in the hotspots of economic value. Second, rural space optimization involves a variety of environmental factors, which affect the intensity and diversity of social values for ES. Taking the significance of environmental variables to social value as a reference can effectively reduce the ecosystem degradation caused by the changes in environmental factors. Taking the Paifang rural community as an example, NDVI and DTTA should be given priority considering that they generally have important impacts on each model. In addition, it is necessary to clarify the correlation between the environmental variables and social values in order to optimize the coupling mode of environmental factors in rural areas. Finally, social values for ESs interconnect perceptions toward the natural world in different groups, so that the perception differences between villagers and tourists should be considered to provide a reference for building bottom-up spatial governance in decision making. Since rural landscape units are the core carrier of rural spatial ecological wisdom, the results of different spatial perception can be implemented in specific spatial units, such as living, production, and ecological units [23]. For the rural living landscape units strongly perceived by villagers, attention should be paid to the improvement of the internal infrastructure and accessibility within the settlements, and landscape units containing important resources of cultural landscape, such as historic sites, should be preserved. On the other hand, for the ecological landscape units with a strong perception among tourists, opportunities for sightseeing and learning about local species, while retaining the natural attributes of rural environment, should be appropriately provided.
4.3. Limitations and Prospects of the Study
Firstly, this paper identified the influencing factors of social values through the rural landscape character to reclassify and describe the social values. However, there may still be ambiguity in the boundaries between different value types due to the complex composition of the rural ecosystem. Currently, there is no unified standard for the way of classifying social values for ES, so it is necessary to continue thinking about how to divide more reasonable and comprehensive evaluation indicators. Secondly, spatial and temporal evolutionary patterns of land use landscapes and regional vegetation may lead to changes in the social values for ES [40]. Therefore, future studies can further explore the spatiotemporal variation in the social values for ES in rural areas. In addition, it is of great importance to identify natural spaces with key ecological functions in rapidly urbanized areas [41], and the application of social value assessment in the identification of natural spaces based on multi-ecosystem services evaluation can also be explored.
5. Conclusions
Through taking the Paifang rural community as an example to assess social values for ESs in rural areas, this paper bridges the limitations of the application study of the SolVES model in rural areas in terms of methodology and research content. Based on the complex ecosystem theory and the measures of rurality, this paper selects the four environmental variables of NDVI, DTRS, DTTA, and DTAPS to rebuild the environmental raster datasets on a village scale. Furthermore, perception differences of social values by core stakeholder groups in rural areas are compared, bridging the gap in the comparative perception studies of social value assessment in rural areas. Comprehensively, the SolVES model shows good applicability in the assessment of social values for rural ES with highly credible results. Our main findings are as follows: (1) The rural ecosystem in the Paifang rural community focuses on the value of recreational service. Aesthetic, health care, recreation, and biodiversity values are highly preferred among 10 secondary value types, and the hotspot areas are concentrated in tourist villages, around large water bodies, and at tourist attractions. (2) Four newly introduced environmental variables can effectively improve the accuracy of the assessment results. NDVI and DTTA generally have an important impact on the model, with NDVI having the strongest irreplaceability of the health care value and DTTA contributing the most to all social values other than biodiversity, while DTRS and DTAPS greatly influence the recreation and biodiversity values, respectively. (3) The perception differences between villagers and tourists are reflected in the identification of hotspots, the spatial distribution of social values, and the importance attached to biodiversity value, and the trade-off relationships between the aesthetic and biodiversity value. Villagers pay more attention to rural settlements and agricultural production space, while tourists tend to choose places around tourist attractions with a mature service industry and prefer the biodiversity value of mountains. The reasons for these differences may be related to accessibility, tourism, and subjective preferences of respondents.
The SolVES model links social and ecological data to provide public perception results and spatial information for the assessment of social values for rural ES, which is conducive to environmental decision making and landscape planning in rural areas. Based on the results of the assessment, our research provides certain technical and practical support for maintaining regional ecosystem balance and promoting sustainable development.
Author Contributions
Conceptualization, H.D. and N.X.; methodology, H.D. and N.X.; software, H.D.; validation, H.D.; formal analysis, H.D. and N.X.; investigation, H.D.; resources, N.X.; data curation, H.D.; writing—original draft preparation, H.D.; writing—review and editing, N.X.; visualization, H.D.; supervision, N.X.; project administration, N.X.; funding acquisition, N.X. All authors have read and agreed to the published version of the manuscript.
Funding
This research was funded by the National Key R&D Program of China (2019YFD1100405) and the National Natural Science Foundation of China (51978147).
Informed Consent Statement
Informed consent was obtained from all the subjects involved in the study.
Data Availability Statement
The data presented in this study are available from the corresponding author on reasonable request. The data are not publicly available due to some of them being used in other studies that have not yet been publicly published.
Conflicts of Interest
The authors declare no conflict of interest.
Abbreviation
List of abbreviations in the article.
| Abbreviation | Full Name |
| SolVES | social values for ecosystem services |
| ES | ecosystem services |
| ELEV | elevation |
| SLOPE | slope |
| DTR | distance to road |
| DTW | distance to water |
| LULC | land use and land cover |
| LT | landscape types |
| DTC | distance to coast |
| NDVI | normalized difference vegetation index |
| DTRS | distance to rural settlement |
| DTTA | distance to tourist attractions |
| DTAPS | distance to agricultural production space |
| VI | value index |
| M-VI | maximum value index |
| MaxEnt | maximum entropy |
| AUC | area under the receiver operating characteristic curve |
| VIF | variance inflation factors |
| ROC | receiver operating characteristic curve |
| % Con. | percent contribution |
| Imp. | permutation importance |
References
- Costanza, R.; d’Arge, R.; De Groot, R.; Farber, S.; Grasso, M.; Hannon, B.; Limburg, K.; Naeem, S.; O’neill, R.V.; Paruelo, J. The value of the world’s ecosystem services and natural capital. Nature 1997, 387, 253–260. [Google Scholar] [CrossRef]
- Wallace, K.J. Classification of ecosystem services: Problems and solutions. Biol. Conserv. 2007, 139, 235–246. [Google Scholar] [CrossRef] [Green Version]
- Sherrouse, B.C.; Semmens, D.J. Validating a method for transferring social values of ecosystem services between public lands in the Rocky Mountain region. Ecosyst. Serv. 2014, 8, 166–177. [Google Scholar] [CrossRef]
- Carpenter, S.R.; Mooney, H.A.; Agard, J.; Capistrano, D.; DeFries, R.S.; Díaz, S.; Dietz, S.; Duraiappah, A.K.; Oteng-Yeboah, A.; Pereira, H.M.; et al. Science for managing ecosystem services: Beyond the Millennium Ecosystem Assessment. Proc. Natl. Acad. Sci. USA 2009, 106, 1305–1312. [Google Scholar] [CrossRef] [PubMed] [Green Version]
- Chan, K.M.A.; Satterfield, T.; Goldstein, J. Rethinking ecosystem services to better address and navigate cultural values. Ecol. Econ. 2012, 74, 8–18. [Google Scholar] [CrossRef] [Green Version]
- Van Riper, C.J.; Kyle, G.T.; Sutton, S.G.; Barnes, M.; Sherrouse, B.C. Mapping outdoor recreationists’ perceived social values for ecosystem services at Hinchinbrook Island National Park, Australia. Appl. Geogr. 2012, 35, 164–173. [Google Scholar] [CrossRef]
- Rolston, H., III; Coufal, J. A forest ethic and multivalue forest management. J. For. 1991, 89, 35–40. [Google Scholar] [CrossRef]
- Brown, G.; Reed, P. Validation of a forest values typology for use in national forest planning. For. Sci. 2000, 46, 240–247. [Google Scholar] [CrossRef]
- Brown, G. Social–ecological hotspots mapping: A spatial approach for identifying coupled social–ecological space. Landsc. Urban Plan. 2008, 85, 27–39. [Google Scholar] [CrossRef]
- Sherrouse, B.C.; Clement, J.M.; Semmens, D.J. A GIS application for assessing, mapping, and quantifying the social values of ecosystem services. Appl. Geogr. 2011, 31, 748–760. [Google Scholar] [CrossRef]
- Zhang, Z.; Zhang, H.; Feng, J.; Wang, Y.; Liu, K. Evaluation of social values for ecosystem services in urban riverfront space based on the solves model: A case study of the fenghe river, Xi’an, China. Int. J. Environ. Res. Public Health 2021, 18, 2765. [Google Scholar] [CrossRef]
- Ma, Q.; Chen, Z.; Zeng, M. Research on the Social Value of Urban Park Ecosystem Services Based on Population Characteristics Difference. Open J. Soc. Sci. 2021, 9, 243–258. [Google Scholar] [CrossRef]
- Makovníková, J.; Kobza, J.; Pálka, B.; Mališ, J.; Kanianska, R.; Kizeková, M. An approach to mapping the potential of cultural agroecosystem services. Soil Water Res. 2016, 11, 44–52. [Google Scholar] [CrossRef] [Green Version]
- Petway, J.R.; Lin, Y.-P.; Wunderlich, R.F. A place-based approach to agricultural nonmaterial intangible cultural ecosystem service values. Sustainability 2020, 12, 699. [Google Scholar] [CrossRef] [Green Version]
- Xie, H.; Zhu, Z.; He, Y.; Zeng, X.; Wen, Y. Integrated framework of rural landscape research: Based on the global perspective. Landsc. Ecol. 2022, 37, 1161–1184. [Google Scholar] [CrossRef]
- Yu, H.; Xu, L.; Li, S.; Li, Y.; Li, J. Do Protected Areas Exacerbate Rural Shrinkage? Research on China’s Gaoligong Mountain Region from an Institutional-Space Perspective. Forests 2022, 13, 1567. [Google Scholar] [CrossRef]
- Su, Q.; Wang, L. Construct the Framework for the Allocation of Resources Invested in Ecological Governance from the Urban–Rural Land Use Coupling. Forests 2022, 13, 1588. [Google Scholar] [CrossRef]
- Wu, Y.; Liao, Y.; Xu, M.; He, J.; Tao, Y.; Zhou, J.; Chen, W. Barriers identification, analysis and solutions to rural clean energy infrastructures development in China: Government perspective. Sust. Cities Soc. 2022, 86, 104106. [Google Scholar] [CrossRef]
- Šťastná, M.; Vaishar, A.; Vavrouchová, H.; Mašíček, T.; Peřinková, V. Values of a suburban landscape: Case study of Podolí u Brna (Moravia), the Czech Republic. Sust. Cities Soc. 2018, 40, 383–393. [Google Scholar] [CrossRef]
- Sherrouse, B.C.; Semmens, D.J.; Ancona, Z.H.; Brunner, N.M. Analyzing land-use change scenarios for trade-offs among cultural ecosystem services in the Southern Rocky Mountains. Ecosyst. Serv. 2017, 26, 431–444. [Google Scholar] [CrossRef]
- Zhang, H.; Gao, Y.; Hua, Y.; Zhang, Y.; Liu, K. Assessing and mapping recreationists’ perceived social values for ecosystem services in the Qinling Mountains, China. Ecosyst. Serv. 2019, 39, 101006. [Google Scholar] [CrossRef]
- Liu, Y.; Yang, C.; Tan, S.; Zhou, H.; Zeng, W. An approach to assess spatio-temporal heterogeneity of rural ecosystem health: A case study in Chongqing mountainous area, China. Ecol. Indic. 2022, 136, 108644. [Google Scholar] [CrossRef]
- Chen, Z.; Wang, Y. Spatial ecological wisdom for identification and cognition of rural landscape units: A case study of Nanjing Paifang Rural Community. Landsc. Archit. 2022, 29, 30–36. [Google Scholar]
- Norton, L.; Greene, S.; Scholefield, P.; Dunbar, M. The importance of scale in the development of ecosystem service indicators? Ecol. Indic. 2016, 61, 130–140. [Google Scholar] [CrossRef] [Green Version]
- Ge, D.; Lu, Y. A strategy of the rural governance for territorial spatial planning in China. J. Geogr. Sci. 2021, 31, 1349–1364. [Google Scholar] [CrossRef]
- Pan, Y.; Marshall, S.; Maltby, L. Prioritising ecosystem services in Chinese rural and urban communities. Ecosyst. Serv. 2016, 21, 1–5. [Google Scholar] [CrossRef] [Green Version]
- Zhang, K.; Tang, X.; Zhao, Y.; Huang, B.; Huang, L.; Liu, M.; Luo, E.; Li, Y.; Jiang, T.; Zhang, L.; et al. Differing perceptions of the youth and the elderly regarding cultural ecosystem services in urban parks: An exploration of the tour experience. Sci. Total Environ. 2022, 821, 153388. [Google Scholar] [CrossRef]
- McAreavey, R.; McDonagh, J. Sustainable rural tourism: Lessons for rural development. Sociol. Rural 2011, 51, 175–194. [Google Scholar] [CrossRef] [Green Version]
- Hersperger, A.M.; Grădinaru, S.R.; Pierri Daunt, A.B.; Imhof, C.S.; Fan, P. Landscape ecological concepts in planning: Review of recent developments. Landsc. Ecol. 2021, 36, 2329–2345. [Google Scholar] [CrossRef]
- Clement, J.M.; Cheng, A.S. Using analyses of public value orientations, attitudes and preferences to inform national forest planning in Colorado and Wyoming. Appl. Geogr. 2011, 31, 393–400. [Google Scholar] [CrossRef]
- Wang, Y.; Chen, Z.; Cheng, Y. The representation system of rural landscape character and personality in the New Era. Landsc. Archit. 2020, 28, 107–113. [Google Scholar]
- Zhao, Q.; Li, J.; Liu, J.; Cuan, Y.; Zhang, C. Integrating supply and demand in cultural ecosystem services assessment: A case study of Cuihua Mountain (China). Environ. Sci. Pollut. Res. 2019, 26, 6065–6076. [Google Scholar] [CrossRef]
- Johnson, D.N.; Van Riper, C.J.; Chu, M.; Winkler-Schor, S. Comparing the social values of ecosystem services in US and Australian marine protected areas. Ecosyst. Serv. 2019, 37, 100919. [Google Scholar] [CrossRef]
- Nelson, K.S.; Nguyen, T.D.; Brownstein, N.A.; Garcia, D.; Walker, H.C.; Watson, J.T.; Xin, A. Definitions, measures, and uses of rurality: A systematic review of the empirical and quantitative literature. J. Rural Stud. 2021, 82, 351–365. [Google Scholar] [CrossRef]
- Lu, M.; Wei, L.; Ge, D.; Sun, D.; Zhang, Z.; Lu, Y. Spatial optimization of rural settlements based on the perspective of appropriateness–domination: A case of Xinyi City. Habitat Int. 2020, 98, 102148. [Google Scholar] [CrossRef]
- Singhania, O.; Swain, S.K.; George, B. Interdependence and complementarity between rural development and rural tourism: A bibliometric analysis. Rural Soc. 2022, 31, 15–32. [Google Scholar] [CrossRef]
- Zhang, H.; Chen, H.; Geng, T.; Liu, D.; Shi, Q. Evolutionary characteristics and trade-offs’ development of social–ecological production landscapes in the loess plateau region from a resilience point of view: A case study in Mizhi County, China. Int. J. Environ. Res. Public Health 2020, 17, 1308. [Google Scholar] [CrossRef] [Green Version]
- Phillips, S.J.; Anderson, R.P.; Schapire, R.E. Maximum entropy modeling of species geographic distributions. Ecol. Model. 2006, 190, 231–259. [Google Scholar] [CrossRef] [Green Version]
- Sen, S.; Guchhait, S.K. Urban green space in India: Perception of cultural ecosystem services and psychology of situatedness and connectedness. Ecol. Indic. 2021, 123, 107338. [Google Scholar] [CrossRef]
- Han, W.; Chen, D.; Li, H.; Chang, Z.; Chen, J.; Ye, L.; Liu, S.; Wang, Z. Spatiotemporal Variation of NDVI in Anhui Province from 2001 to 2019 and Its Response to Climatic Factors. Forests 2022, 13, 1643. [Google Scholar] [CrossRef]
- Shen, J.; Guo, X.; Wang, Y. Identifying and setting the natural spaces priority based on the multi-ecosystem services capacity index. Ecol. Indic. 2021, 125, 107473. [Google Scholar] [CrossRef]
Figure 1.
The research framework of assessing social values for rural ecosystem services.

Figure 2.
The relationships between character of the rural community and social values for rural ecosystem services.
Figure 2.
The relationships between character of the rural community and social values for rural ecosystem services.

Figure 3.
Location of the Paifang rural community.

Figure 4.
The demographic information of the respondents.

Figure 5.
Spatial distribution density of social value points in the Paifang rural community.

Figure 6.
Spatial distribution of four social value types in the Paifang rural community.

Figure 7.
Relationship between the value index of four social value types and environmental variables in the Paifang rural community.
Figure 7.
Relationship between the value index of four social value types and environmental variables in the Paifang rural community.

Figure 8.
Comparison of the spatial distribution density of the social value points marked by the villagers and tourists in the Paifang rural community.
Figure 8.
Comparison of the spatial distribution density of the social value points marked by the villagers and tourists in the Paifang rural community.

Figure 9.
Differences in the perception of the spatial distribution of social values among the villagers and tourists in the Paifang rural community.
Figure 9.
Differences in the perception of the spatial distribution of social values among the villagers and tourists in the Paifang rural community.

Figure 10.
AUC of the jackknife test results of environmental variables.

Figure 11.
Spatial distribution of four social value types generated based on five environmental variables in Paifang Rural Community.
Figure 11.
Spatial distribution of four social value types generated based on five environmental variables in Paifang Rural Community.


Table 1.
Types and descriptions of social values for rural ecosystem services.
| Primary Social Value Type | Secondary Social Value Type | Description |
|---|---|---|
| Cultural inheritance | Cultural and historical | It possesses historical landscapes or the preservation of folk traditions and customs. |
| Future | It provides opportunities to experience rural life. | |
| Recreation service | Recreation | It provides outdoor venues and facilities for leisure. |
| Health care | It provides resources for fitness health promotion and physical and mental relaxation. | |
| Cognitive experience | Aesthetic | It has beautiful scenery in terms of both nature and architecture. |
| Spiritual | It provides spiritual and emotional support or cultivates respect for nature. | |
| Education | It provides educational opportunities and scientific research bases to convey ecological wisdom. | |
| Material supply | Life sustaining | It helps water and soil conservation, air purification, and climate regulation. |
| Biodiversity | It is rich in species resources and habitat types. | |
| Economic | It provides income sources, creating economic benefits. |
Table 2.
Environmental raster datasets for the SolVES model in rural areas.
| First-Level Variables | Second-Level Variables/ Abbreviation | Reasons for Selection |
|---|---|---|
| Natural variables | Elevation/ELEV | It reflects the complex terrain conditions. |
| Slope/SLOPE | It affects the construction in rural areas. | |
| Distance to water/DTW | It reflects the distribution of water, which affects the production and ecology. | |
| Normalized difference vegetation index/NDVI | It reflects the complex vegetation cover status on rural land, which affects the perception of species diversity and plant landscape. | |
| Anthropogenic variables | Land use and land cover/LULC | It reflects the utilization status of rural land resources, which affects land management. |
| Distance to road/DTR | It reflects the accessibility and infrastructure development, which affects rural construction. | |
| Distance to rural settlement/DTRS | It reflects the aggregation of the rural population, which affects the perception of local customs and historical landscape, and is related to the allocation of land resources. | |
| Distance to tourist attractions/DTTA | It reflects the scale of rural tourism, related to economic value and the utilization of material resources such as cultural heritage. | |
| Distance to agricultural production space/DTAPS | It reflects the spatial distribution of agricultural production space, which affects the social-ecological production landscape planning of rural areas. |
Table 3.
The maximum value index (M-VI) and spatial agglomeration of social value types in the Paifang rural community.
Table 3.
The maximum value index (M-VI) and spatial agglomeration of social value types in the Paifang rural community.
| Primary Social Value Type | Secondary Social Value Type | All Surveys | Villager | Tourist | |||
|---|---|---|---|---|---|---|---|
| M-VI (N) | R (Z) | M-VI (N) | R (Z) | M-VI (N) | R (Z) | ||
| Cultural heritage | Cultural and historical | 5 (51) | 0.34 (−9.02) | 4 (19) | 0.38 (−5.16) | 5 (32) | 0.38 (−6.68) |
| Future | 4 (90) | 0.53 (−8.50) | 4 (28) | 0.83 (−1.76) | 5 (62) | 0.53 (−7.08) | |
| Recreation service | Recreation | 7 (179) | 0.39 (−15.52) | 7 (100) | 0.46 (−10.26) | 7 (79) | 0.48 (−8.88) |
| Health care | 8 (223) | 0.43 (−16.18) | 8 (108) | 0.45 (−10.99) | 8 (115) | 0.45 (−11.36) | |
| Cognitive experience | Aesthetic | 9 (281) | 0.50 (−16.08) | 10 (149) | 0.48 (−12.09) | 10 (132) | 0.44 (−12.26) |
| Spiritual | 5 (80) | 0.52 (−8.22) | 4 (33) | 0.64 (−3.96) | 7 (47) | 0.49 (−6.65) | |
| Education | 4 (58) | 0.30 (−10.21) | 4 (26) | 0.11 (−8.69) | 4 (32) | 0.39 (−6.65) | |
| Material supply | Life sustaining | 4 (55) | 0.63 (−5.30) | 1 (15) | 1.00 (−0.03) | 4 (40) | 0.55 (−5.45) |
| Biodiversity | 6 (169) | 0.67 (−8.31) | 5 (102) | 0.67 (−6.47) | 6 (67) | 0.73 (−4.27) | |
| Economic | 5 (161) | 0.50 (−12.15) | 5 (89) | 0.49 (−9.14) | 4 (72) | 0.45 (−8.87) | |
Note: N is the number of social value points; R is the average nearest neighbor ratio; and Z is the multiple of standard deviation.
Table 4.
Test AUC of each social value type in the Paifang rural community.
| Social Value Type | Test AUC | ||
|---|---|---|---|
| All Surveys | Villager | Tourist | |
| Aesthetic | 0.881 | 0.899 | 0.915 |
| Health care | 0.933 | 0.940 | 0.962 |
| Recreation | 0.956 | 0.928 | 0.971 |
| Biodiversity | 0.904 | 0.878 | 0.910 |
Note: AUC is area under the curve, representing the area under the receiver operating characteristic curve (ROC).
Table 5.
Collinearity statistics of environmental variables.
| Environmental Variable | Collinearity Statistics | |
|---|---|---|
| Variance Inflation Factor | Tolerance | |
| ELEV | 3.869 | 0.258 |
| SLOPE | 1.531 | 0.653 |
| DTW | 3.122 | 0.320 |
| NDVI | 1.643 | 0.609 |
| LULC | 1.240 | 0.806 |
| DTR | 1.368 | 0.731 |
| DTRS | 2.361 | 0.424 |
| DTTA | 1.747 | 0.573 |
| DTAPS | 2.734 | 0.366 |
Table 6.
Correlation analysis of social values between villagers and tourists.
| Social Value Type | Group | Social Value Type | ||
|---|---|---|---|---|
| Aesthetic | Health Care | Recreation | ||
| Health care | Villager | 0.756 ** | ||
| Tourist | 0.797 ** | |||
| Recreation | Villager | 0.611 ** | 0.556 ** | |
| Tourist | 0.537 ** | 0.588 ** | ||
| Biodiversity | Villager | −0.487 ** | −0.330 ** | −0.397 ** |
| Tourist | −0.255 ** | −0.284 ** | −0.344 ** | |
Note: ** refers to the Pearson correlation coefficient < 0.01.
Table 7.
Percent contribution (% Con.) and permutation importance (Imp.) of variables.
| Variable | Aesthetic | Health Care | Recreation | Biodiversity | ||||
|---|---|---|---|---|---|---|---|---|
| % Con. | Imp. | % Con. | Imp. | % Con. | Imp. | % Con. | Imp. | |
| ELEV | 4.0% | 5.5% | 2.2% | 7.2% | 2.5% | 4.3% | 6.8% | 5.8% |
| SLOPE | 0.5% | 0.6% | 0.2% | 1.2% | 0.9% | 2.4% | 3.2% | 3.6% |
| DTW | 34.0% | 23.6% | 10.2% | 7.8% | 1.6% | 3.4% | 3.8% | 6.6% |
| NDVI | 6.2% | 4.1% | 22.0% | 32.4% | 13.5% | 13.6% | 18.9% | 5.8% |
| LULC | 0.4% | 1.7% | 0.4% | 2.3% | 0.2% | 0.1% | 1.0% | 0.9% |
| DTR | 3.8% | 2.0% | 4.6% | 14.7% | 14.0% | 9.3% | 17.0% | 20.7% |
| DTRS | 2.7% | 5.9% | 3.7% | 8.7% | 12.5% | 27.6% | 15.3% | 14.1% |
| DTTA | 45.5% | 47.9% | 43.9% | 17.2% | 53.0% | 37.9% | 9.3% | 26.6% |
| DTAPS | 2.9% | 8.8% | 12.8% | 8.5% | 1.8% | 1.4% | 24.7% | 16.1% |
Publisher’s Note: MDPI stays neutral with regard to jurisdictional claims in published maps and institutional affiliations. |
© 2022 by the authors. Licensee MDPI, Basel, Switzerland. This article is an open access article distributed under the terms and conditions of the Creative Commons Attribution (CC BY) license (https://creativecommons.org/licenses/by/4.0/).
Share and Cite
MDPI and ACS Style
Duan, H.; Xu, N. Assessing Social Values for Ecosystem Services in Rural Areas Based on the SolVES Model: A Case Study from Nanjing, China. Forests 2022, 13, 1877. https://doi.org/10.3390/f13111877
AMA Style
Duan H, Xu N. Assessing Social Values for Ecosystem Services in Rural Areas Based on the SolVES Model: A Case Study from Nanjing, China. Forests. 2022; 13(11):1877. https://doi.org/10.3390/f13111877
Chicago/Turabian StyleDuan, Haoran, and Ning Xu. 2022. "Assessing Social Values for Ecosystem Services in Rural Areas Based on the SolVES Model: A Case Study from Nanjing, China" Forests 13, no. 11: 1877. https://doi.org/10.3390/f13111877
Note that from the first issue of 2016, this journal uses article numbers instead of page numbers. See further details here.