
Subjective Preference and Visual Attention to the Attributes of Ornamental Plants in Urban Green Space: An Eye-Tracking Study

1
College of Civil Engineering, Putian University, Putian 351100, China
2
Department of Landscape Architecture, Fujian Forestry Vocational & Technical College, Nanping 353000, China
3
College of Architecture and Urban Planning, Fujian University of Technology, Fuzhou 350118, China
*
Author to whom correspondence should be addressed.
Forests 2022, 13(11), 1871; https://doi.org/10.3390/f13111871
Submission received: 21 October 2022
/
Revised: 4 November 2022
/
Accepted: 7 November 2022
/
Published: 9 November 2022
(This article belongs to the Special Issue Forest, Trees, Human Health and Wellbeing)
Abstract
:Visual attributes of greenery strongly affect the attention and preferences of people. We invited 90 volunteers to participate in a study on the subjective rating and eye tracking on the landscape attributes of greenery to determine the relationship between subjective preference and visual attention to the visual attributes of greenery. The results showed that the subjective ratings of Tree + shrub + grass (IV-A), blue flower (II-A), red flower (II-B), pink flower (II-C), broad-leaved tree (I-C), and bamboo (I-E) were relatively high, belonging to the high rating group. The random forest model showed that the fixation count could indicate a subjective preference. People generate visual attention by fixating on attractive visual attributes with high subjective ratings.
1. Introduction
All organisms exhibit environmental preferences, which might change as a result of evolution [1]. Preference for perceived beauty among humans depends on the perception of the natural environment and visual attention [2]. Subjective preference is closely related to the aesthetic value of the environment and modified by individual bias, which originates from the visual attention generated by visually attractive stimuli in the environment [3,4,5,6]. There is a strong linear correlation between the subjective preference and visual attention in humans, and this correlation might originate from the generation of memory [7]. People are generally more interested and visually attracted when they gaze at positive visual stimuli [4]. The stimuli with high visual attractiveness might draw visual attention and increase people’s preference for such stimuli [8]. There is a nonlinear dose response to the subjective preferences of people for environmental features [9]. Environmental changes can drive the subjective preferences of people for specific landscape attributes. The differences in color and size are especially noticed using the saliency method [10]. The gaze sequences in which people view a displayed product with different marketing elements accurately predict product choice [11,12]. People have distinct visual interests and subjective preferences for specific features of ornamental bamboo [13].
Eye tracking can be used as an adjunct to self-reporting or subjective evaluation [14]. Eye-tracking measures can explain visual attention and eye movement patterns [15]. Non-participatory surveys should be conducted to reduce the bias that occurs during self-reporting or subjective ratings [16]. Some studies combined subjective ratings with eye-tracking to determine visual attention and subjective preferences of people. For example, eye-tracking techniques were used to explain subjective preferences for plant features [13]. Another study was conducted to explain the effects of seasonal changes in vegetation on human physiology and psychology [17]. The results of an eye-tracking study showed that artificial elements affect the visual perception of mountain landscapes [18]. The measure of eye movement had a significantly positive relationship with landscape design intensity, which might be correlated with preferences and restorative perceptions [19]. The use of eye-tracking technology provides new insights into ornamental plant selection for urban green spaces [20]. The eye-tracking measures (e.g., fixation count, percentage of dwell time, fixation duration) can be used to interpret the human response to landscape elements, and it can also be used to assess natural aesthetic values [2].
Eye-tracking measures can be used to determine visual attention or preference of people for environmental features. The high attractiveness of environmental elements can draw visual attention and increase the number of gazes [21]. The fixation count and the percentage of dwell time were found to be significantly positively correlated with preference under different landscape design intensities [19]. The subsequence of a gaze can be used to judge the visual attractiveness of products when choosing them [11]. Landscapes with a high ornamental value are associated with an increase in pupil size, fixation duration, and fixation count to the area of interest, and a decrease in saccade amplitude [22]. More fixations were found in less restorative environments, which might be related to the lower cognitive effort required by humans to process natural environments [23]. However, other studies showed that there is no correlation between the number of fixations and restoration [24]. Exposure to restorative environments would help people recover from a stressful experience [25]. Visual-spatial frequency and power spectra would influence preference, cognitive load, and eye movements [26]. It was shown that places for forest recreation space that were associated with a greater frequency of eye movements had relatively lower subjective ratings [27]. The diameter of the pupil can reflect color preference and visual comfort [28]. Additionally, pupil diameter can reflect visual interest [29]. People pay visual attention (i.e., fixation count) to the features of bamboo with high subjective ratings [13]. Bamboo is a common type of greenery in urban landscapes. Different types of plant arrangements occur in urban green spaces, with a wide variety of plant communities and colorful flowers. Many studies have investigated the subjective preference for ornamental features such as flower color [30]. The method combining subjective preference surveys with eye-tracking technology has been used extensively to determine the preference for specific features or select species in urban green spaces [13,20]. Many studies have investigated the subjective preferences of people for plant attributes, but non-participatory surveys need to be conducted as additional evidence to confirm the authenticity of subjective preference. The purpose of this study attempts to explore the relationship between subjective preference and visual attention to the visual attributes of greenery. In this study, we addressed the following questions: (1) Which visual attributes of ornamental plants would attract people’s attention the most? (2) How did the response of the eyes of the participants change when viewing the different attributes of ornamental plants, as determined by eye-tracking? (3) Which measures of eye tracking were highly correlated with subjective preference? To address these questions, we designed questionnaires and eye-tracking experiments and evaluated the subjective preference and visual attention to attributes of ornamental plants.
2. Method
2.1. Participants
In total, 90 volunteers (31 males and 59 females) participated in the eye-tracking technology and subjective preference survey from August through September of 2021. The average age of the volunteers was 23.13 years (from 20 to 35 years old). The participants were recruited randomly, with 10% and 90% comprising temperate zone regions and tropical or subtropical regions. Those people with natural color vision, a certain aesthetic foundation, and a wide range of aesthetic perspectives were selected as participants.
2.2. Stimuli
Typical attributes of ornamental plants in urban green spaces were selected as stimuli. The attributes of ornamental plants were subdivided into four categories based on vegetation type, flower color, leaf color, and layer (Supplementary Figure S1). The subdivisions based on their attributes were as follows.
- (1)
- Vegetation type: grassland (I-A), shrub (I-B), broad-leaf tree (I-C), coniferous tree (I-D), bamboo (I-E), and palm (I-F)
- (2)
- Flower color: blue flower (II-A), red flower (II-B), pink flower (II-C), purple flower (II-D), white flower (II-E), and yellow flower (II-F)
- (3)
- Leaf color: green leaf (III-A), yellow leaf (III-B), and red leaf (III-C)
- (4)
- Layer: tree + shrub + grass (IV-A), shrub + grass (IV-B), shrub (IV-C), and grass (IV-D)
2.3. Procedure
The participants were invited to a quiet laboratory alone. They were asked to sit comfortably on a chair approximately 55 cm from the computer screen where the pictures were displayed. Each experimental stimulus was displayed for 15 s, with a five-second interval between pictures. When the participants were ready, they were informed of the intent, requirements, and procedure of the experiment. Before starting the eye-tracking experiment, the aim and purpose of this experiment were clarified, and the eye-tracking device and procedure were acknowledged [31]. Calibration and validation procedures of the eye tracker were conducted at the beginning of the experiment. After the experiment, the participants were invited to fill in the questionnaire regarding their preference for stimulus.
2.4. Measure
2.4.1. Subjective Ratings
A five-point Likert scale method was used to rate the degree of subjective preference for vegetation type, flower color, leaf color, and layer. The scale ranged from 1 to 5 representing strongly dislike, dislike, average, like, and strongly like, respectively.
The reliability and validity tests reflected the accuracy of the questionnaire and the consistency and stability of the results. The value of Cronbach’s α was used to determine the degree of reliability. When the value of Cronbach’s α was greater than 0.6, the data met the requirements of the reliability test [32]. The validity test mainly refers to the validity of the questionnaire, and the KMO (Kaiser–Meyer–Olkin) value was measured to determine the requirement of validity.
2.4.2. Eye-Tracking Measures
The eye-tracking experiment was conducted using a desktop EyeLink 1000 Plus, which recorded the eye movement data of the participants while they were viewing the stimuli (1024 × 768 pixels) for 15 s each. The sampling frequency was 1000 Hz/2000 Hz. The eye-tracking measures, pupil size (mm), first fixation duration, dwell time percentage (%), fixation count, saccade amplitude (degree), saccade velocity (degree/second), and saccade count were determined. The eye-tracking heatmap was generated by Data viewer (SR Research Ltd., Ottawa, ON, Canada).
2.5. Data Analysis
The program of experiments was performed using the SR Research Experiment Builder (SR Research Ltd., Ottawa, ON, Canada). The visual analysis was conducted in the Data viewer. One-way ANOVA and Tukey’s HSD post hoc tests were performed to determine subjective preferences and eye-tracking measures related to the attributes of ornamental plants. A Chi-squared test was performed for the eye-tracking measures and subjective ratings. The mean decrease accuracy was measured using the Random Forest algorithm. All statistical analyses were performed in R 3.6.3 and SPSS 19.0.
3. Results
3.1. Eye-Tracking Heatmap
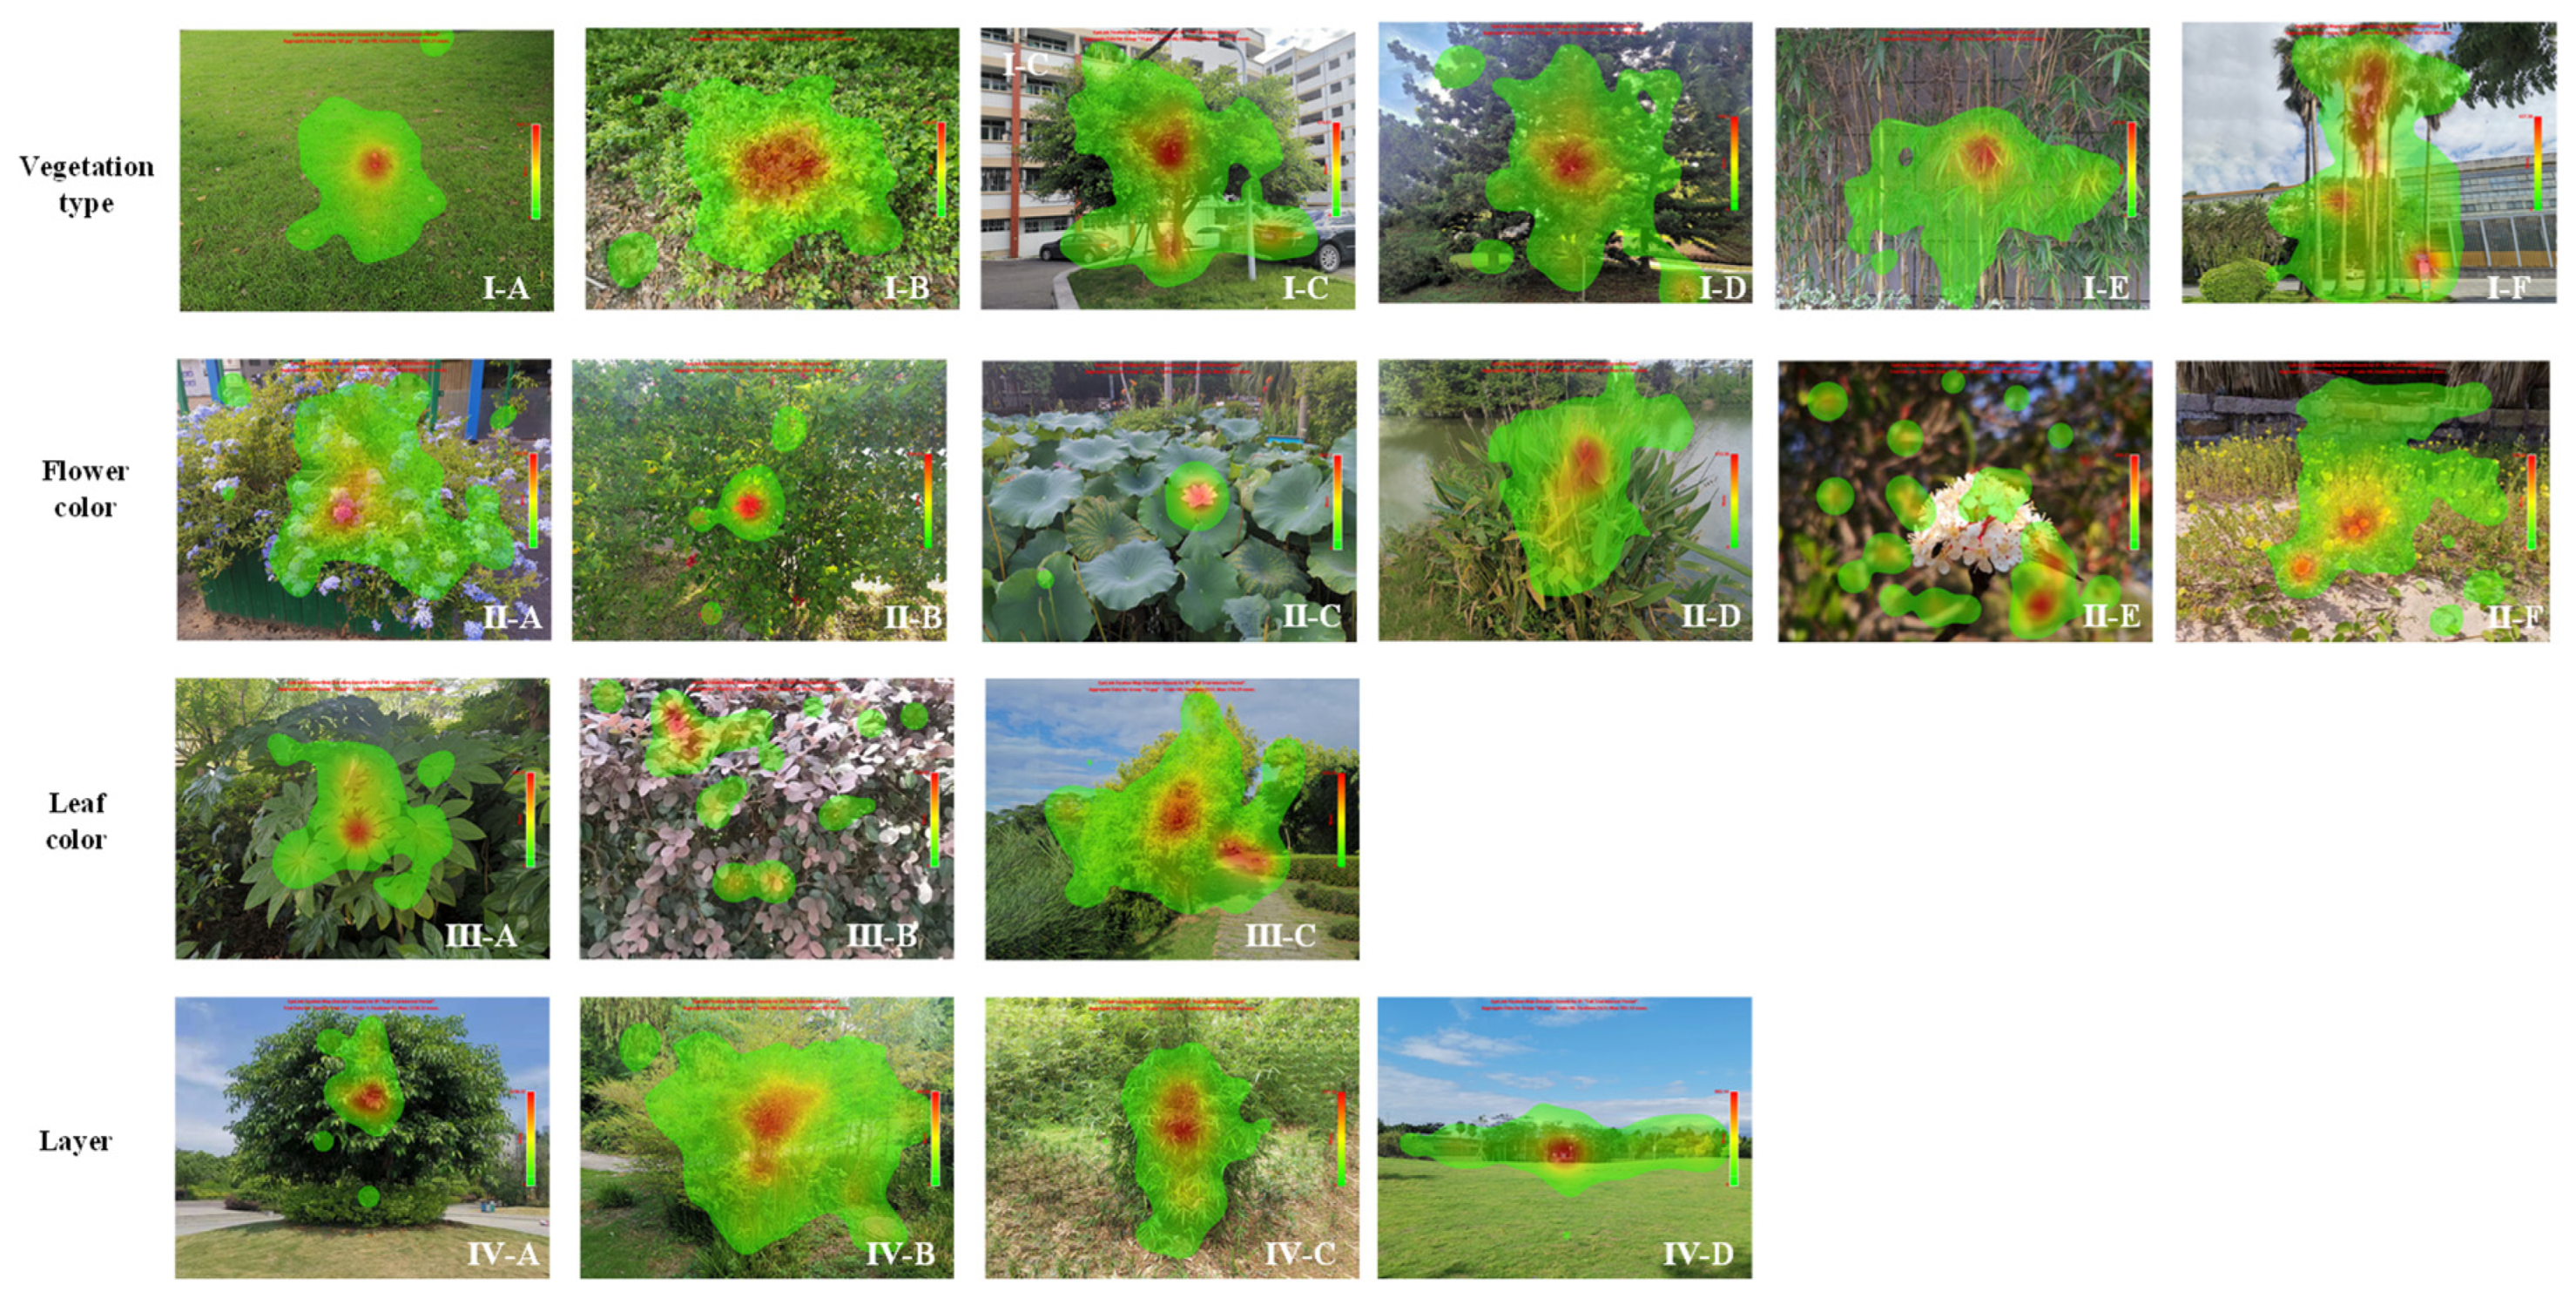
The heatmap of the different attributes of ornamental plants was different (Figure 1). The heatmap was generated based on the fixation area and fixation duration. The hotspots were concentrated in one or multiple areas in the heatmap of most stimuli.
3.2. Subjective Ratings
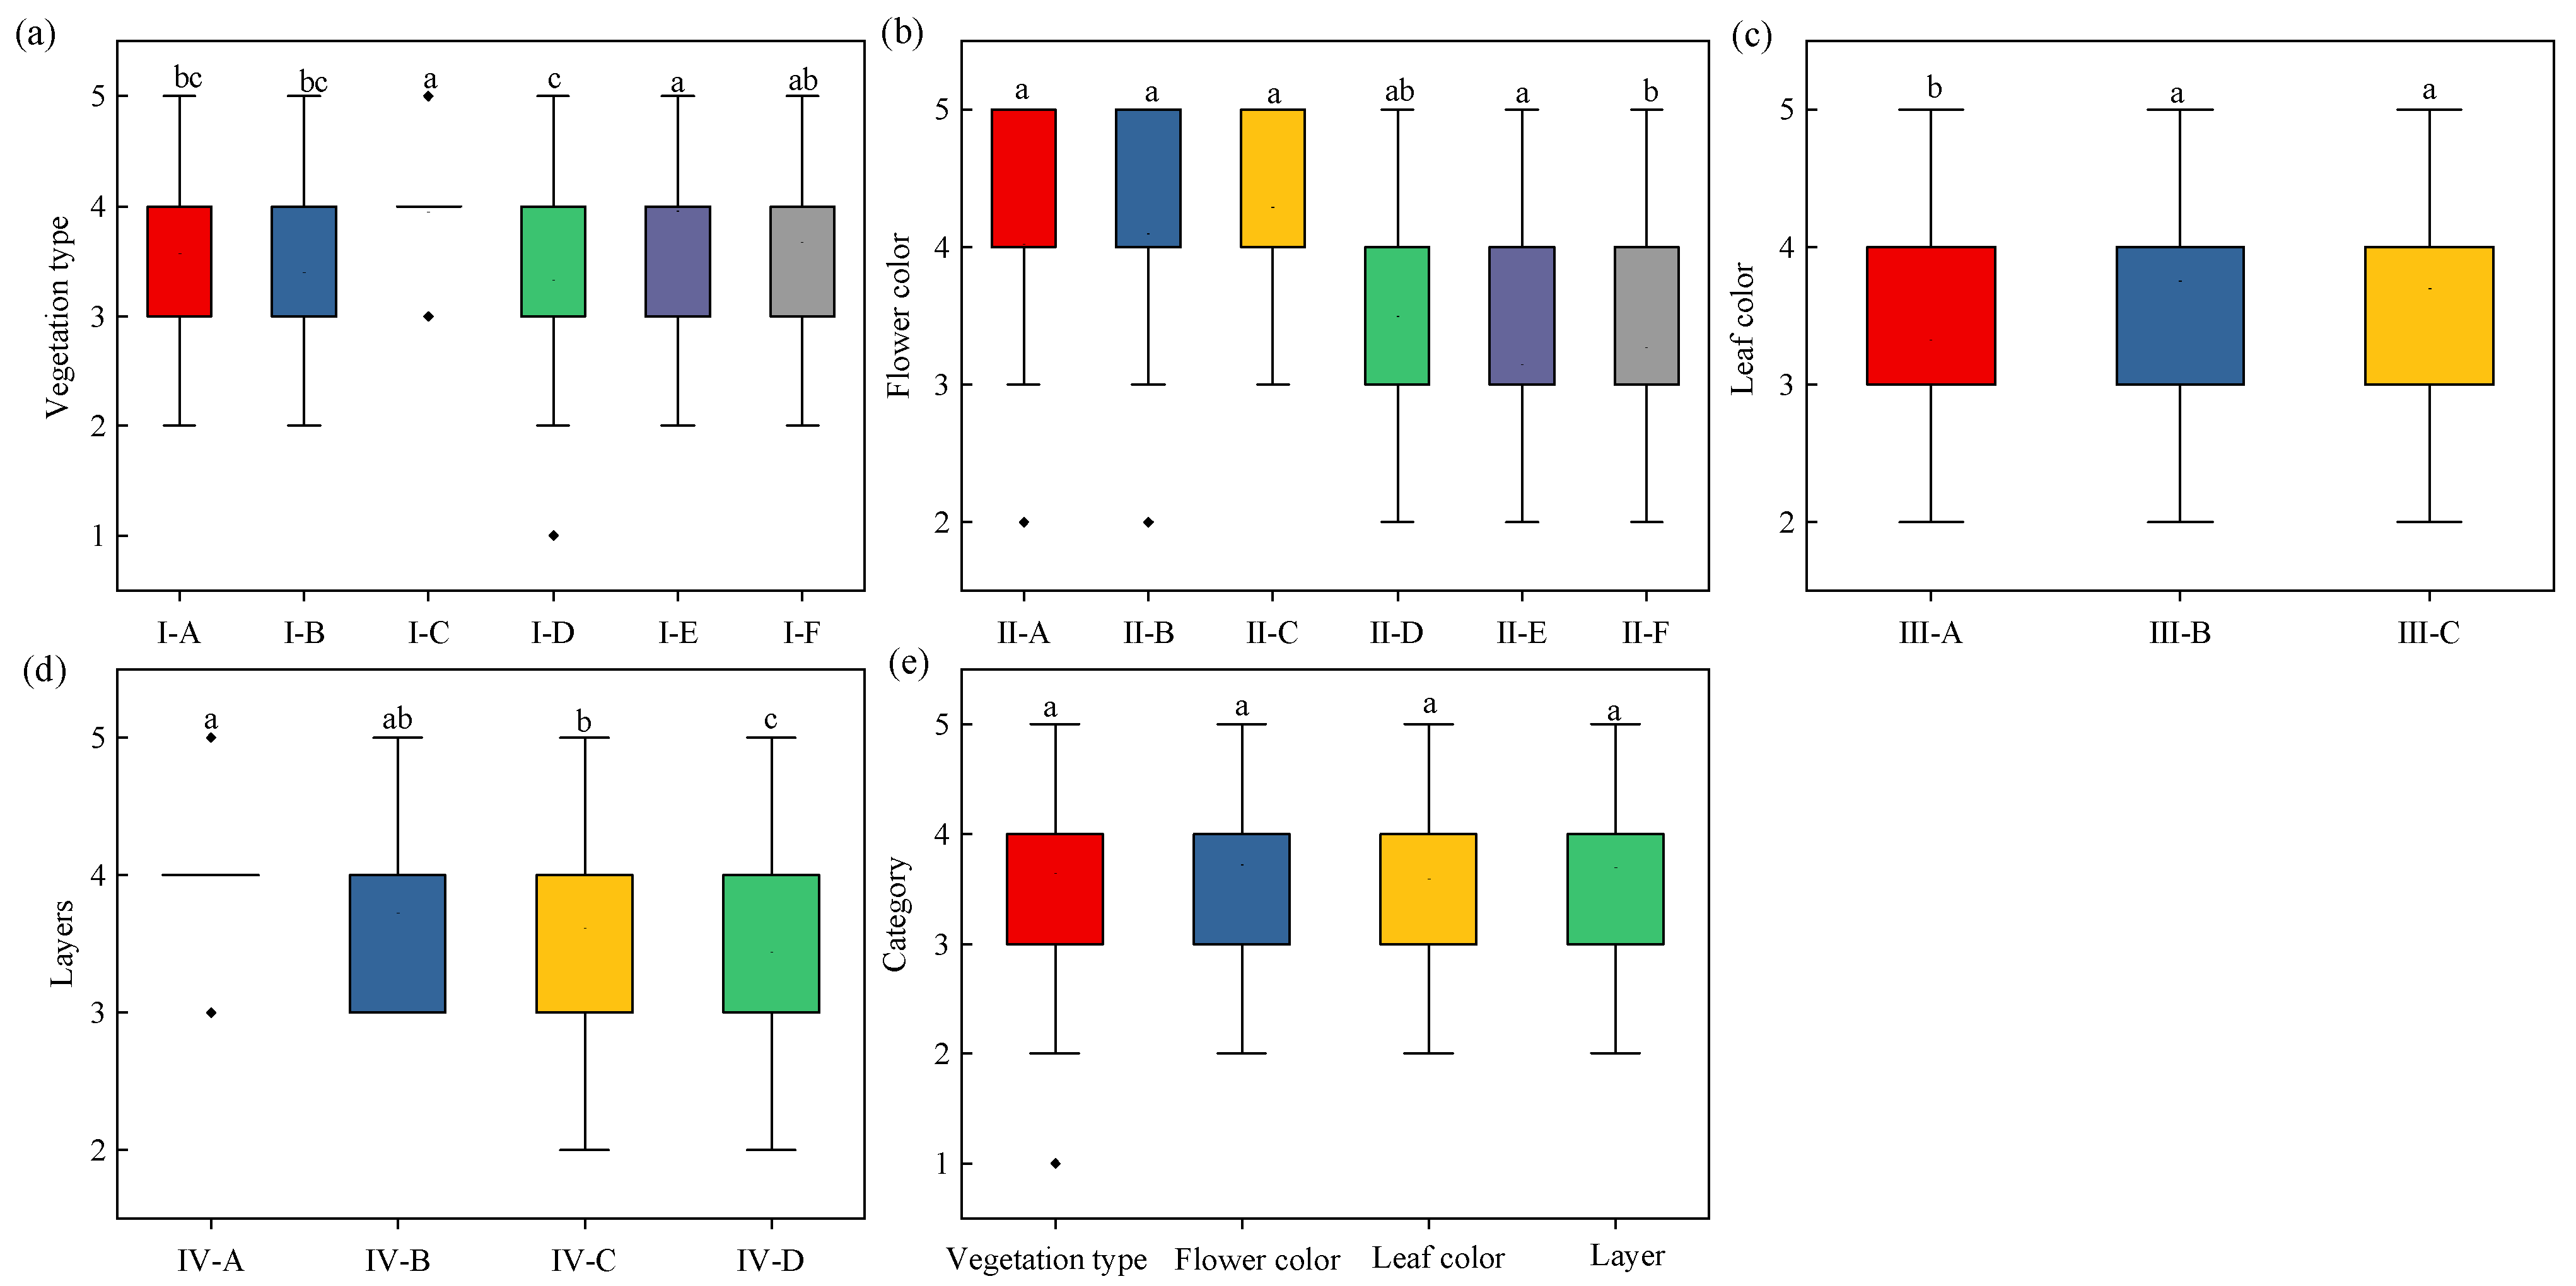
The results of the reliability test (Cronbach’s α = 0.687), validity test (KMO = 0.576), and Bartlett’s test of sphericity (p = 0.000) indicated that the questionnaire data were suitable. Among the different types of vegetation types, bamboo plants (I-E) and broad-leaved trees (I-C) had relatively high scores (Figure 2). Shrubs (I-B) and coniferous trees (I-D) had the lowest scores of 3.39 and 3.32, respectively. Concerning flower color, white flowers (II-E) had a relatively low score of 3.14. Concerning leaf color, the green leaf (III-A) had the lowest score of 3.32, which was significantly lower than the score of the yellow leaf (III-B) and the red leaf (III-C) (p < 0.05). Among the layers, tree + shrub + grass (IV-A) had a relatively high score of 4.00. The score of grassland (IV-D) was 3.44, which was the lowest. The differences in the subjective ratings among the different categories were not significant (p > 0.05).
3.3. Eye-Tracking Measures
3.3.1. Vegetation Type
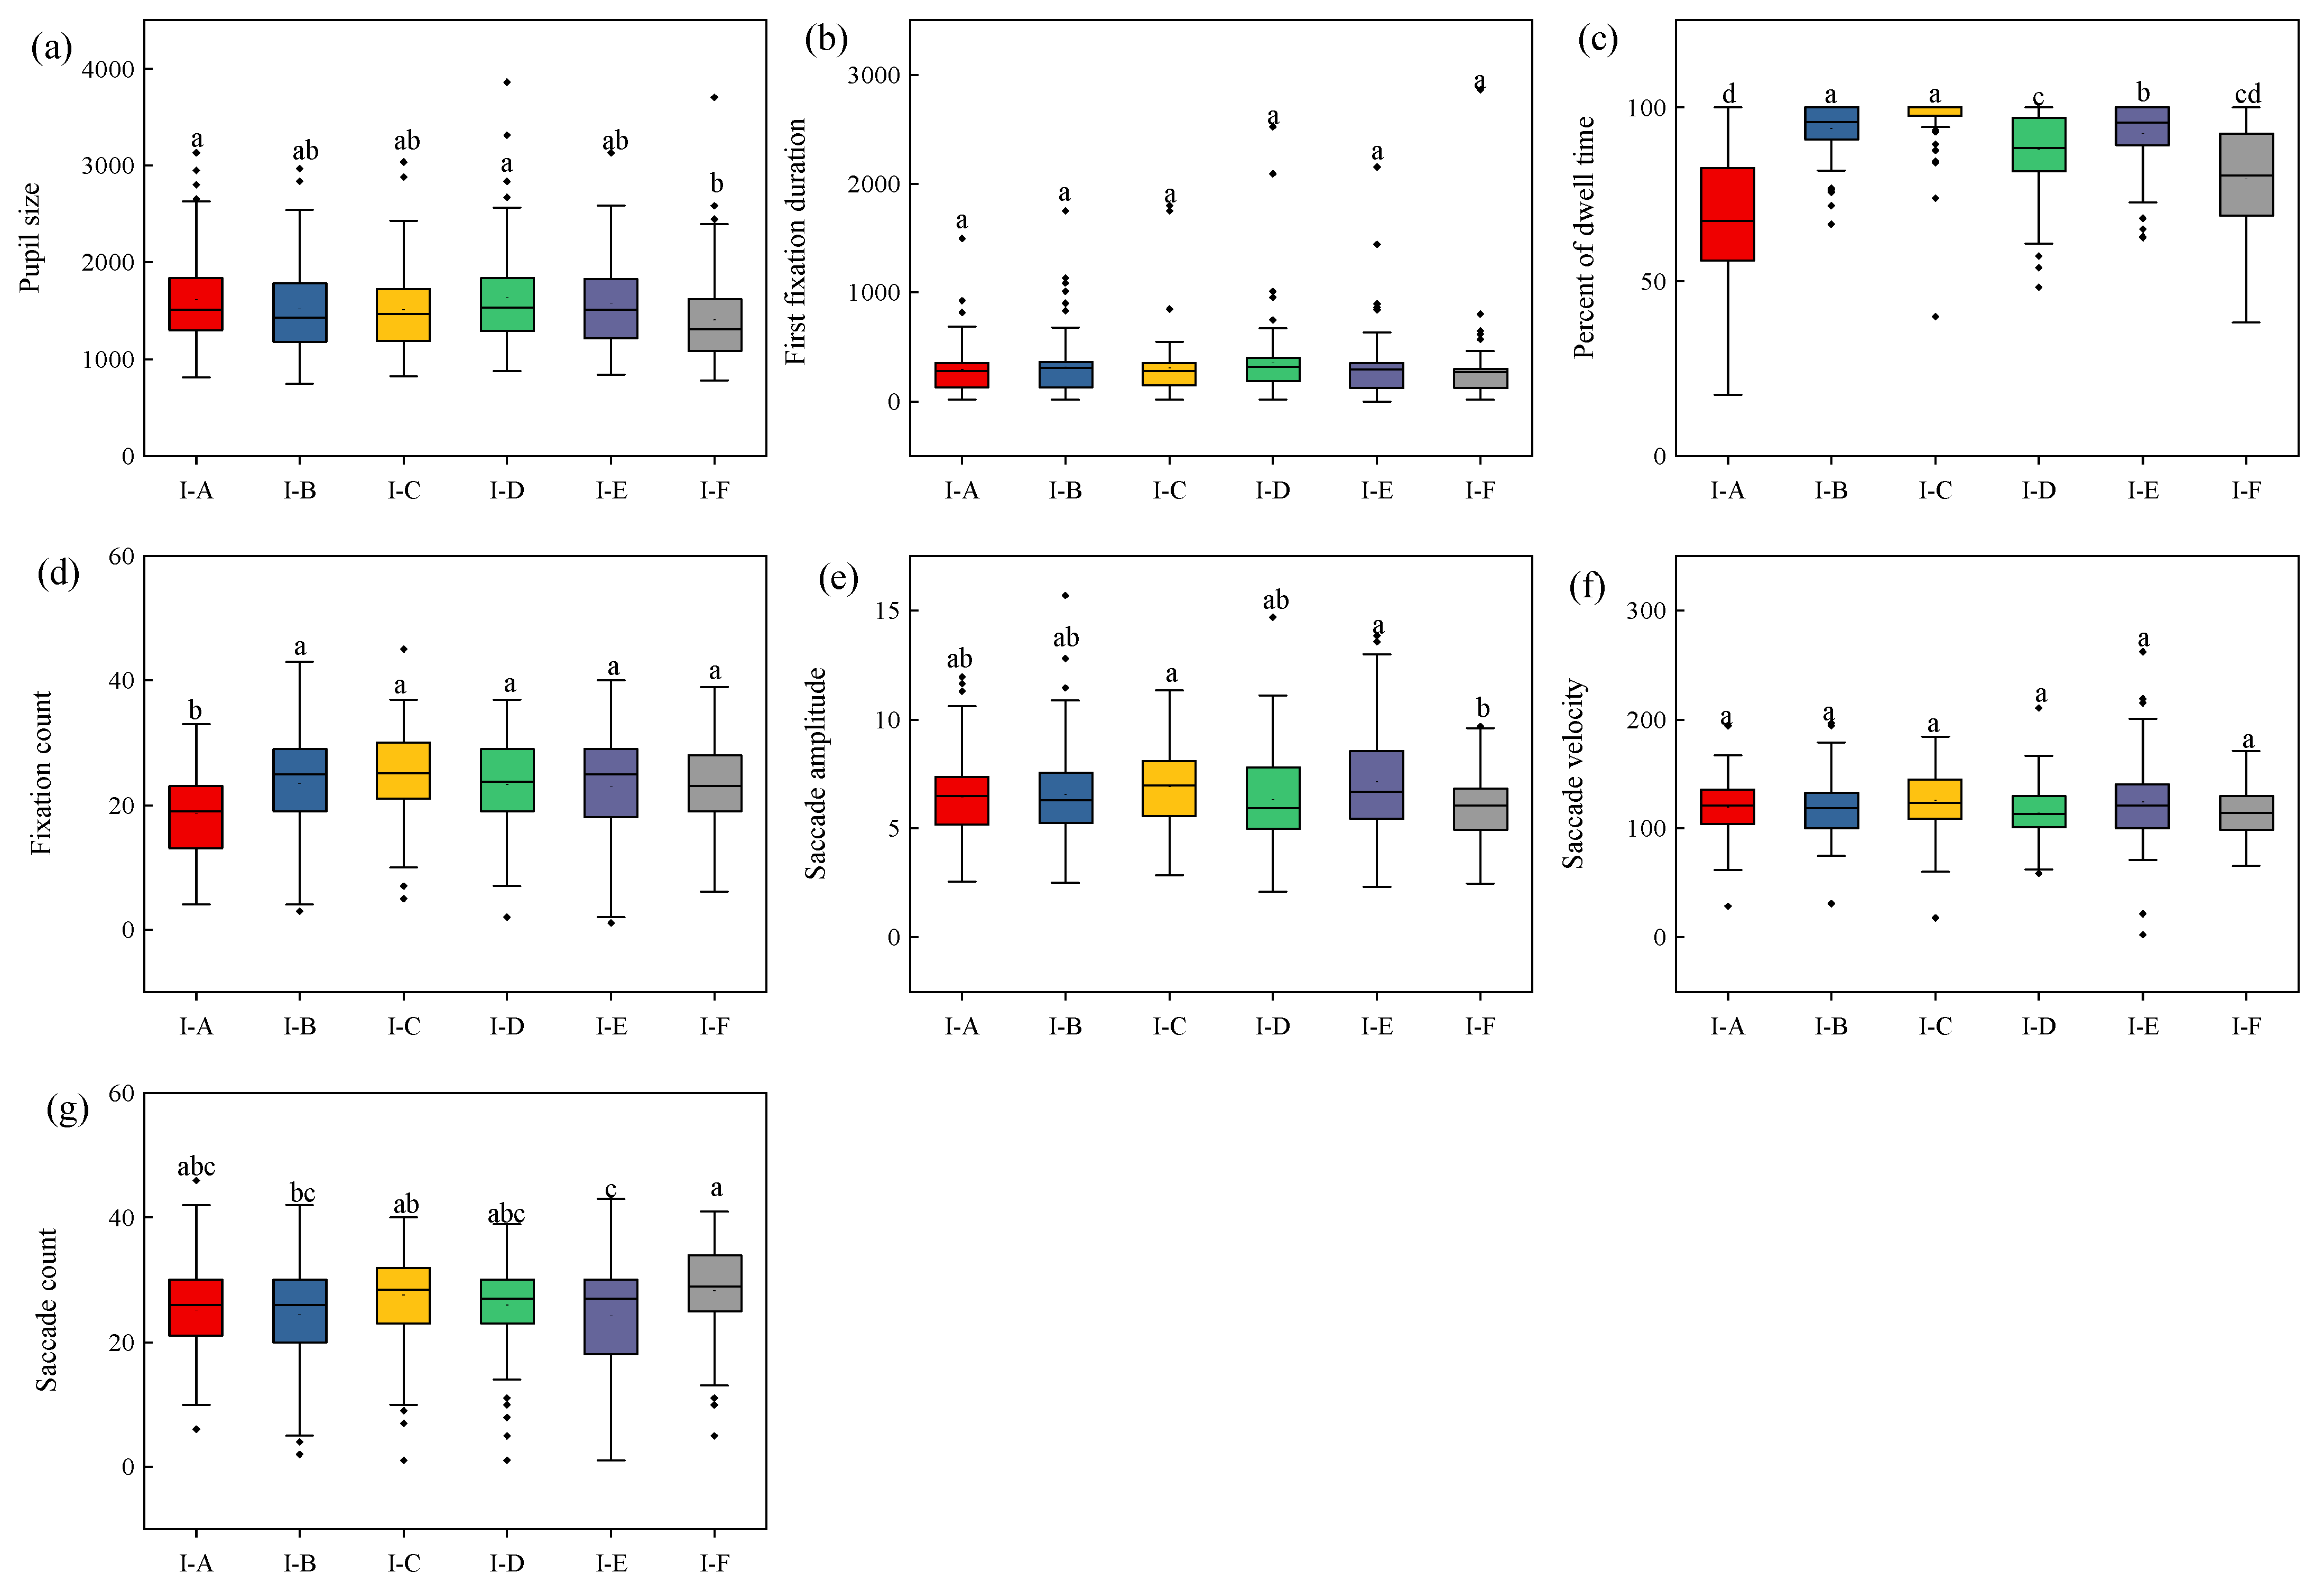
The first fixation duration and saccade velocity did not differ significantly among the different vegetation types (p > 0.05, Figure 3). Grassland (I-A) had the lowest fixation count of 19. Shrubs (I-B) and broad-leaved trees (I-C) had the highest percentage of dwell time, with 93.97% and 97.44%, respectively; the dwell time did not differ significantly between I-B and I-C (p > 0.05).
3.3.2. Flower Color
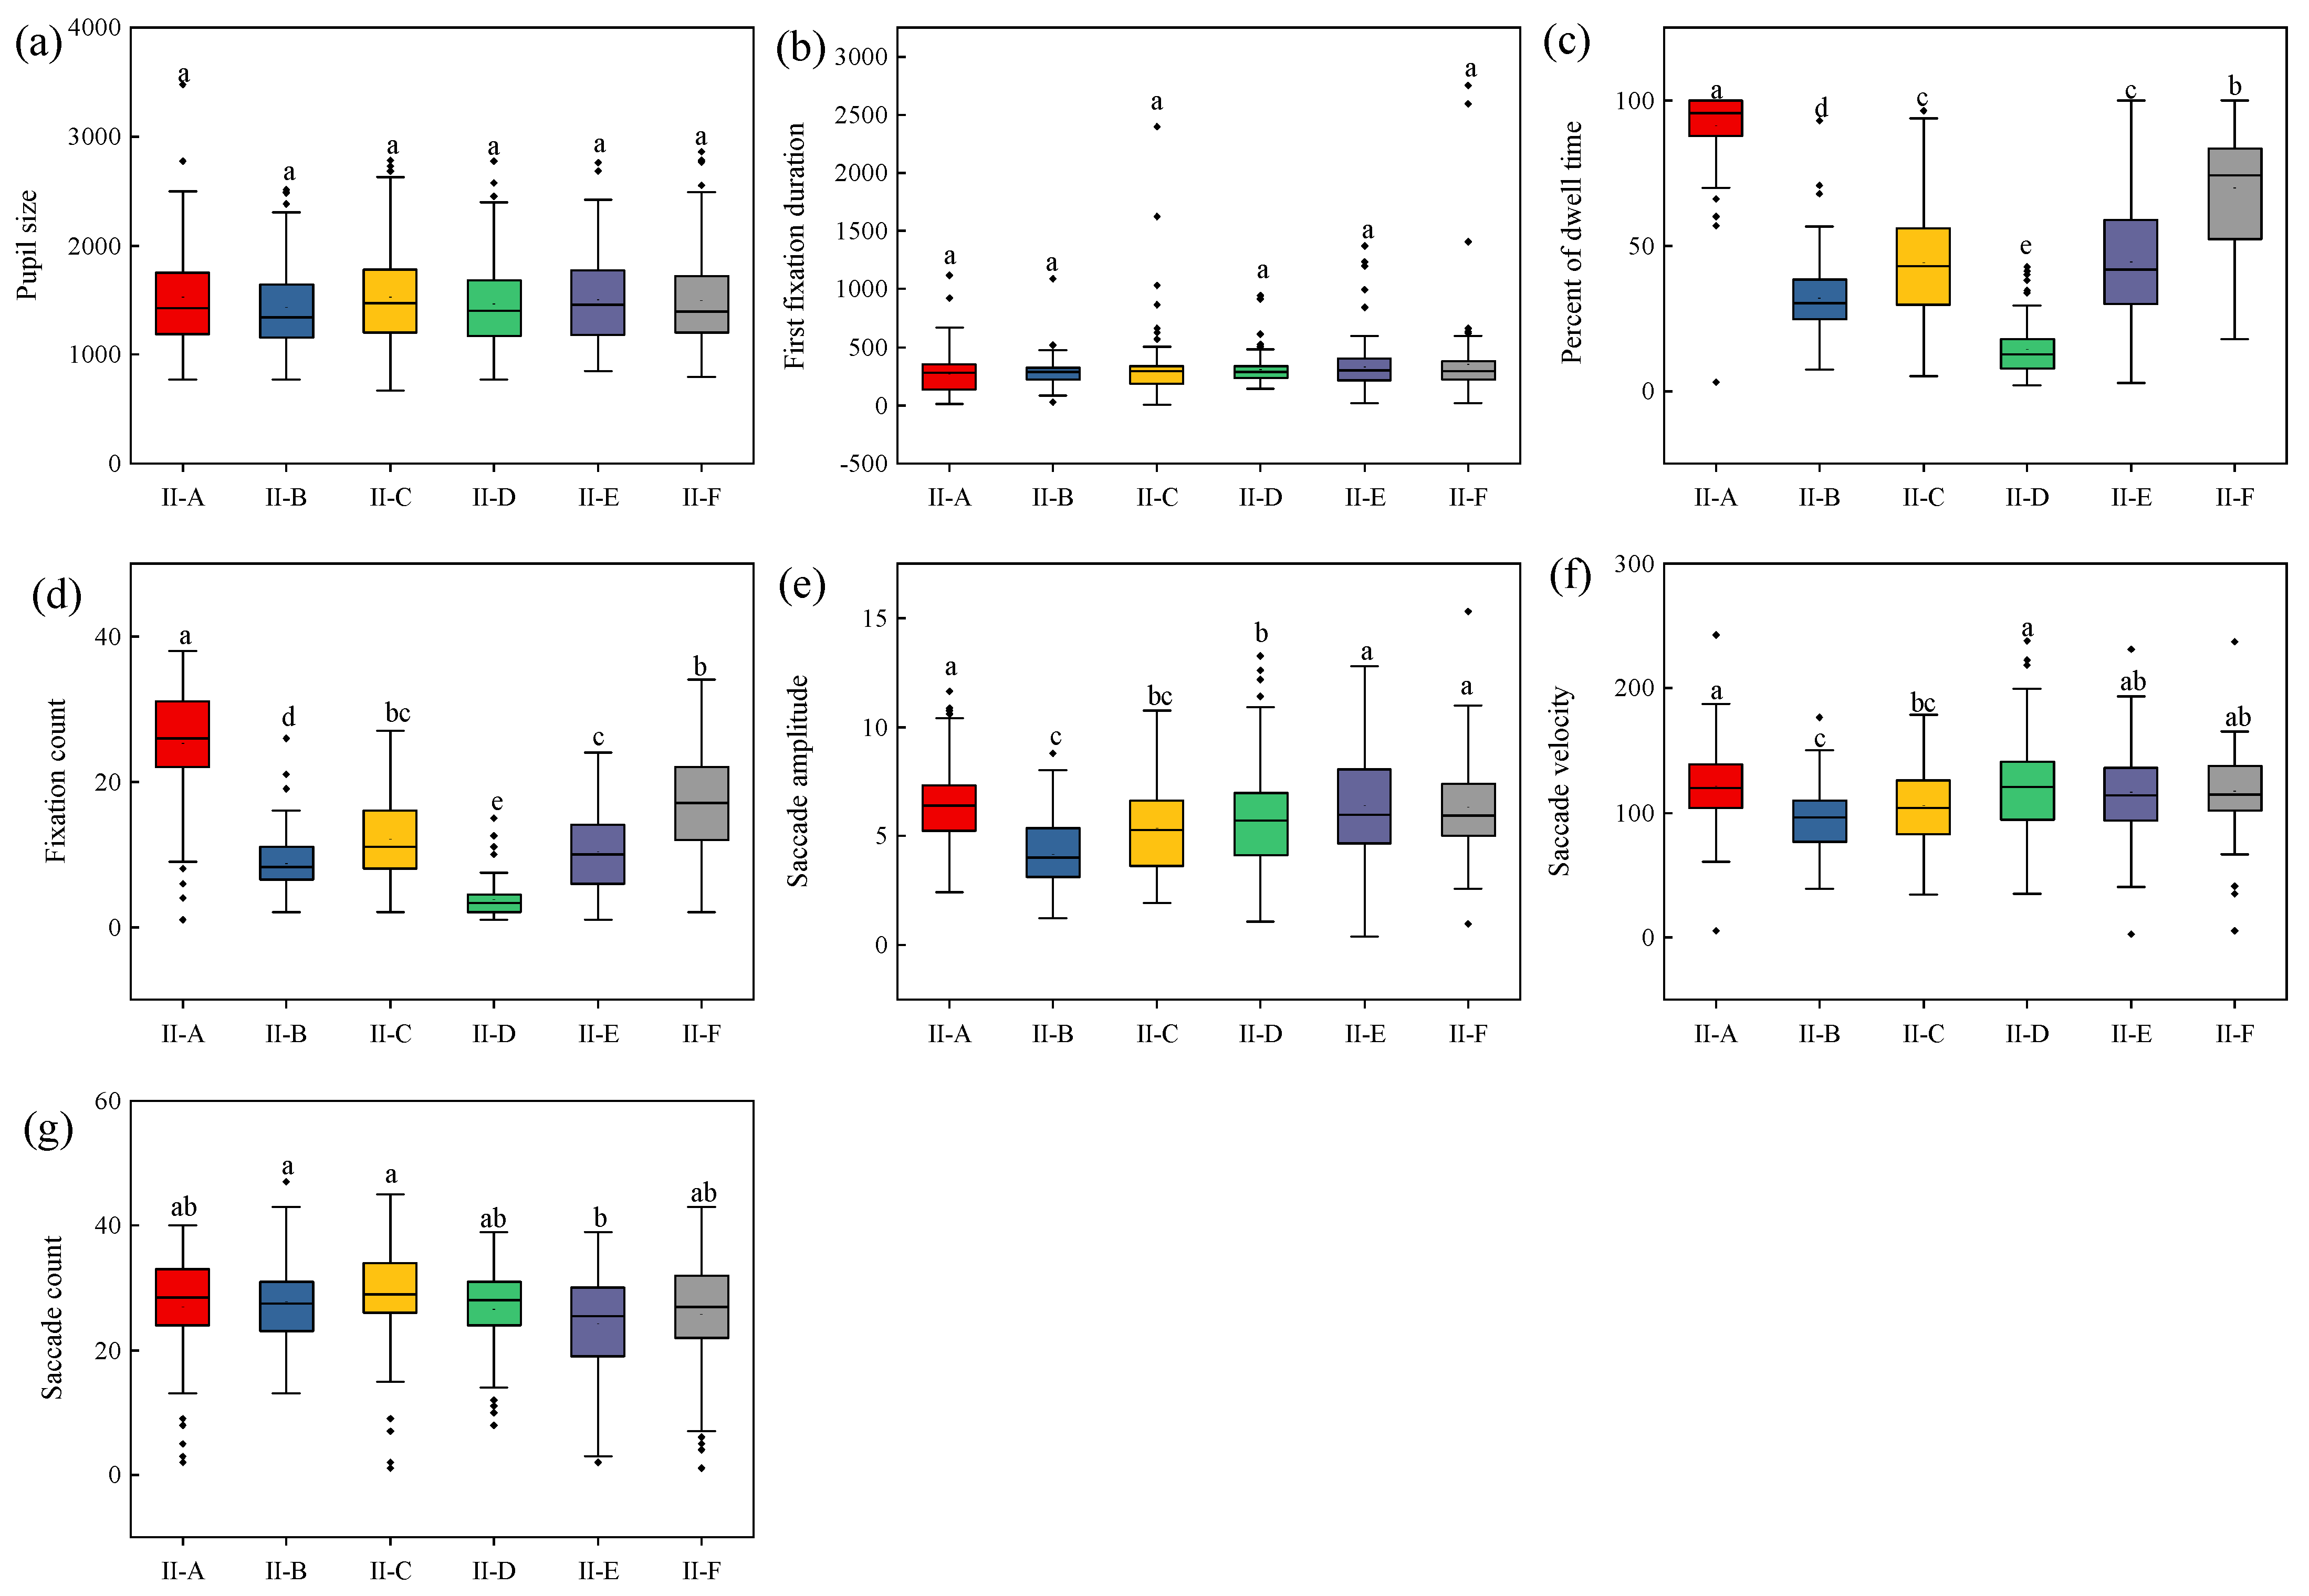
The pupil size and first fixation duration did not differ significantly among the different flower colors (p > 0.05, Figure 4). Blue flowers (II-A) had the highest percentage of dwell time and fixation count, while white flowers (II-E) had the lowest percentage of dwell time and fixation count. Red flowers (II-B) had relatively low saccade amplitude and saccade velocity, with only 4.18° and 95.51, respectively.
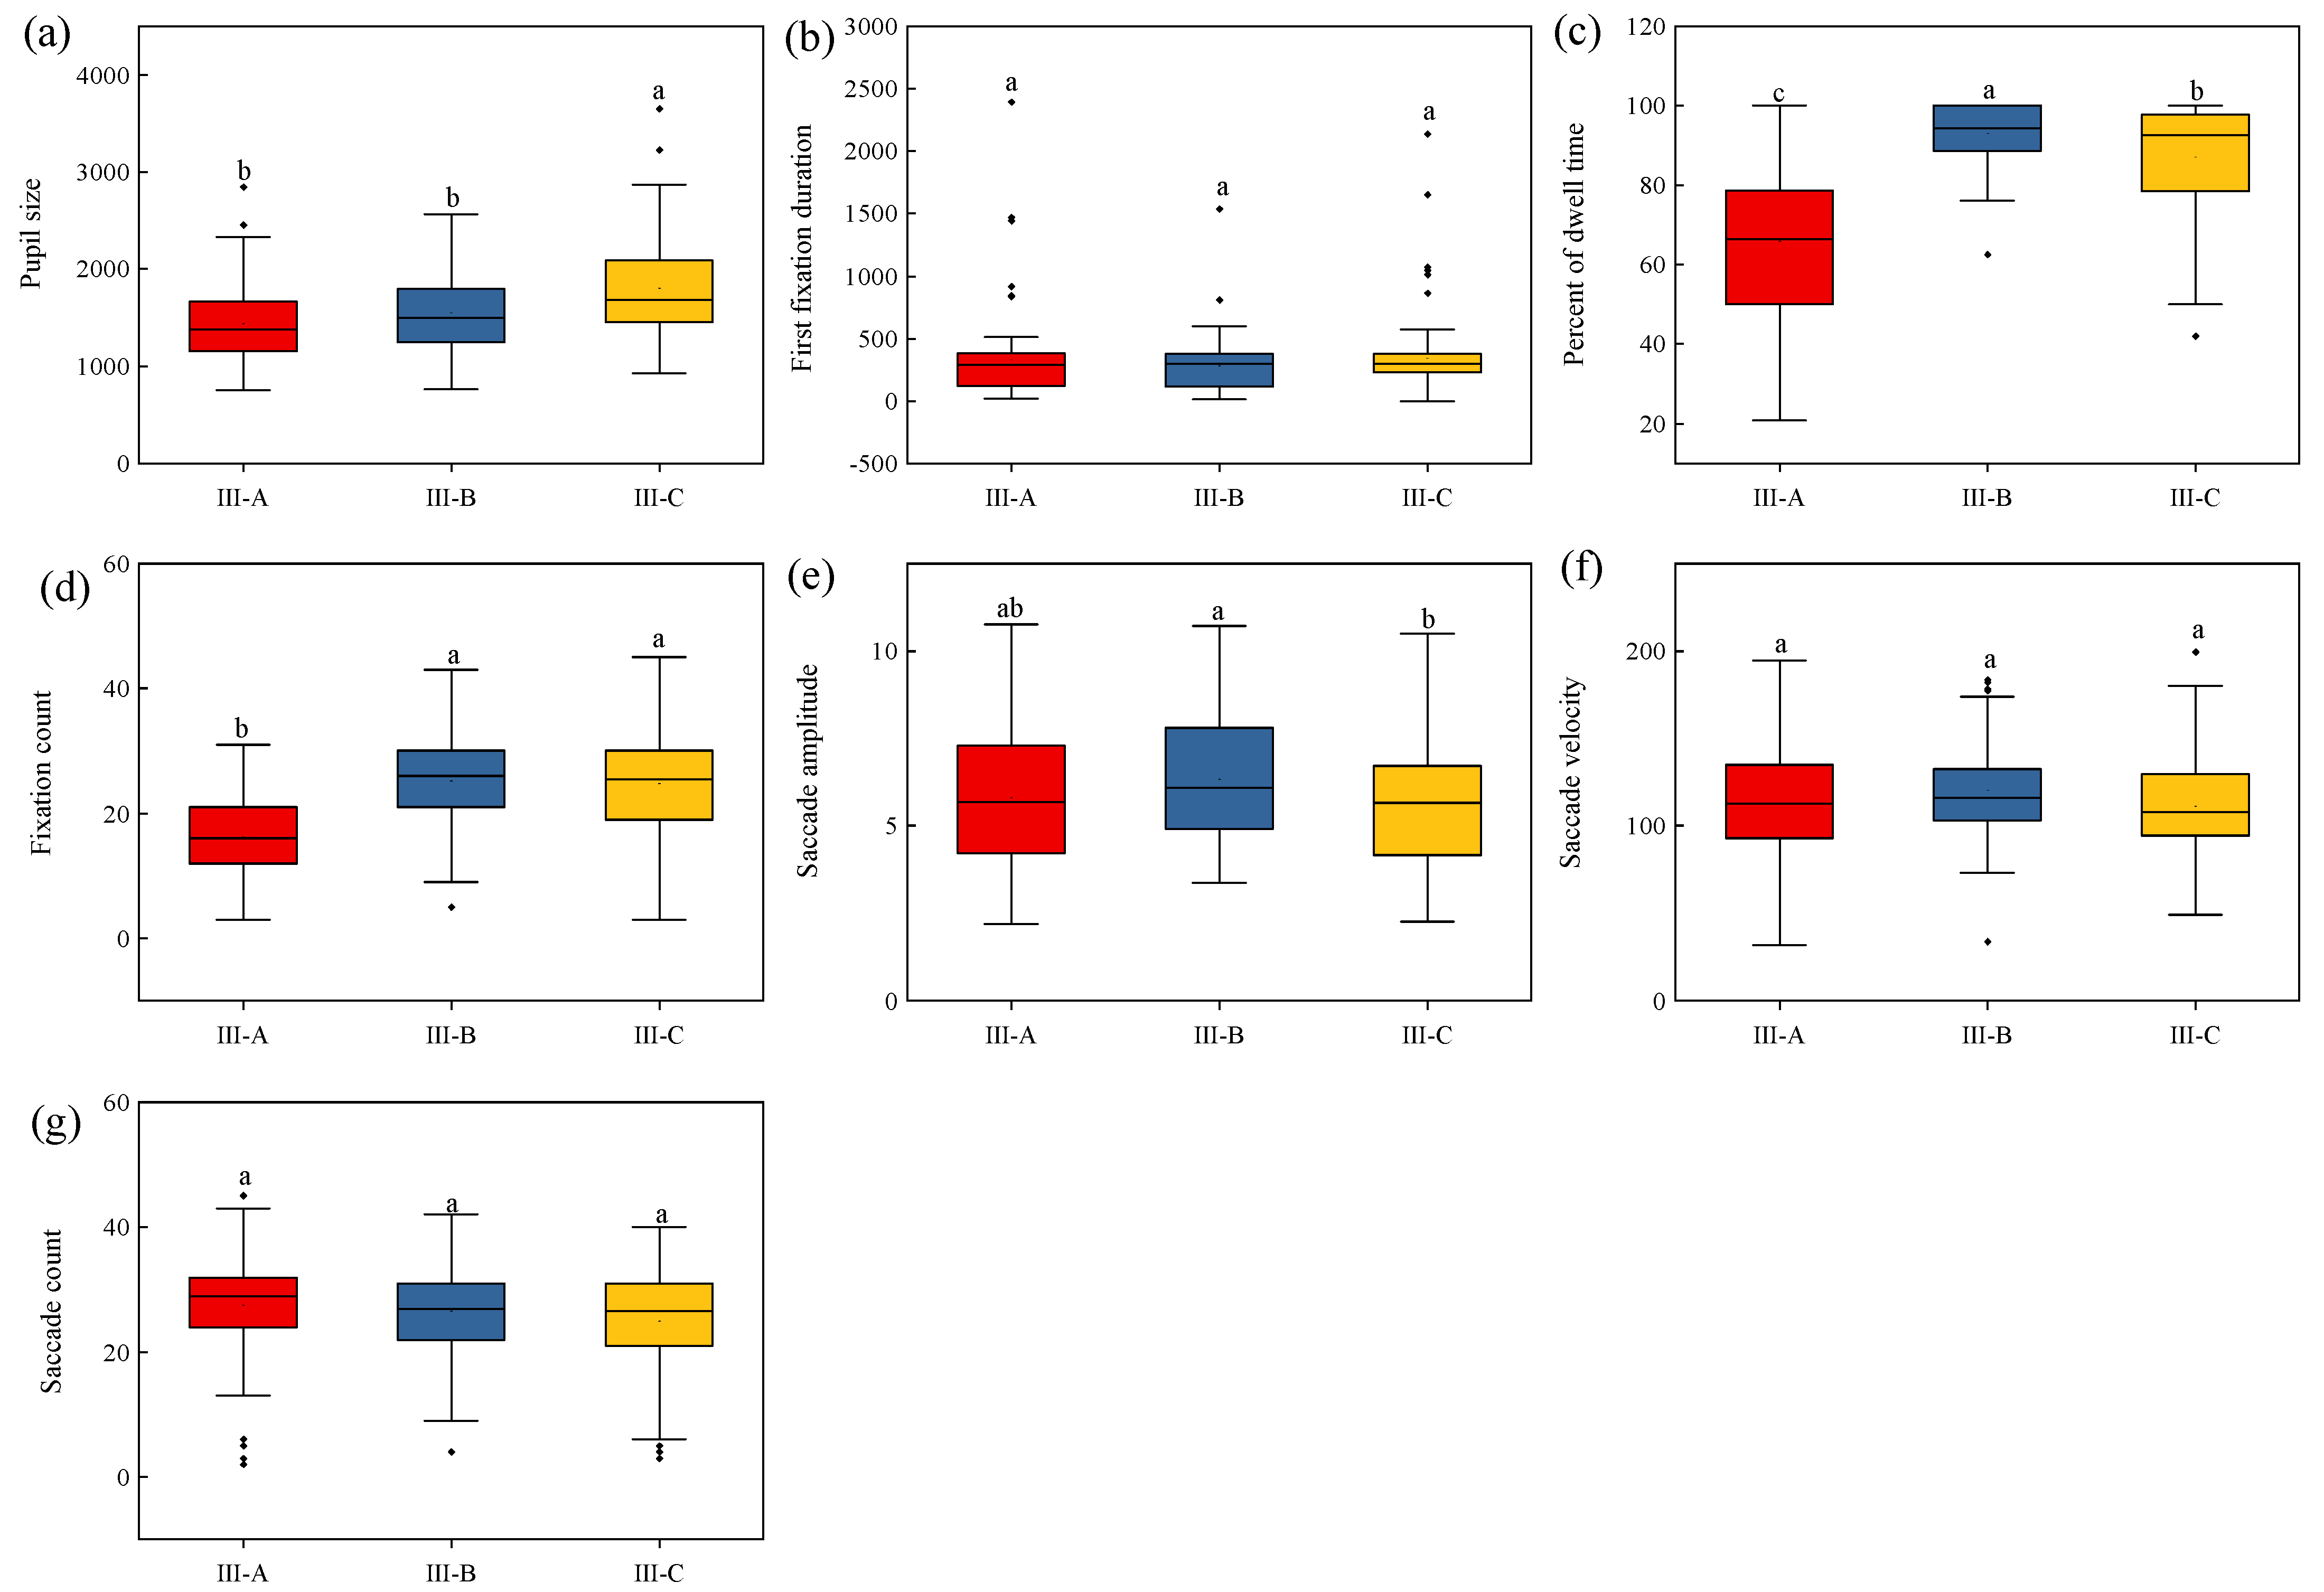
3.3.3. Leaf Color
The first fixation duration, saccade velocity, and saccade count did not differ significantly among leaf colors (p > 0.05, Figure 5). The pupil size for green and yellow leaves was significantly larger than that for red leaves (p < 0.05). The percentage of dwell time and fixation count for green leaves were the lowest at 65.86% and 16.24, respectively.
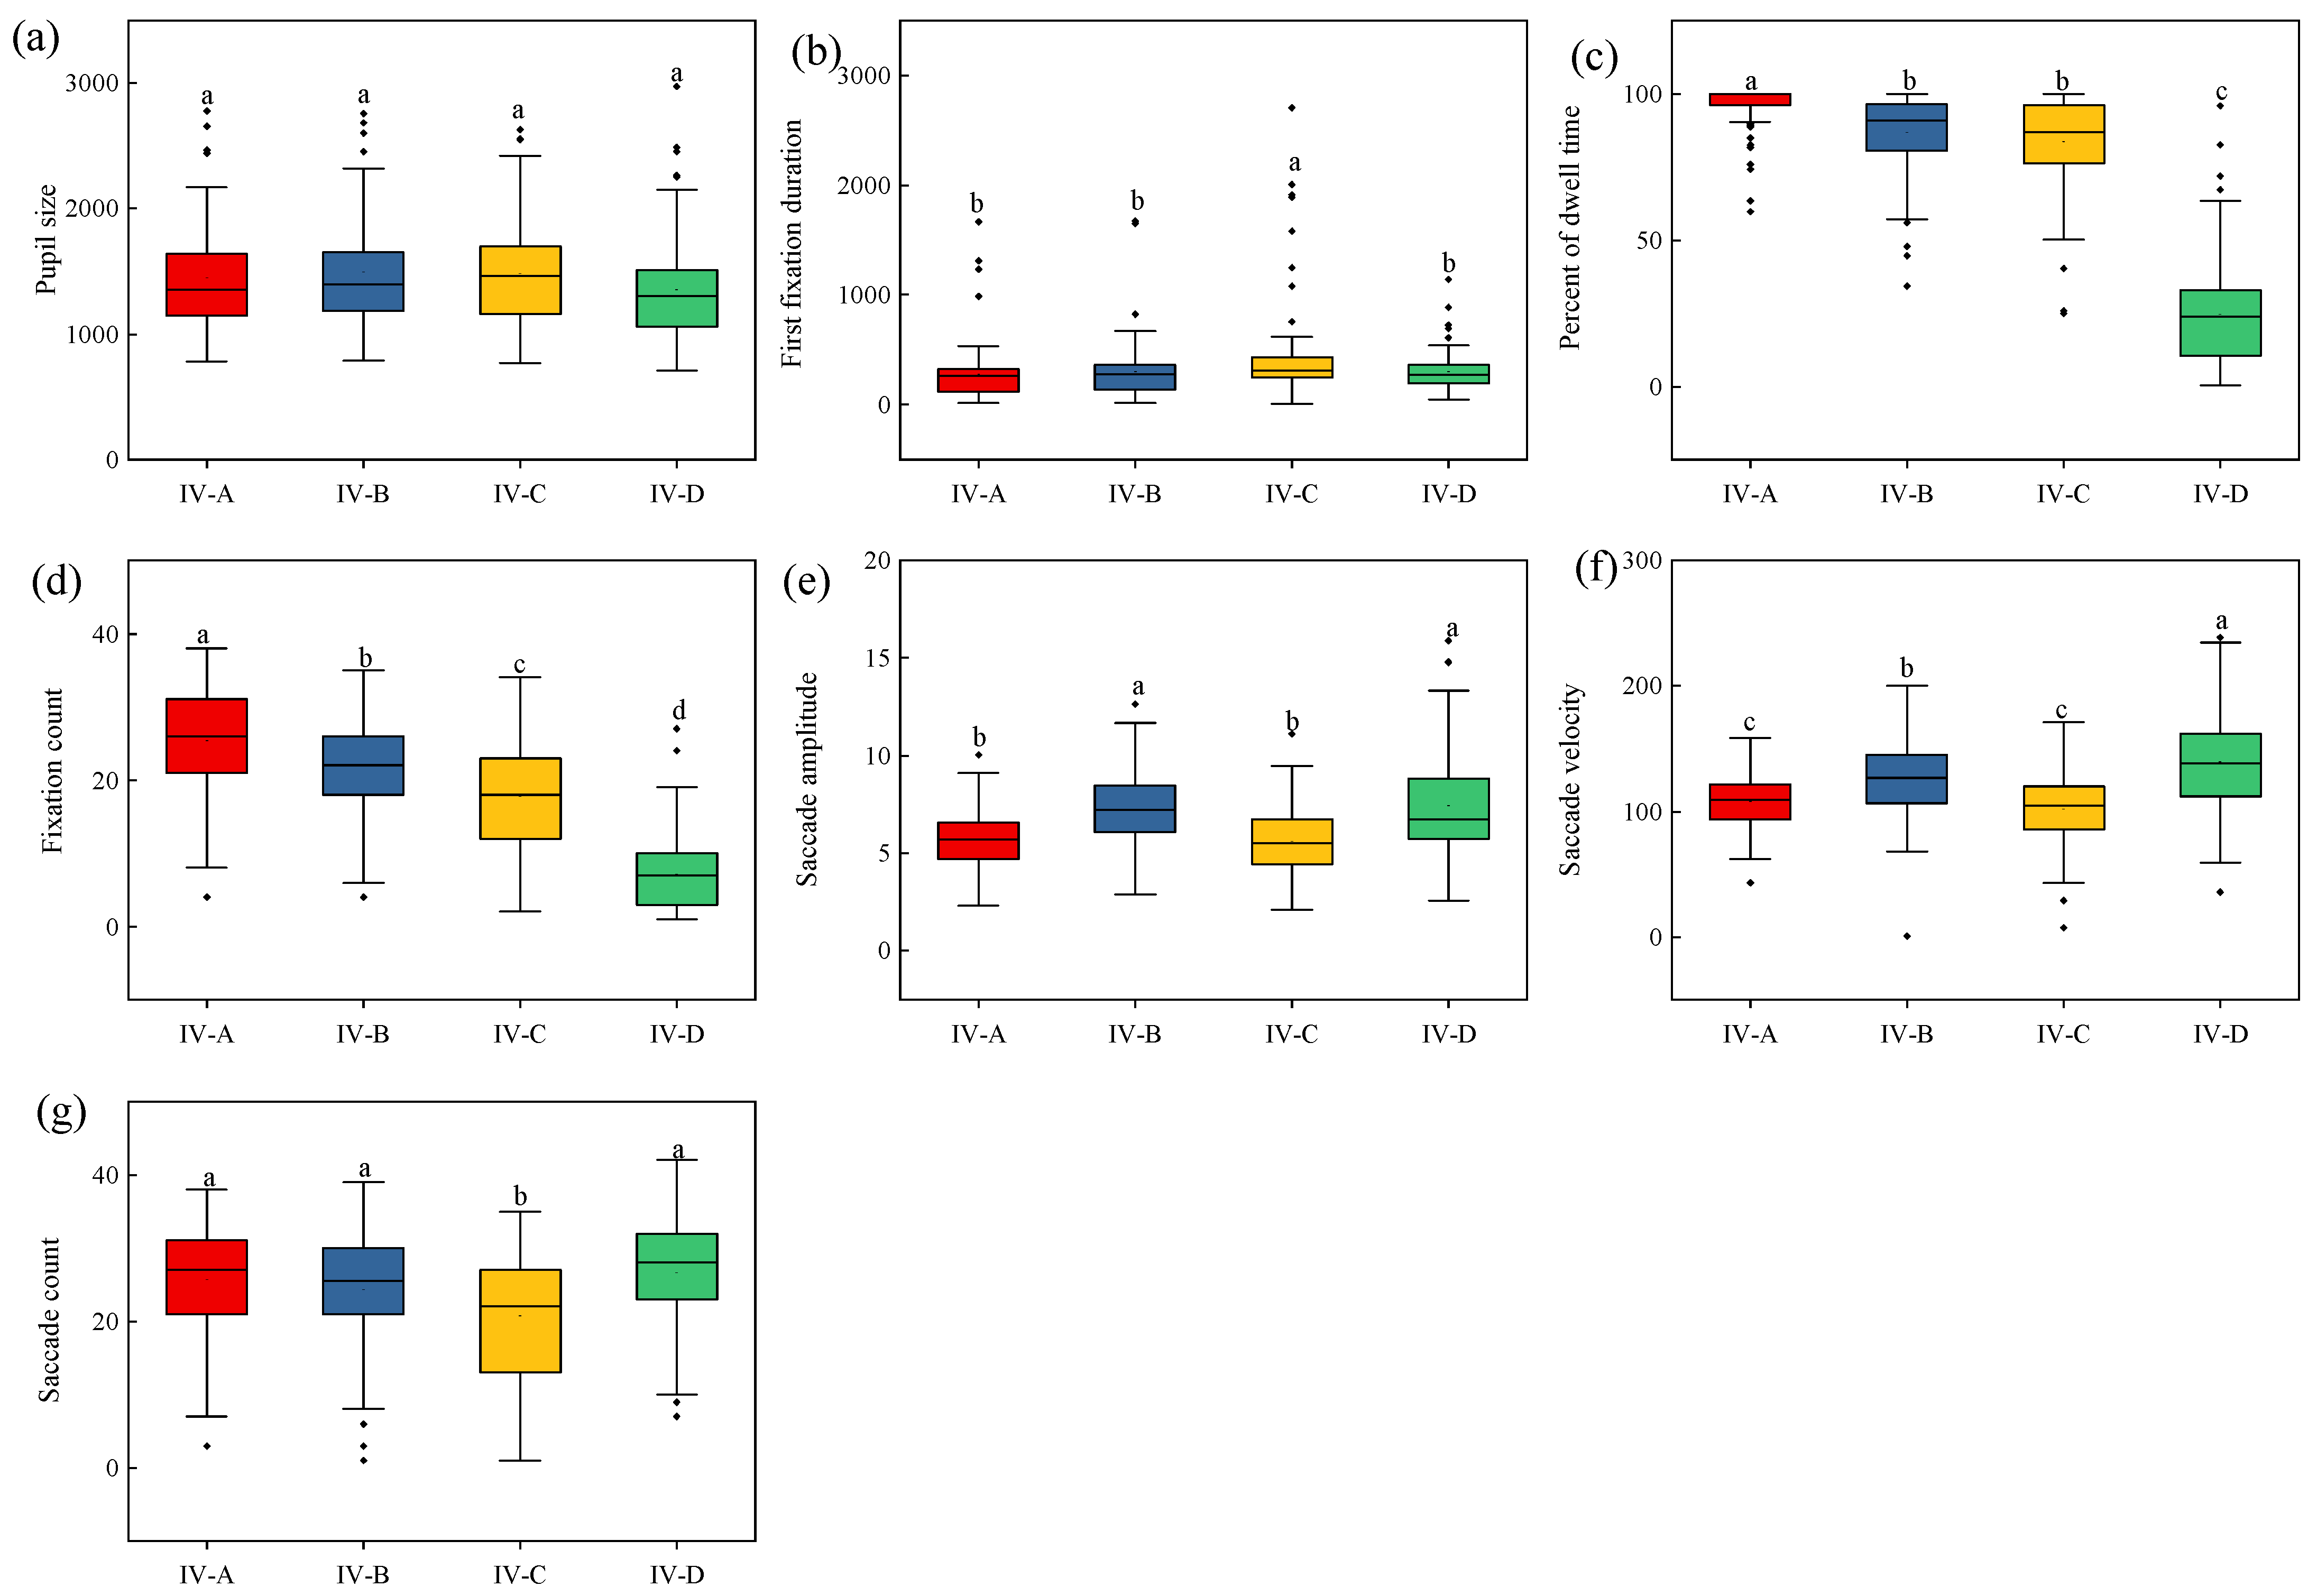
3.3.4. Layer
The pupil size did not differ significantly among the different layers (p > 0.05, Figure 6). Trees + shrub + grass (IV-A) had the highest percentage of dwell time and fixation count at 96.20% and 25.43, respectively. The categories IV-A and shrubs (IV-C) had the lowest saccade amplitude and saccade velocity.
3.4. Hierarchical Clustering Analysis
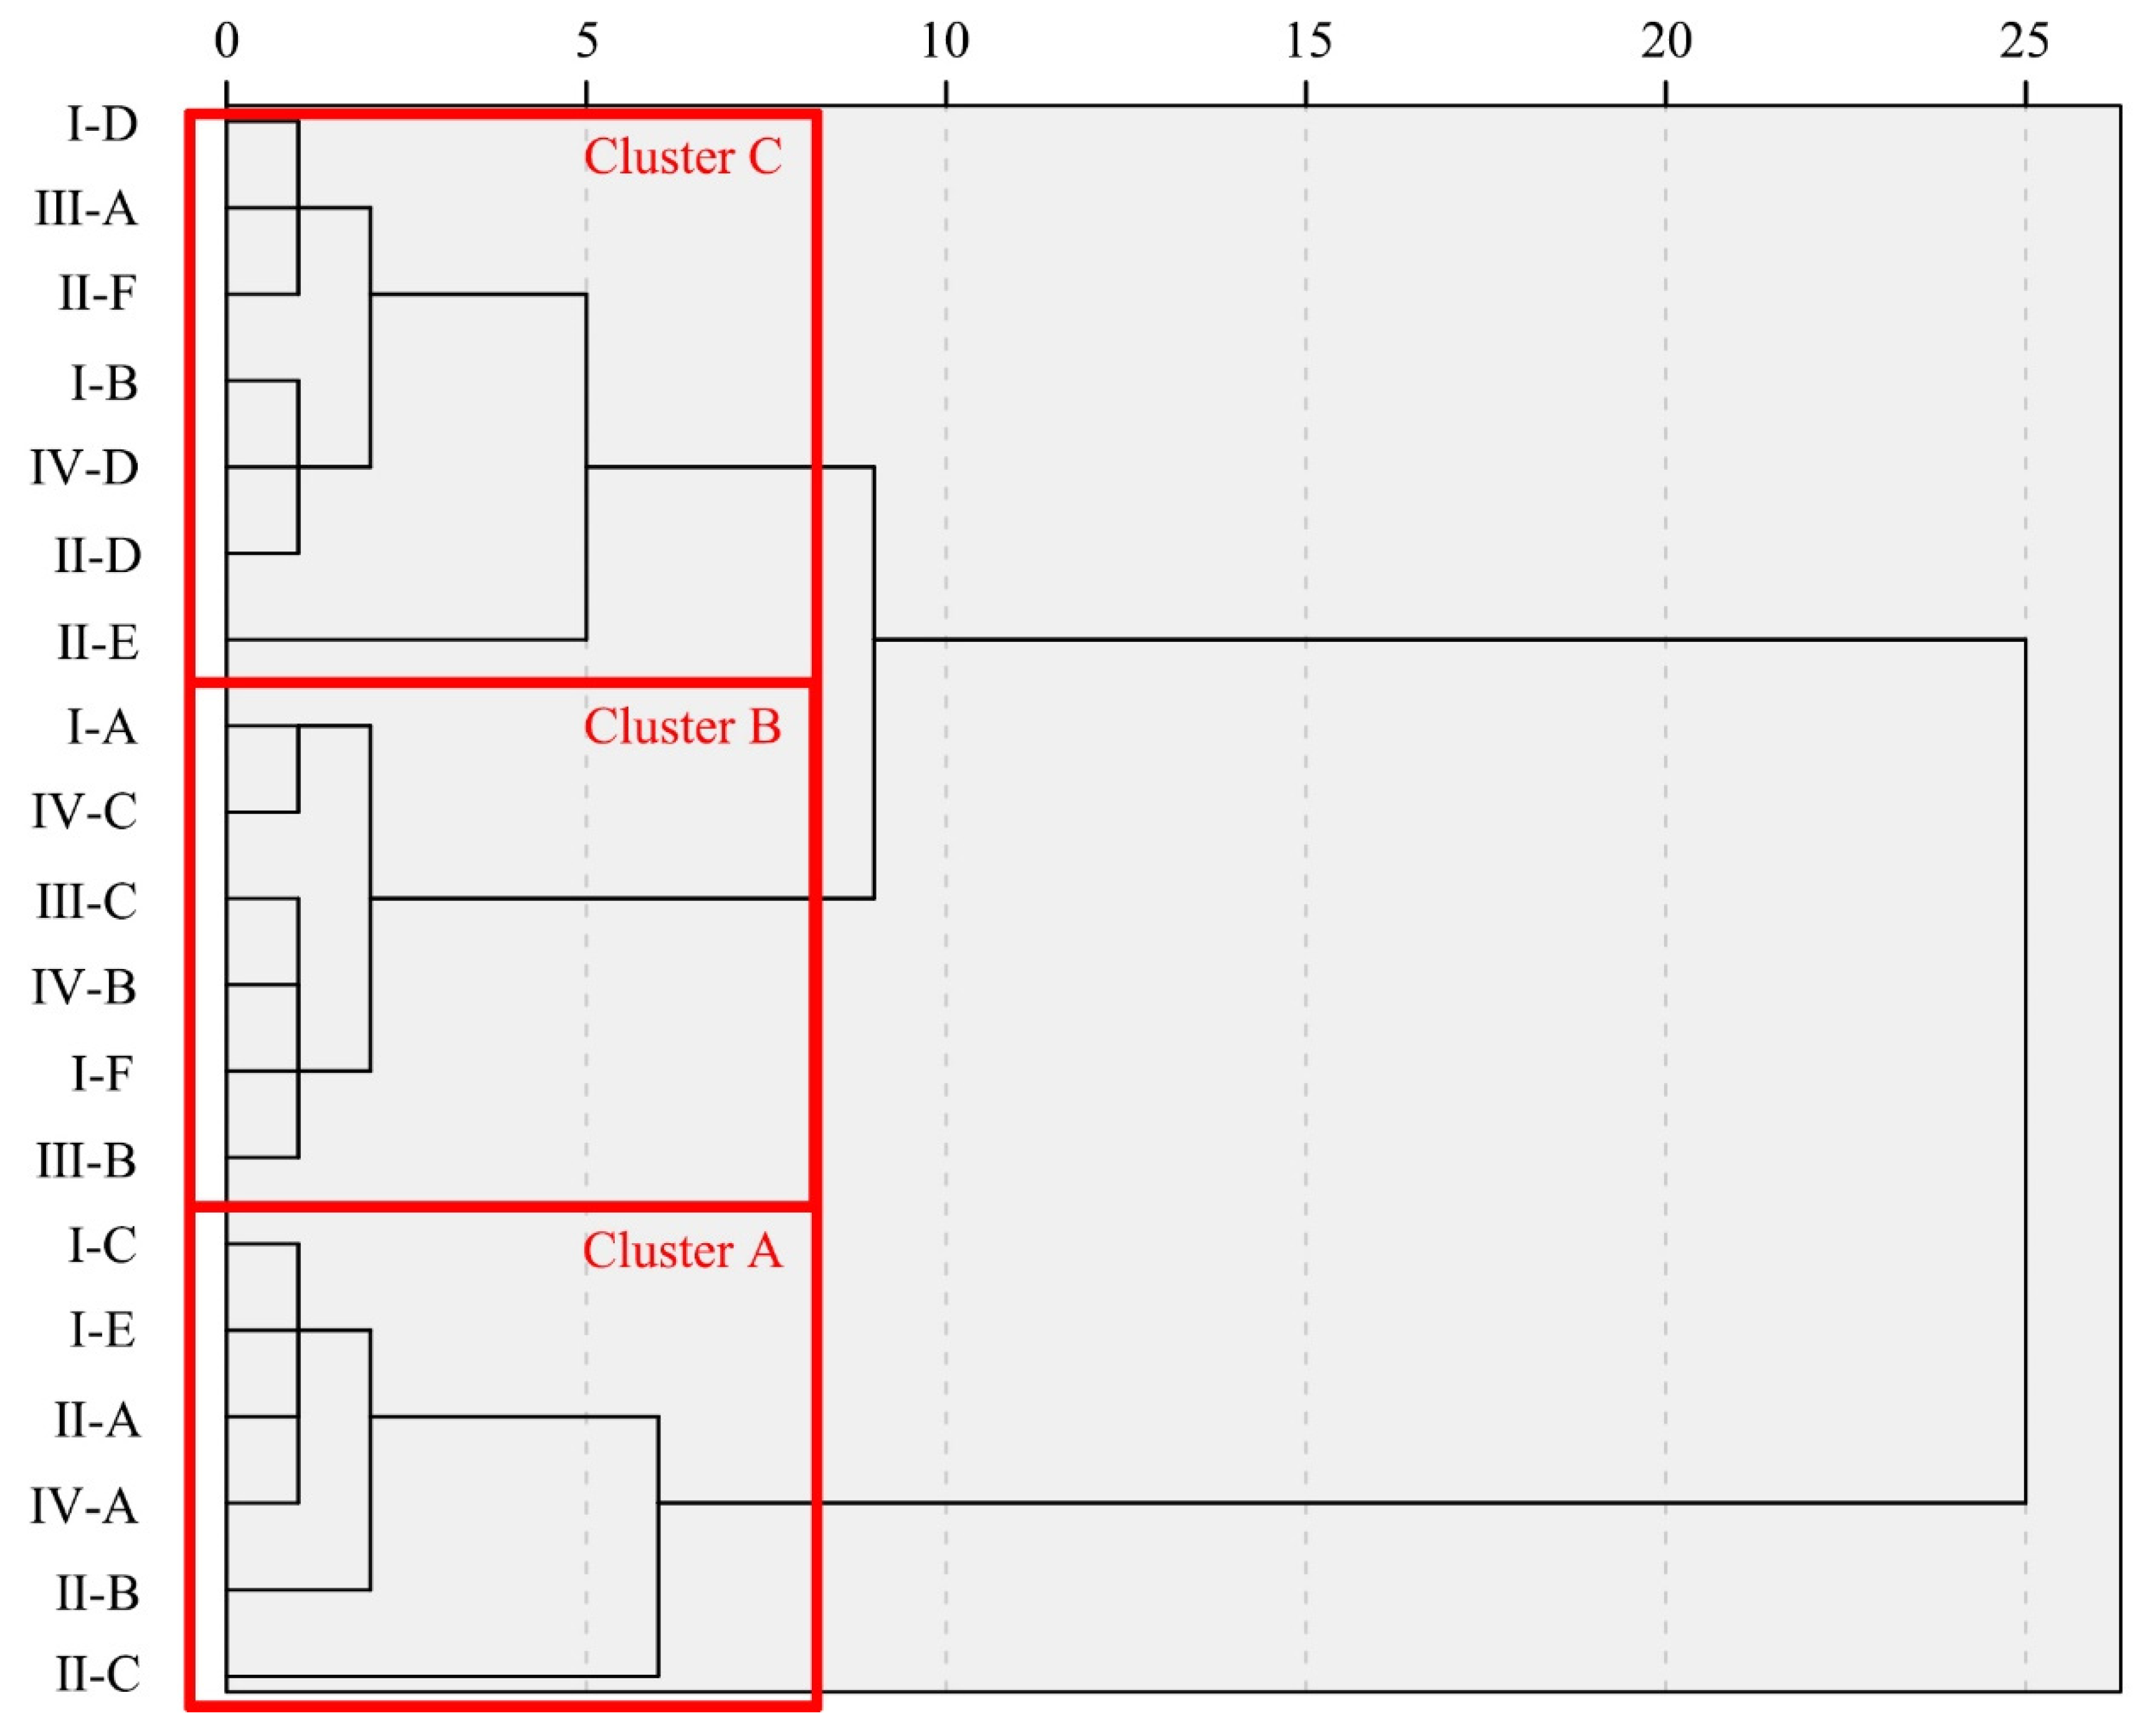
Ornamental features were classified into three groups by hierarchical clustering analysis; clusters A, B, and C indicated high, medium, and low rating groups, respectively (Figure 7). The SSII, LSI, LSII, SSIII, SVTI, SCIII, and tree belonged to cluster A, as they were given higher subjective ratings by the participants.
The subjective scores of the different types of greeneries were classified into three categories based on cluster analysis and included high ratings (Cluster A), medium ratings (Cluster B), and low ratings (Cluster C) (Figure 7). Among them, the subjective ratings of IV-A, II-A, II-B, II-C, I-C, I-D, and I-E were relatively high.
3.5. Chi-Squared Test
The saccade count and subjective ratings for the vegetation type were significantly correlated (r = 0.09, p < 0.05, Table 1). For flower color, a highly significant correlation was found between fixation count, saccade amplitude, saccade counts, and subjective ratings (r = 0.111, −0.171, −0.148, p < 0.01, Table 1). Leaf color, pupil size, the percentage of dwell time, and fixation count were highly significantly correlated with subjective ratings (p < 0.01). For layer, there was a highly significant correlation of the subjective ratings with the percentage of dwell time, fixation count, and saccade count (p < 0.01).
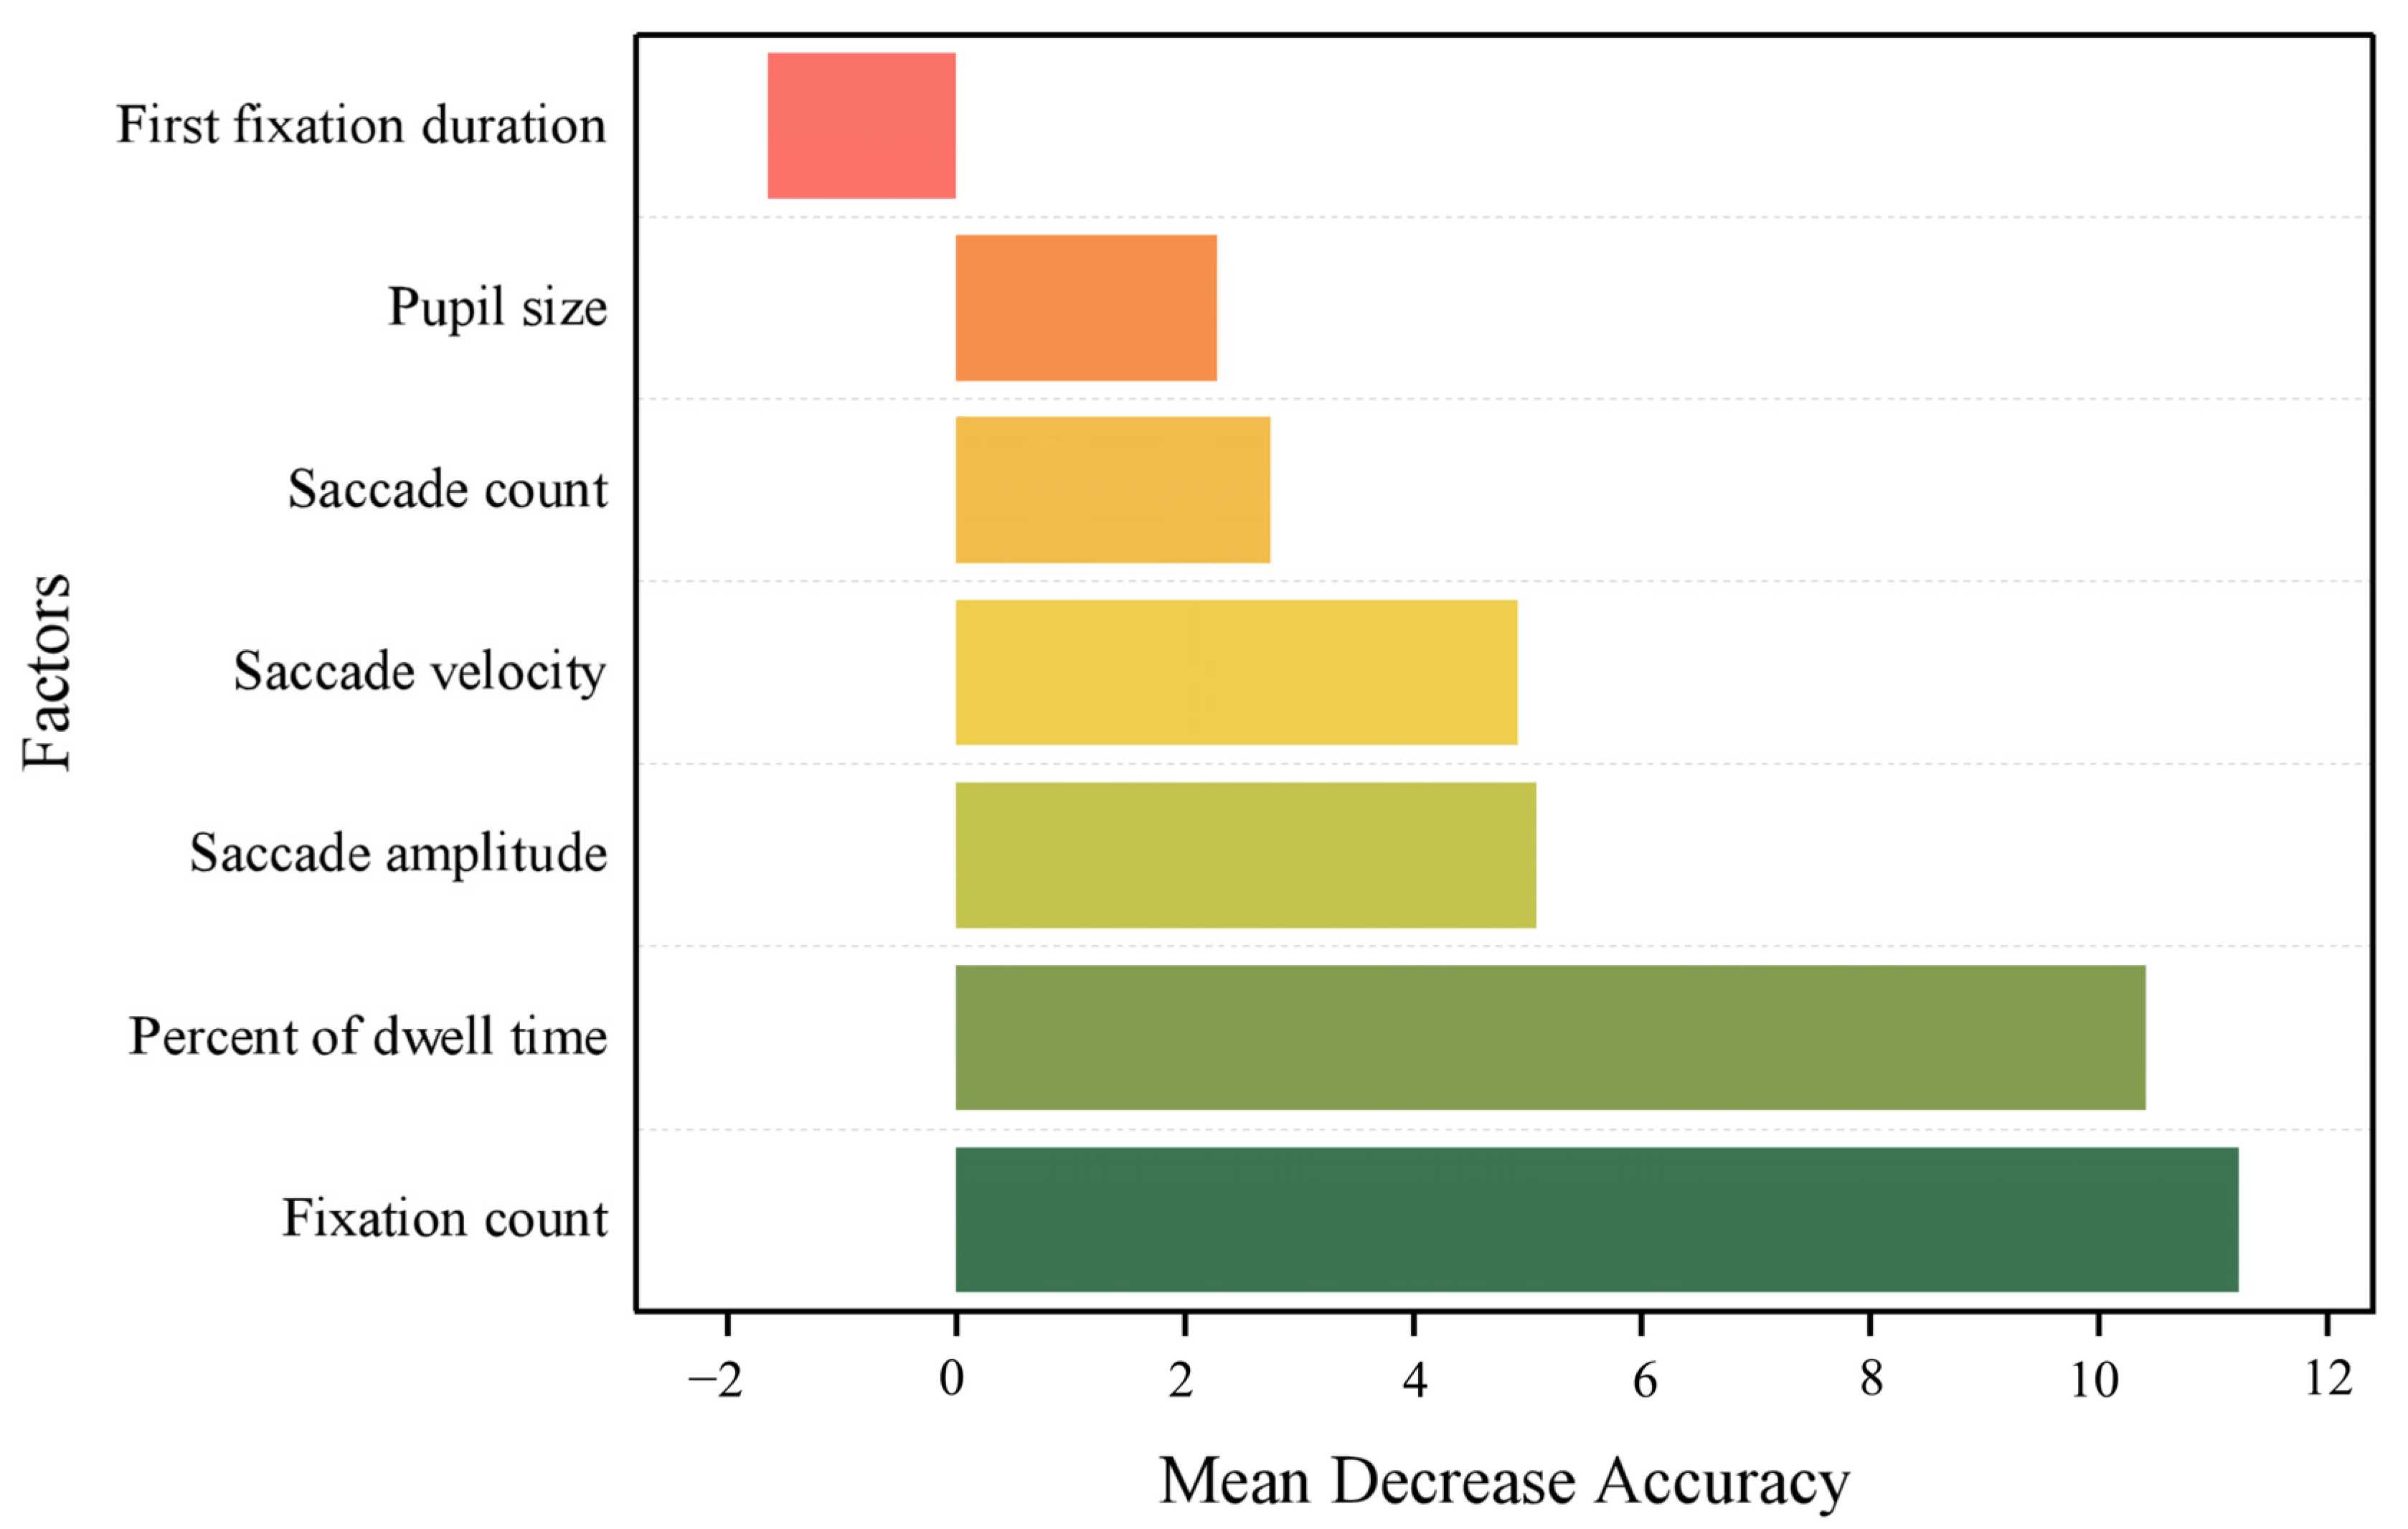
The best combination of trees in the random forest classification model (500) was determined for the highest accuracy of the random forest model. The OOB (out of the bag) error estimate of the error rate of the random forest was 53.72%, which indicated that the variable explained 46.28% of subjective ratings. The order of mean decrease accuracy of eye-tracking measures concerning subjective ratings was fixation count > the percentage of dwell time > saccade amplitude > saccade velocity > saccade count > pupil size > first fixation duration (Figure 8).
4. Discussion
Understanding the preferences, emotions, and perceptions of ornamental plants in urban green spaces can help in selecting species and arranging plants [33]. The heatmap showed eye movements associated with the stimuli [13]. Due to the central effect, most hotspots were concentrated in the center of the picture [34]. However, in this study, we interpreted the visual physiological responses and subjective ratings associated with different stimuli. The results of our study were less affected by the central effect. A greater visual appeal occurs when people encounter features that draw visual attention [4]. In this study, when certain features were focused on by the participants as they performed a visual search, visual attractiveness was generated, and thus, the hotspots differentiated to form multiple areas (Figure 1 I-C, I-F, II-F, and III-C), which also weakened the influence of the center effect on the results of this study. The homogeneity of landscape features or the high visual attractiveness of some landscape attributes might cause visual attention to be concentrated in one spot, as shown in Figure 1 I-A and II-C. The heatmap partly showed the distribution of highly visually attractive features. This information helps to understand the key attractive features of the environment and provides more ideas for landscape planning and design.
Comparing similar attributes of ornamental plants using a saliency-based method can reveal the landscape preferences and physiological responses for specific features [13]. The morphological characteristics of trees can predict the subjective ratings of people [5]. The preference is related to bottom-up processing of the visual features of the natural scene [35]. The low-level visual features (i.e., color spatial, shape) of naturalness are important to esthetic preference [35,36]. In this study, subjective preferences did not differ significantly among different landscape categories (Figure 2e), indicating that flower color, leaf color, vegetation type, and layer resulted in similar overall subjective preferences. However, in another study, flower color was the primary factor that affected the product choices of customers, followed by foliage color and price [37]. Additionally, flowering plants were found to be more popular than foliage plants [33]. We found no significant differences in the subjective ratings of foliage and leaf color overall (p > 0.05), but the participants had clear preferences for specific plant attributes. The results of the cluster analysis showed that people preferred blue flowers (II-A), red flowers (II-B), and pink flowers (II-C) in the high rating group (Figure 7, Cluster A), while the subjective ratings of leaf color were all in the medium and low rating groups (Figure 7, Clusters B and C). These results suggested that the subjective preference for visual attributes depended on the visual appeal generated by that feature rather than on organ attributes.
Trees + shrub + grass (multi-layers, IV-A), broad-leaf (I-C), and bamboo (I-E) had relatively high subjective ratings. A multi-layered community structure is positively associated with ecological benefits and has advantages in microclimate regulation [38]. A diverse community of colorful ornamental plants on the streets produces a greater sense of well-being for urban residents [39]. In China, “learning from nature” is advocated to build multi-level plant communities for developing natural forests. Therefore, people have preferred multi-layer communities from the earliest times to the present day, which can increase the exposure of people to green space, promote the well-being of urban residents, generate ecological benefits, and provide visual ornamental value. Among different vegetation types, arboreal bamboo plants have a higher subjective preference [13]. The preference for an arboreal canopy in the modern period might be an instinct formed as a result of evolutionary adaptations, as a canopy cover probably increased the survival of ancient humans [40]. Tree height and the crown-height ratio are important features for predicting subjective preferences [5]. Therefore, the subjective ratings of broad-leaved trees were higher than that of deciduous trees, as they had a dense crown and were greener. The differences in the climate in which the participants are located can influence their attitudes toward plant attributes [33,41]. Most participants were from the tropical and subtropical regions, where broad-leaved species are more widely used in urban green spaces. Coniferous trees are not favored by many, as they are widely used in cemeteries and are associated with negative feelings. Thus, coniferous trees are used less and have relatively low subjective ratings.
Color strongly influences humans, and it is a key parameter for regulating, guiding, and inducing specific psychological states in individuals [42]. Color establishes an emotional connection with humans from different religions and cultures [33]. In this study, people preferred red, blue, and pink flowers, which was similar to the results of other studies. People liked red flowers the most, followed by blue, green, and yellow flowers [43]. People prefer to buy red flowers because they convey positive emotions, while blue, green, purple, white, and dark colors induce calming thoughts [30]. Red flowers are the most popular as they convey high energy, followed by purple, orange, and mixed-colored flowers [33]. Colors give rise to aesthetic subjective preferences and emotional perception [44]. Colorful plants in urban green spaces can promote the well-being of urban residents [39]. Additionally, leaves with color stripes also showed a high subjective rating [13]. People have subjective preferences for specific colors of leavers or flowers because the visual stimulations of colors affect their emotions (positive, calming, comforting, etc.). The color preference bias is related to the evolution of human perception of color and the visual habits formed by different environmental contexts (i.e., climate or cultural context) [33,41]. In this study, the emotional perception and color bias might change with climate and greenery planting practices; this still needs more evidence.
Eye-tracking measures reflect the psychological contribution of landscape design intensity to the subjective preferences and restorative perceptions of people [19]. They indicate the subjective preferences of people for landscape features [13]. A higher mean decrease accuracy (%IncMSE) in the random forest model indicates the higher relative importance of the variables [45]. In this study, the results of the random forest model indicated that the relative importance of fixation count on subjective ratings was high. This result was consistent with those of other studies [13,22,46]. Visual attractiveness was determined based on the fixation count and fixation duration [11]. Visual attributes with low subjective preferences might be related to visual avoidance or low visual interest and low visual search and eye movements for stimuli. This can lead to a decrease in the fixation count. A decrease in eye movement is related to lower cognitive effort when people observe natural scenes [23]. Beautiful pictures are more visually appealing than ugly ones [2]. The visual value of stimuli can lead to a longer duration of fixation [47]. When the participants viewed the landscape attributes that had a high ornamental value, the fixation duration and fixation count increased, and the saccade amplitude decreased [22]. Conversely, in a study, robot faces with positive emotions induced lesser fixation and fixation duration than those with negative or neutral emotions [48]. The results of our study supported those of previous studies, which suggested a higher subjective preference for pictures with a significant visual appeal. Pictures that have a significant visual appeal elicit sufficiently high fixation to induce an increase in fixation count [11,13]. When people see pictures, processing occurs in five stages; the first three stages are mainly related to the quick processing of the contents of the picture, the bottom-up process that helps to perceive and analyze the picture; the last two stages are related to understanding and thinking about the contents of the picture, such as the top-down process [49]. Thus, the aesthetic value of the picture determines the fixation duration of the picture [49]. When people study features, they are reluctant to spend time observing and fixating on features with low visual attractiveness and low preference, suggesting a lower fixation count.
Pupil size does not indicate visual attention or preference for stimuli. Pupil diameter indicates how interested a person is in a stimulus [29]. A higher aesthetic stimulus increases pupil size [22]. However, a study showed that pupil size increased during emotional arousal and autonomic activation, regardless of whether people were shown a pleasant or an unpleasant image [50]. The results of this study were similar to those of the latter study, i.e., pupil size did not respond significantly to subjective preferences. Another study showed that pupil size was not strongly correlated with the subjective preference for ornamental bamboo features [13]. Perhaps all stimuli in this study increased pupil size, but there was no significant difference in pupil diameter between categories. We assumed that the pupil size would quickly respond to stimuli when viewing pictures with different degrees of attractiveness. The pupil size stabilizes when people think deeply about the contents of the stimulus in the last two stages of the five-stage image processing model. However, these findings need to be confirmed in future studies.
5. Conclusions
The combination of eye-tracking technology and subjective preference can accurately explain subjective preference and visual attention to landscape attributes of greenery. The participants preferred tree + shrub + grass (IV-A), blue flower (II-A), red flower (II-B), pink flower (II-C), broad-leaved tree (I-C), and bamboo (I-E). The random forest model showed that fixation count and the percentage of dwell time can indicate subjective preference. People generate visual attention by fixating on attractive visual attributes with high subjective ratings. The limitation of this research is that we have no specific experimental design to explain the effect of cultural context or region of participants on the color bias. In addition, some visual attributes (for example, fruit color/type) or a combination of attributes were not involved in this study. Future studies should consider methods, such as a combination of EEG and eye-tracking techniques, for determining the underlying physiological mechanisms of subjective preference generation. We would also invite participants from different climate areas or cultural contexts to reveal the mechanism of color preference bias. In the current study, we performed the machine learning algorithm (Random Forest algorithm) to explore the relationship between eye-tracking measures and subjective ratings. This study supplied an adjunct to explore the correlation between eye movements with mental health or fatigue, and the restorative effect of using eye-tracking technology. It also provided new insights into the mechanisms of subjective preference for the attributes of ornamental plants by performing eye tracking.
Supplementary Materials
The following supporting information can be downloaded at: https://www.mdpi.com/article/10.3390/f13111871/s1.
Author Contributions
Data curation, Y.H., Y.C. and L.G.; Funding acquisition, Y.C., L.G. and Q.L.; Investigation, Y.H. and Y.C.; Software, J.Z.; Visualization, Q.L.; Writing—original draft, J.Z.; Writing—review & editing, J.Z. All authors have read and agreed to the published version of the manuscript.
Funding
This research was funded by [Introduction of Talents Project of Putian University of Science and Technology] grant number [2021074], [Fujian Province educational research project of young and middle-aged teachers] grant number [JAT210386], [Special project of scientific research and innovation of Putian University] grant number [2021ZP02, 2021ZP03], [Fujian Social Science Foundation Project] grant number [FJ2022C072], [The Second Batch of 2021 MOE of PRC Industry-University Collaborative Education Program, Kingfar-CES “Human Factors and Ergonomics”] grant number [202102055016].
Data Availability Statement
Not applicable.
Conflicts of Interest
The authors declare no conflict of interest.
References
- Wilkie, S.; Clements, H. Further exploration of environment preference and environment type congruence on restoration and perceived restoration potential. Landsc. Urban Plan. 2018, 170, 314–319. [Google Scholar] [CrossRef]
- Scott, N.; Le, D.; Becken, S.; Connolly, R.M. Measuring perceived beauty of the Great Barrier Reef using eye-tracking technology. Curr. Issues Tour. 2020, 23, 2492–2502. [Google Scholar] [CrossRef]
- Avolio, M.L.; Pataki, D.E.; Pincetl, S.; Gillespie, T.W.; Jenerette, G.D.; McCarthy, H.R. Understanding preferences for tree attributes: The relative effects of socio-economic and local environmental factors. Urban Ecosyst. 2015, 18, 73–86. [Google Scholar] [CrossRef]
- Al-Samarraie, H.; Sarsam, S.M.; Alzahrani, A.I.; Alalwan, N. Personality and individual differences: The potential of using preferences for visual stimuli to predict the Big Five traits. Cogn. Technol. Work. 2018, 20, 337–349. [Google Scholar] [CrossRef]
- Hofmann, M.; Gerstenberg, T.; Gillner, S. Predicting tree preferences from visible tree characteristics. Eur. J. For. Res. 2017, 136, 421–432. [Google Scholar] [CrossRef]
- Van den Berg, A.E.; Koole, S.L.; van der Wulp, N.Y. Environmental preference and restoration: (How) are they related? J. Environ. Psychol. 2003, 23, 135–146. [Google Scholar] [CrossRef]
- Goller, J.; Mitrovic, A.; Leder, H. Effects of liking on visual attention in faces and paintings. Acta Psychol. 2019, 197, 115–123. [Google Scholar] [CrossRef]
- Van der Laan, L.N.; Hooge, I.T.C.; de Ridder, D.T.D.; Viergever, M.A.; Smeets, P.A.M. Do you like what you see? The role of first fixation and total fixation duration in consumer choice. Food Qual. Prefer. 2015, 39, 46–55. [Google Scholar] [CrossRef]
- Jiang, B.; Larsen, L.; Deal, B.; Sullivan, W.C. A dose–response curve describing the relationship between tree cover density and landscape preference. Landsc. Urban Plan. 2015, 139, 16–25. [Google Scholar] [CrossRef]
- Dupont, L.; Ooms, K.; Antrop, M.; Van Etvelde, V. Testing the validity of a saliency-based method for visual assessment of constructions in the landscape. Landsc. Urban Plan. 2017, 167, 325–338. [Google Scholar] [CrossRef]
- Behe, B.K.; Huddleston, P.T.; Childs, K.L.; Chen, J.; Muraro, I.S. Seeing through the forest: The gaze path to purchase. PLoS ONE 2020, 15, e240179. [Google Scholar] [CrossRef] [PubMed]
- Staples, A.; Behe, B.K.; Huddleston, P.; Malone, T. What you see is what you get, and what you don’t goes unsold: Choice overload and purchasing heuristics in a horticulture lab experiment. Agribusiness 2022, 38, 620–635. [Google Scholar] [CrossRef]
- Zheng, J.; Tarin, M.W.K.; Jiang, D.; Li, M.; Ye, J.; Chen, L.; He, T.; Zheng, Y. Which ornamental features of bamboo plants will attract the people most? Urban For. Urban Green. 2021, 61, 127101–127109. [Google Scholar] [CrossRef]
- Dudinskaya, E.C.; Naspetti, S.; Zanoli, R. Using eye-tracking as an aid to design on-screen choice experiments. J. Choice Model. 2020, 36, 100232. [Google Scholar] [CrossRef]
- Dixson, B.J.; Grimshaw, G.M.; Linklater, W.L.; Dixson, A.F. Eye Tracking of Men’s Preferences for Female Breast Size and Areola Pigmentation. Arch. Sex. Behav. 2011, 40, 51–58. [Google Scholar] [CrossRef]
- Aletta, F.; Oberman, T.; Mitchell, A.; Erfanian, M.; Lionello, M.; Kachlicka, M.; Kang, J. Associations between soundscape experience and self-reported wellbeing in open public urban spaces: A field study. Lancet 2019, 394, S17. [Google Scholar] [CrossRef]
- Paraskevopoulou, A.T.; Kamperi, E.; Demiris, N.; Economou, M.; Theleritis, C.; Kitsonas, M.; Papageorgiou, C. The impact of seasonal colour change in planting on patients with psychotic disorders using biosensors. Urban For. Urban Green. 2018, 36, 50–56. [Google Scholar] [CrossRef]
- Guo, S.; Sun, W.; Chen, W.; Zhang, J.; Liu, P. Impact of artificial elements on mountain landscape perception: An eye-tracking study. Land 2021, 10, 1102. [Google Scholar] [CrossRef]
- Wu, Y.; Zhuo, Z.; Liu, Q.; Yu, K.; Huang, Q.; Liu, J. The relationships between perceived design intensity, preference, restorativeness and eye movements in designed urban green space. Int. J. Environ. Res. Public Health 2021, 18, 10944. [Google Scholar] [CrossRef]
- Ding, N.; Zhong, Y.; Li, J.; Xiao, Q. Study on selection of native greening plants based on eye-tracking technology. Sci. Rep. 2022, 12, 1092. [Google Scholar] [CrossRef]
- Orquin, J.L.; Mueller Loose, S. Attention and choice: A review on eye movements in decision making. Acta Psychol. 2013, 144, 190–206. [Google Scholar] [CrossRef] [PubMed] [Green Version]
- Zhang, W.D.; Liang, Q.; Fang, H.L.; Zhang, Q.F. An eye-movement research on city greening landscape appreciation. J. Psychol. Sci. 2009, 4, 34–37. [Google Scholar]
- Martinez-Soto, J.; de la Fuente, S.L.; Gonzales-Santos, L.; Barrios, F.A. Observation of environments with different restorative potential results in differences in eye patron movements and pupillary size. IBRO Rep. 2019, 7, 52–58. [Google Scholar] [CrossRef]
- Berto, R.; Baroni, M.R.; Zainaghi, A.; Bettella, S. An exploratory study of the effect of high and low fascination environments on attentional fatigue. J. Environ. Psychol. 2010, 30, 494–500. [Google Scholar] [CrossRef]
- Berto, R. Exposure to restorative environments helps restore attentional capacity. J. Environ. Psychol. 2005, 25, 249–259. [Google Scholar] [CrossRef]
- Valtchanov, D.; Ellard, C.G. Cognitive and affective responses to natural scenes: Effects of low level visual properties on preference, cognitive load and eye-movements. J. Environ. Psychol. 2015, 43, 184–195. [Google Scholar] [CrossRef]
- Zhang, Z.; Gao, Y.; Zhou, S.; Zhang, T.; Zhang, W.; Meng, H. Psychological cognitive factors affecting visual behavior and satisfaction preference for forest recreation space. Forests 2022, 13, 136. [Google Scholar] [CrossRef]
- Ho, M.; Chen, J.; Huang, R.; Shen, M.; Lu, M.; Liu, C. Numerical analysis on color preference and visual comfort from eye tracking technique. Math. Probl. Eng. 2015, 2015, 861610. [Google Scholar] [CrossRef]
- Hess, E.H.; Polt, J.M. Pupil size as related to interest value of visual stimuli. Science 1960, 132, 349–350. [Google Scholar] [CrossRef]
- Wang, H.; Yang, Y.; Li, M.; Liu, J.; Jin, W. Residents’ preferences for roses, features of rose plantings and the relations between them in built-up areas of Beijing, China. Urban For. Urban Green. 2017, 27, 1–8. [Google Scholar] [CrossRef]
- Balcombe, K.; Fraser, I.; Williams, L.; McSorley, E. Examining the relationship between visual attention and stated preferences: A discrete choice experiment using eye-tracking. J. Econ. Behav. Organ. 2017, 144, 238–257. [Google Scholar] [CrossRef]
- Hair, J.F.; Black, W.C.; Babin, B.J.; Anderson, R.E. Multivariate Data Analysis, 7th ed.; Pearson Prentice Hall: Upper Saddle River, NJ, USA, 2010. [Google Scholar]
- Rahnema, S.; Sedaghathoor, S.; Allahyari, M.S.; Damalas, C.A.; Bilali, H.E. Preferences and emotion perceptions of ornamental plant species for green space designing among urban park users in Iran. Urban For. Urban Green. 2019, 39, 98–108. [Google Scholar] [CrossRef]
- Tatler, B.W. The central fixation bias in scene viewing: Selecting an optimal viewing position independently of motor biases and image feature distributions. J. Vis. 2007, 7, 1–17. [Google Scholar] [CrossRef] [PubMed] [Green Version]
- Kardan, O.; Demiralp, E.; Hout, M.C.; Hunter, M.R.; Karimi, H.; Hanayik, T.; Yourganov, G.; Jonides, J.; Berman, M.G. Is the preference of natural versus man-made scenes driven by bottom–up processing of the visual features of nature? Front. Psychol. 2015, 6, 471. [Google Scholar] [CrossRef] [Green Version]
- Berman, M.G.; Hout, M.C.; Kardan, O.; Hunter, M.R.; Yourganov, G.; Henderson, J.M.; Hanayik, T.; Karimi, H.; Jonides, J. The Perception of Naturalness Correlates with Low-Level Visual Features of Environmental Scenes. PLoS ONE 2014, 9, e114572. [Google Scholar] [CrossRef] [Green Version]
- Behe, B.K.; Nelson, R.G.; Barton, S.S.; Hall, C.R.; Safley, C.D.; Turner, S.R. Consumer preferences for Geranium flower color, leaf variegation, and Price. Hortscience 1999, 34, 740–742. [Google Scholar] [CrossRef] [Green Version]
- Zheng, J.; Tarin, M.W.K.; Chen, G.; Zhang, Q.; Deng, C. The characteristics of plant clusters influence on the cooling effect: A case study in a subtropical Island Park, China. Glob. Ecol. Conserv. 2022, 34, e2055. [Google Scholar] [CrossRef]
- Shentova, R.; de Vries, S.; Verboom, J. Well-being in the time of corona: Associations of nearby greenery with mental well-being during COVID-19 in The Netherlands. Sustainability 2022, 14, 10256. [Google Scholar] [CrossRef]
- Townsend, J.B.; Barton, S. The impact of ancient tree form on modern landscape preferences. Urban For. Urban Green. 2018, 34, 205–216. [Google Scholar] [CrossRef]
- Douven, I. Clustering colors. Cogn. Syst. Res. 2017, 45, 70–81. [Google Scholar] [CrossRef]
- Eder, M.; Öz, Ö. Spatialities of contentious politics: The case of Istanbul’s Besiktas neighborhood, cArsi footfall fandom and Gezi. Polit. Geogr. 2017, 61, 57–66. [Google Scholar] [CrossRef]
- Hurlbert, A.C.; Ling, Y. Biological components of sex differences in color preference. Curr. Biol. 2007, 17, R623–R625. [Google Scholar] [CrossRef] [PubMed] [Green Version]
- Zhuang, J.; Qiao, L.; Zhang, X.; Su, Y.; Xia, Y. Effects of visual attributes of flower borders in urban vegetation landscapes on aesthetic preference and emotional perception. Int. J. Environ. Res. Public Health 2021, 18, 9318. [Google Scholar] [CrossRef]
- Kuhn, S.; Egert, B.; Neumann, S.; Steinbeck, C. Building blocks for automated elucidation of metabolites: Machine learning methods for NMR prediction. BMC Bioinform. 2008, 9, 400. [Google Scholar] [CrossRef] [Green Version]
- Lee, T.; Tang, D.; Tsai, C. Exploring color preference through eye tracking. In Proceedings of the AIC Colour 05-10th Congress of the International Colour Association, Granada, Spain, 8–13 May 2005; pp. 333–336. [Google Scholar]
- Sun, L.; Shao, H.; Li, S.; Huang, X.; Yang, W. Integrated application of eye movement analysis and beauty estimation in the visual landscape quality estimation of urban waterfront park. Int. J. Pattern Recognit. 2018, 32, 1856010. [Google Scholar] [CrossRef]
- Li, M.M.; Guo, F.; Ren, Z.G.; Duffy, V.G. A visual and neural evaluation of the affective impression on humanoid robot appearances in free viewing. Int. J. Ind. Ergon. 2022, 88, 103159. [Google Scholar] [CrossRef]
- Locher, P.; Krupinski, E.A.; Mello-Thoms, C.; Nodine, C.F. Visual interest in pictorial art during an aesthetic experience. Spat. Vis. 2007, 21, 55–77. [Google Scholar] [CrossRef] [PubMed]
- Bradley, M.M.; Miccoli, L.; Escrig, M.A.; Lang, P.J. The pupil as a measure of emotional arousal and autonomic activation. Psychophysiology 2008, 45, 602–607. [Google Scholar] [CrossRef]
Figure 1.
A heatmap of four categories associated with different visual attributes showing the position and duration of fixation. The red areas had the longest fixation time and were visually more attractive, while the green areas had the shortest fixation time and were visually less attractive.
Figure 1.
A heatmap of four categories associated with different visual attributes showing the position and duration of fixation. The red areas had the longest fixation time and were visually more attractive, while the green areas had the shortest fixation time and were visually less attractive.

Figure 2.
The subjective ratings of four categories in urban ornamental plants are shown; (a–e) represent vegetation type, flower color, leaf color, layers, and categories, respectively; I-A–I-F represent grassland, shrub, broad-leaf tree, coniferous tree, bamboo, and palm, respectively; II-A–II-F represent blue, red, pink, purple, white, and yellow flowers, respectively; III-A–III-C represent green, yellow, and red leaves, respectively; IV-A–IV-D represent tree + shrub + grass, shrub + grass, shrub, and grass, respectively. Different lowercase letters indicate significant differences among different attributes with the same category (p < 0.05). Little square represents the mean and rhombus filled with black represents outliers.

Figure 3.
The eye-tracking measures of vegetation type are shown; (a–g) represent pupil size, first fixation duration, the percentage of dwell time, fixation count, saccade amplitude, saccade velocity, and saccade count, respectively; I-A–I-F represent grassland, shrub, broad-leaf tree, coniferous tree, bamboo, and palm, respectively. Different lowercase letters indicate significant differences among different attributes with the same category (p < 0.05). Little square represents the mean and rhombus filled with black represents outliers.

Figure 4.
The eye-tracking measures of flower color are shown; (a–g) represent pupil size, first fixation duration, the percentage of dwell time, fixation count, saccade amplitude, saccade velocity, and saccade count, respectively; II-A–II-F represent blue, red, pink, purple, white, and yellow flowers, respectively. Different lowercase letters indicate significant differences among different attributes with the same category (p < 0.05). Little square represents the mean and rhombus filled with black represents outliers.

Figure 5.
Eye-tracking measures of leaf color are shown, (a–g) represent pupil size, first fixation duration, the percentage of dwell time, fixation count, saccade amplitude, saccade velocity, and saccade count, respectively; III-A–III-C represent green, yellow, and red leaves, respectively. Different lowercase letters indicate significant differences among different attributes with the same category (p < 0.05). Little square represents the mean and rhombus filled with black represents outliers.

Figure 6.
Eye-tracking measures for different layers are shown, (a–g) represent pupil size, first fixation duration, the percentage of dwell time, fixation count, saccade amplitude, saccade velocity, and saccade count, respectively; IV-A–IV-D represent tree + shrub + grass, shrub + grass, shrub, and grass, respectively. Different lowercase letters indicate significant differences among different attributes with the same category (p < 0.05). Little square represents the mean and rhombus filled with black represents outliers.

Figure 7.
Hierarchical clustering analysis of the ratings of the ornamental features. Based on the Euclidean distance, these features were classified into three groups, Cluster A (high ratings), Cluster B (medium ratings), and Cluster C (low ratings). I-A–I-F represent grassland, shrub, broad-leaf tree, coniferous tree, bamboo, and palm, respectively; II-A–II-F represent blue, red, pink, purple, white, and yellow flowers, respectively; III-A–III-C represent green, yellow, and red leaves, respectively; IV-A–IV-D represent tree + shrub + grass, shrub + grass, shrub, and grass, respectively.

Figure 8.
The order of mean decrease accuracy of eye-tracking measures concerning subjective ratings.
Figure 8.
The order of mean decrease accuracy of eye-tracking measures concerning subjective ratings.


Table 1.
Chi-square test of eye-tracking measures and subjective ratings of visual attributes.
| Eye-Tracking Measures | Vegetation Type | Flower Color | Leaf Color | Layer | ||||
|---|---|---|---|---|---|---|---|---|
| r | r | r | r | |||||
| Pupil size | −0.020 | 2131.860 | 0.026 | 1567.094 | 0.162 ** | 804.330 | 0.070 | 1065.167 |
| First fixation duration | −0.050 | 1222.827 | −0.072 | 1060.040 | −0.001 | 623.700 | −0.064 | 785.029 |
| Percent of dwell time | 0.067 | 1747.592 | 0.072 | 1424.126 | 0.248 ** | 635.790 | 0.215 ** | 885.330 * |
| Fixation count | 0.056 | 179.028 | 0.111 ** | 163.850 | 0.202 ** | 116.790 | 0.32 ** | 145.626 |
| Saccade amplitude | 0.013 | 2155.151 | −0.171 ** | 1580.703 | 0.028 | 804.270 | −0.092 | 1074.119 |
| Saccade velocity | 0.019 | 2157.575 | −0.083 | 1596.287 | −0.020 | 810.000 | −0.089 | 1074.119 |
| Saccade count | 0.090 * | 152.627 | 0.148 ** | 148.810 | −0.069 | 124.160 | 0.141 ** | 130.343 |
r: Spearman coefficient, *: p < 0.05, **: p < 0.01 (two-tailed).
Publisher’s Note: MDPI stays neutral with regard to jurisdictional claims in published maps and institutional affiliations. |
© 2022 by the authors. Licensee MDPI, Basel, Switzerland. This article is an open access article distributed under the terms and conditions of the Creative Commons Attribution (CC BY) license (https://creativecommons.org/licenses/by/4.0/).
Share and Cite
MDPI and ACS Style
Zheng, J.; Huang, Y.; Chen, Y.; Guan, L.; Liu, Q. Subjective Preference and Visual Attention to the Attributes of Ornamental Plants in Urban Green Space: An Eye-Tracking Study. Forests 2022, 13, 1871. https://doi.org/10.3390/f13111871
AMA Style
Zheng J, Huang Y, Chen Y, Guan L, Liu Q. Subjective Preference and Visual Attention to the Attributes of Ornamental Plants in Urban Green Space: An Eye-Tracking Study. Forests. 2022; 13(11):1871. https://doi.org/10.3390/f13111871
Chicago/Turabian StyleZheng, Junming, Yanzhen Huang, Yashan Chen, Lei Guan, and Qunyue Liu. 2022. "Subjective Preference and Visual Attention to the Attributes of Ornamental Plants in Urban Green Space: An Eye-Tracking Study" Forests 13, no. 11: 1871. https://doi.org/10.3390/f13111871
Note that from the first issue of 2016, this journal uses article numbers instead of page numbers. See further details here.