

Effects of Herbaceous Plant Roots on the Soil Shear Strength of the Collapsing Walls of Benggang in Southeast China
Abstract
:1. Introduction
2. Materials and Methods
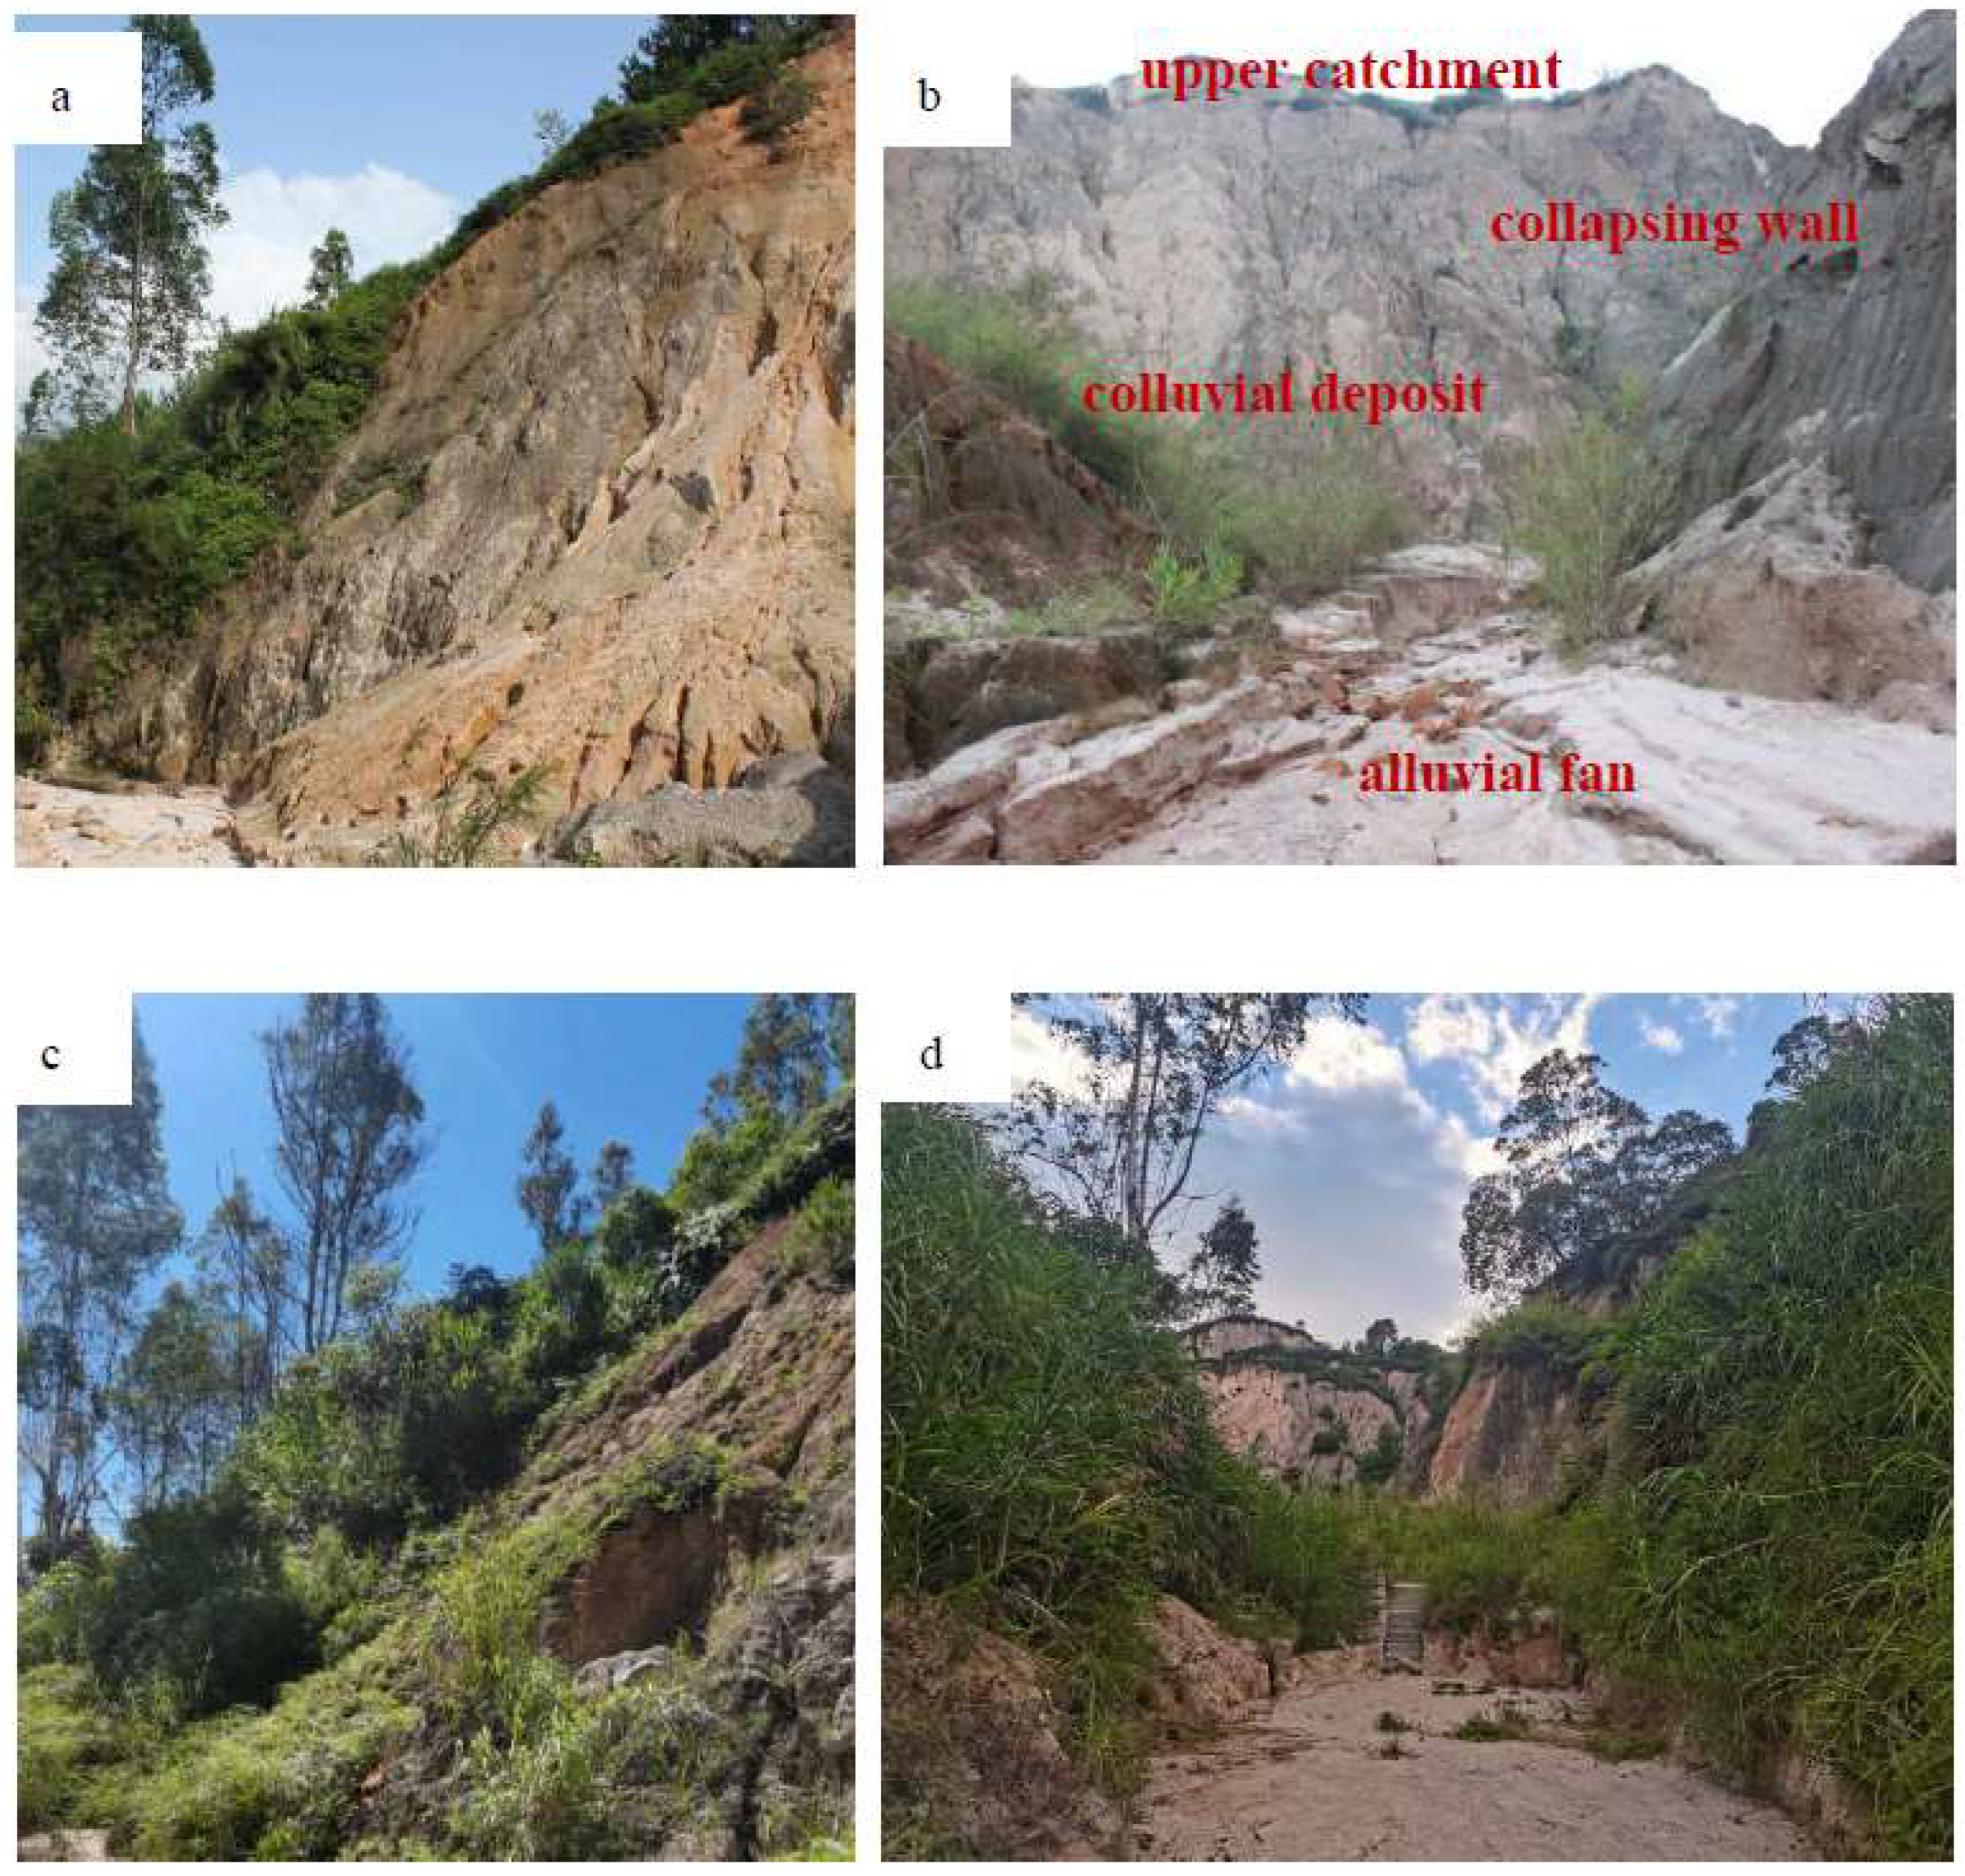
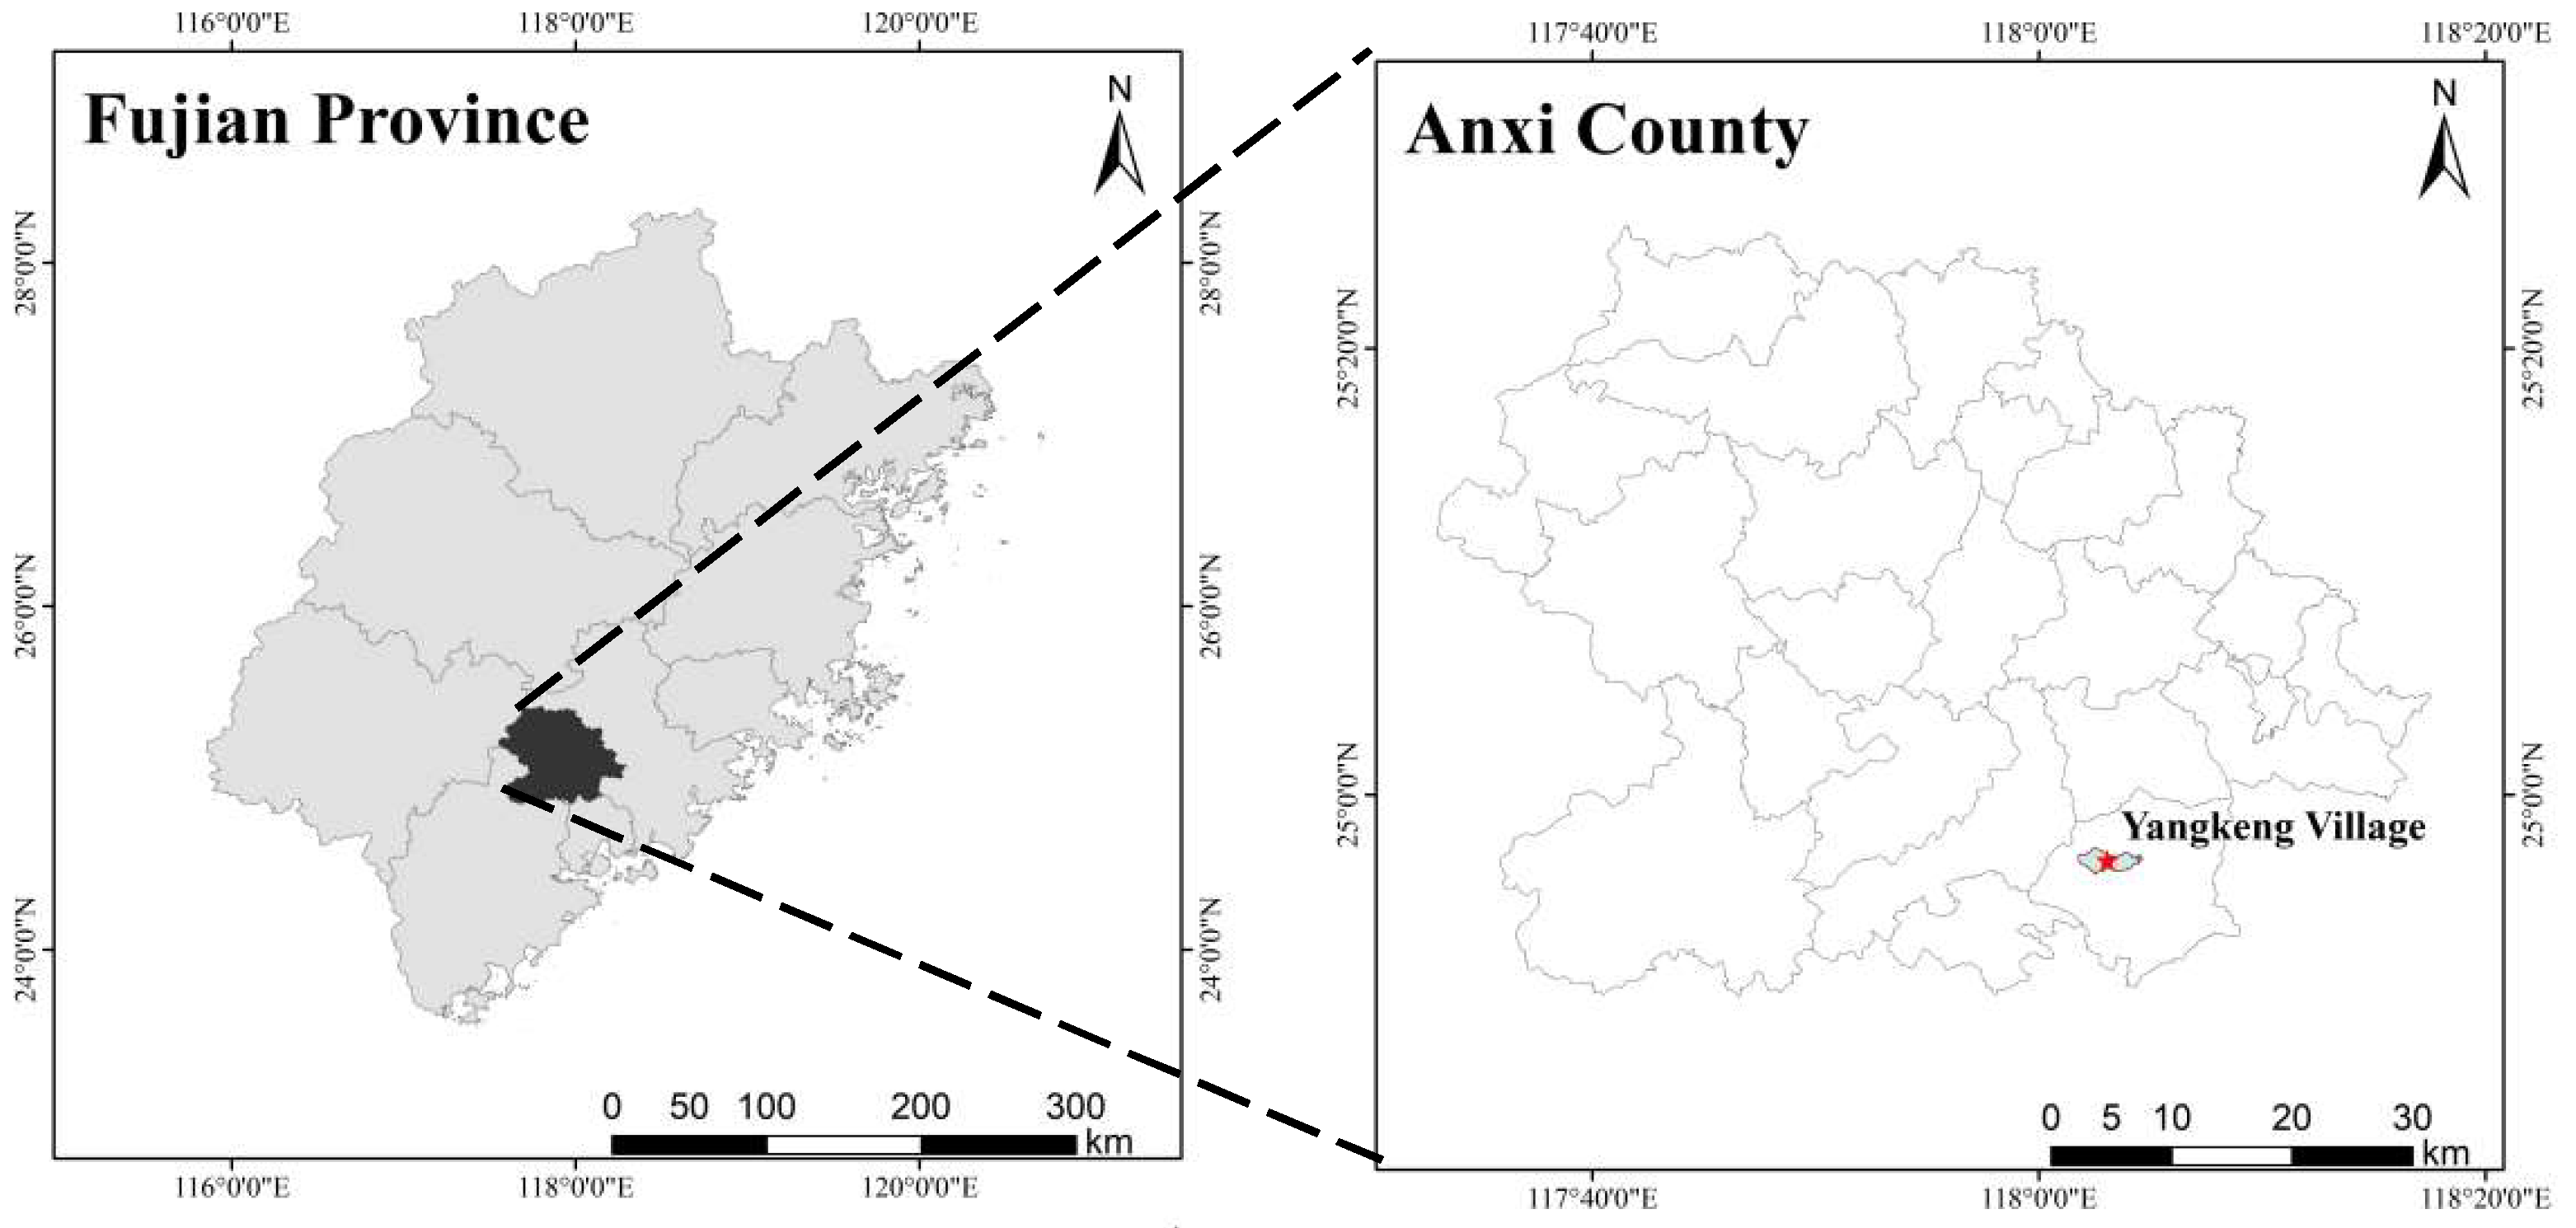
2.1. Study Area
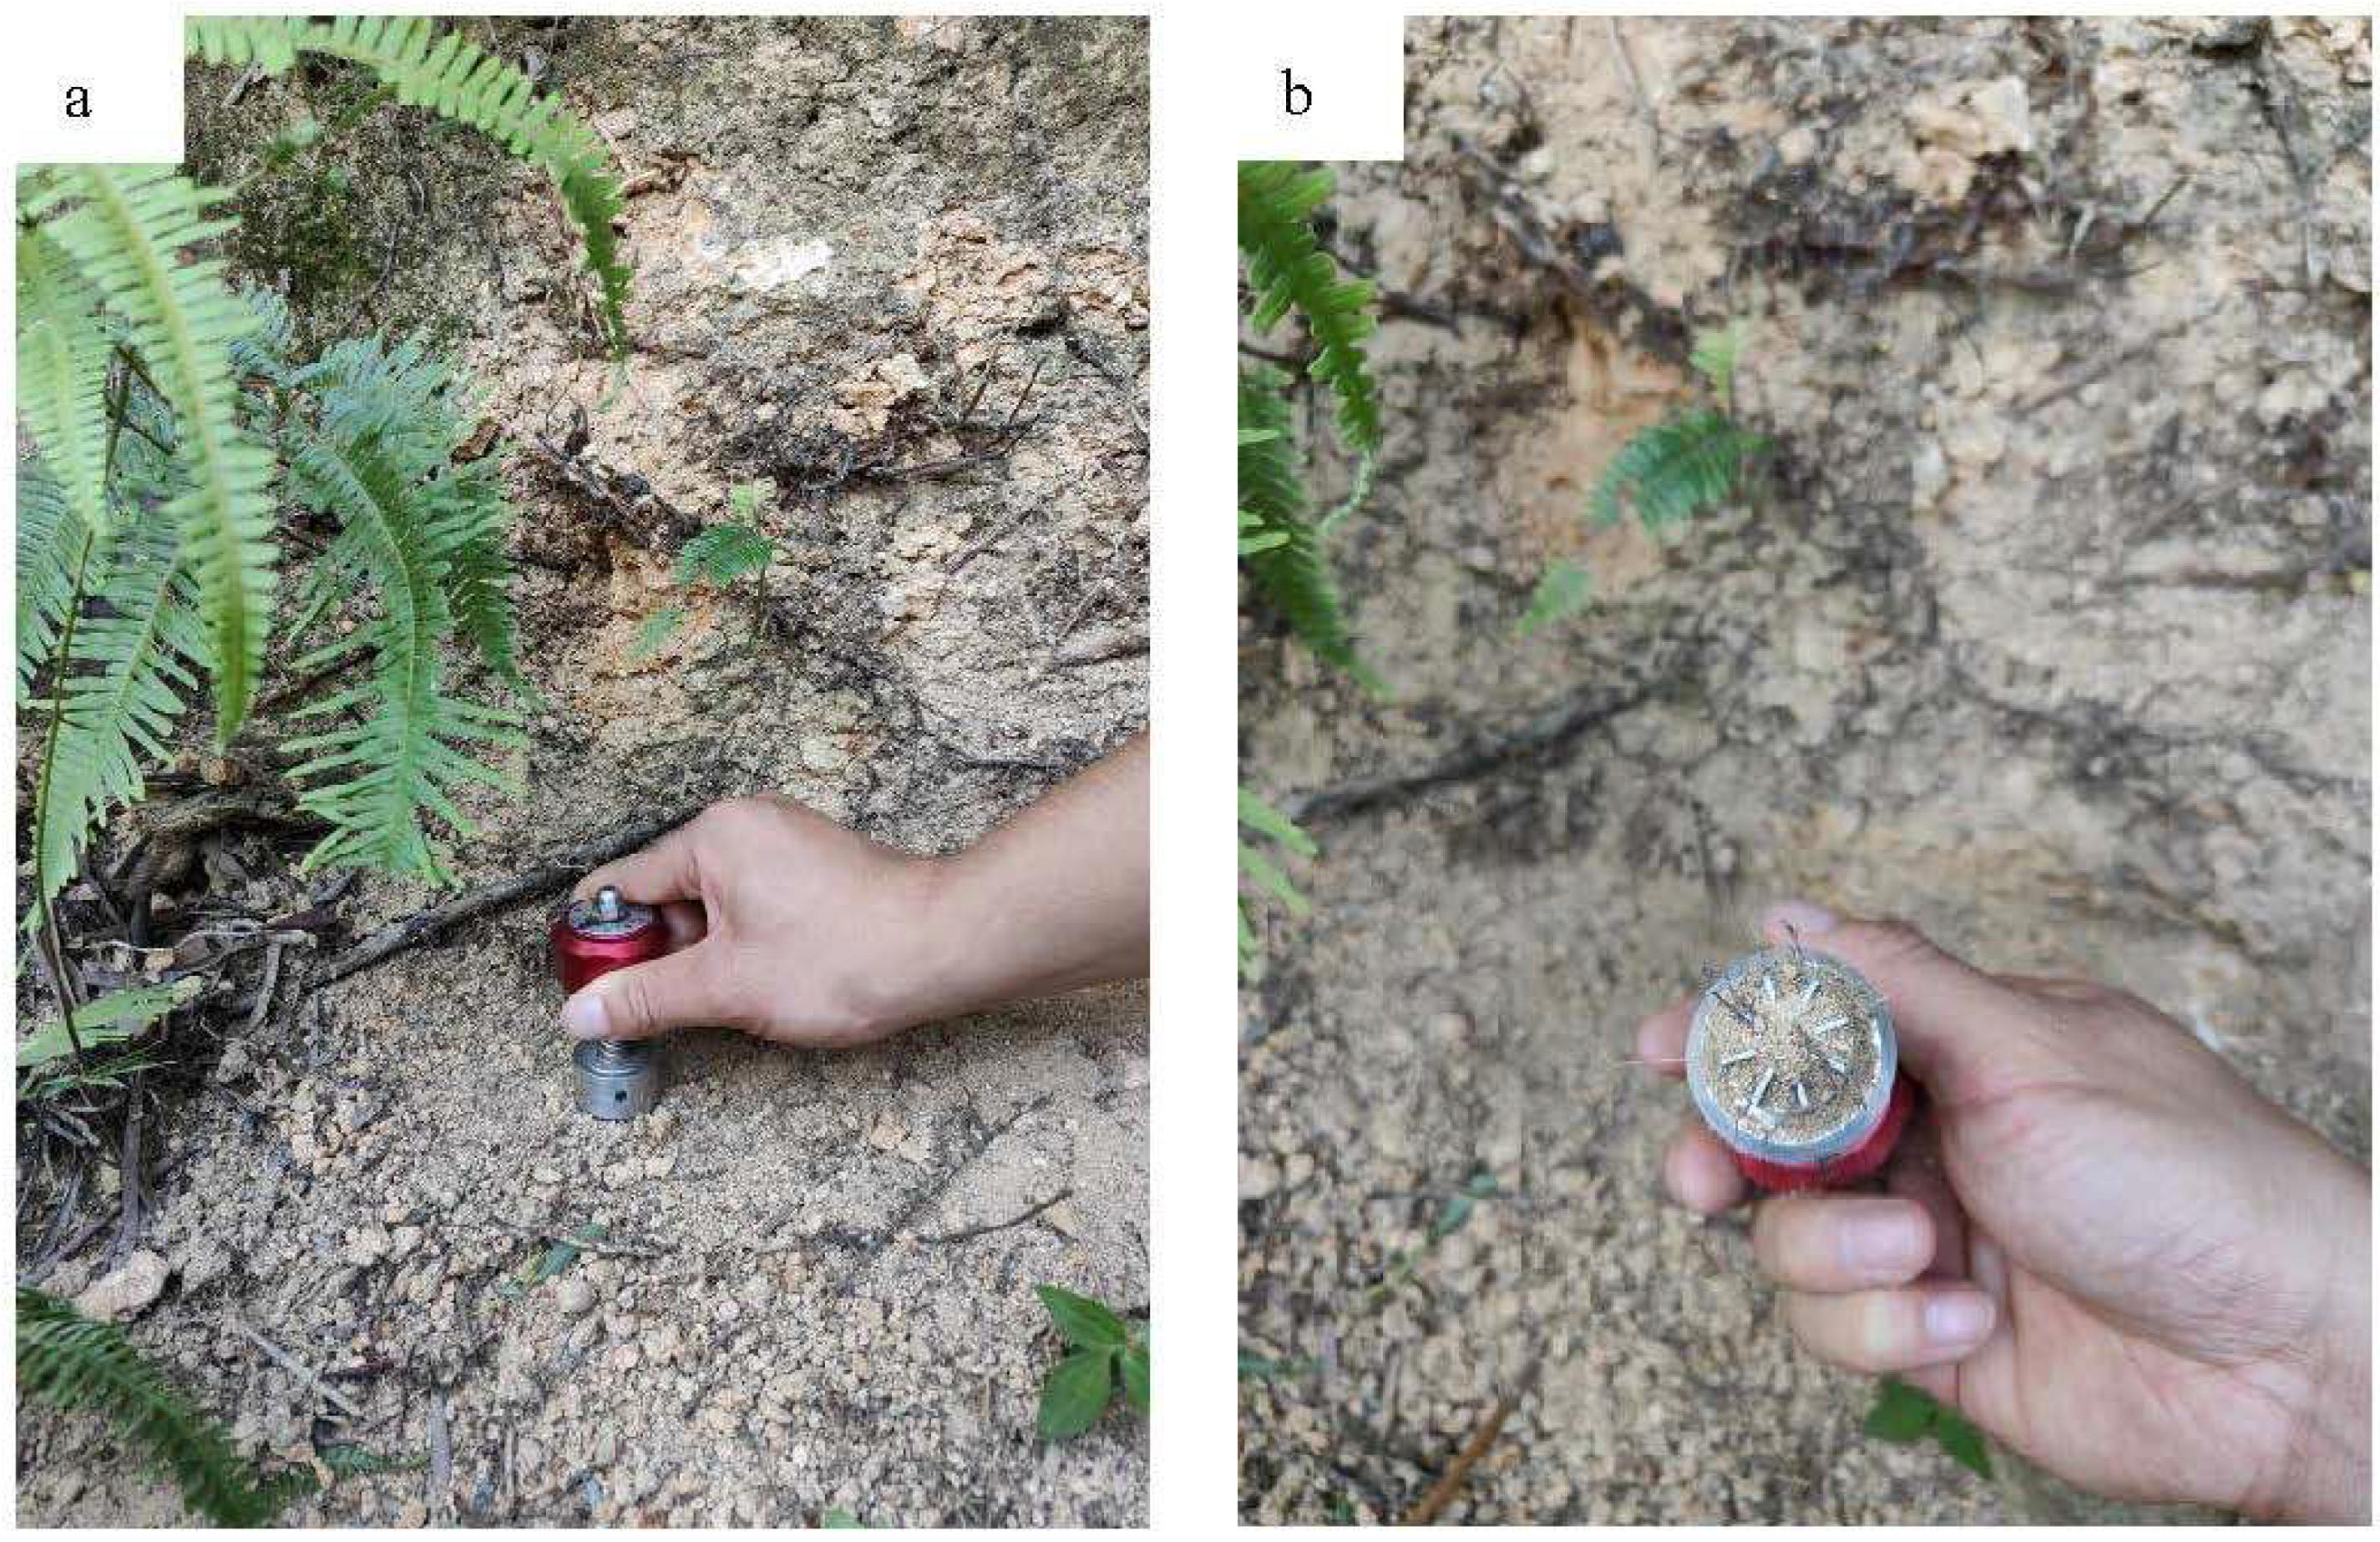
2.2. Field Investigation and Shear Strength Determination of Root–Soil Complexes
2.3. Sample Collection and Determination
2.4. Determination of the Tensile Properties of Roots
2.5. Calculation of the Correction Coefficient of the WWM Model
2.6. Validity Test of the Fitted Equation
2.7. Data Analysis and Processing
3. Results
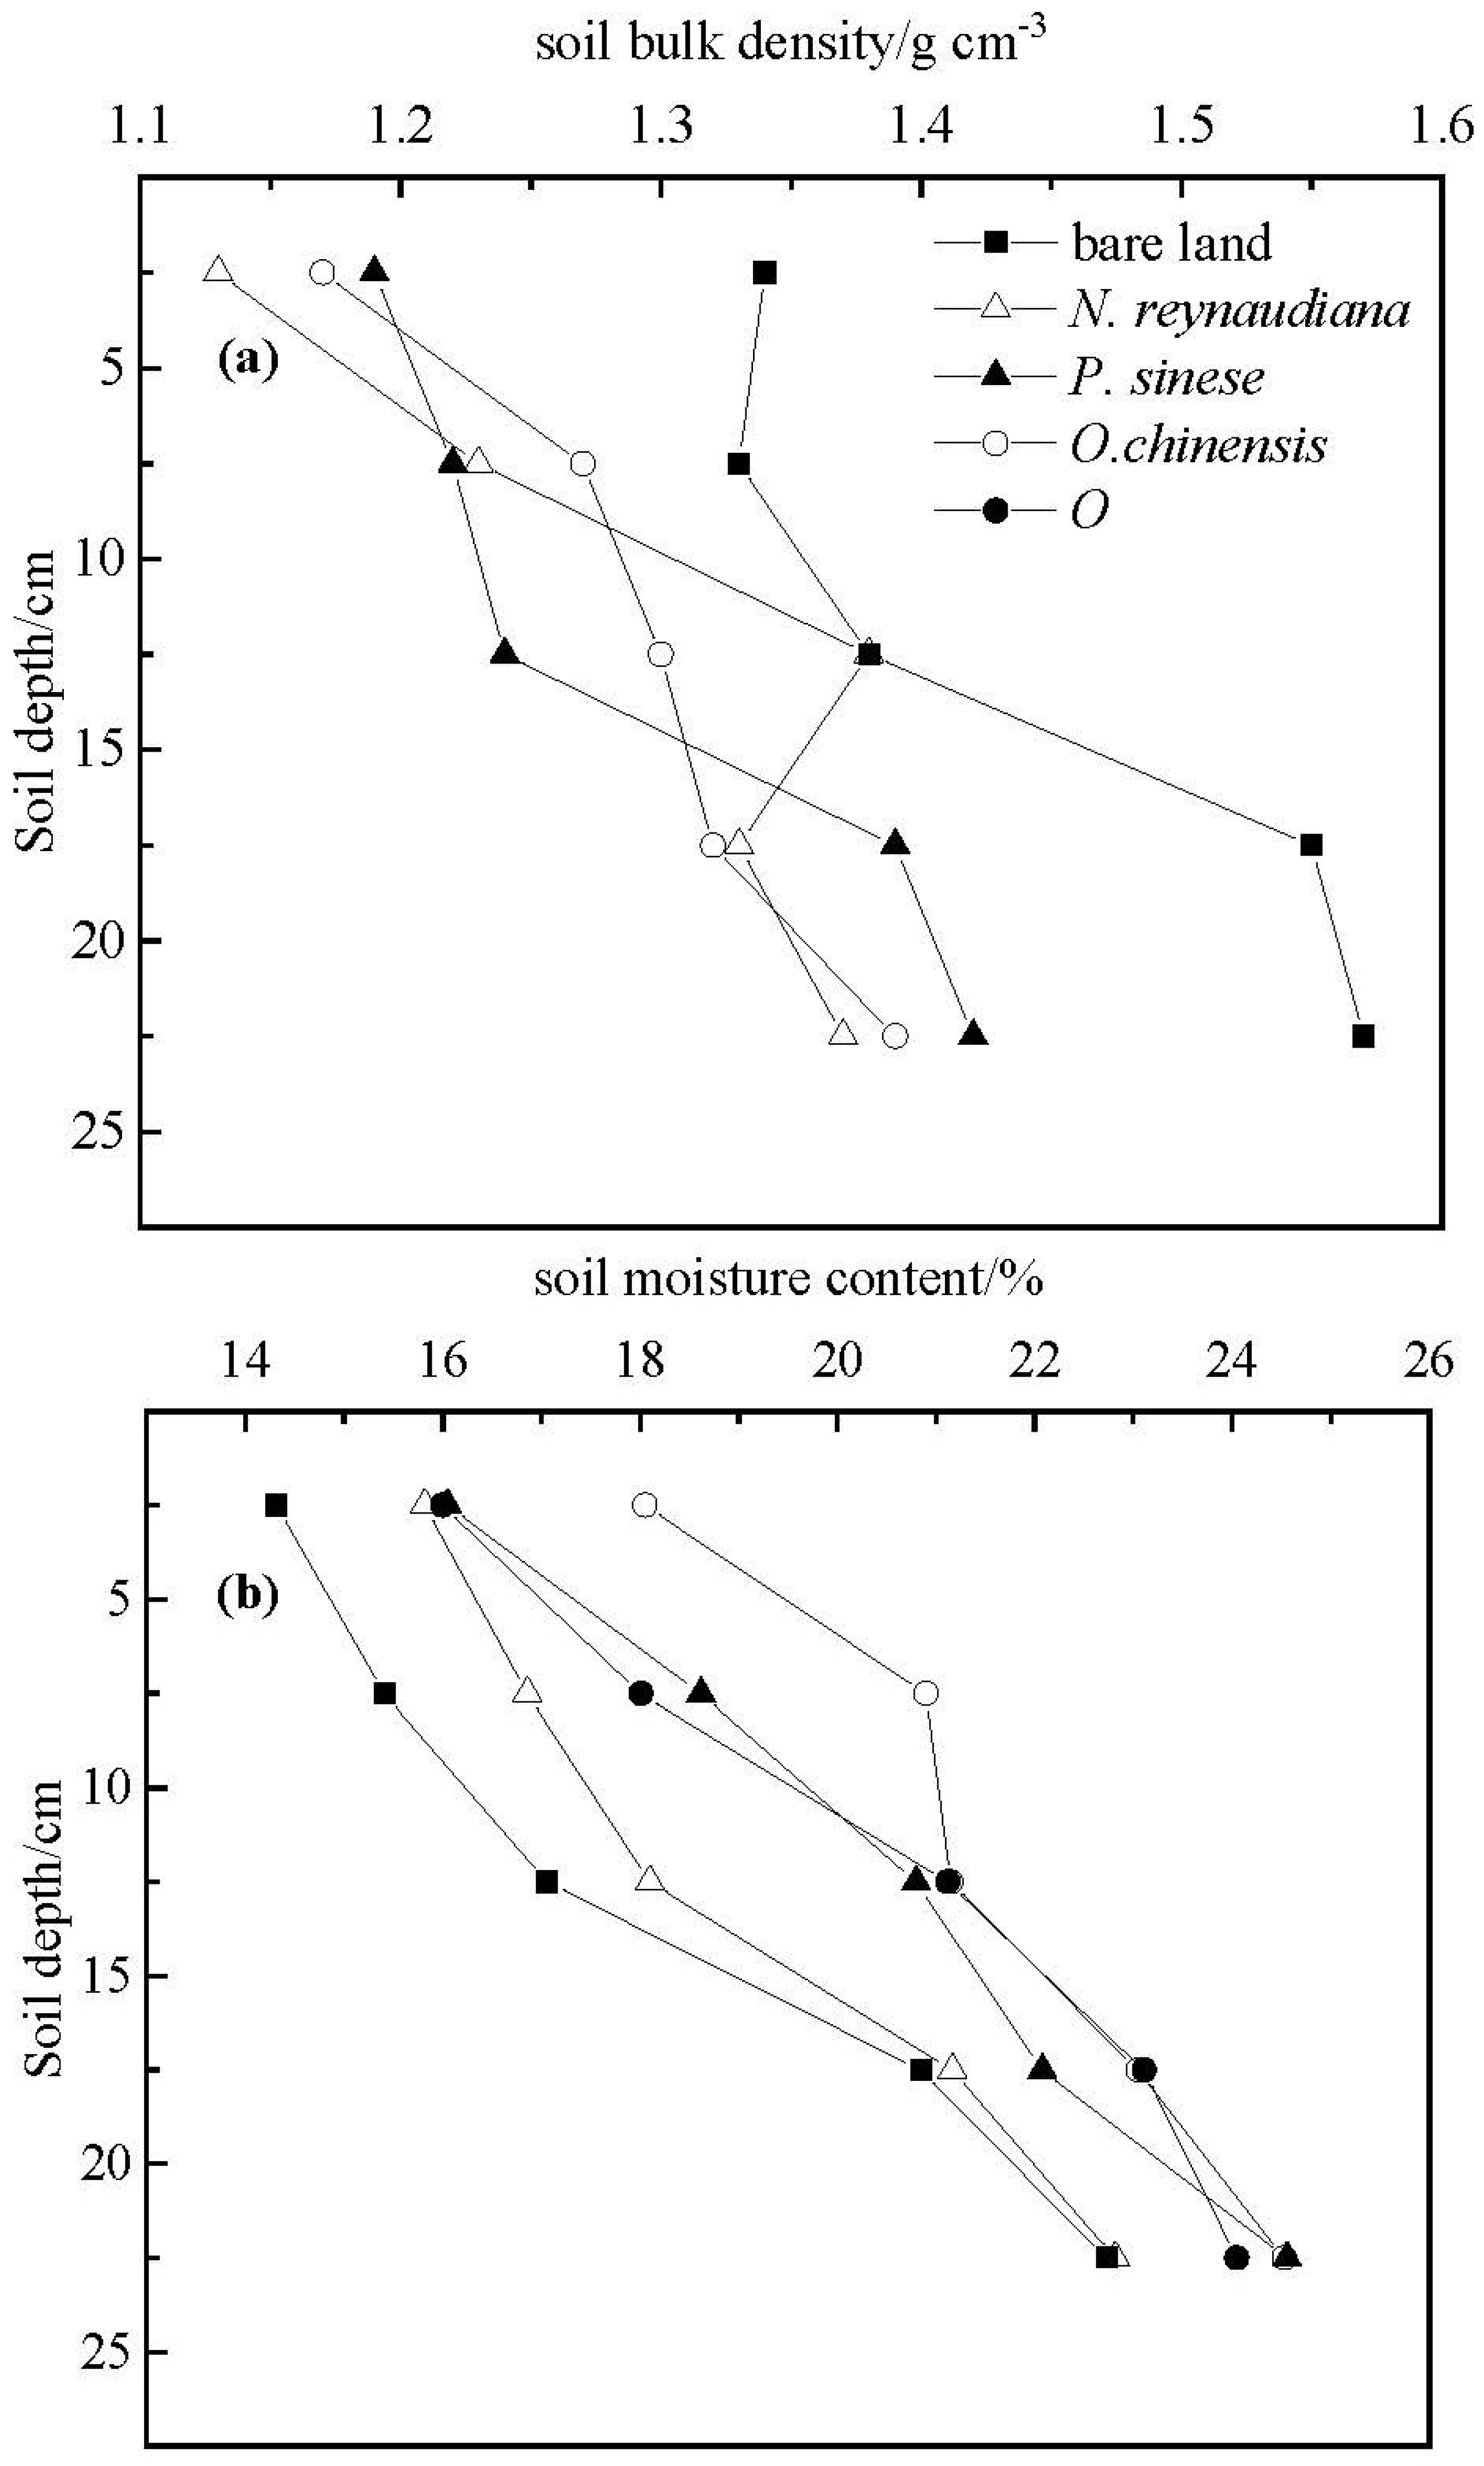
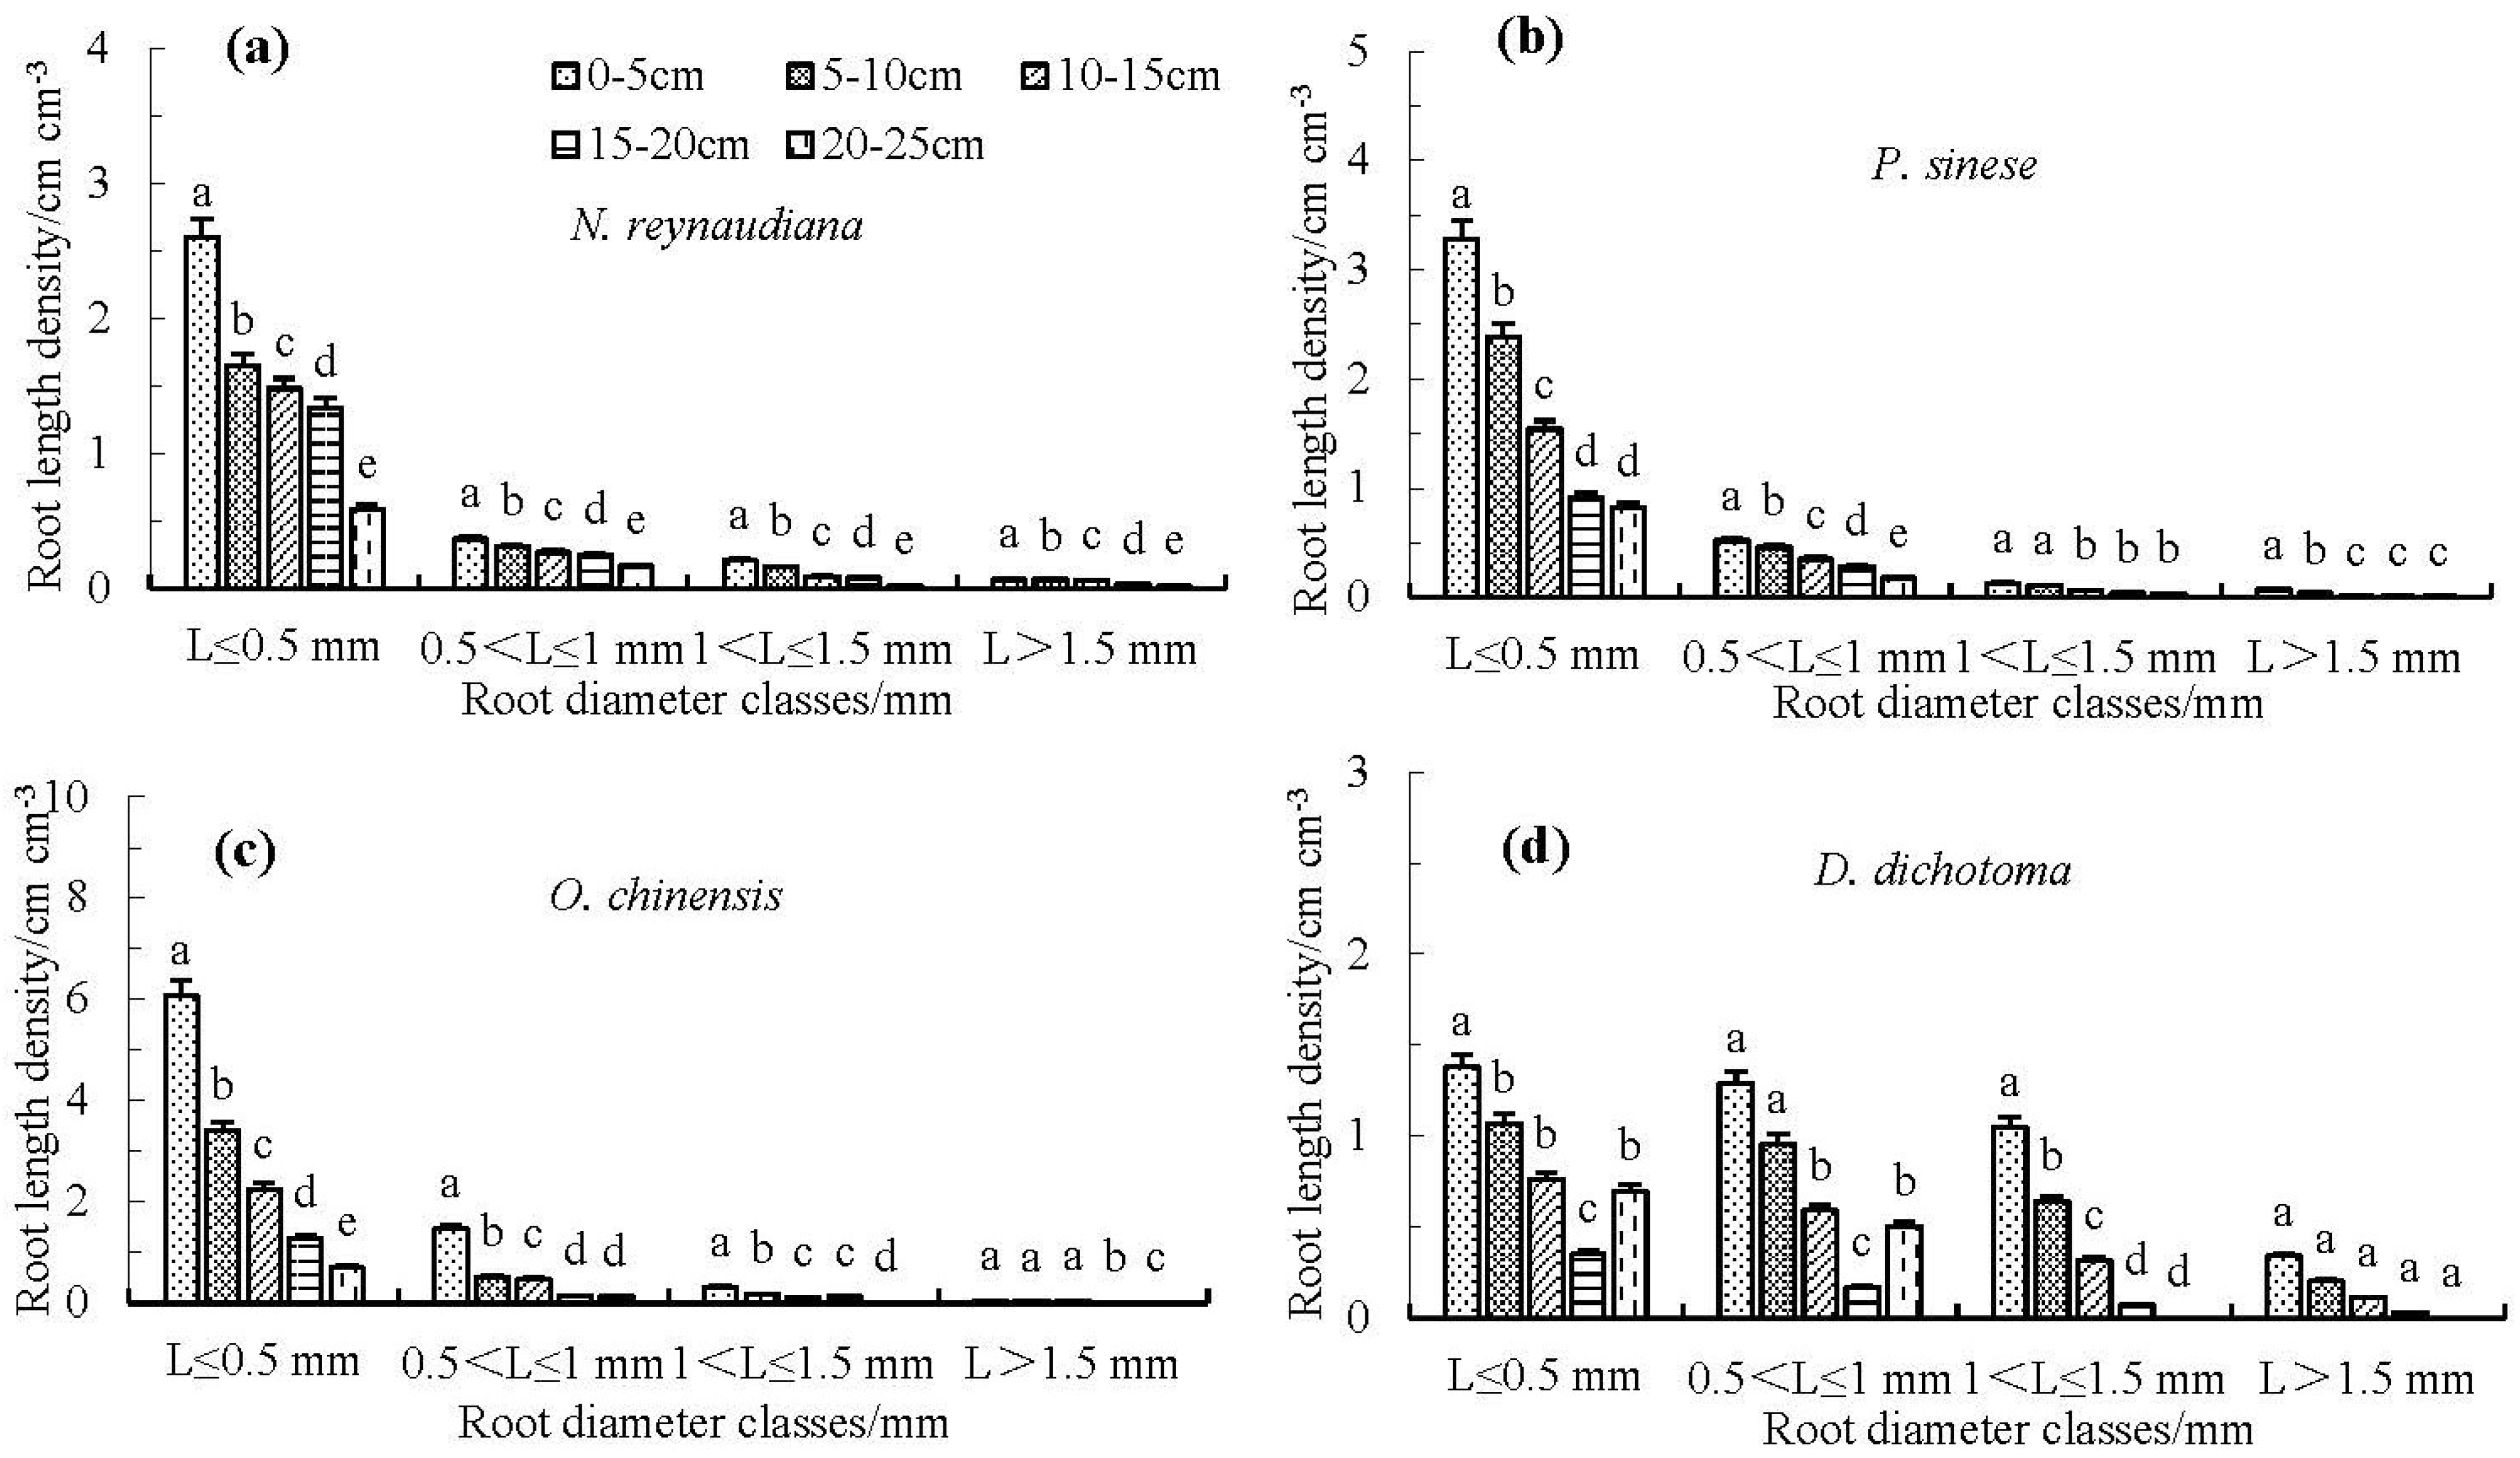
3.1. Soil and Root Properties
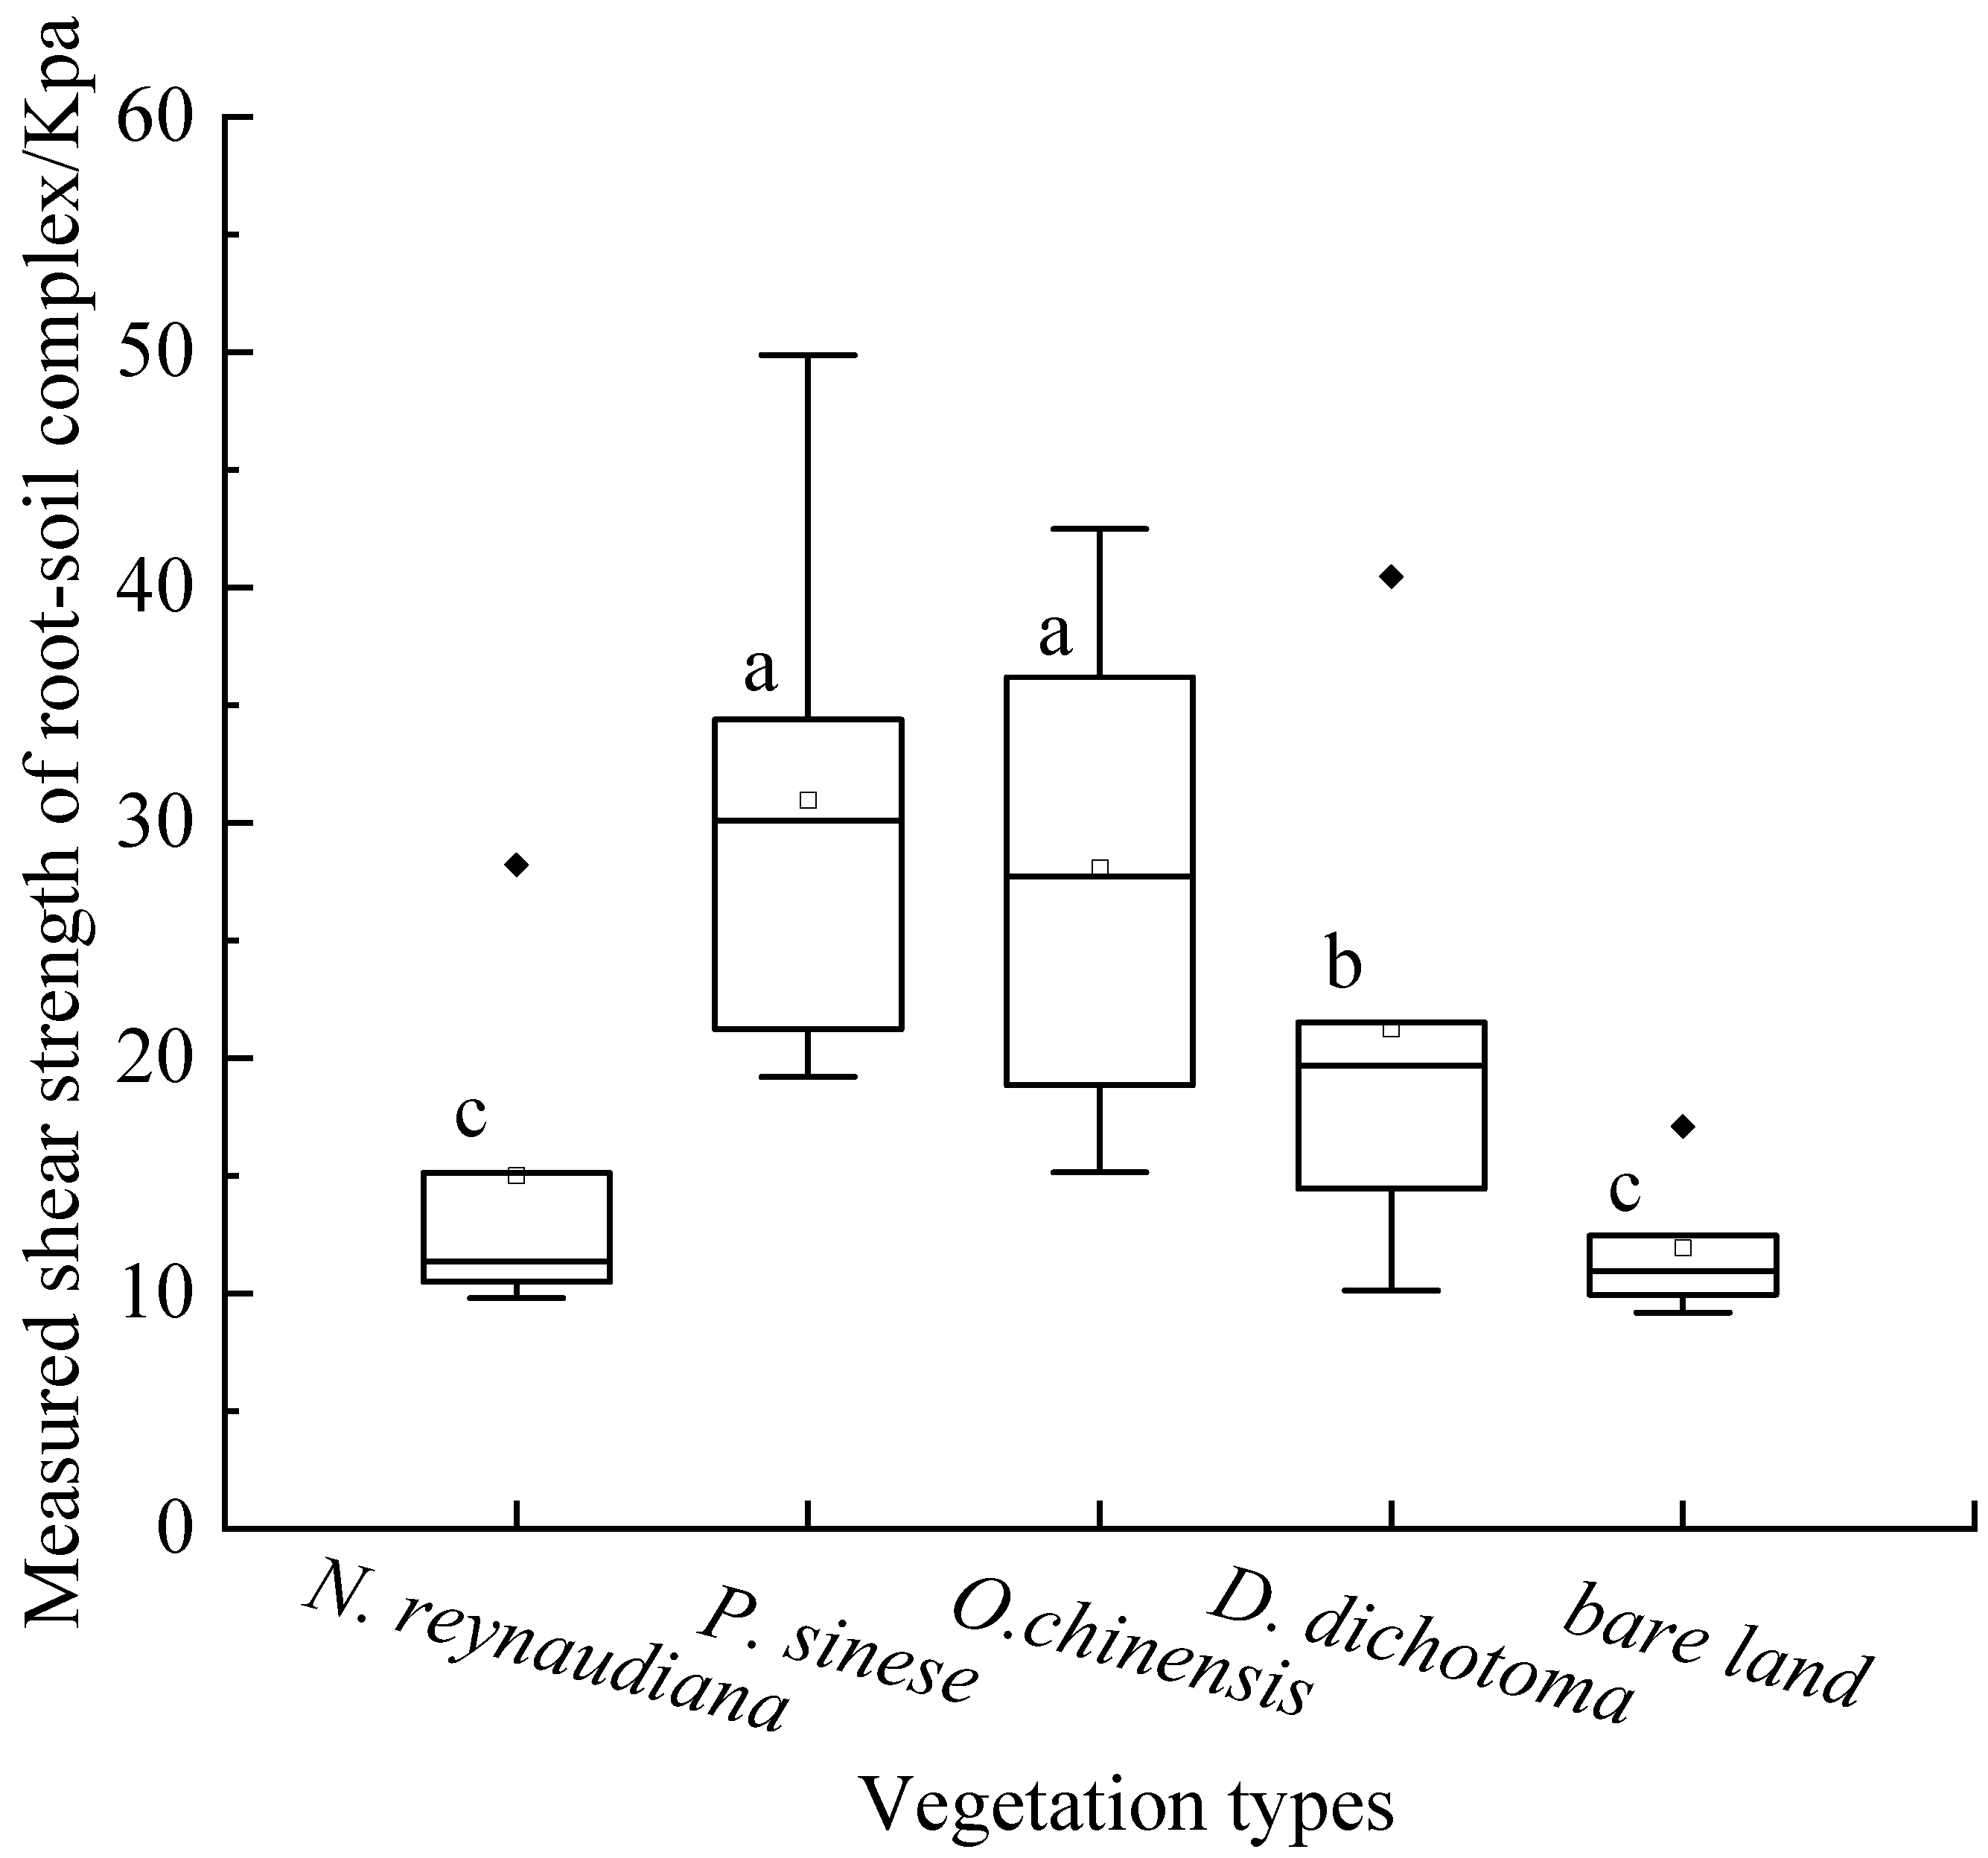
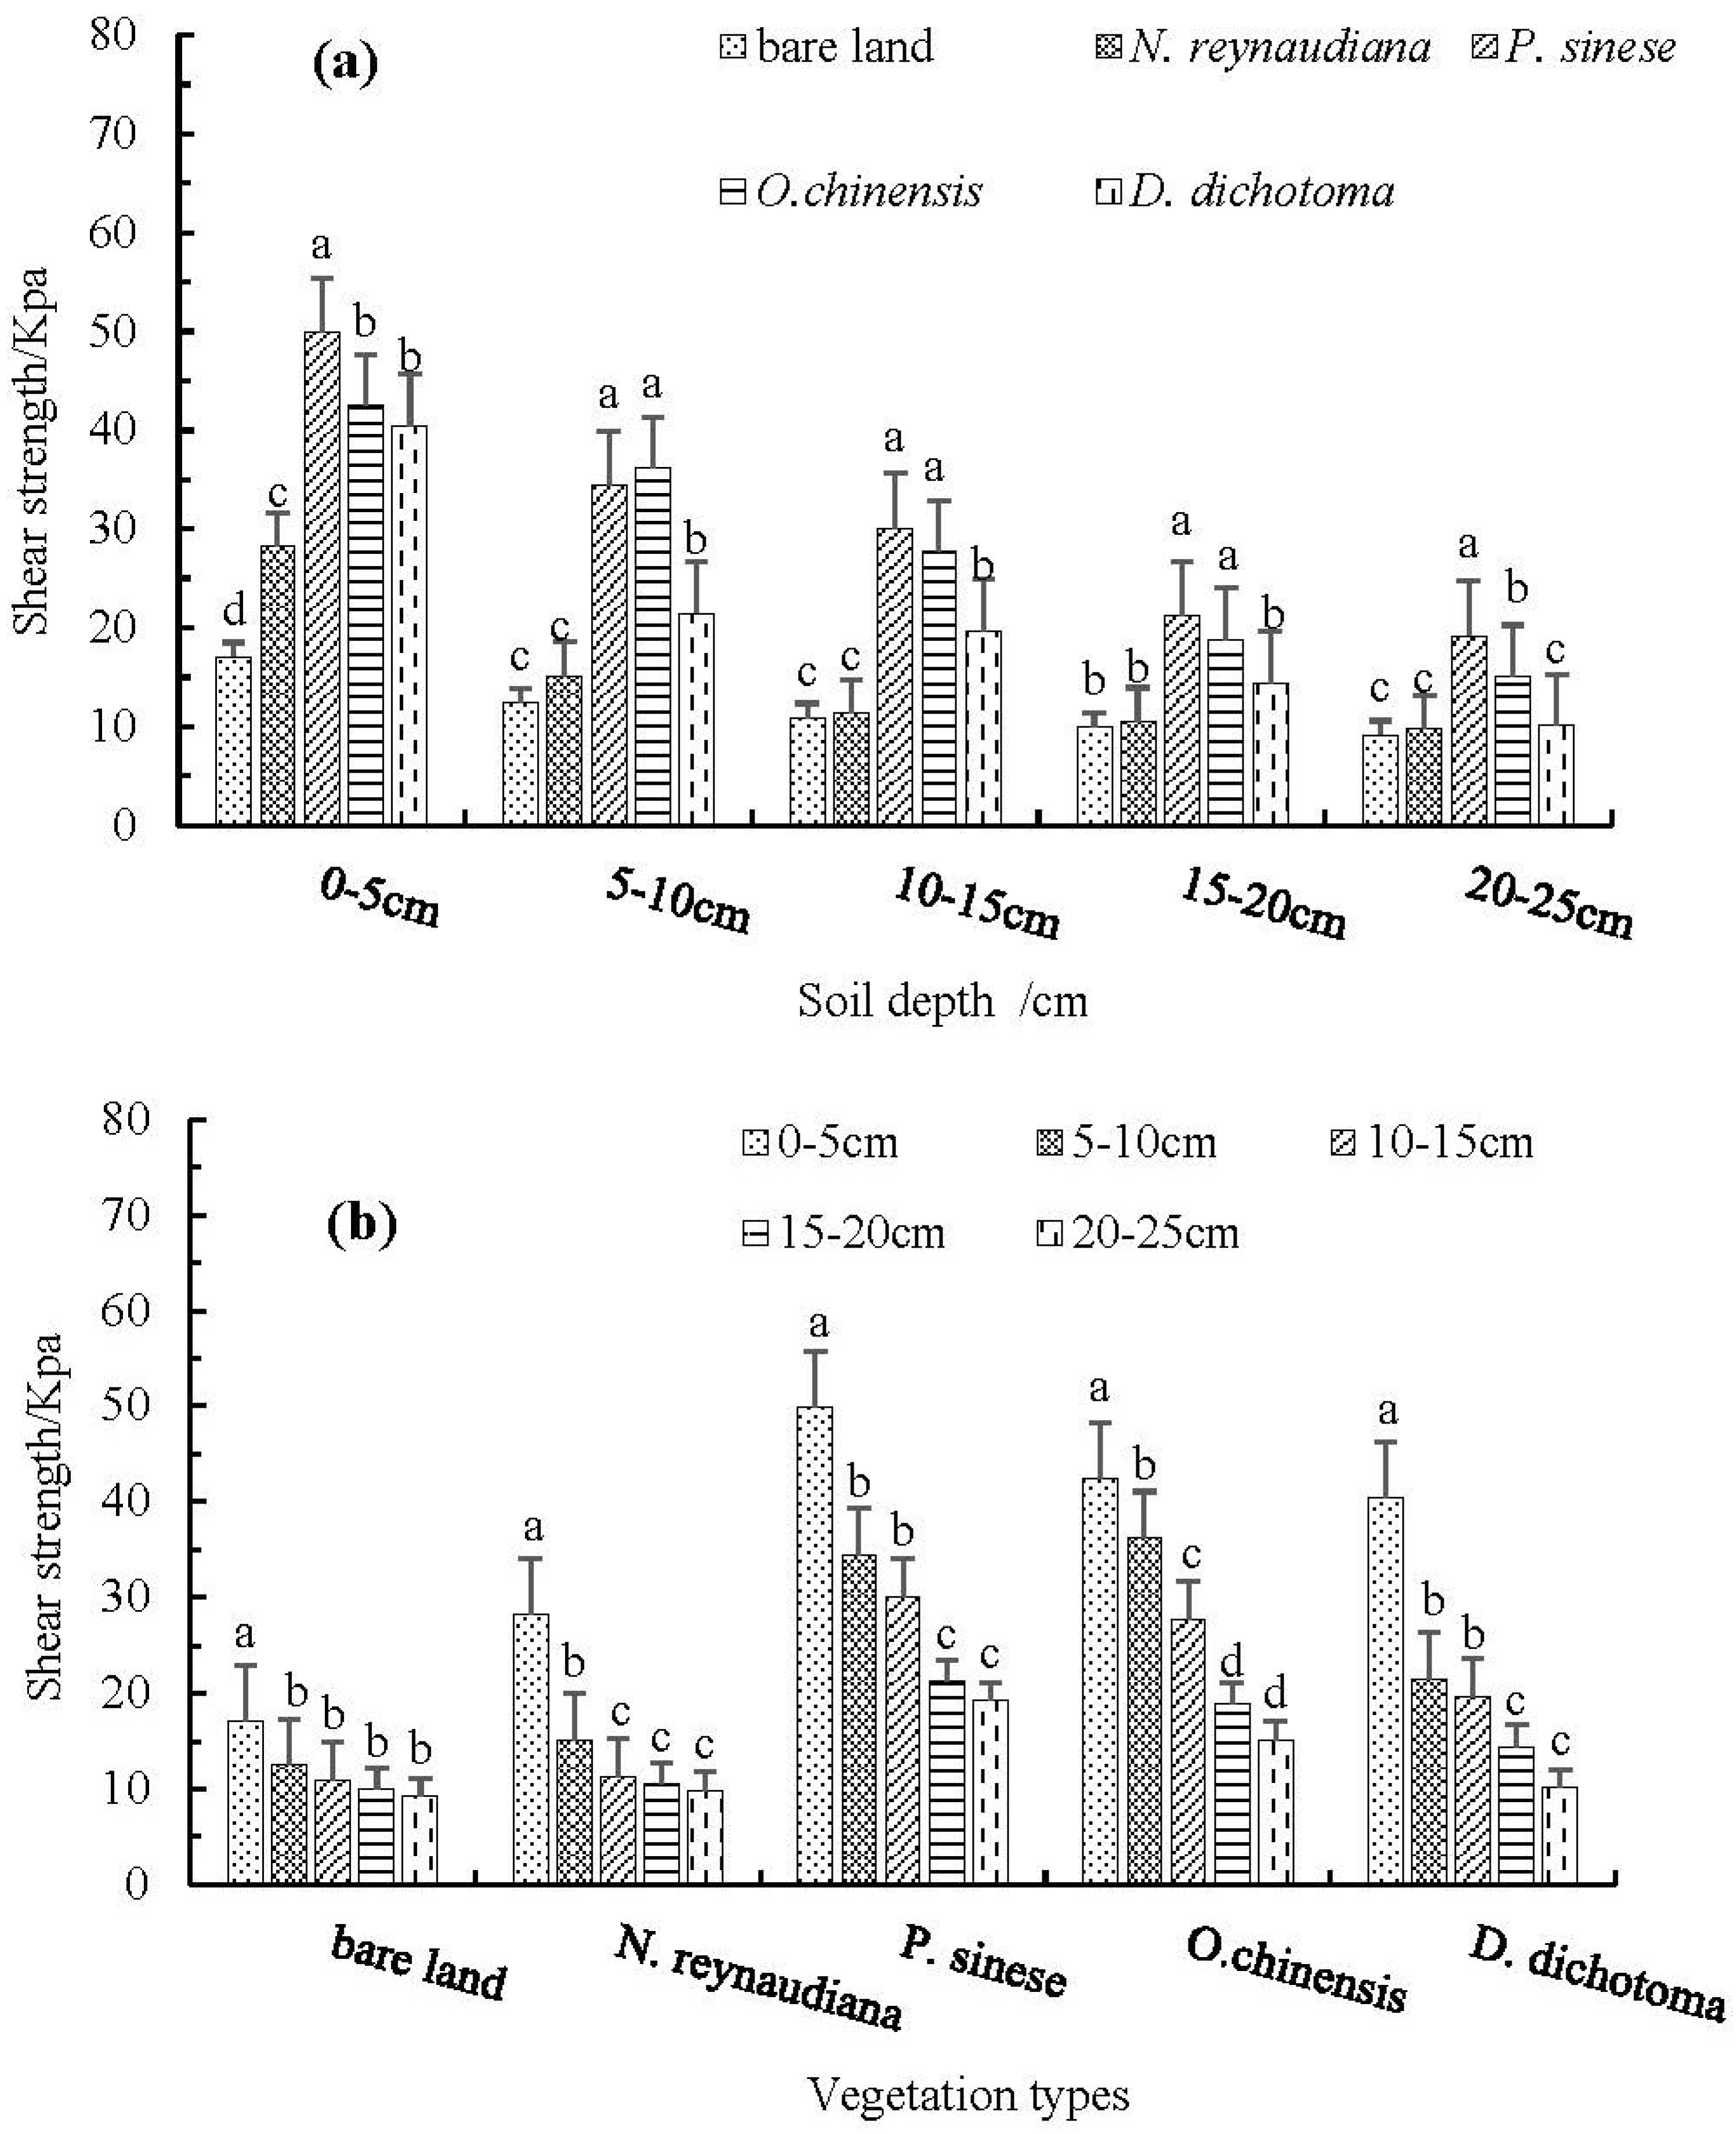
3.2. The Shear Strength of Root–Soil Complexes
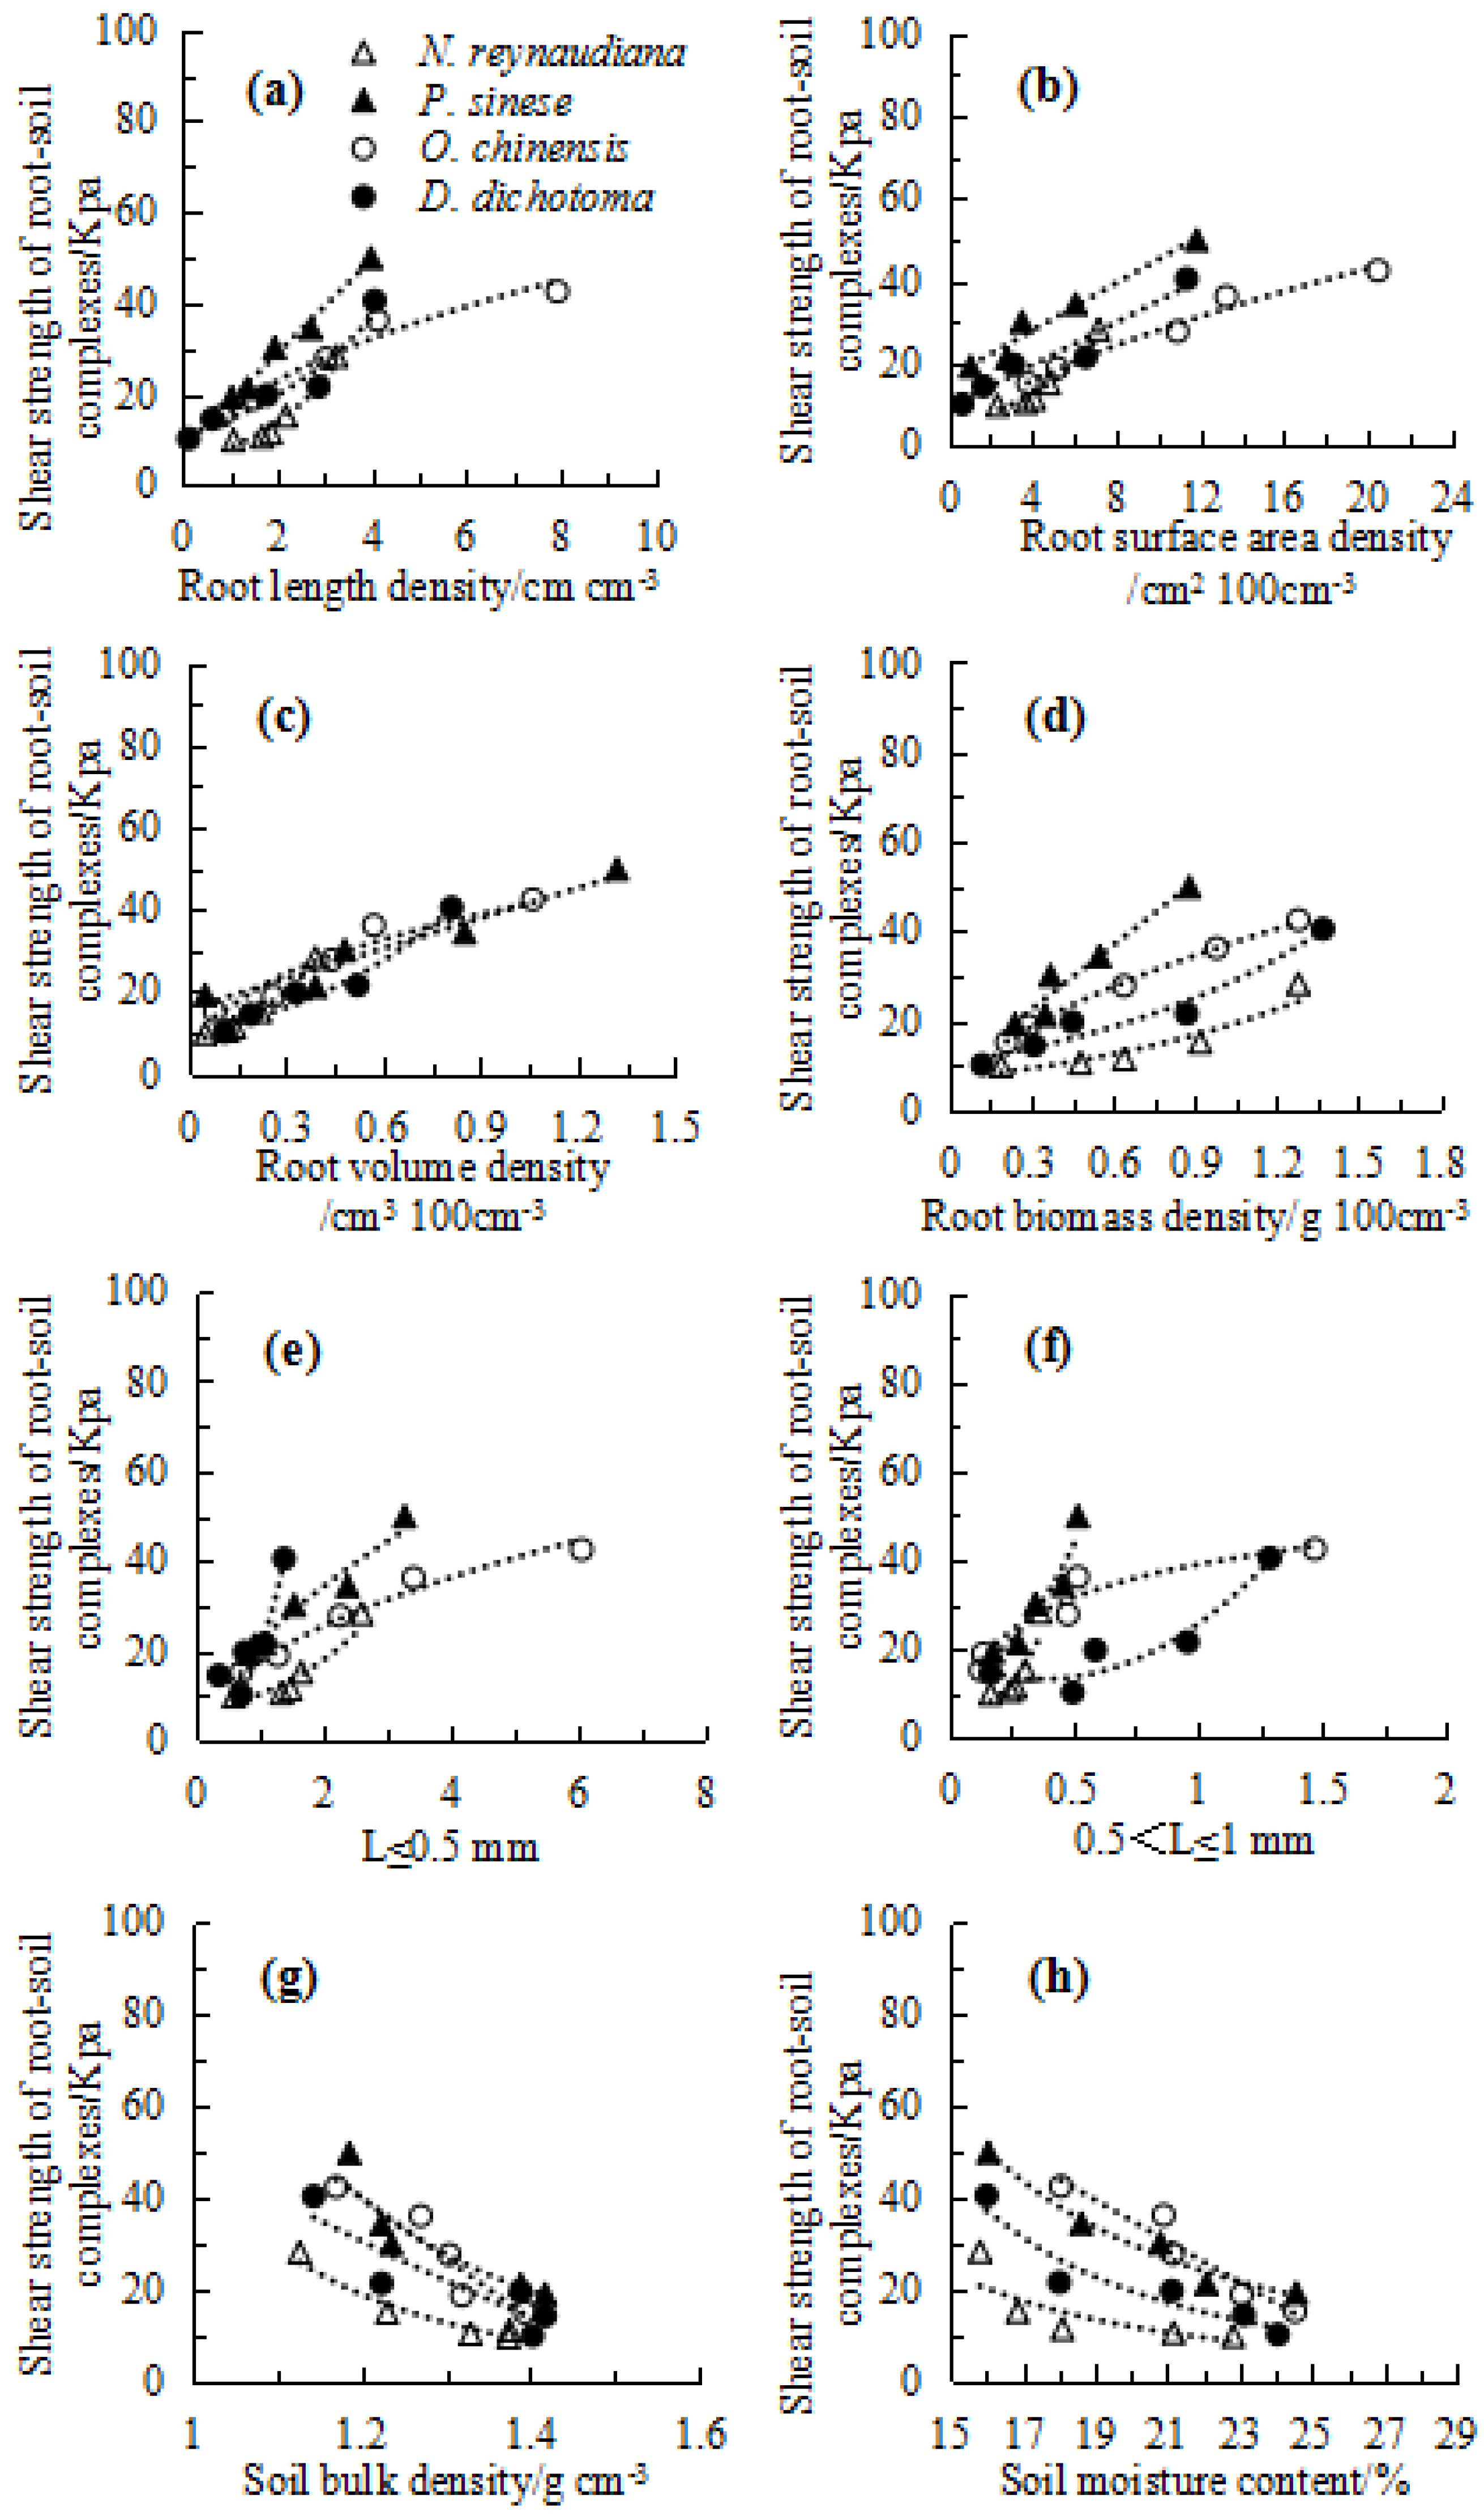
3.3. Relationship between Shear Strength and Soil and Root Properties
3.4. Correction of the WWM Model
4. Discussion
4.1. Effects of Four Herbaceous Plants on the Soil and Root Properties
4.2. Effects of Four Herbaceous Species on the Shear Strength of the Root–Soil Complexes
4.3. Correction Coefficient of the WWM Model by the Pocket Vane Tester
5. Conclusions
Author Contributions
Funding
Data Availability Statement
Conflicts of Interest
References
- Jiang, F.S.; Huang, Y.H.; Wang, M.K.; Lin, J.S.; Zhao, G.; Ge, H.L. Effects of Rainfall Intensity and Slope Gradient on Steep Colluvial Deposit Erosion in Southeast China. Soil Sci. Soc. Am. J. 2014, 78, 1741–1752. [Google Scholar] [CrossRef]
- Lin, J.S.; Huang, Y.H.; Wang, M.K.; Jiang, F.S.; Zhang, X.B.; Ge, H.L. Assessing the sources of sediment transported in gully systems using a fingerprinting approach: An example from South-east China. Catena 2015, 129, 9–17. [Google Scholar] [CrossRef]
- Zhang, L.T.; Sun, S.J.; Lin, M.Q.; Feng, K.J.; Zhang, Y.; Lin, J.S.; Ge, H.L.; Huang, Y.H.; Jiang, F.S. Study on soil-water characteristic curves in the profiles of collapsing walls of typical granite Benggang in southeast China. PeerJ 2022, 10, e13526. [Google Scholar] [CrossRef] [PubMed]
- Chen, J.L.; Zhou, M.; Lin, J.S.; Jiang, F.S.; Huang, B.F.; Xu, T.T.; Wang, M.K.; Ge, H.L.; Huang, Y.H. Comparison of soil physicochemical properties and mineralogical compositions between noncollapsible soils and collapsed gullies. Geoderma 2018, 317, 56–66. [Google Scholar] [CrossRef]
- Wei, Y.J.; Liu, Z.; Wu, X.L.; Zhang, Y.; Cui, T.T.; Cai, C.F.; Guo, Z.L.; Wang, J.G.; Cheng, D.B. Can Benggang be regarded as gully erosion? Catena 2021, 207, 105648. [Google Scholar] [CrossRef]
- Okengwo, O.N.; Okeke, O.C.; Okereke, C.N.; Paschal, A.C. Geological and geotech-nical studies of Gully Erosion at Ekwulobia, Oko and Nanka Towns, Southeastern Ni-geria. Electron. J. Geotech. Eng. 2015, 20, 113–122. [Google Scholar]
- Lin, J.H.; Huang, M.Y.; Zhang, L.T.; Chen, Y.; Shi, Y.Z.; Xu, Y.M.; Lin, J.S.; Huang, Y.H.; Jiang, F.S. Effect of root system of Dicranopteris dichotoma on soil shear strength of Benggang red soil layer. J. Soil Water Conserv. 2020, 34, 159–165, (In Chinese, with English abstract). [Google Scholar] [CrossRef]
- Ajedegba, J.O.; Choi, J.W.; Jones, K.D. Analytical modeling of coastal dune erosion at South Padre Island: A consideration of the effects of vegetation roots and shear strength. Ecol. Eng. 2019, 127, 187–194. [Google Scholar] [CrossRef]
- Huang, M.Y.; Sun, S.J.; Feng, K.J.; Lin, M.Q.; Shuai, F.; Zhang, Y.; Lin, J.S.; Ge, H.L.; Jiang, F.S.; Huang, Y.H. Effects of Neyraudia reynaudiana roots on the soil shear strength of collapsing wall in Benggang, southeast China. Catena 2022, 210, 105883. [Google Scholar] [CrossRef]
- Ji, J.N.; Kokutse, N.; Genet, M.; Fourcaud, T.; Zhang, Z.Q. Effect of spatial variation of tree root characteristics on slope stability. A case study on Black Locust (Robinia pseudoacacia) and Arborvitae (Platycladus orientalis) stands on the Loess Plateau, China. Catena 2012, 92, 139–154. [Google Scholar] [CrossRef]
- Leung, F.T.Y.; Yan, W.M.; Hau, B.C.H.; Thama, L.G. Root systems of native shrubs and trees in Hong Kong and their effects on enhancing slope stability. Catena 2015, 125, 102–110. [Google Scholar] [CrossRef]
- Mattia, C.; Bischetti, G.B.; Gentile, F. Biotechnical characteristics of root systems of typical Mediterranean species. Plant Soil 2005, 278, 23–32. [Google Scholar] [CrossRef]
- Abdi, E.; Majnouniana, B.; Genet, M.; Rahimi, H. Quantifying the effects of root reinforcement of Persian Ironwood (Parrotia persica) on slope stability; a case study: Hillslope of Hyrcanian forests, northern Iran. Ecol. Eng. 2010, 36, 1409–1416. [Google Scholar] [CrossRef]
- Andreoli, A.; Chiaradia, E.A.; Cislaghi, A.; Bischetti, G.B.; Comitia, F. Roots reinforcement by riparian trees in restored rivers. Geomorphology 2020, 370, 107389. [Google Scholar] [CrossRef]
- Karimi, Z.; Abdi, E.; Deljouei, A.; Cislaghi, A.; Shirvany, A.; Schwarz, M.; Halese, T.C. Vegetation-induced soil stabilization in coastal area: An example from a natural mangrove forest. Catena 2022, 216, 106410. [Google Scholar] [CrossRef]
- Mao, Z.; Saint-André, L.; Genet, M.; Mine, F.X.; Jourdan, C.; Rey, H.; Courbaud, B.; Stokes, A. Engineering ecological protection against landslides in diverse mountain forests: Choosing cohesion models. Ecol. Eng. 2012, 45, 55–69. [Google Scholar] [CrossRef]
- Hengchaovanich, D. VGT: A Bioengineering and Phytoremediation Option for the New Millennium. 2003. Available online: https://www.vetiver.org/PRVN_IVC2_35.PDF (accessed on 29 September 2022).
- Loades, K.W.; Bengough, A.G.; Bransby, M.F.; Hallett, P.D. Planting density influ-ence on fibrous root reinforcement of soils. Ecol. Eng. 2010, 36, 276–284. [Google Scholar] [CrossRef]
- Abubakar, M. Contribution of Tea Root Reinforcement to Soil Shear Strength on Slope Stability. J. Civ. Eng. Forum 2018, 4, 13. [Google Scholar] [CrossRef] [Green Version]
- Limon-Ortega, A.; Govaerts, B.; Sayre, K.D. Straw management, crop rotation, and nitrogen source effect on wheat grain yield and nitrogen use efficiency. Eur. J. Agron. 2008, 29, 21–28. [Google Scholar] [CrossRef]
- Operstein, V.; Frydman, S. The influence of vegetation on soil strength. Proc. ICE-Ground Improv. 2000, 4, 81–89. [Google Scholar] [CrossRef]
- Comino, E.; Druetta, A. The effect of Poaceae roots on the shear strength of soils in the Italian alpine environment. Soil Tillage Res. 2010, 106, 194–201. [Google Scholar] [CrossRef]
- Xu, T.; Liu, C.Y.; Hu, X.S.; Xu, Z.W.; Shen, Z.Y.; Yu, D.M. Mechanical effect of vegetation slope protection under load in loess area of Xining Basin. Trans. Chin. Soc. Agric. Eng. 2021, 37, 142–151. [Google Scholar] [CrossRef]
- Mokhammad, F.M. Shear strength of Apus bamboo root reinforced soil. Ecol. Eng. 2012, 41, 84–86. [Google Scholar] [CrossRef]
- Mahannopkul, K.; Jotisankasa, A. Influences of root concentration and suction on Chrysopogon zizanioides reinforcement of soil. Soils Found. 2019, 59, 500–516. [Google Scholar] [CrossRef]
- Wu, T.H.; Mckinnell III, W.P.; Swanston, D.N. Strength of tree roots and landslides on prince of Wales Island, Alaska. Can. Geotech. J. 1979, 16, 19–33. [Google Scholar] [CrossRef]
- Waldron, L.J. The shear resistance of root-permeated homogeneous and stratified soil. Soil Sci. Soc. Am. J. 1977, 41, 843–849. [Google Scholar] [CrossRef]
- Pollen, N.; Simon, A. Estimating the mechanical effects of riparian vegetation on stream bank stability using a fiber bundle model. Water Resour. Res. 2005, 41, 226–244. [Google Scholar] [CrossRef]
- Schwarz, M.; Giadrossich, F.; Cohen, D. Modeling root reinforcement using a root-failure Weibull survival function. Hydrol. Earth Syst. Sci. 2013, 17, 4367–4377. [Google Scholar] [CrossRef] [Green Version]
- Baets, S.D.; Poesen, J.; Reubens, B.; Wemans, K.; Baerdemaeker, J.D.; Muys, B. Root tensile strength and root distribution of typical Mediterranean plant species and their contribution to soil shear strength. Plant Soil 2008, 305, 207–226. [Google Scholar] [CrossRef]
- Zhang, G.H.; Tang, M.K.; Zhang, X.C. Temporal variation in soil detachment under different land uses in the Loess Plateau of China. Earth Surf. Processes Landf. 2009, 34, 1302–1309. [Google Scholar] [CrossRef]
- Wang, B.; Zhang, G.H.; Shi, Y.Y.; Zhang, X.C. Soil detachment by overland flow under different vegetation restoration models in the Loess Plateau of China. Catena 2013, 116, 51–59. [Google Scholar] [CrossRef]
- Yu, Y.C.; Zhang, G.H.; Geng, R.; Sun, L. Temporal variation in soil detachment capacity by overland flow under four typical crops in the Loess Plateau of China. Biosyst. Eng. 2014, 122, 139–148. [Google Scholar] [CrossRef]
- Wang, B.; Zhang, G.H.; Yang, Y.F.; Li, P.P.; Liu, J.X. The effects of varied soil properties induced by natural grassland succession on the process of soil detachment. Catena 2018, 166, 192–199. [Google Scholar] [CrossRef]
- Yang, J.H.; Wang, C.L.; Dai, H.L. Soil Agrochemical Analysis and Environmental Monitoring; China Land Press: Beijing, China, 2008; (In Chinese, with English abstract). [Google Scholar]
- Jackson, M.L. Soil Chemical Analysis, 2nd ed.; Jackson, M.L., Madison, W.I., Eds.; Prentice Hall, Inc.: Englewood Cliffs, NJ, USA, 1979. [Google Scholar]
- Jiang, F.S.; He, K.W.; Lin, J.H.; Li, H.; Zhan, Z.Z.; Lin, J.S.; Ge, H.L.; Wang, M.K.; Huang, Y.H. A comparison of the effectiveness of the roots of two grass species in re-ducing soil erosion on alluvial fans in south-east China. Hydrol. Process. 2020, 34, 96–110. [Google Scholar] [CrossRef]
- Soest, P.J.V. Using of detergents in the analysis of fibrous feeds. A rapid method for the determination of fibre and lignin. J. Assoc. Off. Anal. Chem. 1963, 49, 546–551. [Google Scholar]
- Yuan, Z.L.; Xiong, S.P.; Li, C.M.; Ma, X.M. Effects of chronic stress of cadmium and lead on anatomical structure of tobacco roots. Agric. Sci. China 2011, 10, 1941–1948. [Google Scholar] [CrossRef]
- Rossi, R.; Picuno, P.; Fagnano, M.; Amato, M. Soil reinforcement potential of culti-vated cardoon (Cynara cardunculus L.): First data of root tensile strength and density. Catena 2022, 211, 106016. [Google Scholar] [CrossRef]
- Wang, D.H. Multivariate Statistical Analysis and SPSS Application, 2nd ed.; East China University of Science and Technology Press: Shanghai, China, 2018; (In Chinese, with English abstract). [Google Scholar]
- Wu, T.H.; Beal, P.E.; Lan, C. In-situ shear test of soil-root systems. Geotech. Eng. 1988, 114, 1376–1394. [Google Scholar] [CrossRef]
- Han, G.Z.; Zhang, G.L.; Gong, Z.T.; Wang, G.F. Pedotransfer functions for estimating soil bulk density in China. Soil Sci. 2012, 177, 158–164. [Google Scholar] [CrossRef]
- Li, X.R.; Ma, F.Y.; Xiao, H.L.; Wang, X.P.; Kim, K.C. Long-term effects of revegeta-tion on soil water content of sand dunes in arid region of Northern China. J. Arid. Environ. 2004, 57, 1–16. [Google Scholar] [CrossRef]
- Na, R.S.; Du, H.B.; Na, L.; Shan, Y.; He, H.S.; Wu, Z.F.; Zong, S.W.; Yang, Y.; Huang, L.R. Spatiotemporal changes in the Aeolian desertification of Hulunbuir Grassland and its driving factors in China during 1980-2015. Catena 2019, 182, 104123. [Google Scholar] [CrossRef]
- Zhao, Y.L.; Wang, Y.Q.; Wang, L.; Fu, Z.H.; Zhang, X.Y.; Cui, B.L. Soil-water stor-age to a depth of 5 m along a 500-km transect on the Chinese Loess Plateau. Catena 2017, 150, 71–78. [Google Scholar] [CrossRef]
- Zhang, J.Y.; Duan, L.M.; Liu, T.X.; Chen, Z.X.; Wang, Y.X.; Li, M.Y.; Zhou, Y.J. Experimental analysis of soil moisture response to rainfall in a typical grassland hillslope under different vegetation treatments. Environ. Res. 2022, 213, 113608. [Google Scholar] [CrossRef] [PubMed]
- Li, T.C.; Shao, M.A.; Jia, Y.H. Application of X-ray tomography to quantify macropore characteristics of loess soil under two perennial plants. Eur. J. Soil Sci. 2016, 67, 266–275. [Google Scholar] [CrossRef]
- Hendrick, R.L.; Pregitzer, K.S. Temporal and Depth-Related Patterns of Fine Root Dynamics in Northern Hardwood Forests. J. Ecol. 1996, 84, 167–176. [Google Scholar] [CrossRef]
- Bordron, B.; Robin, A.; Oliveira, I.R.; Guillemot, J.; Laclau, J.P.; Jourdan, C.; Nouvellon, Y.; Abreu-Junior, C.H.; Trivelin, P.C.O.; Gonçalves, J.L.M.; et al. Fertilization increases the functional specialization of fine roots in deep soil layers for young Eucalyptus grandis trees. For. Ecol. Manag. 2019, 431, 6–16. [Google Scholar] [CrossRef] [Green Version]
- Claus, A.; George, E. Effect of stand age on fine-root biomass and biomass distribu-tion in three European forest chronosequences. Can. J. For. Res. 2005, 35, 1617–1625. [Google Scholar] [CrossRef]
- Page, E.R.; Gerwitz, A. Mathematical models, based on diffusion equations, to de-scribe root systems of isolated plants, row crops, and swards. Plant Soil 1974, 41, 243–254. [Google Scholar] [CrossRef]
- Yuan, H.X.; Gao, Z.L.; Zhang, X.; Du, J.; Zhang, X.J. Root distribution and tensile resistance characteristics of slope protection plants. South North Water Divers. Water Sci. Technol. 2016, 14, 117–123, (In Chinese, with English abstract). [Google Scholar] [CrossRef]
- Bischetti, G.B.; Chiaradia, E.A.; Simonato, T.; Speziali, B.; Vitali, B.; Vullo, P.; Zocco, A. Root Strength and Root Area Ratio of Forest Species in Lombardy (Northern Italy). Plant Soil 2005, 278, 11–22. [Google Scholar] [CrossRef]
- Hathaway, R.L.; Penny, D. Root Strength in Some Populus and Salix Clones. N. Z. J. Bot. 1975, 13, 333–344. [Google Scholar] [CrossRef] [Green Version]
- Zhang, C.B.; Chen, L.H.; Jiang, J. Why fine tree roots are stronger than thicker roots: The role of cellulose and lignin in relation to slope stability. Geomorphology 2014, 206, 196–202. [Google Scholar] [CrossRef]
- Zhang, C.B.; Chen, L.H.; Liu, Y.P.; Ji, X.D.; Liu, X.P. Triaxial compression test of soil-root composites to evaluate influence of roots on soil shear strength. Ecol. Eng. 2010, 36, 19–26. [Google Scholar] [CrossRef]
- Prasad, R. A linear root water uptake model. J. Hydrol. 1988, 99, 297–306. [Google Scholar] [CrossRef]
- Hu, X.S.; Brierley, G.; Zhu, H.L.; Li, G.R.; Fu, J.T.; Mao, X.Q.; Yu, Q.Q.; Qiao, N. An exploratory analysis of vegetation strategies to reduce shallow landslide activity on loess hillslopes, Northeast Qinghai-Tibet Plateau, China. J. Mt. Sci. 2013, 10, 668–686. [Google Scholar] [CrossRef] [Green Version]
- Osman, N.; Barakbah, S.S. Parameters to predict slope stability—Soil water and root profiles. Ecol. Eng. 2006, 28, 90–95. [Google Scholar] [CrossRef]
- Zhuang, L.Y.; Yang, W.Q.; Wu, F.Z.; Tan, B.; Zhang, L.; Yang, K.J.; He, R.Y.; Li, Z.J.; Xu, Z.F. Diameter-related variations in root decomposition of three common sub-alpine tree species in southwestern China. Geoderma 2018, 311, 1–8. [Google Scholar] [CrossRef]
- Miller, R.M.; Jastrow, J.D. Hierarchy of root and mycorrhizal fungal interactions with soil aggregation. Soil Biol. Biochem. 1990, 22, 579–584. [Google Scholar] [CrossRef]
- Genet, M.; Stokes, A.; Salin, F.; Mickovski, S.B.; Fourcaud, T.; Dumail, J.F.; Beek, R.V. The influence of cellulose content on tensile strength in tree roots. Plant Soil 2005, 278, 1–9. [Google Scholar] [CrossRef]
- Wei, J.; Shi, B.L.; Li, J.L.; Li, S.S.; He, X.B. Shear strength of purple soil bunds under different soil water contents and dry densities: A case study in the Three Gorges Res-ervoir Area, China. Catena 2018, 166, 124–133. [Google Scholar] [CrossRef]
- Ye, C.; Guo, Z.L.; Cai, C.F.; Wang, J.G.; Deng, J. Effect of water content, bulk den-sity, and aggregate size on mechanical characteristics of Aquults soil blocks and ag-gregates from subtropical China. J. Soils Sediments 2017, 17, 210–219. [Google Scholar] [CrossRef]
- Fan, C.C.; Su, C.F. Role of roots in the shear strength of root-reinforced soils with high moisture content. Ecol. Eng. 2008, 33, 157–166. [Google Scholar] [CrossRef]
- Bischetti, G.B.; Chiaradia, E.A.; Epis, T.; Morlotti, E. Root cohesion of forest species in the Italian Alps. Plant Soil 2009, 324, 71–89. [Google Scholar] [CrossRef]
- Ghestem, M.; Veylon, G.; Bernard, A.; Vanel, Q.; Stokes, A. Influence of plant root system morphology and architectural traits on soil shear resistance. Plant Soil 2014, 377, 43–61. [Google Scholar] [CrossRef]
- Schwarz, M.; Preti, F.; Giadrossich, F.; Lehmann, P.; Or, D. Quantifying the role of vegetation in slope stability: A case study in Tuscany (Italy). Ecol. Eng. 2010, 36, 285–291. [Google Scholar] [CrossRef]
- Fan, C.C.; Su, C.F. Effect of soil moisture content on the deformation behaviour of root-reinforced soils subjected to shear. Plant Soil 2009, 324, 57–69. [Google Scholar] [CrossRef]
- Wu, T.H. Root reinforcement of soil: Review of analytical models, test results, and ap-plications to design. Can. Geotech. J. 2013, 50, 259–274. [Google Scholar] [CrossRef]
- Schwarz, M.; Cohen, D.; Or, D. Root-soil mechanical interactions during pullout and failure of root bundles. J. Geophys. Res. 2010, 115, F04035. [Google Scholar] [CrossRef] [Green Version]
- Zhu, J.Q.; Su, B.R.; Wang, Y.Q.; Wang, Y.J.; Li, Y.X. Changes of soil fixation func-tion of thorns root system with soil moisture content. For. Sci. 2020, 56, 202–208, (In Chinese, with English abstract). [Google Scholar] [CrossRef]


| Vegetation Types | Average Plant Height /cm | Average Crown /cm | Average Depth of the Root /cm | Average Vegetation Coverage /% |
|---|---|---|---|---|
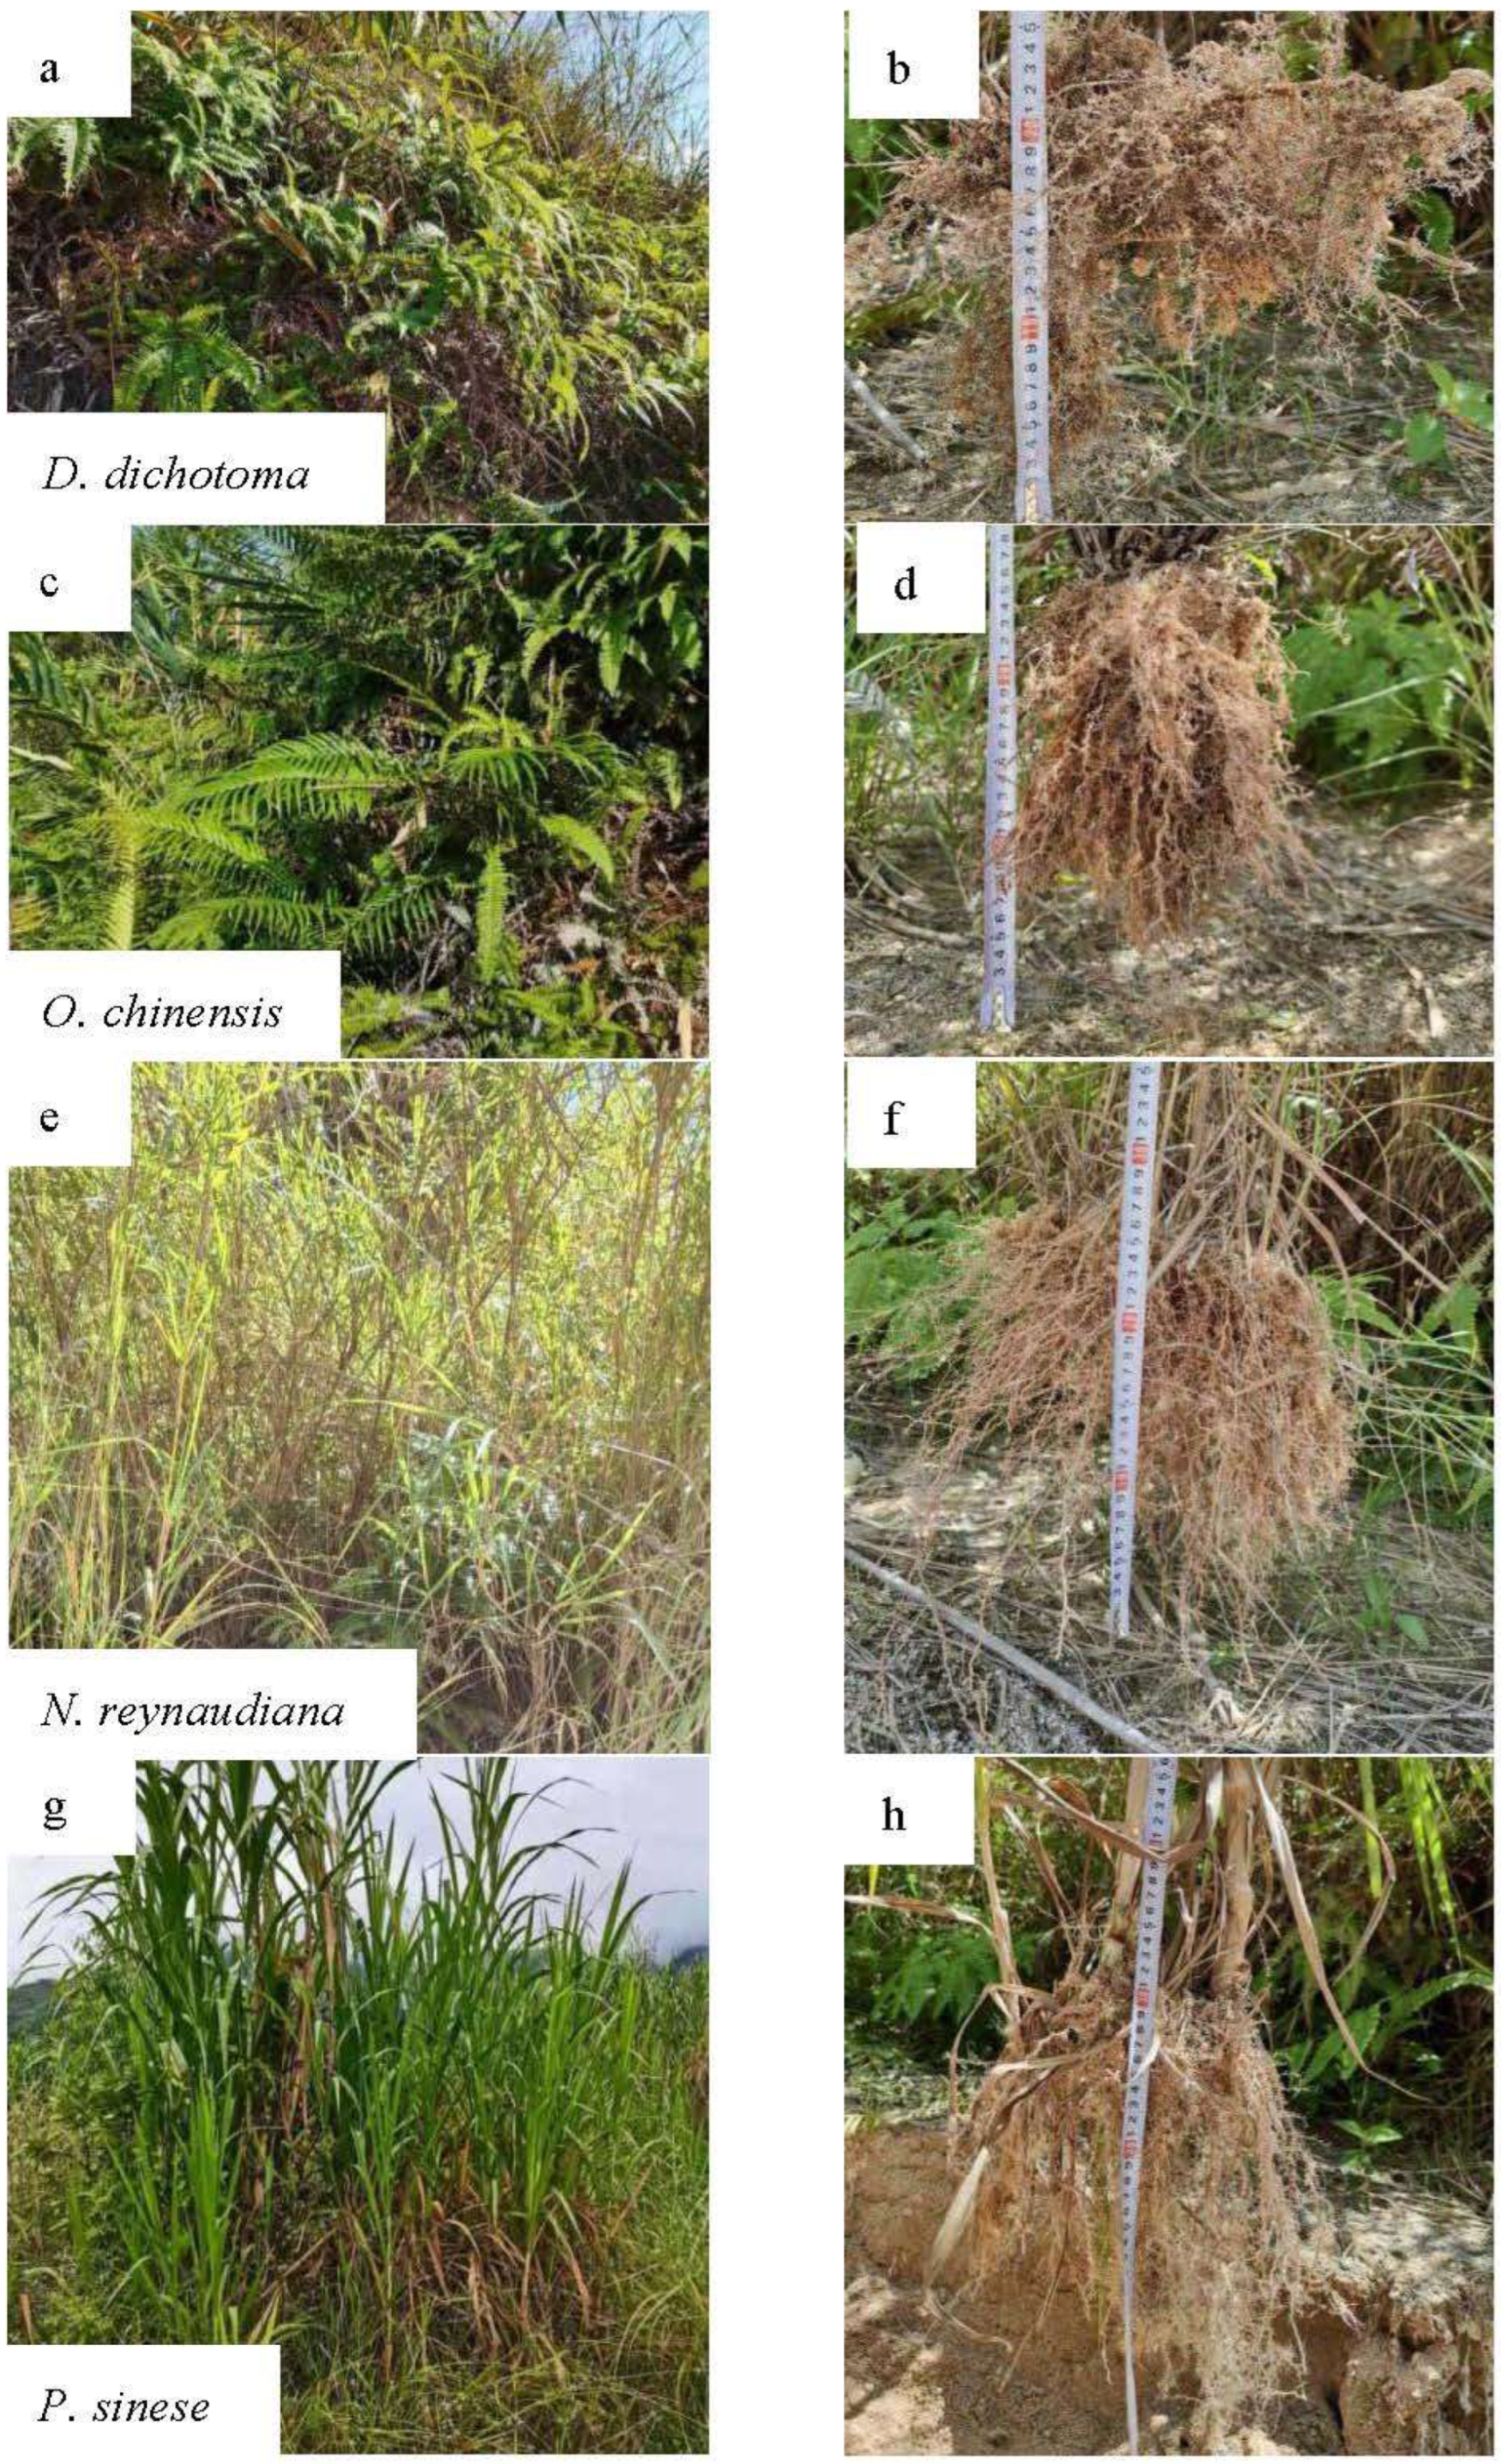
| Dicranopteris dichotoma | 28 ± 9 | 17 ± 5 | 16 ± 3 | 95 |
| Odontosoria chinensis | 82 ± 21 | 72 ± 18 | 25 ± 2 | 98 |
| Neyraudia reynaudiana | 260 ± 14 | 51 ± 2 | 26 ± 2 | 90 |
| Pennisetum sinese | 233 ± 29 | 61 ± 7 | 24 ± 2 | 90 |
| Experiment Land | pH | Soil Organic Matter (g kg−1) | Soil Bulk Density (g cm−3) | Total Porosity (%) | Particle Size Distribution/% | |||
|---|---|---|---|---|---|---|---|---|
| Gravel >2 mm | Sand 2–0.05 mm | Silt 0.05–0.002 mm | Clay <0.002 mm | |||||
| Bare land | 4.10 ± 0.32 | 3.05 ± 0.32 | 1.43 ± 0.20 | 45.87 ± 9.13 | 17.54 ± 1.78 | 49.92 ± 7.43 | 26.65 ± 4.74 | 5.89 ± 0.60 |
| D. dichotoma | 4.26 ± 0.25 | 4.28 ± 0.54 | 1.32 ± 0.20 | 50.37 ± 9.79 | 15.65 ± 1.98 | 49.40 ± 5.93 | 30.29 ± 3.11 | 4.66 ± 0.38 |
| O. chinensis | 4.64 ± 0.27 | 4.45 ± 0.31 | 1.29 ± 0.19 | 51.27 ± 9.67 | 14.15 ± 2.14 | 48.25 ± 7.17 | 32.68 ± 5.12 | 4.92 ± 0.89 |
| N. reynaudiana | 4.31 ± 0.21 | 3.85 ± 0.42 | 1.29 ± 0.18 | 51.43 ± 9.25 | 16.96 ± 2.33 | 42.30 ± 6.74 | 35.55 ± 4.52 | 5.19 ± 0.56 |
| P. sinese | 4.36 ± 0.18 | 5.02 ± 0.58 | 1.29 ± 0.19 | 51.31 ± 9.61 | 18.23 ± 2.20 | 46.56 ± 8.04 | 31.09 ± 5.39 | 4.12 ± 0.66 |
| Vegetation Types | Chemical Composition | Microstructure Characteristics | |||||||
|---|---|---|---|---|---|---|---|---|---|
| Lignin (%) | Cellulose (%) | Hemicellulose (%) | Holocellulose (%) | Wood Fiber Ratio | Average Diameter (mm) | Epidermal Thickness (μm) | Cortical Thickness (μm) | Pericycle Thickness (μm) | |
| D. dichotoma | 25.1 | 39.9 | 8.9 | 48.8 | 0.63 | 0.49 | 31.26 | 146.67 | 4.87 |
| O. chinensis | 20.7 | 36.8 | 6.5 | 43.3 | 0.56 | 0.75 | 34.09 | 93.75 | 4.33 |
| N. reynaudiana | 20.7 | 39.9 | 14.8 | 54.7 | 0.52 | 0.51 | 6.23 | 62.83 | 7.58 |
| P. sinese | 16.3 | 37.7 | 9.0 | 46.6 | 0.43 | 0.62 | 8.64 | 80.26 | 8.68 |
| Vegetation Types | Soil Depth (cm) | Root Length Density (cm cm−3) | Root Surface Density (cm2 100 cm−3) | Root Volume Density (cm³ 100 cm−3) | Root Biomass Density (g 100 cm−3) |
|---|---|---|---|---|---|
| N. reynaudiana | 0–5 cm | 3.25 ± 0.41 a | 7.17 ± 1.49 a | 0.39 ± 0.19 a | 1.28 ± 0.19 a |
| 5–10 cm | 2.18 ± 0.21 b | 4.80 ± 1.68 b | 0.22 ± 0.15 b | 0.92 ± 0.29 b | |
| 10–15 cm | 1.86 ± 0.46 c | 4.10 ± 3.29 c | 0.14 ± 0.11 c | 0.64 ± 0.13 c | |
| 15–20 cm | 1.68 ± 0.68 d | 3.71 ± 2.77 d | 0.12 ± 0.06 d | 0.48 ± 0.22 d | |
| 20–25 cm | 1.07 ± 0.46 e | 2.36 ± 1.41 e | 0.05 ± 0.06 e | 0.19 ± 0.06 e | |
| Average | 2.01 | 4.43 | 0.18 | 0.70 | |
| P. sinese | 0–5 cm | 3.98 ± 0.23 a | 11.85 ± 0.32 a | 1.32 ± 0.03 a | 0.88 ± 0.62 a |
| 5–10 cm | 2.71 ± 0.68 b | 6.08 ± 0.59 b | 0.85 ± 0.25 b | 0.55 ± 0.29 b | |
| 10–15 cm | 1.94 ± 0.59 c | 3.52 ± 1.56 c | 0.48 ± 0.15 c | 0.37 ± 0.15 c | |
| 15–20 cm | 1.36 ± 0.19 d | 2.80 ± 0.04 d | 0.39 ± 0.04 d | 0.35 ± 0.22 d | |
| 20–25 cm | 1.03 ± 0.29 e | 1.07 ± 0.46 e | 0.05 ± 0.05 e | 0.24 ± 0.21 e | |
| Average | 2.20 | 5.06 | 0.62 | 0.48 | |
| O. chinensis | 0–5 cm | 7.93 ± 4.33 a | 20.48 ± 9.45 a | 1.06 ± 0.15 a | 1.28 ± 0.26 a |
| 5–10 cm | 4.12 ± 0.20 b | 13.26 ± 2.71 b | 0.57 ± 0.09 b | 0.98 ± 0.23 b | |
| 10–15 cm | 3.03 ± 1.01 c | 10.93 ± 1.56 c | 0.44 ± 0.08 c | 0.64 ± 0.24 c | |
| 15–20 cm | 1.50 ± 0.28 d | 5.21 ± 2.54 d | 0.26 ± 0.08 d | 0.29 ± 0.22 d | |
| 20–25 cm | 0.83 ± 0.16 e | 3.81 ± 2.33 e | 0.08 ± 0.02 e | 0.21 ± 0.08 e | |
| Average | 3.48 | 10.74 | 0.48 | 0.68 | |
| D. dichotoma | 0–5 cm | 4.06 ± 1.17 a | 11.37 ± 3.58 a | 0.81 ± 0.38 a | 1.37 ± 1.05 a |
| 5–10 cm | 2.87 ± 0.87 b | 6.56 ± 3.11 b | 0.52 ± 0.35 b | 0.87 ± 0.53 b | |
| 10–15 cm | 1.78 ± 0.53 c | 3.12 ± 1.37 c | 0.33 ± 0.21 c | 0.45 ± 0.27 c | |
| 15–20 cm | 0.62 ± 0.47 d | 1.69 ± 1.03 d | 0.19 ± 0.13 d | 0.31 ± 0.14 d | |
| 20–25 cm | 0.12 ± 0.05 e | 0.68 ± 0.11 e | 0.11 ± 0.04 d | 0.12 ± 0.05 e | |
| Average | 1.89 | 4.68 | 0.39 | 0.62 |
| Vegetation Types | Root Length Density | Root Surface Area Density | Root Volume Density | Root Biomass Density |
|---|---|---|---|---|
| N. reynaudiana | Rld = −0.91log(h) + 4.09 R2 = 0.97 ** | Rsad = −2log(h) + 9.01 R2 = 0.97 ** | Rvd = −0.15log(h) + 0.52 R2 = 0.99 ** | Rbd = −0.05h + 1.36 R2 = 0.99 ** |
| P. sinese | Rld = 4.59e−0.07h R2 = 0.99 ** | Rsad = −4.81log(h) + 16.07 R2 = 0.99 ** | Rvd = −0.55log(h) + 1.87 R2 = 0.97 ** | Rbd = −0.29log(h) + 1.13 R2 = 0.99 ** |
| O. chinensis | Rld = −3.21log(h) + 10.82 R2 = 0.99 ** | Rsad = −7.57log(h) + 28.05 R2 = 0.96 ** | Rvd = −0.43log(h) + 1.45 R2 = 0.99 ** | Rbd = −0.06h + 1.39 R2 = 0.97 ** |
| D. dichotoma | Rld = −0.20h + 4.42 R2 = 0.98 ** | Rsad = −4.99log(h) + 16.09 R2 = 0.99 ** | Rvd = 1.09e−0.10h R2 = 0.99 ** | Rbd = −0.57log(h) + 1.93 R2 = 0.99 ** |
| Vegetation Types | Average Diameter (mm) | Average Tensile Strength (MPa) |
|---|---|---|
| D. dichotoma | 0.49 | 18.42 ± 9.63 c |
| N. reynaudiana | 0.75 | 61.35 ± 31.35 a |
| O. chinensis | 0.51 | 19.65 ± 10.30 c |
| P. sinese | 0.62 | 56.52 ± 19.11 b |
| Vegetation Types | Bare Land | N. reynaudiana | P. sinese | O. chinensis | D. dichotoma |
|---|---|---|---|---|---|
| Equation | SS = 22.07h−0.28 R2 = 0.99 ** | SS = 42.61h−0.49 R2 = 0.98 ** | SS = −14.01log(h) + 62.99 R2 = 0.99 ** | SS = −1.44h + 46.08 R2 = 0.99 ** | SS = 70.97h−0.58 R2 = 0.97 ** |
| Indicators | Shear Strength | Root Length Density | Root Surface Density | Root Volume Density | Root Biomass Density | L ≤ 0.5 mm | 0.5 < L ≤ 1 mm | 1 < L ≤ 1.5 mm | L > 1.5 mm | Tensile Strength | Bulk Density | Moisture Content |
|---|---|---|---|---|---|---|---|---|---|---|---|---|
| Shear strength | 1 | |||||||||||
| Root length density | 0.80 ** | 1 | ||||||||||
| Root surface density | 0.80 ** | 0.96 ** | 1 | |||||||||
| Root volume density | 0.94 ** | 0.79 ** | 0.78 ** | 1 | ||||||||
| Root biomass density | 0.67 ** | 0.83 ** | 0.78 ** | 0.64 ** | 1 | |||||||
| L ≤ 0.5 mm | 0.74 ** | 0.93 ** | 0.91 ** | 0.73 ** | 0.68 ** | 1 | ||||||
| 0.5 < L ≤ 1 mm | 0.61 ** | 0.80 ** | 0.74 ** | 0.66 ** | 0.71 ** | 0.58 ** | 1 | |||||
| 1 < L ≤ 1.5 mm | 0.42 | 0.47 * | 0.43 | 0.42 | 0.67 ** | 0.12 | 0.78 ** | 1 | ||||
| L > 1.5 mm | 0.37 | 0.37 | 0.33 | 0.38 | 0.65 ** | 0.2 | 0.68 ** | 0.97 ** | 1 | |||
| Tensile strength | −0.10 | −0.15 | −0.29 | −0.07 | −0.05 | −0.04 | −0.43 | −0.38 | −0.27 | 1 | ||
| Bulk density | −0.75 ** | −0.76 ** | −0.70 ** | −0.73 ** | −0.86 ** | −0.65 ** | −0.62 ** | −0.57 ** | −0.53 * | −0.08 | 1 | |
| Moisture content | −0.59 ** | −0.65 ** | −0.56 * | −0.65 ** | −0.87 ** | −0.52 * | −0.54 * | −0.56 ** | −0.61 ** | −0.26 | 0.85 ** | 1 |
| Iindicators | Vegetation Types | Dominant Factor Equation | R2 | Indicators | Vegetation Types | Dominant Factor Equation | R2 |
|---|---|---|---|---|---|---|---|
| Root length density /cm cm−3 | N. reynaudiana | SS = 4.84e0.52Rld | 0.93 ** | L ≤ 0.5 mm | N. reynaudiana | SS = 5.87e0.56L0.5 | 0.86 * |
| P. sinese | SS = 10.33Rld + 8.18 | 0.99 ** | P. sinese | SS = 22.08L0.50.63 | 0.97 ** | ||
| O. chinensis | SS = 16.34Rld0.49 | 0.98 ** | O. chinensis | SS = 17.84L0.50.51 | 0.98 ** | ||
| D. dichotoma | SS = 10.62e0.31Rld | 0.94 ** | D. dichotoma | SS = 25.35L0.5−0.35 | 0.72 | ||
| Root surface area density/cm2 100 cm−3 | N. reynaudiana | SS = 4.84e0.24Rsad | 0.93 ** | 0.5 < L ≤ 1 mm | N. reynaudiana | SS = 3.27e5.25L0.5–1 | 0.80 * |
| P. sinese | SS = 2.87Rsad + 16.45 | 0.96 ** | P. sinese | SS = 11.01e2.72L0.5−1 | 0.93 ** | ||
| O. chinensis | SS = 6.65Rsad0.62 | 0.98 ** | O. chinensis | SS = 10.91ln(L0.5–1) + 39.01 | 0.94 ** | ||
| D. dichotoma | SS = 2.60Rsad + 9.09 | 0.94 ** | D. dichotoma | SS = 23.26L0.5–1 + 4.92 | 0.75 | ||
| Root volume density/cm3 100 cm−3 | N. reynaudiana | SS = 7.53e3.29Rvd | 0.98 ** | Soil bulk density/g cm−3 | N. reynaudiana | SS = 46.60Sbd−4.88 | 0.93 ** |
| P. sinese | SS = 24.55Rvd + 15.78 | 0.94 ** | P. sinese | SS = 91.48Sbd−4.54 | 0.91 * | ||
| O. chinensis | SS = 40.69Rvd0.43 | 0.92 * | O. chinensis | SS = −131.94Sbd + 198.46 | 0.88 * | ||
| D. dichotoma | SS = 9.46e1.79Rvd | 0.95 ** | D. dichotoma | SS = −107.4ln(Sbd) + 50.29 | 0.80 * | ||
| Root biomass density/g·100 cm−3 | N. reynaudiana | SS = 6.93e0.98Rbd | 0.89 * | Soil moisture content/% | N. reynaudiana | SS = 14,644Smc−2.38 | 0.71 |
| P. sinese | SS = 47.66Rbd + 8.17 | 0.95 ** | P. sinese | SS = 29,978Smc−2.31 | 0.96 ** | ||
| O. chinensis | SS = 36.57Rbd0.56 | 0.99 ** | O. chinensis | SS = −4.51Smc + 125.15 | 0.93 ** | ||
| D. dichotoma | SS = 10.25e0.99Rbd | 0.93 ** | D. dichotoma | SS = 98,565Smc−2.844 | 0.90 * |
| Vegetation Types | Dominant Factor Equation | R2 | n | NSE |
|---|---|---|---|---|
| N. reynaudiana | SS = 101.11Rvd − 81.02L0.5–1 + 18.59 | 0.99 ** | 5 | 0.99 |
| P. sinese | SS = 10.33Rld + 8.18 | 0.99 ** | 5 | 0.99 |
| O. chinensis | SS = 25.18Rbd + 10.96 | 0.99 ** | 5 | 0.99 |
| D. dichotoma | SS = 98.43Rvd + 4.87Smc − 117.06 | 0.99 ** | 5 | 0.99 |
| comprehensive | SS = 31.61Rvd + 10.57 | 0.89 ** | 20 | 0.89 |
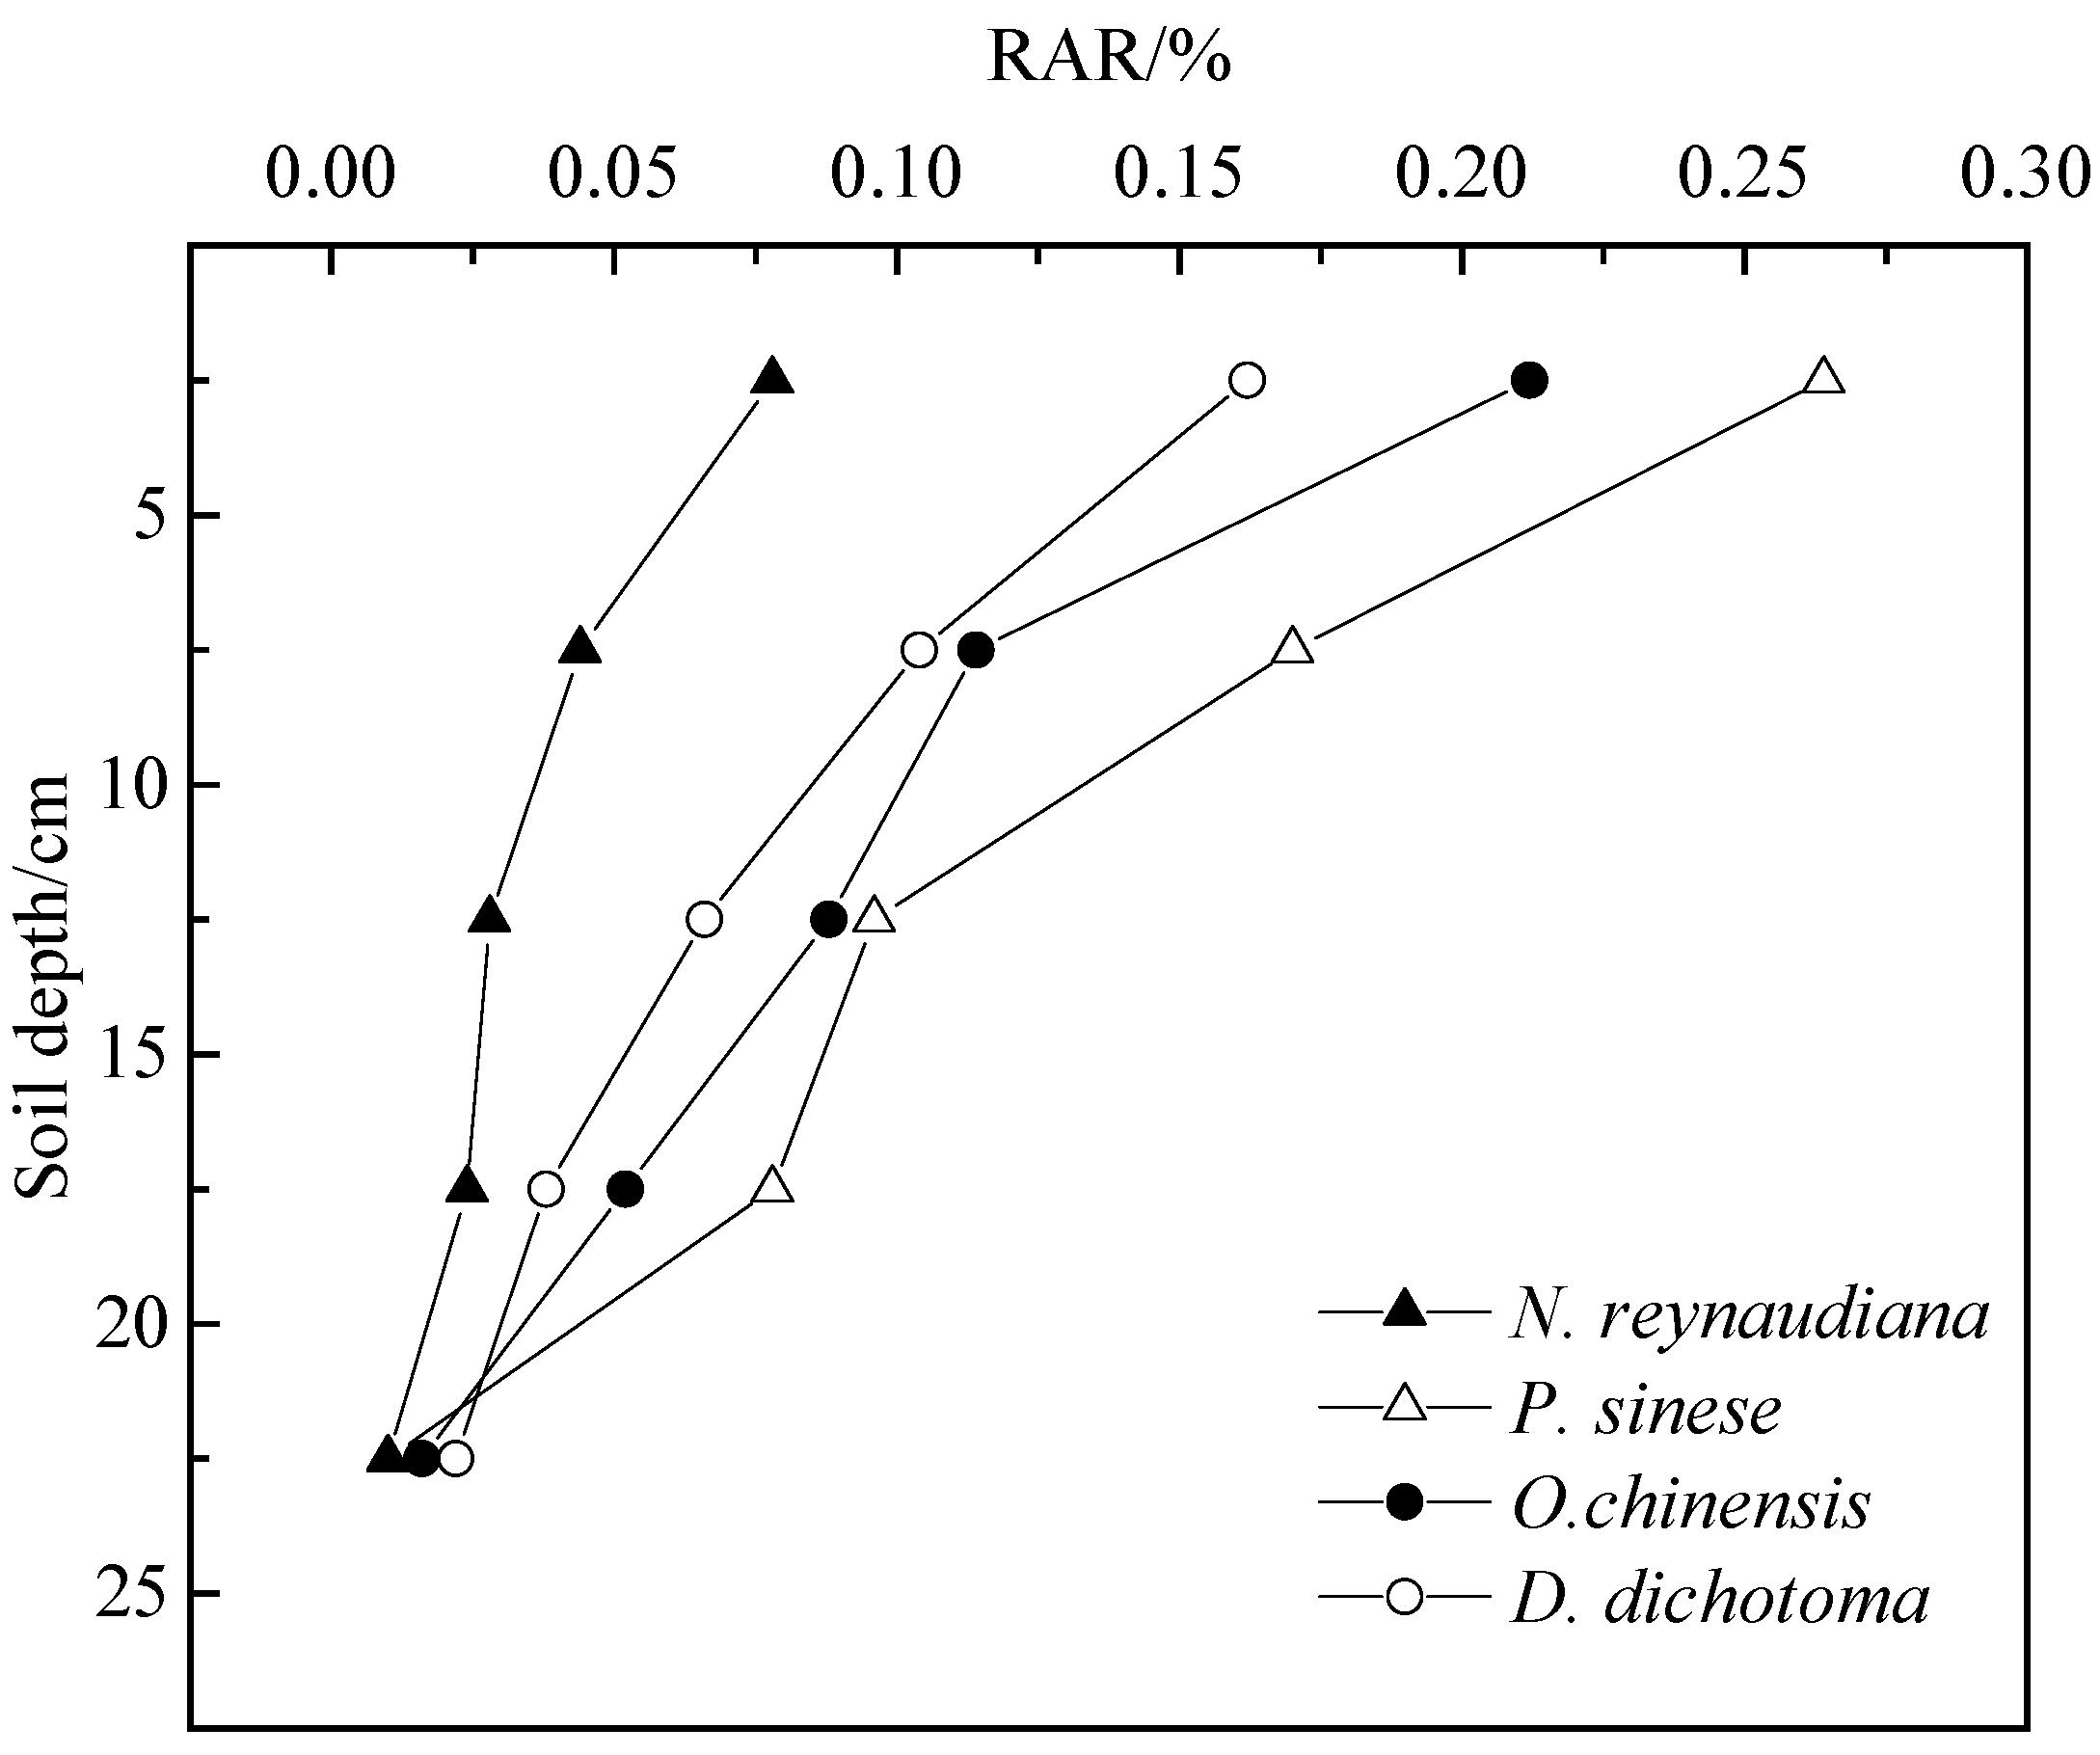
| Vegetation Types | Soil Depth (cm) | RAR /% | Average Tensile Strength /Mpa | Measured Shear Strength of Root–Soil Complex /kPa | Shear Strength of Bare Land /kPa | Measured Shear Strength Enhancement Value /kPa | Simulated Shear Strength Enhancement Value /kPa | Measured/ Simulated (k′) |
|---|---|---|---|---|---|---|---|---|
| N. reynaudiana | 0–5 cm | 0.078 | 51.29 | 28.21 | 17.10 | 11.11 | 4.80 | 2.31 |
| 5–10 cm | 0.044 | 54.96 | 15.12 | 12.47 | 2.66 | 2.90 | 0.92 | |
| 10–15 cm | 0.028 | 61.79 | 11.35 | 10.94 | 0.42 | 2.08 | 0.20 | |
| 15–20 cm | 0.024 | 63.10 | 10.50 | 9.95 | 0.55 | 1.82 | 0.30 | |
| 20–25 cm | 0.010 | 74.76 | 9.79 | 9.19 | 0.60 | 0.90 | 0.67 | |
| P. sinese | 0–5 cm | 0.264 | 45.63 | 49.87 | 17.10 | 32.77 | 14.46 | 2.27 |
| 5–10 cm | 0.170 | 51.88 | 34.38 | 12.47 | 21.92 | 10.58 | 2.07 | |
| 10–15 cm | 0.096 | 57.20 | 30.10 | 10.94 | 19.16 | 6.59 | 2.91 | |
| 15–20 cm | 0.078 | 53.97 | 21.22 | 9.95 | 11.26 | 5.05 | 2.23 | |
| 20–25 cm | 0.010 | 73.92 | 19.21 | 9.19 | 10.02 | 0.89 | 11.30 | |
| O. chinensis | 0–5 cm | 0.212 | 24.51 | 42.48 | 17.10 | 25.37 | 6.23 | 4.07 |
| 5–10 cm | 0.114 | 20.52 | 36.18 | 12.47 | 23.71 | 2.81 | 8.45 | |
| 10–15 cm | 0.088 | 18.68 | 27.73 | 10.94 | 16.80 | 1.97 | 8.52 | |
| 15–20 cm | 0.052 | 19.22 | 18.85 | 9.95 | 8.90 | 1.20 | 7.42 | |
| 20–25 cm | 0.016 | 15.33 | 15.15 | 9.19 | 5.96 | 0.29 | 20.25 | |
| D. dichotoma | 0–5 cm | 0.162 | 16.80 | 40.46 | 17.10 | 23.36 | 3.27 | 7.15 |
| 5–10 cm | 0.104 | 21.40 | 21.51 | 12.47 | 9.04 | 2.67 | 3.38 | |
| 10–15 cm | 0.066 | 29.66 | 19.68 | 10.94 | 8.75 | 2.35 | 3.72 | |
| 15–20 cm | 0.038 | 17.23 | 14.44 | 9.95 | 4.48 | 0.79 | 5.71 | |
| 20–25 cm | 0.022 | 51.29 | 10.12 | 9.19 | 0.93 | 0.18 | 5.05 | |
| Average | N. reynaudiana | 0.037 | 61.35 | 14.99 | 11.93 | 3.06 | 2.71 | 1.13 |
| P. sinese | 0.124 | 56.52 | 30.95 | 11.93 | 19.02 | 8.38 | 2.27 | |
| O. chinensis | 0.096 | 19.65 | 28.08 | 11.93 | 16.15 | 2.27 | 7.10 | |
| D. dichotoma | 0.078 | 18.42 | 21.24 | 11.93 | 9.31 | 1.73 | 5.37 |
Publisher’s Note: MDPI stays neutral with regard to jurisdictional claims in published maps and institutional affiliations. |
© 2022 by the authors. Licensee MDPI, Basel, Switzerland. This article is an open access article distributed under the terms and conditions of the Creative Commons Attribution (CC BY) license (https://creativecommons.org/licenses/by/4.0/).
Share and Cite
Shuai, F.; Huang, M.; Zhan, Y.; Zhu, Q.; Li, X.; Zhang, Y.; Lin, J.; Huang, Y.; Jiang, F. Effects of Herbaceous Plant Roots on the Soil Shear Strength of the Collapsing Walls of Benggang in Southeast China. Forests 2022, 13, 1843. https://doi.org/10.3390/f13111843
Shuai F, Huang M, Zhan Y, Zhu Q, Li X, Zhang Y, Lin J, Huang Y, Jiang F. Effects of Herbaceous Plant Roots on the Soil Shear Strength of the Collapsing Walls of Benggang in Southeast China. Forests. 2022; 13(11):1843. https://doi.org/10.3390/f13111843
Chicago/Turabian StyleShuai, Fang, Mengyuan Huang, Yuanyuan Zhan, Qin Zhu, Xiaolin Li, Yue Zhang, Jinshi Lin, Yanhe Huang, and Fangshi Jiang. 2022. "Effects of Herbaceous Plant Roots on the Soil Shear Strength of the Collapsing Walls of Benggang in Southeast China" Forests 13, no. 11: 1843. https://doi.org/10.3390/f13111843