Article

Community-Based Importance and Quantification of Ecosystem Services, Disservices, Drivers, and Neotropical Dry Forests in a Rural Colombian Municipality

by
Yuli Paola Tovar Tique
1,
Francisco J. Escobedo
2 and
Nicola Clerici
1,*
1
Department of Biology, Faculty of Natural Sciences, Universidad del Rosario, Kr 26 No 63B-48, Bogotá D.C. 111221, Colombia
2
USDA Forest Service Pacific Southwest Research Station, 4955 Canyon Crest Dr., Riverside, CA 90012, USA
*
Author to whom correspondence should be addressed.
Forests 2021, 12(7), 919; https://doi.org/10.3390/f12070919
Submission received: 27 April 2021 / Revised: 15 June 2021 / Accepted: 23 June 2021 / Published: 15 July 2021
(This article belongs to the Special Issue Political Ecology of Forests Ecosystem Services)

Abstract

:
Few studies analyze people’s preferences for ecosystem services (ES), disservices (ED) and drivers of change in less populated, tropical municipalities. Understanding such preferences and needs by the community and stakeholder groups before actually assessing, modelling, and measuring the supply of ES is key for decision-making and planning in municipalities, as well as for the conservation of nearby neotropical dry forests. We studied these dynamics in a small rural municipality in Colombia with limited data availability using semi-structured interviews and surveys, as well as ES-proxies and geospatial analyses. We then analyzed the supply and importance of two community identified ES and one ED from adjacent neotropical dry forests during 2005–2017. We found that respondents recognized air purification and food production as the most important ES. Increased temperatures and fires were the most important ED, while fires were also identified as an important driver of change. Air purification, via pollutant deposition to forest cover, remained approximately constant (116 ton/year), while food production (49 ton/ha) and fire occurrence, an ED, increased. Findings show how transdisciplinary research and participatory knowledge co-production among local communities, researchers and land management institutions can improve governance, decision making, policy uptake and planning efforts.

1. Introduction

Human settlements depend strongly on adjacent ecosystems as these provide the necessary functions and resources for human well-being [1]. Indeed, the importance of ecosystems for society is regularly undervalued in some medium and low-income tropical countries, as documented by the unbalanced number of ecosystem services studies from temperate and high-income countries [2]. Until 2010, approximately 50% of ES studies were concentrated in six countries, particularly the United States and China [3]. Similarly, the role of ecosystem disservices (ED) and their effects on tropical socio-ecological systems and cities has been less studied compared to studies on ES [4]. In particular, such science-based information for supporting urban planning and neotropical forest conservation instruments that take into consideration community-defined ecosystem services assessments are also often lacking [2].
Although much ES research focuses on generating information on ES supply, fewer studies begin by first consulting with local stakeholders to identify the demand for important ES before commencing their assessments [5,6]. Spatially explicit information on ES in Colombia exists, yet ineffective conservation goals, planning instruments, and degradation of ecosystems, such as Andean forests and the paramos (mountain grasslands), continue to alter both the storage and supply of water- a highly important ES to downstream municipalities [7]. Therefore, there seems to be a mismatch between the local realities and needs of municipal and regional planners with the information being provided by ES assessments [2]. Thus, it is key to assess the importance and recognition of relevant ES supply and demand by local populations a priori, in order to better model their supply and meet demand [3].
This participatory approach is important for assessing demand for some ES as land cover changes can alter the provision of these ES and ED [8]. Studies frequently focus uniquely on a single or a few ES, such as water quality or carbon sequestration [9], or estimate ES demand or consumption using secondary data, leaving out elicitation-based preferences and concerns of local communities [10]. Several ES studies also focus on monetary or biophysical valuation, leaving aside people’s non-monetary value systems and their local-scale socio-ecological context [8]. Other studies and assessments are increasingly using the ES approach for planning. Aldana et al. [4], for example, estimated ES supply and demand using experts in the city of Barranquilla, Colombia. However, the ES prioritized by experts might differ from non-experts [11]. Therefore, the inclusion of local non-expert communities and other stakeholder groups is necessary to assess the ES and ED to stakeholders with less power and influence [6] and to integrate local and traditional knowledge [12].
Ecosystem services and ED are also strongly affected by anthropogenic drivers of change that alter ecosystems structure and functions, and in turn the supply of ES and ED [13]. The provision of an ES/ED is dependent not only on the biophysical and structural properties of an ecosystem, but also on the socioeconomic dynamics taking place in a particular context. Ecosystem service assessments using a socio-ecological approach can, therefore, provide a means to better understand the effects of ED and drivers of change on society, as well as their demand for ES [1]. In this way, information is gathered on the diverse and often divergent values that people have regarding ES/ED [11,14].
Our aim was to study a less populated municipality in Colombia to identify the importance to the community of, and subsequently map and quantify, ES, ED and drivers of change from adjacent neotropical dry forests. We did so by integrating the following specific objectives: (i) identify the recognition and importance of key ES, ED and drivers of change by a local community; (ii) use proxies to quantify and map the supply of these ES, and (iii) model the relationships between a recognized driver of change and its effects on the supply of a key ES. Such an approach, which first identifies the community’s most important ES, ED and drivers of change—before assessing the supply of ES—can aid in improving environmental planning and management instruments and subsequently people’s quality of life and better use of natural resources.

2. Materials and Methods

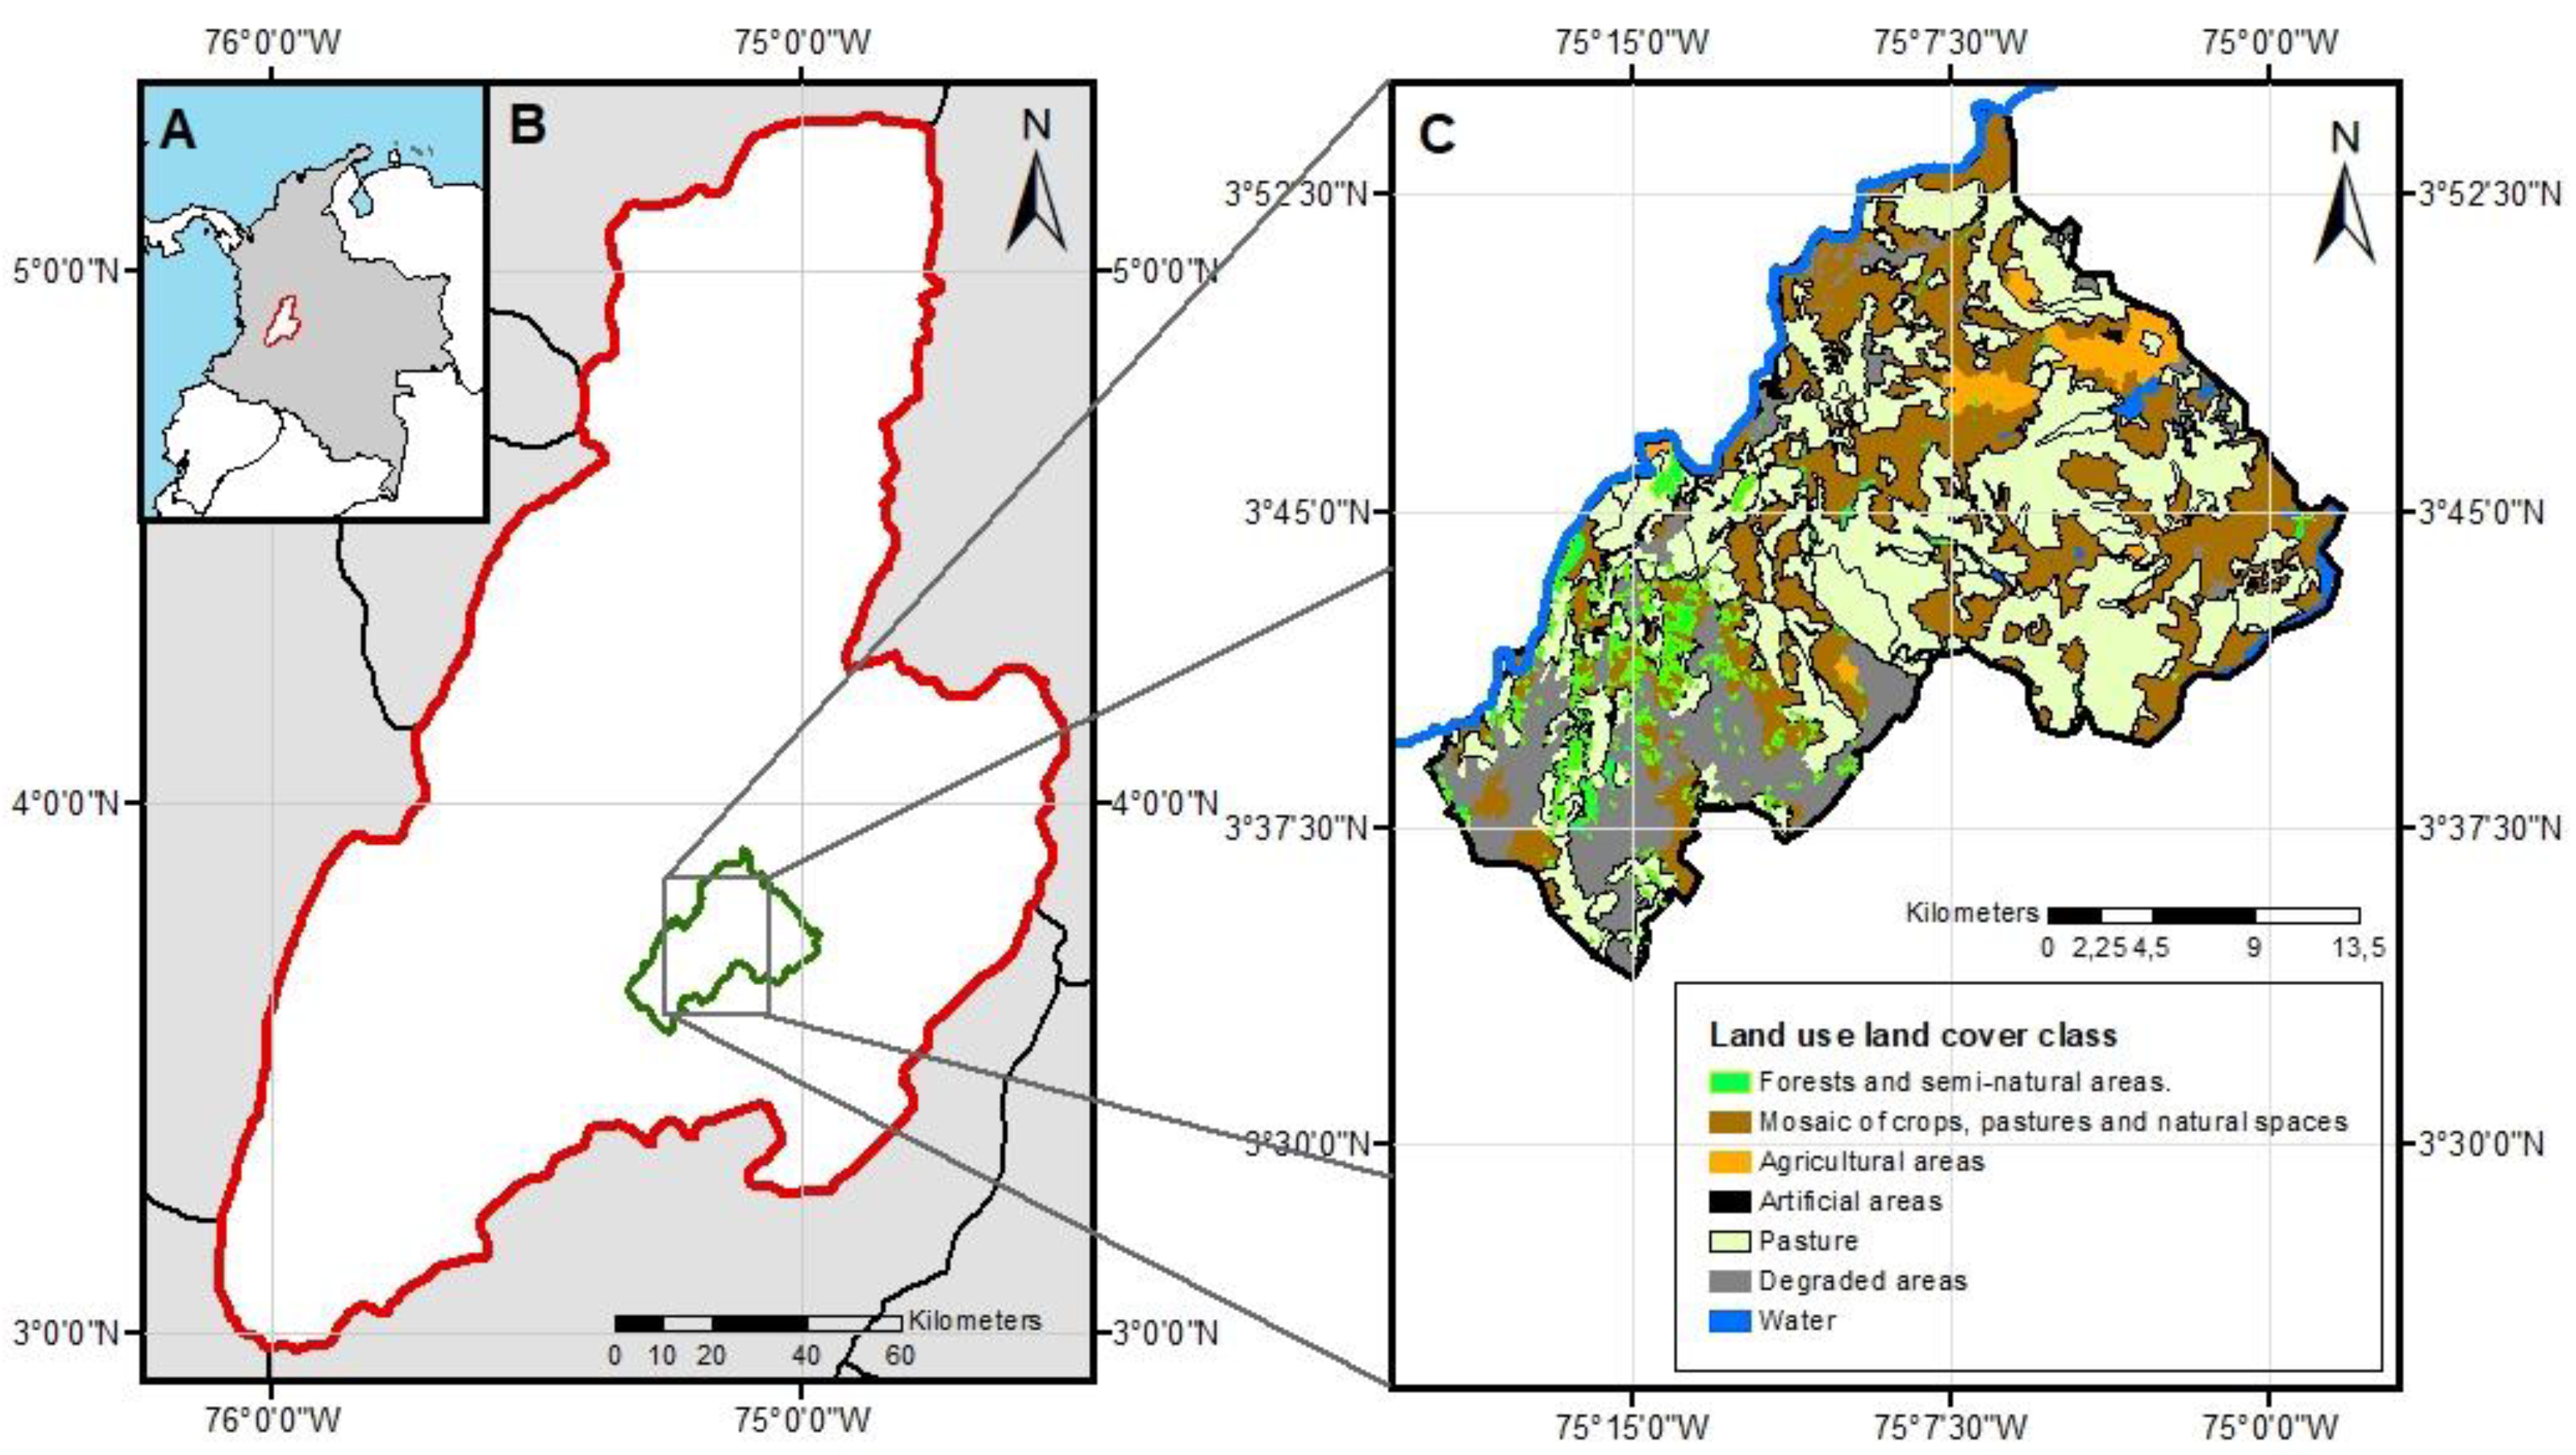
2.1. Study Area and Context

The study area is the municipality of Coyaima, located in the Department of Tolima, Colombia (Figure 1). The dominant natural vegetation surrounding the municipality is tropical dry forest, intermixed with a mosaic of crops, pastures and degraded areas [15]. Elevation ranges between 300 and 1200 m a.s.l., average annual precipitation is 125.3 mm/yr, and average annual temperature is 28 °C [16]. The municipality covers a total area of 664.3 km2, where the majority is rural and only 1% urban [17]. This municipality is administratively subdivided into different veredas, which are outlying less densified human settlements or hamlets located near major roads or other transportation routes.
The population of Coyaima is approximately 28,000 people, with 51.8% men and 48.2% women [18], and 78% of the population lives in non-urban areas [19]. Approximately, 77% of residents in Coyaima self-identify as belonging to the Pijao ethnic group [18]. The municipality has an area of 664 km2 and an urbanized full-service village of 1.5 km2 with approximately 5000 inhabitants, while the rest of the inhabitants live in 53 adjacent and nearby veredas [19]. The economy of the municipality is mainly based on agriculture, livestock, mining, followed by manufacturing activities, commerce, and services [16]. The major agricultural activities are fishing and cropping of corn, sesame and sorghum (Sorghum spp.) [17]. Tropical dry forests are ecosystems at risk in Colombia, having been reduced to 8% of their original cover across the country [20]. Historically people have set fires to tropical dry forests to gain new grazing and agricultural land and to deter deleterious wildlife. Nevertheless, fires can have long-term negative effects on hydrology, biodiversity, soil properties and human safety and health [21].

2.2. Perception of Ecosystem Services, Disservices and Drivers of Change

We identified the items and potential variables to be used in our eventual survey instrument by initially interviewing: two community leaders, five public officials and one resident. The eight key stakeholders were identified using a snowball sampling technique based off an initial interview [22]. The semi-structured interviews yielded the most important ES/ED, and the identification and understanding of drivers of change [14].
Using the interview responses and Pedraza et al. [7], we developed a structured survey with the following sections: (1) demographic characteristics, (2) the most important ES and (3) ED affecting them, (4) identification of key drivers of change, and (5) questions about respondents environmental attitudes and opinions. They survey was pre-tested with 10 university researchers and once finalized, 361 in-person intercept surveys were conducted in Coyaima. The interview structure and the survey instrument and its items are presented in Supplementary Material, Part 1, Part 2 and Part 3. The surveys method consisted of the following steps: (1) the study area context was explained to the respondents using a script and photos, (2) respondents were provided with a form in which response items were previously read, (3) once respondents read all the options, they selected their response options. This was done for Questions 1, 2, 3 and 5 to reduce protest responses [7]. The order of listing the benefit and damage response options in Questions 1 and 2 (Supplementary Material, Part 3) were randomly presented to the respondents in every survey to reduce selection bias associated with selecting the initially presented items. Approximately 80% of people invited to participate in the survey did so.
The survey results were digitized and analyzed using the NVivo Version 12 data analysis software [23]. The software identified the most frequently reported ES and ED important to, or that affected, people, as well as the most frequently mentioned drivers of change. Finally, the open questions on environmental attitudes and opinions were analyzed by identifying the 10 most frequently related words regarding ES, ED, and drivers of change (minimum length of 5 letters and exact matches).

2.3. Quantifying the Most Important ES

Using results from Section 2.2, we found that respondents identified air purification and food production as the two most important ES (see results in Section 3.1). This shows the importance of these two ES for people in Coyaima and, therefore, as stated in our study aim, we quantified the supply and distribution of these ES in the municipality. In addition, a main limitation in contexts such as Colombia is data availability and access. Therefore, we used the ES proxy approach to help estimate the supply of air purification and food production, and thereby eliminating the need for expensive and extensive field data collection work in difficult to access study areas [24].
The supply of the air purification ES was estimated by means of the annual amount of dry deposition, or removal, of pollutants, specifically carbon monoxide (CO), nitrogen dioxide (NO2), ozone (O3), particulate matter 10 (PM10) and 2.5 (PM2.5), and sulfur dioxide (SO2). These were estimated in tons (t) with respect to the total forested area in the municipality for the period 2005 to 2017. This time period was chosen primarily because of data availability and because of a substantial increase in national level deforestation beginning around 2005. The estimates consisted of multiplying proxy-based rates of annual pollutant removal (g/m2) and the amount in square meters (m2) of total forested area in the municipality during each year. Proxy-based annual rates of annual pollutant removal (Table 1) were obtained from modelling estimates from Mexico City by Escobedo and Chacalo [25], Santiago de Chile by Escobedo and Nowak [26] and for the United States by Hirabayashi [27], using the urban forest effects and i-Tree canopy models [28]. These modelled estimates are based on pollutant flux means (g/m2/s), which is the product of the dry deposition rate (m/s) and pollutant concentrations (g/m3) (see [26,27] for specific air pollution- forest deposition modelling methods). The total forested area data for each year were obtained from the Colombian IDEAM forest/non-forest layers for the years 2005, 2010, and annually from 2012 to 2017 [29].
The food production ES was estimated using proxy-based yields in tons/hectares (t/ha) for the five main types of non-industrial crops for each year from 2007 to 2017 according to yields reported in AGRONET [30]. The following subsistence crops were selected since they are important for household subsistence and revenue of residents, and included: cachaco (Musa sp.), traditional corn, mango (Mangifera indica), lemon, and sweet cassava (Manihot esculenta) [17].

2.4. Quantifying Ecosystem Disservices and Drivers of Change

We used the results from our survey (Section 2.2) and the proxy-based approach to quantify the most important ED. The survey respondents identified increased temperatures and the effects of fires as the main ED, while the uncontrolled dumping of garbage and again fires were the most frequently reported drivers of change in the study area (see detailed results in Section 3.1). Therefore, we quantified fires as both an ED and driver of change while dumping of garbage was not quantified, due to lack of data availability [17]. Neither was temperature, due to a lack of a weather monitoring station network in the study area. Rather, we prioritized the analysis of fires, as they have an important role as both ED and drivers of change, and the relevant data are readily available based on remote sensing products.
The amount of hectares burned between 2006 to 2017 was estimated using a supervised classification of seven scenes from different satellites: Terra/Aqua MODIS (for year 2006), Landsat 3–4 (2010, 2013), Landsat 8 (2014, 2017) and Sentinel-2 (2015, 2016), obtained from the GloVIS search engine [31]. The assessment of the overall classification accuracies for the burned and non-burned areas was carried out by means of a confusion matrix using 100 validation points per year and high-resolution imagery from Google Earth. To determine if the specific land cover that was burned in the study area for 2017, we used the Colombian map of continental, coastal and marine ecosystems -MEC [15]. The map represents 16 land cover types, which were collapsed into seven aggregated land cover classes, according to Cortolima [16] for the municipality of Coyaima (Table S1).
Since fires primarily affect exurban areas, we differentiated between residents living in more urbanized area versus those living in ex-urban veredas in the municipality, by developing a political boundary map for Coyaima to differentiate these areas. We then assigned each respondent to their self-reported vereda in the municipality of Coyaima and a ranking depending on whether the persons living in that veredas (n = 274) identified fires as the first, second, or third most important ED or driver of change (1,2,3, respectively).
We used Spearman’s correlations to explore the relationships between fire as a driver of air purification supply plus ES food production, and Chi- square tests explored the relationship between n fires as an ED and driver of change and demographic variables such as: sex, age, education, occupation, affiliation with an indigenous reservation/council and rural or urban residence. All statistical analyses were performed using RStudio version 3.5.3 [32].

3. Results

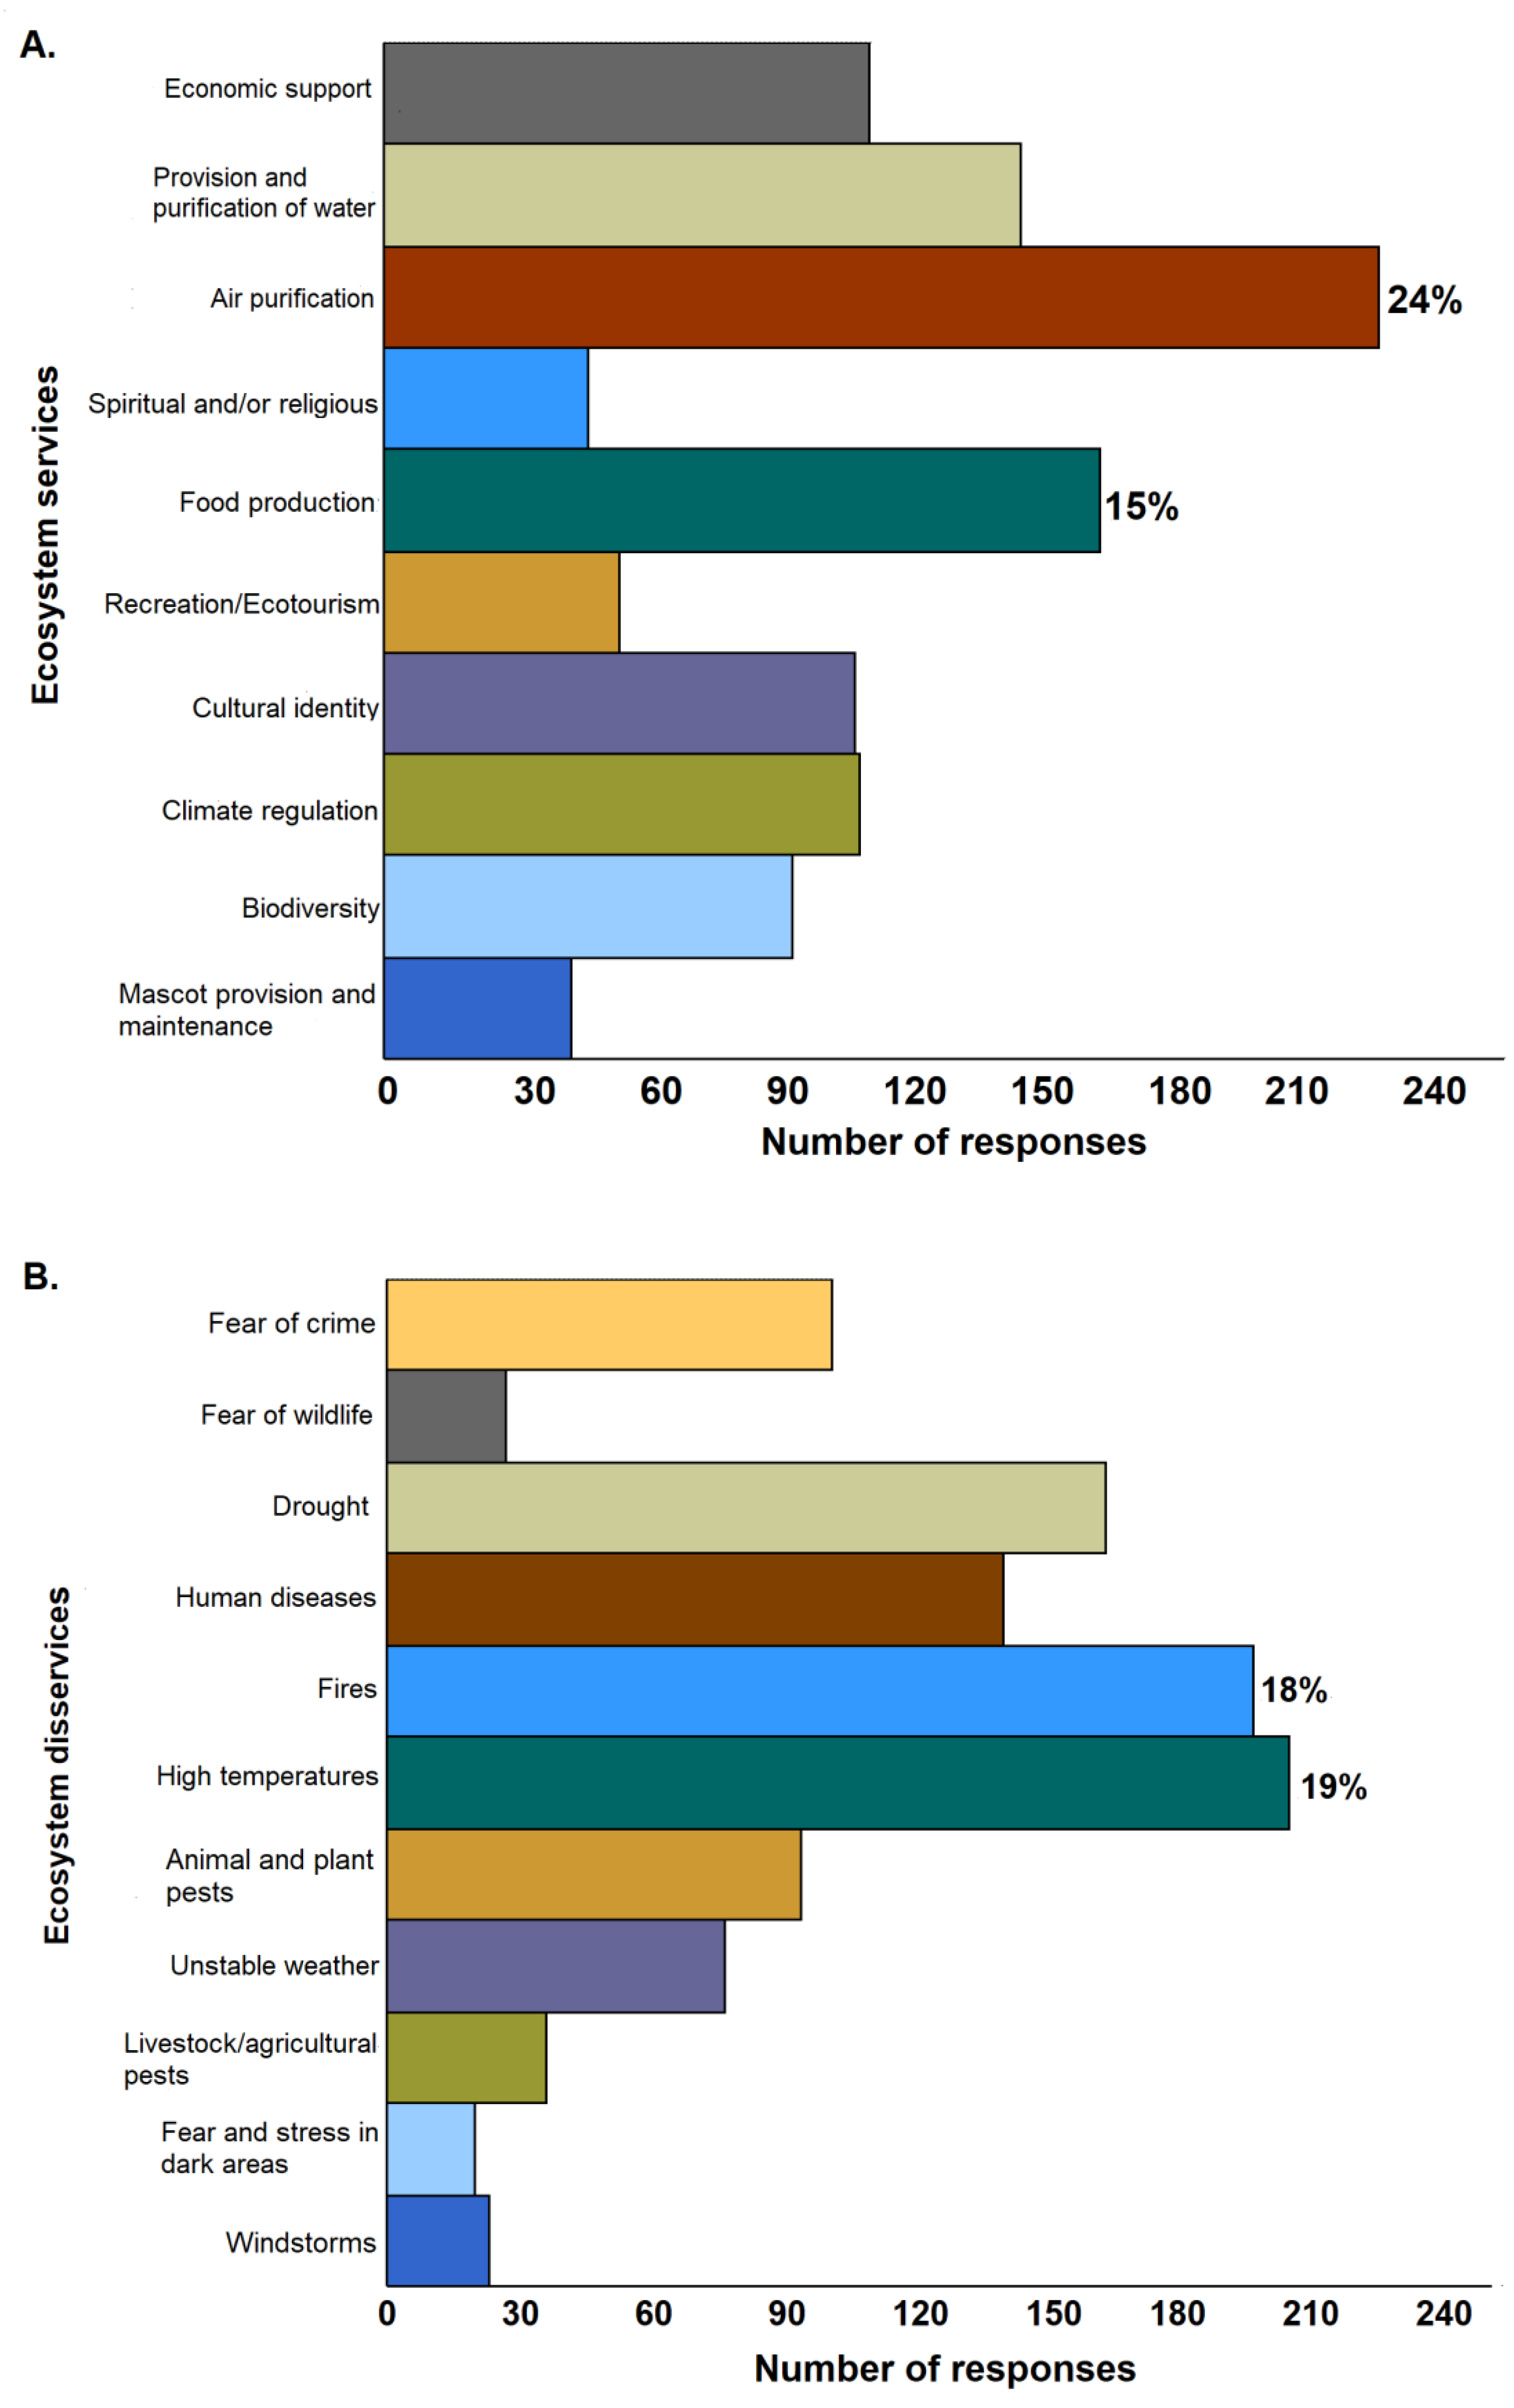
3.1. Identification and Importance of Key ES, ED and Drivers of Change

Eight key stakeholders from the municipality (3 women, 5 men) were initially interviewed. Their ages ranged from 46 to 60 years old, and all had lived in the municipality an average of 32 years. The interviewees identified a total of 25 ES, 10 ED and 13 drivers of change (Supplementary Material, Part 2). To reduce redundancy and the number of ES, ED and drivers of change, these were collapsed into 10 ES, 11 ED and 9 drivers of change that were later used as response items in the survey instrument (see Section 2.2).
Table 2 shows the population characteristics of our survey respondents (n = 361). Overall, we found that survey respondents chose air purification (24%) and food production (15%) as the most important ES (Figure 2A). The two ED that were chosen in the survey as the most damaging were: high temperatures (19%) and fires (18%; Figure 2B). The two drivers that most important were: informal garbage dumping (26%) and fire (22%), which interestingly was also one of the top ED (Figure 3).
We also explored specific demographics and their relationship to ES, ED, and drivers of change and found that air purification was important to most demographic groups (Figure 2A), but the importance of other ES, ED and drivers differed across demographic groups. For example, women less than 30 years old (n = 82) chose air purification (55%) and climate regulation (40%) as their most important ESs. Professionally educated women also chose air purification (58%) and additionally biodiversity as their most important ES. Meanwhile men with a professional-level education chose air purification (76%) as well as cultural identity as the most important ESs. Further, rural respondents with no education again chose air purification as an important ES but also economic support. In terms of EDs (Figure 2B), urban respondents with a technician-level education identified high temperatures and drought as the most important EDs, while older men > 60 years old identified drought and fear of crime as most important. Respondents who worked in agriculture (n = 32) reported that fire was the most important ED and the majority (59%) identified fire as the most important driver of change. Finally, younger respondents 18–30 years old with a primary school education identified garbage (i.e., Figure 3) and soil erosion as the main drivers of change.

3.2. Quantifying the Most Important ES

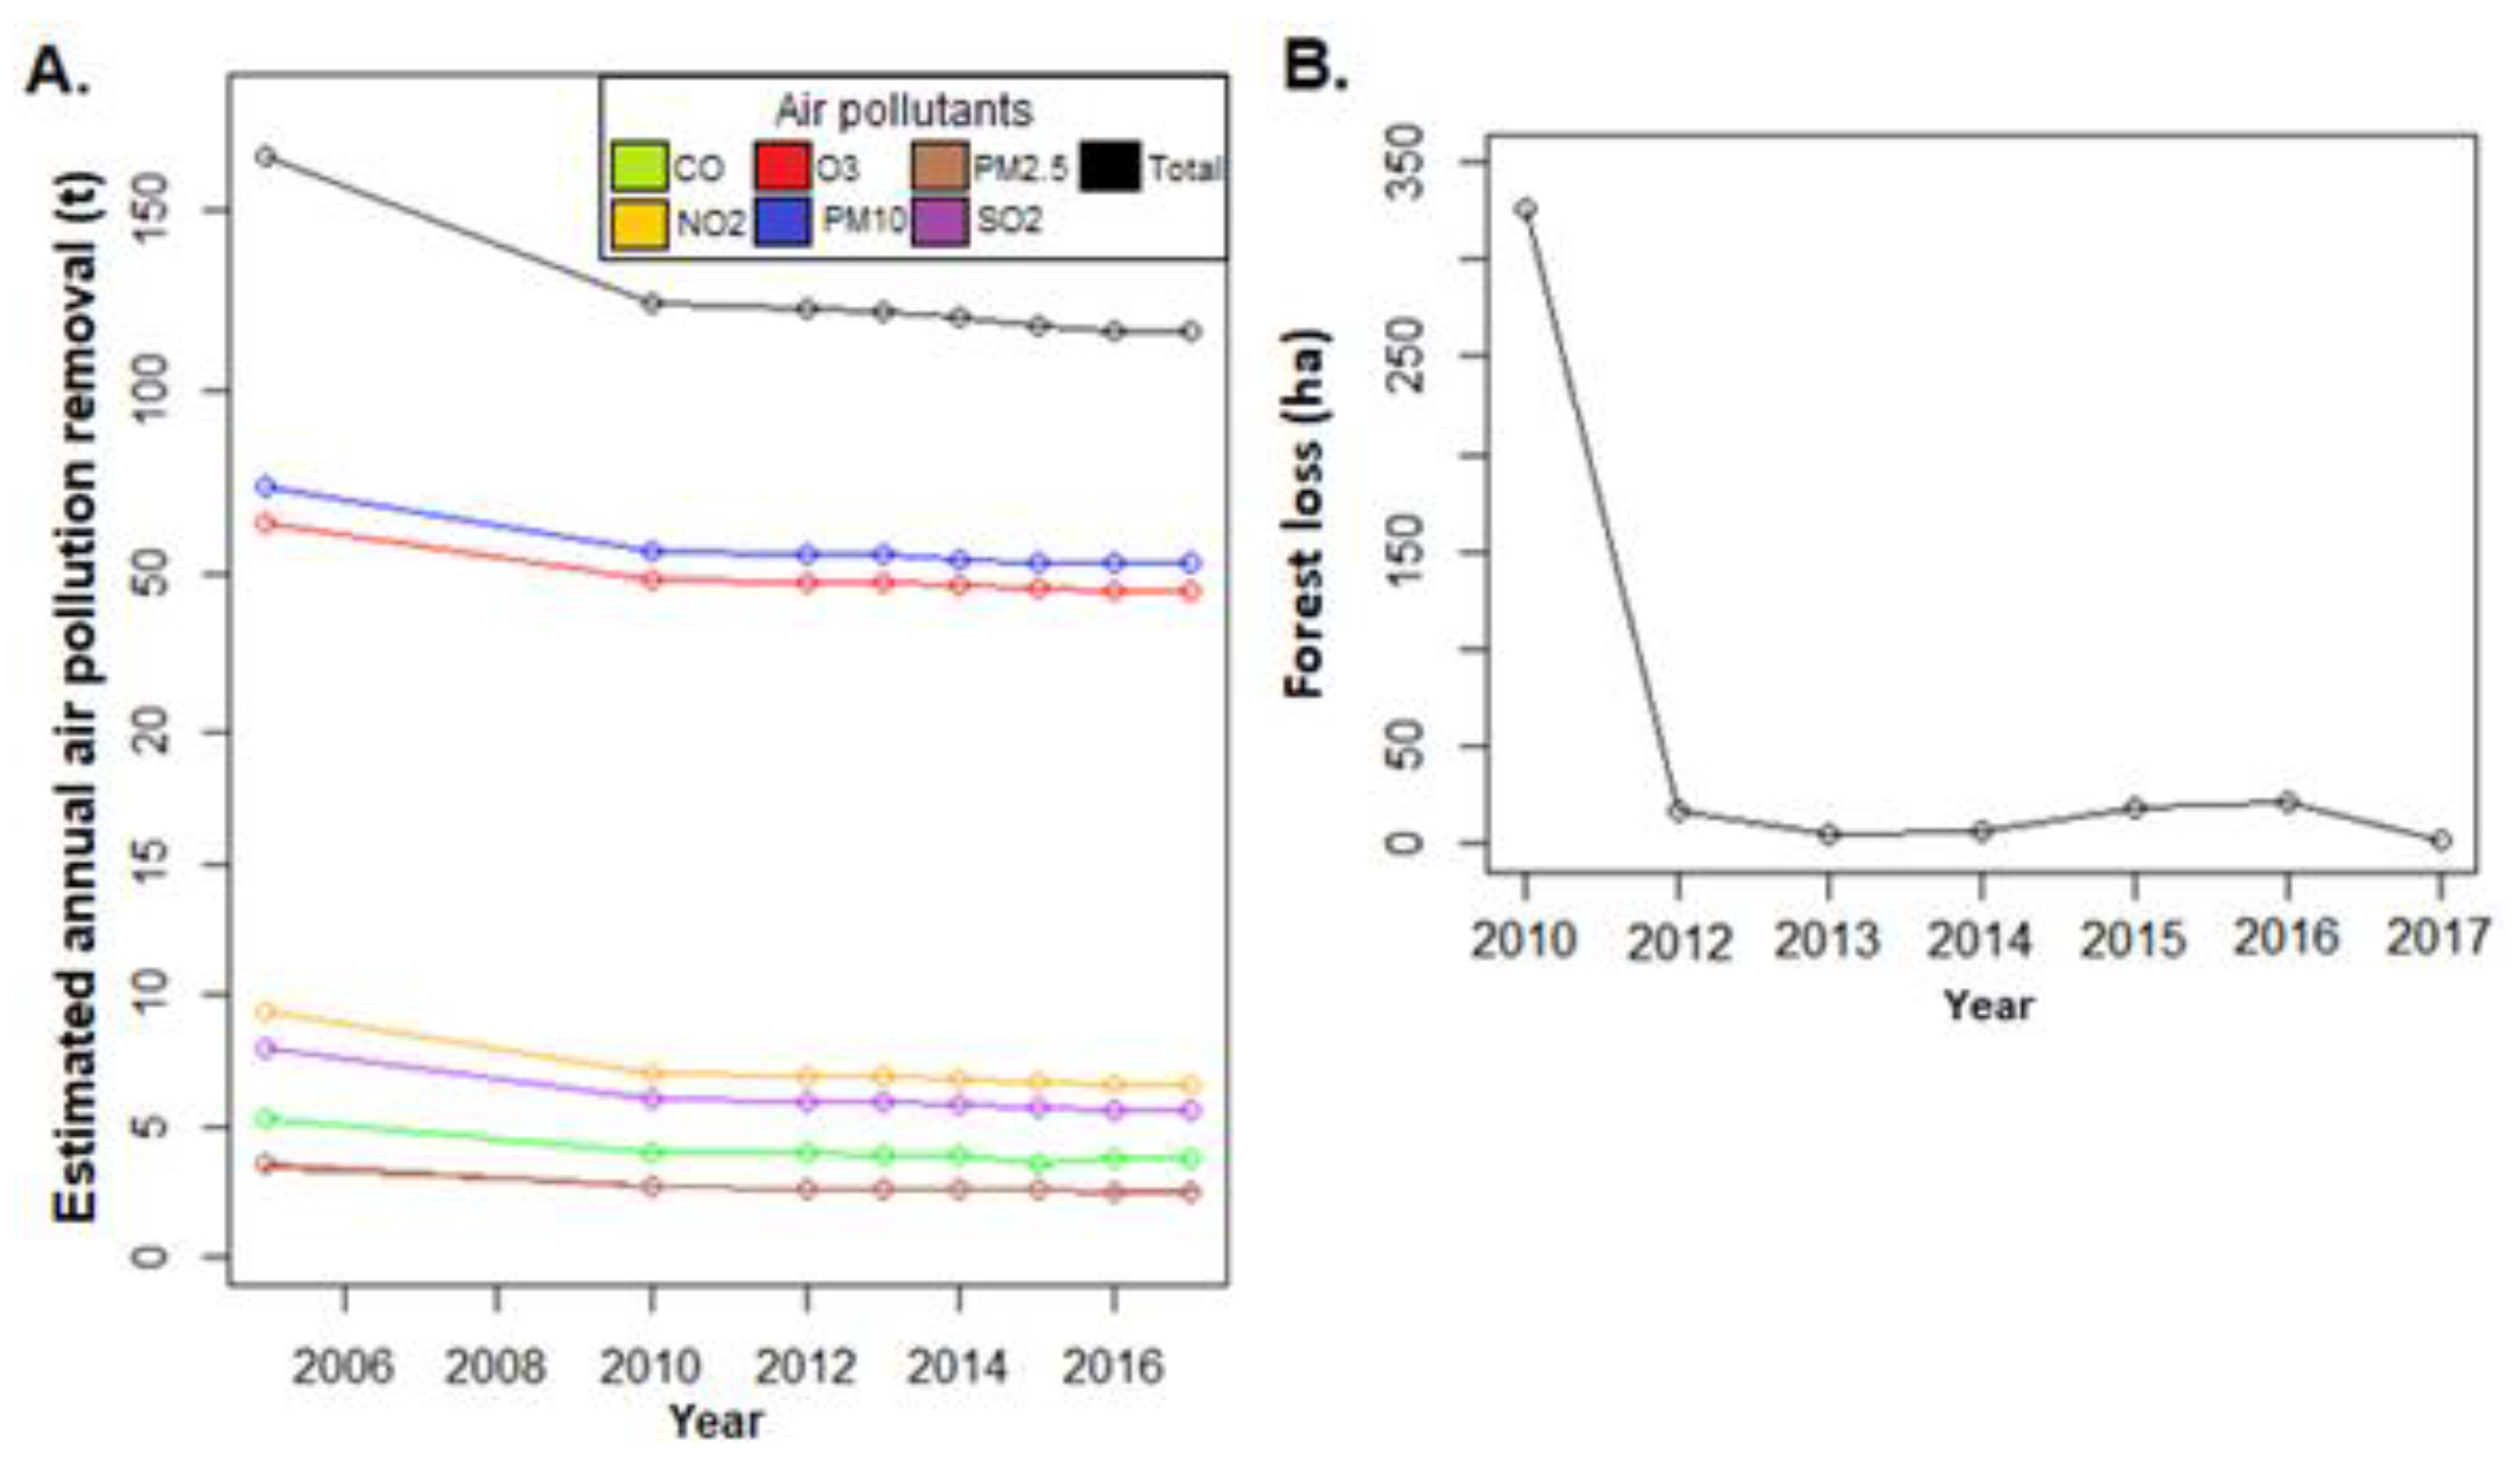
3.2.1. Air Purification

The maximum total supply of the annual air purification ES by the forested area in the municipality of Coyaima in 2005 as estimated by our Methods (Section 2.3) averaged 164 t (Table 3) and decreased between 2005 and 2010, indicating a loss in a functional ability to eliminate about 40 t of pollutants annually (Figure 4A). This is due to decreased forest cover (326 ha) in the study area during this period (Figure 4B) and resulted in the inability to remove 48.2 t of pollutants.

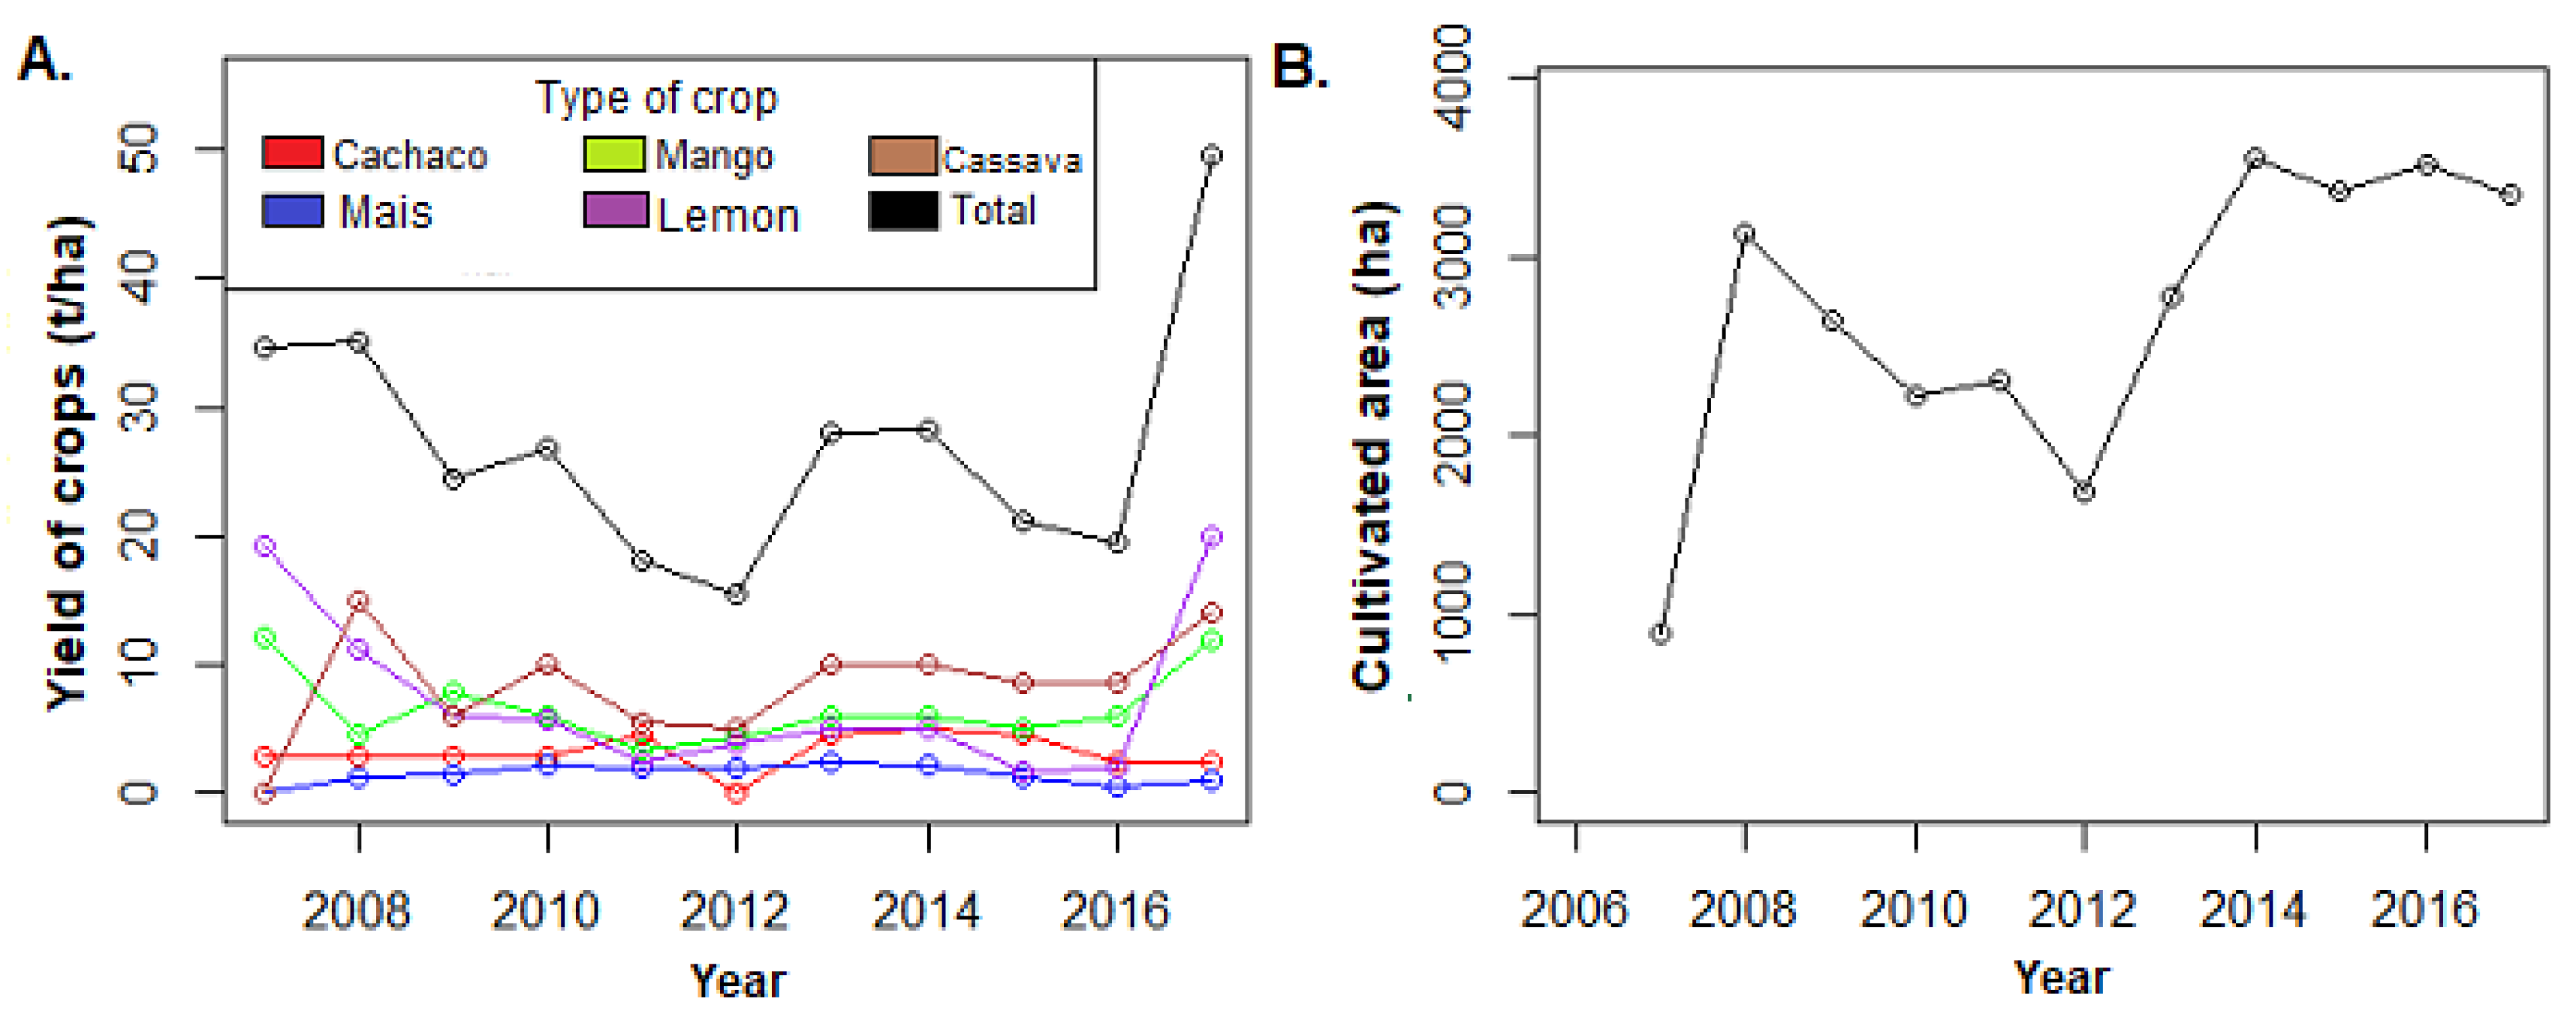
3.2.2. Food Production

The total supply of food production ES decreased between 2007–2012, but on average increased between 2012–2017 (Figure 5A). Despite the increase in total planted area between 2007–2008 (2 241 ha; Figure 5B), total yield remains approximately the same during this period (Figure 5A).

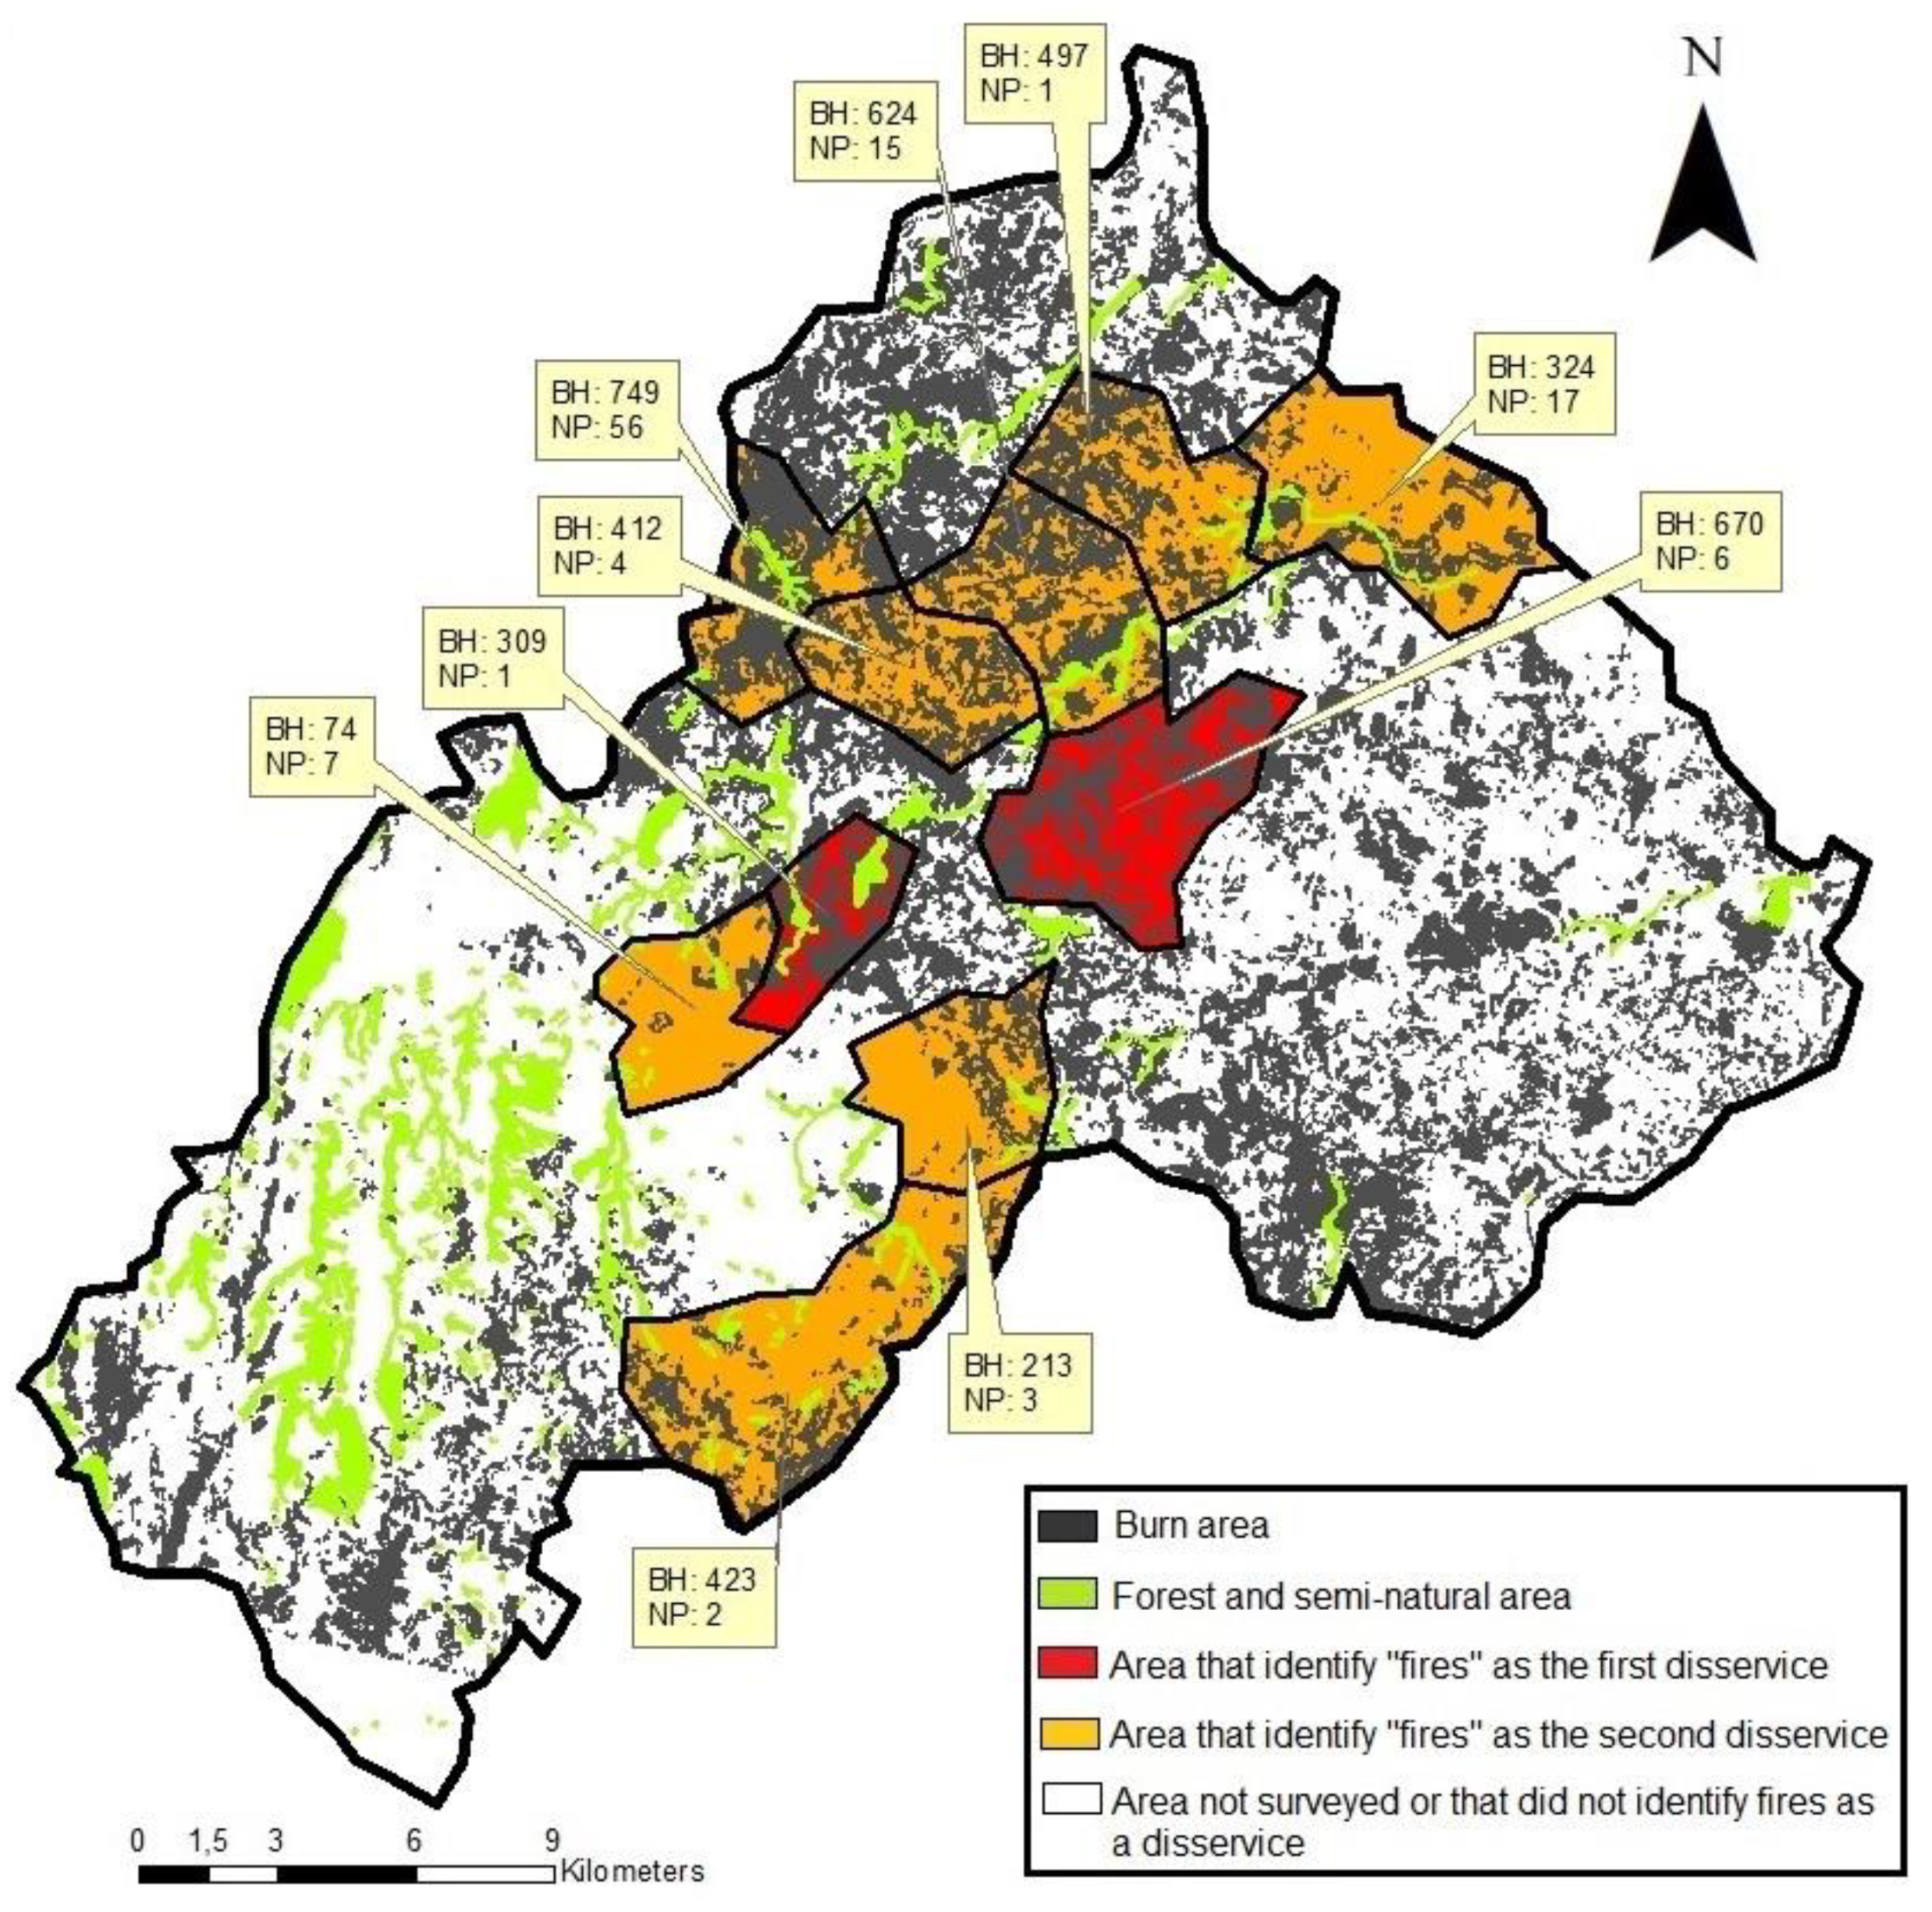
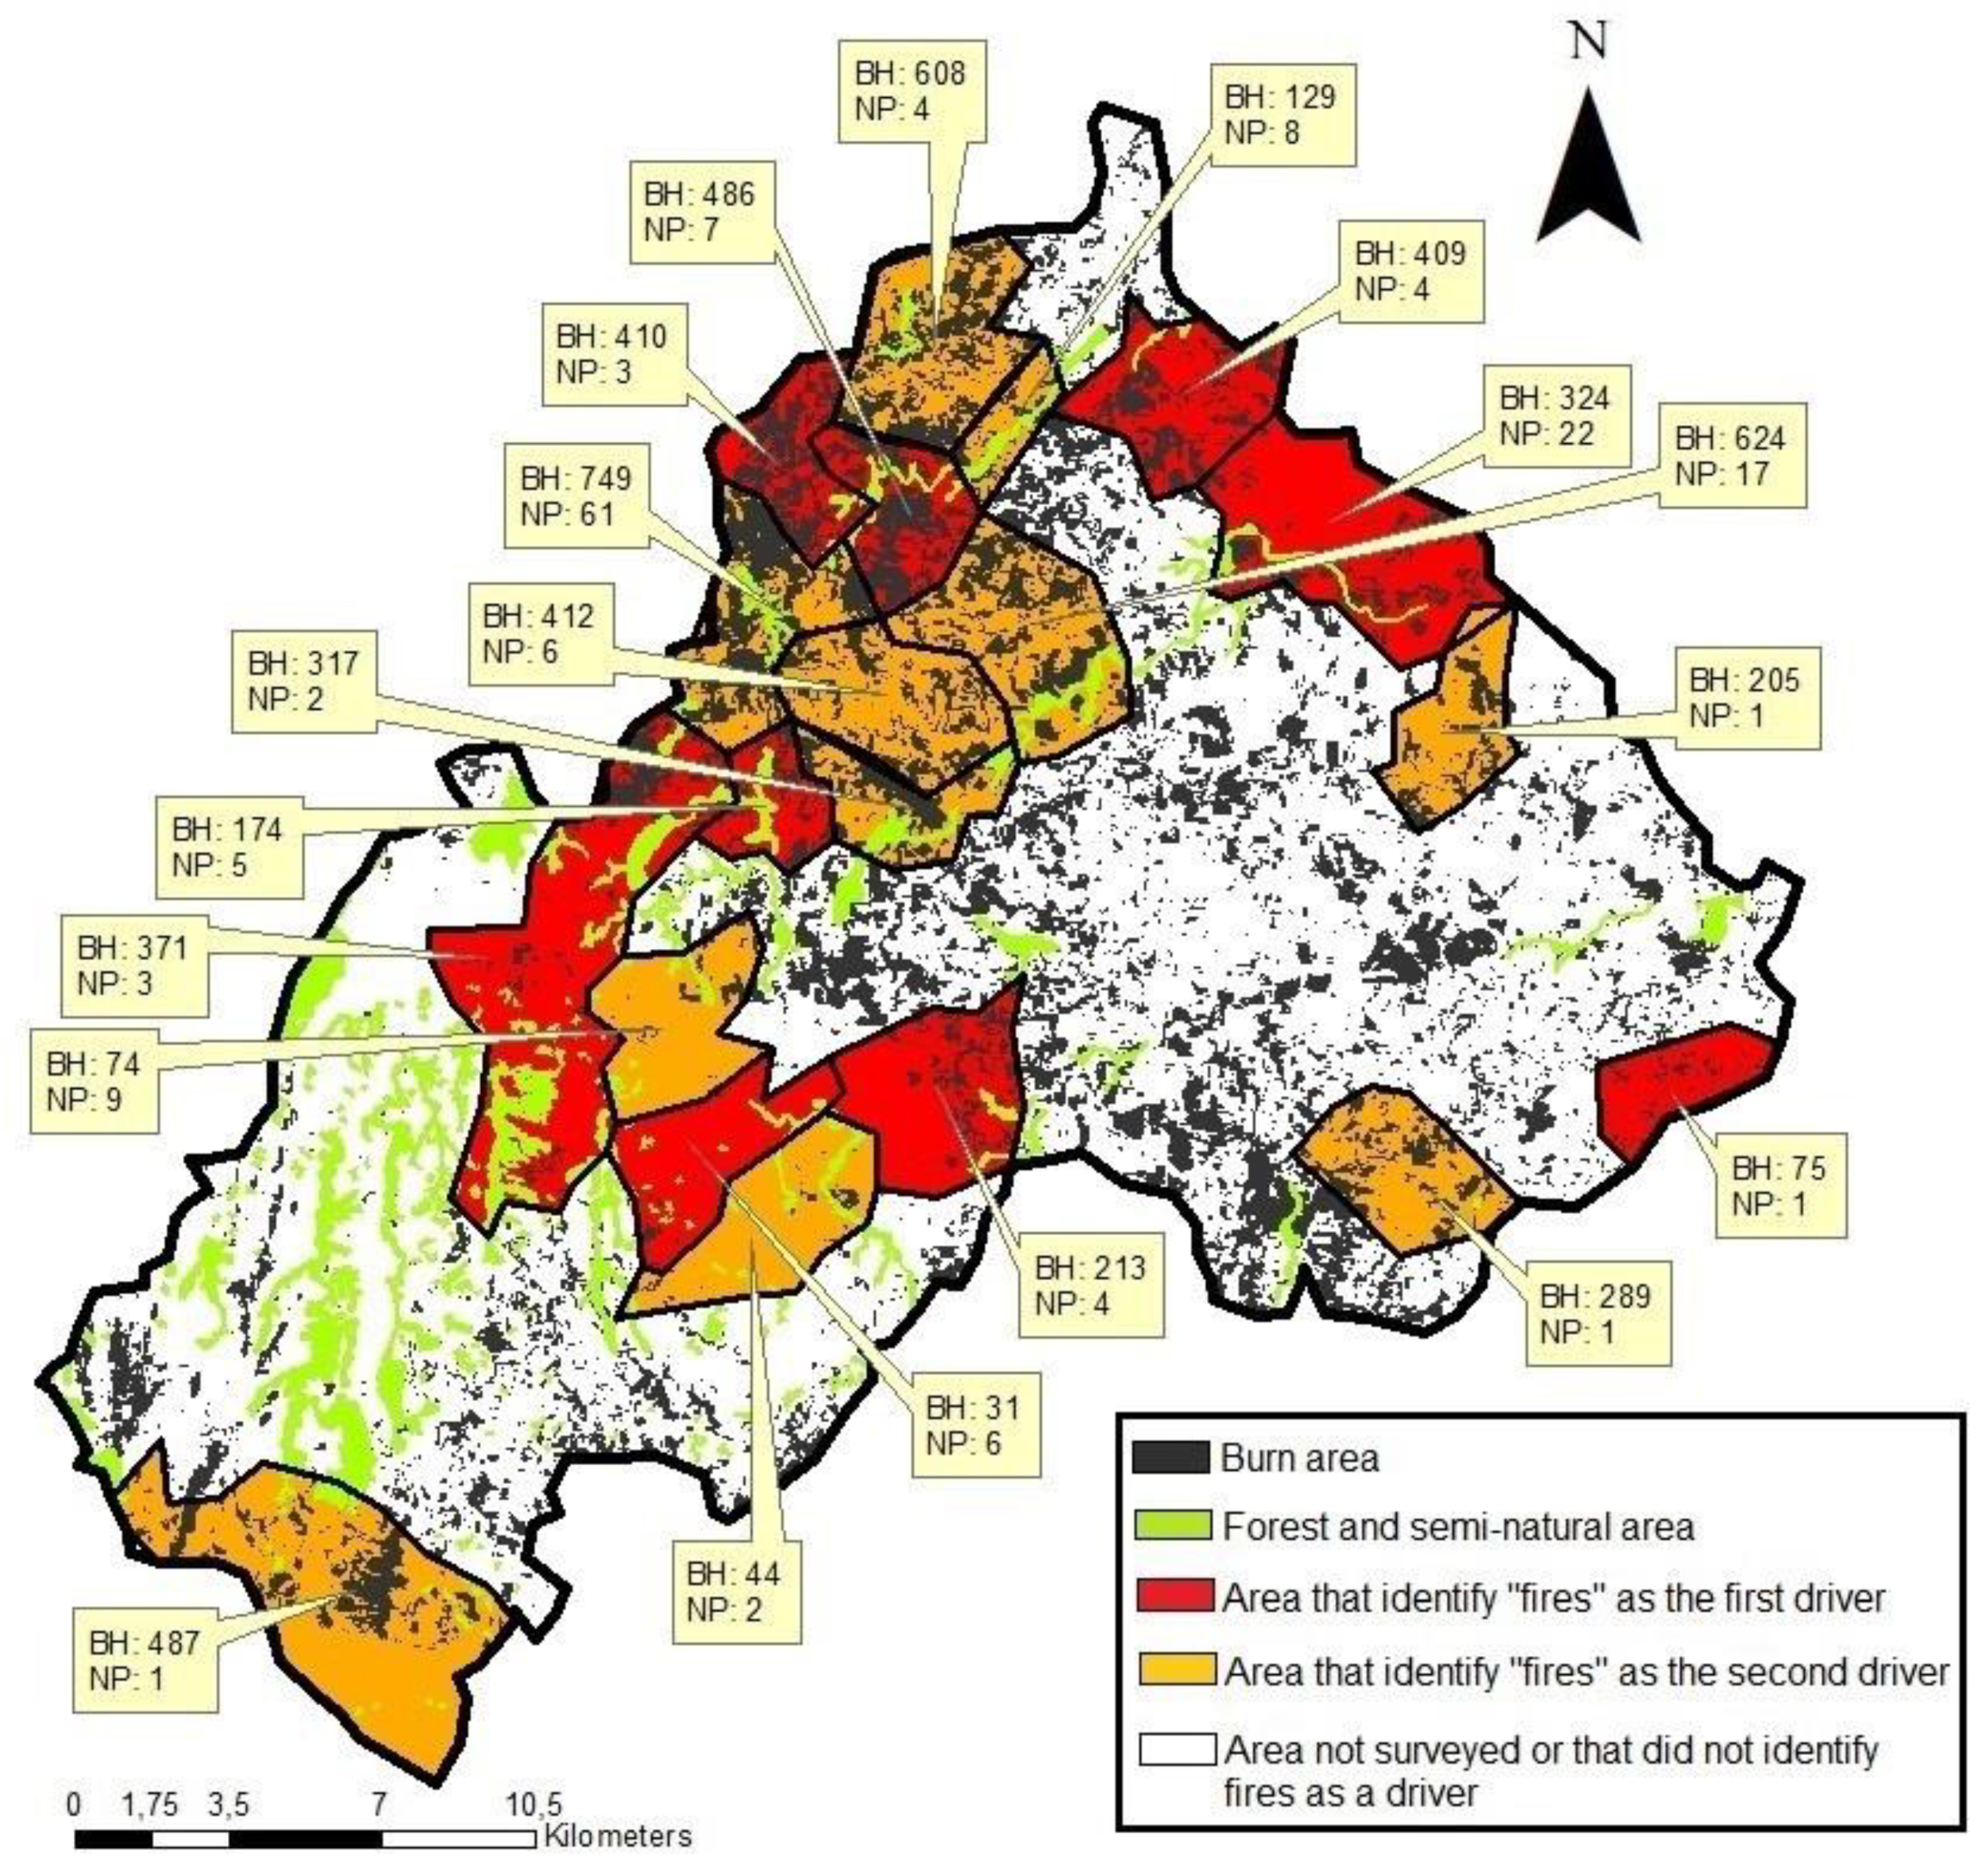
3.3. Ecosystem Disservices and Drivers of Change

The overall accuracies for the burned areas classification for the different years were: 94% (2006), 96% (2010), 72% (2013), 81% (2014), 80% (2015), 94% (2016) and 98% (2017). Results show that the area burned decreased between 2010–2013 (Figure S1). In 2017, burned areas occupied a large part of the study area (Figure 6) and the land cover types that were most affected by fires were pastures (6717 ha).
We found that the veredas that identified fires as the two main ED and drivers of change, were those generally located near areas with the highest extension of burned areas (Figure 6 and Figure 7). Education was significantly related to the respondents who are living in the municipality and who chose fire as one of the main disservice (p = 0.03). We also found sex was significantly related to the respondents living in the municipality and who chose fire as one of the main drivers of change (p = 0.016), with females having the highest percentage of choice (53% females and 47% males). Fire occurrence in terms of area burned (ha) also does not appear to be driving both the supply of air purification (ρ = −0.14, p = 0.8) and food production (ρ = 0.26, p = 0.6) ES during 2006–2017.

3.4. Governance

We found that most respondents could not identify any entities or institution that manage or regulate environmental activities in the municipality of Coyaima (66%); although 26% identified the Mayor’s Office and the regional Corporación Autónoma del Tolima (i.e., the regional government’s environmental regulatory entity). On the other hand, most respondents expressed interest in investing time for “stewardship” related activities (64%), specifically an average of 3.5 h per month in activities such as planting trees and restoring watersheds. However, some respondents were not willing to participate (31%) because of health and time limitations or because they were seasonal residents in the municipality. Finally, 64% of the respondents would be willing to participate with environmental entities (e.g., the Mayor’s Office, the regional environmental entity), in shared governance activities.
In terms of demographics, we found that 44% of women and 56% of men would participate in some type of stewardship activity. Younger people between <18–30 years would participate predominantly in tree plantings and recycling. In general, men would dedicate an average of 5.2 h per month towards planting trees and 4.8 per month towards agricultural activities without the use of agrochemicals. Both of these activities are key to maintaining the supply of ES such as air purification and food production. However, only 26% of respondents whose occupation is agriculture would participate in agriculture activities without the use of agrochemicals. Although we also found that the majority of older respondents (>60 years) not would participate in activities related to the care of nature (66%), because of health condition and lack of time.

4. Discussion

An interview-based, in-person survey was used in this study to identify and spatially analyze the most relevant and important ES, ED and drivers of change in a less populated rural municipality in Colombia. Respondents primarily valued ES that offer basic goods and services that are necessary for improved well-being (i.e., clean air, food, and water). We estimated that the two pollutants most removed by forests are PM10 and ozone (Figure 4). Overall ES food production, during the last five years, has increased in Coyaima (Figure 5). Although previous studies in mostly rural areas in temperate climates have found that people prioritize provisioning over regulating ES [33], in Coyaima we found the opposite, as air purification (Figure 2A) was the regulating ES considered most important. One possible reason are frequent episodes of smoke emissions from frequent fire activity in the municipality. In addition, this can be possibly due to the influence of ES preferences of the respondents who live in urban versus more rural areas (55% rural and 44% urban; Table 2) as urban residents in Colombia seem to prioritize regulating over cultural ES [34]. Similarly, citizens who live in urban areas tend to disconnect their personal well-being from the environments that support life and perceiving ecosystems as factors external to them, e.g., provisioning ES (e.g., food production) are perceived with less importance despite their relevance [33].
Oteros-Rozas et al. [14] report similar findings to this study in rangeland agroecosystem where anthropogenic activities dominate. The authors identified 34 ES crucial for people, and three were more important for their well-being: fire prevention, air purification and livestock. However, fire prevention per se is not an ES under current typologies [35] and this might be further evidence of the lack of knowledge or awareness by citizens of ecosystem processes. Although, in Coyaima respondents did not identify fire prevention as ES, they identified fires as an ED (Figure 2), indicating that people recognize the effects that fires have on human well-being (i.e., smoke emissions). Although, respondents might not be aware that farmers and ranchers regularly use fires as a beneficial management practice to supply provision ES, e.g., to induce pasture regeneration. On the other hand, the ED reported here differ from those found by Aldana et al. [4], despite having the Colombian tropical dry forests ecosystem in common; which is possibly due to Aldana et al.’s results being based on the perception of experts, while in this study focused on mostly non-expert respondents.
However, fear of crime (e.g., assaults, burglaries, etc.) was the fourth most frequently reported ED and fear of wildlife (e.g., biting snakes and scorpions, fear of jaguars, bears and other large mammals) was also reported (Figure 2). Such ED have also been reported in more peri-urban areas in Colombia [2,7,34] and are likely also relevant in other more tropical areas. In terms of ES-governance, other issues that have also been identified in Colombia, but were not explored in this study, are transparency and lack of confidence in government institutions as well perceived corruption by the citizens [34].
Fires were expected to have a negative relationship with respect to the supply of the air purification ES, since conversion of forests to agricultural areas often uses slash and burn practices [8]. However, a significant correlation was not found between burned areas and air purification, likely because the practice of fire is carried out on shrubland and pasturelands, and thus, have a minor effect on deforestation in the municipality of Coyaima. A regional scale evaluation would be necessary to allow a deeper understanding of the dynamics between fires and land cover conversion and degradation [14]. Overall, the areas burned in 2017 were mostly rangeland pasture areas [16]. However, the complex relationships between livestock grazing, the use of fires to improve pastures, and deforestation drivers of change need to be further investigated. Finally, we found no significant correlation between the amount of crop area and overall productivity (Rho: 0.2, p-value = 0.5), therefore, food production is likely being influenced by other factors (e.g., technology, agro-chemical inputs, improved agricultural practices).
Contingency plans for the prevention, management, and control of forest fires and slash burn practices were not available until 2014 for the municipality [36], and are necessary as demonstrated by respondents in the veredas, who identified fires as one of the three main perceived ED (Figure 6). Similarly, in terms of governance opportunities exist for incorporating traditional knowledge in environmental and natural resource management, planning processes and overall governance in Colombia [12,34]. Recently, the participation of indigenous communities in land management has become more visible, as these communities are achieving recognition by the State as territories that can adopt forms of self-government and adaptive management regimes [37]. Thus, participatory valuation and governance processes are key for decision-making concerning planning in indigenous lands, where the State must include the participation or prior consultation of indigenous communities [12].

5. Conclusions

This study presents an approach for identifying, quantifying, and mapping the community’s most important ES, ED and drivers. Processes that are not only important for the conservation of neotropical dry forests, but also for more sustainable and equitable municipal and regional planning strategies. However, we do not some study limitations. First, we were not able to interview key stakeholders in every single demographic or vereda in the study area. Similarly, we did not ask respondents to assign supply levels to the ES and ED they identified as important. Knowing how much ES and ED supply—and to whom—would have been interesting to study to better explore issues of equity, sustainability, and assessing respondent’s cognitive ability in identifying and understanding complex ecological processes. Another limitation was our proxy-based approach for quantifying the air purification ES. Our approach was based on proxies of annualized air pollution removal estimates from temperate urban forests outside of Colombia, thus not reflecting necessarily the tropical dry forest and air pollution characteristics of Coyaima. Most importantly, the use of such annualized air pollution removal proxies does not account for episodic fire-caused smoke emissions that directly affect citizen well-being.
That being said, this and other future research is a baseline and could be used towards assessing socio-culturally perceived trade-offs and synergies among ES-ED by citizens and the influence of other drivers of change. Such information regarding the community’s awareness of fire and the recognition of the importance of sustainable forest management practices and planning of ES provided by forests, or addressing their ED, is key for the conservation of tropical dry forest.
The results of studies such as ours demonstrate how a priori qualitative methods can be used to complement biophysical modelling of ES and ED, specifically by identifying relevant ecosystem processes and concerns to local stakeholders. In doing so, planners can more effectively manage small tropical cities as well as adjacent forests and improve community well-being in contexts lacking environmental data. As such, this approach represents a relevant example to better identify relevant ES and ED with respect to the needs and context of a local study area from various perspectives.
Indeed, there is a need in municipalities such as Coyaima to address the ongoing loss in the supply of the air purification ES, due to historical loss of adjacent tropical dry forests and because of the chronic emissions of air pollutants due to existing burning practices. In addition, climate change literature reports scenarios of future decrease of relative humidity and increase in minimum and maximum temperatures in the Tolima Department, where Coyaima is located, which could in turn affect fire effects and crop yield [38]. Our study also identified a willingness by the respondents to participate in the co-management of the municipality’s land and environment along with governmental entities. As such, we hope this study and future collaborative efforts between the government with the Pijao indigenous community can establish the basis for synergies and opportunities for more sustainable environmental planning practices.

Supplementary Materials

The following are available online at https://www.mdpi.com/article/10.3390/f12070919/s1, Part 1, semi-structured interview to identify ecosystem services, disservices and drivers of change for key stakeholders in the municipality of Coyaima; Part 2, ecosystem services, disservices and drivers of change identified by the interviewees in Coyaima (answers; no particular order); Part 3, survey used for assessing the ecosystem services of the municipality of Coyaima, Colombia; Figure S1: burned area (ha) between years 2006–2017 in Coyaima, Colombia; Table S1: map of continental, coastal and marine ecosystems of Colombia (MEC) and Cortolima land use land cover classes (LULC; ha and %) for the municipality of Coyaima.

Author Contributions

Conceptualization, Y.P.T.T. and F.J.E.; methodology, Y.P.T.T., F.J.E. and N.C.; formal analysis, Y.P.T.T.; writing—original draft preparation, Y.P.T.T. and F.J.E.; writing—review and editing, F.J.E., N.C.; supervision, F.J.E., N.C.; funding acquisition, F.J.E., N.C. All authors have read and agreed to the published version of the manuscript.

Funding

This research was funded by internal funding of the DIRECCIÓN DE INVESTIGACIÓN E INNOVACIÓN of UNIVERSIDAD DEL ROSARIO, and María Arcelia Madrigal.

Data Availability Statement

The data that support the findings of this study are available from the corresponding author upon reasonable request.

Acknowledgments

We acknowledge Claudia Ramos for help with the surveys, and we particularly thank the respondents of the Pijao community.

Conflicts of Interest

The authors declare no conflict of interest. The funders had no role in the design of the study; in the collection, analyses, or interpretation of data; in the writing of the manuscript, or in the decision to publish the results.

References

  1. Quintas-Soriano, C.; Brandt, J.; Running, K.; Baxter, C.V.; Gibson, D.M.; Narducci, J.; Castro, A.J. Social-ecological systems influence ecosystem service perception. Ecol. Soc. 2018, 23. [Google Scholar] [CrossRef] [Green Version]
  2. Dobbs, C.; Escobedo, F.J.; Clerici, N.; de la Barrera, F.; Eleuterio, A.A.; MacGregor-Fors, I.; Reyes-Paecke, S.; Vásquez, A.; Zea, J.; Hernández, J. Urban ecosystem services in Latin America: Mismatch between global concepts and regional realities? Urban Ecosyst. 2019, 22, 173–187. [Google Scholar] [CrossRef]
  3. Seppelt, R.; Dormann, C.F.; Eppink, F.V.; Lautenbach, S. A quantitative review of ecosystem service studies: Approaches, shortcomings and the road ahead. J. Appl. Ecol. 2011, 48, 630–636. [Google Scholar] [CrossRef]
  4. Aldana, J.; Palomo, I.; Gutiérrez, J.; Arnaiz, C.; Montes, C.; Narvaez, F. Assessing the effects of past and future land cover changes in ecosystem services, disservices and biodiversity: A case study in Barranquilla Metropolitan Area (BMA), Colombia. Ecosyst. Serv. 2019, 37, 100915. [Google Scholar] [CrossRef]
  5. Lebel, L.; Wattana, S.; Pawin, T. Assessments of ecosystem services and human well-being in Thailand build and create demand for coproductive capacity. Ecol. Soc. 2015, 20. [Google Scholar] [CrossRef] [Green Version]
  6. Nahuelhual, L.; Saavedra, G.; Henríque, F.; Benra, F.; Vergara, X.; Perugache, C.; Hansen, F. Opportunities and limits to ecosystem services governance in developing countries and indigenous territories: The case of water supply in Southern Chile. Environ. Sci. Policy 2018, 86, 11–18. [Google Scholar] [CrossRef]
  7. Pedraza, S.; Sanchez, A.; Clerici, N.; Ospina, L.; Quintero, A.; Escobedo, F.J. Perception of conservation strategies and nature’s contributions to people around Chingaza National Natural Park, Colombia. Environ. Conserv. 2020, 1–8. [Google Scholar] [CrossRef]
  8. Rincón, A.; Echeverry, M.; Piñeros, A.M.; Tapia, C.H.; David, A.; Arias, P.; Zuluaga, P.A. Valoración Integral de la Biodiversidad y los Servicios Ecosistémicos: Aspectos Conceptuales y Metodológicos; Instituto de Investigación de Recursos Biológicos Alexander Von Humboldt (IAvH): Bogotá, DC, Colombia, 2014; 151p. [Google Scholar]
  9. Kroll, F.; Müller, F.; Haase, D.; Fohrer, N. Rural-urban gradient analysis of ecosystem services supply and demand dynamics. Land Use Policy 2012, 29, 521–535. [Google Scholar] [CrossRef]
  10. Burkhard, B.; Kroll, F.; Nedkov, S.; Müller, F. Mapping ecosystem service supply, demand and budgets. Ecol. Indic. 2012, 21, 17–29. [Google Scholar] [CrossRef]
  11. Cáceres, D.M.; Tapella, E.; Quétier, F.; Díaz, S. The social value of biodiversity and ecosystem services from the perspectives of different social actors. Ecol. Soc. 2015, 20. [Google Scholar] [CrossRef]
  12. Manrique, M.; Benjumea, S.; Rodríguez, I.; Nieto, B.; Franky, S.; Sánchez, E.; Salamanca, M. Los Pueblos Indígenas en Colombia, Derechos, Políticas y Desafíos; UNICEF, Oficina de área para Colombia y Venezuela: Bogotá, DC, Colombia, 2011. [Google Scholar]
  13. Hoffmann, C.; Márquez, J.R.G.; Krueger, T. A local perspective on drivers and measures to slow deforestation in the Andean-Amazonian foothills of Colombia. Land Use Policy 2018, 77, 379–391. [Google Scholar] [CrossRef]
  14. Oteros-Rozas, E.; Martín-López, B.; González, J.A.; Plieninger, T.; López, C.A.; Montes, C. Socio-cultural valuation of ecosystem services in a transhumance social-ecological network. Reg. Environ. Chang. 2014, 14, 1269–1289. [Google Scholar] [CrossRef]
  15. Instituto de Hidrología, Meteorología y Estudios Ambientales (IDEAM), Instituto Alexander Von Humboldt (I. Humboldt), Instituto Geográfico Agustín Codazzi (IGAC), Instituto de Investigaciones Marinas y Costeras “José Benito Vives de Andréis” (Invemar), Ministerio de Ambiente y Desarrollo Sostenible. In Mapa de Ecosistemas Continentales, Costeros y Marinos de Colombia (MEC) [mapa]; Versión 2.1; escala 1:00.000; Instituto Geográfico Agustín Codazzi: Bogotá, Colombia, 2017.
  16. Cortolima. Agenda Ambiental del Municipio de Coyaima. 2011. Available online: https://www.cortolima.gov.co/sites/default/files/images/stories/centro_documentos/estudios/agendas/2011_Agenda_Ambiental_del_Municipio_de_Coyaima.pdf (accessed on 17 March 2020).
  17. Ministerio del Interior de Colombia (MIC), Plan de salvaguarda étnica del pueblo Pijao. Etapa de validación de información del proceso de diagnóstico y formulación de líneas de acción. Documento válido Comunidad Indígena Buena Vista Meche Municipio de Coyaima. 2014. Available online: https://siic.mininterior.gov.co/sites/default/files/upload/21_comunidad_buena_vista_meche_coyaima.pdf (accessed on 23 January 2020).
  18. Gobernación del Tolima. Estadísticas 2011–2014. Coyaima, Tolima, 2018. Available online: www.tolima.gov.co (accessed on 23 January 2020).
  19. DANE. Censo General 2005. 2010. Available online: www.dane.gov.co (accessed on 15 February 2020).
  20. González, R.; García, H.; Isaacs, P.; Cuadros, H.; López, R.; Rodríguez, N.; Pérez, K.; Mijares, F.; Castaño-Naranjo, A.; Jurado, R. Disentangling the environmental heterogeneity, floristic distinctiveness and current threats of tropical dry forests in Colombia. Environ. Res. Lett. 2018, 13, 045007. [Google Scholar] [CrossRef]
  21. Schmerbeck, J.; Fiener, P. Wildfires, ecosystem services, and biodiversity in tropical dry forest in India. Environ. Manag. 2015, 56, 355–372. [Google Scholar] [CrossRef]
  22. Snijders, T.A.B. Estimation on the basis of snowball samples: How to weight? Bull. Methodol. Sociol. 1992, 36, 59–70. [Google Scholar] [CrossRef]
  23. QSR International; NVivo Qualitative Data Analysis Software [Version 12]. 1999. Available online: https://qsrinternational.com/nvivo/nvivo-products (accessed on 13 May 2020).
  24. Eigenbrod, F.; Armsworth, P.R.; Anderson, B.J.; Heinemeyer, A.; Gillings, S.; Roy, D.; Thomas, K.; Gaston, K. The impact of proxy-based methods on mapping the distribution of ecosystem services. J. Appl. Ecol. 2010, 47, 377–385. [Google Scholar] [CrossRef]
  25. Escobedo, F.; Chacalo, A. Estimación preliminar de la descontaminación atmosférica por el arbolado urbano de la ciudad de México. Interciencia 2008, 33, 29–33. [Google Scholar]
  26. Escobedo, F.; Nowak, D. Spatial heterogeneity and air pollution removal by an urban forest. Landsc. Urban Plan 2009, 90, 102–110. [Google Scholar] [CrossRef]
  27. Hirabayashi, S. i-Tree Canopy Air Pollutant Removal and Monetary Value Model Descriptions. 2014. Available online: https://www.itreetools.org/documents/560/i-Tree_Canopy_Air_Pollutant_Removal_and_Monetary_Value_Model_Descriptions.pdf (accessed on 17 March 2020).
  28. i-Tree. i-Tree Sofware Suite v5.x. 2002. Available online: www.itreetools.org (accessed on 15 February 2020).
  29. Instituto de Hidrología, Meteorología y Estudios Ambientales (IDEAM). Mapas de Bosque No bosque Colombia—Área Continental (Escala Fina LANDSAT) [Mapas], Año 2005, 2010, 2012, 2013, 2014, 2015, 2016 & 2017, escala 1:8.500.000. 2016. Available online: www.ideam.gov.co/web/ecosistemas/superficie-cubierta-por-bosque-natural?p_p_id=110_INSTANCE_dqBGlv6hKQrD&p_p_lifecycle=0&p_p_state=normal&p_p_mode=view&p_p_col_id=column-2&p_p_col_pos=1&p_p_col_count=2&_110_INSTANCE_dqBGlv6hKQrD_struts_action=%2Fdocument_ (accessed on 13 May 2020).
  30. AGRONET. Área Sembrada, área Cosechada, Producción y Rendimiento del Cultivo Según Municipio 2007–2017. 2018. Available online: www.agronet.gov.co (accessed on 20 May 2020).
  31. Houska, T.R.; Johnson, A.P. GloVis (No. 137). US Geological Survey. 2012. Available online: https://pubs.usgs.gov/gip/137/ (accessed on 17 March 2020).
  32. R Core Team. R: A Language and Environment for Statistical Computing; R Foundation for Statistical Computing: Vienna, Austria, 2013. [Google Scholar]
  33. Martín, B.; Iniesta, I.; García, M.; Palomo, I.; Casado, I.; García, D.; Gómez, E.; Oteros, E.; Palacios, I.; Willaarts, B.; et al. Uncovering Ecosystem Service Bundles through Social Preferences. PLoS ONE 2012, 7, e38970. [Google Scholar] [CrossRef] [Green Version]
  34. Pineda-Guerrero, A.; Escobedo, F.J.; Carriazo, F. Governance, Nature’s Contributions to People, and Investing in Conservation Influence the Valuation of Urban Green Areas. Land 2021, 10, 14. [Google Scholar] [CrossRef]
  35. Depietri, Y.; Orenstein, D.E. Fire-regulating services and disservices with an application to the Haifa-Carmel region in Israel. Front. Environ. Sci. 2019, 7, 107. [Google Scholar] [CrossRef] [Green Version]
  36. Contraloría del Tolima. Informe definitivo auditoría ambiental especial vigencia 2014. 2015. Available online: http://contraloriatolima.gov.co/webcontraloria/documentos/2015/informes/inf_ambiental_coyaima_2014.pdf (accessed on 20 May 2020).
  37. Cortes, A. Resguardos Indígenas en la Conservación: Territorios en Traslape. 2018. Available online: https://bdigital.uexternado.edu.co/bitstream/001/682/1/DHA-spa-2018-Resguardos_indigenas_en_la_conservacion_territorios_en_traslape.pdf (accessed on 13 June 2020).
  38. Fernandez, M.E. Efectos del Cambio ClimáTico en el Rendimiento de tres Cultivos Mediante el uso del Modelo AquaCrop. Informe Final; 2013. Available online: http://www.ideam.gov.co/documents/21021/21138/Informe+Final_+Efectos+del+CC+en+el+rendimiento+de+cultivos+agrícolas.pdf/77713cce-eef6-4eb9-9ad6-02985c72b76b (accessed on 13 June 2021).
Figure 1. Study area: (A) Tolima Department (red) in Colombia; (B) Municipality of Coyaima (green) within the Tolima Department, red; (C) land use land cover of Coyaima municipality [15].
Forests 12 00919 g001
Figure 2. (A) The main ecosystem services and (B) main ecosystem disservices identified by respondents in Coyaima, Colombia (n = 361).
Forests 12 00919 g002
Figure 3. Drivers of ecosystem change reported in Coyaima, Colombia and the number of respondents. We report the percent total responses for the two most reported drivers (n = 361).
Forests 12 00919 g003
Figure 4. (A) Trends in the supply of the air purification ES in the municipality of Coyaima, Colombia during 2005–2017.CO: green, NO2: orange, O3: red, PM10: blue, PM2.5: brown, SO2: purple, and total: black. (B) Loss of forest cover (ha) during 2005–2017 in Coyaima, Colombia.
Forests 12 00919 g004
Figure 5. (A) Supply of the ES food production between 2007–2017 in Coyaima (t/ha). (B) Total area planted for the five crops listed, in Coyaima, Colombia (Note: data unavailable for 2005 and 2006).
Forests 12 00919 g005
Figure 6. Veredas (thin black line polygons) that identified fires as a key ecosystem disservice in Coyaima (thick black line polygon), Colombia. Note: the number of burned hectares (BH) in 2017 and the number of people (NP) in each vereda who identified fires as the main ecosystem disservice in the survey are also reported.
Forests 12 00919 g006
Figure 7. Veredas that identified fires as one of the main drivers of change in Coyaima, Colombia. Note: the number of burned hectares (BH) in 2017 and the Number of People (NP) in each vereda who identified fires as the main driver of change in the survey are also reported.
Forests 12 00919 g007
Table 1. Estimated rates of annual pollution removal by forested areas (g/m2) used in our modelling methods (see Section 2.3).
PollutantMinimum
(g/m2)
Average
(g/m2)
Maximum
(g/m2)
CO0.1+0.4NA
NO20.50.71.5
O31.6 *4.8 *8.4 *
PM102.2 *5.6 *8.7 *
PM2.5NA0.3 +NA
SO20.40.61.6
Total4.812.120.2
Note: The proxy removal rates are based on * Mexico City, + USA and Santiago de Chile (See [25,26,27]).
Table 2. Characteristics of the surveyed population in Coyaima, Colombia.
CategoryCharacteristicsPeople
(n)
Proportion
(%)
SexMale16746
Female19454
Age<18 years5114
18–3010429
31–458624
45–608122
>603911
EducationNone185
Preschool103
Primary school8824
High school17749
Technician3911
Professional298
OccupationAgriculture349
Commerce8523
Government185
Transport185
Education123
Health system64
Household management8323
Various trades246
Others or none8122
Affiliation with an indigenous reservation/councilIndigenous reservation17548
Indigenous council134
None17348
Place of BirthCoyaima21760
Other14440
Place of
residence
Coyaima27475
Other place8725
Rural or urban residenceRural15255
Urban12245
Table 3. Estimated annual amount of air pollutants removal in tons (t) from forest cover in the Coyaima Colombia from 2005 to 2017. Minimum and maximum values are reported in parentheses.
Annual Air Pollution Removal (t)
YearCONO2O3PM10PM2.5SO2Total
20055.35
(1.35–n/a)
9.36
(6.69–20)
64
(21–112)
74
(29–116)
3.58.0
(5.3–21)
164.3
20104.04
(1.02–n/a)
7.07
(5.05–15)
48
(16–84)
56
(22–87)
2.76.0
(4.0–16.1)
123.8
20123.97
(1.00–n/a)
6.95
(4.96–14.9)
47.6
(15.9–83)
55.6
(21.8–86.3)
2.655.95
(3.97–16)
122.7
20133.95
(0.99–n/a)
6.91
(4.94–14.8)
47.4
(15.8–82)
55.3
(21.7–86)
2.635.92
(3.95–15.8)
122.1
20143.92
(0.99–n/a)
6.87
(4.91–14.7)
47.1
(15.7–82)
54
(21.6–85)
2.625.89
(3.92–15.7)
120.4
20153.85
(0.97–n/a)
6.74
(4.82–14.4)
46.2
(15.4–80)
53
(21.2–83)
2.575.78
(3.85–15.4)
117.8
20163.76
(0.95–n/a)
6.59
(4.71–14.1)
45.2
(15.1–79)
52.7
(20.8–82)
2.515.61
(3.76–15.1)
116.4
20173.76
(0.94–n/a)
6.58
(4.70–14.1)
45.1
(15–78)
52.6
(20.6–81)
2.506.64
(3.76–15)
116.1
Publisher’s Note: MDPI stays neutral with regard to jurisdictional claims in published maps and institutional affiliations.

