Construction and Optimization of an Urban Ecological Security Pattern Based on Habitat Quality Assessment and the Minimum Cumulative Resistance Model in Shenzhen City, China

 ,
,
Abstract
:1. Introduction
2. Materials and Methods
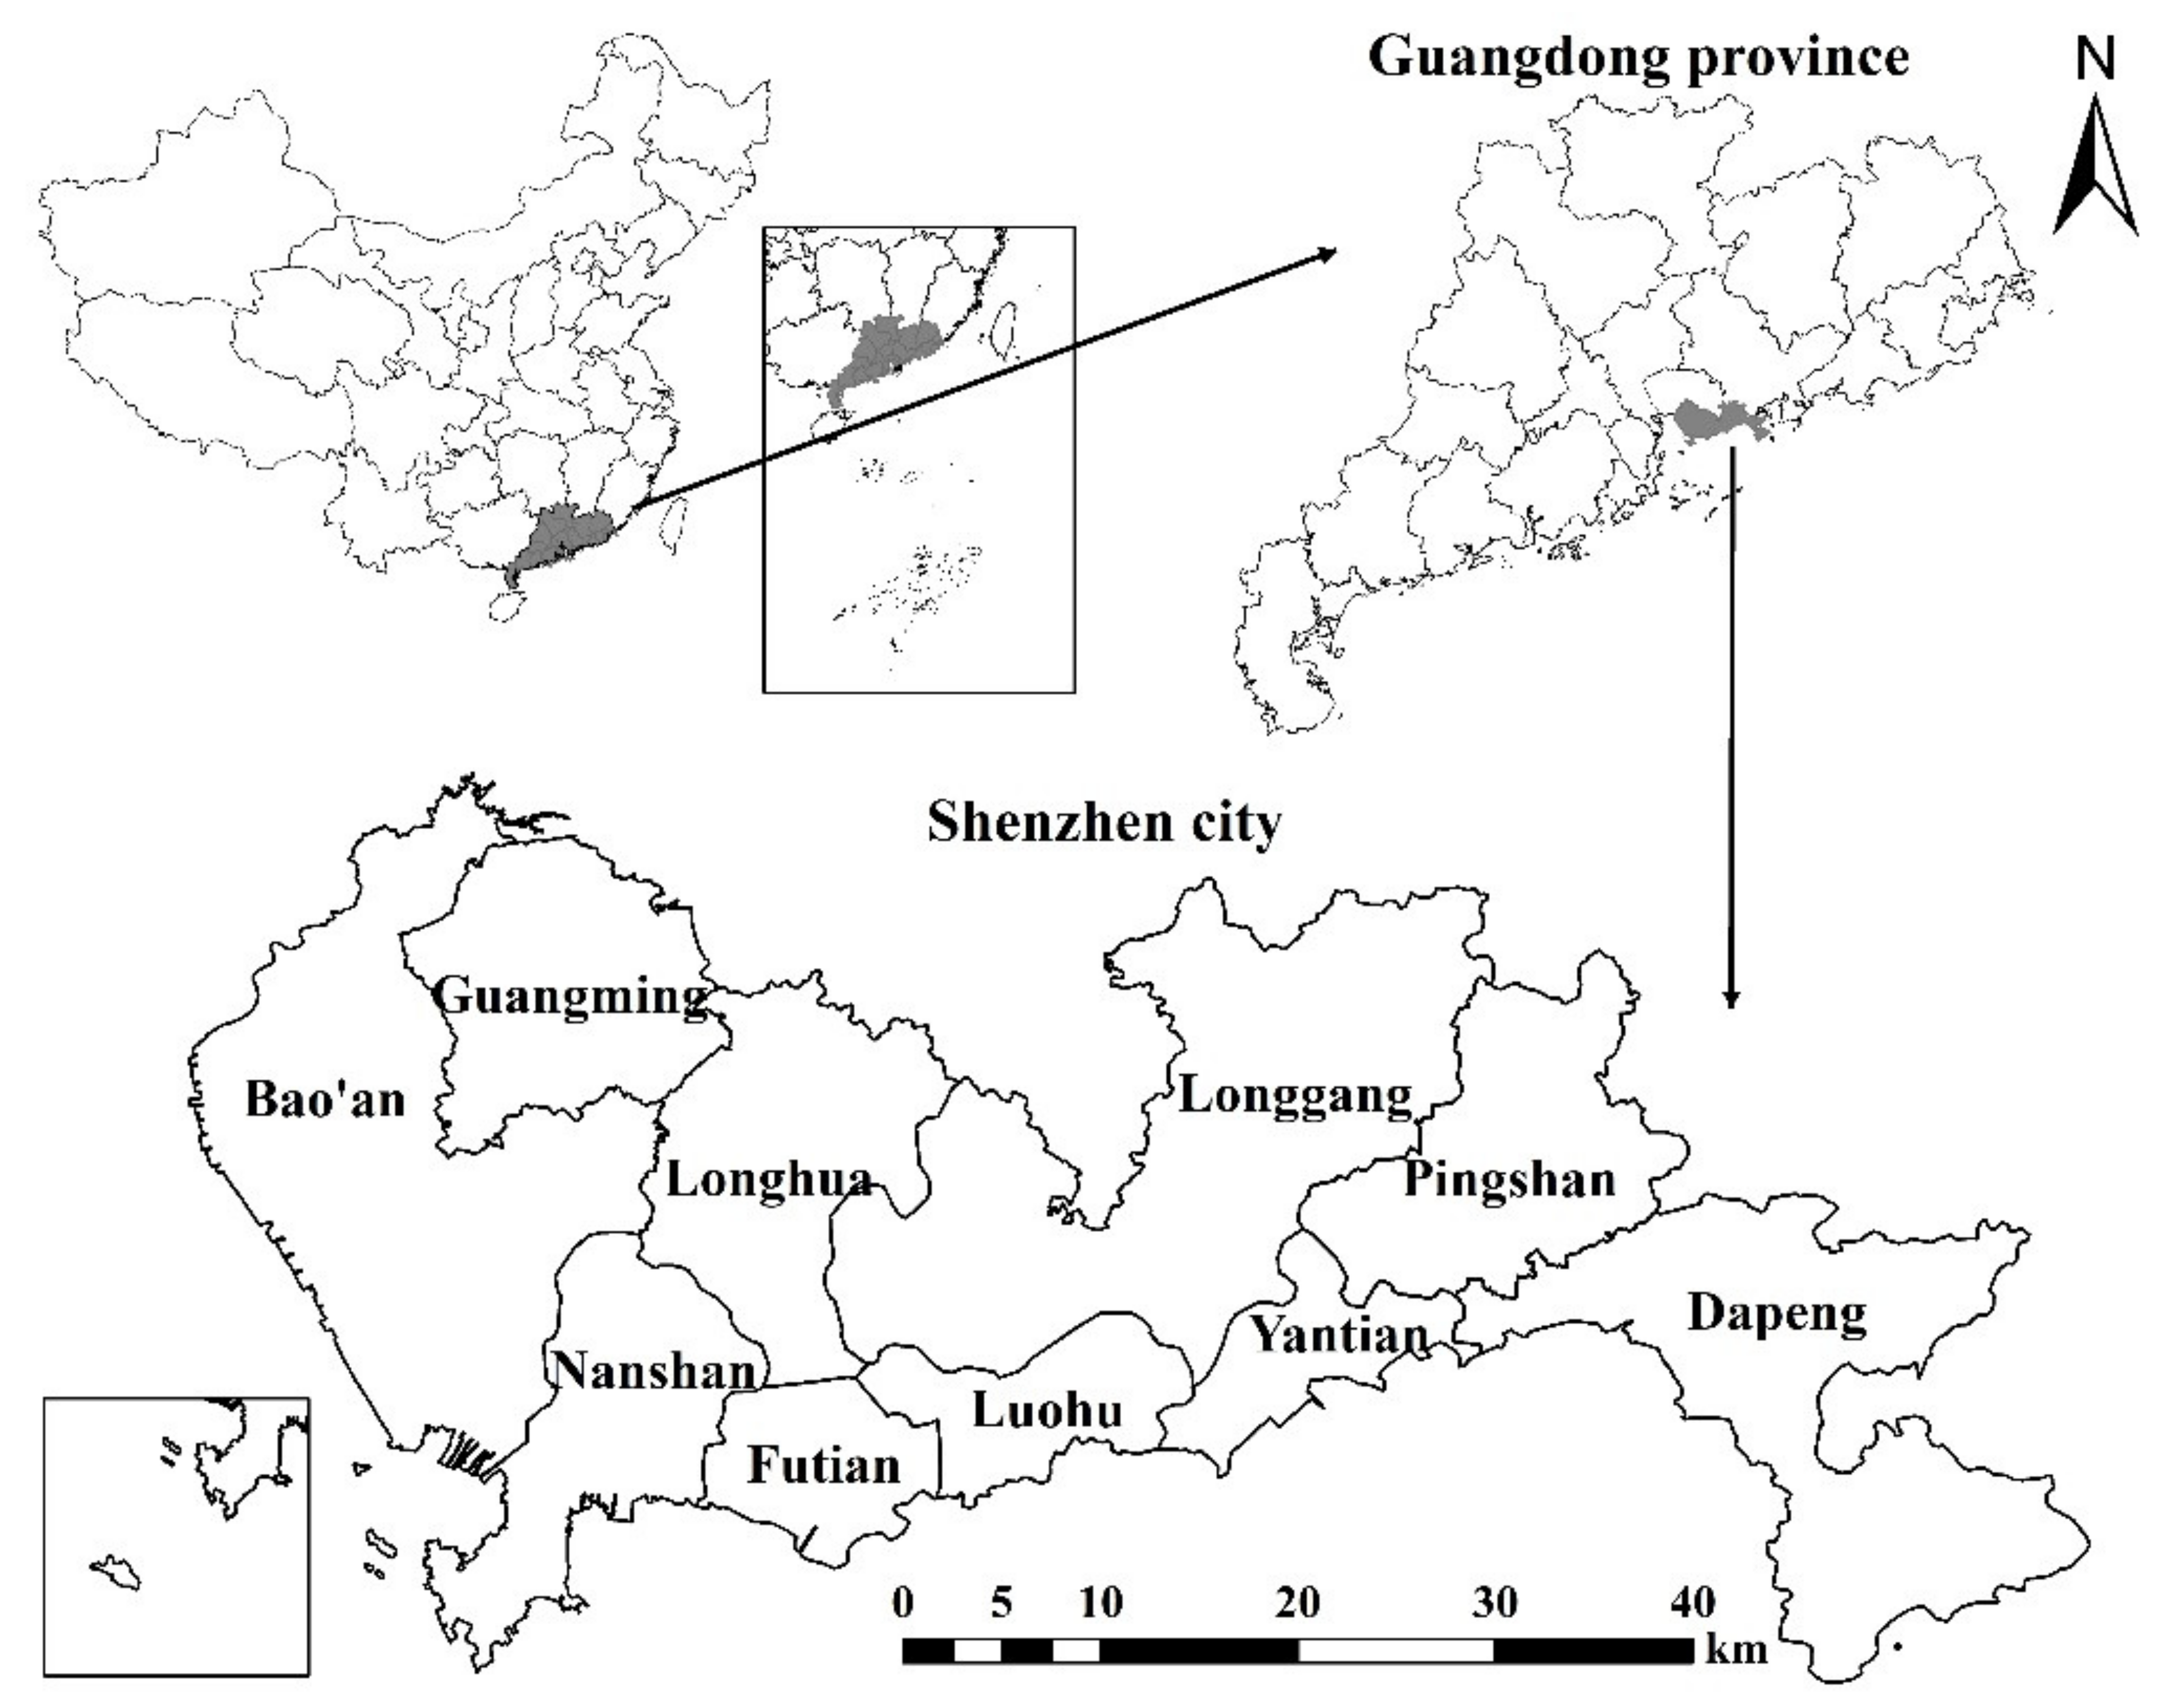
2.1. Study Area and Data Sources
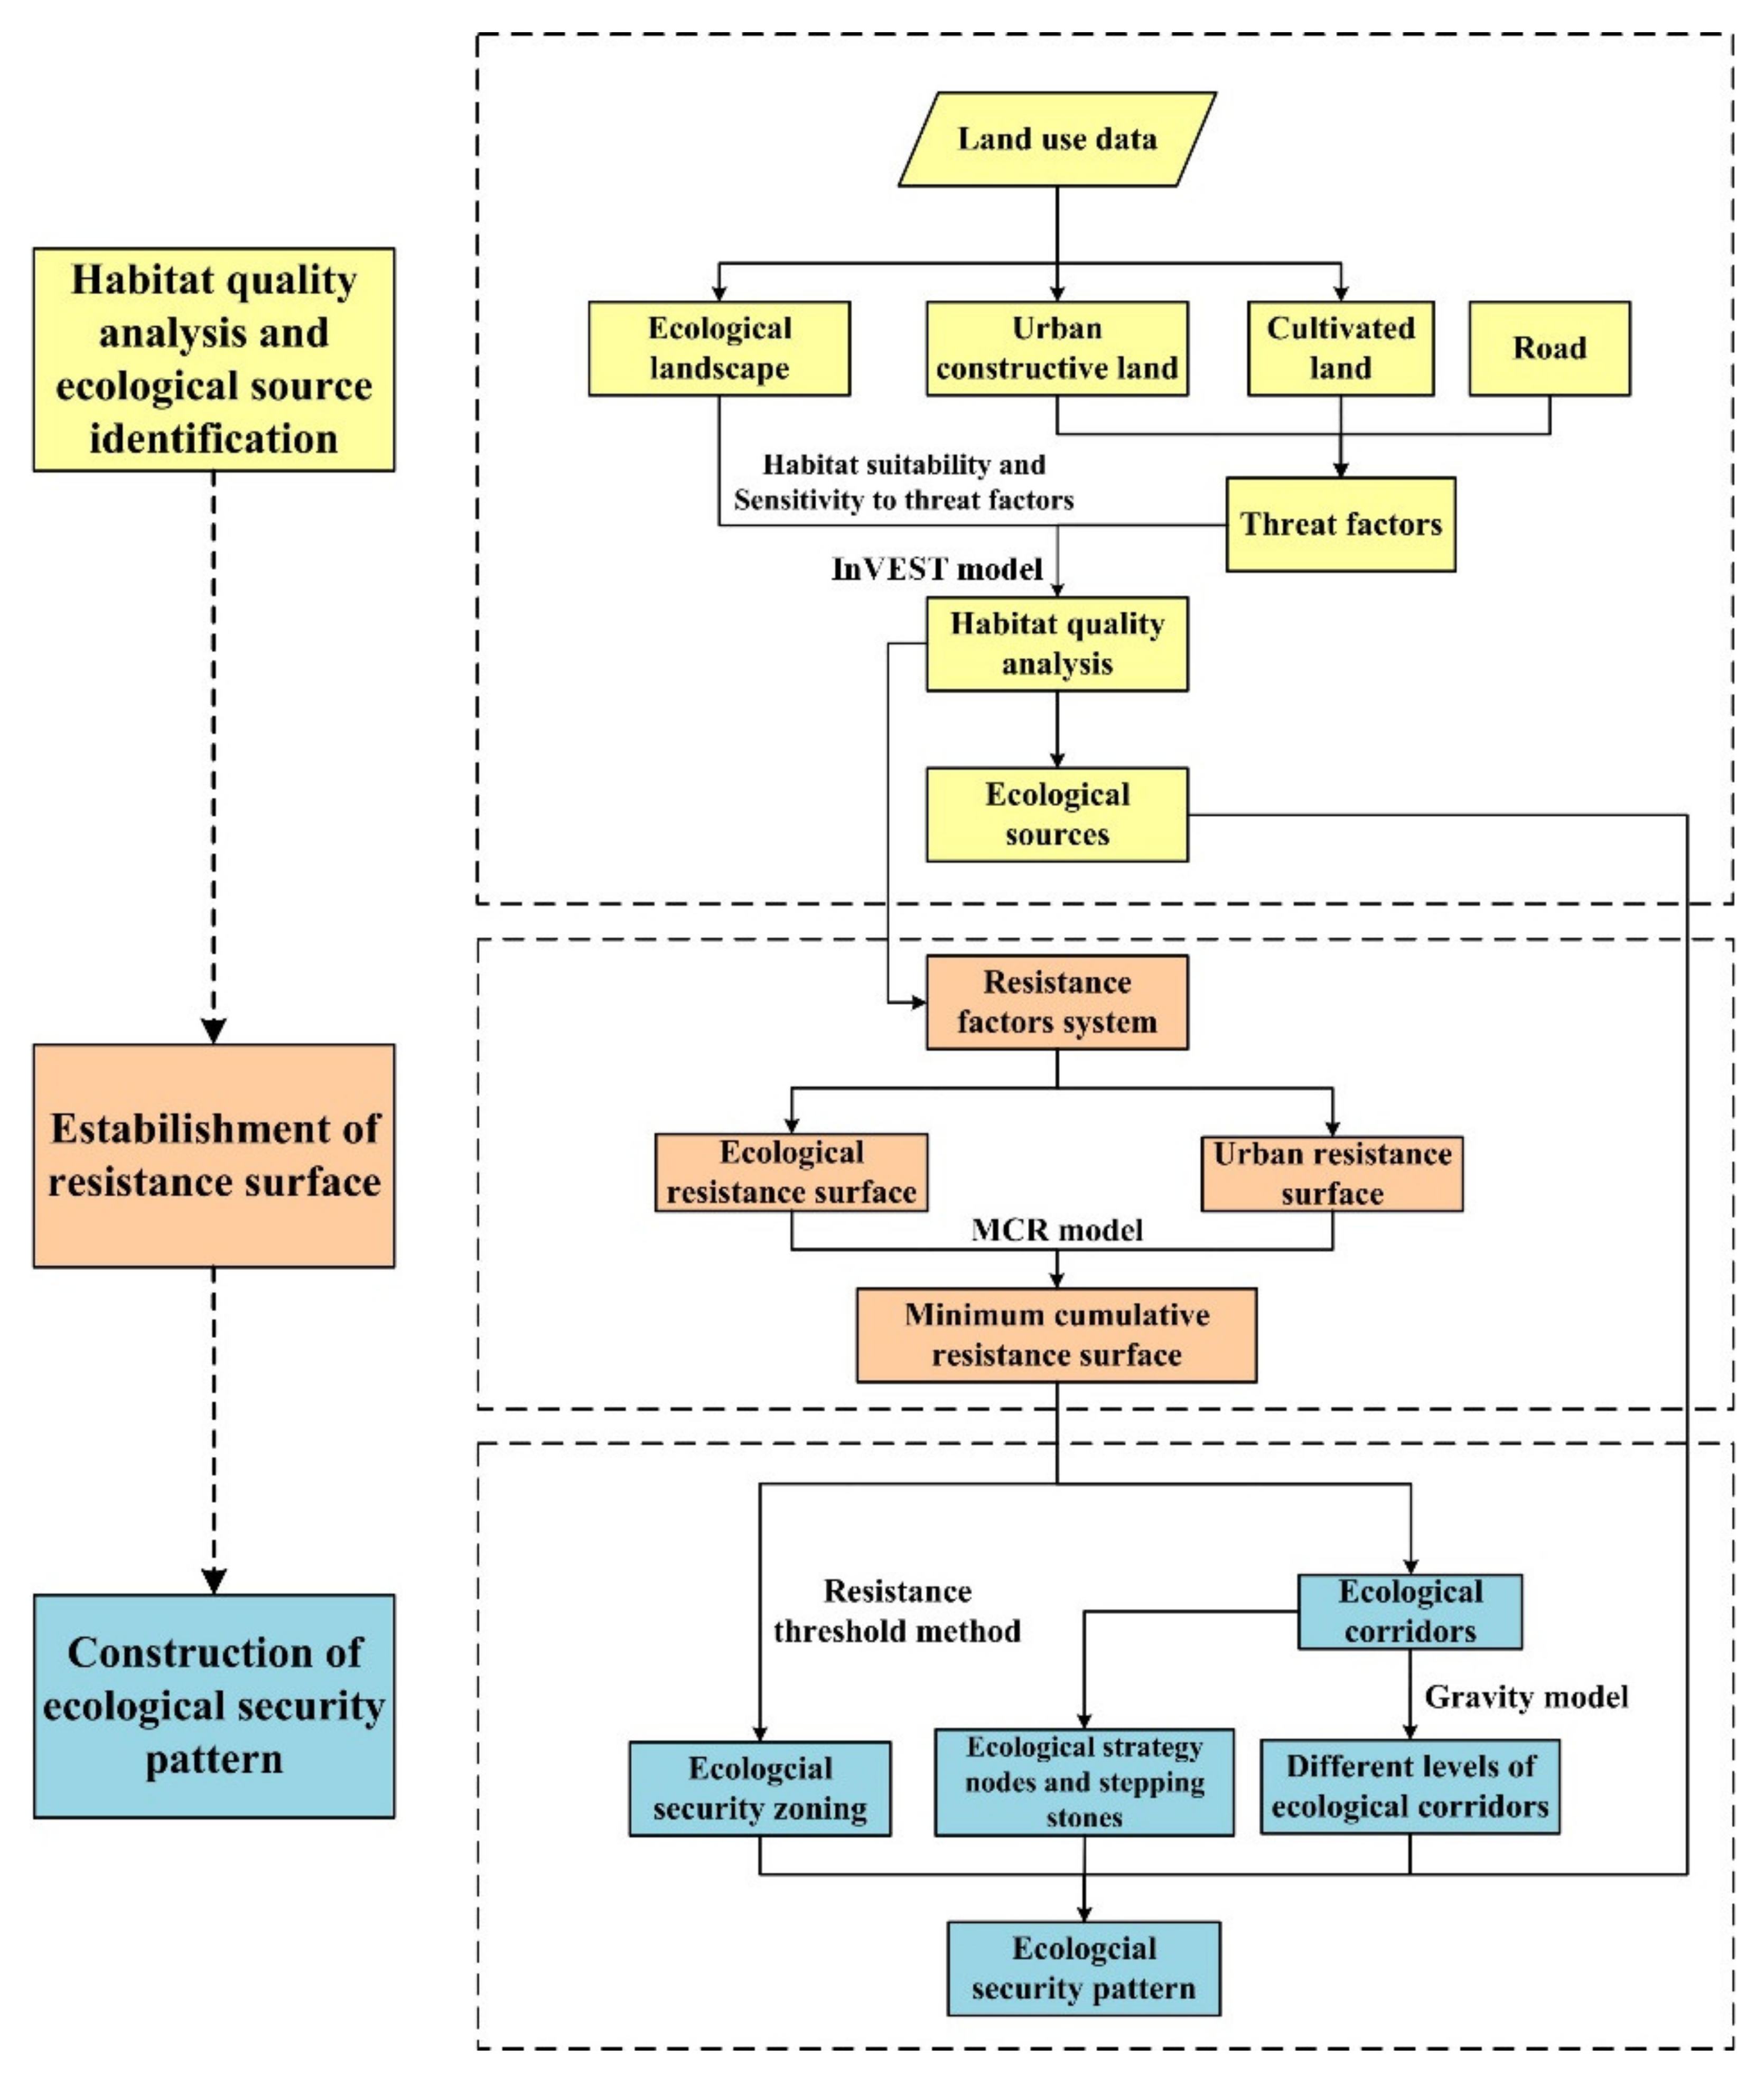
2.2. Assessment of Habitat Quality and Source Identification
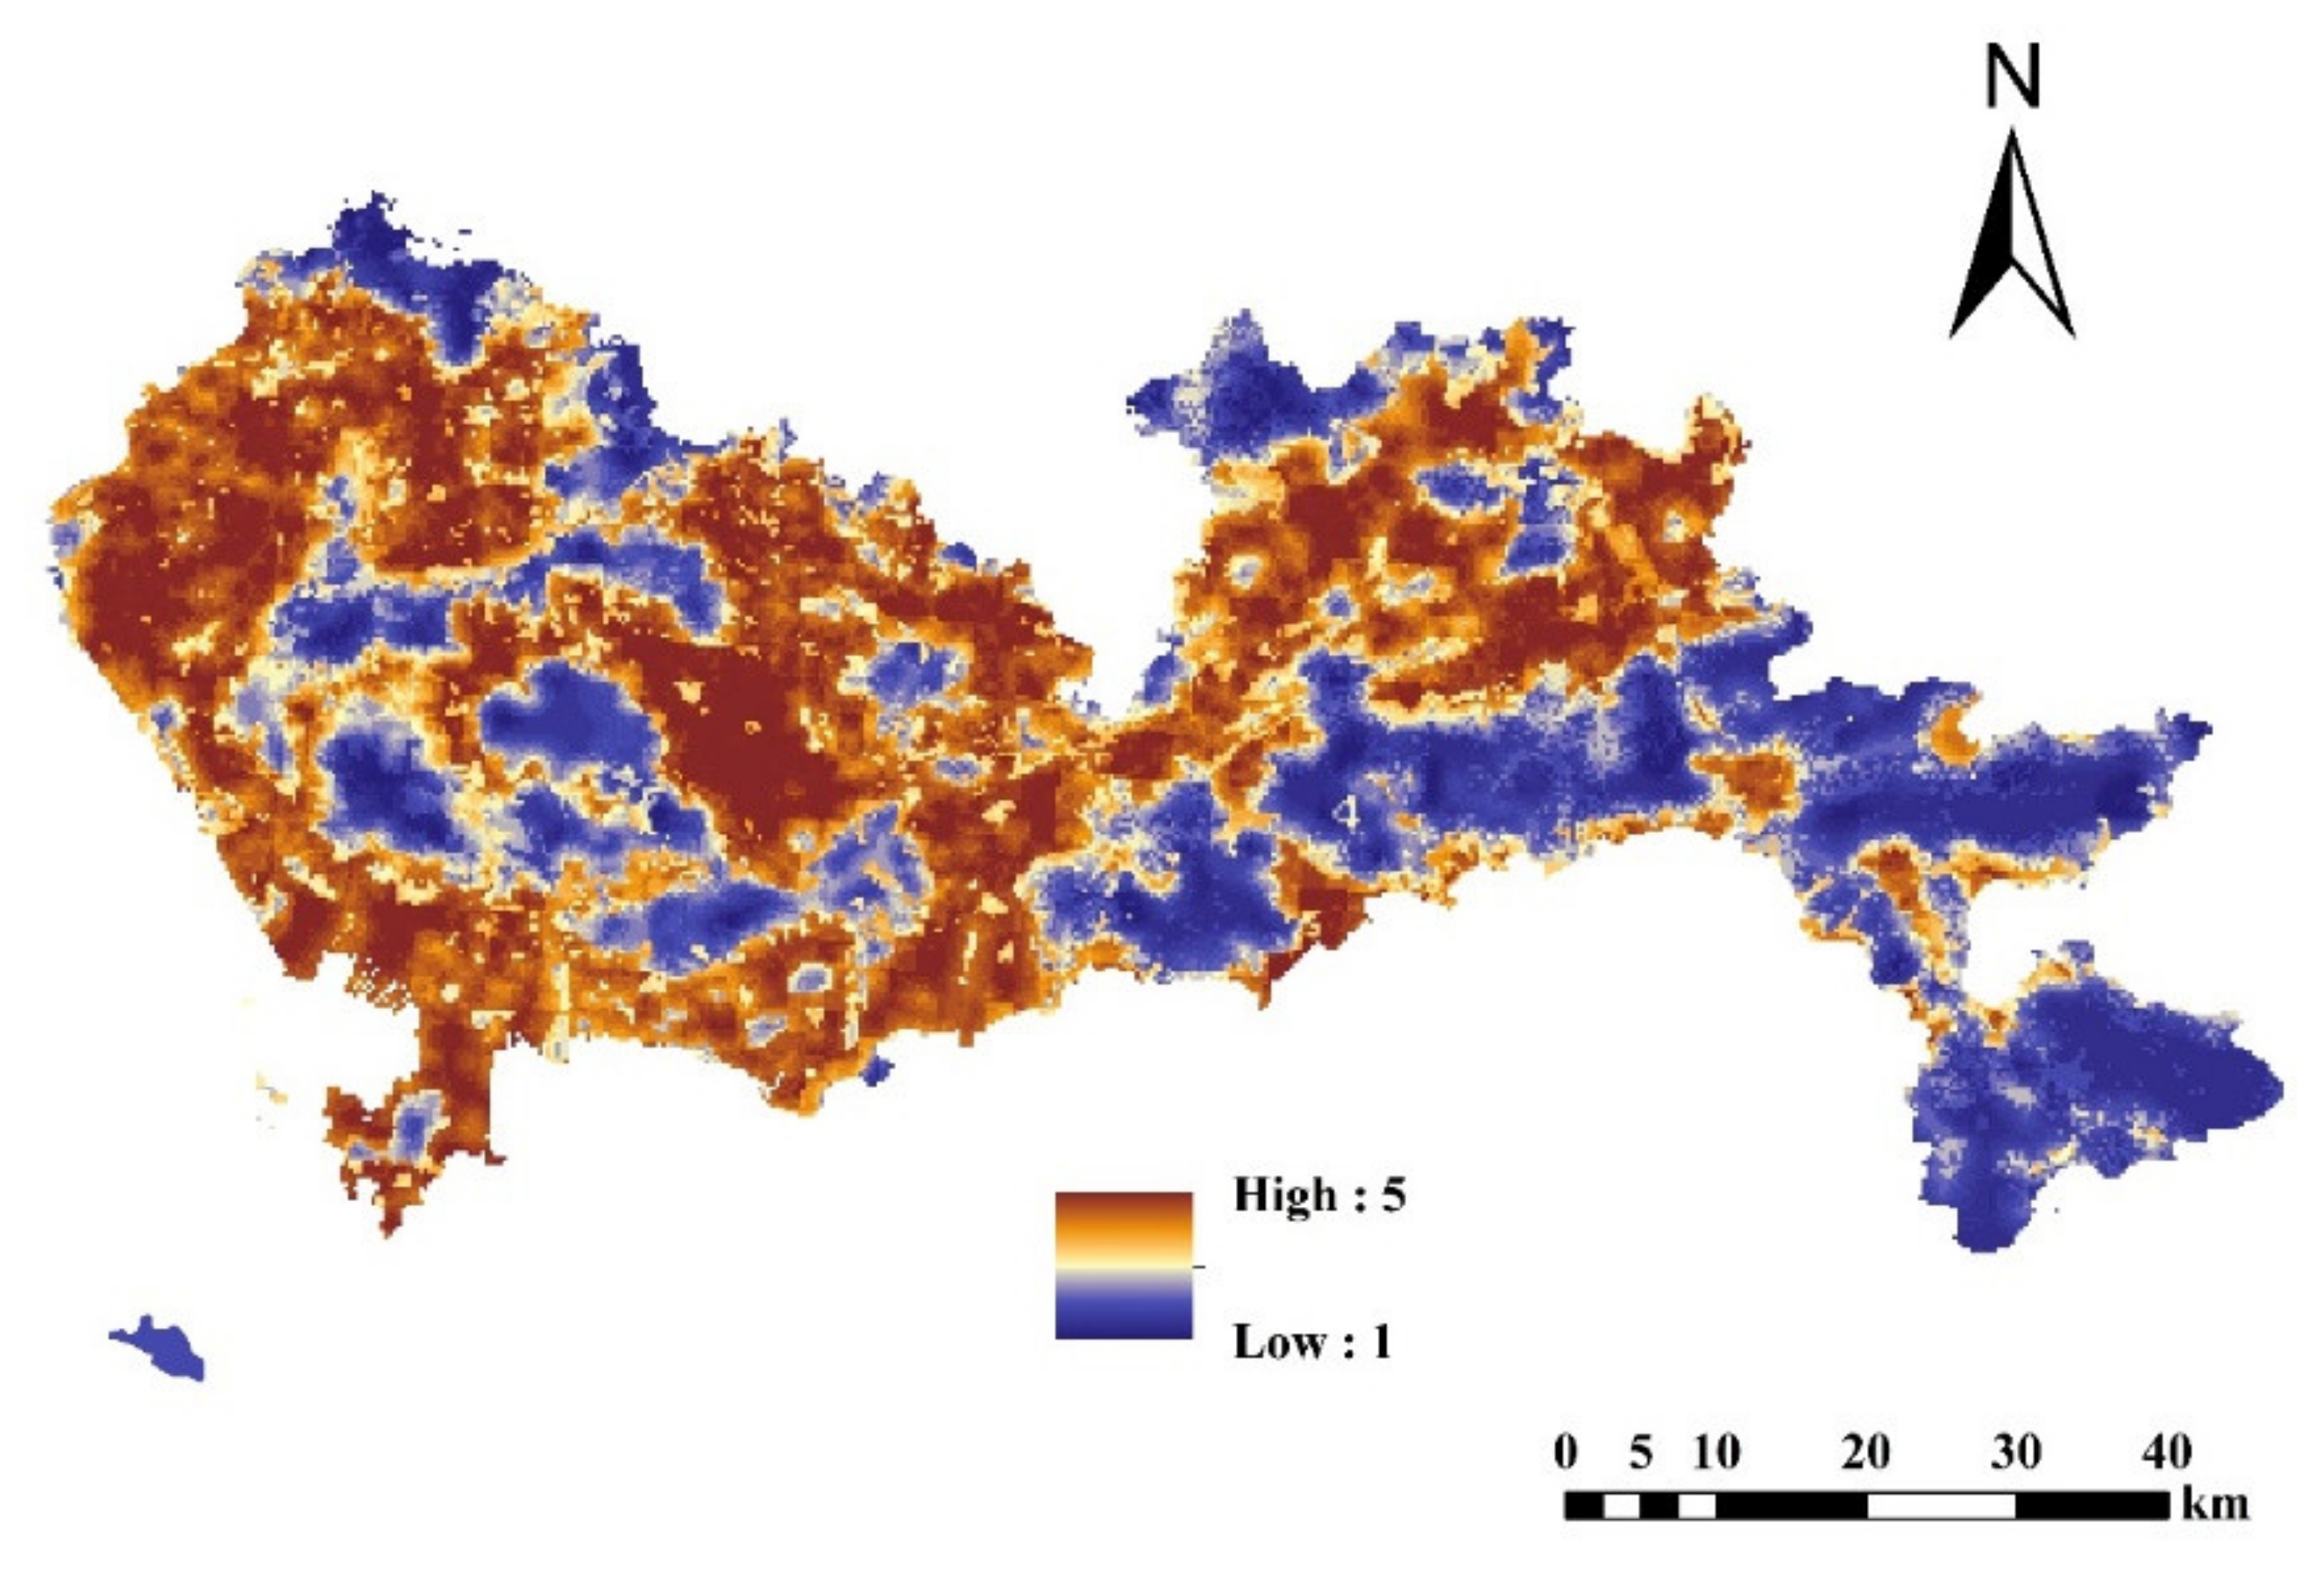
2.3. Establishment of Resistance Surface
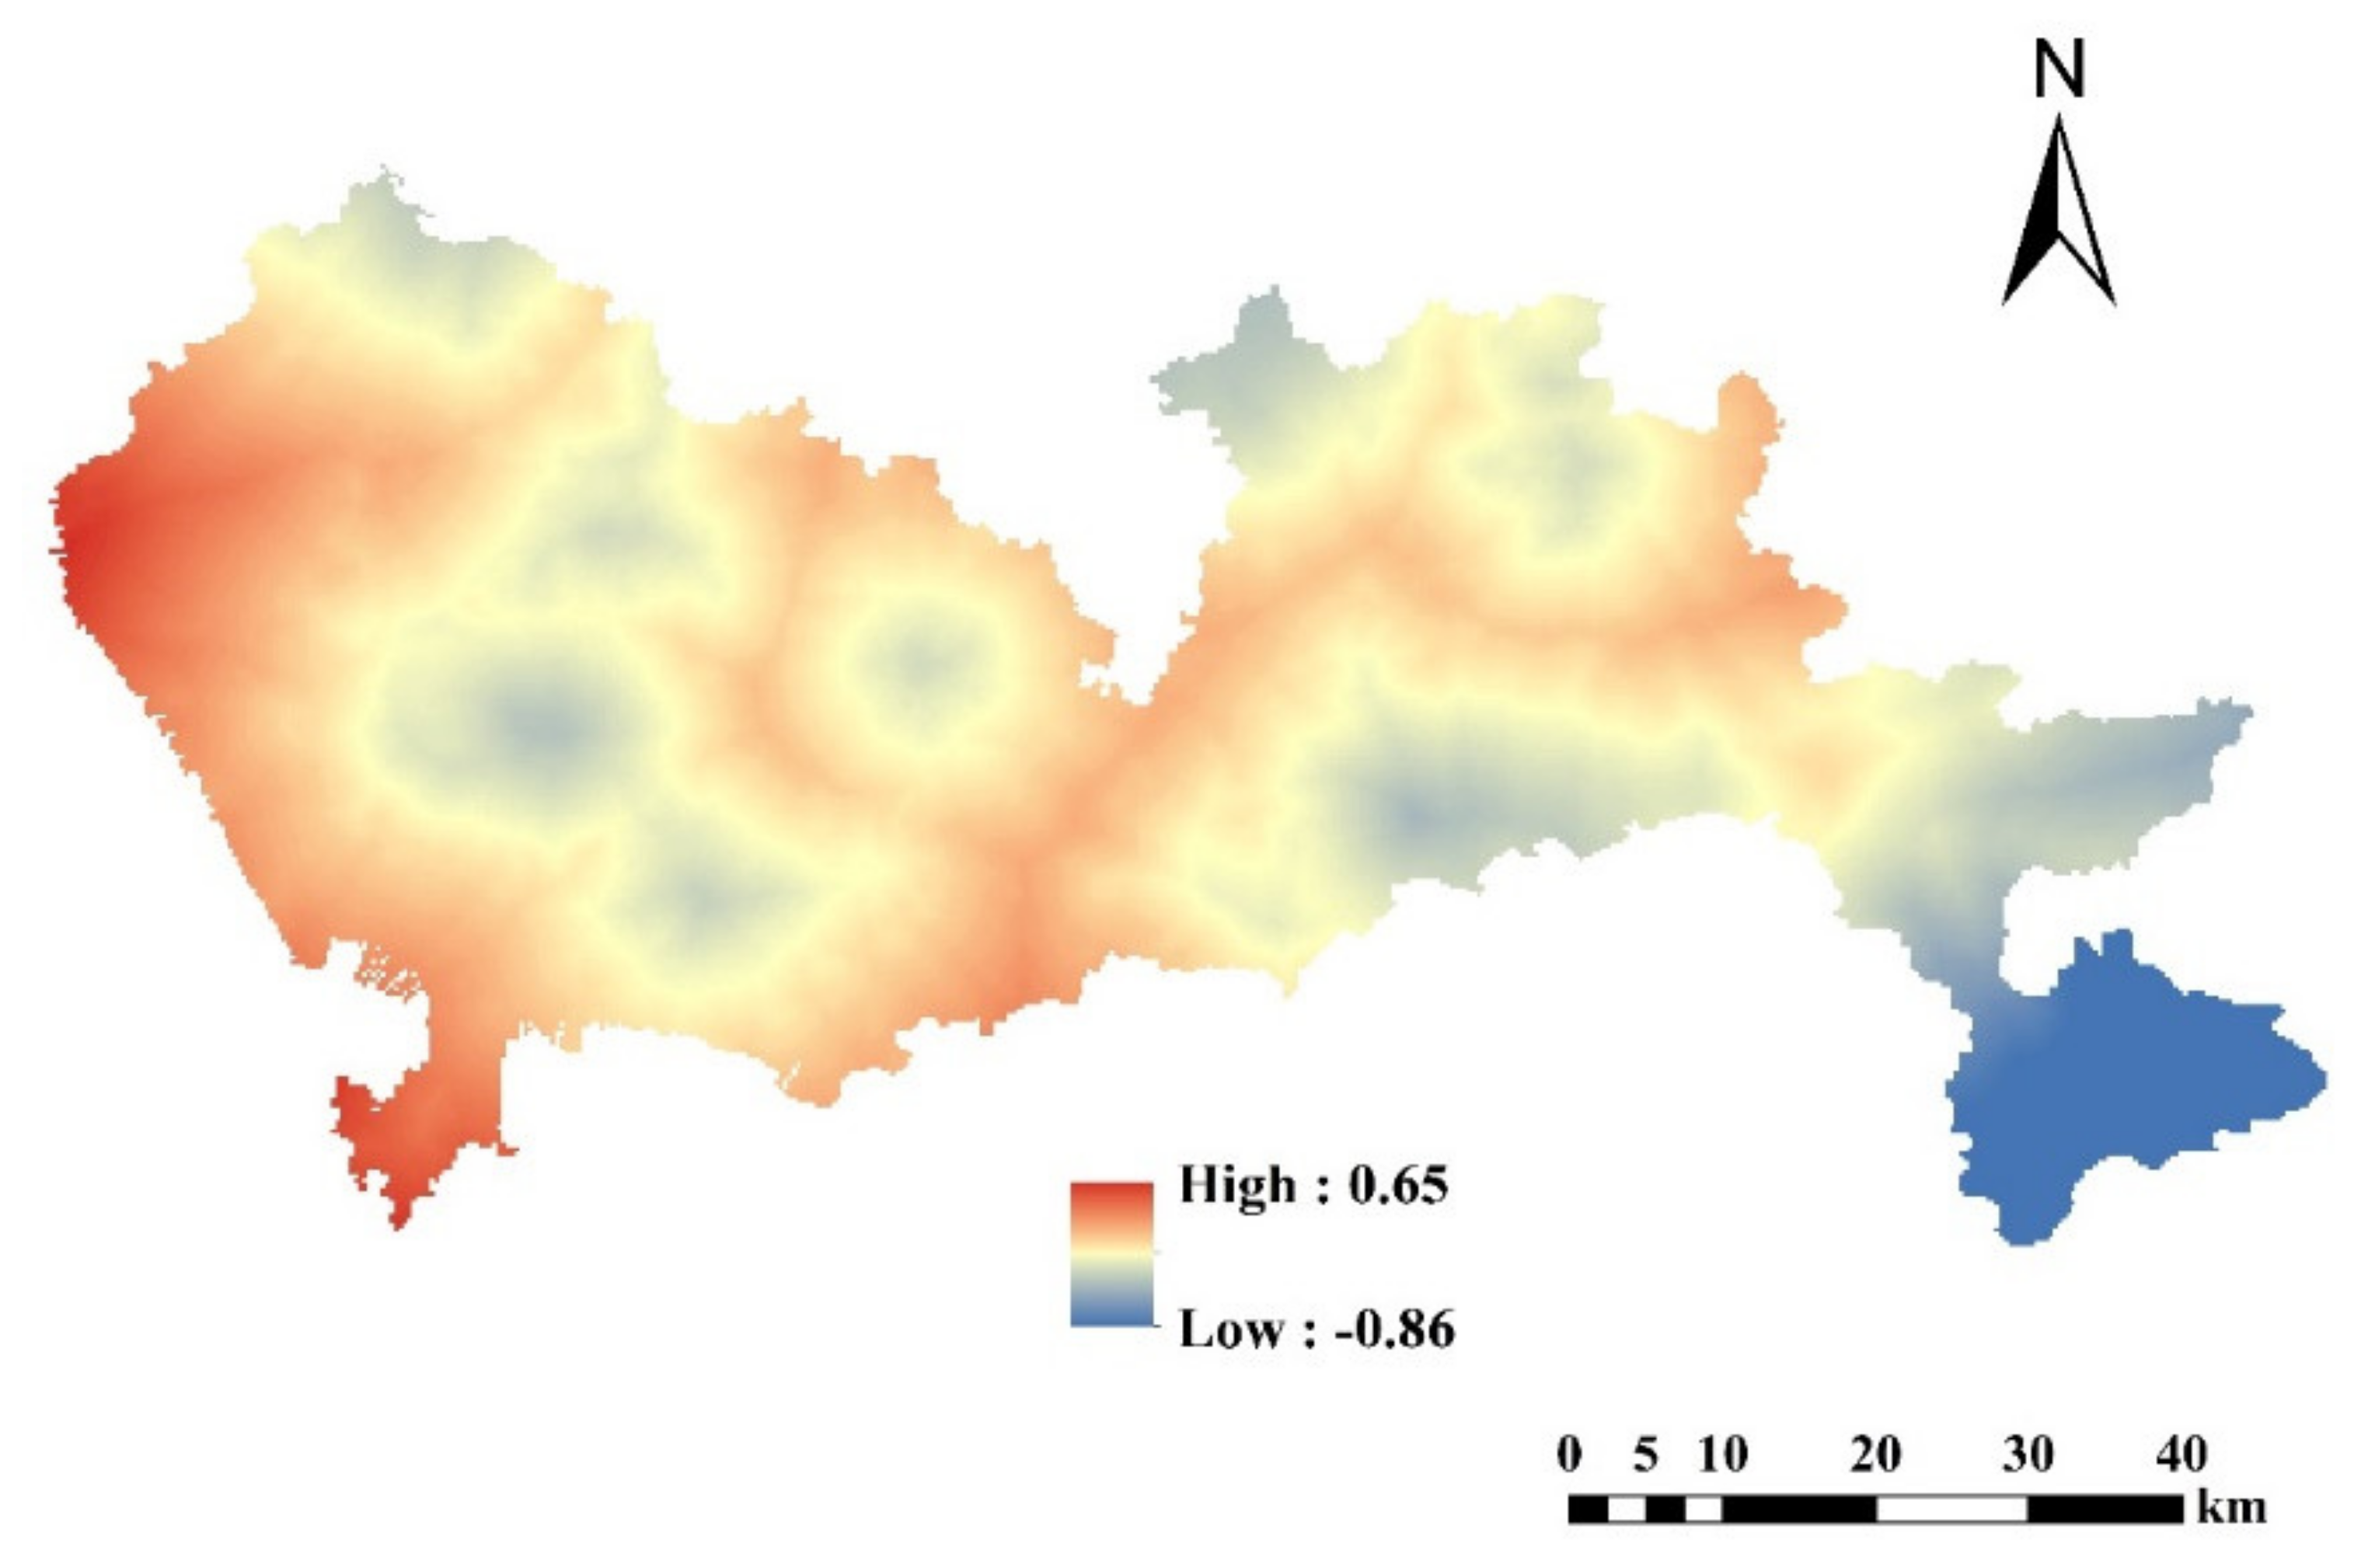
2.4. Division of Ecological Security Zones
2.5. Extraction of Ecological Corridors
2.6. Construction of the Ecological Security Pattern
3. Results
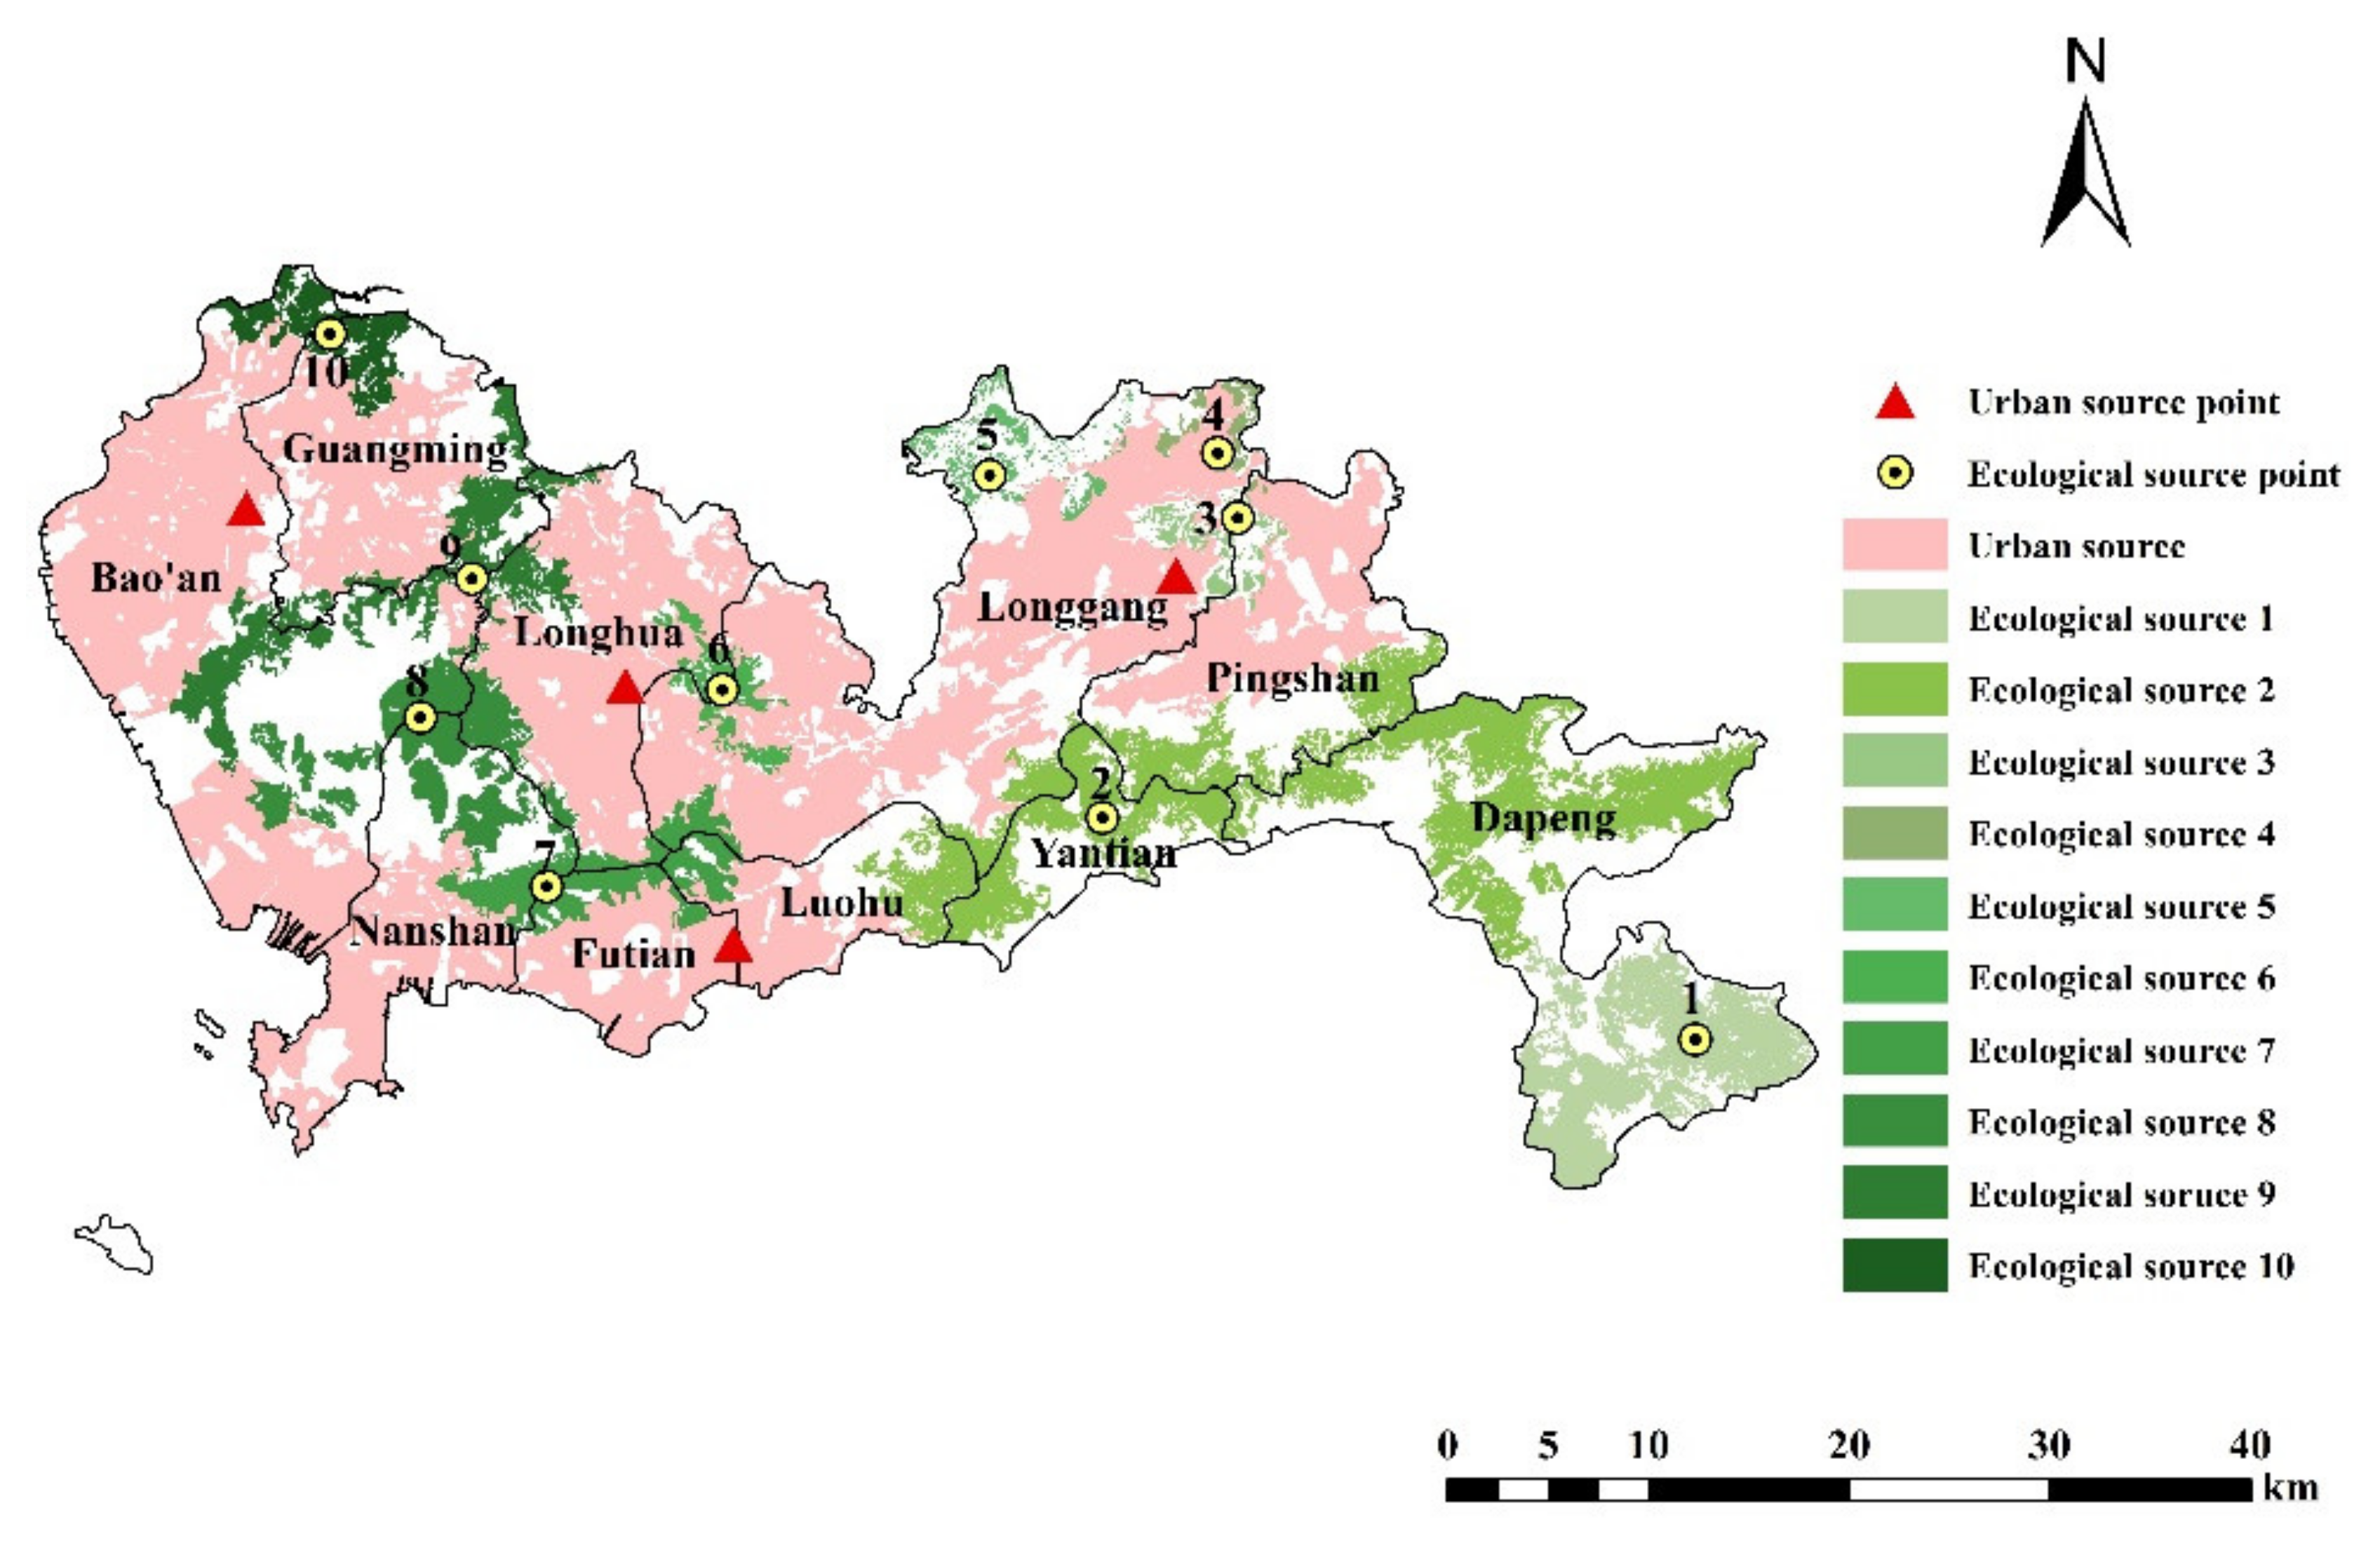
3.1. Habitat Quality Assessment and Source Identification
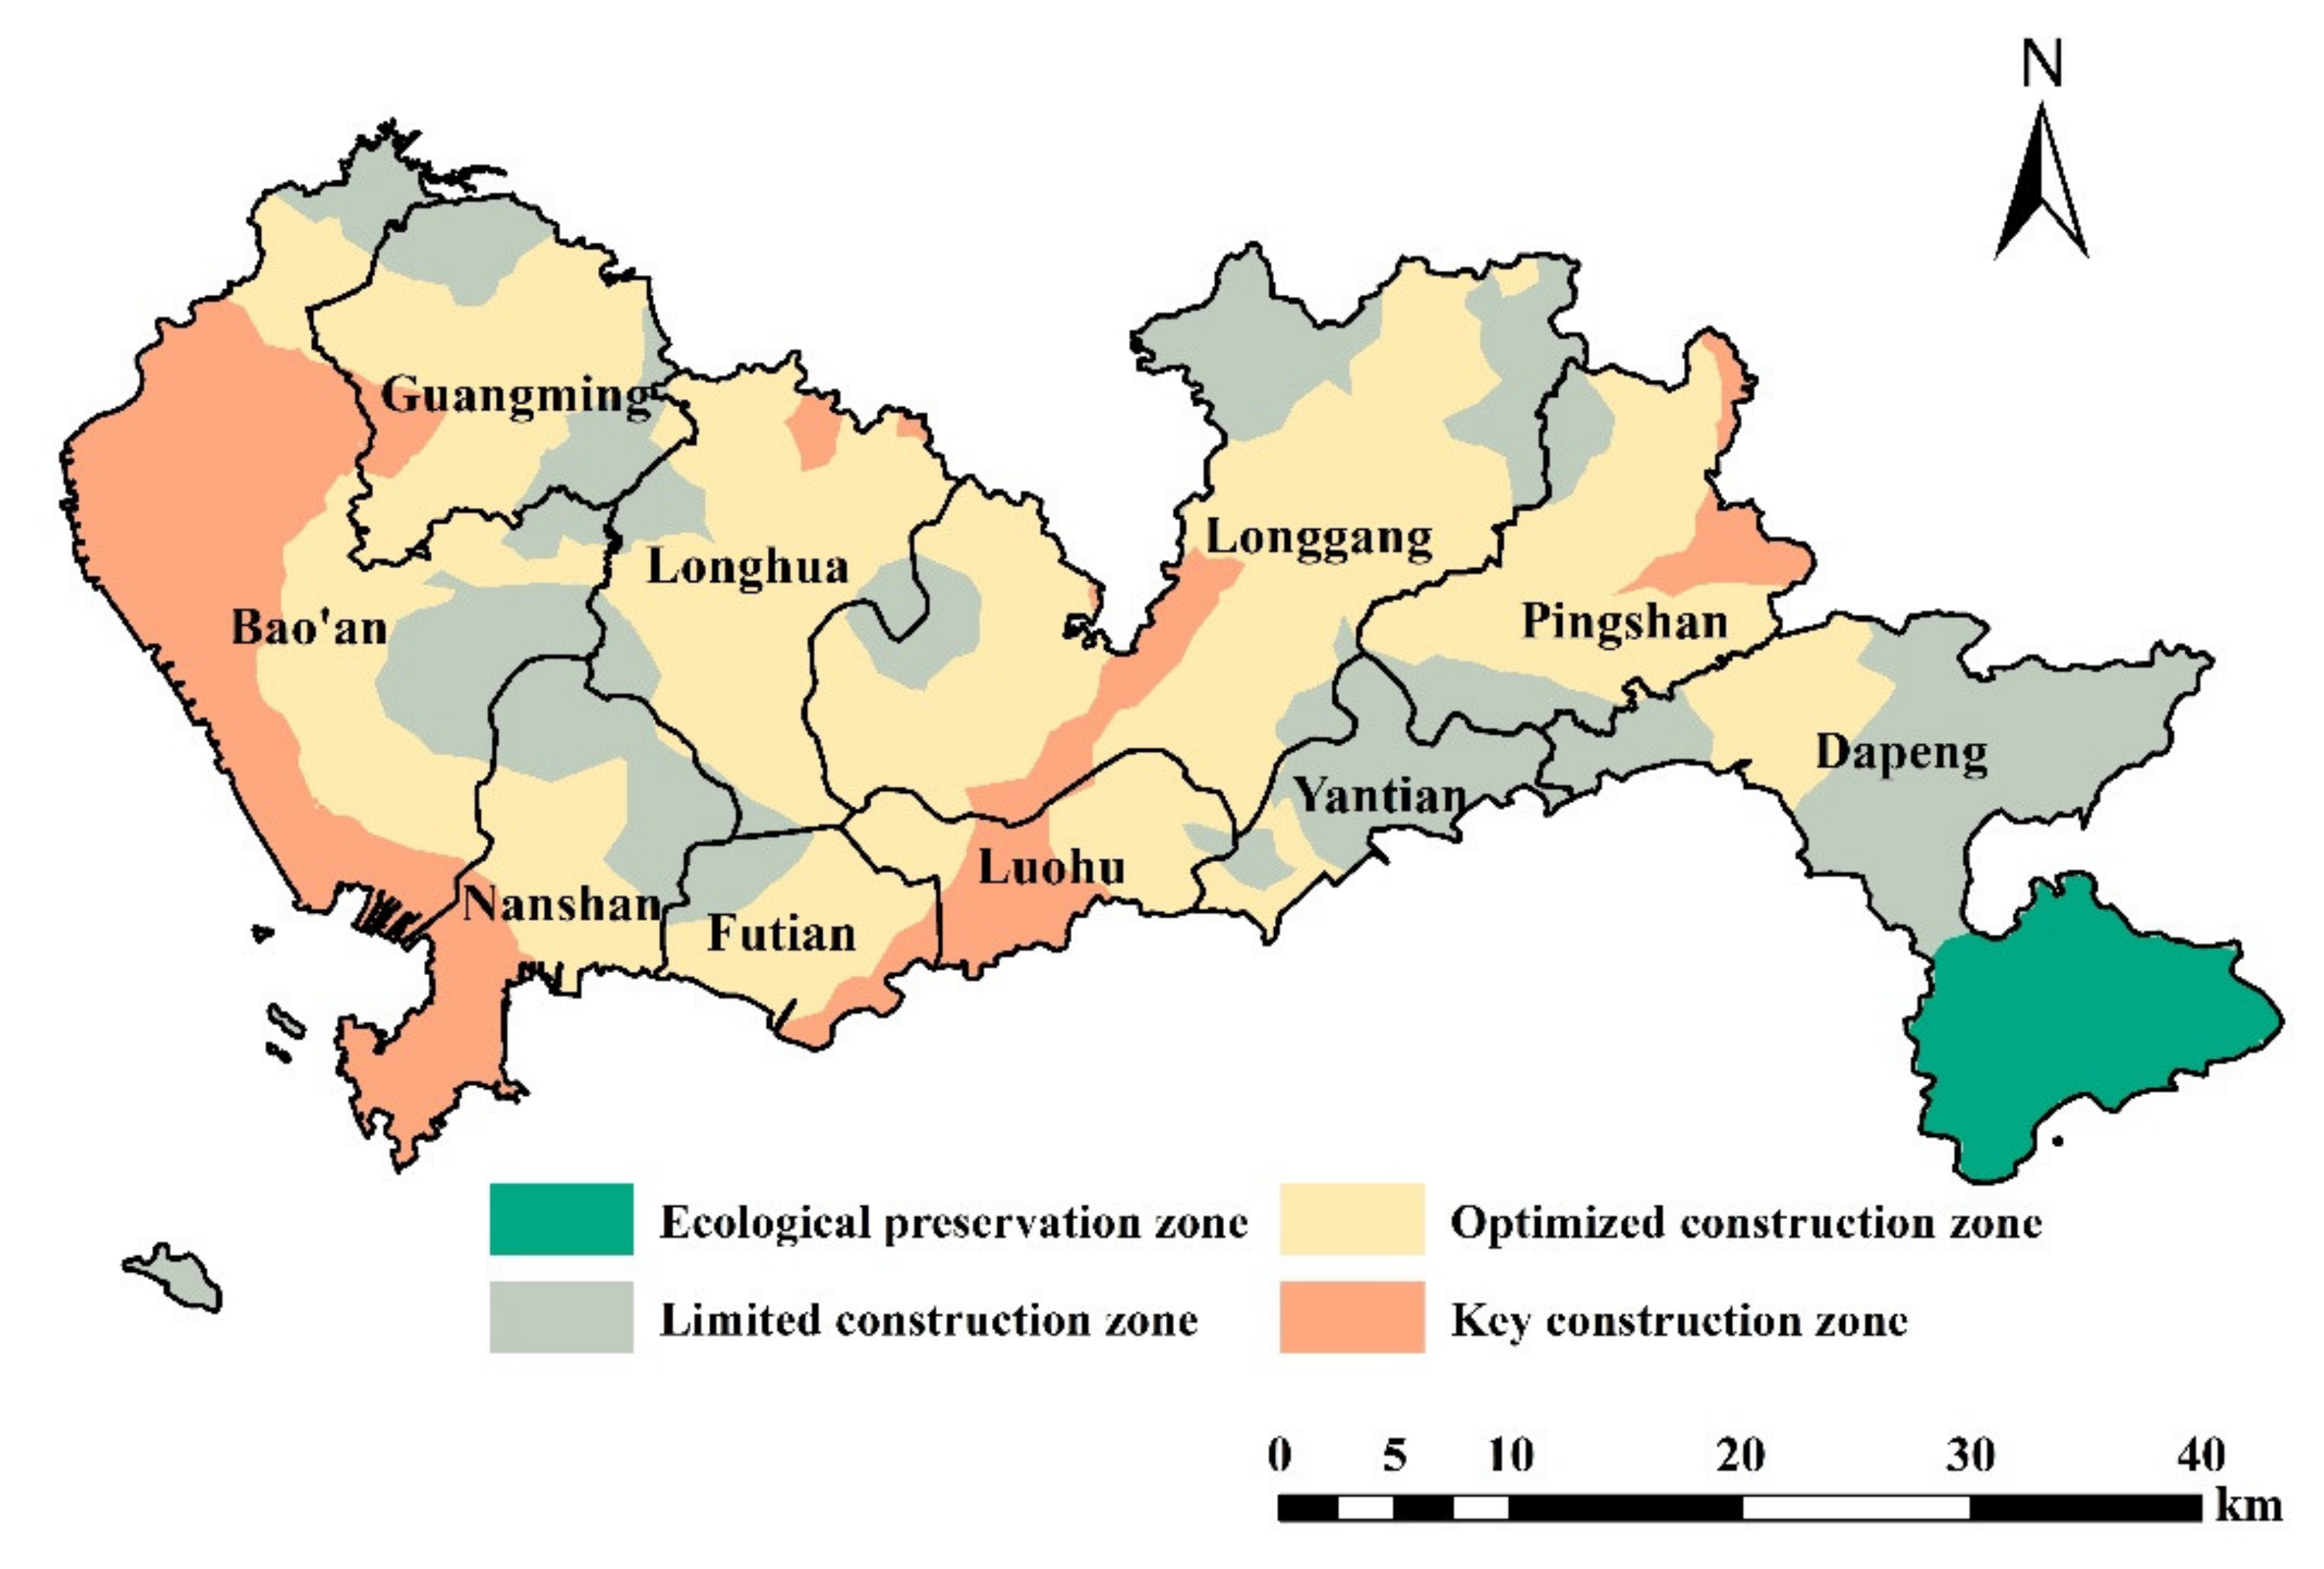
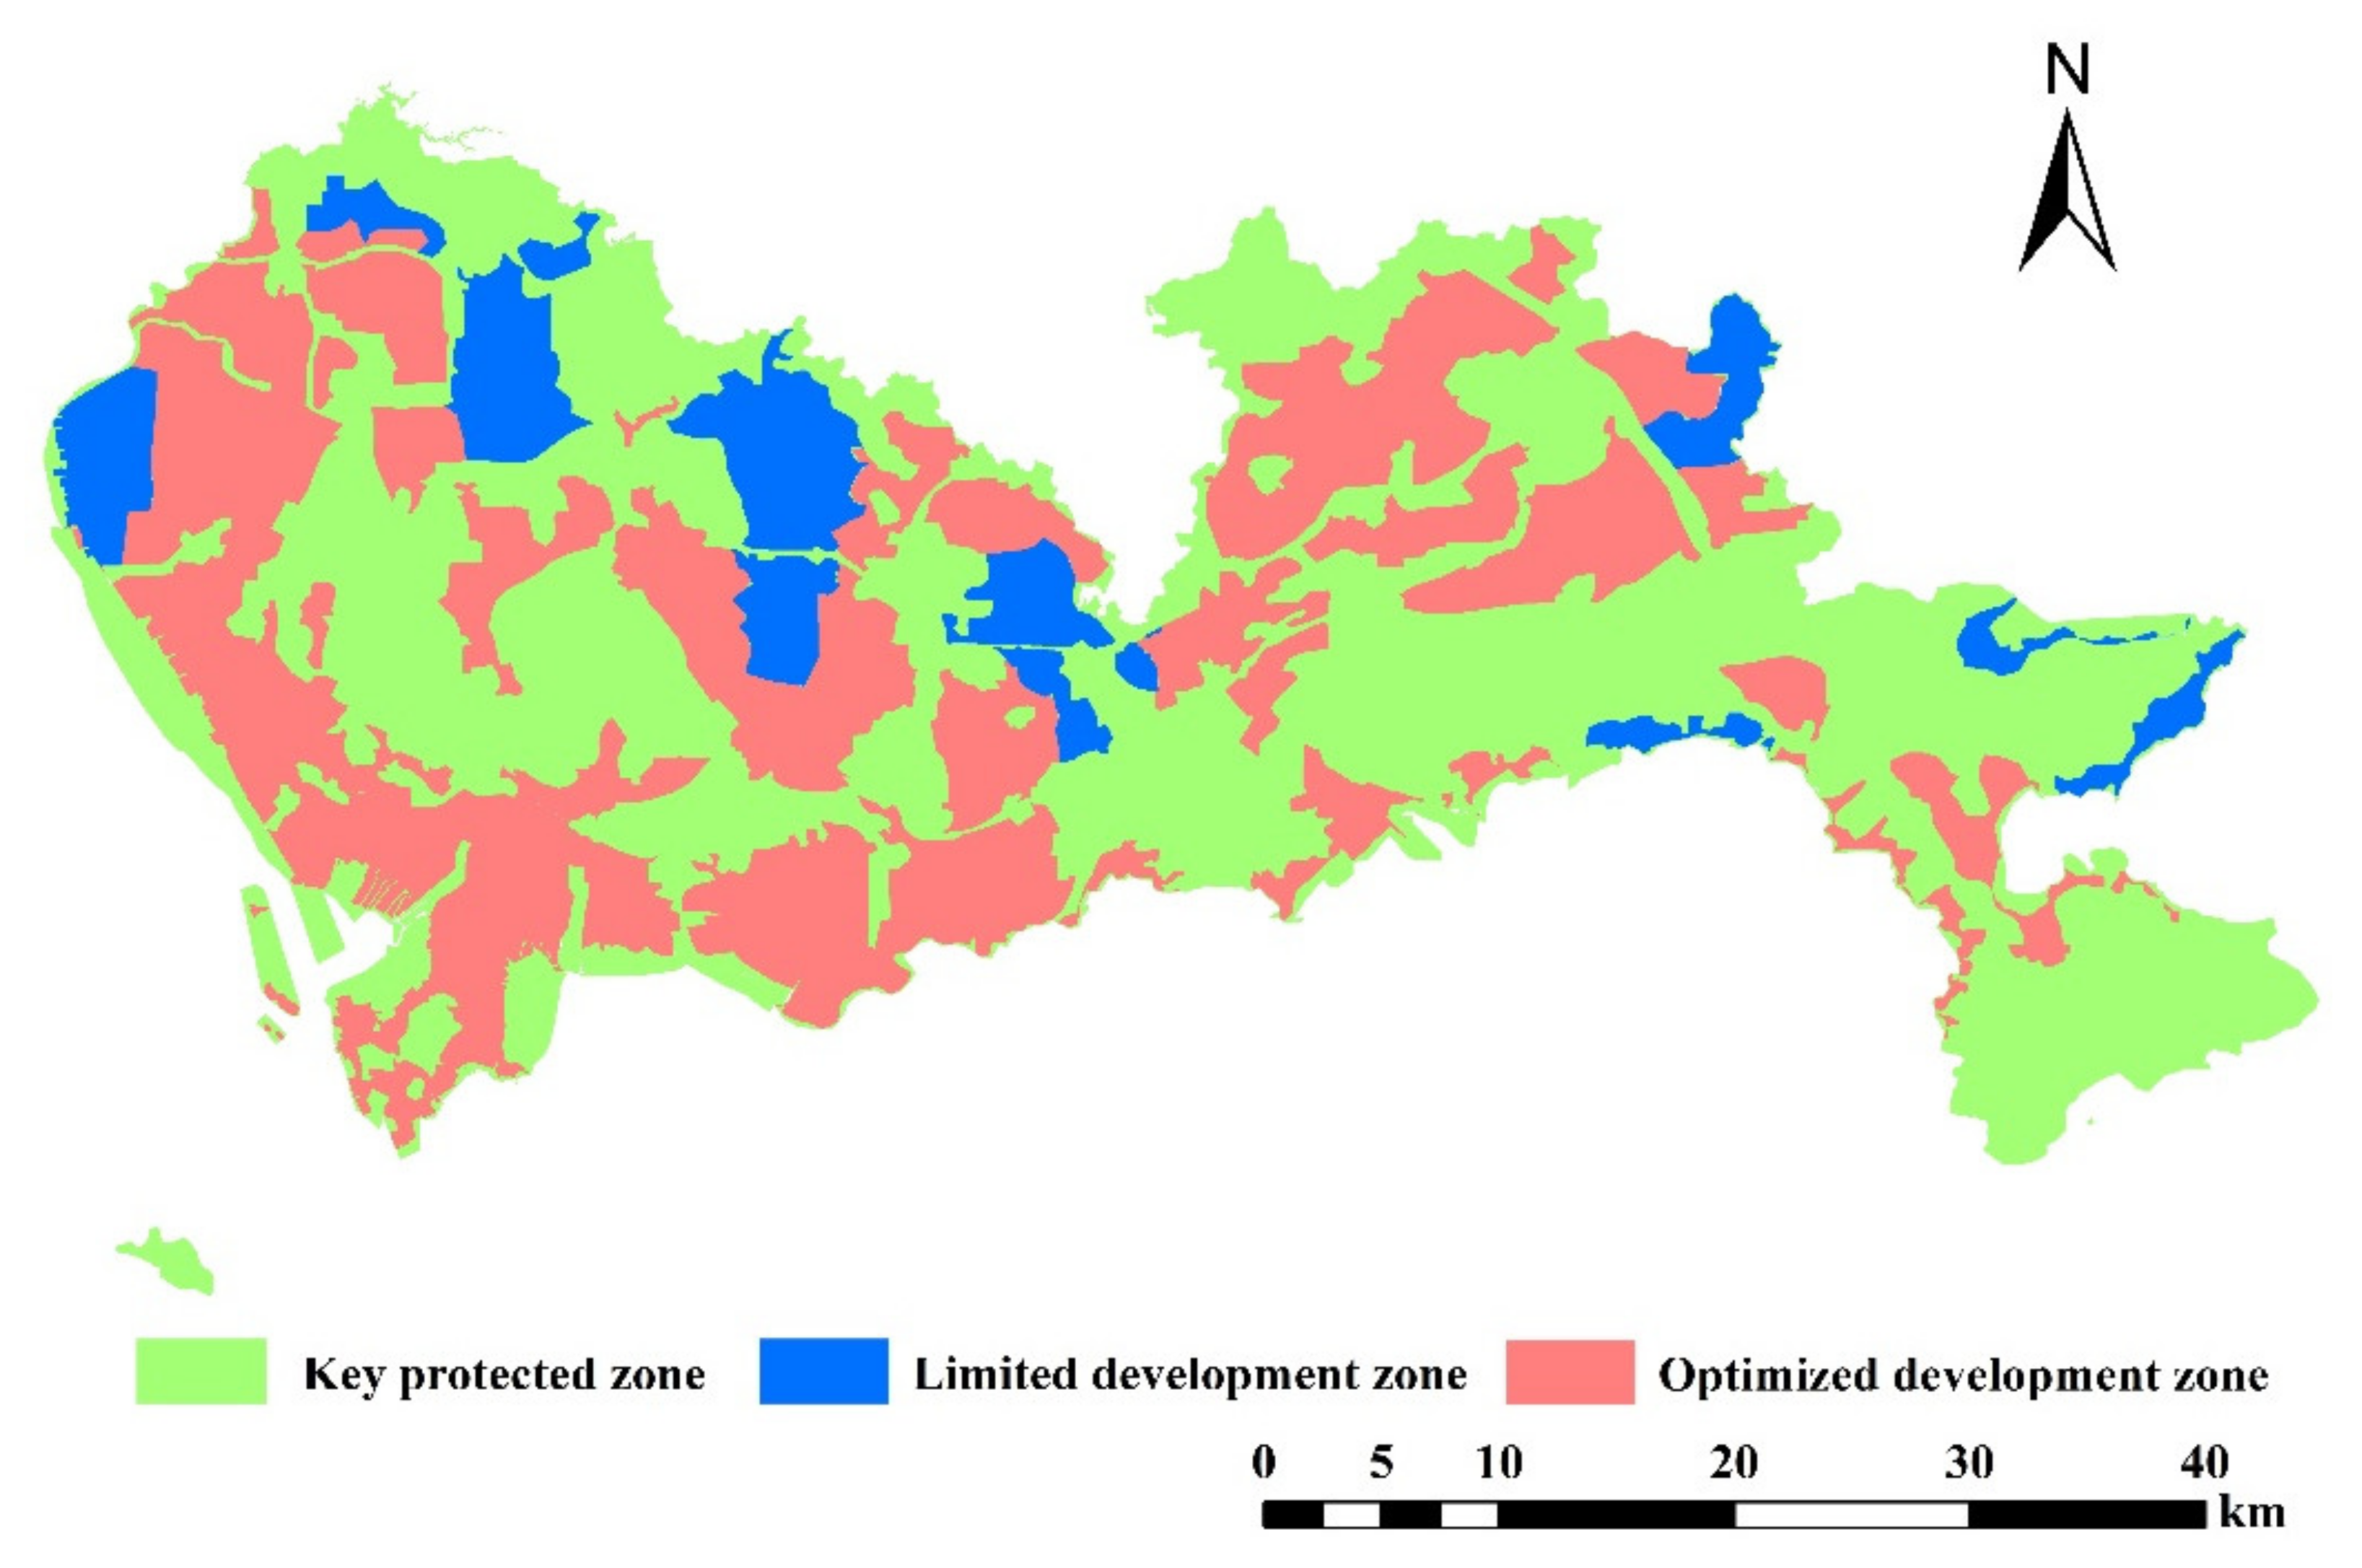
3.2. Division of Ecological Security Zones
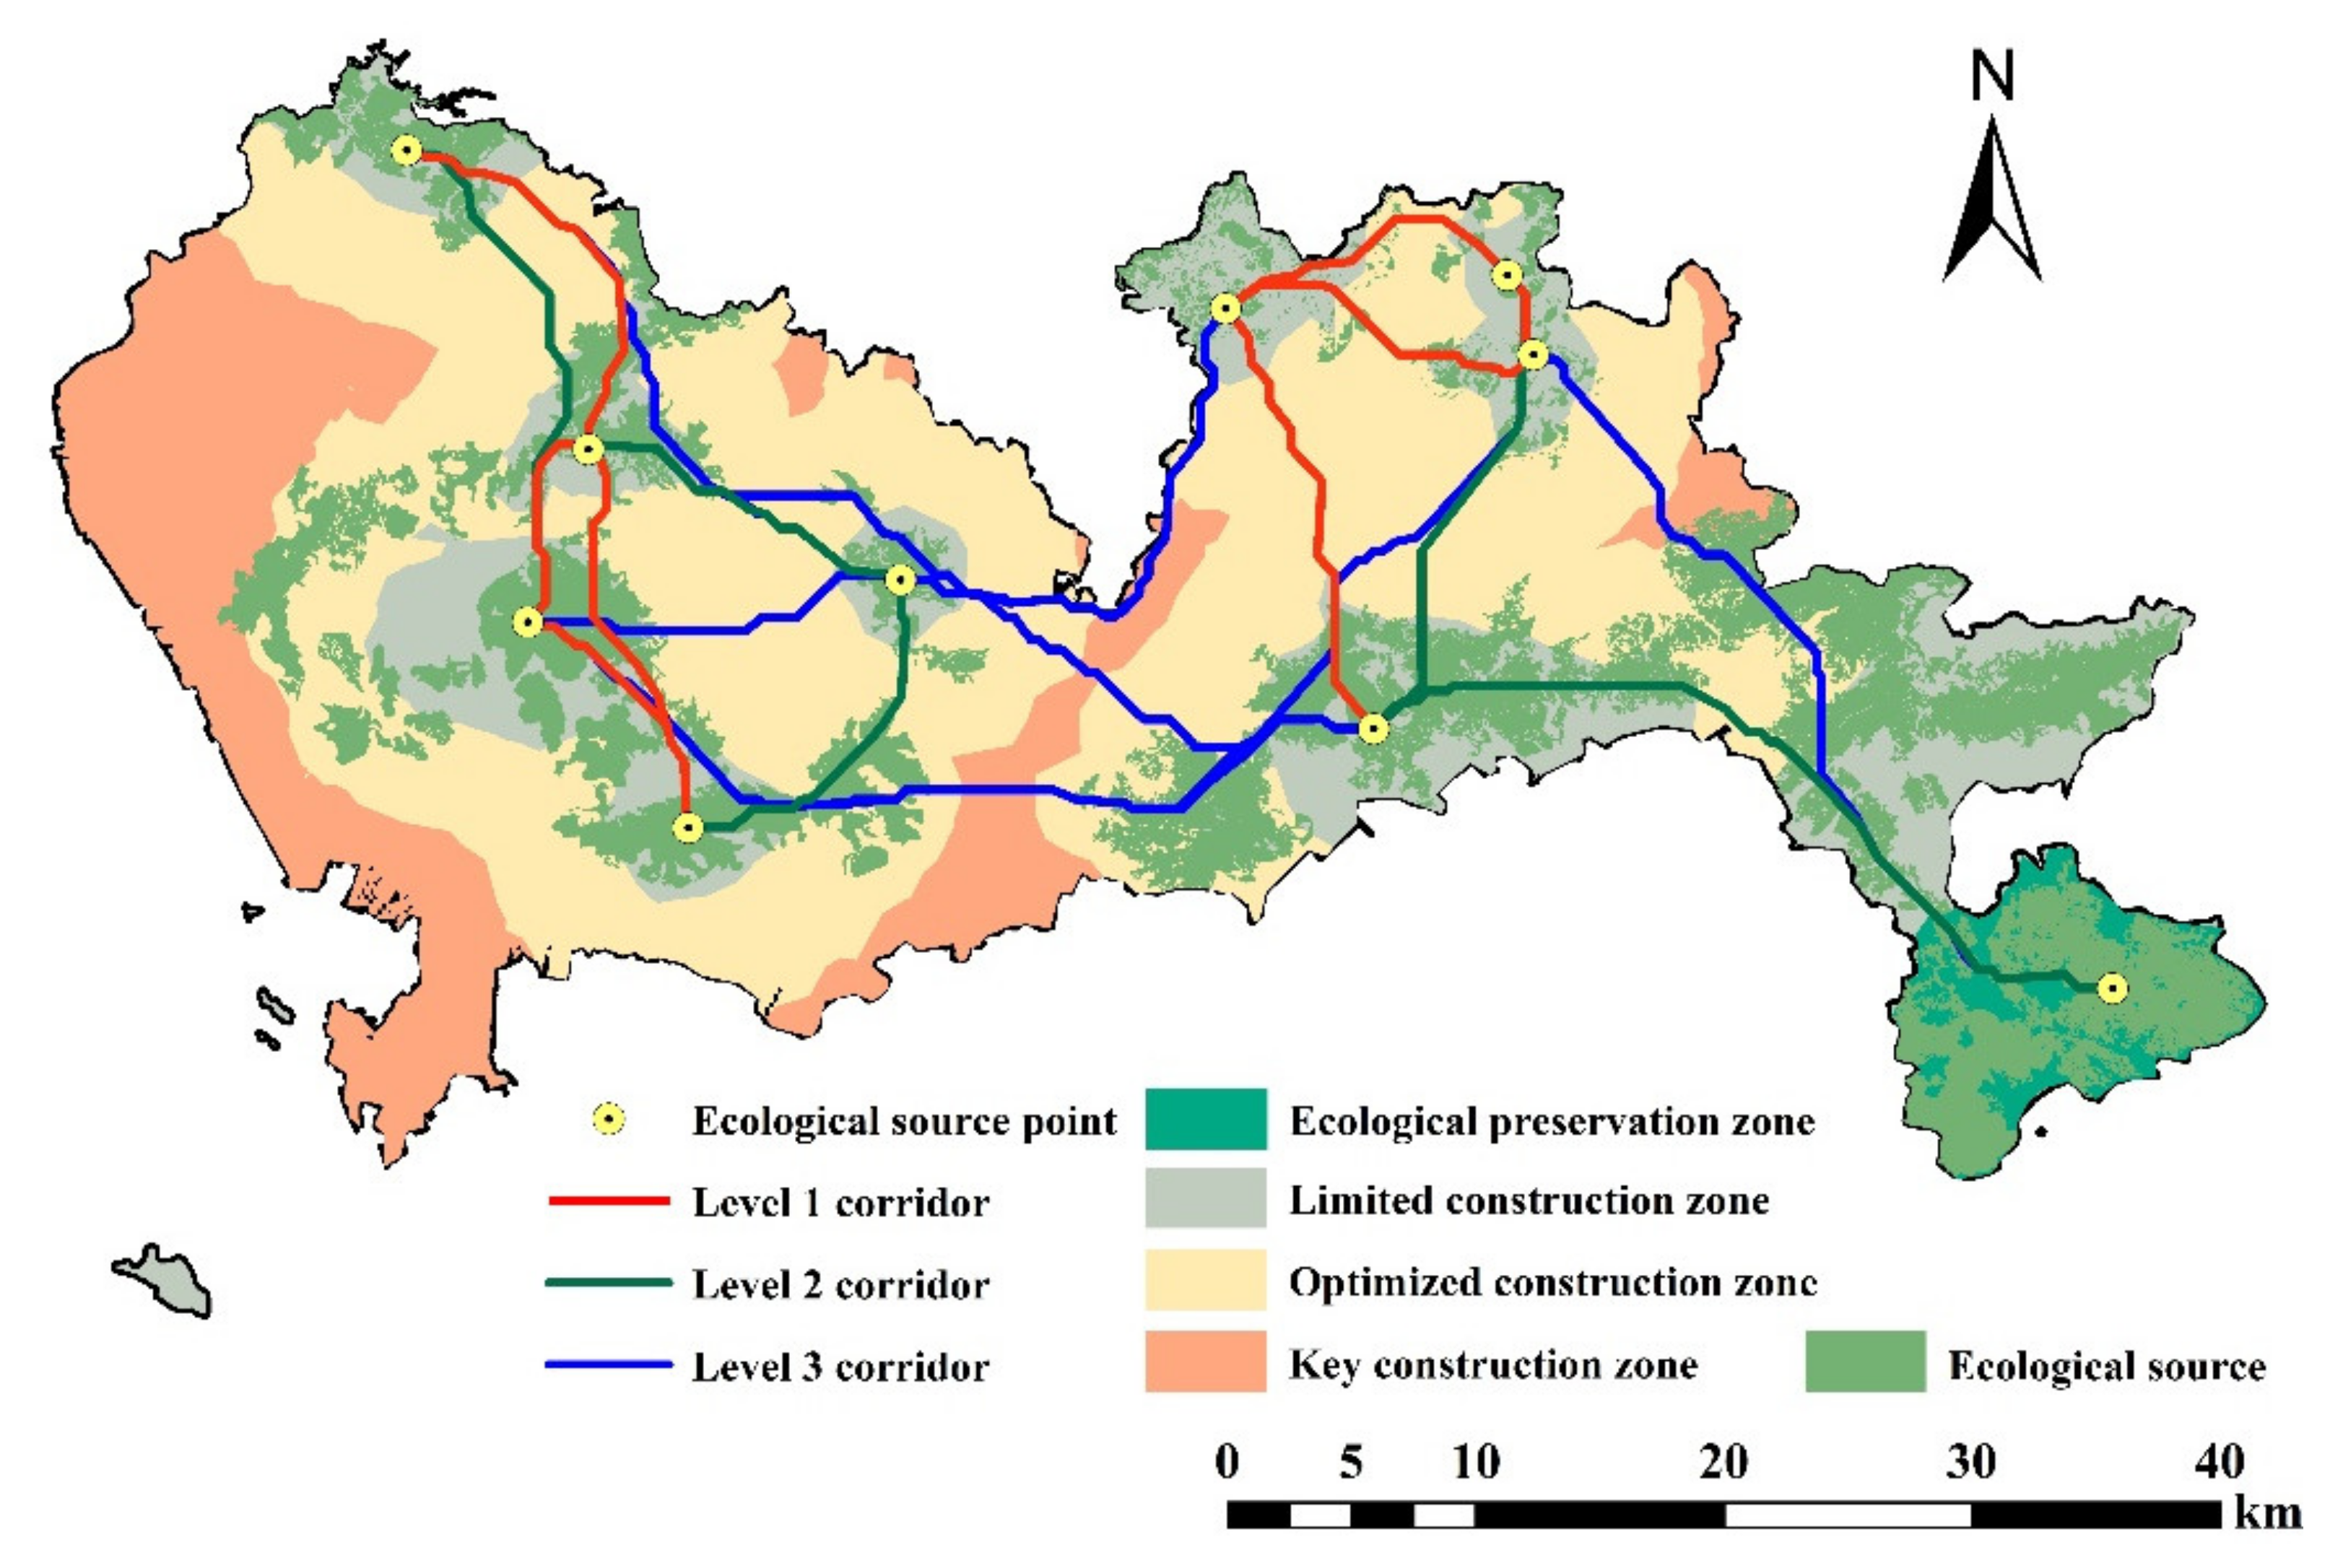
3.3. Construction of Ecological Corridors
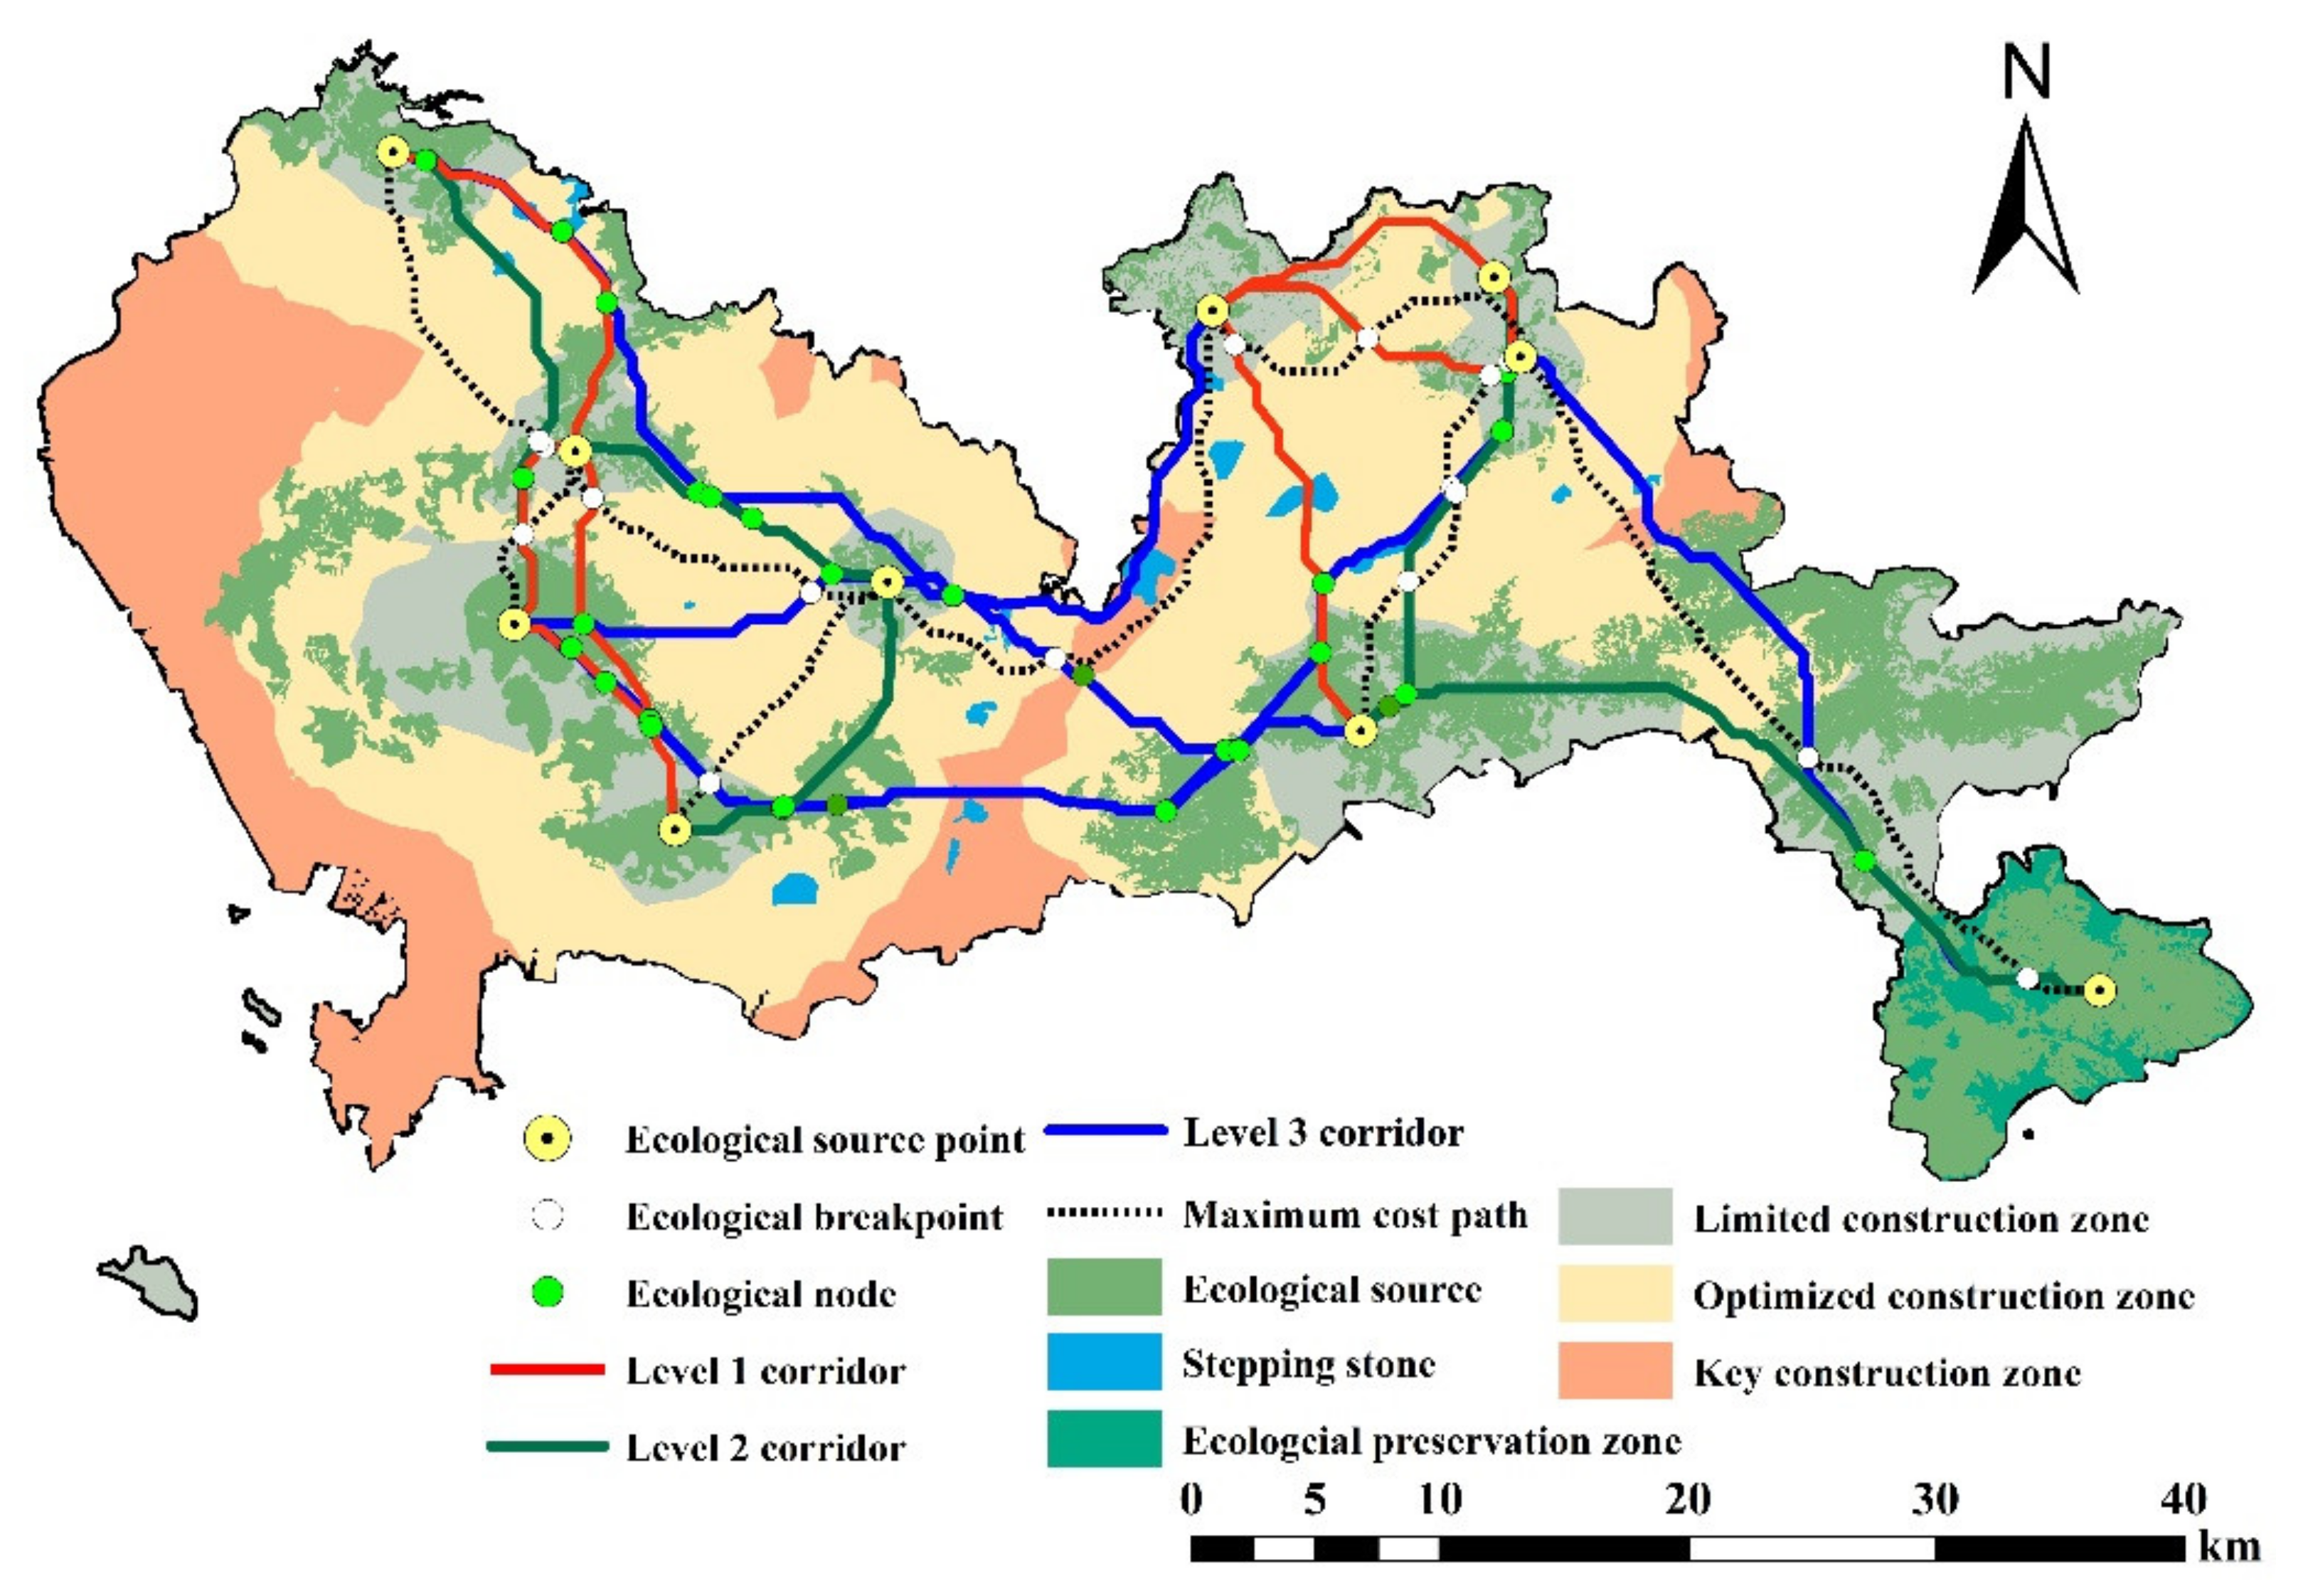
3.4. Construction of the Ecological Security Pattern
4. Discussion
4.1. Habitat Quality Assessment
4.2. Construction of the Ecological Security Pattern
4.3. Implications for the Development of an Ecological City in Shenzhen City
5. Conclusions
Author Contributions
Funding
Institutional Review Board Statement
Informed Consent Statement
Data Availability Statement
Conflicts of Interest
References
- Pfeifer, M.; Lefebvre, V.; Peres, C.A.; Banks-Leite, C.; Wearn, O.; Marsh, C.; Butchart, S.H.M.; Arroyo-Rodríguez, V.; Barlow, J.; Cerezo, A.; et al. Creation of forest edges has a global impact on forest vertebrates. Nat. Cell Biol. 2017, 551, 187–191. [Google Scholar] [CrossRef] [PubMed]
- Yu, Q.; Hu, Q.; van Vliet, J.; Verburg, P.H.; Wu, W. GlobeLand30 shows little cropland area loss but greater fragmentation in China. Int. J. Appl. Earth Obs. Geoinf. 2018, 66, 37–45. [Google Scholar] [CrossRef]
- Seto, K.C.; Güneralp, B.; Hutyra, L.R. Global forecasts of urban expansion to 2030 and direct impacts on biodiversity and carbon pools. Proc. Natl. Acad. Sci. USA 2012, 109, 16083–16088. [Google Scholar] [CrossRef] [Green Version]
- Akpalu, W.; Stage, J. Connectivity at a cost: Economic dynamics of restoring habitat connectivity. Nat. Resour. Model. 2021, 34, 12294. [Google Scholar] [CrossRef]
- Hanski, I. Habitat Loss, the Dynamics of Biodiversity, and a Perspective on Conservation. Ambio 2011, 40, 248–255. [Google Scholar] [CrossRef] [PubMed] [Green Version]
- Baloch, M.A.; Zhang, J.; Iqbal, K.; Iqbal, Z. The effect of financial development on ecological footprint in BRI countries: Evidence from panel data estimation. Environ. Sci. Pollut. Res. 2019, 26, 6199–6208. [Google Scholar] [CrossRef] [PubMed]
- Charfeddine, L. The impact of energy consumption and economic development on Ecological Footprint and CO2 emissions: Evidence from a Markov Switching Equilibrium Correction Model. Energy Econ. 2017, 65, 355–374. [Google Scholar] [CrossRef]
- Ouyang, J.Q.; Isaksson, C.; Schmidt, C.; Hutton, P.; Bonier, F.; Dominoni, D. A New Framework for Urban Ecology: An Integration of Proximate and Ultimate Responses to Anthropogenic Change. Integr. Comp. Biol. 2018, 58, 915–928. [Google Scholar] [CrossRef] [Green Version]
- Bai, X.; Shi, P.; Liu, Y. Society: Realizing China’s urban dream. Nature 2014, 509, 158. [Google Scholar] [CrossRef] [Green Version]
- Fu, B.; Liang, D.; Lu, N. Landscape ecology: Coupling of pattern, process, and scale. Chin. Geogr. Sci. 2011, 21, 385–391. [Google Scholar] [CrossRef]
- Beier, P.; Spencer, W.; Baldwin, R.F.; McRae, B.H. Toward Best Practices for Developing Regional Connectivity Maps. Conserv. Biol. 2011, 25, 879–892. [Google Scholar] [CrossRef]
- Modica, G.; Praticò, S.; Laudari, L.; Ledda, A.; Di Fazio, S.; De Montis, A. Implementation of multispecies ecological networks at the regional scale: Analysis and multi-temporal assessment. J. Environ. Manag. 2021, 289, 112494. [Google Scholar] [CrossRef]
- Cho, S.-H.; Poudyal, N.; Lambert, D.M. Estimating spatially varying effects of urban growth boundaries on land development and land value. Land Use Policy 2008, 25, 320–329. [Google Scholar] [CrossRef]
- Esbah, H.; Cook, E.A.; Ewan, J. Effects of Increasing Urbanization on the Ecological Integrity of Open Space Preserves. Environ. Manag. 2009, 43, 846–862. [Google Scholar] [CrossRef]
- Benedict, M.A.; McMahon, E.T. Green infrastructure: Smart conservation for the 21st century. Renew. Res. J. 2002, 20, 12–17. [Google Scholar]
- Fan, J. Theoretical innovation in optimization of protection and development of China’s territorial space and coping strategy of 13th Five-Year Plan. Bull. Chin. Acad. Sci. 2016, 31, 1–12. [Google Scholar]
- Yu, K. Security patterns and surface model in landscape ecological planning. Landsc. Urban Plan. 1996, 36, 1–17. [Google Scholar] [CrossRef]
- Ma, K.; Fu, B.; Li, X.; Guan, W. The regional pattern for ecological security (RPES): The concept and theoretical basis. Acta Ecol. Sin. 2004, 24, 761–768. [Google Scholar]
- He, C.; Liu, Z.; Tian, J.; Ma, Q. Urban expansion dynamics and natural habitat loss in China: A multiscale landscape perspective. Glob. Chang. Biol. 2014, 20, 2886–2902. [Google Scholar] [CrossRef] [PubMed]
- Peng, J.; Yang, Y.; Liu, Y.; Hu, Y.; Du, Y.; Meersmans, J.; Qiu, S. Linking ecosystem services and circuit theory to identify ecological security patterns. Sci. Total. Environ. 2018, 644, 781–790. [Google Scholar] [CrossRef] [PubMed] [Green Version]
- Zhang, L.; Peng, J.; Liu, Y.; Wu, J. Coupling ecosystem services supply and human ecological demand to identify landscape ecological security pattern: A case study in Beijing–Tianjin–Hebei region, China. Urban Ecosyst. 2016, 20, 701–714. [Google Scholar] [CrossRef]
- Jiang, H.; Peng, J.; Dong, J.; Zhang, Z.; Xu, Z.; Meersmans, J. Linking ecological background and demand to identify ecological security patterns across the Guangdong-Hong Kong-Macao Greater Bay Area in China. Landsc. Ecol. 2021, 36, 2135–2150. [Google Scholar] [CrossRef]
- Tang, Y.; Gao, C.; Wu, X. Urban Ecological Corridor Network Construction: An Integration of the Least Cost Path Model and the InVEST Model. ISPRS Int. J. Geo-Inf. 2020, 9, 33. [Google Scholar] [CrossRef] [Green Version]
- Dong, R.; Zhang, X.; Li, H. Constructing the Ecological Security Pattern for Sponge City: A Case Study in Zhengzhou, China. Water 2019, 11, 284. [Google Scholar] [CrossRef] [Green Version]
- Yang, T.R.; Kuang, W.H.; Liu, W.D.; Liu, A.L.; Pan, T. Optimizing the layout of eco-spatial structure in Guanzhong urban agglomeration based on the ecological security pattern. Geogr. Res. 2017, 36, 441–452. [Google Scholar] [CrossRef]
- Pascual-Hortal, L.; Saura, S. Comparison and development of new graph-based landscape connectivity indices: Towards the priorization of habitat patches and corridors for conservation. Landsc. Ecol. 2006, 21, 959–967. [Google Scholar] [CrossRef]
- Gao, Y.; Ma, L.; Liu, J.; Zhuang, Z.; Huang, Q.; Li, M. Constructing Ecological Networks Based on Habitat Quality Assessment: A Case Study of Changzhou, China. Sci. Rep. 2017, 7, srep46073. [Google Scholar] [CrossRef] [PubMed]
- Li, F.; Ye, Y.; Song, B.; Wang, R. Evaluation of urban suitable ecological land based on the minimum cumulative resistance model: A case study from Changzhou, China. Ecol. Model. 2015, 318, 194–203. [Google Scholar] [CrossRef]
- Gurrutxaga, M.; Lozano, P.J.; del Barrio, G. GIS-based approach for incorporating the connectivity of ecological networks into regional planning. J. Nat. Conserv. 2010, 18, 318–326. [Google Scholar] [CrossRef]
- Carvalho, F.; Carvalho, R.; Mira, A.; Beja, P. Assessing landscape functional connectivity in a forest carnivore using path selection functions. Landsc. Ecol. 2016, 31, 1021–1036. [Google Scholar] [CrossRef] [Green Version]
- Graves, T.A.; Chandler, R.B.; Royle, J.; Beier, P.; Kendall, K.C. Estimating landscape resistance to dispersal. Landsc. Ecol. 2014, 29, 1201–1211. [Google Scholar] [CrossRef]
- Kang, J.; Zhang, X.; Zhu, X.; Zhang, B. Ecological security pattern: A new idea for balancing regional development and ecological protection. A case study of the Jiaodong Peninsula, China. Glob. Ecol. Conserv. 2021, 26, e01472. [Google Scholar] [CrossRef]
- Peng, J.; Zhao, H.; Liu, Y. Urban ecological corridors construction: A review. Acta Ecol. Sin. 2017, 37, 23–30. [Google Scholar] [CrossRef]
- Belote, R.T.; Dietz, M.S.; McRae, B.H.; Theobald, D.M.; McClure, M.L.; Irwin, G.H.; McKinley, P.S.; Gage, J.A.; Aplet, G.H. Identifying Corridors among Large Protected Areas in the United States. PLoS ONE 2016, 11, e0154223. [Google Scholar] [CrossRef] [Green Version]
- Wang, D.; Chen, J.; Zhang, L.; Sun, Z.; Wang, X.; Zhang, X.; Zhang, W. Establishing an ecological security pattern for urban agglomeration, taking ecosystem services and human interference factors into consideration. PeerJ 2019, 7, e7306. [Google Scholar] [CrossRef]
- Huang, J.; Hu, Y.; Zheng, F. Research on recognition and protection of ecological security patterns based on circuit theory: A case study of Jinan City. Environ. Sci. Pollut. Res. 2020, 27, 12414–12427. [Google Scholar] [CrossRef] [PubMed]
- Keeley, A.T.H.; Beier, P.; Gagnon, J.W. Estimating landscape resistance from habitat suitability: Effects of data source and nonlinearities. Landsc. Ecol. 2016, 31, 2151–2162. [Google Scholar] [CrossRef]
- Kong, F.; Yin, H.; Nakagoshi, N.; Zong, Y. Urban green space network development for biodiversity conservation: Identification based on graph theory and gravity modeling. Landsc. Urban Plan. 2010, 95, 16–27. [Google Scholar] [CrossRef]
- Pickett, S.T.A.; Cadenasso, M.L.; Rosi, E.; Belt, K.T.; Groffman, P.M.; Grove, J.M.; Irwin, E.G.; Kaushal, S.S.; LaDeau, S.; Nilon, C.H.; et al. Dynamic heterogeneity: A framework to promote ecological integration and hypothesis generation in urban systems. Urban Ecosyst. 2017, 20, 1–14. [Google Scholar] [CrossRef] [Green Version]
- Zhu, K.-W.; Chen, Y.-C.; Zhang, S.; Yang, Z.-M.; Huang, L.; Lei, B.; Li, L.; Zhou, Z.-B.; Xiong, H.-L.; Li, X.-X. Identification and prevention of agricultural non-point source pollution risk based on the minimum cumulative resistance model. Glob. Ecol. Conserv. 2020, 23, e01149. [Google Scholar] [CrossRef]
- Peng, J.; Zhao, M.; Guo, X.; Pan, Y.; Liu, Y. Spatial-temporal dynamics and associated driving forces of urban ecological land: A case study in Shenzhen City, China. Habitat Int. 2017, 60, 81–90. [Google Scholar] [CrossRef]
- Li, S.; Yang, B. Introducing a new method for assessing spatially explicit processes of landscape fragmentation. Ecol. Indic. 2015, 56, 116–124. [Google Scholar] [CrossRef]
- Shi, P.; Yu, D. Assessing urban environmental resources and services of Shenzhen, China: A landscape-based approach for urban planning and sustainability. Landsc. Urban Plan. 2014, 125, 290–297. [Google Scholar] [CrossRef]
- Peng, J.; Pan, Y.; Liu, Y.; Zhao, H.; Wang, Y. Linking ecological degradation risk to identify ecological security patterns in a rapidly urbanizing landscape. Habitat Int. 2018, 71, 110–124. [Google Scholar] [CrossRef]
- Yu, D.; Liu, Y.; Xun, B.; Shao, H. Measuring Landscape Connectivity in a Urban Area for Biological Conservation. Clean Soil Air Water 2014, 43, 605–613. [Google Scholar] [CrossRef]
- Li, M.; Liang, D.; Xia, J.; Song, J.; Cheng, D.; Wu, J.; Cao, Y.; Sun, H.; Li, Q. Evaluation of water conservation function of Danjiang River Basin in Qinling Mountains, China based on InVEST model. J. Environ. Manag. 2021, 286, 112212. [Google Scholar] [CrossRef]
- Sharp, R.; Tallis, H.T.; Ricketts, T.; Guerry, A.D.; Wood, S.A.; Chapin-Kramer, R.; Nelson, E.; Ennaanay, D.; Wolny, S.; Olwero, N.; et al. InVEST 3.2.0 User’s Guide; The Natural Capital Project, Stanford University, University of Minnesota, The Nature Conservancy, and World Wildlife Fund: Stanford, CA, USA, 2015. [Google Scholar]
- Hao, Y.; Zhang, N.; Du, Y.J.; Wang, Y.H.; Zheng, Y.D.; Zhang, C.C. Construction of ecological security pattern based on habitat quality in Tang County, Hebei, China. J. Appl. Ecol. 2019, 30, 1015–1024, (in Chinese with English abstract). [Google Scholar] [CrossRef]
- Lin, Q.; Mao, J.; Wu, J.; Li, W.; Yang, J. Ecological Security Pattern Analysis Based on InVEST and Least-Cost Path Model: A Case Study of Dongguan Water Village. Sustainability 2016, 8, 172. [Google Scholar] [CrossRef] [Green Version]
- Knaapen, J.P.; Scheffer, M.; Harms, B. Estimating habitat isolation in landscape planning. Landsc. Urban Plan. 1992, 23, 1–16. [Google Scholar] [CrossRef]
- Yang, S.; Zou, C.; Shen, W.; Shen, R.; Xu, D. Construction of ecological security patterns based on ecological red line: A case study of Jiangxi Province. Chinese J. Ecol. 2016, 35, 250, (in Chinese with English abstract). [Google Scholar]
- Luo, Y.; Wu, J.; Wang, X.; Peng, J. Using stepping-stone theory to evaluate the maintenance of landscape connectivity under China’s ecological control line policy. J. Clean. Prod. 2021, 296, 126356. [Google Scholar] [CrossRef]
- Fichera, C.R.; Laudari, L.; Modica, G. Application, validation and comparison in different geographical contexts of an integrated model for the design of ecological networks. J. Agric. Eng. 2015, 46, 52. [Google Scholar] [CrossRef] [Green Version]
- Yang, Z.G.; Jiang, Z.Y.; Guo, C.X.; Yang, X.J.; Xu, X.J.; Li, X.; Hu, Z.M.; Zhou, H.Y. Construction of ecological network using morphological spatial pattern analysis and minimal cumulative resistance models in Guangzhou City, China. Chin. J. Appl. Ecol. 2018, 29, 3367–3376, (in Chinese with English abstract). [Google Scholar] [CrossRef]
- Stauffer, F.; Best, L.B. Habitat Selection by Birds of Riparian Communities: Evaluating Effects of Habitat Alterations. J. Wildl. Manag. 1980, 44. [Google Scholar] [CrossRef]
- Bueno, J.A.; Tsihrintzis, V.A.; Alvarez, L. South Florida greenways: A conceptual framework for the ecological reconnectivity of the region. Landsc. Urban Plan. 1995, 33, 247–266. [Google Scholar] [CrossRef]
- Bai, L.; Xiu, C.; Feng, X.; Liu, D. Influence of urbanization on regional habitat quality:a case study of Changchun City. Habitat Int. 2019, 93, 102042. [Google Scholar] [CrossRef]
- Housing and Urban-Rural Development Department of Guangdong Province in PRC. Green Pearl River Delta road network master plan outline. Superv. Test Cost Constr. 2010, 3, 10–69, (in Chinese with English Abstract). [Google Scholar]
- Dai, L.; Liu, Y.; Luo, X. Integrating the MCR and DOI models to construct an ecological security network for the urban agglomeration around Poyang Lake, China. Sci. Total. Environ. 2021, 754, 141868. [Google Scholar] [CrossRef]
- Yu, Q.; Yue, D.; Wang, J.; Zhang, Q.; Li, Y.; Yu, Y.; Chen, J.; Li, N. The optimization of urban ecological infrastructure network based on the changes of county landscape patterns: A typical case study of ecological fragile zone located at Deng Kou (Inner Mongolia). J. Clean. Prod. 2017, 163, S54–S67. [Google Scholar] [CrossRef]
- Wilson, M.A.; Howarth, R. Discourse-based valuation of ecosystem services: Establishing fair outcomes through group deliberation. Ecol. Econ. 2002, 41, 431–443. [Google Scholar] [CrossRef]
- Zhu, Q.; Yu, K.J.; Li, D.H. The width of ecological corridor in landscape planning. Acta Ecol. Sin. 2005, 25, 2406–2412, (in Chinese with English abstract). [Google Scholar] [CrossRef]
- Yeung, C.; Yang, M.-S. Spatial variation in habitat quality for juvenile flatfish in the southeastern Bering Sea and its implications for productivity in a warming ecosystem. J. Sea Res. 2018, 139, 62–72. [Google Scholar] [CrossRef]
- General Office of the People’s Government of Shenzhen Municipality. Ecological City Construction Plan of Shenzhen. 2007. Available online: http://www.sz.gov.cn/zwgk/zfxxgk/zfwj/szfwj/content/post_6577266.html (accessed on 2 February 2021).
- Ma, X.; Tao, J. Cross-border environmental governance in the Greater Pearl River Delta (GPRD). Int. J. Environ. Stud. 2010, 67, 127–136. [Google Scholar] [CrossRef]
- Saura, S.; Bodin, Ö.; Fortin, M.J. EDITOR’S CHOICE: Stepping stones are crucial for species’ long-distance dispersal and range expansion through habitat networks. J. Appl. Ecol. 2014, 51, 171–182. [Google Scholar] [CrossRef]
- Urban Administration Office of the People’s Government of Shenzhen Municipality (Urban Administration and Regulation of Shenzhen Municipality). Master Plan of National Forest City Construction of Shenzhen (2016–2025). 2017. Available online: http://cgj.sz.gov.cn/zwgk/ghjh/fzgh/content/post_2127354.html (accessed on 2 February 2021).


| Threat Factors | Maximum Influence Distance (km) | Weight | Decay Linear Correlation |
|---|---|---|---|
| Cultivated land | 4.0 | 0.7 | Exponential |
| Urban constructive land | 5.0 | 1.0 | Exponential |
| Road | 2.0 | 0.5 | Exponential |
| Name | Habitat Suitability | Cultivated Land | Urban Constructive Land | Road |
|---|---|---|---|---|
| Cultivated land | 0.50 | 0.30 | 0.50 | 0.40 |
| Forest | 1.00 | 0.80 | 0.80 | 0.60 |
| Grassland | 0.70 | 0.25 | 0.65 | 0.50 |
| Shrubland | 0.70 | 0.25 | 0.65 | 0.50 |
| water area | 0.80 | 0.65 | 0.60 | 0.50 |
| Construction land | 0.00 | 0.00 | 0.00 | 0.00 |
| Bare land | 0.25 | 0.10 | 0.20 | 0.15 |
| Sea area | 0.80 | 0.65 | 0.60 | 0.50 |
| Resistance Factors | Feature | Ecological Resistance Value | Urban Resistance Value | Weight |
|---|---|---|---|---|
| Land-use types | water area, sea area, forest | 1 | 5 | 0.15 |
| grassland, shrub land | 2 | 4 | ||
| cultivated land | 3 | 3 | ||
| bare land | 4 | 2 | ||
| construction land | 5 | 1 | ||
| Habitat quality index | >0.80 | 1 | 5 | 0.17 |
| 0.60~0.80 | 2 | 4 | ||
| 0.40~0.60 | 3 | 3 | ||
| 0.20~0.40 | 4 | 2 | ||
| <0.20 | 5 | 1 | ||
| NDVI | 0.74~1 | 1 | 5 | 0.17 |
| 0.44~0.74 | 2 | 4 | ||
| 0.17~0.44 | 3 | 3 | ||
| −0.44~0.17 | 4 | 2 | ||
| −1~−0.44 | 5 | 1 | ||
| Distance from water area | >1000 m | 1 | 5 | 0.14 |
| 750 m~1000 m | 2 | 4 | ||
| 500 m~750 m | 3 | 3 | ||
| 250 m~500 m | 4 | 2 | ||
| <250 m | 5 | 1 | ||
| Distance from residential areas | >1100 m | 1 | 5 | 0.19 |
| 800 m~1100 m | 2 | 4 | ||
| 500 m~800 m | 3 | 3 | ||
| 200 m~500 m | 4 | 2 | ||
| <200 m | 5 | 1 | ||
| Distance from roads | >1200 m | 1 | 5 | 0.18 |
| 900 m~1200 m | 2 | 4 | ||
| 600 m~900 m | 3 | 3 | ||
| 300 m~600 m | 4 | 2 | ||
| <300 m | 5 | 1 |
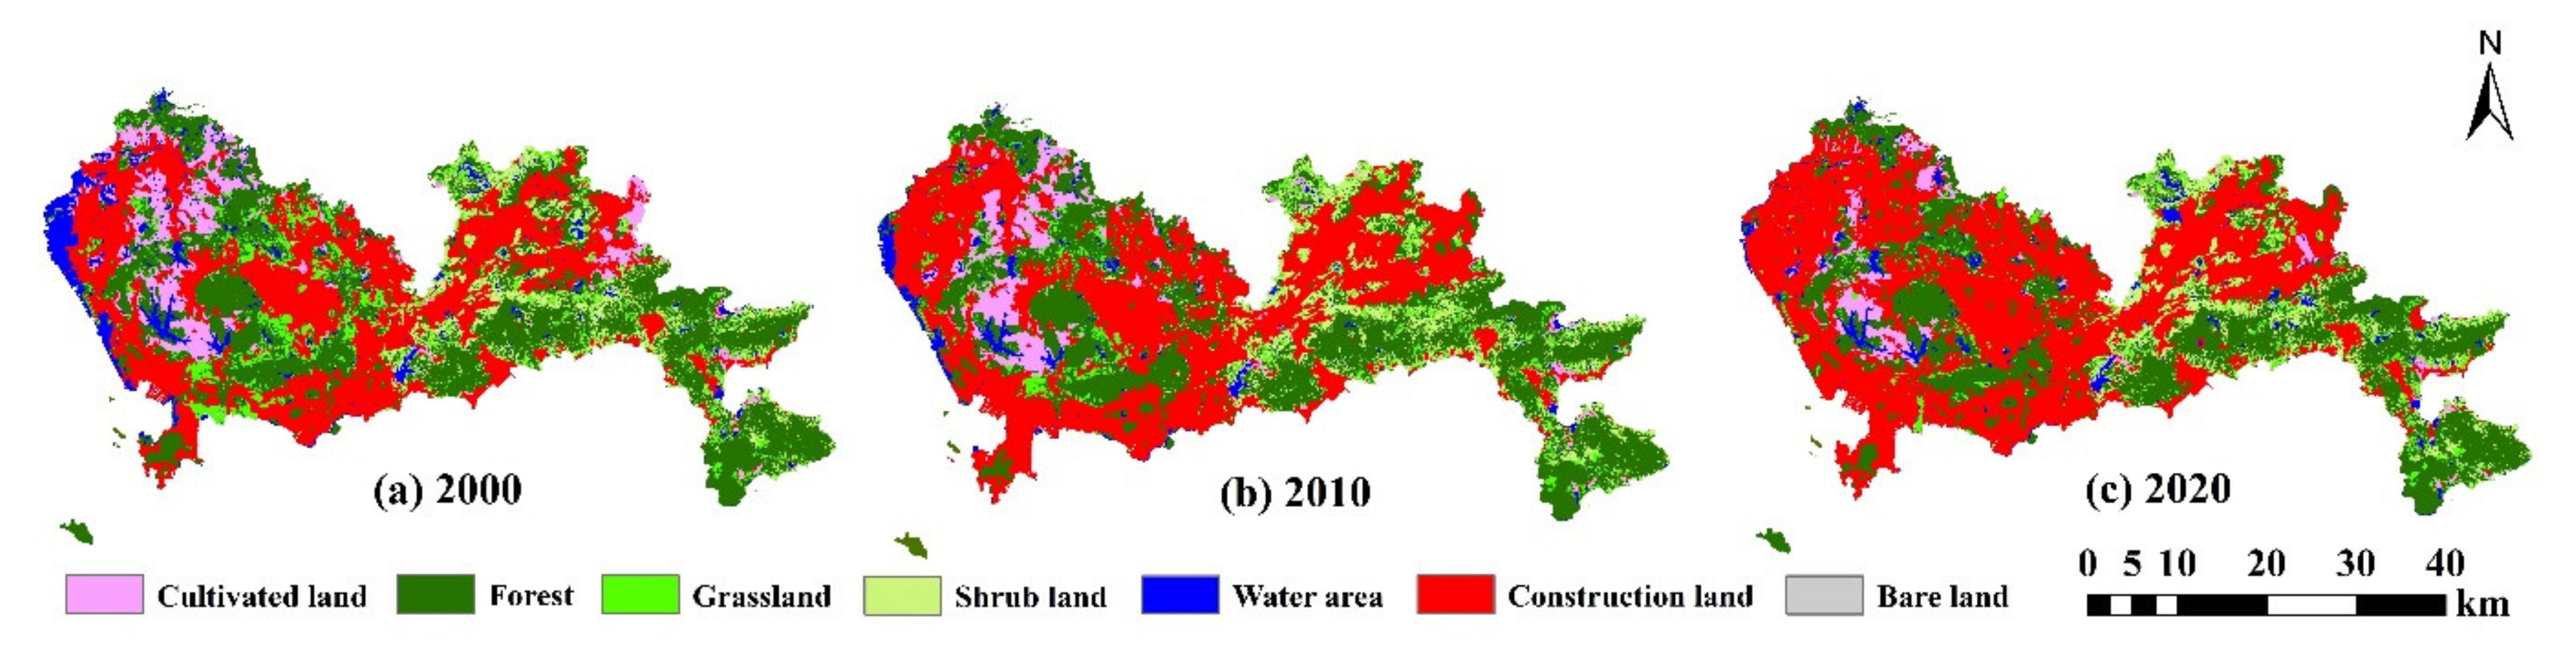
| Land-Use Types | 2000 | 2010 | 2020 | |||
|---|---|---|---|---|---|---|
| Area (km2) | Proportion (%) | Area (km2) | Proportion (%) | Area (km2) | Proportion (%) | |
| Cultivated land | 149.27 | 7.89% | 118.01 | 6.24% | 70.20 | 3.71% |
| Forest | 660.77 | 34.92% | 661.39 | 34.97% | 602.69 | 31.87% |
| Grassland | 159.18 | 8.41% | 110.74 | 5.86% | 89.56 | 4.73% |
| Shrub land | 147.47 | 7.79% | 154.46 | 8.17% | 141.22 | 7.47% |
| Water area | 109.80 | 5.80% | 55.69 | 2.94% | 58.76 | 3.11% |
| Built area | 662.75 | 35.03% | 789.04 | 41.72% | 926.48 | 48.98% |
| Bare land | 0.05 | 0.00% | 0.00 | 0.00% | 0.76 | 0.04% |
| Sea area | 2.81 | 0.15% | 2.04 | 0.11% | 1.72 | 0.09% |
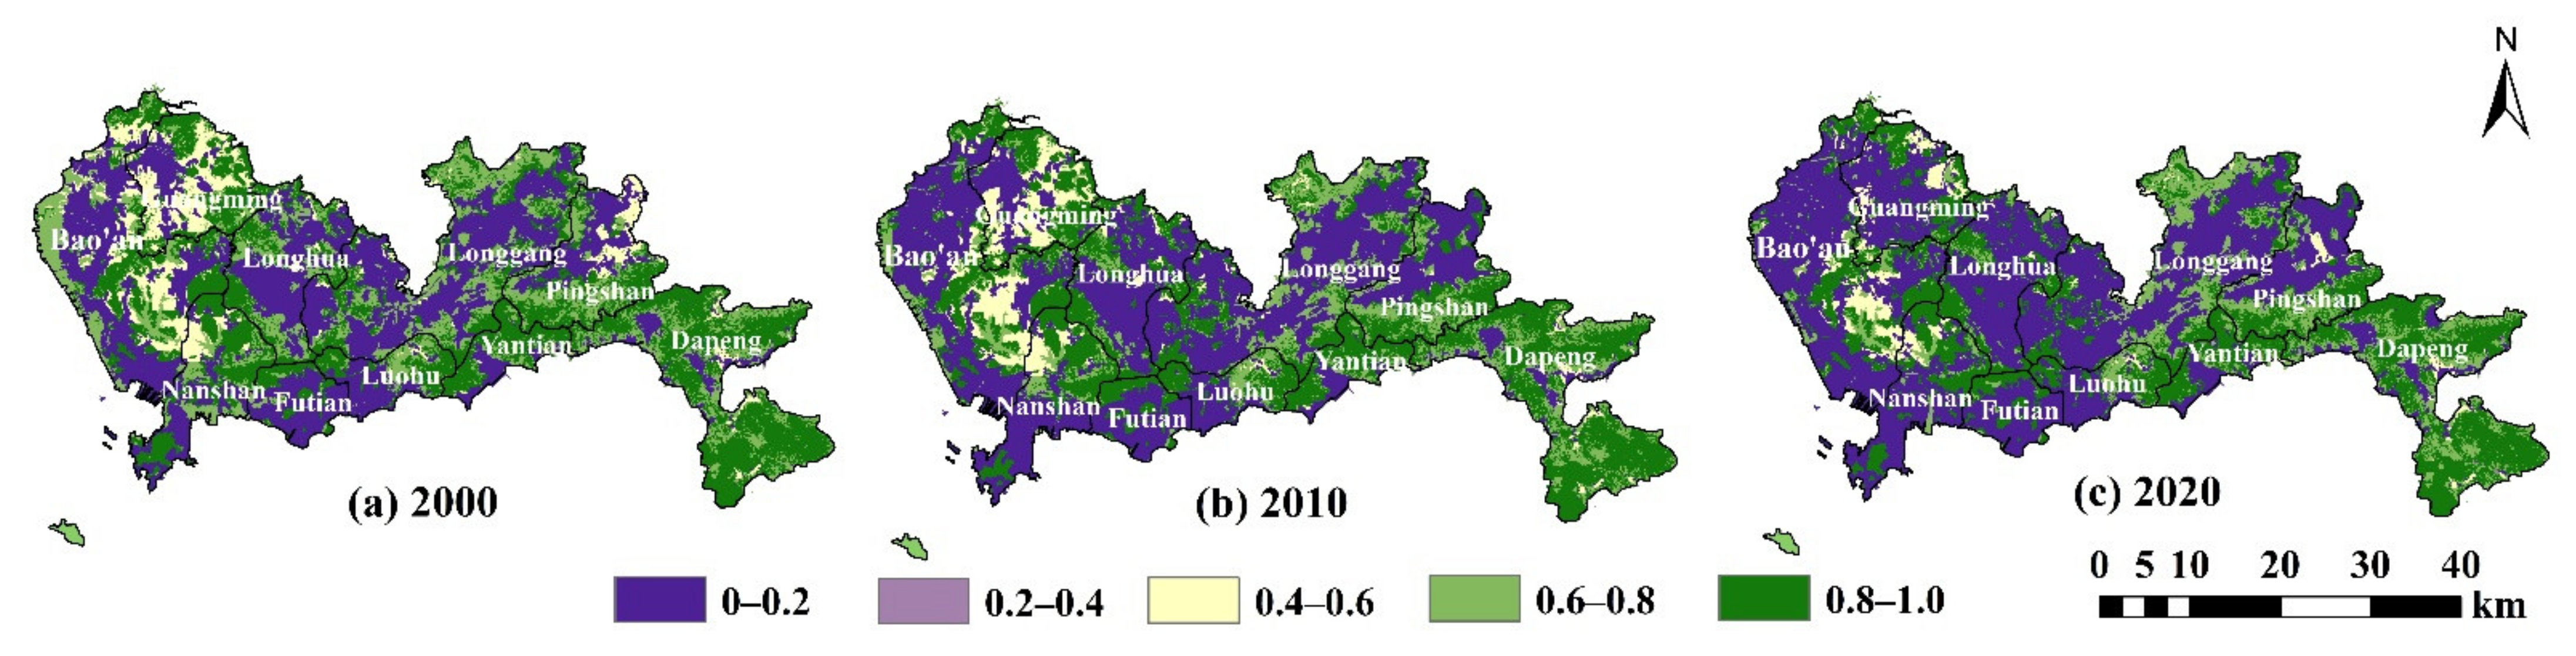
| Habitat Quality Grade | 2000 | 2010 | 2020 | |||
|---|---|---|---|---|---|---|
| Area (km2) | Proportion (%) | Area (km2) | Proportion (%) | Area (km2) | Proportion (%) | |
| Lowest | 663.58 | 35.07% | 789.82 | 41.76% | 927.28 | 49.03% |
| Lower | 0.05 | 0.00% | 0.00 | 0.00% | 0.76 | 0.04% |
| Moderate | 149.23 | 7.89% | 117.98 | 6.24% | 70.16 | 3.71% |
| Higher | 420.38 | 22.22% | 323.54 | 17.11% | 291.80 | 15.43% |
| Highest | 658.92 | 34.82% | 660.04 | 34.90% | 601.40 | 31.80% |
| Appropriate Partition Type | Area | Ecological Security Zones | Grading | Area | Proportion |
|---|---|---|---|---|---|
| (km2) | Range | (km2) | |||
| Suitable ecological land | 658.56 | Ecological preservation zone | −0.86−0.11 | 114.23 | 5.72% |
| Limited construction zone | −0.11–0.00 | 544.33 | 27.25% | ||
| Suitable urban land | 1338.91 | Optimized construction zone | 0.00–0.26 | 997.74 | 49.95% |
| Key construction zone | 0.26–0.65 | 341.17 | 17.08% |
| Land-Use Types | Ecological Preservation Zone | Limited Construction Zone | Optimized Construction Zone | Key Construction Zone | ||||
|---|---|---|---|---|---|---|---|---|
| Area (km2) | Proportion | Area (km2) | Proportion | Area (km2) | Proportion | Area (km2) | Proportion | |
| Cultivated land | 1.87 | 1.64% | 27.47 | 5.05% | 35.17 | 3.53% | 4.63 | 1.36% |
| Grassland | 2.99 | 2.61% | 8.27 | 1.52% | 8.72 | 0.87% | 1.29 | 0.38% |
| Forest | 100.95 | 88.37% | 346.86 | 63.72% | 205.28 | 20.57% | 28.23 | 8.27% |
| Built area | 1.78 | 1.56% | 126.81 | 23.30% | 692.57 | 69.41% | 296.70 | 86.96% |
| Water area | 1.65 | 1.44% | 15.11 | 2.78% | 22.35 | 2.24% | 4.90 | 1.43% |
| Shurb land | 4.72 | 4.14% | 19.69 | 3.62% | 33.63 | 3.37% | 5.43 | 1.59% |
| Bare land | 0.27 | 0.23% | 0.13 | 0.02% | 0.00 | 0.00% | 0.00 | 0.00% |
| Total | 114.23 | 100.00% | 544.33 | 100.00% | 997.74 | 100.00% | 341.17 | 100.00% |
| Ecological Source Number | 1 | 2 | 3 | 4 | 5 | 6 | 7 | 8 | 9 | 10 |
|---|---|---|---|---|---|---|---|---|---|---|
| 1 | 0.00 | 2.16 | 0.74 | 0.64 | 0.56 | 0.36 | 0.40 | 0.34 | 0.27 | 0.21 |
| 2 | 0.00 | 2.91 | 2.20 | 3.09 | 1.83 | 1.74 | 1.17 | 0.82 | 0.52 | |
| 3 | 0.00 | 28.13 | 3.21 | 0.30 | 0.33 | 0.27 | 0.21 | 0.15 | ||
| 4 | 0.00 | 4.22 | 0.30 | 0.30 | 0.25 | 0.21 | 0.15 | |||
| 5 | 0.00 | 0.77 | 0.56 | 0.44 | 0.43 | 0.28 | ||||
| 6 | 0.00 | 2.95 | 1.65 | 2.34 | 0.83 | |||||
| 7 | 0.00 | 9.88 | 3.29 | 1.00 | ||||||
| 8 | 0.00 | 13.86 | 2.10 | |||||||
| 9 | 0.00 | 4.62 | ||||||||
| 10 | 0.00 |
| Land-Use Types | 30 m | 60 m | 100 m | 200 m | ||||
|---|---|---|---|---|---|---|---|---|
| Area (km2) | Percentage (%) | Area (km2) | Percentage (%) | Area (km2) | Percentage (%) | Area (km2) | Percentage (%) | |
| Cultivated land | 0.60 | 2.74% | 1.11 | 2.64% | 1.82 | 2.65% | 3.74 | 2.85% |
| Forest | 12.81 | 59.02% | 24.83 | 58.77% | 39.71 | 57.72% | 72.13 | 54.94% |
| Grassland | 1.12 | 5.15% | 2.20 | 5.22% | 3.69 | 5.37% | 7.43 | 5.66% |
| Shurb land | 2.62 | 12.06% | 5.11 | 12.09% | 8.44 | 12.28% | 16.24 | 12.37% |
| Water area | 0.93 | 4.30% | 1.76 | 4.17% | 2.81 | 4.08% | 5.31 | 4.05% |
| Built area | 3.63 | 16.73% | 7.23 | 17.11% | 12.31 | 17.90% | 26.43 | 20.13% |
Publisher’s Note: MDPI stays neutral with regard to jurisdictional claims in published maps and institutional affiliations. |
© 2021 by the authors. Licensee MDPI, Basel, Switzerland. This article is an open access article distributed under the terms and conditions of the Creative Commons Attribution (CC BY) license (https://creativecommons.org/licenses/by/4.0/).
Share and Cite
Zhang, Y.-Z.; Jiang, Z.-Y.; Li, Y.-Y.; Yang, Z.-G.; Wang, X.-H.; Li, X.-B. Construction and Optimization of an Urban Ecological Security Pattern Based on Habitat Quality Assessment and the Minimum Cumulative Resistance Model in Shenzhen City, China. Forests 2021, 12, 847. https://doi.org/10.3390/f12070847
Zhang Y-Z, Jiang Z-Y, Li Y-Y, Yang Z-G, Wang X-H, Li X-B. Construction and Optimization of an Urban Ecological Security Pattern Based on Habitat Quality Assessment and the Minimum Cumulative Resistance Model in Shenzhen City, China. Forests. 2021; 12(7):847. https://doi.org/10.3390/f12070847
Chicago/Turabian StyleZhang, Yu-Zhe, Zhi-Yun Jiang, Yang-Yang Li, Zhi-Guang Yang, Xiao-Hong Wang, and Xian-Bing Li. 2021. "Construction and Optimization of an Urban Ecological Security Pattern Based on Habitat Quality Assessment and the Minimum Cumulative Resistance Model in Shenzhen City, China" Forests 12, no. 7: 847. https://doi.org/10.3390/f12070847