Article

The Influence of Deforestation on Land Surface Temperature—A Case Study of Perak and Kedah, Malaysia

by
Wan Shafrina Wan Mohd Jaafar
1,
Khairul Nizam Abdul Maulud
1,2,*,
Aisyah Marliza Muhmad Kamarulzaman
1,
Asif Raihan
1,
Syarina Md Sah
1,
Azizah Ahmad
1,
Siti Nor Maizah Saad
1,3,
Ahmad Tarmizi Mohd Azmi
1,
Nur Khairun Ayuni Jusoh Syukri
1 and
Waseem Razzaq Khan
4
1
Earth Observation Centre, Institute of Climate Change, Universiti Kebangsaan Malaysia, Bangi 43600, Selangor, Malaysia
2
Department of Civil Engineering, Faculty of Engineering and Built Environment, Universiti Kebangsaan Malaysia, Bangi 43600, Selangor, Malaysia
3
Department of Surveying Science and Geomatics, Faculty of Architecture, Planning & Surveying, Universiti Teknologi Mara, Perlis 02600, Malaysia
4
Institut Ekosains Borneo, Universiti Putra Malaysia Kampus Bintulu, Sarawak 97008, Malaysia
*
Author to whom correspondence should be addressed.
Forests 2020, 11(6), 670; https://doi.org/10.3390/f11060670
Submission received: 24 April 2020 / Revised: 30 May 2020 / Accepted: 8 June 2020 / Published: 11 June 2020

Abstract

:
Over the past few decades, there has been a rapid change in forest and land cover, especially in tropical forests due to massive deforestation. The major factor responsible for the changes is to fulfill the growing demand of increasing population through agricultural intensification, rural settlements, and urbanization. Monitoring forest cover and vegetation are essential for detecting regional and global environmental changes. The present study evaluates the influence of deforestation on land surface temperature (LST) in the states of Kedah and Perak, Malaysia, between 1988 and 2017. The trend in forest cover change over the time span of 29 years, was analyzed using Landsat 5 and Landsat 8 satellite images to map the sequence of forest cover change. With the measurement of deforestation and its relationship with LST as an end goal, the Normalized Difference Vegetation Index (NDVI) was used to determine forest health, and the spectral radiance model was used to extract the LST. The findings of the study show that nearly 16% (189,423 ha) of forest cover in Perak and more than 9% (33,391 ha) of forest cover in Kedah have disappeared within these 29 years as a result of anthropogenic activities. The correlation between the LST and NDVI is related to the distribution of forests, where LST is inversely related to NDVI. A strong correlation between LST and NDVI was observed in this study, where the average mean of LST in Kedah (25 °C) is higher than in Perak (22.6 °C). This is also reflected by the decreased NDVI value from 0.6 to 0.5 in 2017 at both states. This demonstrated that a decrease in the vegetation area leads to an increase in the surface temperature. The resultant forest change map would be helpful for forest management in terms of identifying highly vulnerable areas. Moreover, it could help the local government to formulate a land management plan.

1. Introduction

Land cover and land use change are one of the major drivers that affect land surface temperature (LST). This relation is even more pronounced at urban forest interfaces where forests are crucial in maintaining micro and regional climate [1]. Temperature regimes of the land surface can undergo changes in the form of change in energy balance, evapotranspiration and precipitation [2]. Deforestation can accelerate climate warming, directly as a result of surface albedo and indirectly due to the increase of greenhouse gasses. It is also one of the main causes of biodiversity loss around the world [3]. According to the International Tropical Timber Organization (ITTO) of the United Nations, it is estimated that deforestation will rise to 12.9 million ha per year; the current area of degraded forest is 850 million ha [4]. Moreover, the effects of deforestation on rising local temperatures can result in the loss of microclimate conditions associated with forests. Deng et al. agreed that vegetation could effectively influence land surface temperature (LST) by selectively absorbing and reflecting solar radiation energy and regulating latent and sensible heat exchange.
Land surface temperature is the measurement of the emission of thermal infrared radiation, in other words, radiometric temperature. LST has a significant spatial variation, especially over heterogeneous land cover, and it is challenging to obtain in-situ measurements; therefore, sensors onboard various platforms can be used to retrieve regional and global estimates of LST [5]. For instance, OLI (Operational Land Imager) and TIRS (Thermal Infrared Sensor) on the Landsat 8 satellite can be used to derive spatial and temporal characteristics of LST [6]. Since LST is responsive to soil moisture content and changes in vegetation, some land change processes, such as forest conversion, can be used to understand and predict changing heat flux exchange, local surface energy balance, and local climatic trends [7]. Various studies have used satellite-derived LST to investigate the relationship between the Normalized Difference Vegetation Index (NDVI) and LST in watershed areas using Landsat 8 [8], quantify the impact of urban land use zoning on environmental quality [9], the effect on surface temperature due to expansion of cash crops in Indonesia [10], cooling in urban areas due to green spaces [11] and warming over pastures in comparison to forested land [12,13].
Some studies have implied NDVI (Normalized Difference Vegetation Index) as an indicator in the study of the relationship between LST and vegetation using remote sensing and ground-based observation data [1,9,14,15,16,17]. NDVI is a simple numerical indicator that can be used to measure the vegetation cover change and photosynthetic activity [18]. It acts as a proxy to biomass concentration [19]. A combination of LST and the NDVI algorithm takes advantage of the fact that photosynthetically active vegetation reflects more NIR and less thermal energy, respectively. In comparison, sparse or deforested areas reflect less NIR and more thermal radiation. Peng et. al. reported that afforestation in China has caused a decrease in the LST of day-time and an increase in the LST of night-time by approximately 1.1K and 0.2K, respectively, while [17] reported that changes of forest to other land uses, such as grassland, has caused ecological responses in the local, regional climates in South America and central Africa. To the best of our knowledge, little has been studied on comparing forest decadal changes on the tropical rainforest of Southeast Asia as well as quantifying the implication of such changes on land surface temperature. Perak and Kedah are two states in Malaysia that have grown at a faster pace than the national growth with respect to agriculture, mining, and quarrying and manufacturing economic activities [20]. These economic activities may influence forest change patterns as the cities are growing.
This paper focuses on the application of remote sensing in identifying possible changes in LST as a result of deforestation and land use changes in Perak and Kedah, such as clear-cutting, forest conversion to palm oil plantation, agriculture, settlements, and mining activities. NDVI was used as an indicator for stable forests, deforestation, and different land change processes. Space-borne multispectral Landsat imageries were used to investigate the effect of deforestation on land surface temperature in Perak and Kedah, Malaysia, between 1988 and 2017 by using the spectral radiance model. We verified the forest decadal changes trend and their implications on LST between the two states with supporting secondary data received from the Forestry Department of Peninsular Malaysia, Malaysian Meteorological Department, and PLANMalaysia (Department of Town and Country Planning).

2. Materials and Methods
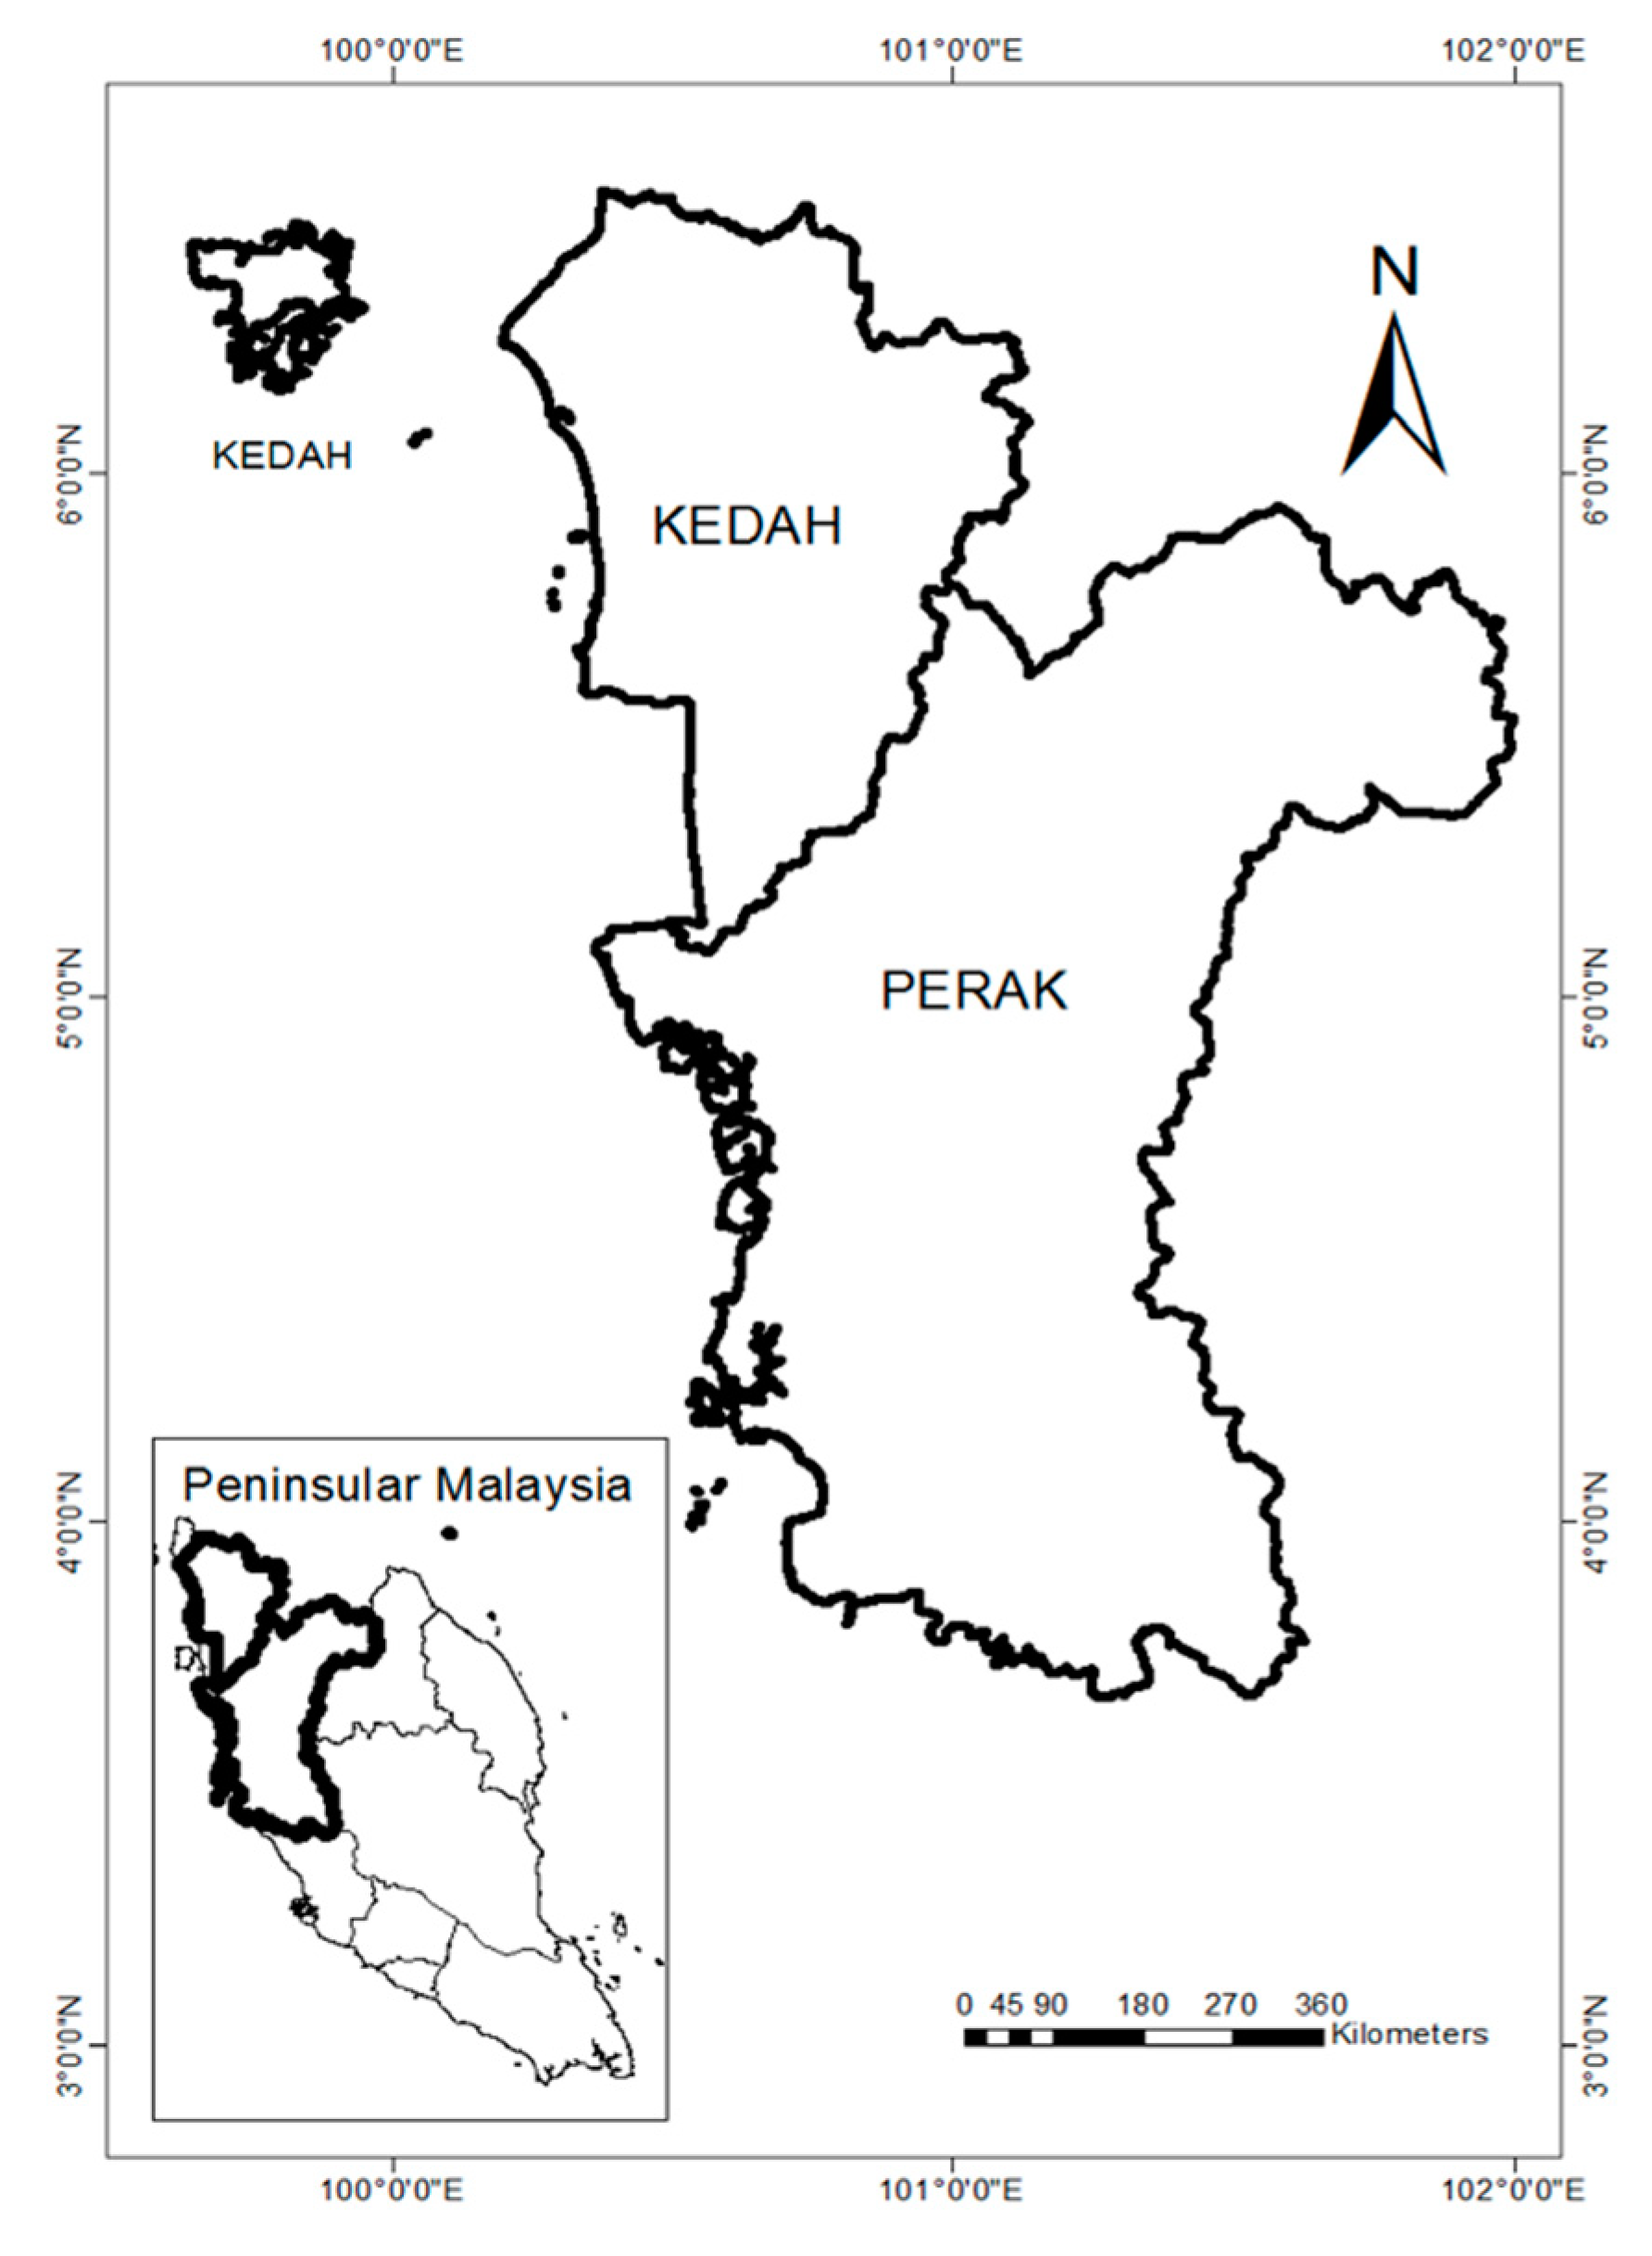
2.1. Study Area

Our approach to mapping forest degradation based on time series data was tested in the Perak and Kedah area. These two states of Malaysia are located in the northwestern part of Peninsular Malaysia (Figure 1). Perak has a forested area of 1,019.052 ha and Kedah with a forested area of 330,585 ha. Total forest cover for the two states is 1,349,617 ha. Forests in Perak and Kedah states consist of mangrove forest, peat swamp forest, lowland dipterocarp forest, hill dipterocarp forest, upperhill dipterocarp forest, oak montana forest, and ericaceous forest. Perak and Kedah are covered with 95.6% tropical rainforest and 4.4% mangrove forest.

2.2. Satellite Data

Landsat-5 Thematic Mapper (TM) and Landsat-8 Operational Land Images (OLI) multispectral image series data were used to analyse the temporal changes of Kedah and Perak forest. In order to obtain an average of each band rather than using a single date to represent the whole month, two images taken within the same month with less cloud cover were used in each year. In total, 36 satellite images from Landsat-5 and 12 satellite images from Landsat-8 from each state were used to conduct the analysis in this study. All images were taken during the month of June during the dry period of the Southwest Monsoon season, where Peninsular Malaysia generally experiences clear skies and contained less than 10% cloud coverage. The hand removal of cloud pixels were conducted further to only retain pixels representing the surface temperature. Landsat-5 images covering Kedah and Perak states were partly overlapped with Landsat-8 images of Kedah and Perak, but each image was treated separately. The satellite imageries were geometrically, atmospherically, and radiometrically corrected to improve the image quality and seeing that the spatial resolution is varying at different maps, pixels for all channels were resampled to 30 m to retain the highest resolution possible. The image processing procedure and the evaluation of multitemporal satellite image series were performed using ERDAS Imagine and ArcGIS software. Table 1 shows the satellite scenes that were used for NDVI derivation, land surface temperature, the production of seamless mosaic images, and forest cover change detection mapping over Perak, and Kedah states.

2.3. Meteorological Data

Meteorological data were obtained from the Malaysia Meteorological Department [21], which provides hourly data for Kedah and Perak states. The data were then averaged to obtain specific measures of ambient temperature and precipitation at monthly and annual reading. Three meteorological stations in Kedah and four meteorological stations in Perak were available with a complete hourly and monthly reading (Table 2). In this study, we attempted to reveal the correlation between NDVI and meteorological factors to observe how much meteorological factors, such as air temperature and precipitation, can affect plant growth (health).

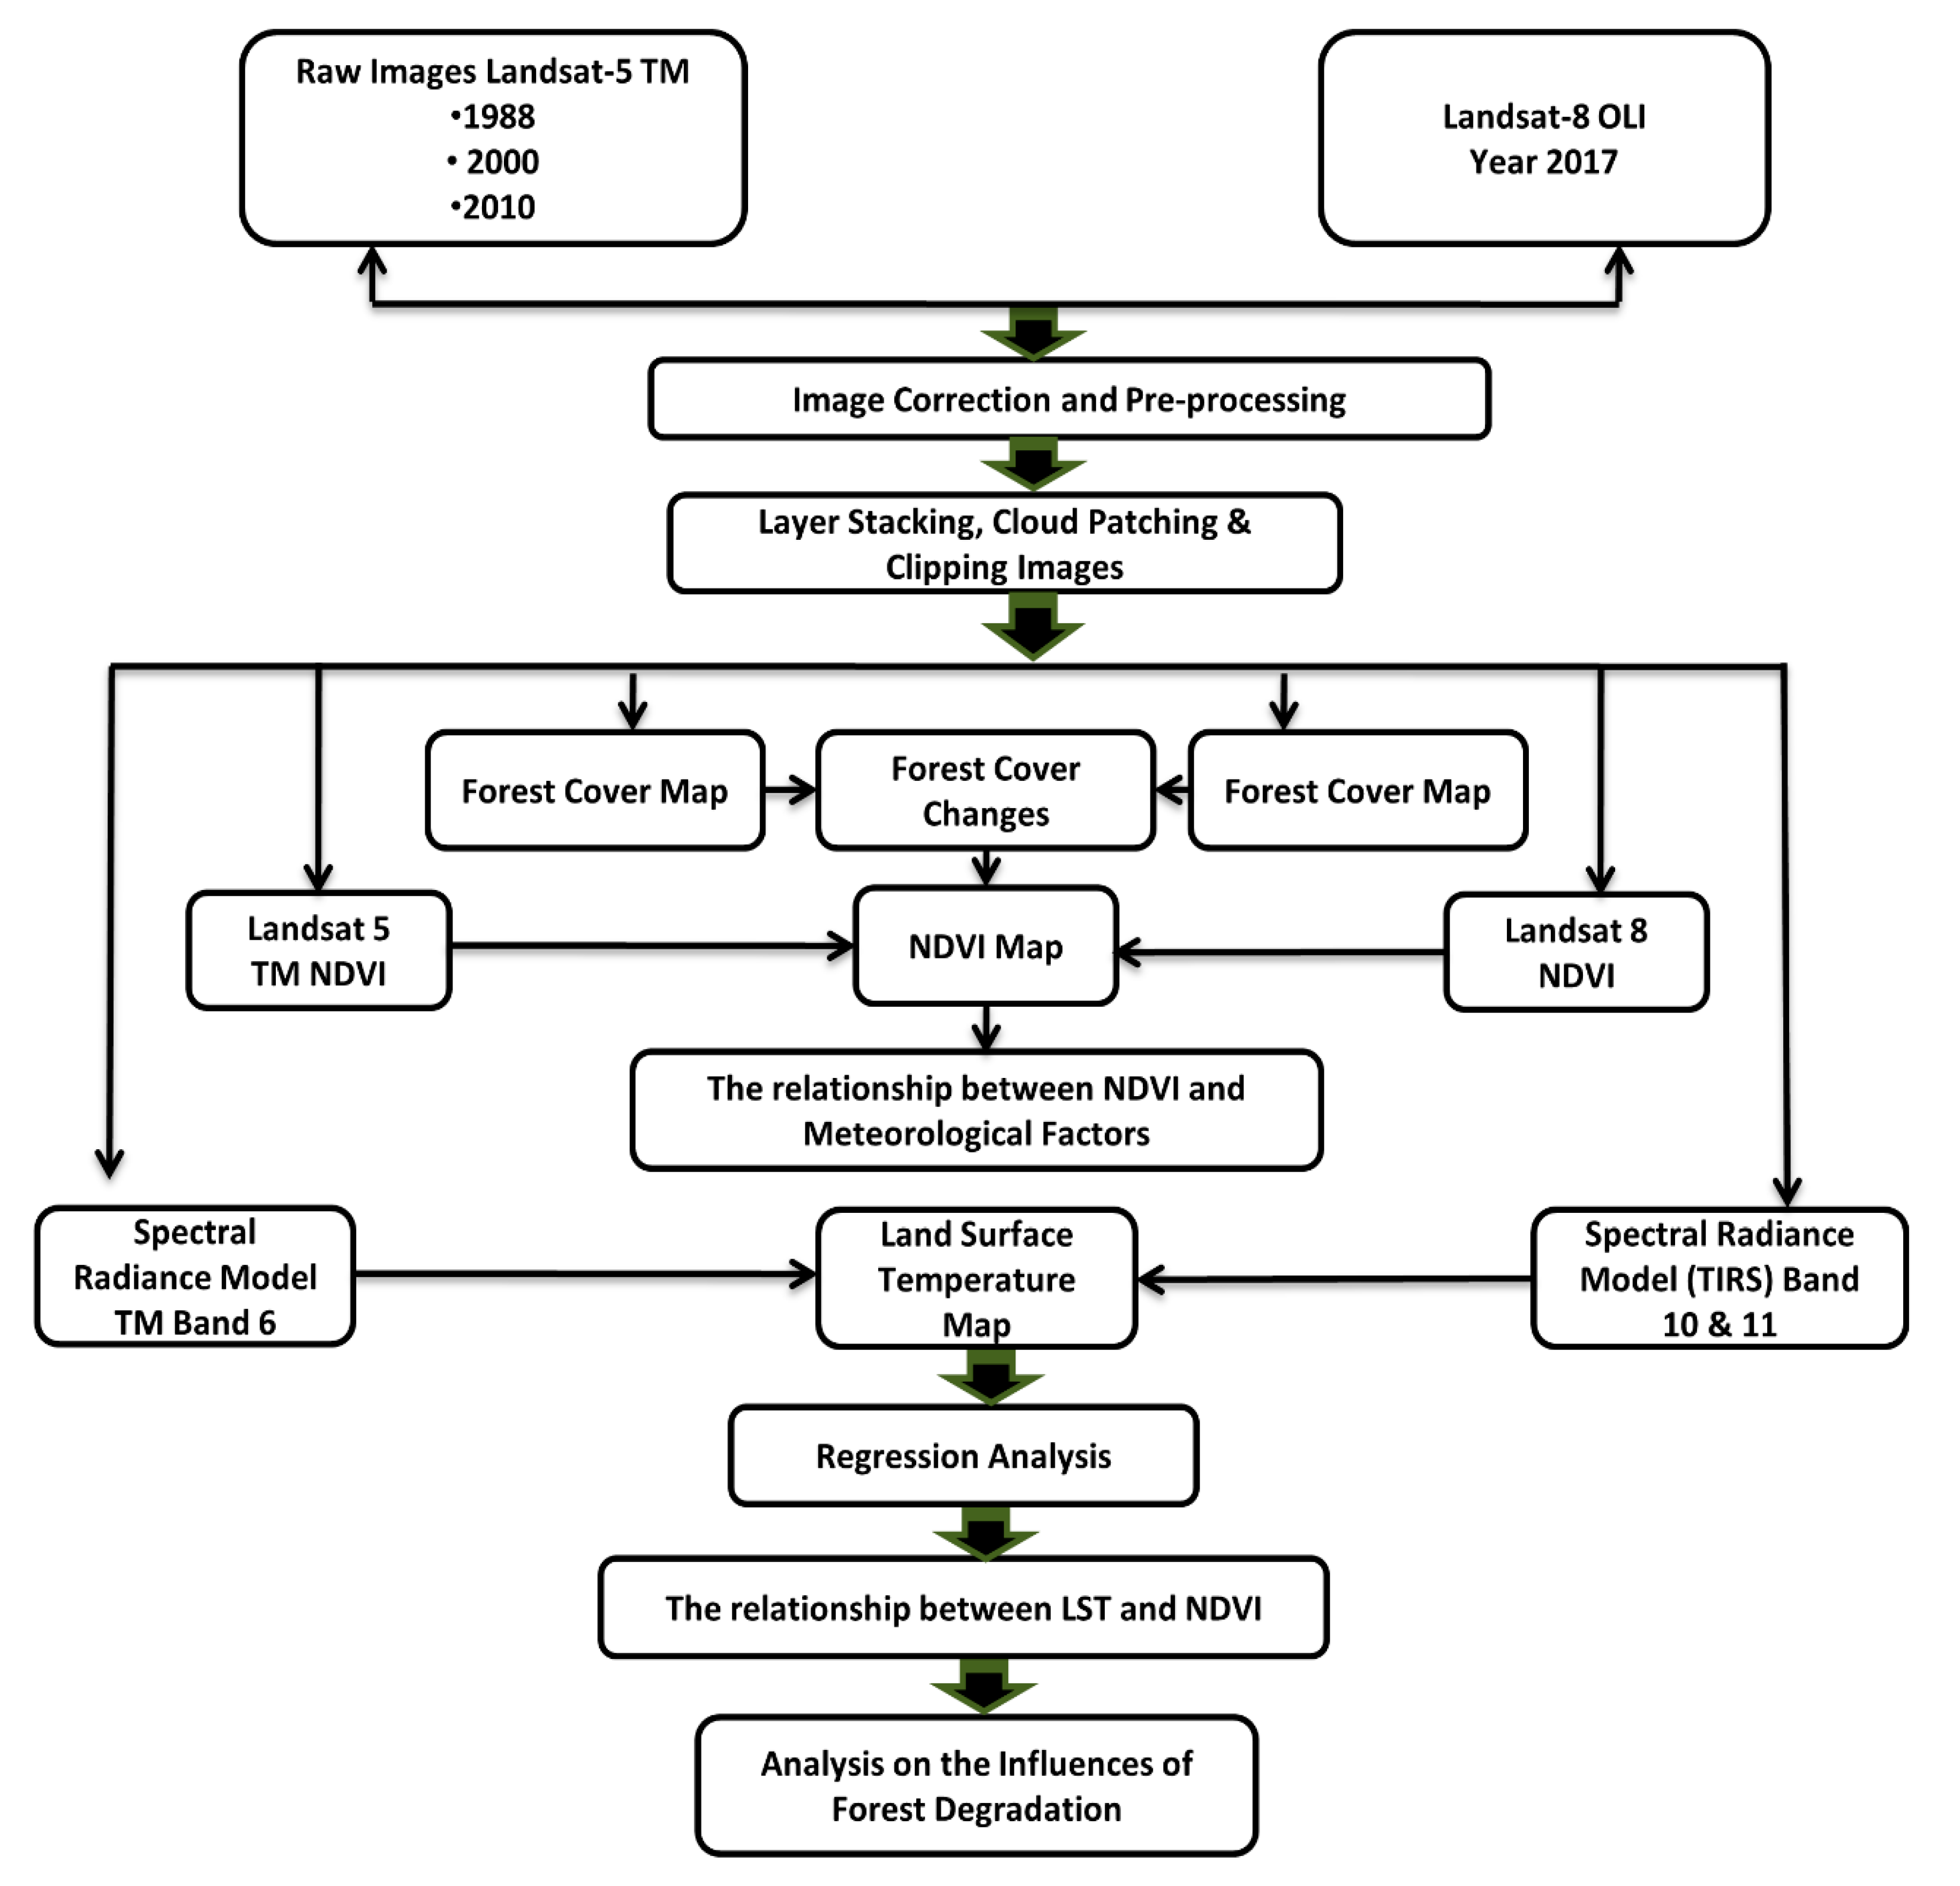
2.4. Forest Cover Change Extraction

In this study, we used geometrically rectified and enhanced Landsat scenes data to extract forest cover change, and this may refer to either an increase or decrease of forest cover, which can be interpreted as deforestation or afforestation. The boundaries of the delineated forest were digitized from the Landsat scene using reference forest polygons obtained from the Forestry Department of Peninsular Malaysia for both states.
The forested landscape in the study area was divided into zoning blocks from north to south to analyse forest changes in both states, Perak and Kedah. Through this zoning blocks division, it is easier to understand areas of ground affected by forest loss and relevant intervention that might be required to improve the quality of forest cover. Analysis by blocks also makes it easier to study the type of land use that replaces forest cover.
The land use data for Kedah and Perak were obtained from the PLANMalaysia (Federal Department of Town and Country Planning), which were received in the printed version; these data were classified as strictly confidential and were used as reference (personal communication, 1 November 2018) [22]. The landuse data for the years 1988, 2000, 2010, and 2017 were used for the purpose of identifying which land use activity has caused forest change, in order to justify the Normalized Difference Vegetation Index (NDVI) and Land Surface Temperature analysis results.

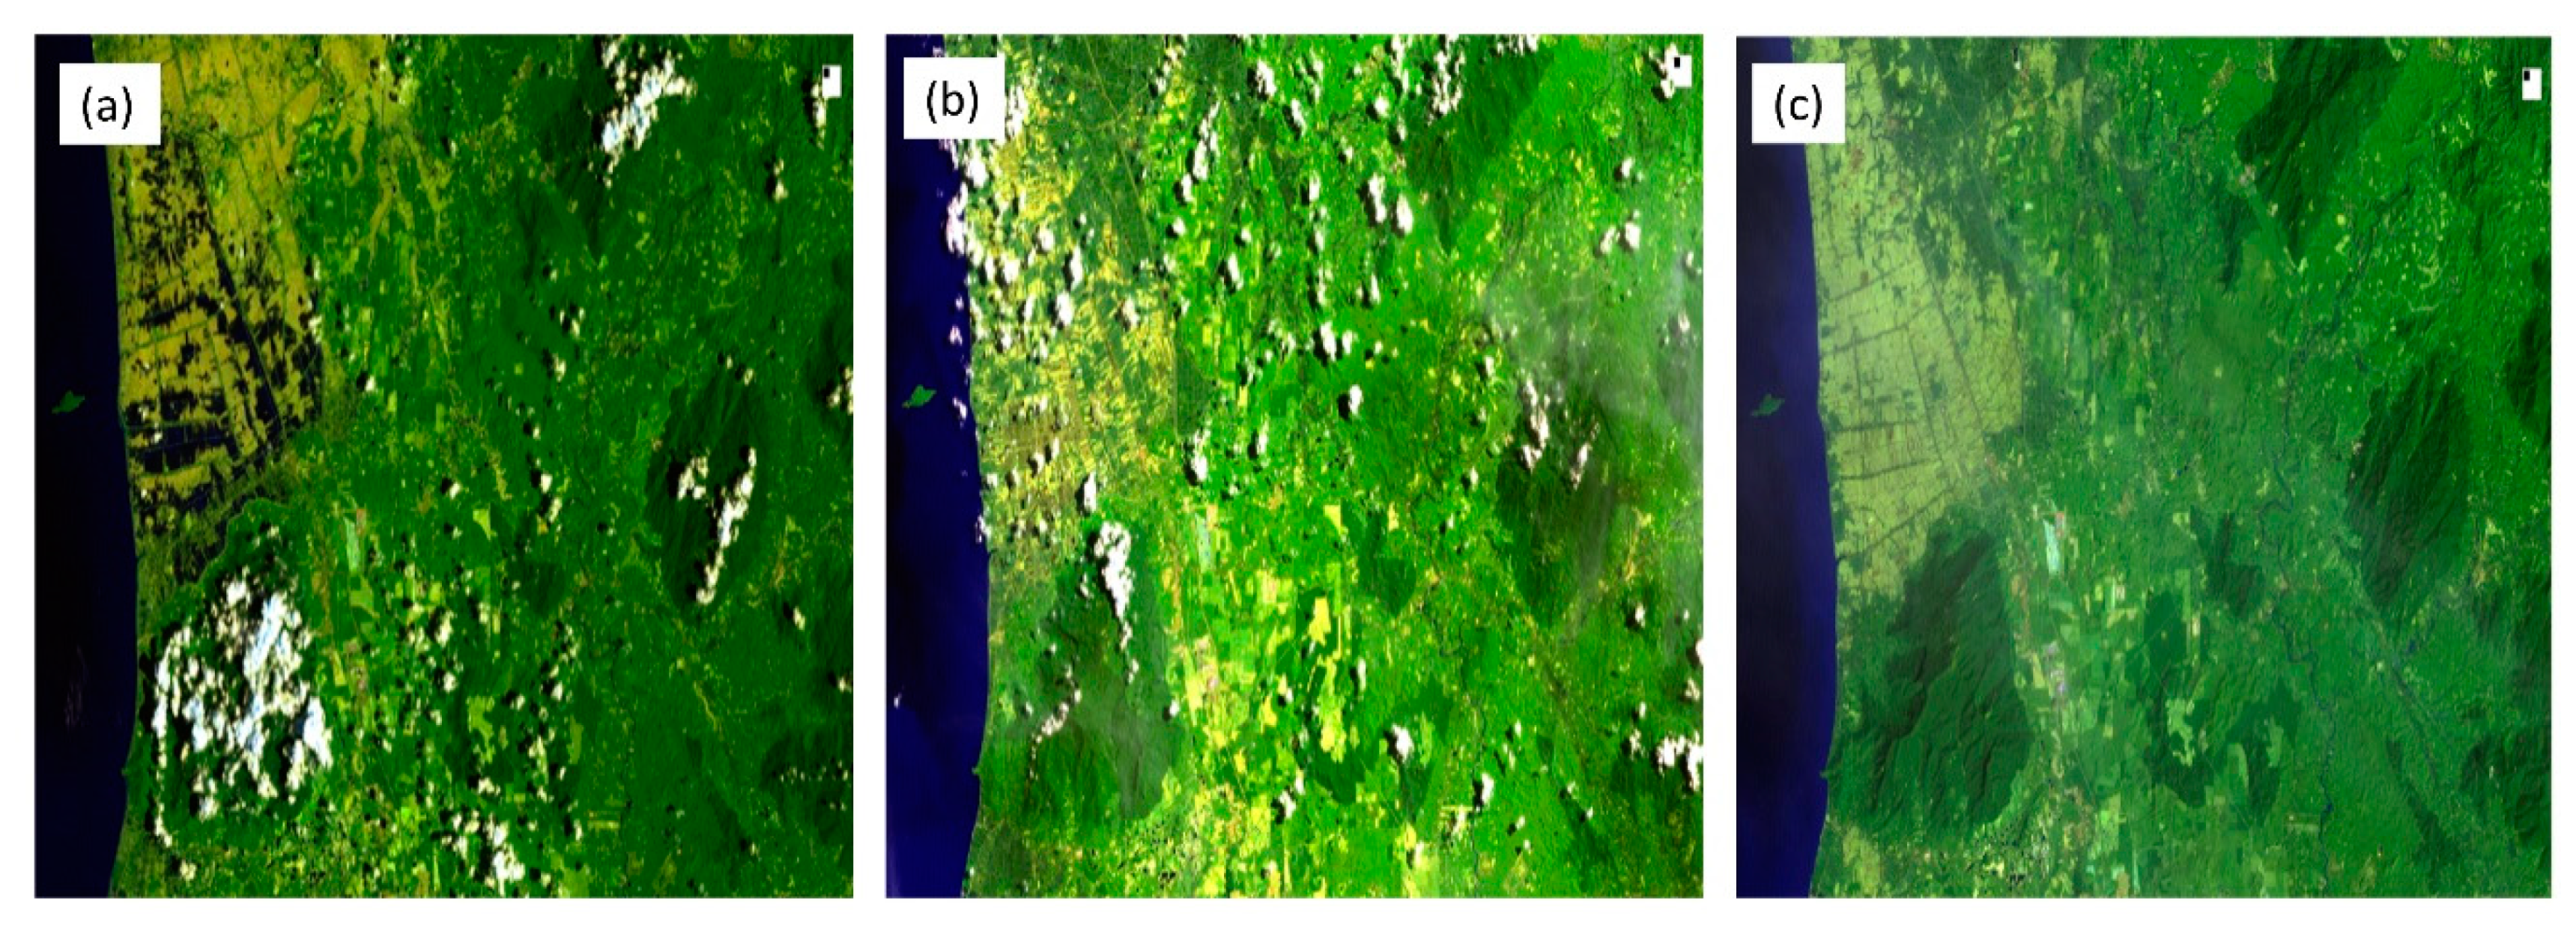
2.5. Seamless Image Mosaicking

To create a seamless image, cloud patching on every single satellite scene was conducted using the F Mask algorithm. Images with cloud cover less than 10% were retained, and the remaining cloud contaminated pixels were further removed by GIS operators using GIS software before the analysis.
For each satellite image scene, two different images that were captured at different dates for each scene were used in the cloud patching process (Figure 2). The seamless mosaic product (free cloud cover and atmospherically corrected images) were used in the subsequent processes as an input.
The F mask algorithm successfully removed 99% of cloud covers and the shadows. The algorithm also efficiently detected thin and low-temperature clouds in high altitudes through thermal sensors onboard the Landsat systems (TM, Enhanced Thematic Mapper Plus (ETM+), and OLI). Although the algorithm somehow failed to detect small patches of scattering clouds on the images, it did assist the cloud removal process and made the monitoring work on the landscape-level practical and feasible [23].

2.6. Normalized Difference Vegetation Index (NDVI)

NDVI is an index to quantify vegetation by measuring the spectral reflectance of the ground surface feature. To derive the NDVI, calibrated NIR and red bands of the Landsat images were utilized in this study. A total of 8 NDVI images with a minimal cloud cover have been selected for the years 1988, 2000, 2010, and 2017 for each state. Using images taken in the same month allowed us to limit inter-seasonal variation in vegetation density and chlorophyll activity throughout the dry period of the southwest monsoon season. To perform this study, NDVI is calculated by the following equation:
NDVI = ( NIR RED ) ( NIR + RED )
where RED and NIR stand for the spectral reflectance measurement acquired in the red and near-infrared region, respectively, the NDVI maps were classified according to their index values that vary from +1 to −1. NDVI with irrelevant values (NDVI < 0 and NDVI > 1) were recorded as NODATA. Individual images were stacked by year within a specific path/row, and the maximum value per pixel per year was extracted. Healthy vegetation is represented by high NDVI values between 0.1 and 1. Vegetated areas have positive NDVI values, whereas near 0 and negative values correspond to an absence of vegetation [24]. Non-vegetated surfaces such as water bodies yield negative values and appear black due to the absorption of NIR by water. Exposed area and land clearing will reflect very low NDVI value probably < 0.2 while sparse, and shrub vegetation and grassland may have a slightly higher NDVI value of 0.3. NDVI values, especially above 0.5, indicate dense vegetation areas [24]. The index can also be converted to a percentage.

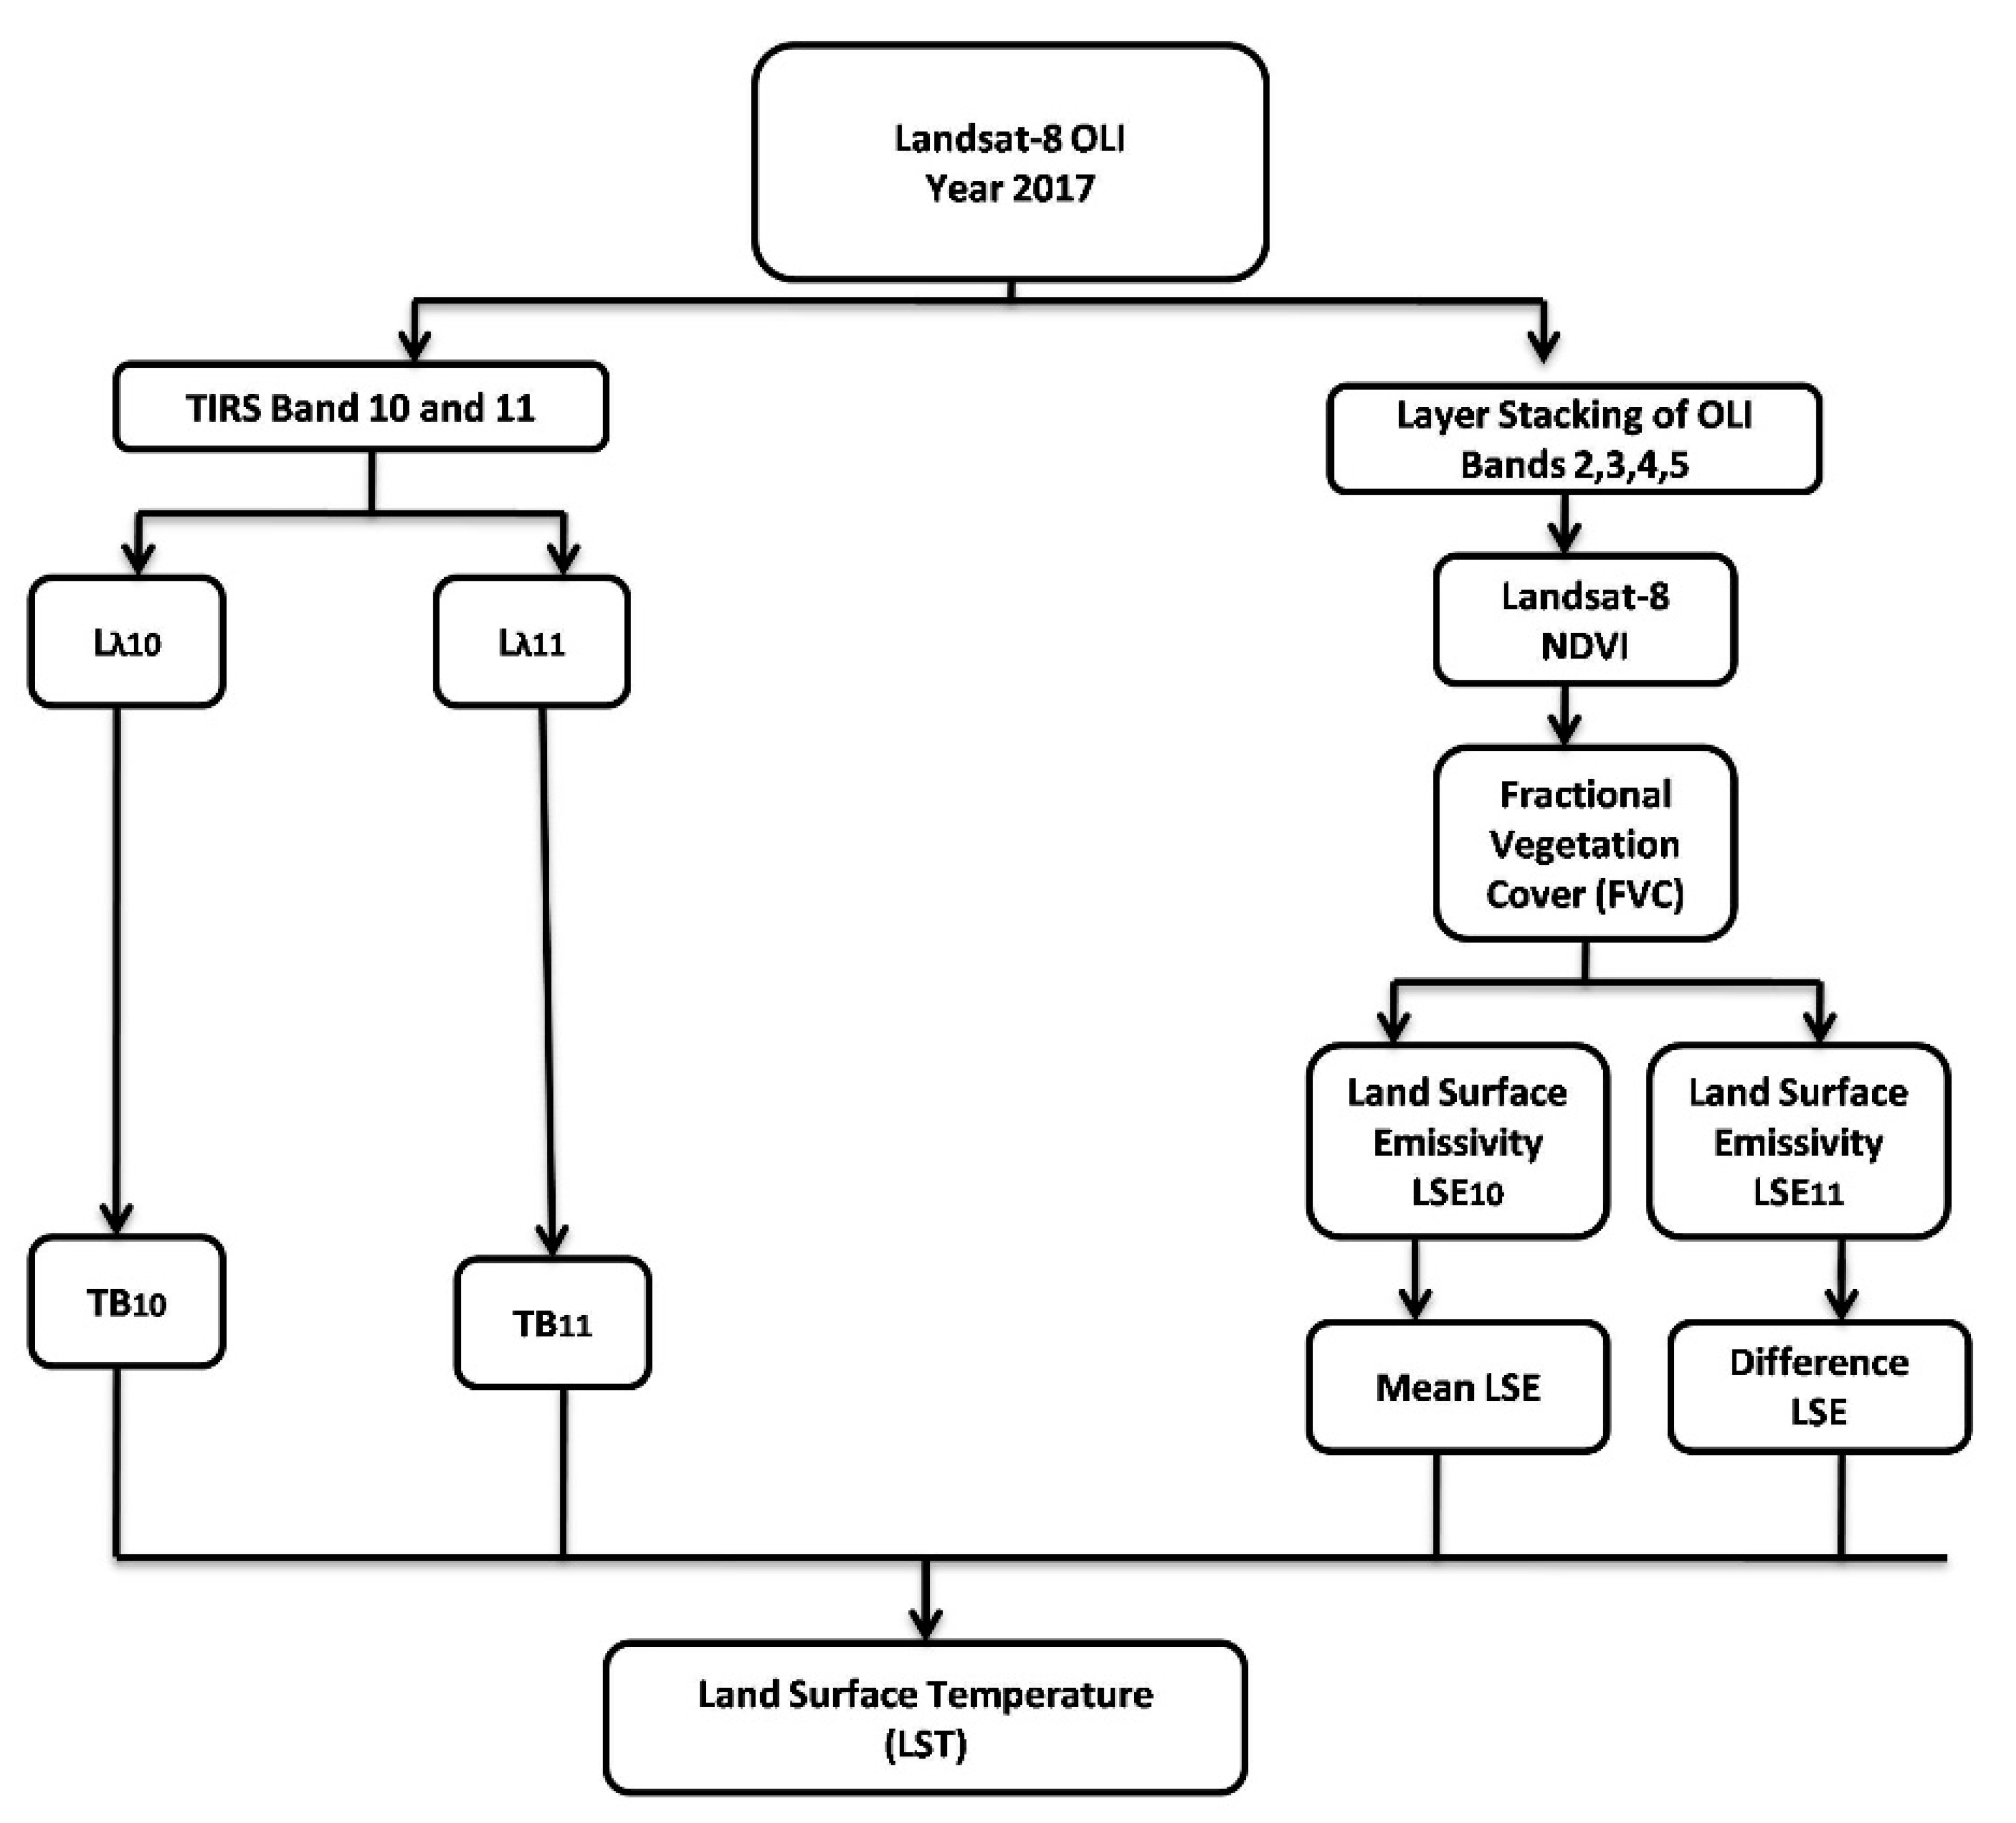
2.7. Land Surface Temperature (LST) Extraction from Landsat Imagery

Landsat 5 and Landsat 8 were used as primary data sources in evaluating LST and the effect of forest degradation in this study. The land surface temperature was derived from Landsat-5 thermal infrared (TIR) band 6 and Landsat-8 TIR band 10 and 11. All images were geometrically corrected and free from distortions related to the sensors (i.e., angle effect), rotation, earth’s surface relief, and curvature [25]. To measure LST, individual thermal images were compared between different periods. Two-step processes were conducted to retrieve radiance and brightness temperature from the Landsat-5 and Landsat-8 OLI. In the first step, the image-based method was employed to retrieve LST from Landsat TM/ETM+ data. This method was chosen due to its simplicity and validity compared to the other frequently used algorithms, such as the mono-window algorithm [26] and the single-channel algorithm [27]. The digital numbers (DNs) of thermal bands were converted to radiance based using the following formula (Section 2.7.1) by retrieving information from the header file of the images.

2.7.1. Conversion of Digital Number (DN) to Spectral Radiance

Radiance is an amount of radiation that is coming from the earth’s surface. Every single feature on earth emits radiation to the atmosphere, and it is capable of being detected by thermal sensors in the form of a digital number [28]. Equation (2) explained the process of deriving spectral radiance from the digital number value that was extracted in Landsat 5 data. In the second step, the effective at-satellite temperature of the Earth–atmosphere system, assuming a uniform emissivity, could be derived by Equation (3) [9]:
L λ = 0.0003342 D N + 0.1
where L λ is the radiance of thermal band pixels in W/ ( m 2 ster mm µ), gain is the slope of the radiance/DN conversion function, and offset is the intercept of the radiance /DN conversion [14].

2.7.2. Spectral Radiance to Brightness Temperature

Brightness temperature (TB) of a surface or feature can be extracted after the conversion of the digital number to radiance reflectance. Brightness temperature (TB) is radiance measured in the unit of temperature. Basically, any corrected emissivity (ε) would be applied to the radiant temperature [28]. The surface brightness temperature (TB) could be generated using the following equation:
T B = K 2 ln ( 1 + K 1 L λ )
  • K1 = 607.76 W·m−2·sr−1·μm−1, K2 = 1260.56 (Landsat-5 TM);
  • K1 = 666.09 W·−2·sr−1·μm−1, K2 = 1282.71 (Landsat-8 ETM+).
where T B is the effective at-satellite temperature in Kelvin (K), and both K 1 and K 2 are pre-launch calibration constants. This information was available in the Landsat metadata files for each thermal band (band 6 for Landsat 5 TM is and band 10 and 11 for Landsat 8 OLI). The NDVI determined the fractional vegetation (Fv) of each pixel using Equation (4). High LST values were found in built-up and cultivated areas whereas low LST values were found in the forest, degraded forest, floating garden and water [29].

2.7.3. Generating LST for Landsat 5 and Landsat 8 (OLI)

There are slightly different approaches to generate LST for Landsat 5 and Landsat 8. Direct LST extraction can be done for Landsat 5 based on the equation given. The LST was derived using the following equation [30]:
L S T = T B 1 + ( λ σ T B h c ) ln ε
where λ is the effective wavelength, σ is Boltzmann constant, (1.38 × 10⁻²³ J/K), h is Plank’s constant (6.626 × 10⁻³⁴ Js), c is the velocity of light in a vacuum (2.998 × 10⁻⁸ m/sec) and ε is emissivity
From the NDVI, the fractional vegetation, Fv, was determined using the following equation, [31]:
F v = ( N D V I N D V I m i n N D V I m a x N D V I m i n ) 2
where NDVImin is the minimum NDVI value where pixels are presumed to be bare soil, and NDVImax is the maximum NDVI value where pixels are considered to be healthy. dε is the geometrical distribution effect of natural surfaces and internal reflections. The value of dε is 2% for heterogeneous and corrugated surfaces.
d ε = ( 1 ε s ) ( 1 F v ) F ε v
where εv is vegetation emissivity, εs is soil emissivity, Fv is fractional vegetation and F is a shape factor [32].
ε = ε v F v + ε v ( 1 F v ) π + d ε
where ε is emissivity. From Equations (6) and (7), ε may be determined by the following equation, [31]:
ε = 0.004 F v + 0.986
Finally, the LST was derived using Equation (4) above.
The procedure of generating LST from Landsat 8 involved applying a mathematical algorithm that is known as the Split Window (SW) algorithm because Landsat 8 has two different thermal bands, band 10 and band 11 [28]. In this part, LST was generated from the calculation of Land Surface Emissivity (LSE) from the study area. LSE can be computed using the NDVI threshold technique, based on the following equations:
L S E = ε s ( 1 F V ) + ε v F V
FV = N D V I N D V I s N D V I v N D V I s
where ε s and ε v represent the value of soil and vegetation emissivity for band 10 and band 11. The value of ε s and ε v for band 10 is 0.971 and 0.987, while the value for band 11 is 0.977 and 0.989, respectively, for ε s and ε v . To obtain N D V I v   and   N D V I s , we need to reclassify the NDVI image into soil and vegetation. Finally, LST for Landsat 8 (OLI) can be generated. Figure 3 summarizes the overall workflow of generating LST for Landsat 8 (OLI) and Figure 4 summarises the overall flow of the influence of forest degradation on LST.

2.7.4. LST Kelvin (K) to Degree Celsius (°C) Conversion

The general unit of temperature generated from remote sensing processing is in Kelvin (K). Therefore, to standardize the unit of temperature, we need to transform it to degrees Celsius using the formula of 0 °C equal to 273.15 K.

3. Results

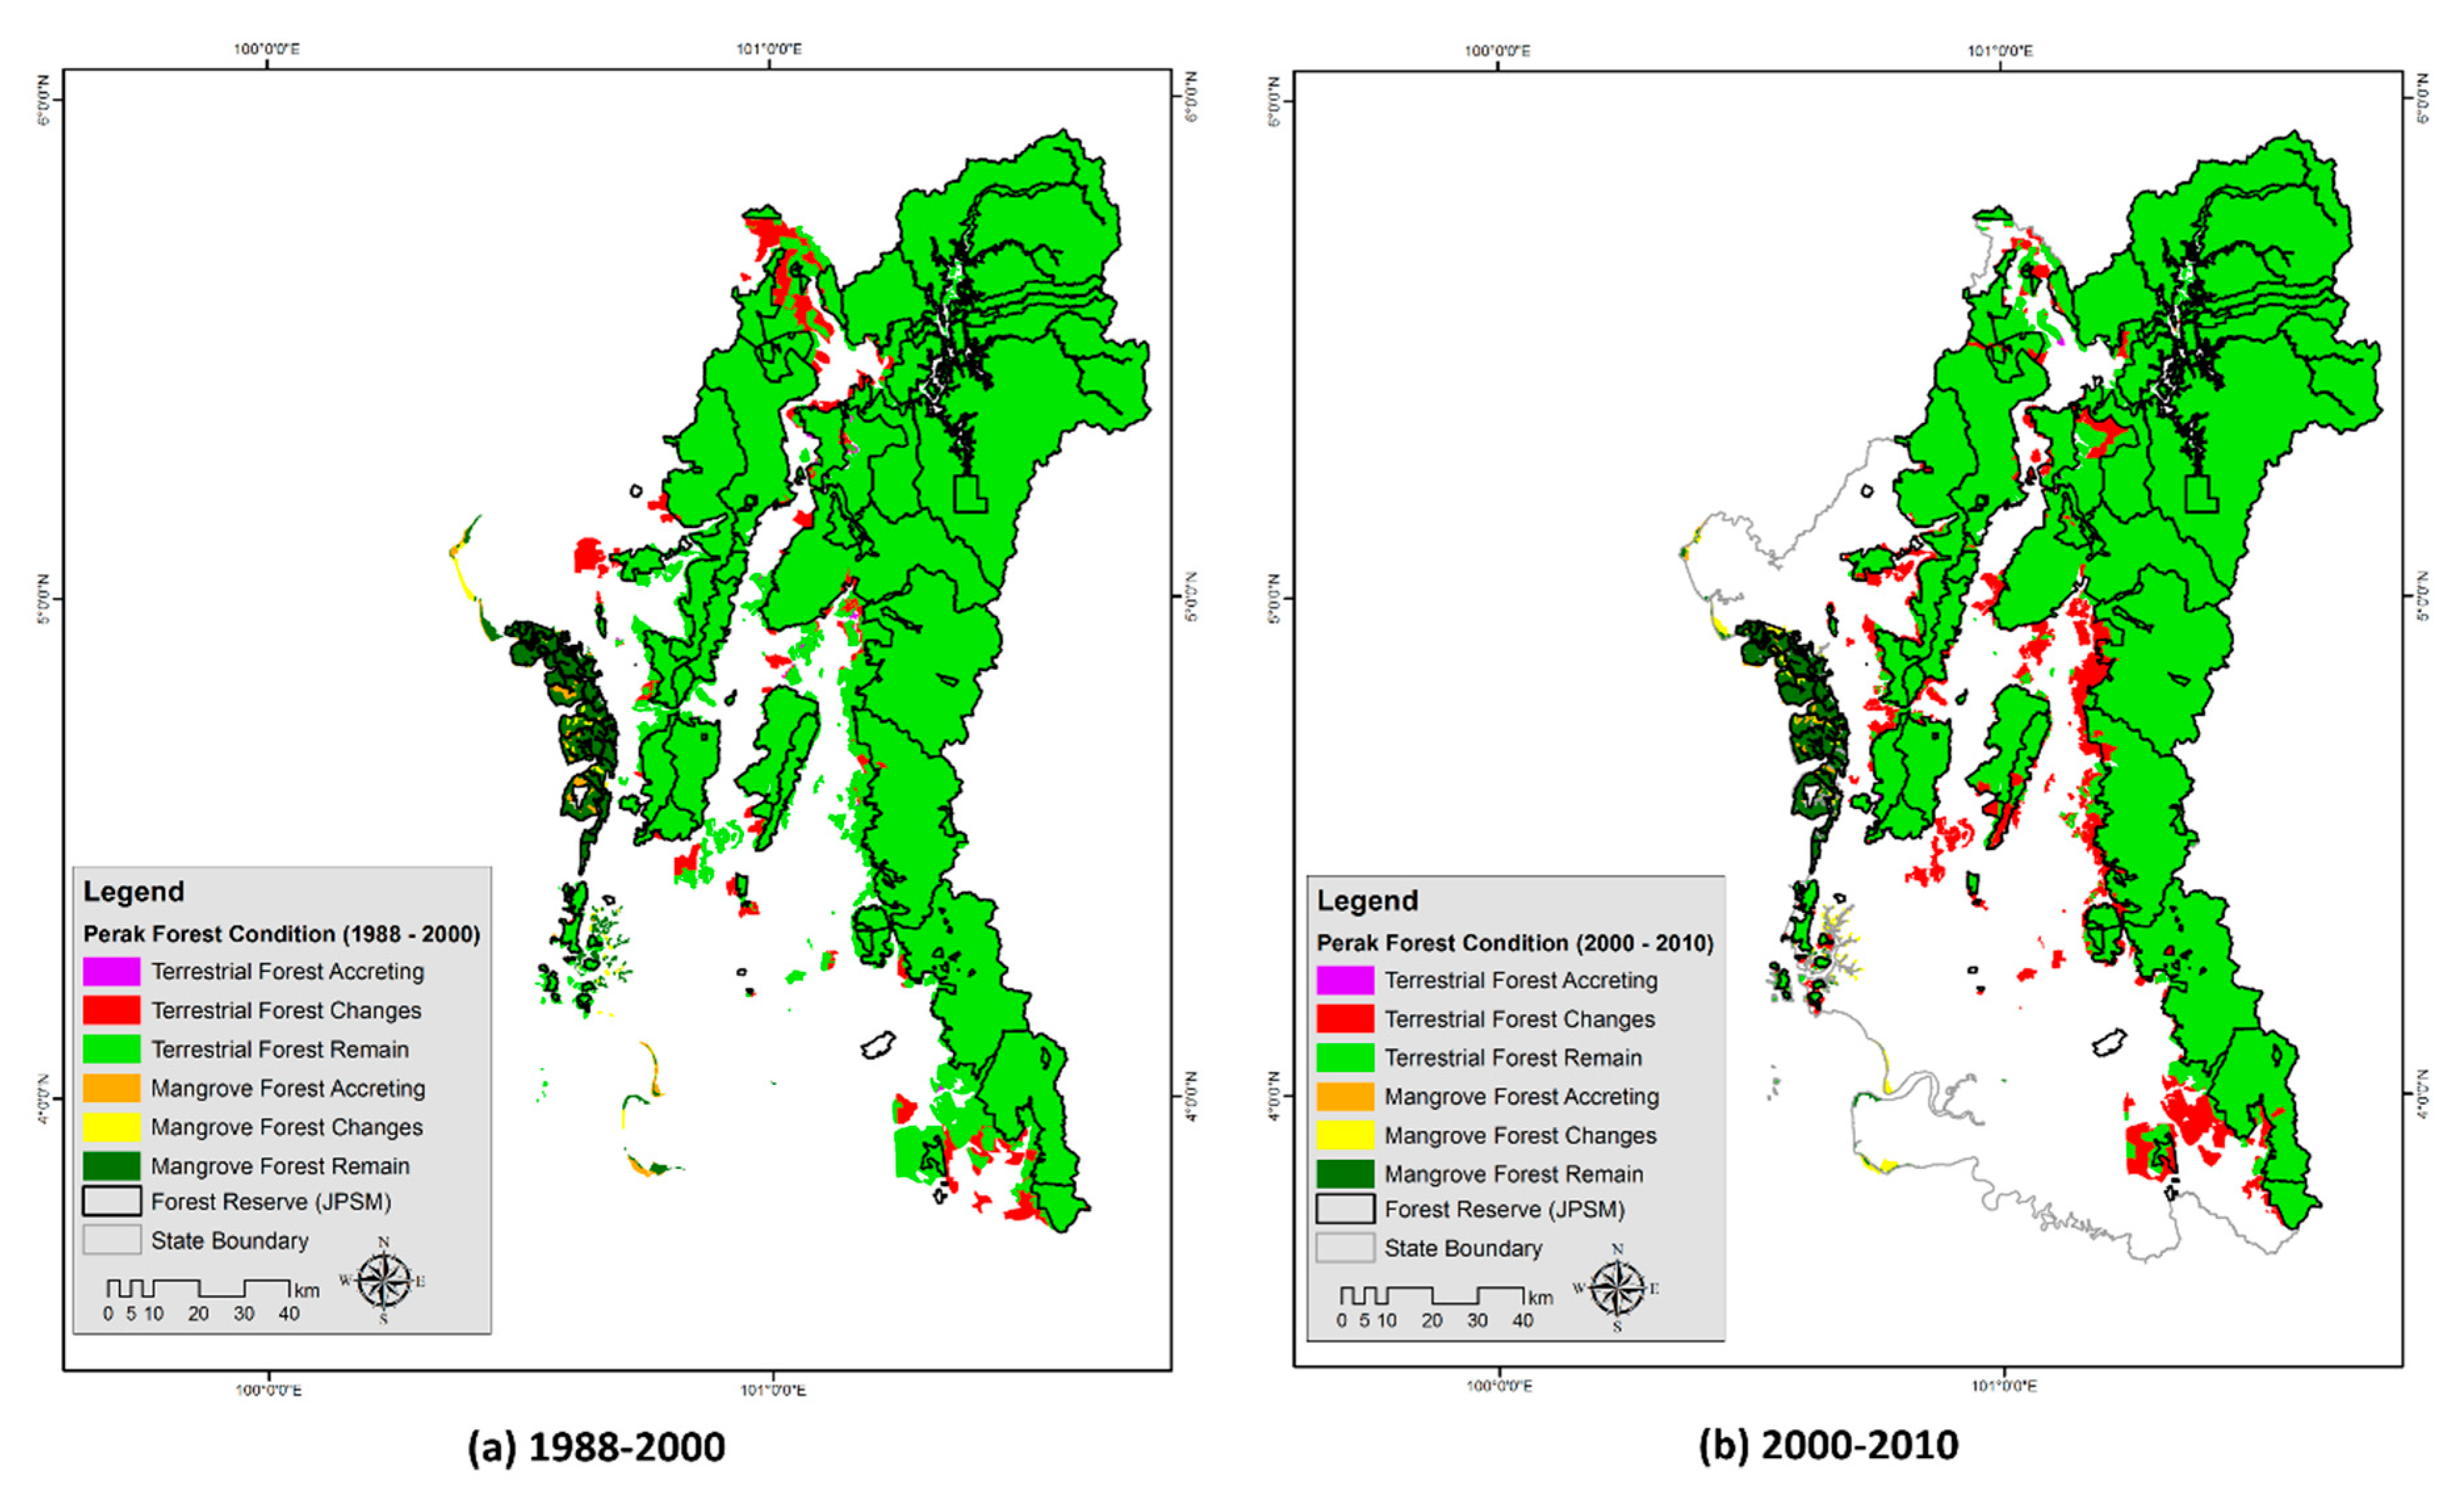
3.1. Forest Cover Change in Perak

Table 3 shows the forest cover changes over Perak between 1988 and 2017. According to the results, terrestrial forest showed a persistent decrease reducing from 1.16 million ha in 1988 to 979,760 ha in 2017. On the other hand, mangroves increased between 1988 and 2000, after which they also decreased until 2017. Overall, forest cover change from 1988 to 2017 showed a reduction of 189,423 ha (15.7%) with terrestrial and mangrove forest cover change reduced as much as 184,923 ha (15.9%) and 4501 ha (10.3%), respectively (Table 3).
The distribution of deforestation hotspots is mainly along the fringes of the forest area. The encroachment of forest is most obvious in the south, northwest, and west (Figure 5). It is usually associated with the presence of access roads nearby. The size of the hotspot areas varied by year. Between 2000 and 2010, the hotspot areas expanded and were concentrated at the south, west, and southwest of Perak. Hotspot areas continued to occur but to a smaller extent from 2010 to 2017. It is obvious that forest cover loss was in the eastern part of the forest and along the border of the forest reserves. The largest encroachment was in the south and northern end. Settlement and plantation are the two most common land use replacing forests. The presence of access road also results in a forest being converted to other land uses.
Forest loss in Perak mostly occurred between 2000 and 2010. The cumulative impact of forest loss from 1988 to 2017 (29 years) is significant. On average, 16% of the forest in Perak was converted to other land uses. This forest cover loss is also associated with carbon stock loss and an increase in soil erosion due to exposure of land to rainfall. High erosion rates resulted in increased quantities of suspended sediments into the river system and led to water quality degradation. This is evidenced by the degradation at the Perak river basin that affects the quality and quantity of the river water. Pengkalan Hulu is one of the major deforestation hotspots in Perak (Figure 6) where forest cover is disturbed by activities such as palm oil plantation, built-up area, settlement, mining, water bodies, and land clearing.

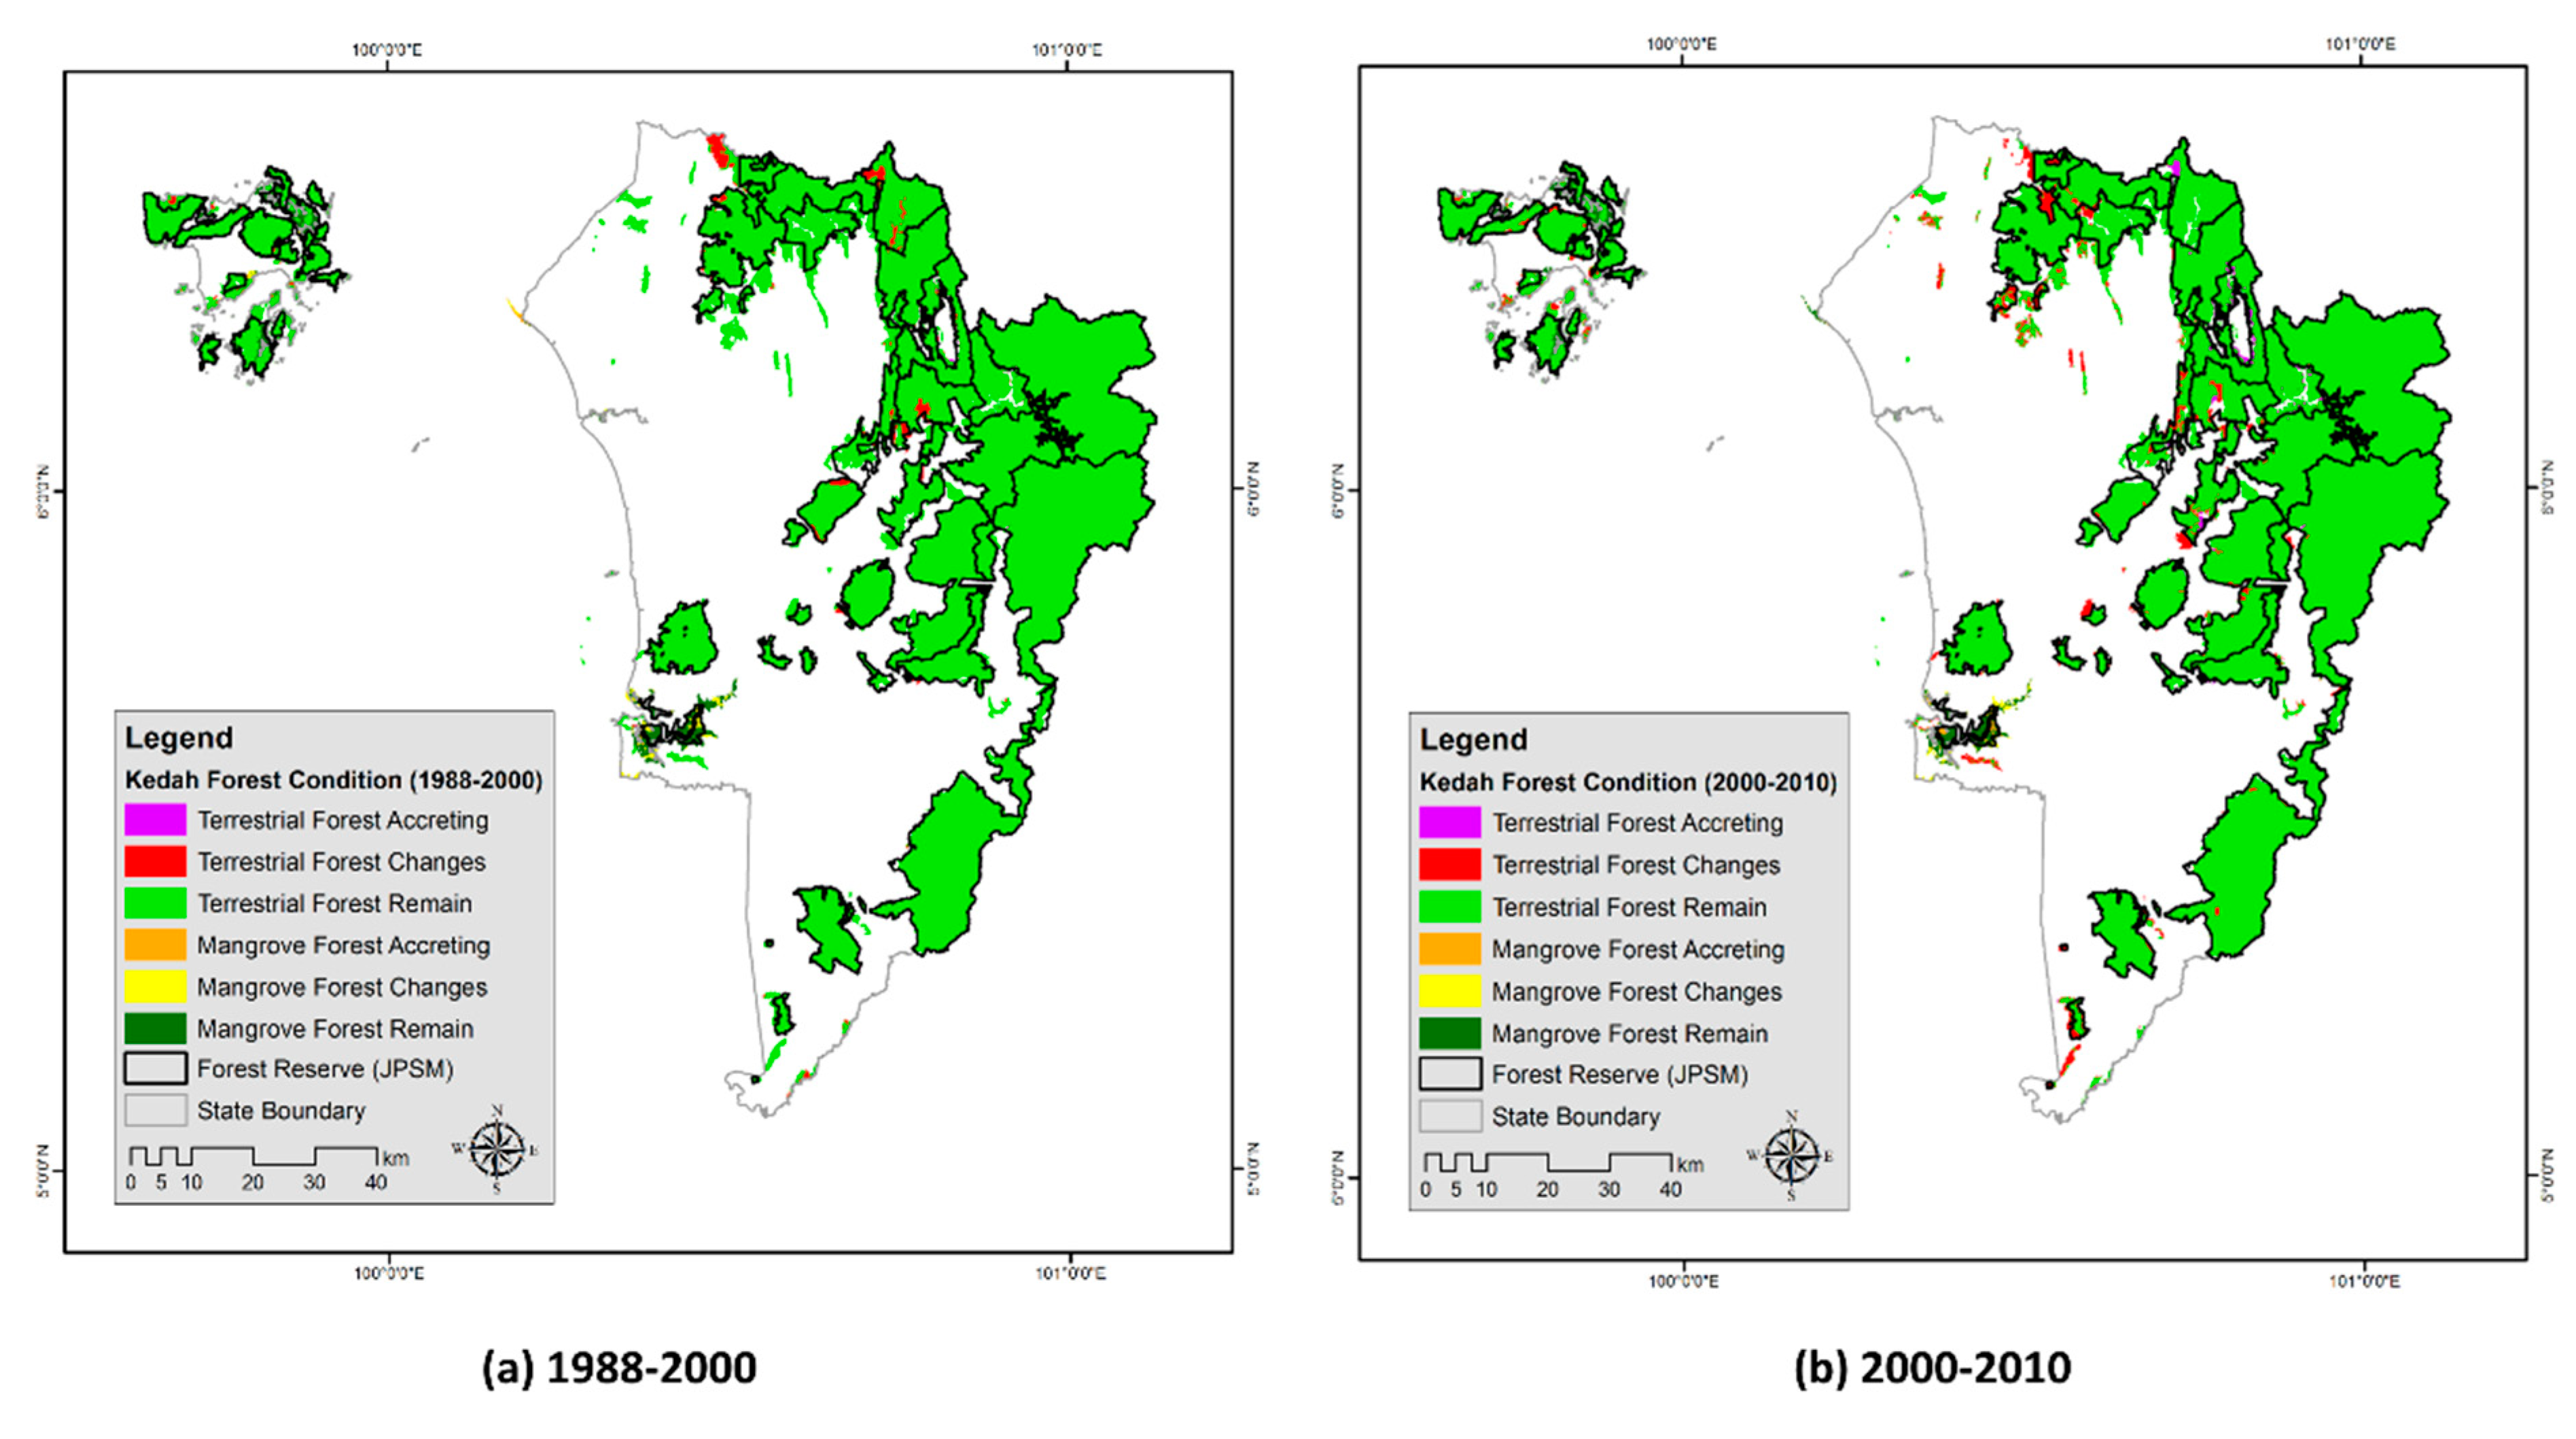
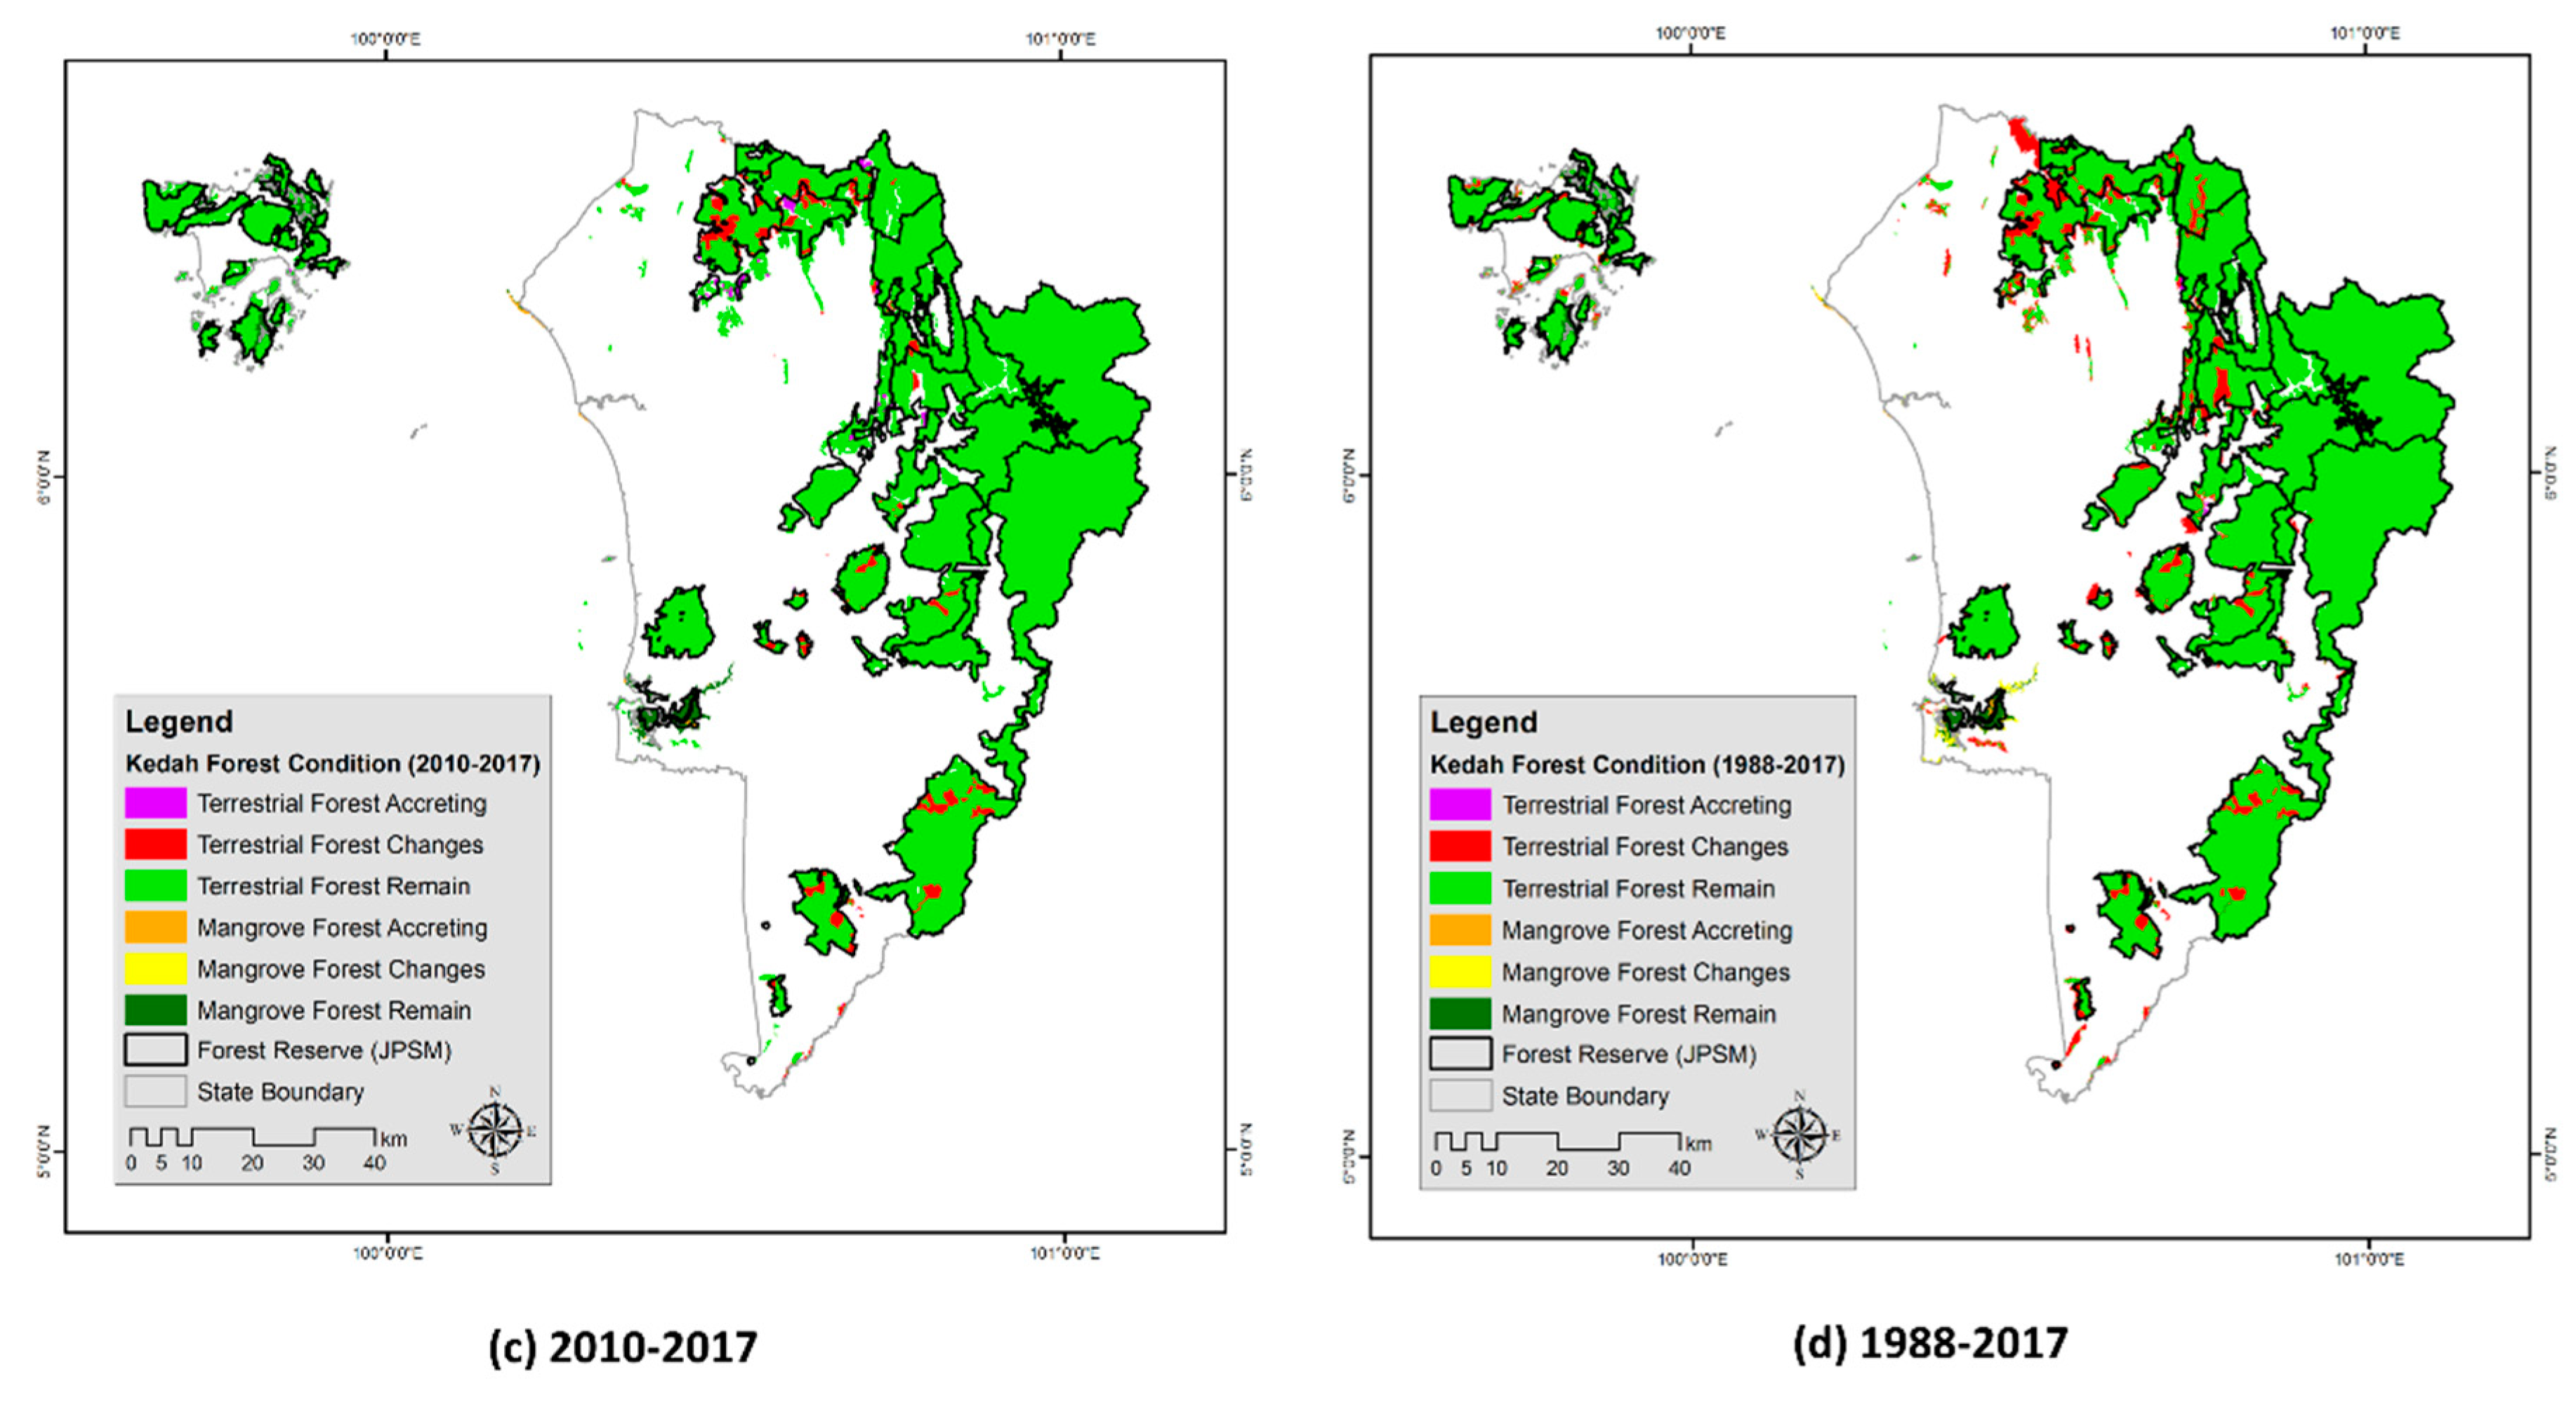
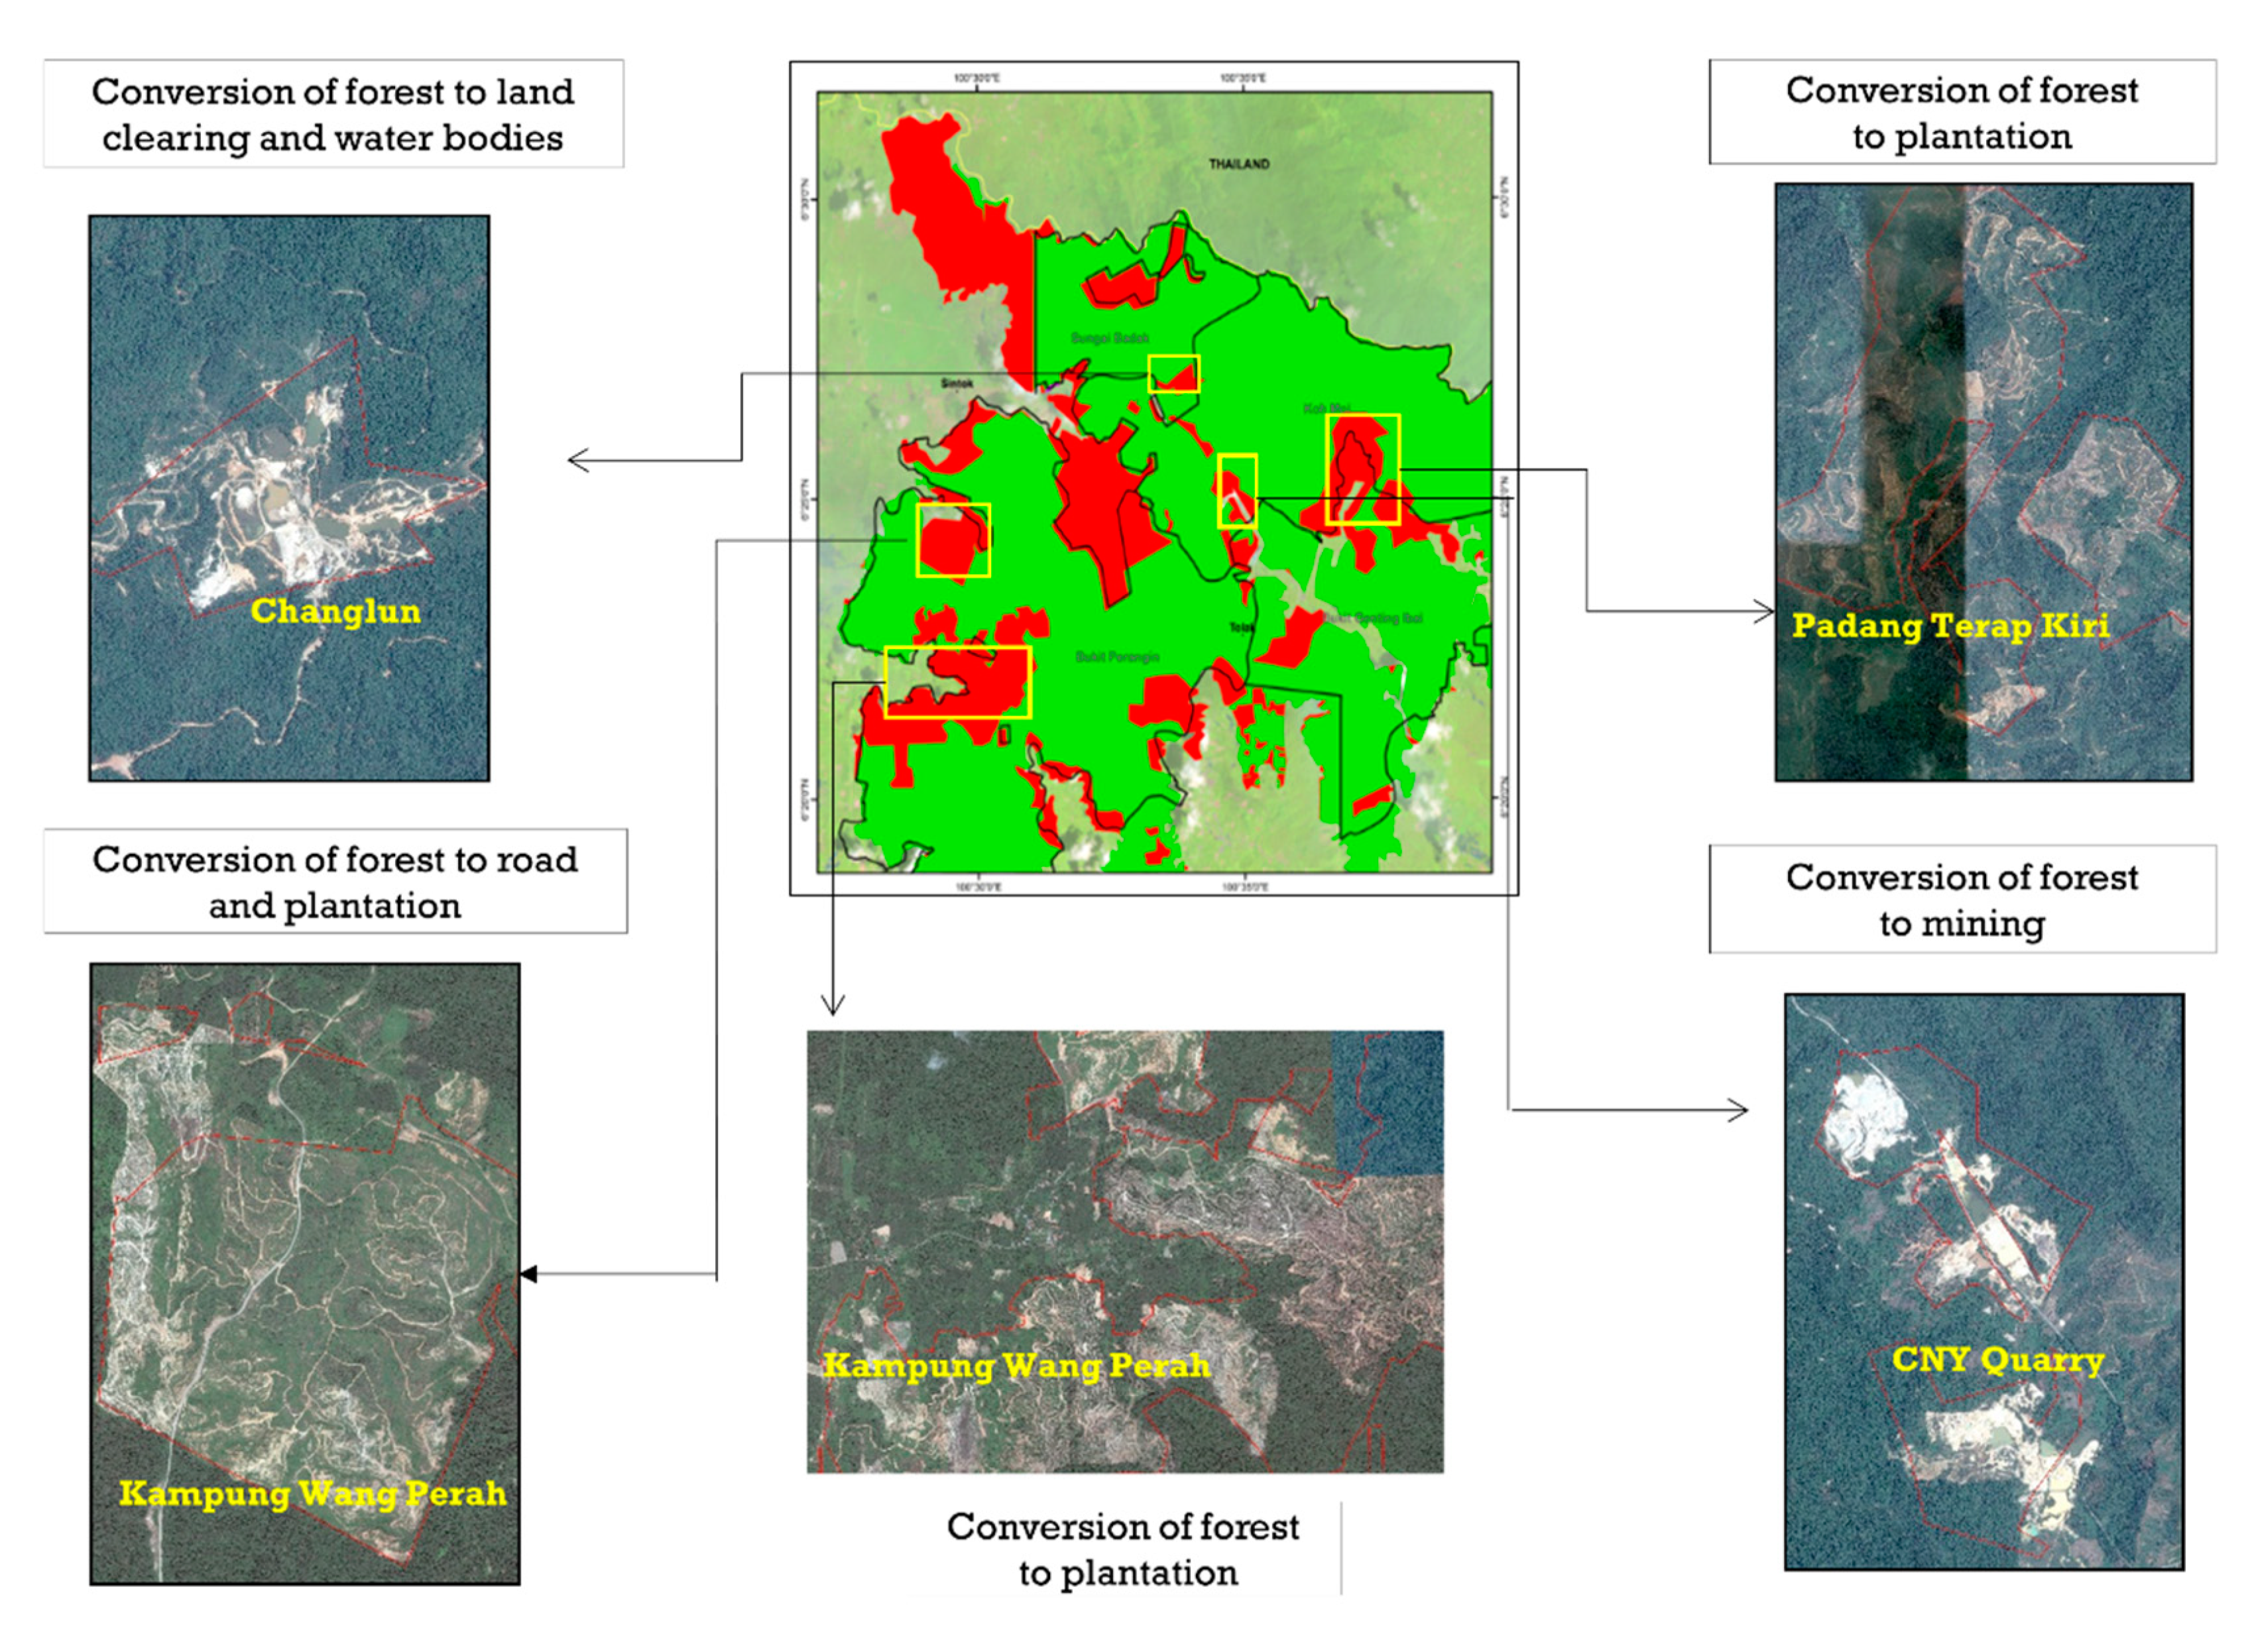
3.2. Forest Cover Change in Kedah

Table 4 gives an overview of forest cover changes in Kedah. In 1988, total forest cover in Kedah was 366,037 ha, including 356,329 ha of terrestrial forest and 9708 ha of mangrove forest. Both of the terrestrial and mangrove forest cover reduced slightly to 349,438 and 8643 ha, respectively, in 2000. In 2010, forest cover showed a further decrease to 333,498 and 7852 ha for terrestrial and mangrove forests. A more significant decrease is seen in 2017 when terrestrial forest cover was recorded only as 324,745 ha. Overall, within these 29 years, 9% of forest cover was lost in Kedah. The reported loss of forest cover was due to land use practices such as oil palm plantation, access road, land clearing, settlement, and water bodies.
Figure 7 highlights spatial patterns of forest cover change in Kedah using satellite imagery through four selected time series between 1988 and 2017. The bulk of the forest is in the East towards the Main Range. The pattern of the forest cover shows many fragmentations due to deforestation and degradation. Some of the forest covers have become an isolated cluster in the west of Kedah. In 2010, the pattern of forest fragmentation is also found westwards and the main forest cover remains near the Main Range.
Similar to Perak, deforestation hotspots in Kedah were divided into nine zoning blocks. In total, 33,391 ha of forest cover was converted to other land uses in Kedah. Figure 8 shows one of the zoning blocks in Perak, which faces forest cover changes by different types of land use. Sintok is one of the major deforestation hotspots in Kedah forest reserve, where forest cover was replaced by settlement, land clearing, mining, palm oil plantation, and other types of land-use practices.
Within 29 years, nearly 16% of forest cover in Perak and more than 9% of forest cover in Kedah have been converted to agricultural land and urban settlements due to population growth, anthropogenic activities, and industrialization. Both Perak and Kedah have lost a huge amount of forest cover between 2000 and 2010 compared to other periods because of the higher rate of deforestation.

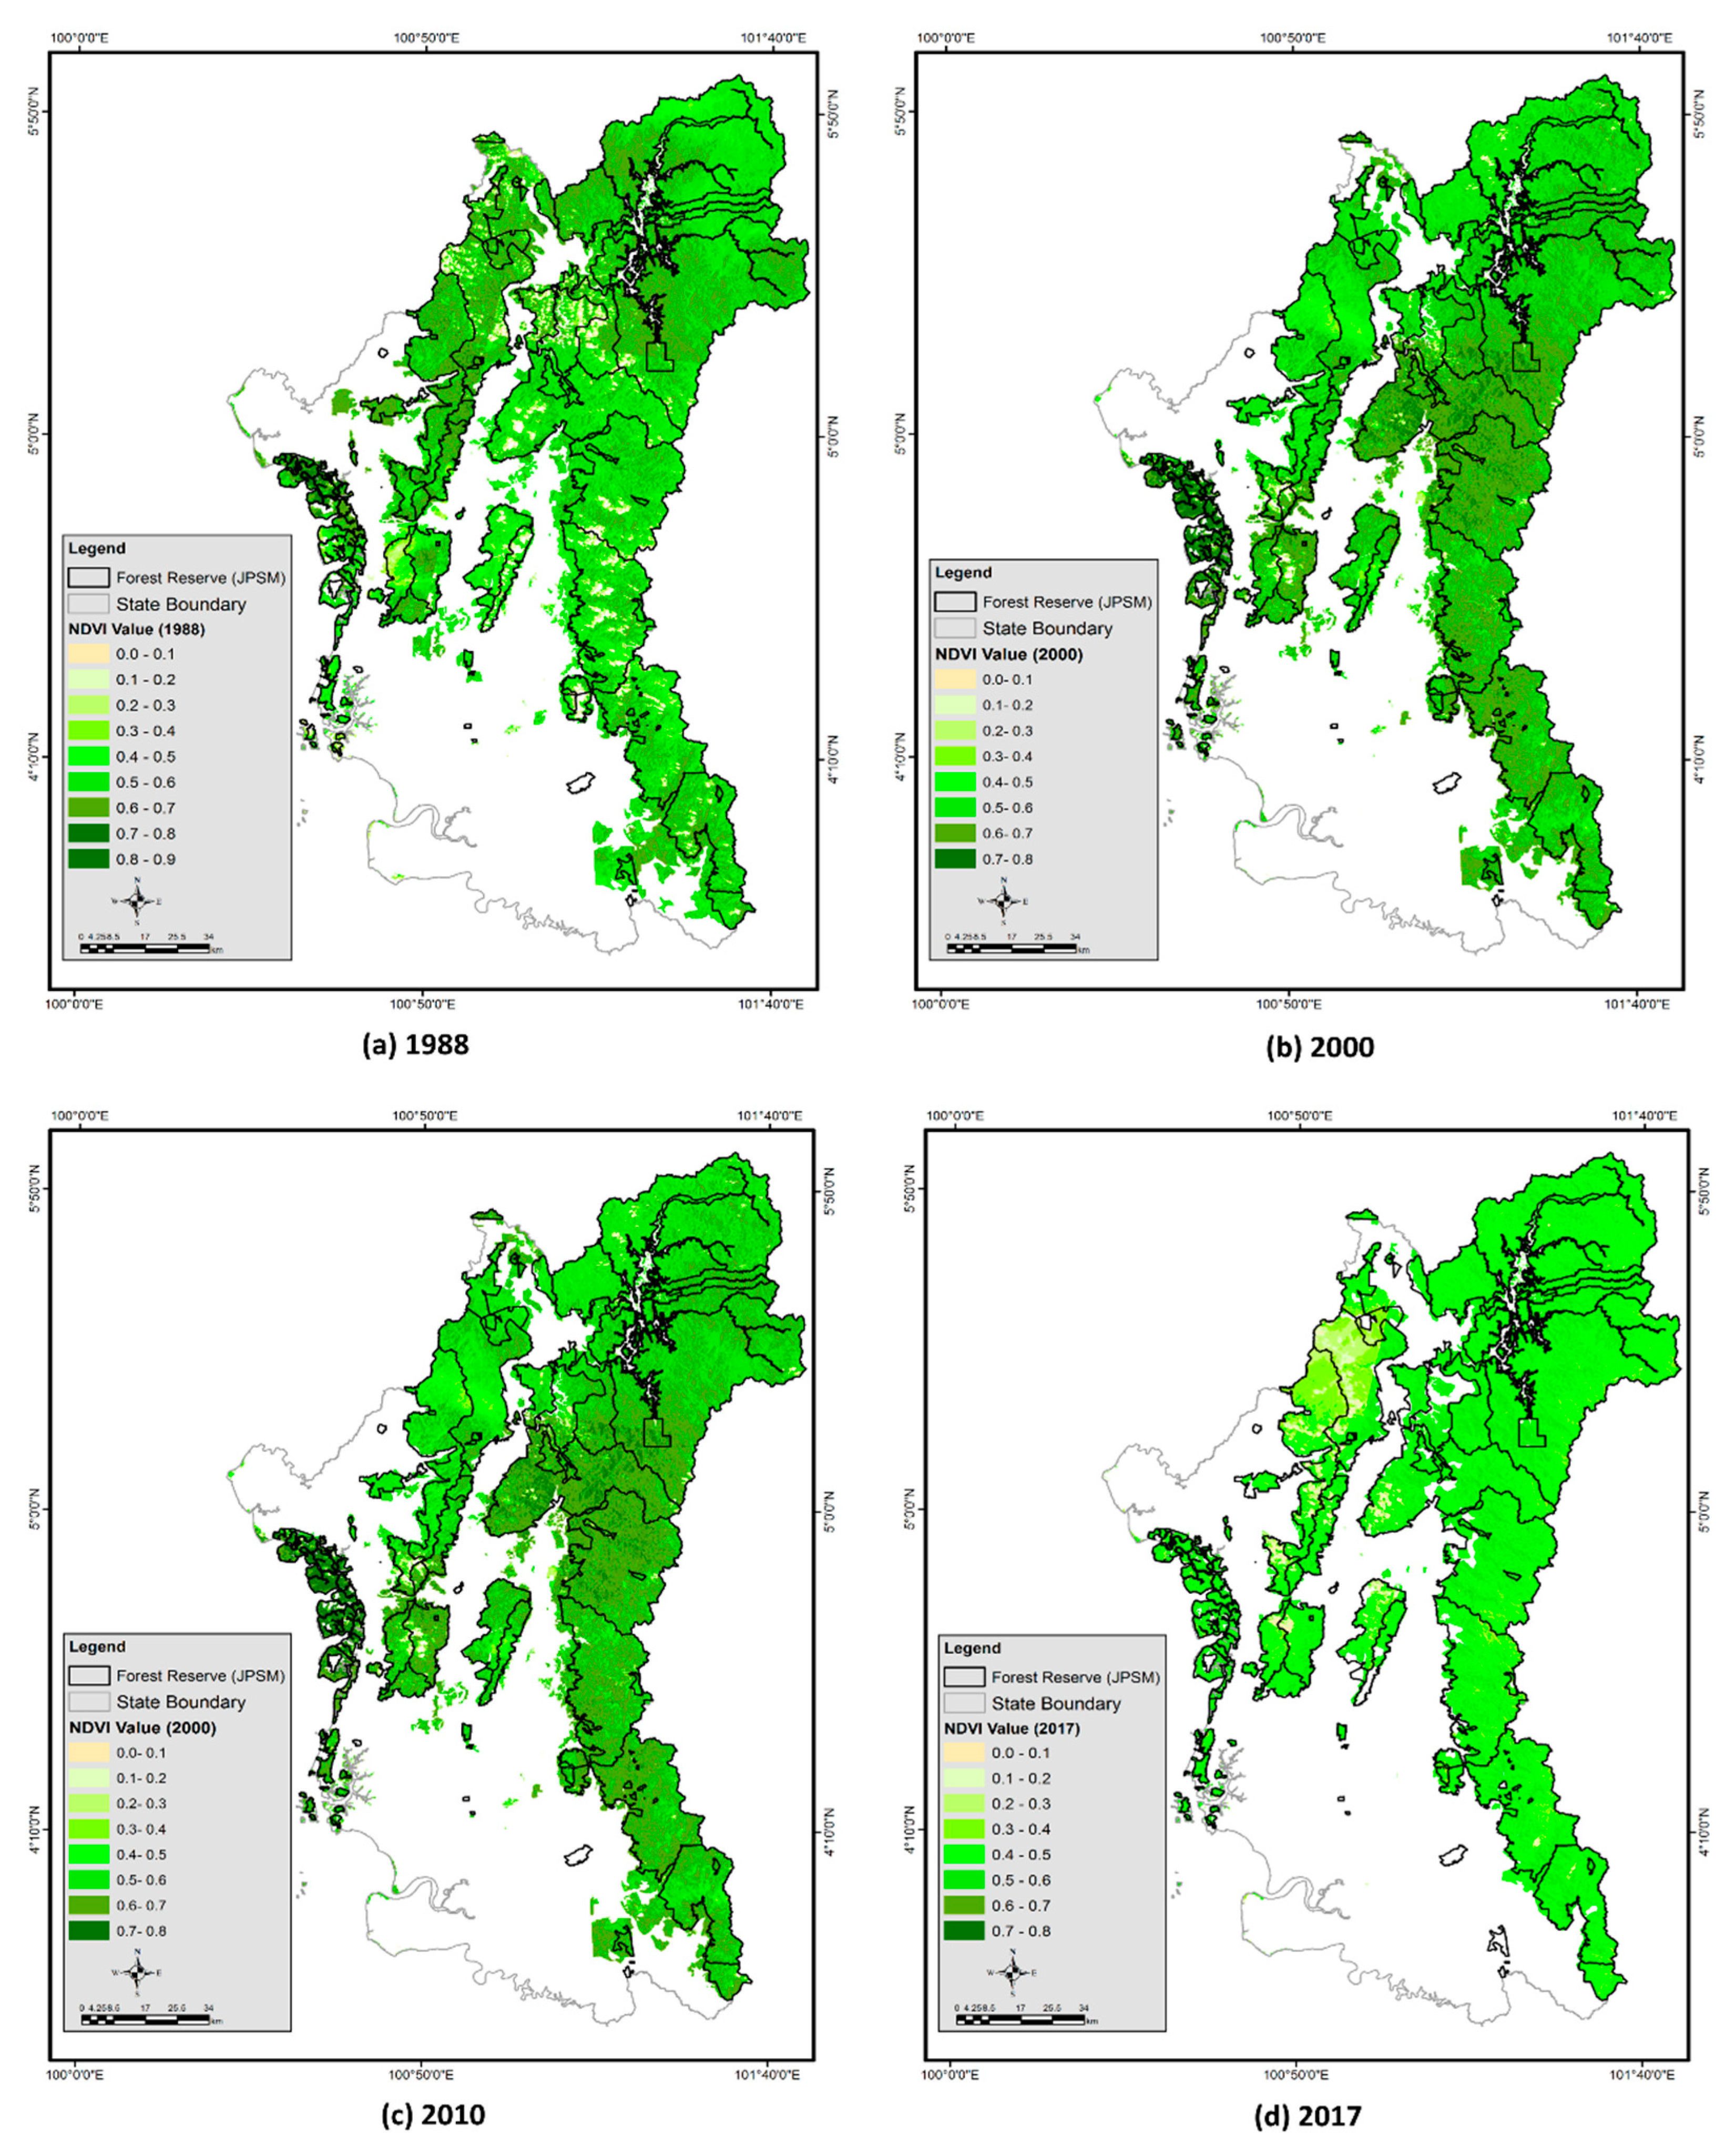
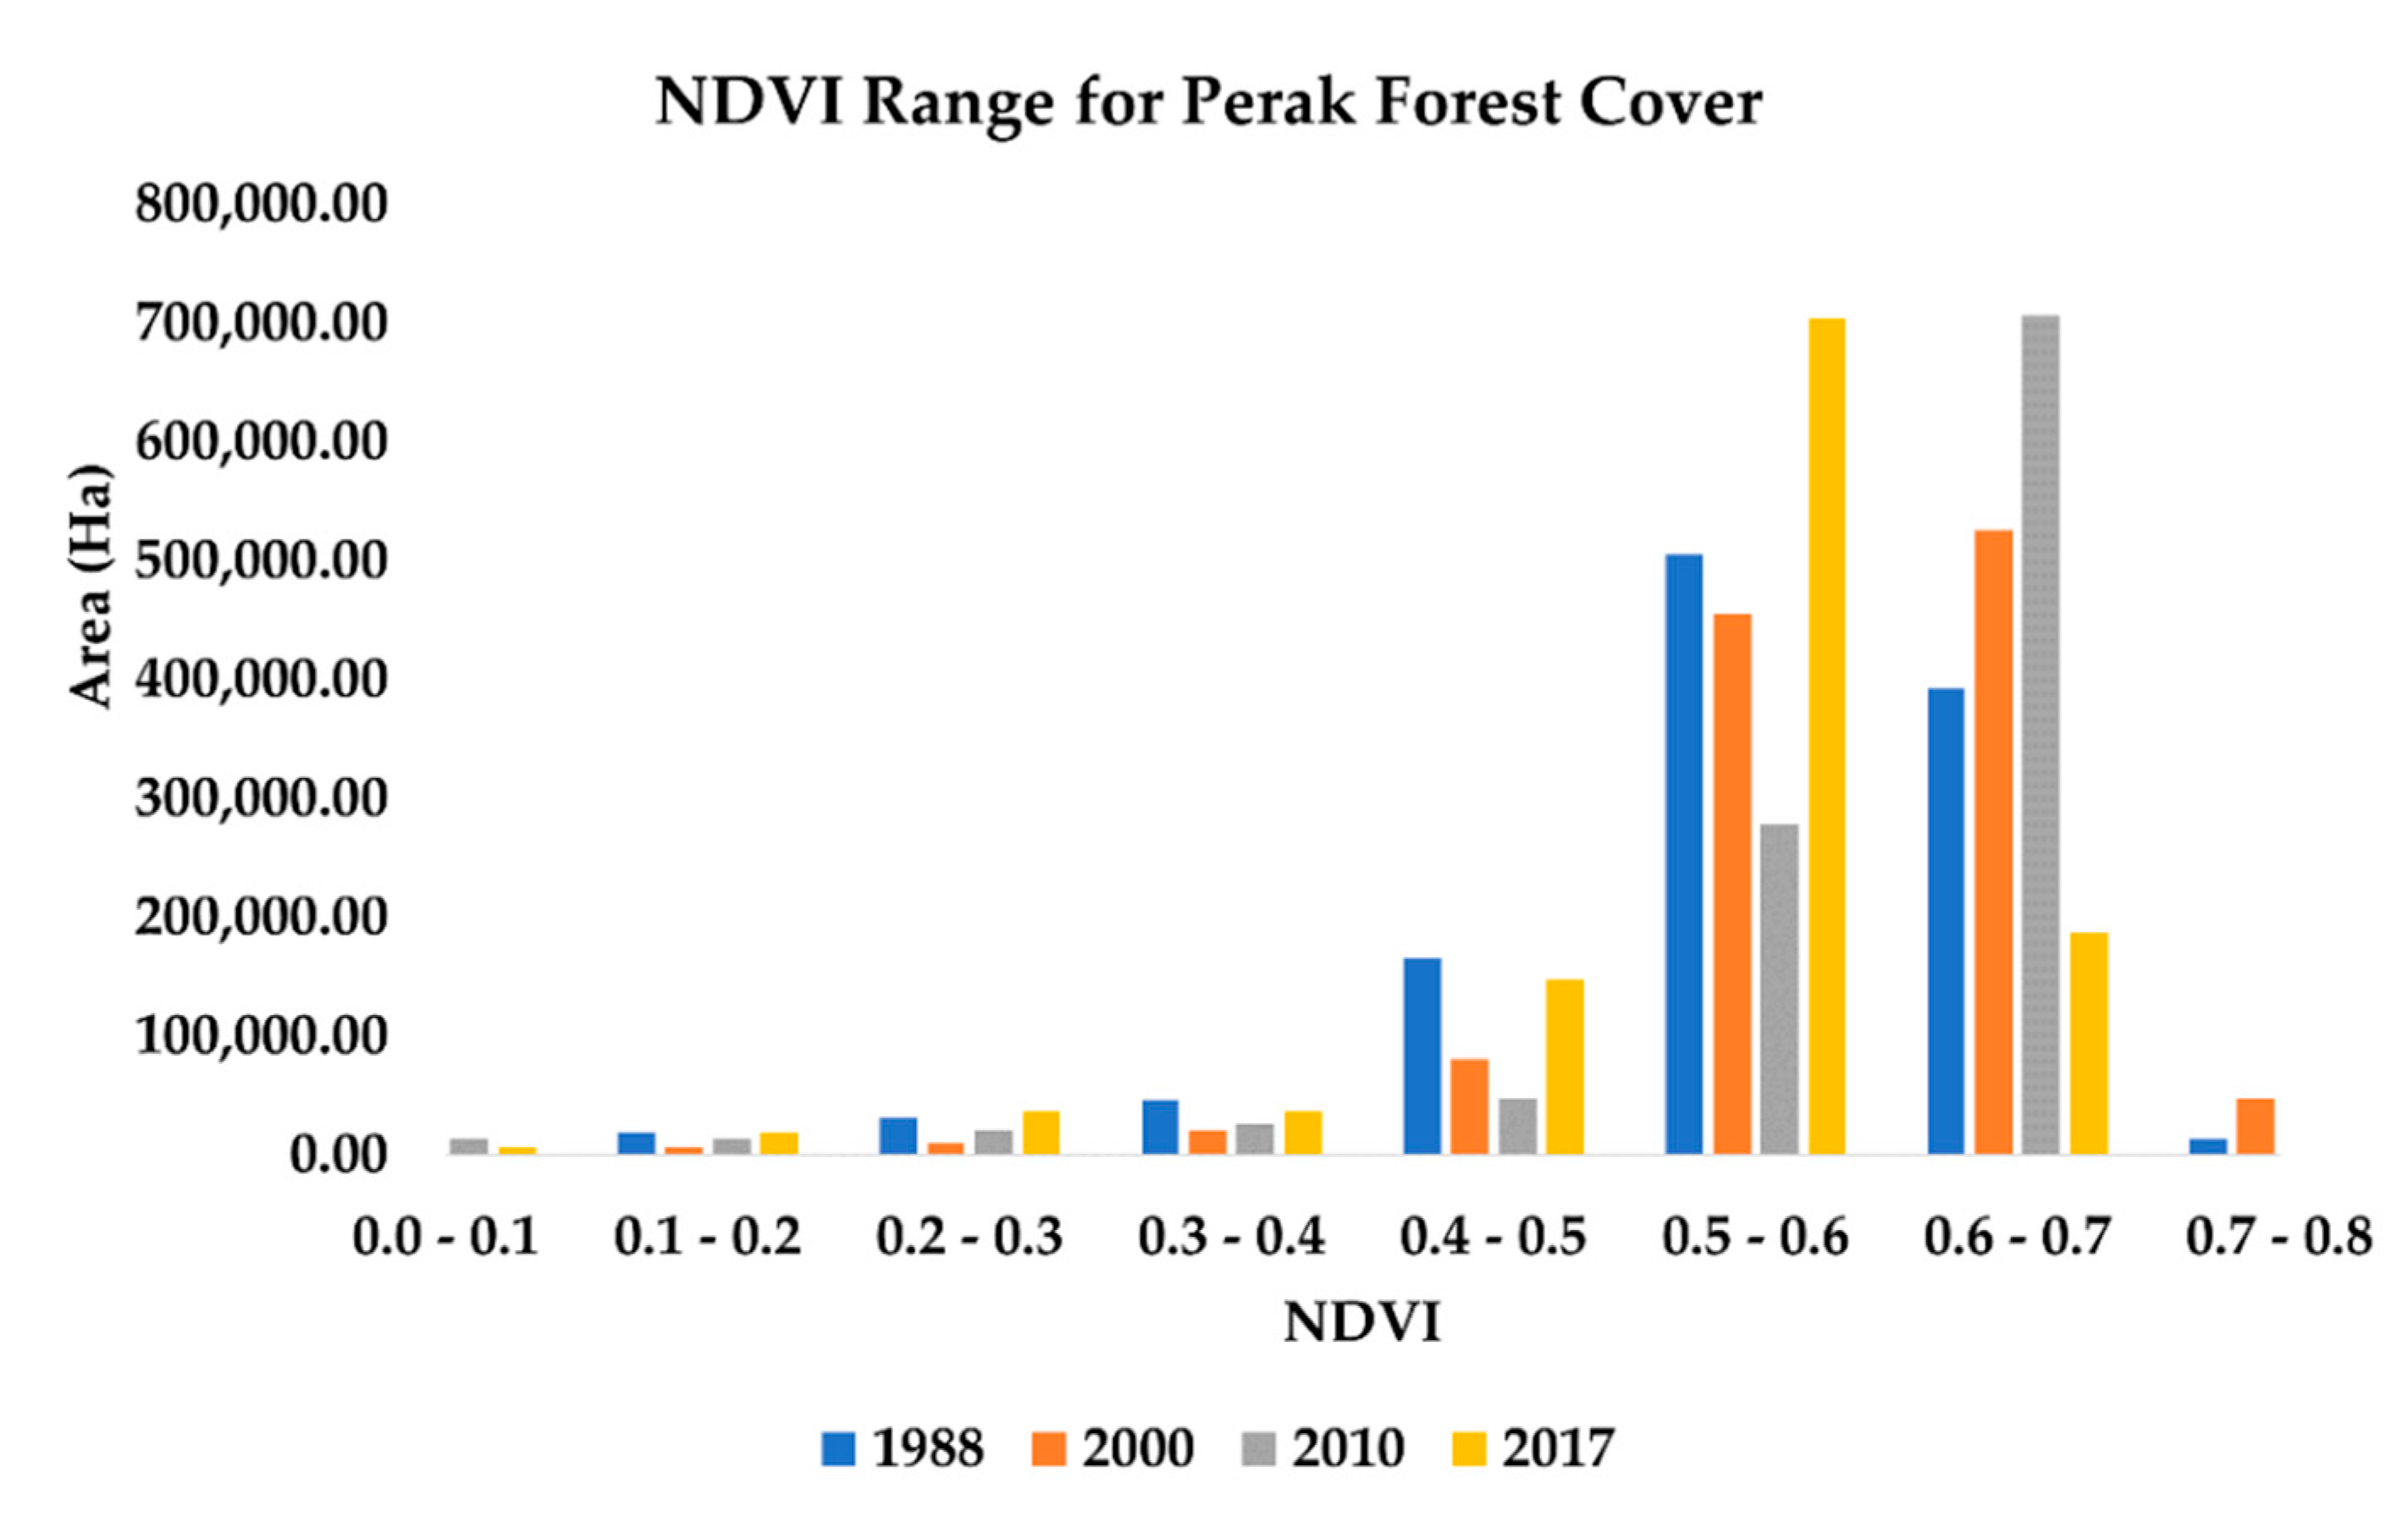
3.3. NDVI for Perak Forest Cover

Figure 9 and Figure 10 presents the result of NDVI distribution for the years 1988, 2000, 2010 and 2017 in Perak forest cover. Darker green color represents healthy and dense forest cover. Changes of NDVI throughout the years are shown by the variation of green. Table 2 shows NDVI values ranging from 0–0.8 and the forest area coverage (in hectares) for 1988, 2000, 2010, and 2017. The area of forest cover with an NDVI value of more than 0.5 is considered a healthy forest.
However, in comparison to the year 1998, the NDVI values of the year 2000 for Perak forest cover show a significant change across the whole region, and the NDVI range increased from 0.5–0.6 to 0.6–0.7 (Table 5). The increase in NDVI value indicates the increase of area and density of forest cover as well as the good health of vegetation due to afforestation or reforestation program and the maturity of the previously planted forest. The hectarage involved is increased fairly by 19,724.32 ha. Figure 9 shows that the forest cover in 2000 is greener in color than in 1988 in most of the forest area of Perak. However, after 2010, the NDVI distribution pattern of the forest cover in Perak remained the same as in 2000, with NDVI values ranging between 0.6–0.7, but the hectarage involved is increased from 525,641.74 ha to 706,503.92 ha. Figure 9 shows that, compared to 2000, some portion of the forest area becomes dark green due to forest plantation and the maturity of the planted forest, but some portion of the forest area becomes less green due to forest degradation. This is the reason why the NDVI value ranges remained constant even after ten years.
Forested area and vegetation health were recorded at its highest peak in 2010. Figure 9 shows massive degradation of forest that occurred in 2017, mostly towards the north-west of the map. 891,058 ha of forested area falls in the class of fully vegetated area with NDVI value of more than 0.5 (Figure 10).

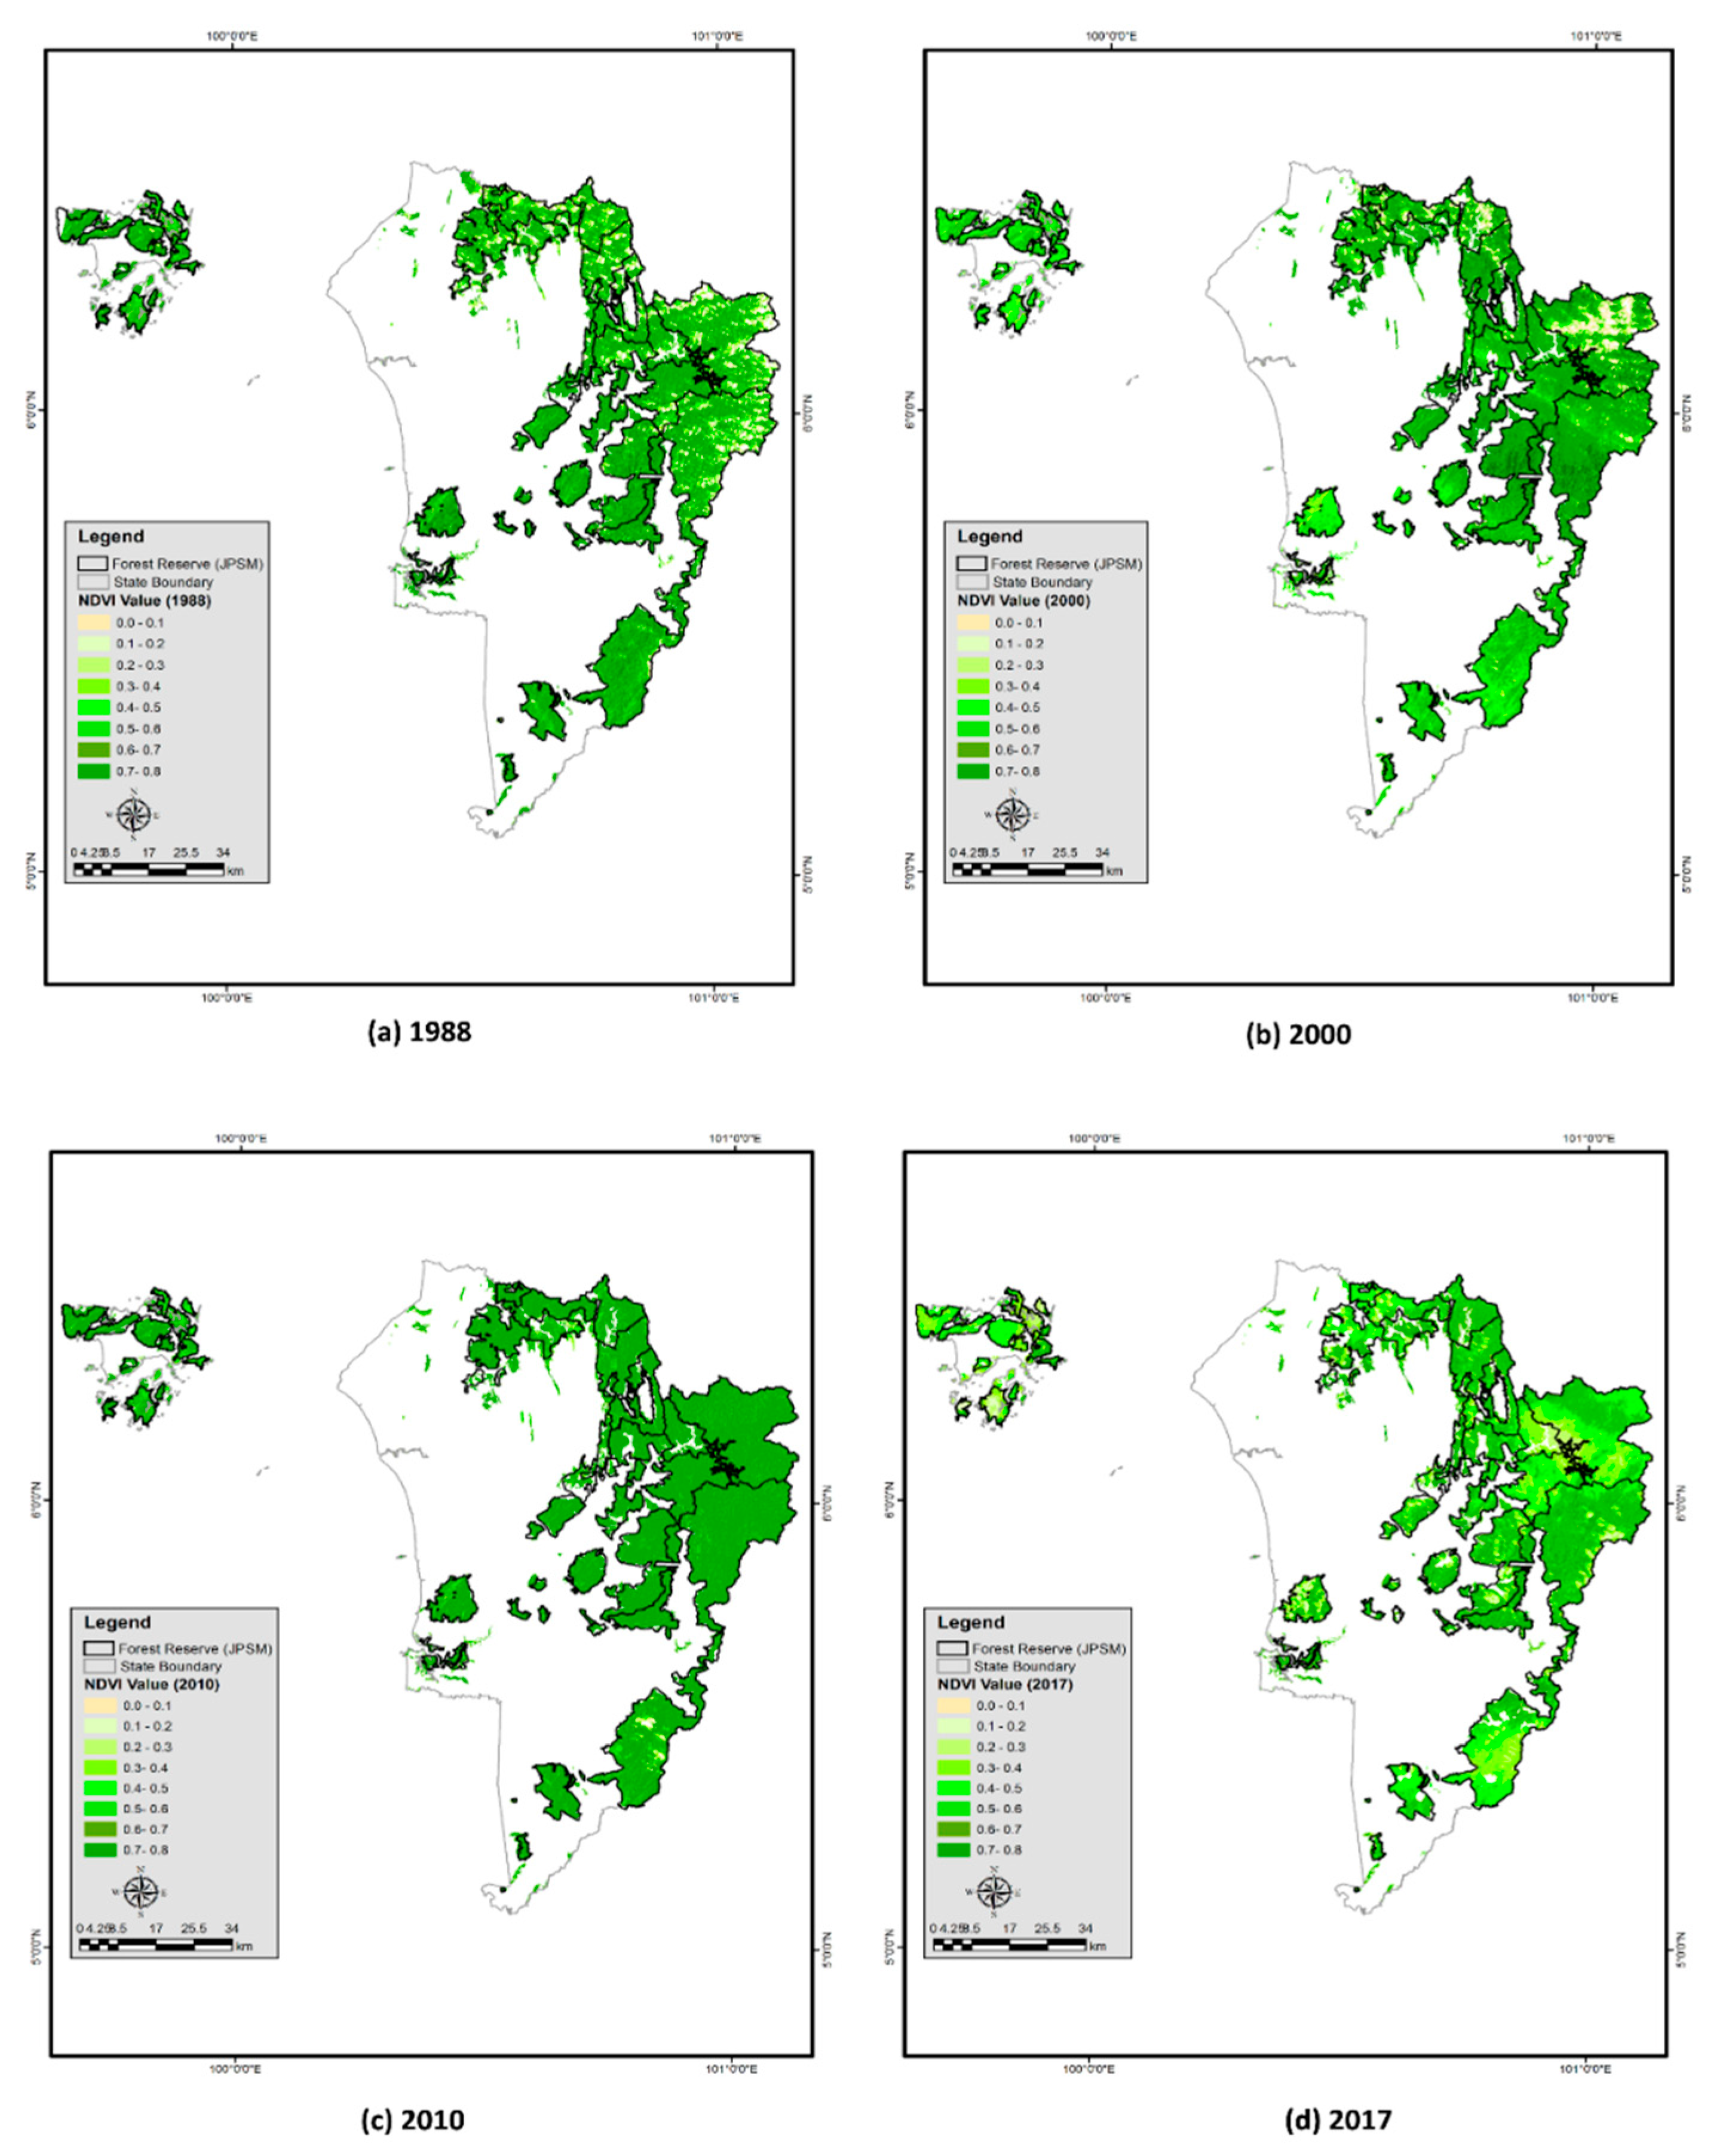
3.4. NDVI for Kedah Forest Cover

Figure 11 presents the distribution of NDVI in Kedah. Forest cover in 2000 is less green compared to 1988, especially in the northeast and south part of the map. Forest in Kedah regained healthy in 2010 as the condition in 1988 as shown through the darker green color before deteriorated in 2017.
NDVI value for Kedah forest cover in 2010 remains the same as it was in 1988 and 2000, while the total coverage of forest for NDVI value range 0.6–0.7 is increased drastically to 230,266.80 ha in 2010 from 141,246.97 ha in 2000. Figure 11 shows that the degraded forest area in 2000 from the northern part of Kedah turned into green color in 2010 map which indicates the implementation of large-scale afforestation and reforestation under Malaysia’s forest plantation programs in that area to reduce deforestation (Hashim et al. 2015). The amount of healthy forest cover reached its highest peak in 2010.
However, the NDVI value decreased slightly to 0.5–0.6 in 2017. The reduction in NDVI value in terms of a hectare is shown in Table 6. A massive degradation of forest occurred between 2010 and 2017. Forest degradation is detected by the change of green color on the map. Figure 11 shows that some portion of the map turned into light green and yellowish-green in 2017, which were green or dark green before. The change of green color in 2017 indicates a substantial change in forest cover due to forest degradation. In 2017, the total forested area fell in the class of fully vegetated areas with an NDVI value of more than 0.5 is 209,817 ha (Figure 12).

3.5. Relationship between NDVI and Meteorological Factors

The relationship between NDVI and meteorological factors on temperature and water were analyzed for the assessment year (1988, 2000, 2010, and 2017) for both Perak and Kedah states. Climate change especially change in precipitation, has influences on NDVI, and the change patterns on NDVI were always similar with pattern in precipitation. The response characteristics of NDVI values to climatic factors were quantitatively analyzed through the correlation between NDVI and the climatic factors studied (Table 7). The correlation between NDVI and precipitation is significant, as the NDVI value increases with the increase in precipitation in linear with correlation coefficient (R2). Meanwhile, the correlation between NDVI and air temperature is not significant, as the NDVI value decreased with the increase in air temperature.

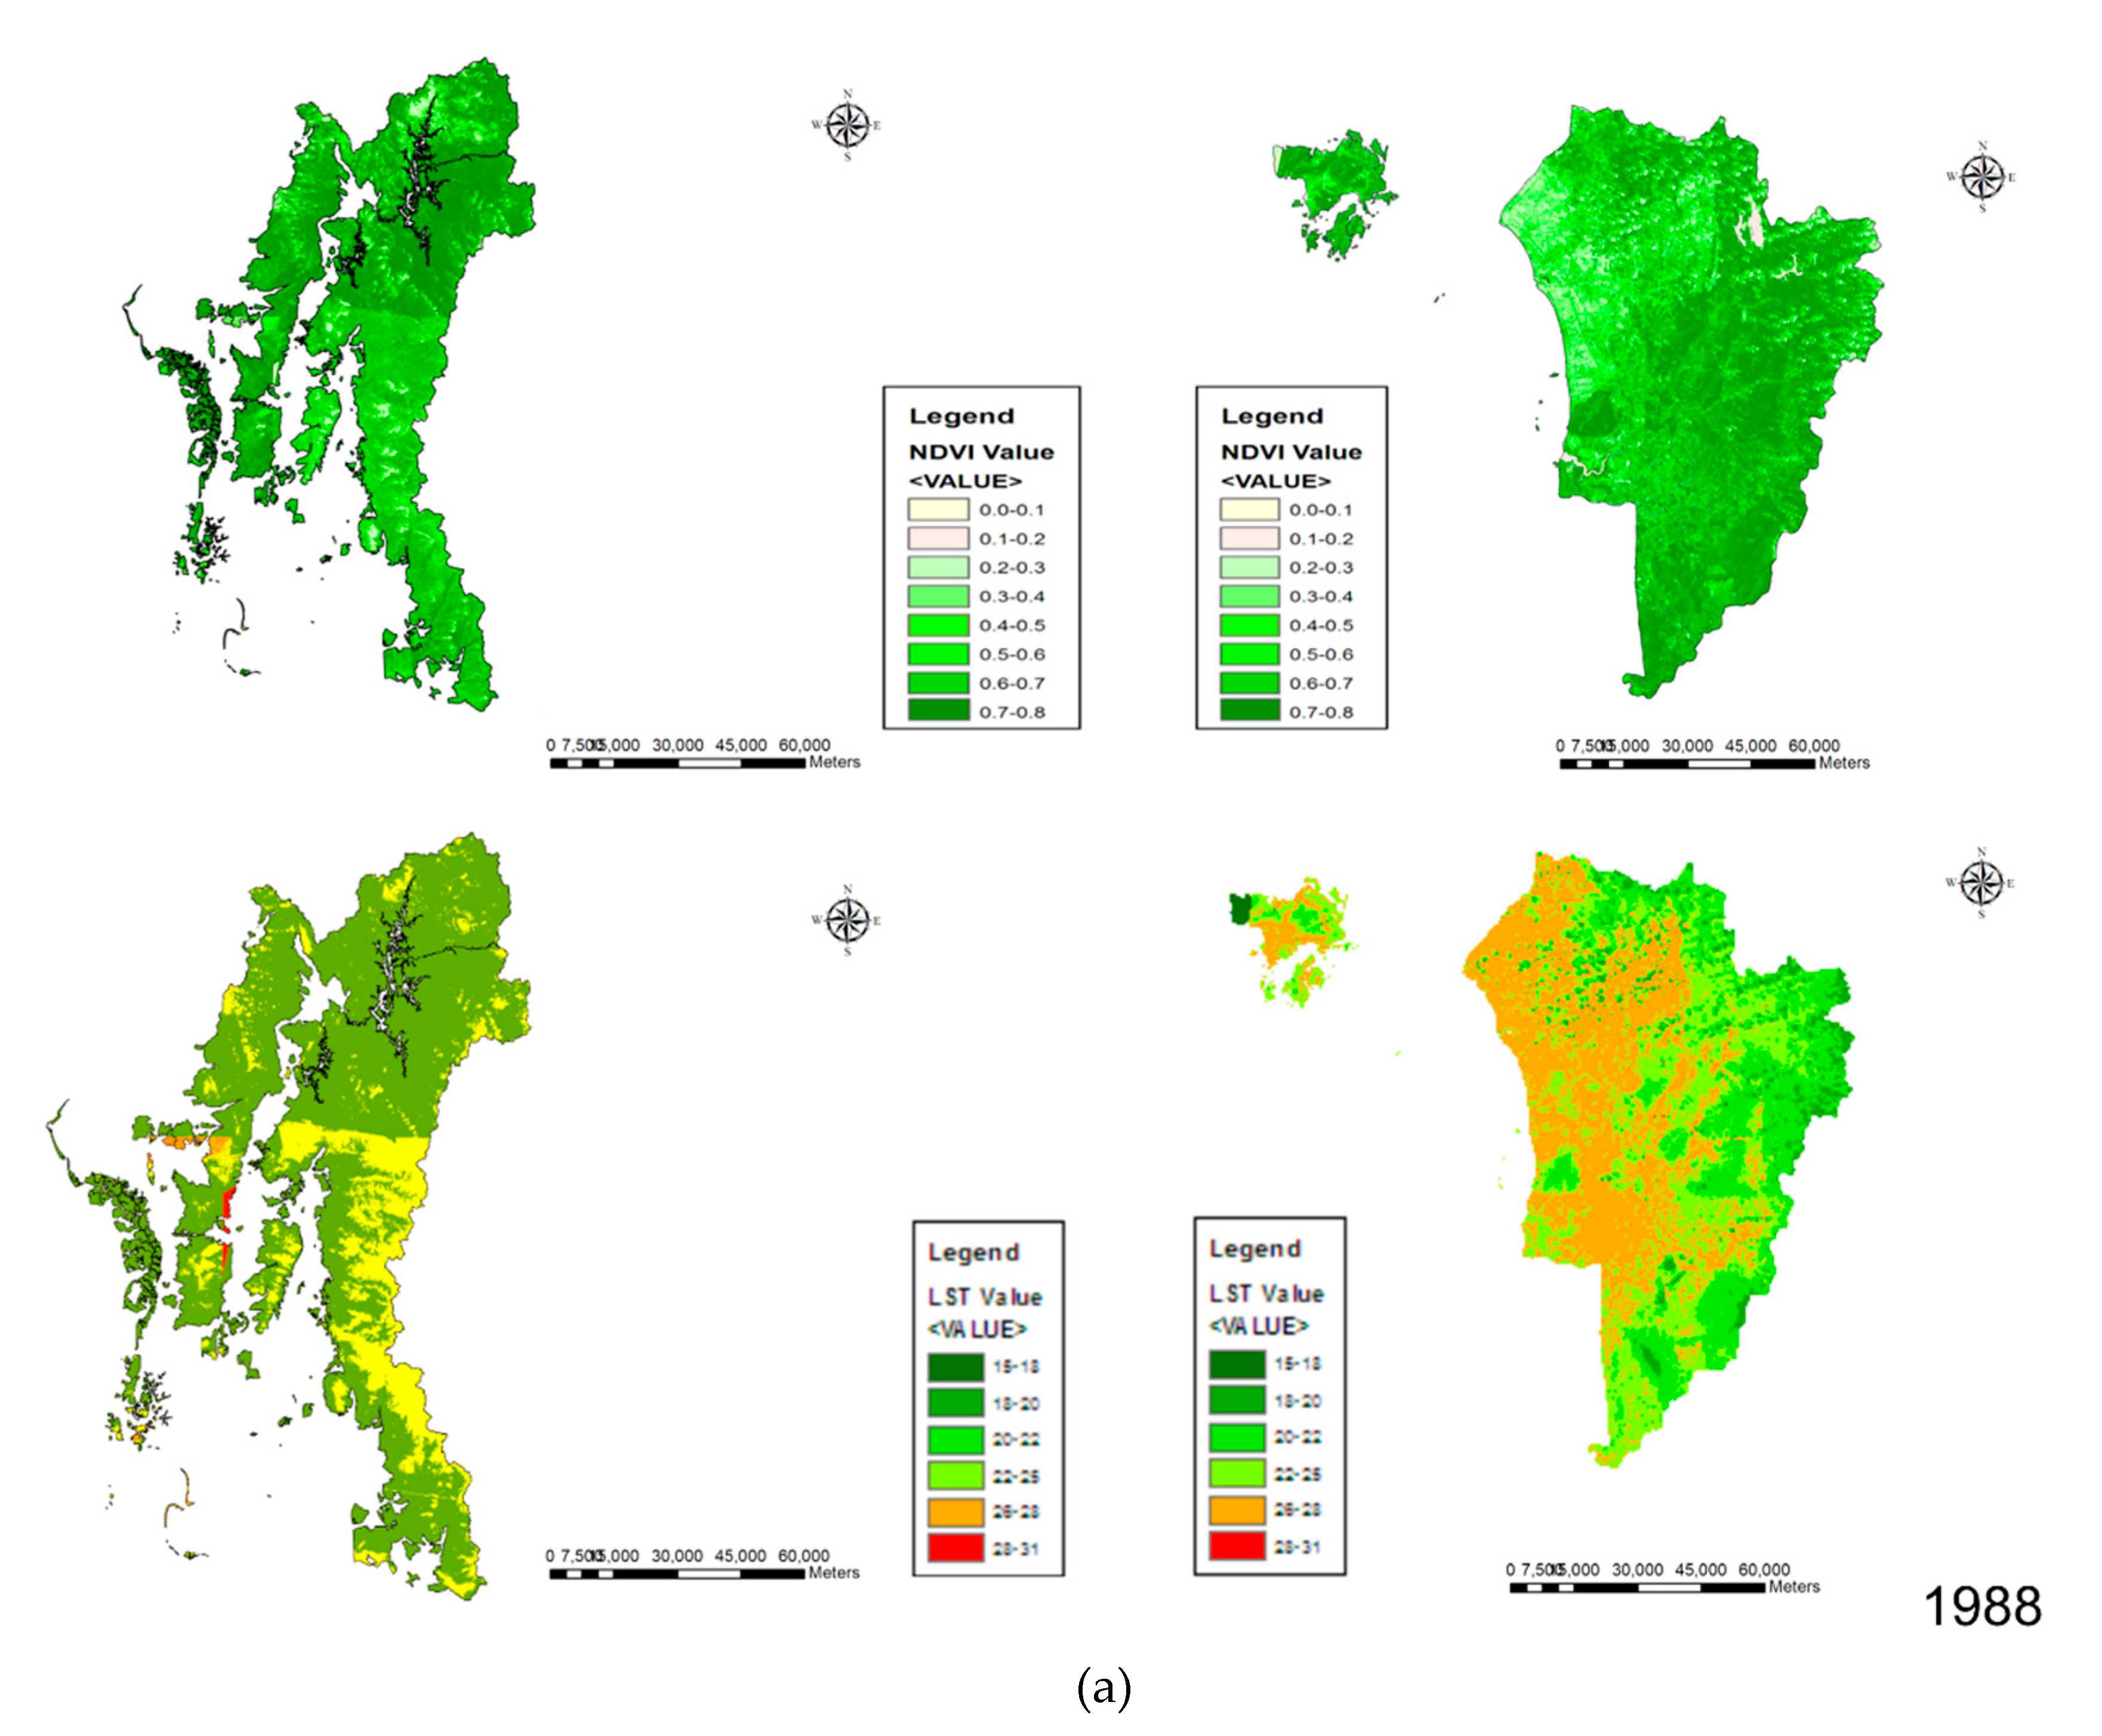
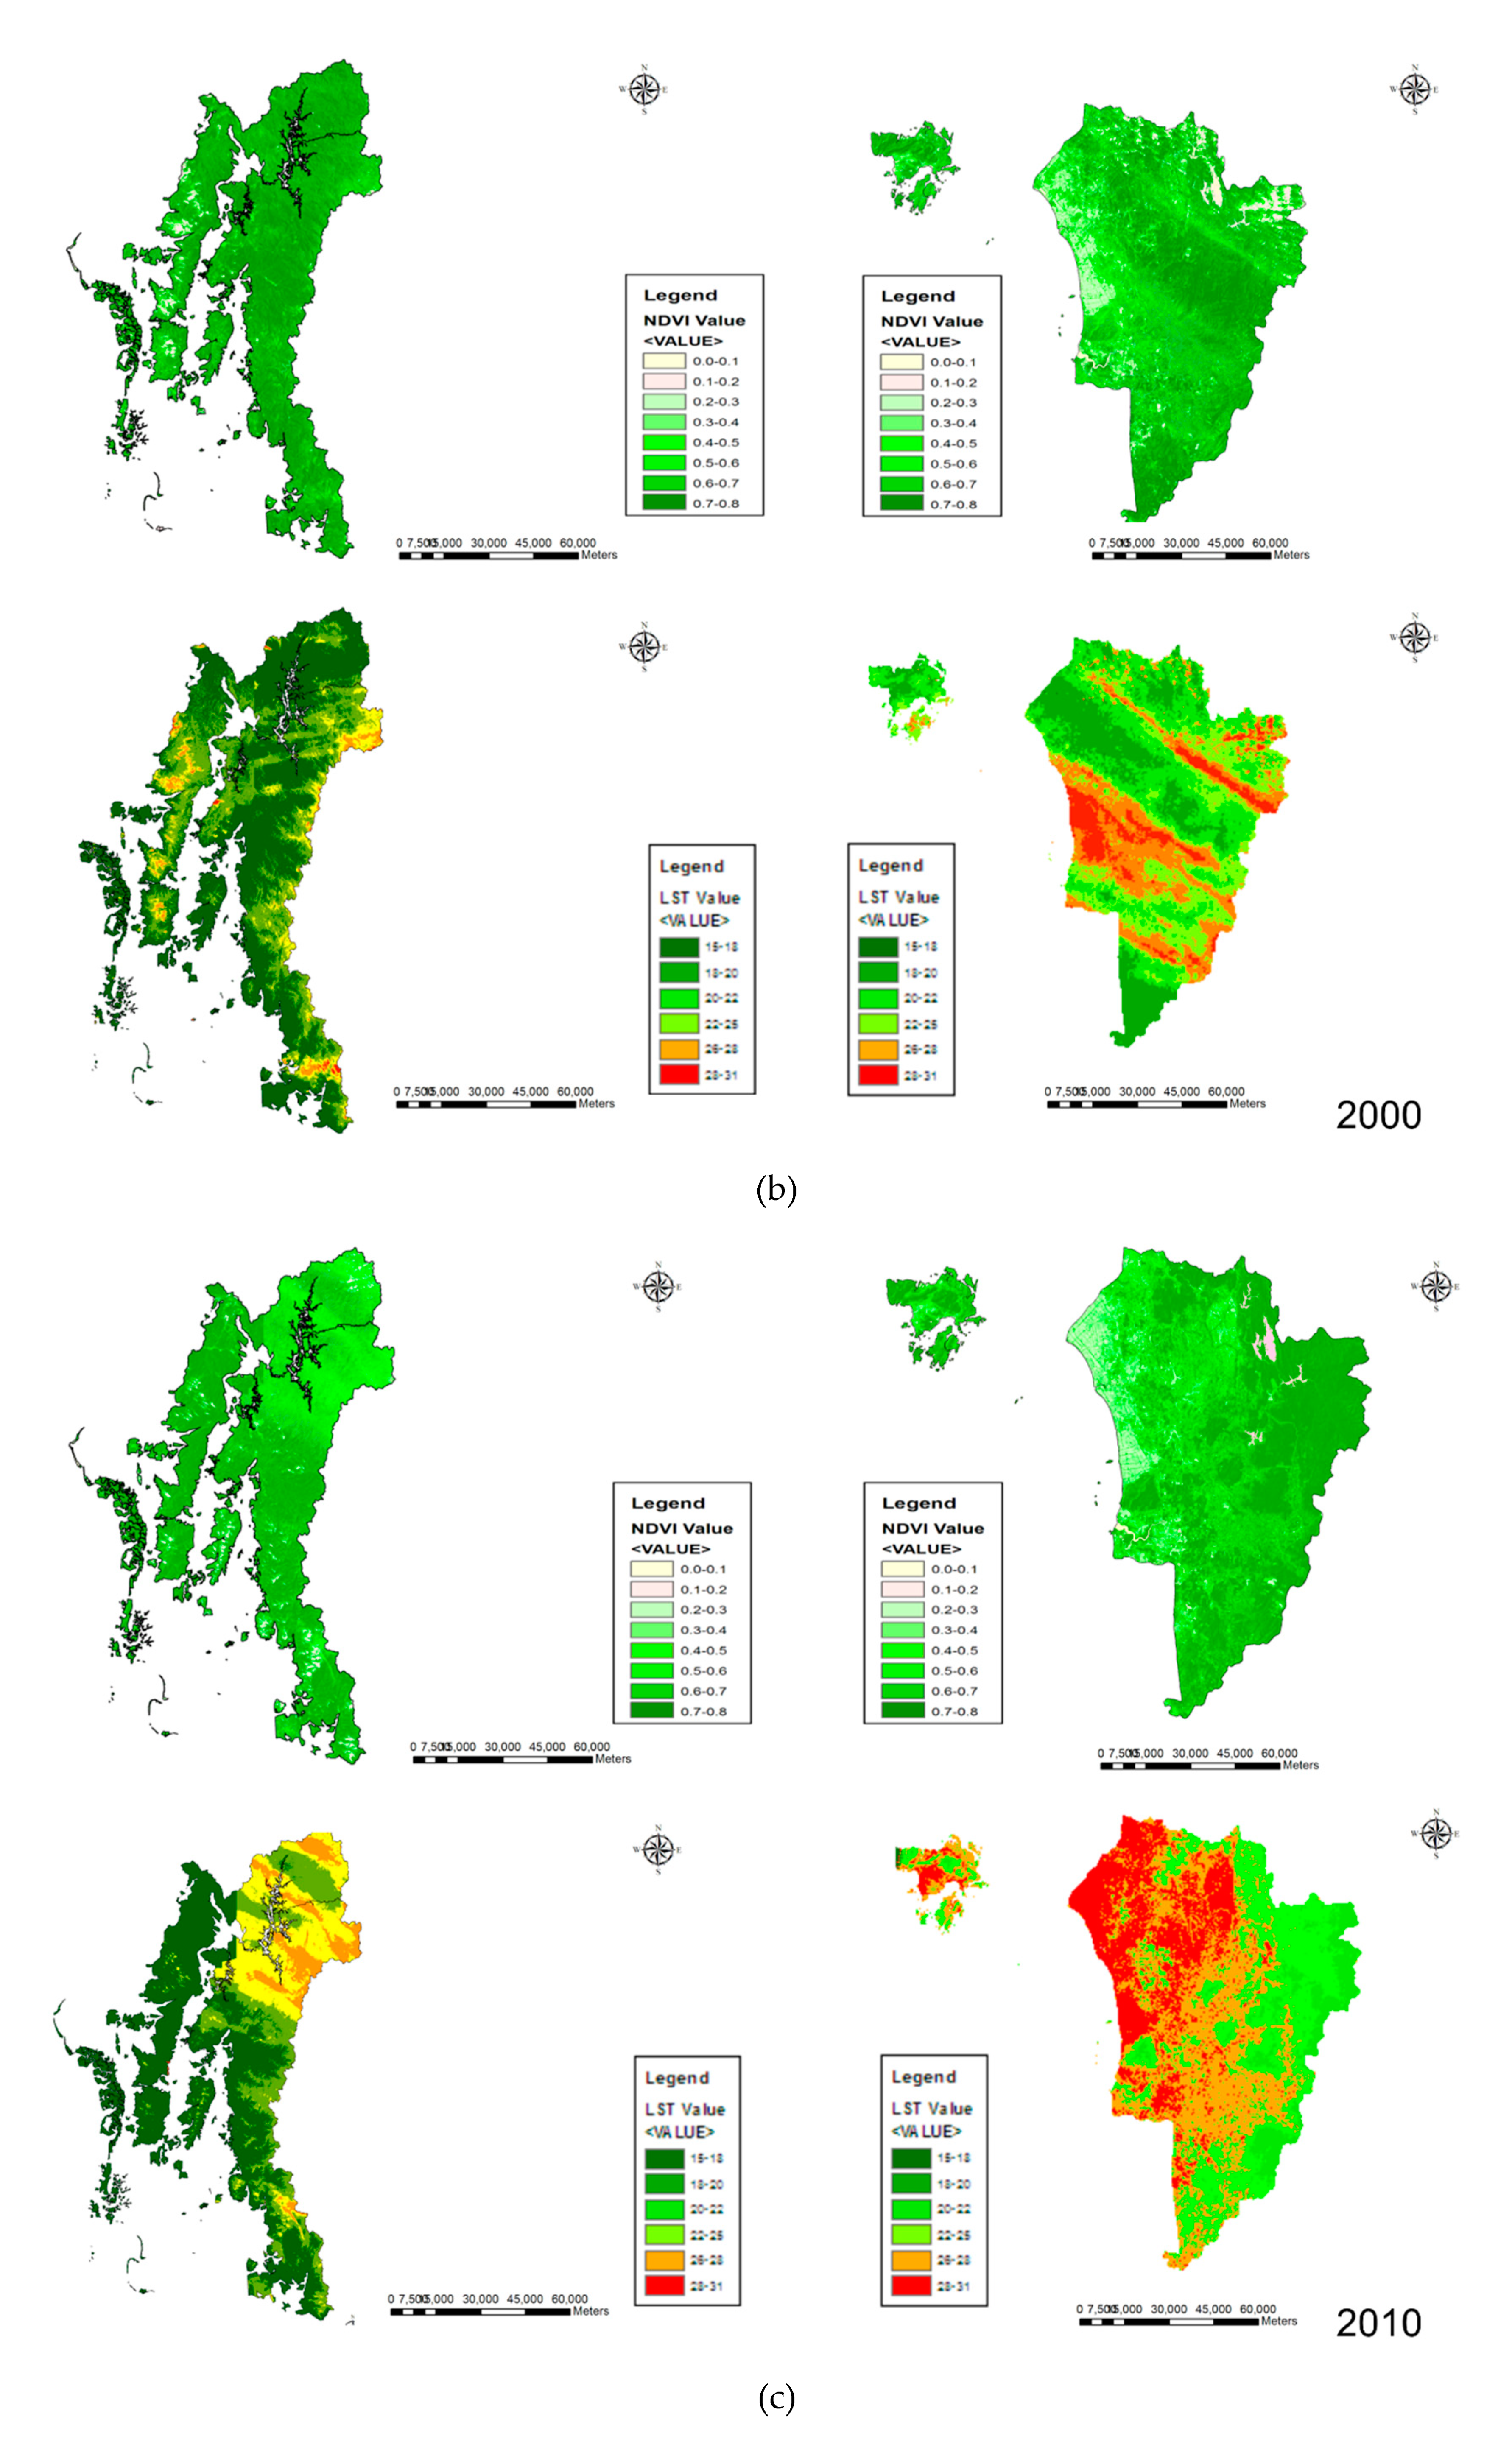
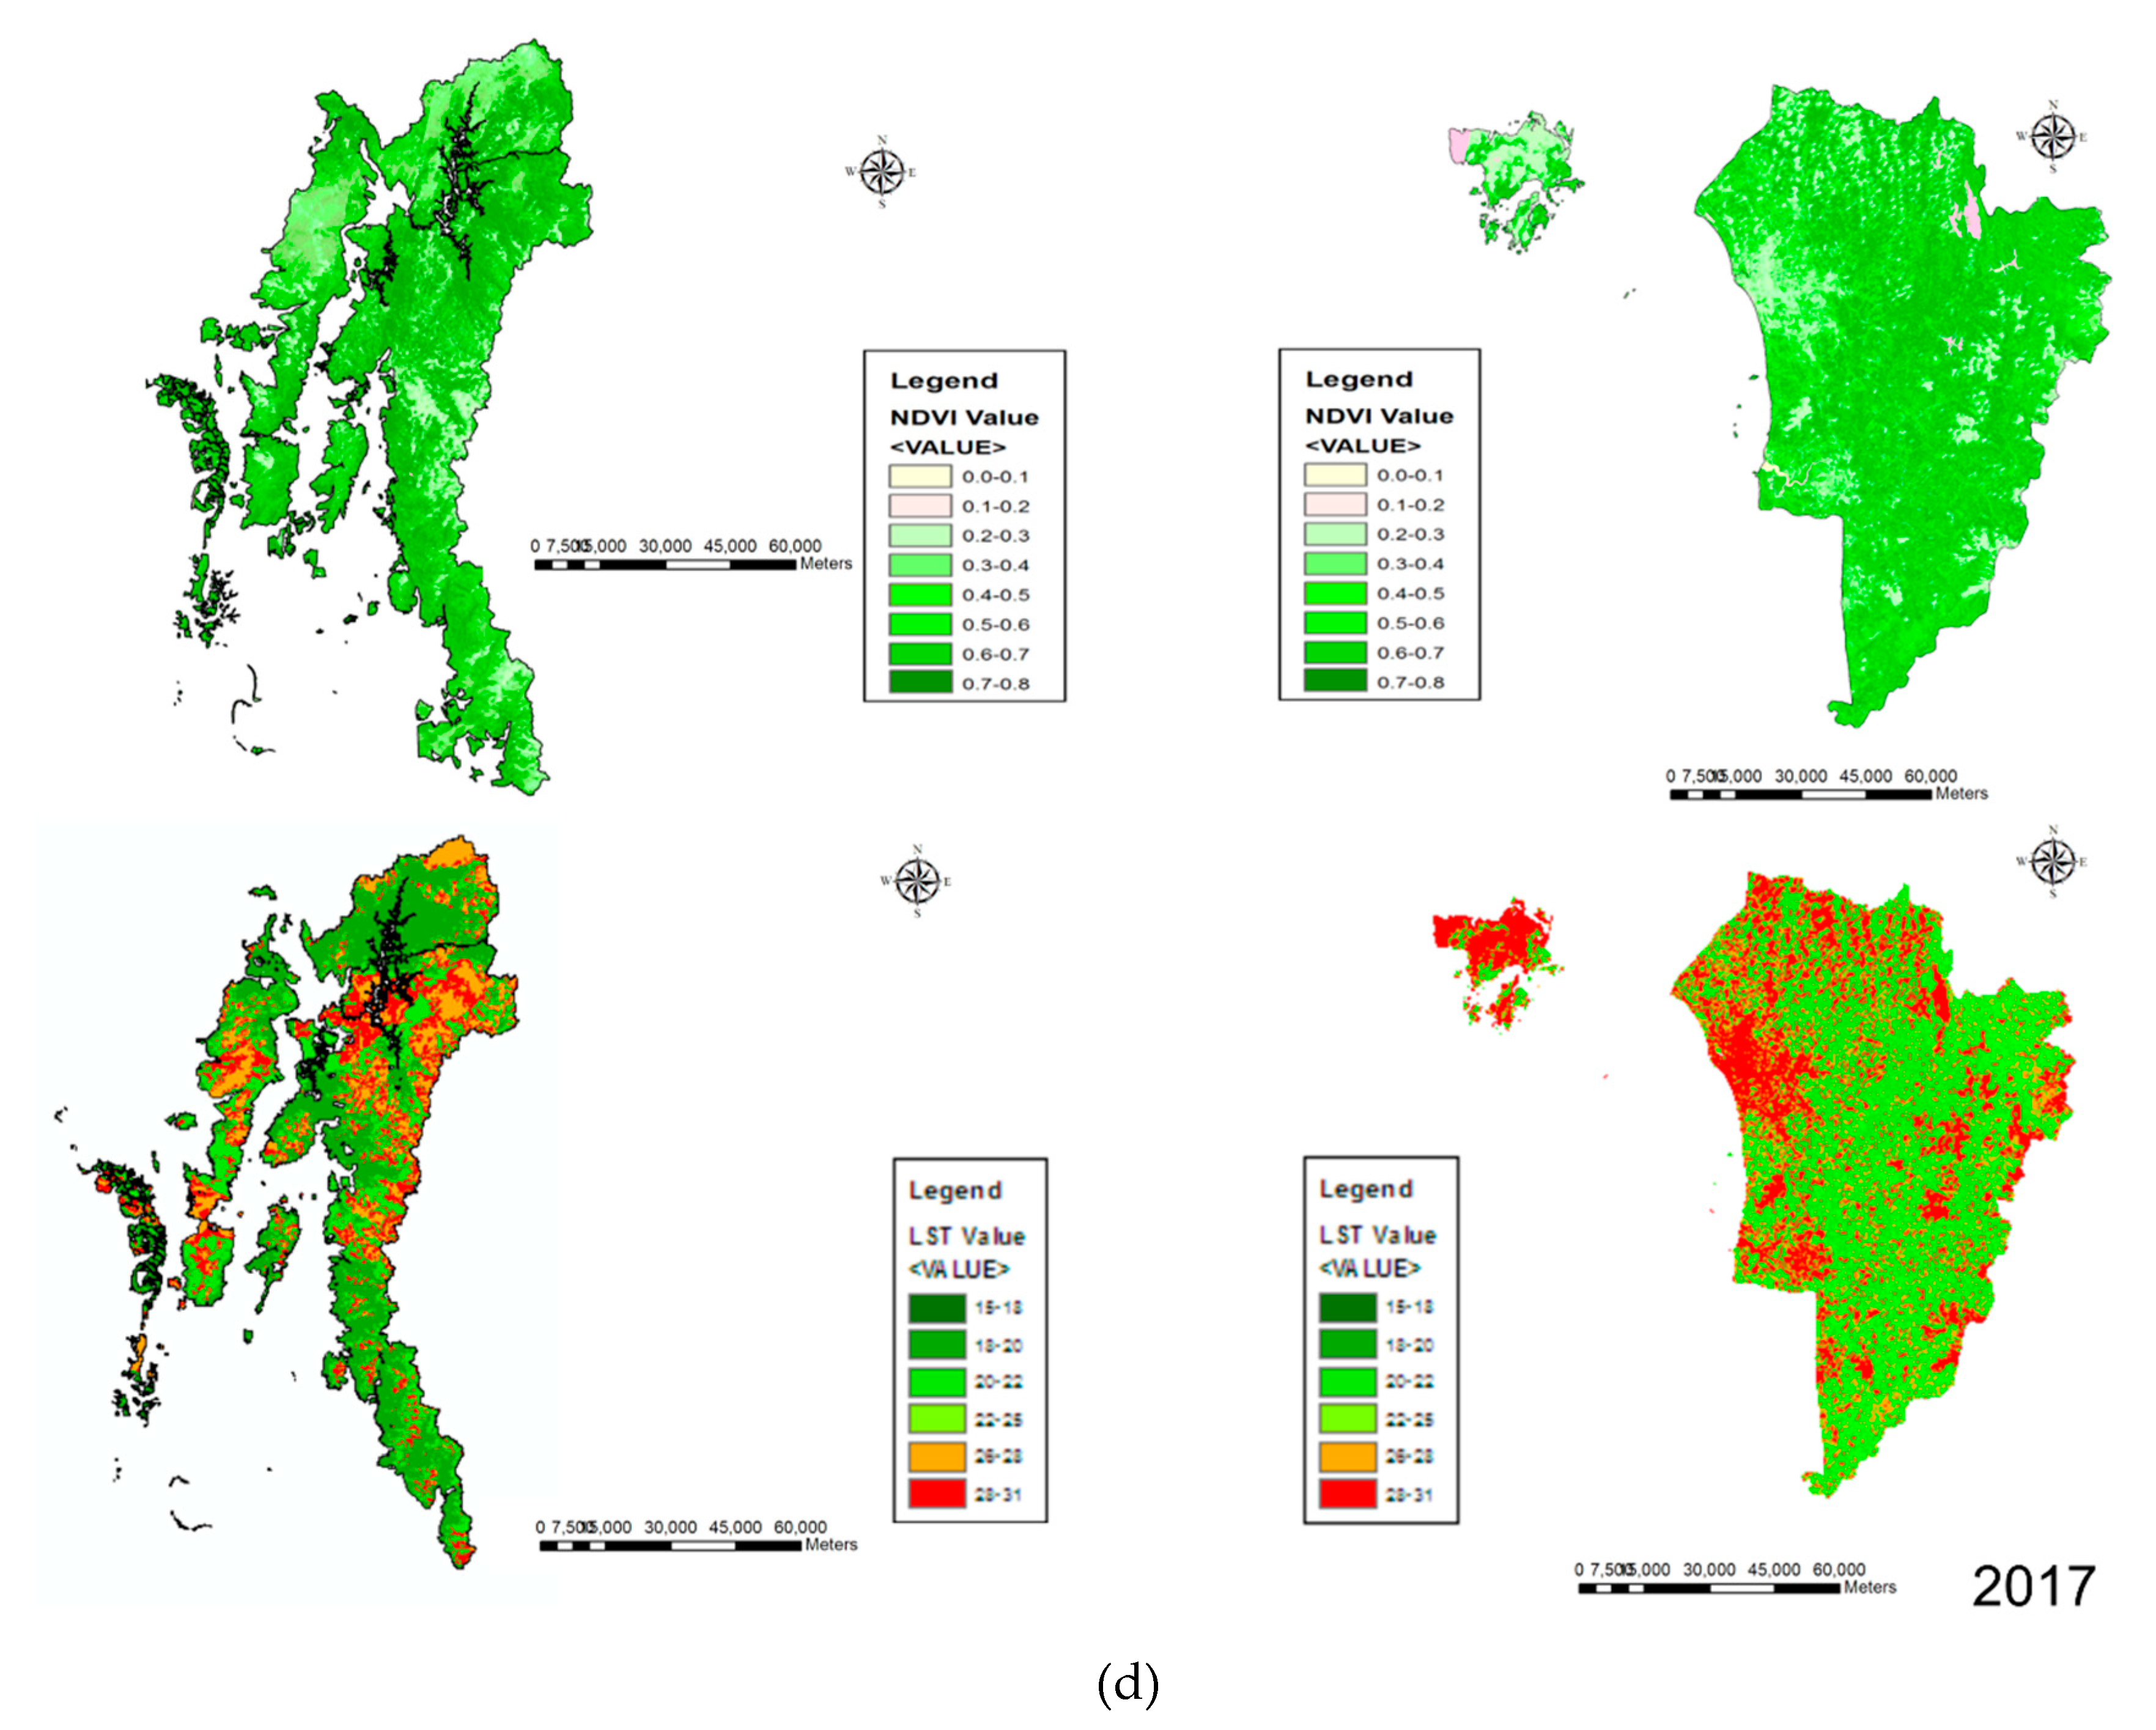
3.6. Spatial Distribution of LST and NDVI

Table 8 presents the LST and NDVI statistics for the states of both Perak and Kedah in Malaysia. LST distribution was categorized into suitable ranges and color coded to produce an LST thermal pattern distribution map across the study area (Figure 13). The average mean LST values for Perak and Kedah are 22.6 and 25 °C, respectively. The high rate of activities in deforestation and built-up area along with power generation accelerates the mean of LST. For Perak and Kedah, the mean NDVI values are 0.5 and 0.4, respectively.
LST presents an inverse relationship with NDVI. Figure 14 a and b depict mean LST and NDVI values associated with forest changes, with error bars representing the ± standard deviation of each year studied. The spatial pattern of temperature and vegetation covers for Kedah and Perak showed that higher temperature is possibly associated with the deforestation that occurred on that year. Other than NDVI influences, the combination and spatial distribution of land cover types also determine LST values and spatial trends, which have relatively high LST and lower NDVIs in areas with significant human impact [9].

4. Discussion

4.1. Forest Cover Changes and Analysis

Forest cover change in the form of deforestation and forest degradation is a major environmental problem manifested at the Perak and Kedah states of Malaysia. It is clear that the factors contributing to forest changes are mainly man-made due to settlement encroachment, mining, and artificial plantation. The major important land use changes in Perak and Kedah are land clearing for settlement and access road, forest to oil palm plantation, forest to an industrial area, cropland, fish farm, and mining [33]. For these reasons, the amount of forest cover and forest density in Perak and Kedah are showing a downward trend in recent years due to land use changes as well as deforestation and degradation of forests. Malaysia lost an average of 1.4 million hectares (0.65 percent) of its forest area per year since 2000 [34].
This study found that forest cover from 1988 to 2017 showed a reduction of 15.7% and 9.1% in Perak and Kedah, respectively. Urbanization and industrialization are one of the major reasons behind this forest cover change that is occurring in the whole of Malaysia. Kanniah et al. showed that over 12 years (2000–2012), Penang, Kuala Lumpur, Johor Bahru, and Pasir Gudang lost about 6.9 %, 3.5 %, 9.5 %, and 17.4 % of tree cover, respectively, from their total land area [35]. A more detailed analysis of tree cover change in Iskandar Malaysia using satellite data by [36] shows that urban development has resulted in a loss of 1565 ha of forest and mangrove cover between 2005 and 2014. This is the period where Iskandar Malaysia had undergone intensive urban development. The result of the percentage of forest cover loss in Perak and Kedah found in this study is justified by the previous studies about forest cover loss in different parts of Malaysia [37,38,39]. The rate of urbanization in Malaysia as documented by the Department of Statistics Malaysia increased gradually from 47% in 1988 to 75.5% in 2017 (Table 7). Based on the available documented statistics, Perak and Kedah experiences a 79.8% and 74.4%, respectively, urbanization rate in 2017. These statistics indicate the substantial relationship of forest changes at both states in 2017. More open land areas needed to cater to urbanization schemes in Malaysia’s economic plan. The urbanization factor also supported by the trend of economic growth. Perak and Kedah posted a constant Gross Domestic Product (GDP) growth for years up to 5.5% and 5.0% in 2017, respectively.
Perak and Kedah also recorded a continuous rise in population for more than 10 years, as their domestic economy increased. The size of the total population in Perak increased by 0.13 million from 2010 to 2.5 million in 2017. At the same time, Kedah also experienced an increased number of populations from 2 million populations in 2010 to 2.1 million populations in 2017 (Table 9). Demographic change, mainly characterized by an increasing population, is seen as one of the main factors for land use development hence resulting in land use change [40]. This study did not aim to investigate the relationship and differentiation between demographic and land use change, but the statistics obtained from the Malaysia Department of Statistics is enough to support our findings on forest cover change for the selective studied period.
The loss of forest cover needs to be controlled, and efforts should be taken to increase the forest cover in an urban environment in Malaysia. Furthermore, the Perak and Kedah states of Malaysia are in the developing stage. Hence, most forest lands have been converted to urban settlement. Settlement expansion, subsistence farming, and illegal logging are the major factors behind the land use and forest cover changes observed in the study area. The result showed that forests in Kedah are more vulnerable than forests in Perak due to mass forest degradation over the past few years. Many aspects based on the socio-economic conditions of the local population, farming systems, institutional settings, environmental policy, and political instabilities influenced the type of changes that have occurred on the forest cover [20,43]. This can lead to long-term environmental degradation. Most importantly, forests in Perak and Kedah are a source of revenue for the nation; therefore, it must be managed sustainably to ensure that future generations can benefit from its legacy. Identifying the driving forces for forest cover changes is essential, as this would allow policy and decision makers to understand ongoing land use management, forest management and forest cover change processes and their effects on the country as a whole [44,45,46,47].

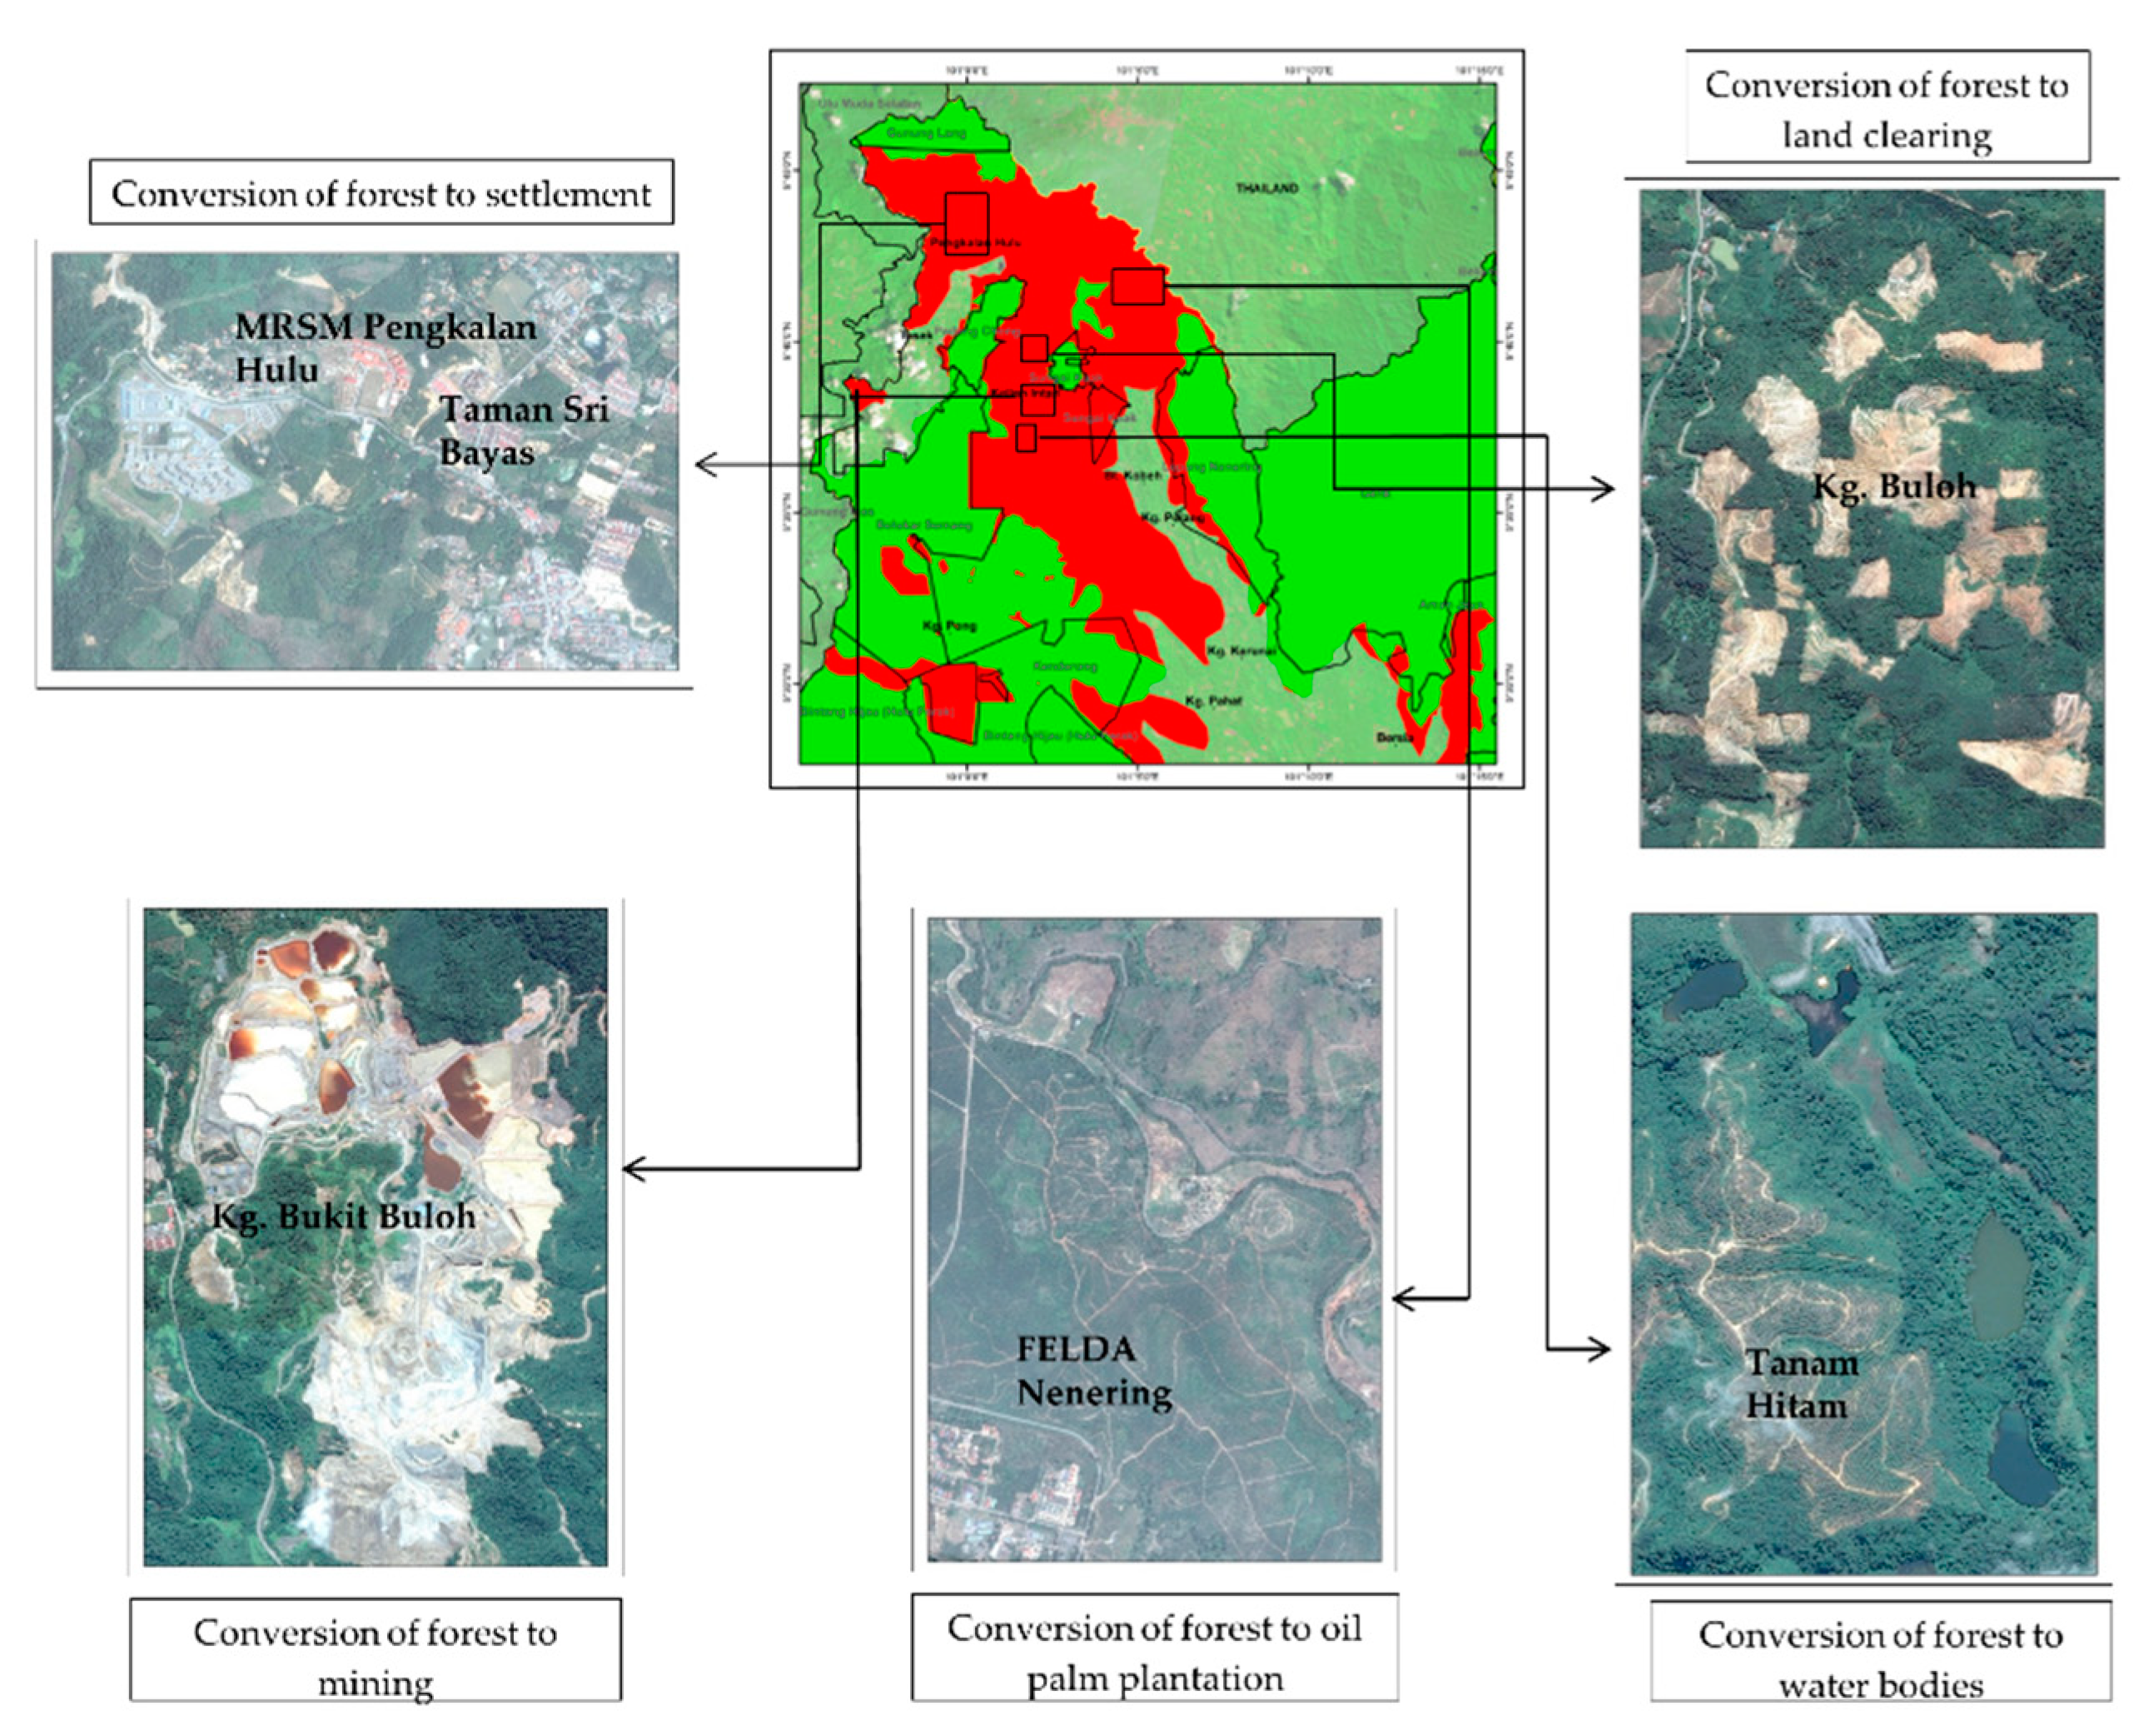
4.2. Deforestation in Perak and Kedah

Forest cover change in the form of deforestation is a major environmental problem manifested at Perak and Kedah states of Malaysia. NDVI is an indicator of vegetation health. The degradation of vegetation health through the decrease in green color would be reflected in a decrease in NDVI value. This vegetation index, when applied to plant communities, can establish a value of explaining how green is the area that can be reflected in the quantity of vegetation present in a particular area and its state of health and growth condition. This study showed that the forests of Perak and Kedah were healthy in 2000 and 2010 with NDVI value of 0.6–0.7, but they are slightly fragmented and degraded in recent years. The present NDVI value for Kedah and Perak forest cover is between 0.4 and 0.5, respectively. Almost 33.1% and 49.9% of forest cover are degraded in Perak and Kedah, respectively. Many factors can affect the NDVI values. A few scholars attempted to reveal the correlation between NDVI and meteorological factors [1,48,49,50,51]. The most widely used parameter is precipitation and air temperature by demonstrating the mechanism effects of these parameters on plant growth.
In this study, NDVI’s relationship with climatic factors, precipitation, and air temperature was assessed. There is a strong positive correlation between NDVI with precipitation but a negative correlation between NDVI and air temperature for both states through the study period between 1988 and 2017. Precipitation was one of the main factors in determining vegetation growth in tropical regions. In the years with heavy rainfall, the vegetation grows lush, and in the years with low rainfall, the vegetation becomes sparse as the growth slows down. Water replenishment helps in plant growth [52]. This relationship proved that more precipitation leads to a higher NDVI value. Meanwhile, in relation to negative correlation results between NDVI and air temperature in this study, [53] also showed that excessive air temperature would cause plant transpiration, leading to the lack of sufficient water for vegetation growth. It is also reported that higher air temperatures will increase plant respiration and reduce the photosynthesis, hence reducing the crop yield [54].
In view of the changes observed between 1988 and 2017, the forest cover pattern can be predicted for the future years. Therefore, this study encourages further research related to future prediction in relation to meteorological factors of forest cover maps for improvement in forest management and land use in Perak, Kedah, and the whole states of Malaysia.

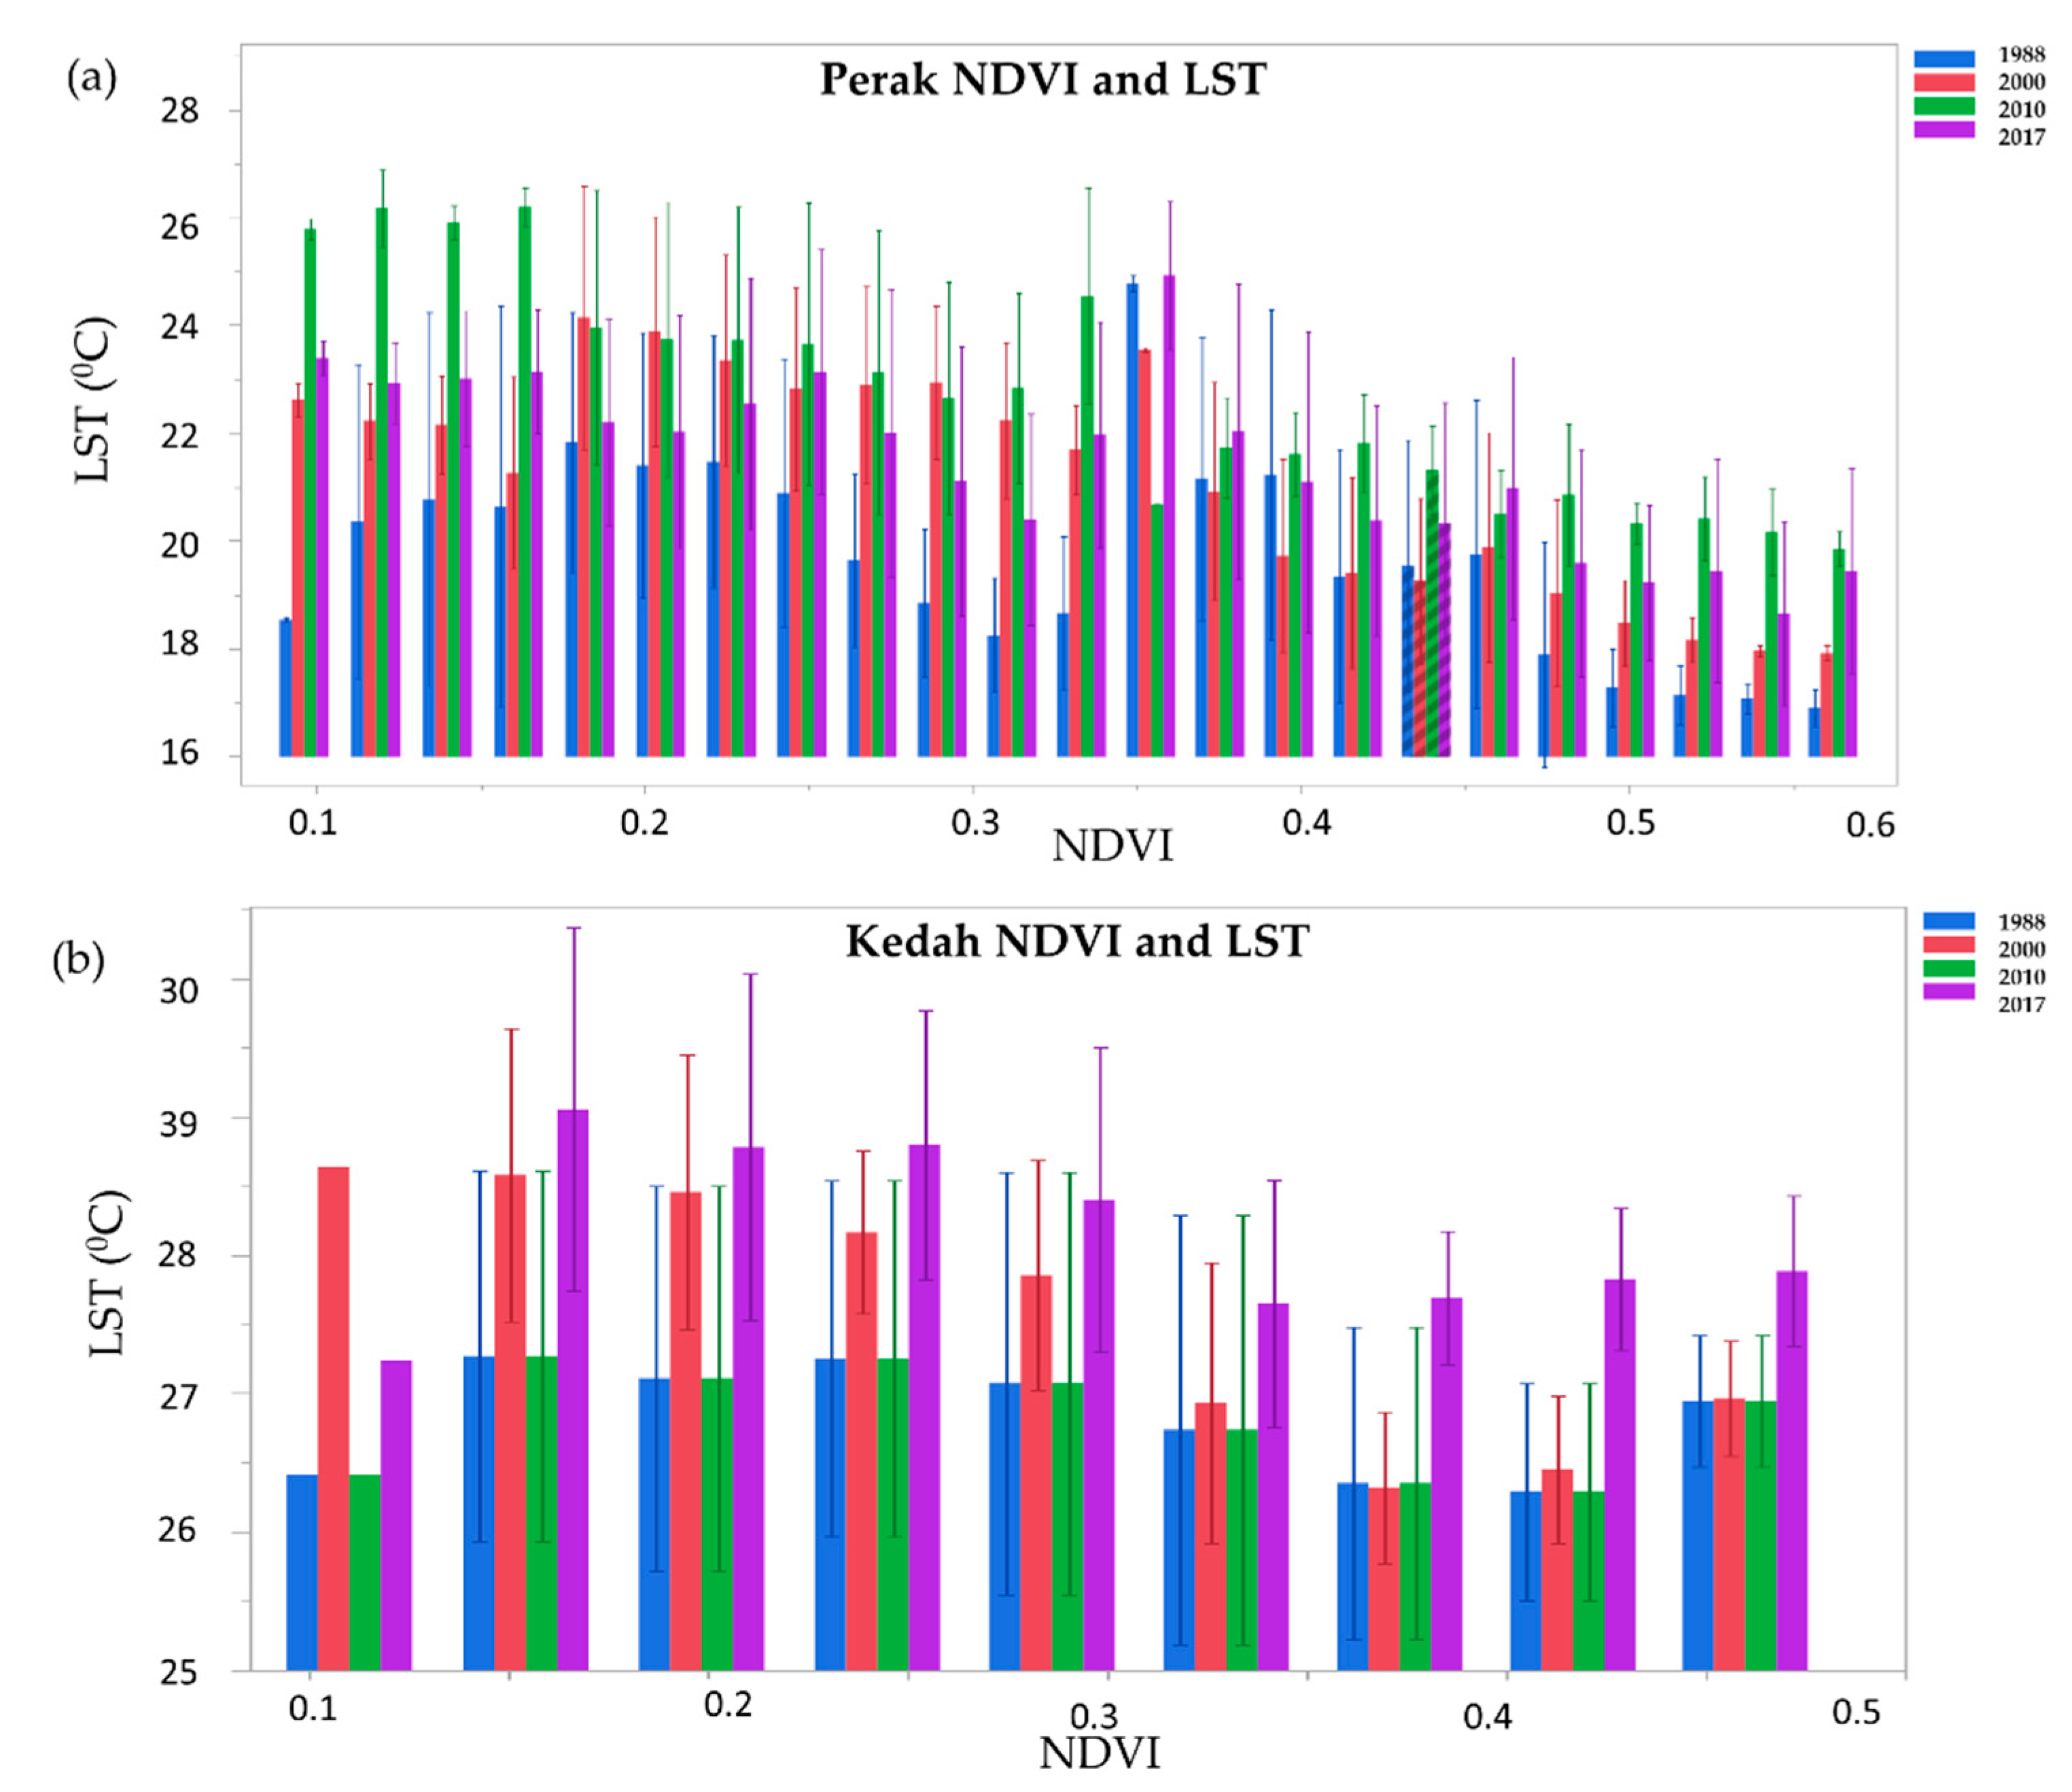
4.3. Relationship between LST and NDVI

LST distribution is closely related to the distribution of NDVI, where LST, in general, presents an inverse relationship with NDVI. This relationship may also be influenced by other factors, such as seasonal variation and spatial resolution. NDVI is highly dependent on the land use and land cover types of a region [55]. LST decreases with the increase in green vegetation such as forest, cropland and wetland and LST increases with the increase in a built-up area and bare land [14]. The relationship between LST and NDVI from the years 1988 to 2017, shows a decrease in vegetation level as well as rising surface temperature. A regression analysis between mean LST and mean NDVI associated with forest changes is made to further evaluate the influences of deforestation (Table 8). The linear regression coefficient is determined based on the strength of the correlation coefficient. All the relationships between LST and NDVI for the Perak and Kedah states’ forest for the years 1988, 2000, 2010 and 2017 show the highest negative strong correlation coefficient (Table 10).
This is related to statistical data from the states of Perak and Kedah, increasing the number of open spaces in Perak and Kedah, leading to hotter regions. There are many human activities in the region caused by land opening and forest clearing. Land clearing in 2010 and 2017 has prompted much higher temperature rises in Perak and Kedah. On average, the mean LST in the forest area of Kedah and Perak range between 19–27 °C with Kedah having the highest average mean LST. This is supported by the reported news by [56], where the large-scale illegal logging was detected at Ulu Muda forest in early 2017, and the logging issue in Ulu Muda has been ongoing for almost two decades. Change of forested land to agriculture would directly reduce photosynthesis and transpiration, thereby increasing the temperature in the surrounding environment [14]. Overall, the pattern of LST in Kedah and Perak from 1988 to 2017 is normal, with no explicit drastic changes.

5. Conclusions

In this study, Landsat 5 TM and Landsat 8 OLI data were used to derive forest cover changes, NDVI and LST over the states of Perak and Kedah in Malaysia over 29 years. Based on these study findings, Kedah and Perak experienced extensive deforestation, as forest cover in Perak dropped from 58% in 1988 to 49% and forest cover in Kedah dropped from 39% in 1988 to 35% in 2017. This has led to more open areas and deforestation, causing an increase in LST. It was also observed that areas with vegetation and forest had lower LST. Therefore, LST shows a strong negative correlation with NDVI.
Using NDVI to measure deforestation and forest degradation somehow contains limitations. Since phenology plays a vital role in the study of change processes, the dates of the Landsat images used must be selected carefully. During the processing stages, extra care should be taken to eliminate the clouds and the shadows. Attention to detail should also be taken to other aspects, such as climatic factors that have a significant impact on plant growth. Dry years can generate very low values in the vegetation index, while the wet season associated with northeast monsoon will lead to an increase in NDVI value. The Landsat images in this study were selected in the month of June of each year during the Southwest Monsoon season. Northeast Monsoon originating from North Pacific and China brings more rainfall compared to the Southwest Monsoon. Despite limitations on imaging, the result of this study shows a strong positive and negative correlation between NDVI and meteorological factors and NDVI and LST, as other results reported in many literatures. This indicates that Landsat images are suitable for identifying changes resulting from deforestation and degradation when the impact has been sufficiently minimized to generate a change in radiometry and NDVI. NDVI has predicted behavior and can be used as an indicator.
With NDVI and LST parameters added with climatic factors, temperature and precipitation, environmental changes can be identified; the results of identification can be used for sustainable development mechanisms. Based on our findings at the sub-national data of states in Peninsular Malaysia, it can be inferred that the forest cover did not fall to deficient levels. Our results suggest the need to explore factors that contribute to forest degradation, reasons that reduce deforestation and to develop strategies to decrease deforestation rates as a promotion of sustainable forest management. The results have given meaningful reference for assessment for the impact of climate change on vegetation coverage. More work than the scope combined with a variety of factors for comprehensive analysis should be considered.

Author Contributions

All the authors have made a substantial contribution toward the successful completion of this manuscript. Conceptualization, W.S.W.M.J. and K.N.A.M.; methodology, W.S.W.M.J., A.M.M.K., and K.N.A.M.; software, A.M.M.K., S.M.S., A.A., A.T.M.A. and N.K.A.J.S.; validation, W.S.W.M.J., A.M.M.K., S.M.S. and A.A.; formal analysis W.S.W.M.J., A.M.M.K., S.M.S. and A.A; investigation, W.S.W.M.J. and A.M.M.K.; data curation, W.S.W.M.J., A.M.M.K., S.M.S.Y. and A.A.; writing—original draft preparation, A.R., W.S.W.M.J. and A.M.M.K.; writing—review and editing, W.S.W.M.J., A.M.M.K., S.N.M.S. and W.R.K.; visualization, W.S.W.M.J., A.M.M.K., S.M.S., A.A., and S.N.M.S.; supervision, W.S.W.M.J. and K.N.A.M.; funding acquisition, K.N.A.M. All authors have read and agreed to the published version of the manuscript.

Funding

This research was funded by Research University Grant, DANA IMPAK PERDANA with grant no: DIP-2018-030, YAYASAN HASANAH, and GERAN UNIVERSITI PENYELIDIKAN with grant no: GUP-2018-132. The APC was funded by DANA IMPAK PERDANA with grant no: DIP-2018-030.

Acknowledgments

The authors would like to thank the Forestry Department of Peninsular Malaysia for sharing the relevant data.

Conflicts of Interest

The authors declare no conflict of interest.

References

  1. Deng, Y.; Wang, S.; Bai, X.; Tian, Y.; Wu, L.; Xiao, J.; Chen, F.; Qian, Q. Relationship among land surface temperature and LUCC, NDVI in typical karst area. Sci. Rep. 2018, 8, 641. [Google Scholar] [CrossRef]
  2. Culf, A.D.; Esteves, J.L.; Filho, A.O.M.; Da Rocha, H.R. Radiation, temperature and humidity over forest and pasture in Amazonia. Amazonian Deforestation and Climate. Amazon. Deforestation Clim. 1996, 175–192. [Google Scholar]
  3. Cusack, D.F.; Karpman, J.; Ashdown, D.; Cao, Q.; Ciochina, M.; Halterman, S.; Lydon, S.; Neupane, A. Global change effects on humid tropical forests: Evidence for biogeochemical and biodiversity shifts at an ecosystem scale. Rev. Geophys. 2016, 54, 523–610. [Google Scholar] [CrossRef] [Green Version]
  4. Ngwira, S.; Watanabe, T. An Analysis of the Causes of Deforestation in Malawi: A Case of Mwazisi. Land 2019, 8, 48. [Google Scholar] [CrossRef] [Green Version]
  5. Cresswell, M.P.; Morse, A.P.; Thomson, M.; Connor, S.J. Estimating surface air temperatures, from Meteosat land surface temperatures, using an empirical solar zenith angle model. Int. J. Remote. Sens. 1999, 20, 1125–1132. [Google Scholar] [CrossRef]
  6. Prata, F.; Caselles, V.; Coll, C.; Sobrino, J.A.; Ottlé, C. Thermal remote sensing of land surface temperature from satellites: Current status and future prospects. Remote. Sens. Rev. 1995, 12, 175–224. [Google Scholar] [CrossRef]
  7. Mahmood, R.; Pielke, R.A.; Hubbard, K.G.; Niyogi, D.; Dirmeyer, P.A.; McAlpine, C.; Carleton, A.M.; Hale, R.; Gameda, S.; Beltrán-Przekurat, A.; et al. Land cover changes and their bio geophysical effects on climate. Int. J. Climatol. 2014, 34, 929–953. [Google Scholar] [CrossRef]
  8. Malik, M.S.; Shukla, J.P.; Mishra, S. Relationship of LST, NDBI and NDVI using Landsat-8 data in Kandaihimmat Watershed, Hoshangabad, India. Indian J. Geo Mar. Sci. 2019, 48, 25–31. [Google Scholar]
  9. Converting Landsat, T.M. ETM+ thermal bands to temperature. Yale Cent. Earth Obs. 2010, 1–4. Available online: http://citeseerx.ist.psu.edu/viewdoc/download;jsessionid=60571AD20E7D15AEB7A013077666A36D?doi=10.1.1.187.6113&rep=rep1&type=pdf (accessed on 15 September 2019).
  10. Sabajo, C.R.; Le Maire, G.; June, T.; Meijide, A.; Roupsard, O.; Knohl, A. Expansion of oil palm and other cash crops causes an increase of the land surface temperature in the Jambi province in Indonesia. Biogeosciences 2017, 14, 4619–4635. [Google Scholar] [CrossRef] [Green Version]
  11. Kong, F.; Yin, H.; James, P.; Hutyra, L.R.; He, H.S. Effects of spatial pattern of greenspace on urban cooling in a large metropolitan area of eastern China. Landsc. Urban Plan. 2014, 128, 35–47. [Google Scholar] [CrossRef]
  12. Connors, J.P.; Galletti, C.; Chow, W.T.L. Landscape configuration and urban heat island effects: Assessing the relationship between landscape characteristics and land surface temperature in Phoenix, Arizona. Landsc. Ecol. 2012, 28, 271–283. [Google Scholar] [CrossRef]
  13. Jenerette, G.D.; Harlan, S.L.; Brazel, A.; Jones, N.; Larsen, L.; Stefanov, W.L. Regional relationships between surface temperature, vegetation, and human settlement in a rapidly urbanizing ecosystem. Landsc. Ecol. 2006, 22, 353–365. [Google Scholar] [CrossRef]
  14. Guha, S.; Govil, H.; Dey, A.; Gill, N. Analytical study of land surface temperature with NDVI and NDBI using Landsat 8 OLI and TIRS data in Florence and Naples city, Italy. Eur. J. Remote. Sens. 2018, 51, 667–678. [Google Scholar] [CrossRef]
  15. Anbazhagan, S.; Paramasivam, C.R. Statistical Correlation between Land Surface Temperature (LST) and Vegetation Index (NDVI) using Multi-Temporal Landsat TM Data. Int. J. Adv. Earth Sci. Eng. 2016, 5, 333–346. [Google Scholar] [CrossRef]
  16. Peng, S.; Piao, S.; Zeng, Z.; Ciais, P.; Zhou, L.; Li, L.; Myneni, R.; Yin, Y.; Zeng, H. Afforestation in China cools local land surface temperature. Proc. Natl. Acad. Sci. USA 2014, 111, 2915–2919. [Google Scholar] [CrossRef] [Green Version]
  17. Bala, G.; Caldeira, K.; Wickett, M.; Phillips, T.J.; Lobell, D.B.; Delire, C.; Mirin, A. Combined climate and carbon-cycle effects of large-scale deforestation. Proc. Natl. Acad. Sci. USA 2007, 104, 6550–6555. [Google Scholar] [CrossRef] [Green Version]
  18. Yuan, X.; Wang, W.; Cui, J.; Meng, F.; Kurban, A.; De Maeyer, P. Vegetation changes and land surface feedbacks drive shifts in local temperatures over Central Asia. Sci. Rep. 2017, 7, 3287. [Google Scholar] [CrossRef] [Green Version]
  19. Huete, A.; Justice, C.; van Leeuwen, W. Modis Vegetation Index Algorithm Theoretical Basis. Environ. Sci. 1999, 3, 129. [Google Scholar]
  20. Department of Statistics Malaysia. Available online: https://www.dosm.gov.my (accessed on 1 April 2020).
  21. Malaysian Meteorological Department. Meteorological Observations Annual Summary Observation Report from 1988 to 2008; Malaysian Meteorological Department: Kuala Lumpur, Malaysia, 2010.
  22. Haniff, N.B.M.; National Physical Planning Division, PLANMalaysia, Federal Deparment of Town and Country Planning Peninsular Malaysia, Kuala Lumpur, Malaysia. Personal communication, 2018.
  23. Omar, H.; Misman, M.A.; Musa, S. GIS and Remote Sensing for Mangroves Mapping and Monitoring. In Geographic Information Systems and Science; IntechOpen Limited: London, UK, 2019. [Google Scholar]
  24. Escuin, S.; Navarro, R.; Fernandez, P. Fire severity assessment by using NBR (Normalized Burn Ratio) and NDVI (Normalized Difference Vegetation Index) derived from LANDSAT TM/ETM images. Int. J. Remote. Sens. 2007, 29, 1053–1073. [Google Scholar] [CrossRef]
  25. NASA. Landsat 7 Science Data Users Handbook. Available online: http://landsathandbook. gsfc. nasa. gov/inst_cal/prog_sect8_2. html (accessed on 24 April 2020).
  26. Qin, Z.; Karnieli, A.; Berliner, P. A mono-window algorithm for retrieving land surface temperature from Landsat TM data and its application to the Israel-Egypt border region. Int. J. Remote. Sens. 2001, 22, 3719–3746. [Google Scholar] [CrossRef]
  27. Jiménez-Muñoz, J.C.; Sobrino, J.A. A generalized single-channel method for retrieving land surface temperature from remote sensing data. J. Geophys. Res. Space Phys. 2003, 108, 22. [Google Scholar] [CrossRef] [Green Version]
  28. Hua, A.K.; Ping, O.W. The influence of land-use/land-cover changes on land surface temperature: A case study of Kuala Lumpur metropolitan city. Eur. J. Remote. Sens. 2018, 51, 1049–1069. [Google Scholar] [CrossRef] [Green Version]
  29. Carlson, T.N.; Ripley, D.A. On the relation between NDVI, fractional vegetation cover, and leaf area index. Remote. Sens. Environ. 1997, 62, 241–252. [Google Scholar] [CrossRef]
  30. Sobrino, J.A.; Jiménez-Muñoz, J.C.; Paolini, L. Land surface temperature retrieval from LANDSAT TM 5. Remote. Sens. Environ. 2004, 90, 434–440. [Google Scholar] [CrossRef]
  31. Statistics, V. Forestry statistics Peninsular Malaysia 2001, 2006, 2010 and 2011; Malaysian Department of Statistics: Kuala Lumpur, Malaysia, 2012.
  32. Butler, R.A. Mongabay. Malaysia has the World’s Highest Deforestation Rate, Reveals Google Forest Map. Available online: http://news.mongabay.com/2013/1115-worlds-highest-deforestationrate.html2013 (accessed on 24 April 2020).
  33. Kanniah, K.D.; Siong, H.C. Urban forest cover change and sustainability of Malaysian cities. Chem. Eng. Trans. 2017, 56, 673–678. [Google Scholar]
  34. Kanniah, K.D.; Sheikhi, A.; Cracknell, A.P.; Goh, H.C.; Tan, K.P.; Ho, C.S.; Rasli, F.N. Satellite Images for Monitoring Mangrove Cover Changes in a Fast Growing Economic Region in Southern Peninsular Malaysia. Remote. Sens. 2015, 7, 14360–14385. [Google Scholar] [CrossRef] [Green Version]
  35. Miyamoto, M.; Parid, M.M.; Aini, Z.N.; Michinaka, T. Proximate and underlying causes of forest cover change in Peninsular Malaysia. For. Policy Econ. 2014, 44, 18–25. [Google Scholar] [CrossRef] [Green Version]
  36. Henson, I. An assessment of changes in biomass carbon stocks in tree crops and forests in Malaysia. J. Trop. For. Sci. 2005, 7, 279–296. [Google Scholar]
  37. Aisyah, A.; Shahrul, A.B.; Zulfahmie, M.Z.M.; Mastura, S.S.; Mokhtar, J. Deforestation analysis in Selangor, Malaysia between 1989 and 2011. J. Trop. For. Sci. 2015, 1, 3–12. [Google Scholar]
  38. Kroll, F.; Haase, D. Does demographic change affect land use patterns? Land Use Policy 2010, 27, 726–737. [Google Scholar] [CrossRef]
  39. Department of Statistics Malaysia. General report of the population and housing census 1991. In Population Growth and Urbanization in Peninsular Malaysia from 1911 to 2000; Jabatan Perangkaan Malaysia: Kuala Lumpur, Malaysia, 1995. [Google Scholar]
  40. Department of Statistics Malaysia. General Report of the Population and Housing Census 2000; Department of Statistics Malaysia: Kuala Lumpur, Malaysia, 2005.
  41. Kanianska, R. Agriculture and its impact on land-use, environment, and ecosystem services. In Landscape Ecology—The Influences of Land Use and Anthropogenic Impacts of Landscape Creation; IntechOpen Limited: London, UK, 2016; pp. 1–26. [Google Scholar]
  42. Meyfroidt, P.; Lambin, E.F.; Erb, K.-H.; Hertel, B.T.W. Globalization of land use: Distant drivers of land change and geographic displacement of land use. Curr. Opin. Environ. Sustain. 2013, 5, 438–444. [Google Scholar] [CrossRef]
  43. Vu, T.D.; Takeuchi, W.; Van, N.A. Carbon Stock Calculating and Forest Change Assessment Toward REDD+ Activities for The Mangrove Forest in Vietnam. Trans. Jpn. Soc. Aeronaut. Space Sci. Aerosp. Technol. Jpn. 2014, 12, 23. [Google Scholar] [CrossRef]
  44. Wan-Mohd-Jaafar, W.S.; Woodhouse, I.H.; Silva, C.A.; Omar, H.; Hudak, A.T. Modelling individual tree aboveground biomass using discrete return lidar in lowland dipterocarp forest of Malaysia. J. Tropical For. Sci. 2017, 4, 465–484. [Google Scholar]
  45. Wan Mohd Jaafar, W.S.; Woodhouse, I.H.; Silva, C.A.; Omar, H.; Maulud, A.; Mohan, M. Improving Individual Tree Crown Delineation and Attributes Estimation of Tropical Forests Using Airborne LiDAR Data. Forests 2018, 9, 759. [Google Scholar] [CrossRef] [Green Version]
  46. Wen, Z.; Wu, S.; Chen, J.; Lü, M. NDVI indicated long-term interannual changes in vegetation activities and their responses to climatic and anthropogenic factors in the Three Gorges Reservoir Region, China. Sci. Total Environ. 2017, 574, 947–959. [Google Scholar] [CrossRef] [PubMed]
  47. Hou, G.; Xu, C.; Dong, K.; Zhao, J.; Liu, Z. Spatial-temporal difference of time lag for response of NDVI to climatic factors in Changbai mountains. Fresen. Environ. Bull 2016, 25, 3348–3362. [Google Scholar]
  48. Fang, S.; Cammarano, D.; Zhou, G.; Tan, K.; Ren, S. Effects of increased day and night temperature with supplemental infrared heating on winter wheat growth in North China. Eur. J. Agron. 2015, 64, 67–77. [Google Scholar] [CrossRef]
  49. Wahidah, M.N.L.; Ahmad, W.J.W.; Said, M.N.M.; Zain, C.R.C.M. Effects of Elevated Atmospheric CO2 on Photosynthesis, Growth and Biomass in Shorea platycarpa F. Heim (Meranti Paya). Sains Malays. 2017, 46, 1421–1428. [Google Scholar]
  50. Zhang, M.; Gong, Z.N.; Zhao, W.J.; Duo, A. Landscape pattern change and the driving forces in Baiyangdian wetland from 1984 to 2014. Acta Ecol. Sin. 2016, 36, 4780–4791. [Google Scholar] [CrossRef]
  51. Li, Y.; Chang, J.; Wang, Y.; Jin, W.; Guo, A. Spatiotemporal Impacts of Climate, Land Cover Change and Direct Human Activities on Runoff Variations in the Wei River Basin, China. Water 2016, 8, 220. [Google Scholar] [CrossRef] [Green Version]
  52. Lakshmi Kumar, T.V.; Koteswara Rao, K.; Barbosa, H.; Prabha Jothi, E. Studies on spatial pattern of NDVI over Indiaand its relationship with rainfall, air temperature, soil moisture adequacy and ENSO. Geofizika 2013, 30, 1–18. [Google Scholar]
  53. Manandhar, R.; Odeh, I.O.A.; Ancev, T. Improving the Accuracy of Land Use and Land Cover Classification of Landsat Data Using Post-Classification Enhancement. Remote Sens. 2009, 1, 330–344. [Google Scholar] [CrossRef] [Green Version]
  54. The Star. Water for Penang and Kedah Comes from the Forests of Ulu Muda. Available online: https://www.thestar.com.my/lifestyle/living/2017/08/16/water-ulu-muda-forests (accessed on 10 December 2019).
  55. Ismail, N.A.; Zin, W.Z.W.; Ibrahim, W.; Yeun, L.C. Eight-Day Daytime Land Surface Temperature Pattern Over Peninsular Malaysia. Int. J. Technol. Eng. 2019, 8, 11949–11955. [Google Scholar]
  56. The Yale Centre for Earth Observation. Converting Landsat TM and ETM+ thermal Bands to Temperature; The Yale Centre for Earth Observation: New Haven, CT, USA, 2010; pp. 1–4. [Google Scholar]
Figure 1. Study area; Kedah and Perak.
Forests 11 00670 g001
Figure 2. Cloud removal phase from individual Landsat scene (a) Landsat-5 TM, 27 June 2000; (b) Landsat-5 TM, 30 June 2000; (c) cloud-free image result 2000.
Forests 11 00670 g002
Figure 3. Model of spectral radiance to calculate land surface temperature (LST) for Landsat 8 (Operational Land Imager (OLI)).
Forests 11 00670 g003
Figure 4. The overall terminology of the influence of forest degradation on LST.
Forests 11 00670 g004
Figure 5. Forest cover changes and deforestation hotspot areas in Perak: (a) forest changes 1988–2000; (b) forest changes 2000–2010; (c) forest changes 2010–2017; (d) forest changes 1998–2017.
Forests 11 00670 g005aForests 11 00670 g005b
Figure 6. Forest cover replaced by different types at Pengkalan Hulu, Perak.
Forests 11 00670 g006
Figure 7. Forest cover changes and deforestation hotspot areas in Kedah: (a) forest changes 1988–2000; (b) forest changes 2000–2010; (c) forest changes 2010–2017; (d) forest changes 1998–2017.
Forests 11 00670 g007aForests 11 00670 g007b
Figure 8. Forest cover replaced by different types at Sintok, Kedah.
Forests 11 00670 g008
Figure 9. Result of the Normalized Difference Vegetation Index (NDVI) distribution in Perak: (a) NDVI 1988; (b) NDVI 2000; (c) NDVI 2010; (d) NDVI 2017.
Forests 11 00670 g009
Figure 10. NDVI for Perak forest cover.
Forests 11 00670 g010
Figure 11. Result of NDVI distribution in Kedah: (a) NDVI 1988; (b) NDVI 2000; (c) NDVI 2010; (d) NDVI 2017.
Forests 11 00670 g011
Figure 12. NDVI for Kedah forest cover.
Forests 11 00670 g012
Figure 13. Spatial distribution map of the LST (temperature in degree celsius) and NDVI of Perak (left) and Kedah (right): (a) 1988; (b) 2000; (c) 2010; (d) 2017.
Forests 11 00670 g013aForests 11 00670 g013bForests 11 00670 g013c
Figure 14. Mean error bar plot of LST and NDVI: (a) Perak and (b) Kedah.
Forests 11 00670 g014
Table 1. Landsat data specification selected for the state of Perak and Kedah.
Satellite SensorPart/ RowYearResolution (m)Wavelength (µm)
Landsat-5Thematic Mapper (TM)127/56
127/57
128/56
128/57
1988
2000
2010
300.45–0.52 (Band 1)
0.52–0.60 (Band 2)
0.63–0.69 (Band 3)
0.76–0.90 (Band 4)
1.55–1.75 (Band 5)
10.40–12.50 (Band 6-Thermal)
2.09–2.35 (Band 7)
Landsat-8Operational Land Images (OLI) and Thermal Infrared Sensor (TIRS)127/56
127/57
128/56
128/57
2017300.43–0.45 (Band 1)
0.45–0.51 (Band 2)
0.53–0.59 (Band 3)
0.64–0.67 (Band 4)
0.85–0.88 (Band 5)
1.57–1.65 (Band 6)
2.11–2.29 (Band 7)
0.50–0.68 (Band 8)
1.36–1.38 (Band 9)
10.60–11.19 (Band 10-Thermal)
11.50–12.51 (Band 11-Thermal)
Table 2. Average air temperature and precipitation data reading obtained from the Malaysia Meteorological Department for year 1988, 2000, 2010 and 2017.
StateYearAverage Air Temperature (°C)Precipitation Total Rainfall Amount (mm)StateAverage Air Temperature (°C)Precipitation Total Rainfall Amount (mm)
MeanMaxMeanMax
Perak198826.931.82660.5Kedah27.431.32161.7
Perak200027.432.92959.1Kedah27.232.51994.6
Perak201026.931.73257.6Kedah27.731.32274.0
Perak201729.232.32145.0Kedah29.332.52782.0
Table 3. Amount of forest cover in Perak.
Type of Forest 1988
(ha)
2000
(ha)
2010
(ha)
2017
(ha)
Forest Cover Change
(1988–2017)
Forest Cover Change
(%)
Terrestrial Forest 1,164,6831,113,5701,013,673979,760−184,923−15.88
Mangrove Forest43,79244,96839,55939,291−4501−10.28
Total Forest1,208,4751,158,5381,053,2321,019,052−189,423−15.67
Table 4. Amount of forest cover change in Kedah.
Type of Forest1988
(ha)
2000
(ha)
2010
(ha)
2017
(ha)
Forest Cover Change
(1988–2017)
Forest Cover Chnge
(%)
Terrestrial Forest 356,329349,438333,498324,745−31,583−8.86
Mangrove Forest 9708864378527900−1807−18.61
Total Forest366,037358,082341,350332,646−33,391−9.12
Table 5. NDVI value and area of forest cover in Perak.
NDVI ValueArea (ha)
1988200020102017
0.0–0.116,724.565056.5912,958.205764.69
0.1–0.219,347.806357.4312,906.0318,536.43
0.2–0.331,243.3910,225.2720,056.6037,353.45
0.3–0.446,603.7020,886.5325,627.3637,353.45
0.4–0.5166,219.8980,728.2948,286.42147,867.51
0.5–0.6505,917.42455,013.46278,722.24703,684.43
0.6–0.7393,153.52525,641.74706,503.92187,280.67
0.7–0.812,798.9148,149.0610,947.4393.24
Table 6. NDVI value and area of forest cover in Kedah.
NDVI ValueArea (Ha)
1988200020102017
0.0–0.17997.307609.79748.742113.84
0.1–0.28432.566139.101199.034419.76
0.2–0.313,503.456890.292123.0221,314.10
0.3–0.420,353.0915,003.253953.0356,565.38
0.4–0.529,416.2555,723.6412,614.4182,552.44
0.5–0.678,622.54102,794.4284,128.78138,791.35
0.6–0.7189,087.13141,246.97230,266.8033,633.75
0.7–0.87505.7115,933.053490.6338.44
Table 7. Linear correlation coefficients between NDVI and meteorological factors by forest change.
Meteorological FactorsState1988200020102017
Precipitation Rainfall (mm)PerakNDVI = 0.325 + 0.011*R
R2 = 0.80
NDVI = 0.892 + 0.0124*R
R2 = 0.71
NDVI = 0.225 + 0.001*R
R2 = 0.859
NDVI = 0.974 + 0.025*R
R2 = 0.67
KedahNDVI = 0.456 + 0.071*R
R2 = 0.75
NDVI = 0.558 + 0.186*R
R2= 0.69
NDVI = 0.356 + 0.051*R
R2 = 0.78
NDVI = 0.889 + 0.156*R
R2 = 0.65
Air Temperature (°C)PerakNDVI = 3.045 − 0.065*T
R2 = 0.71
NDVI = 3.546 − 0.105*T
R2 = 0.68
NDVI = 2.046 − 0.055*T
R2 = 0.761
NDVI = 2.546 − 0.100*T
R2 = 0.65
KedahNDVI = 5.005 − 0.051*T
R2 = 0.68
NDVI = 5.689 − 0.119*T
R2= 0.65
NDVI = 4.891 − 0.089*T
R2 = 0.75
NDVI = 4.059 − 0.129*T
R2 = 0.61
*R = Rainfall; T = Temperature.
Table 8. Statistics for LST and NDVI Kedah and Perak.
LST (°C)NDVI
MinMaxMeanSDMinMaxMeanSD
1988Perak16.9326.4821.576.1800.820.530.17
Kedah20.3730.0025.676.2900.980.380.21
2000Perak19.7727.04423.553.4300.750.580.13
Kedah20.5421.0719.924.4000.980.470.16
2010Perak14.5127.4820.846.2700.740.590.14
Kedah20.8927.24326.786.9400.880.480.20
2017Perak18.8829.9024.456.2500.850.440.11
Kedah23.8534.7827.766.5000.830.450.14
Min: Minimum, Max: Maximum, SD: Standard Deviation.
Table 9. Socio-economic and demographic data in Perak, Kedah and the whole of Malaysia.
Economic Activities (%)20102017
PerakKedahPerakKedah
Agriculture10.14.69.67.1
Mining0.20.15.914.5
Manufacturing3.84.08.04.2
Construction3.53.124.57.1
Overall GDP5.43.35.55.0
Demographic (million)20102017
PerakKedahPerakKedah
Population2.42.02.52.1
Urbanization Rate for Malaysia (%)198812000220102017
47.062.070.975.5
Note: 1 Based on population and housing census 1991 [41]; 2 Based on population and housing census 2000 [42]; Source: Department of Statistics Malaysia (www.dosm.gov.my) [20].
Table 10. Linear correlation coefficients between LST and NDVI.
State1988200020102017
PerakLST = −5.865NDVI + 23.195
R2 = 0.8122
LST = −6.882NDVI + 25.805
R2 = 0.798
LST = −11.194NDVI + 27.097
R2 = 0.856
LST = −3.337NDVI + 28.837
R2 = 0.910
KedahLST = −2.335NDVI + 28.663
R2 = 0.891
LST = −6.566NDVI + 25.674
R2 = 0.889
LST = −6.050NDVI + 23.063
R2 = 0.841
LST = −11.624NDVI + 27.206
R2 = 0.905

