
An Interactive Differential Evolution Algorithm Based on Backtracking Strategy Applied in Interior Layout Design


Abstract
:1. Introduction
2. Related Work
2.1. Layout Problem
2.2. Auxiliary Design Tools
3. Interactive Evolutionary Algorithm
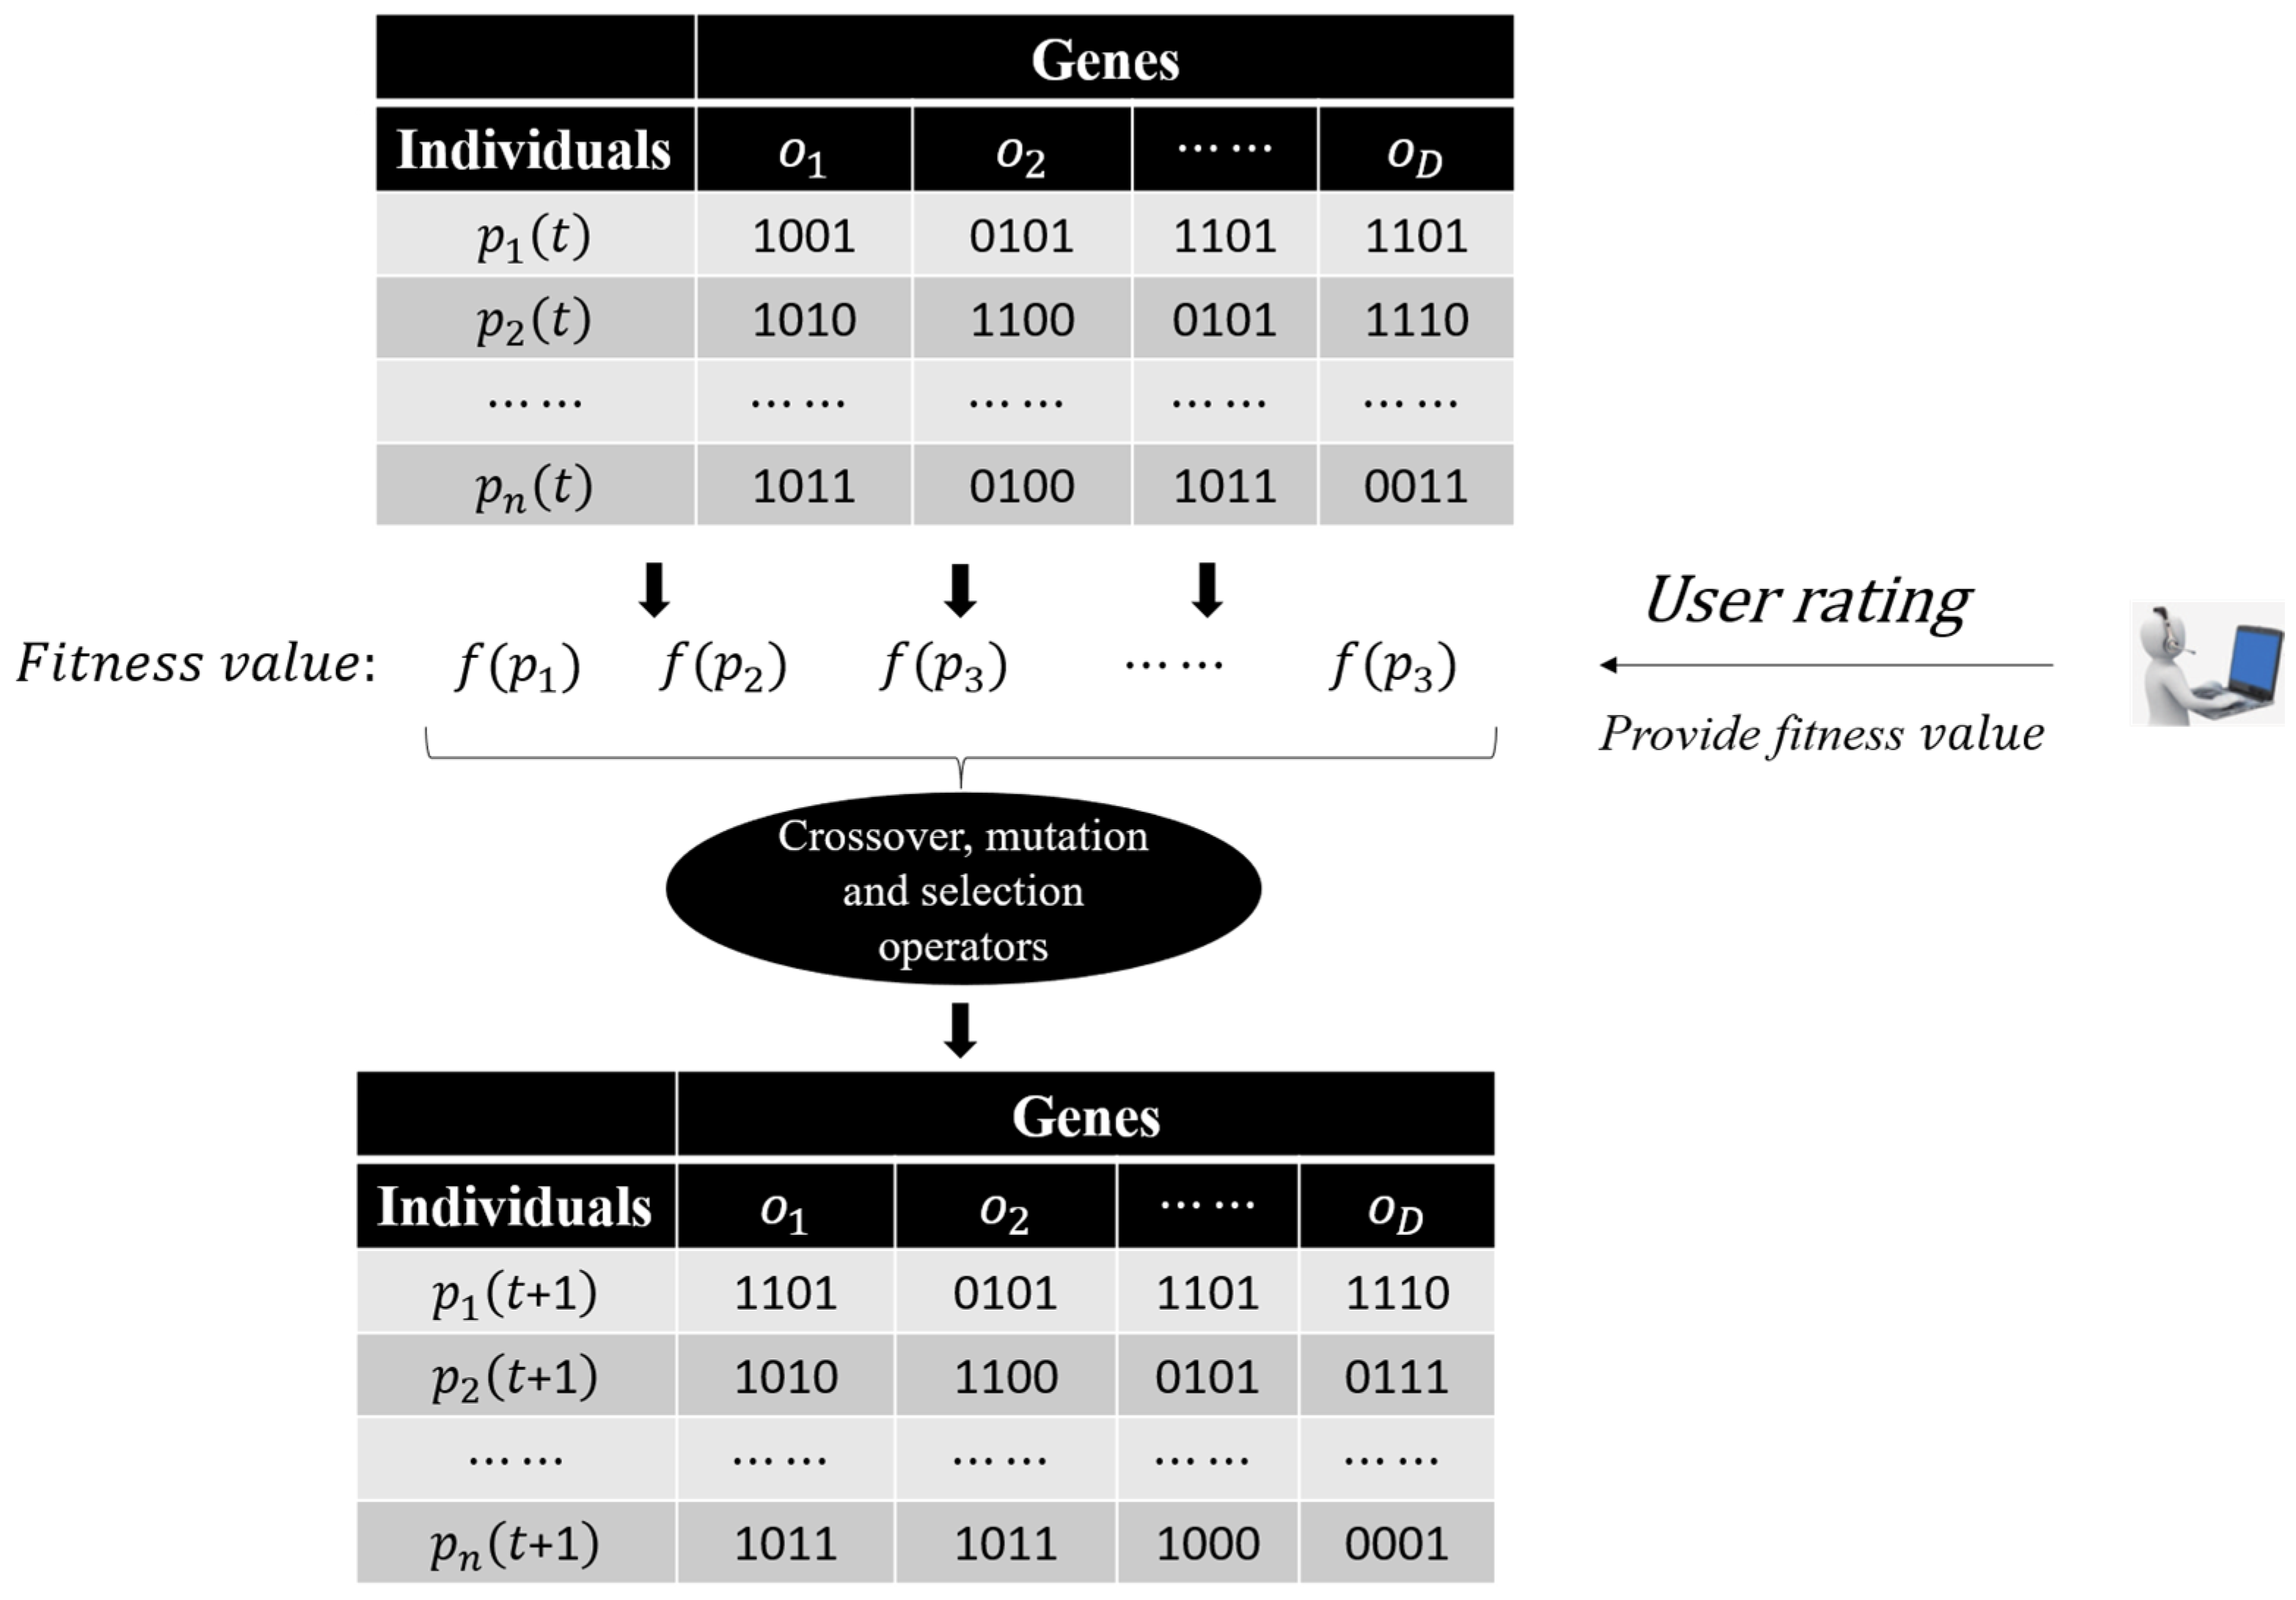
3.1. Interactive Genetic Algorithm
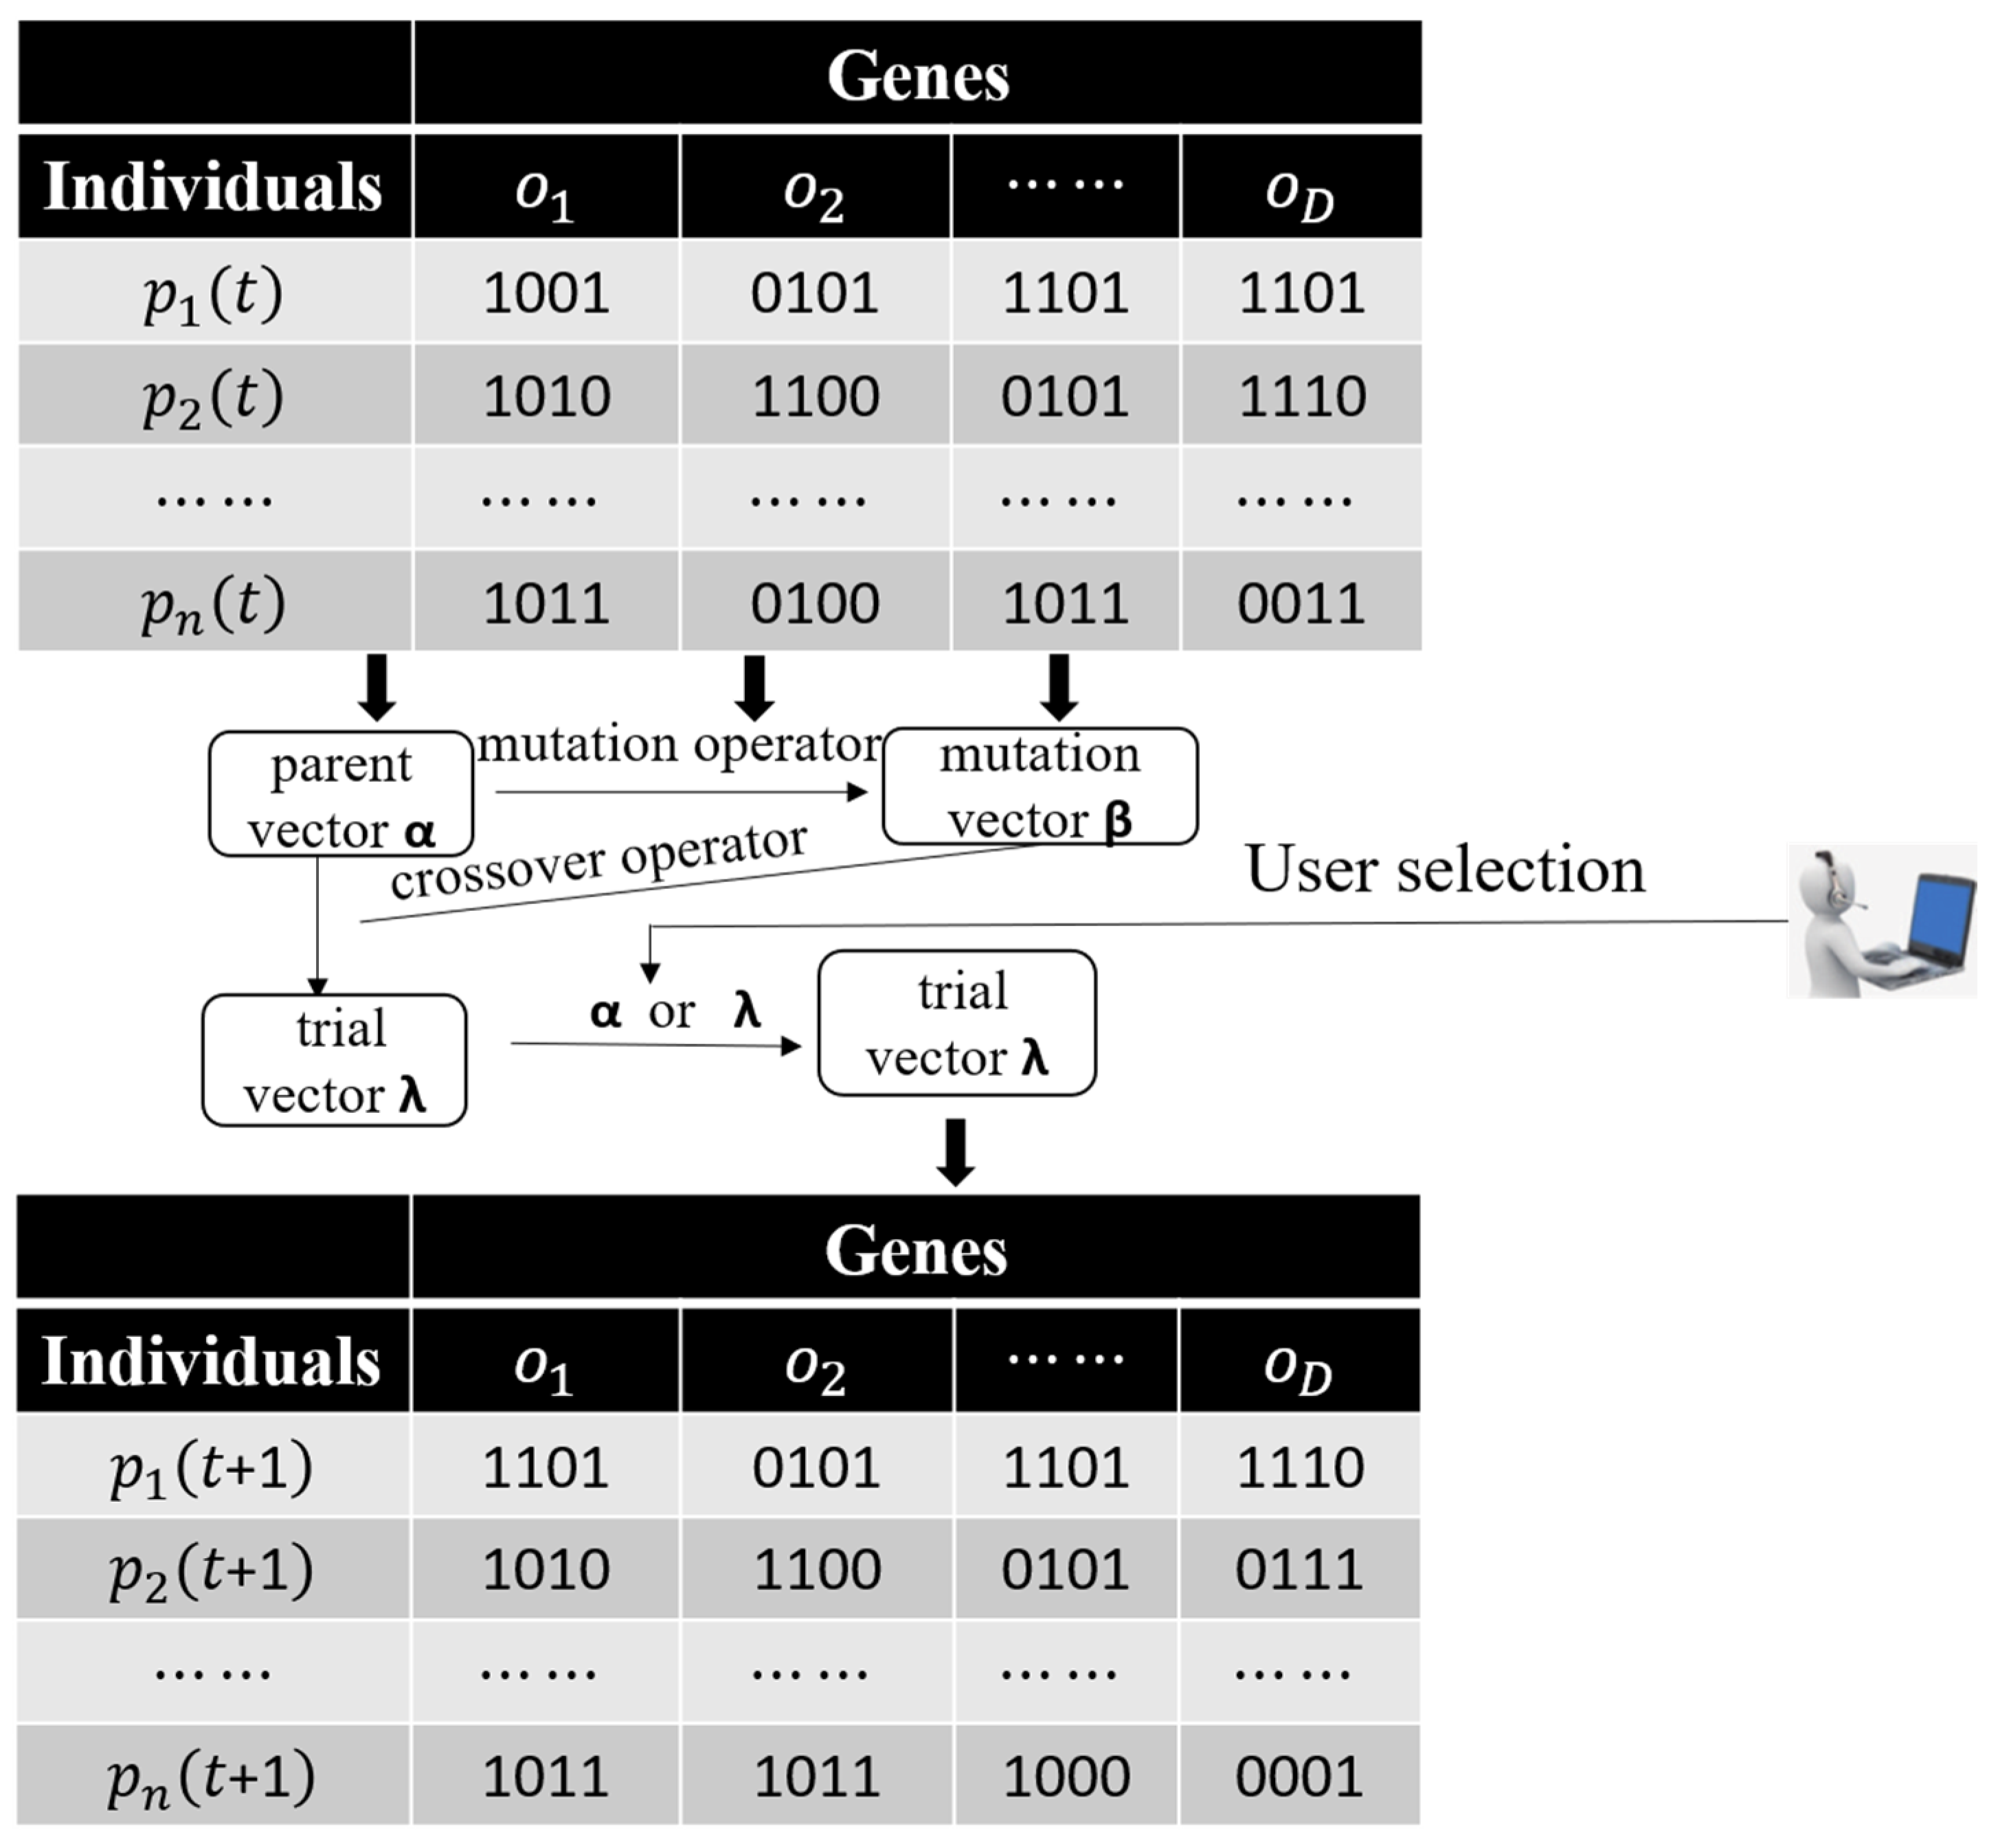
3.2. Interactive Differential Evolution Algorithm
3.2.1. Initialization
3.2.2. Mutation Operation
- (1)
- DE/rand/1:
- (2)
- DE/best/1:
- (3)
- DE/current-to-best/1:
- (4)
- DE/current-to-pbest/1:
3.2.3. Crossover Operation
3.2.4. Selection Operation
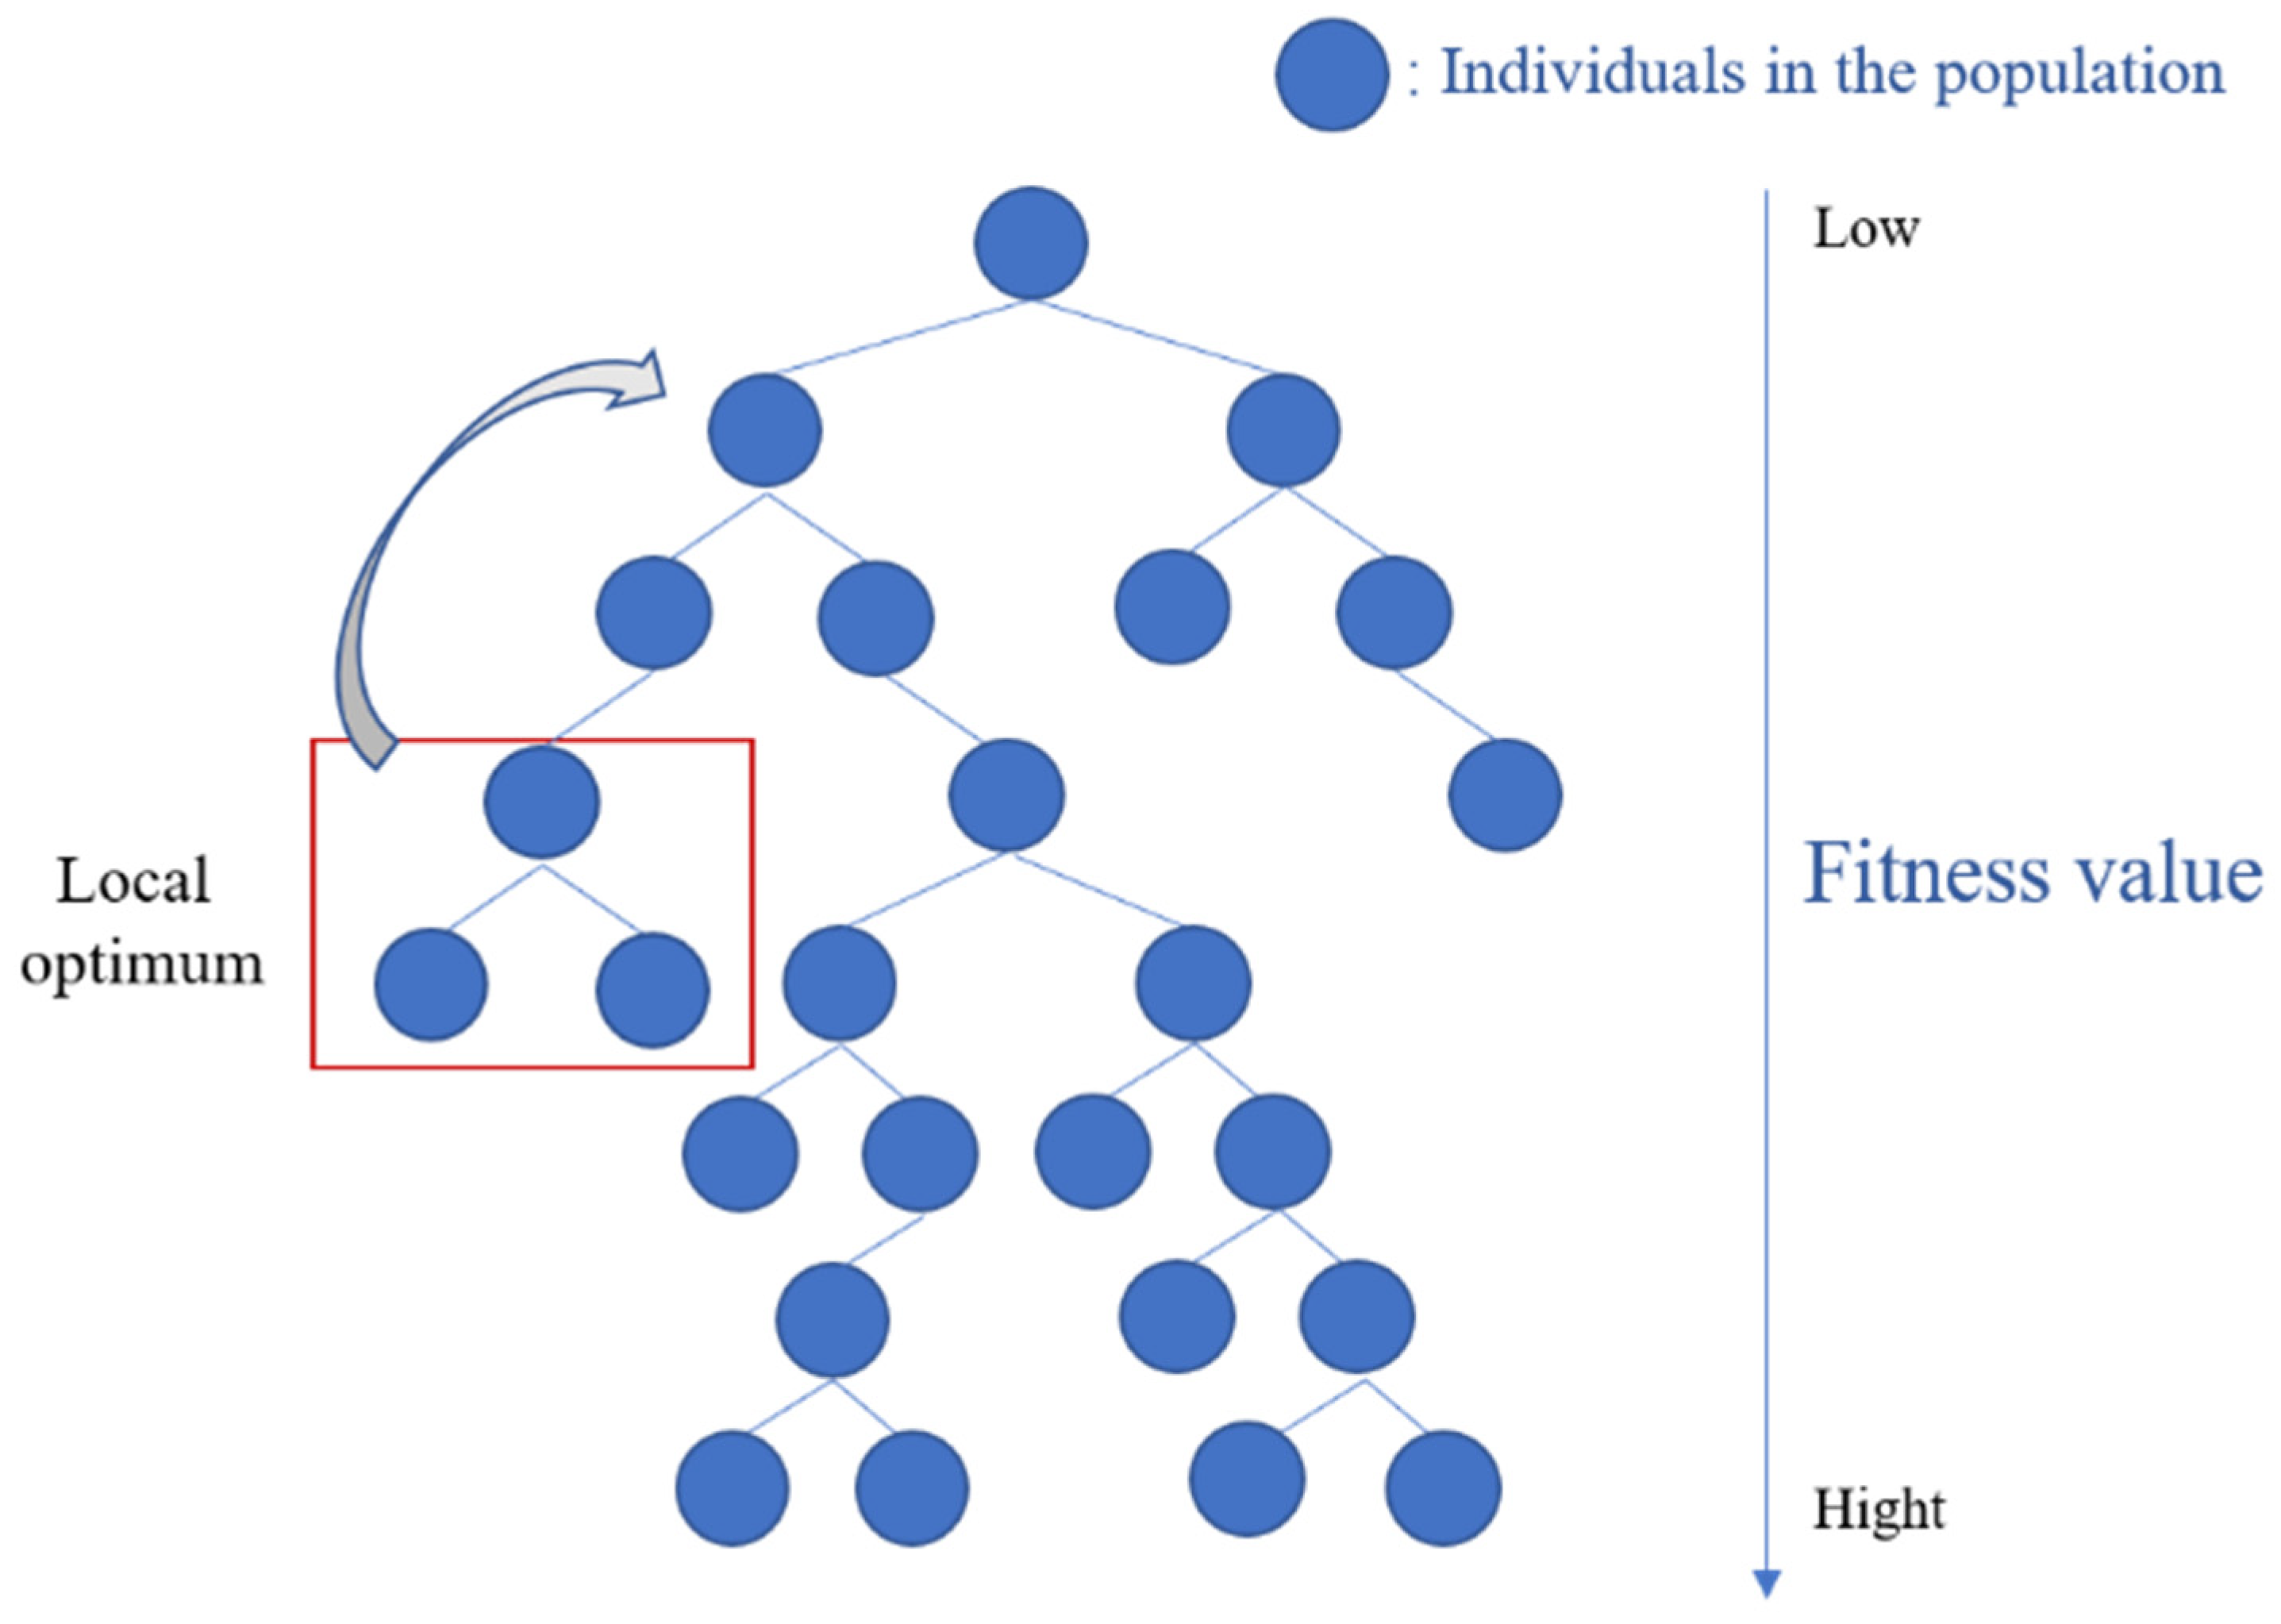
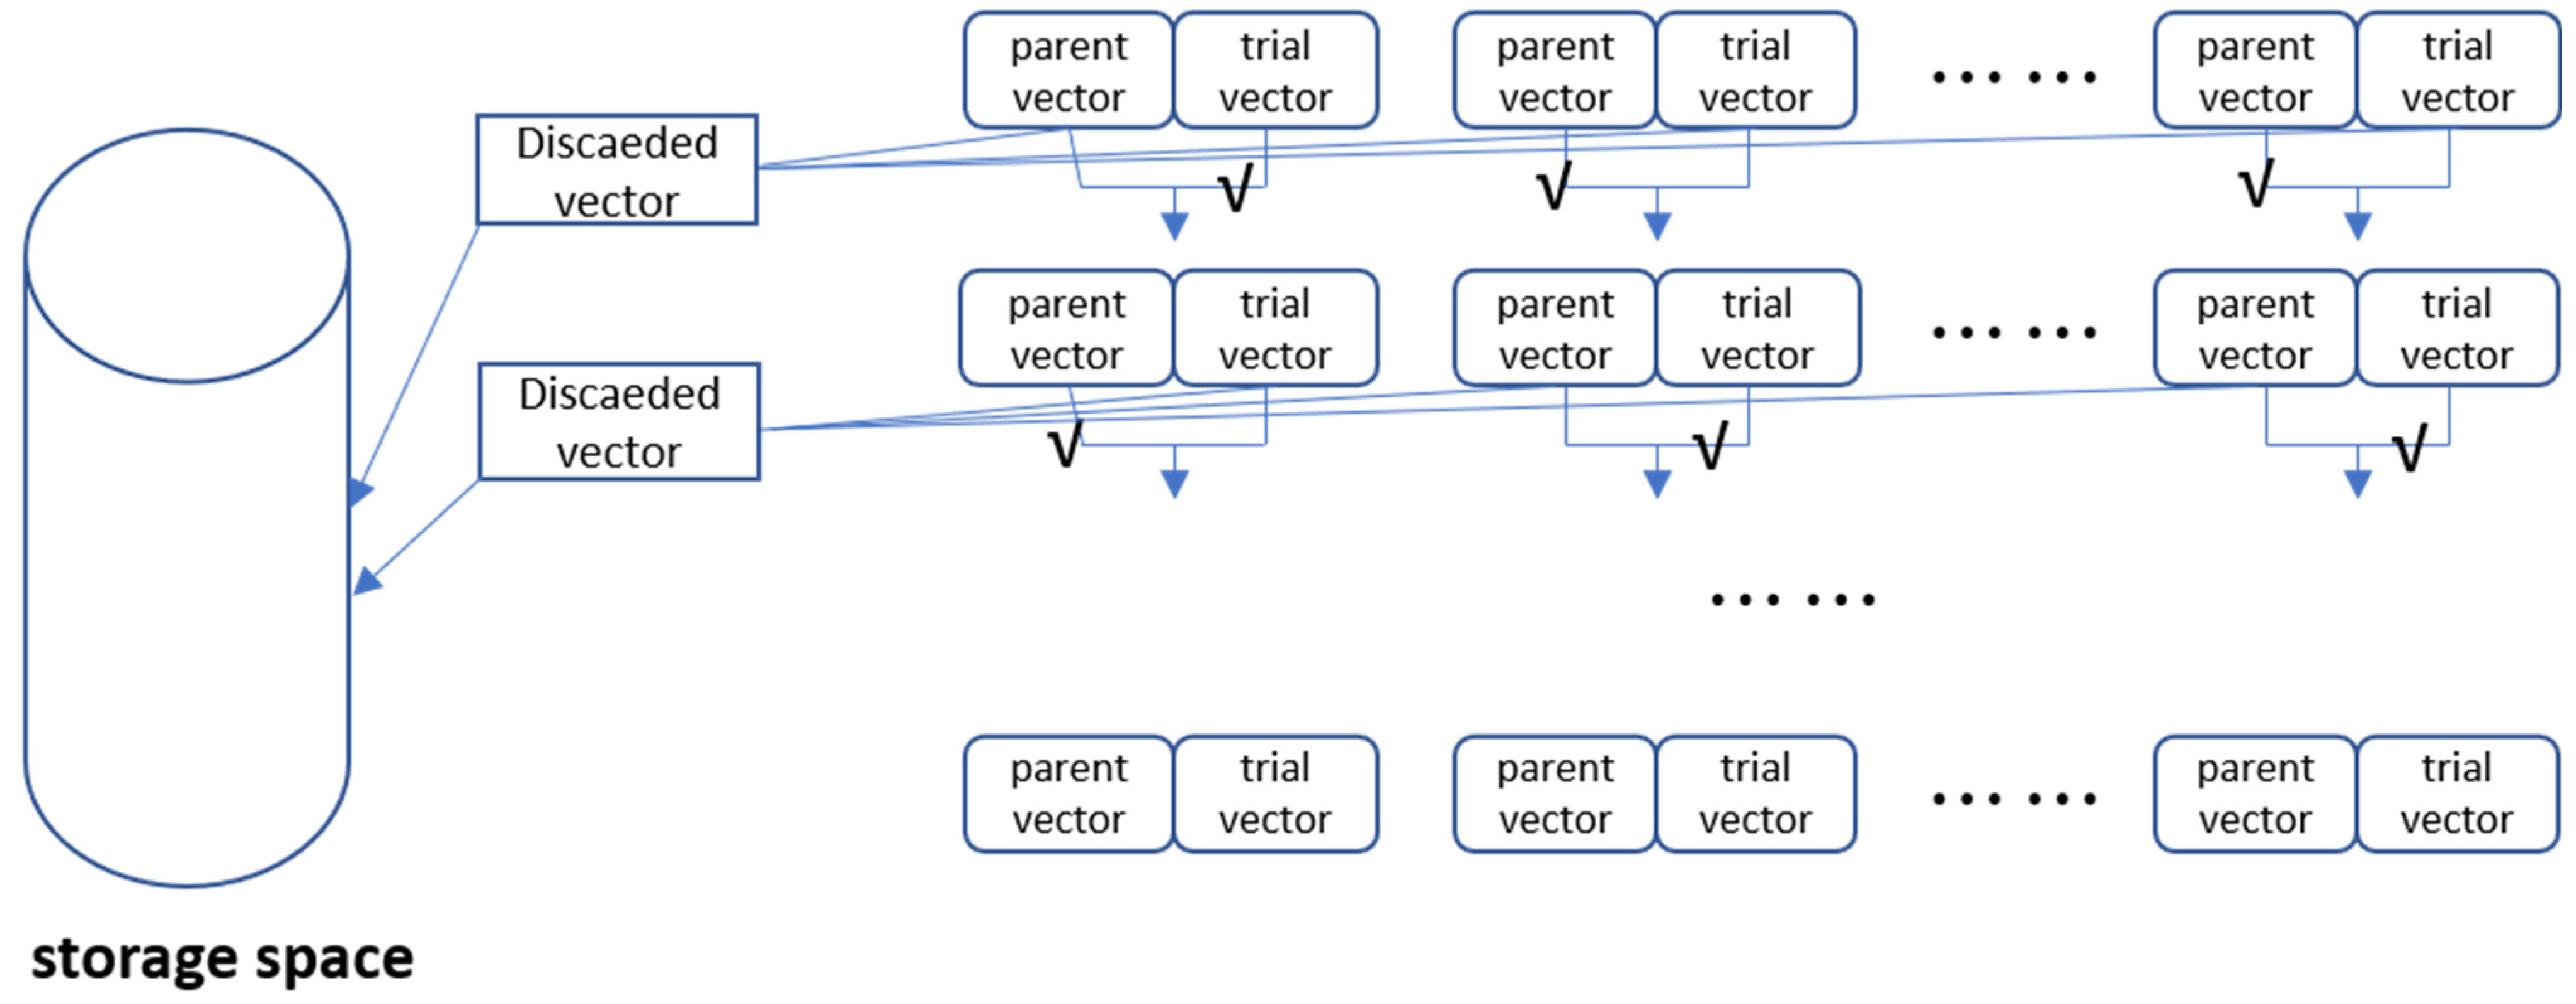
3.3. Interactive Differential Evolution Algorithm Based on Backtracking Strategy
4. Generation Method of Indoor Plan
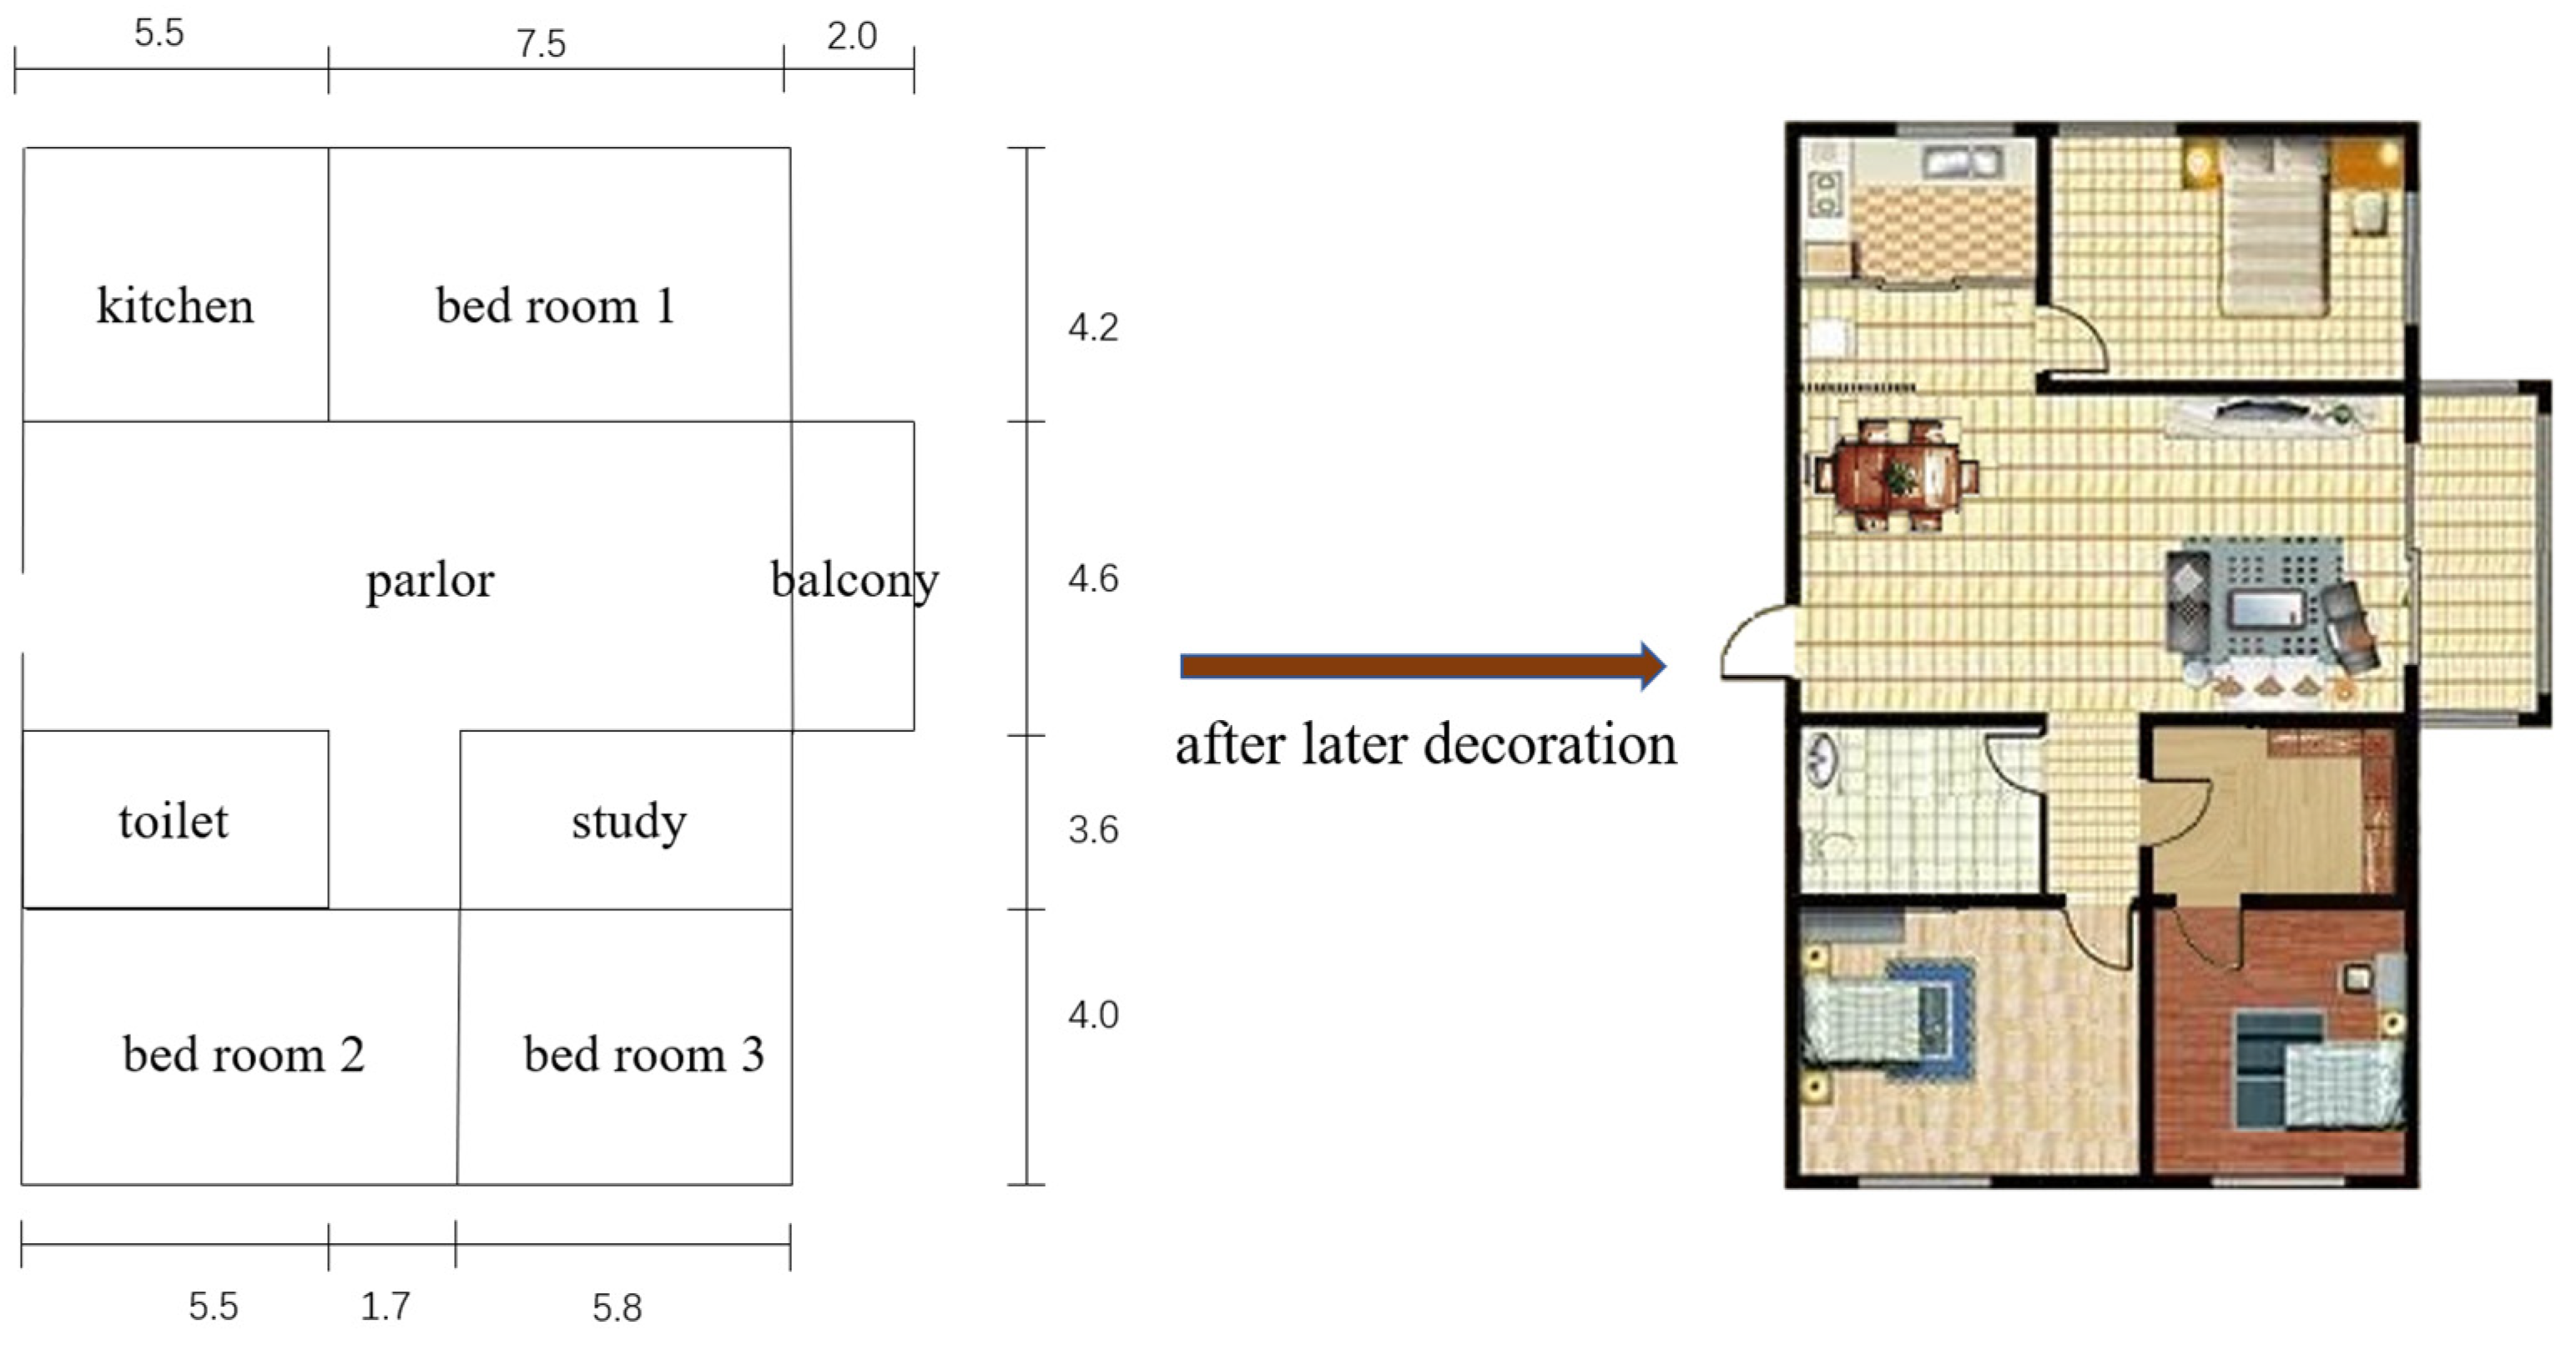
4.1. Exterior Frame
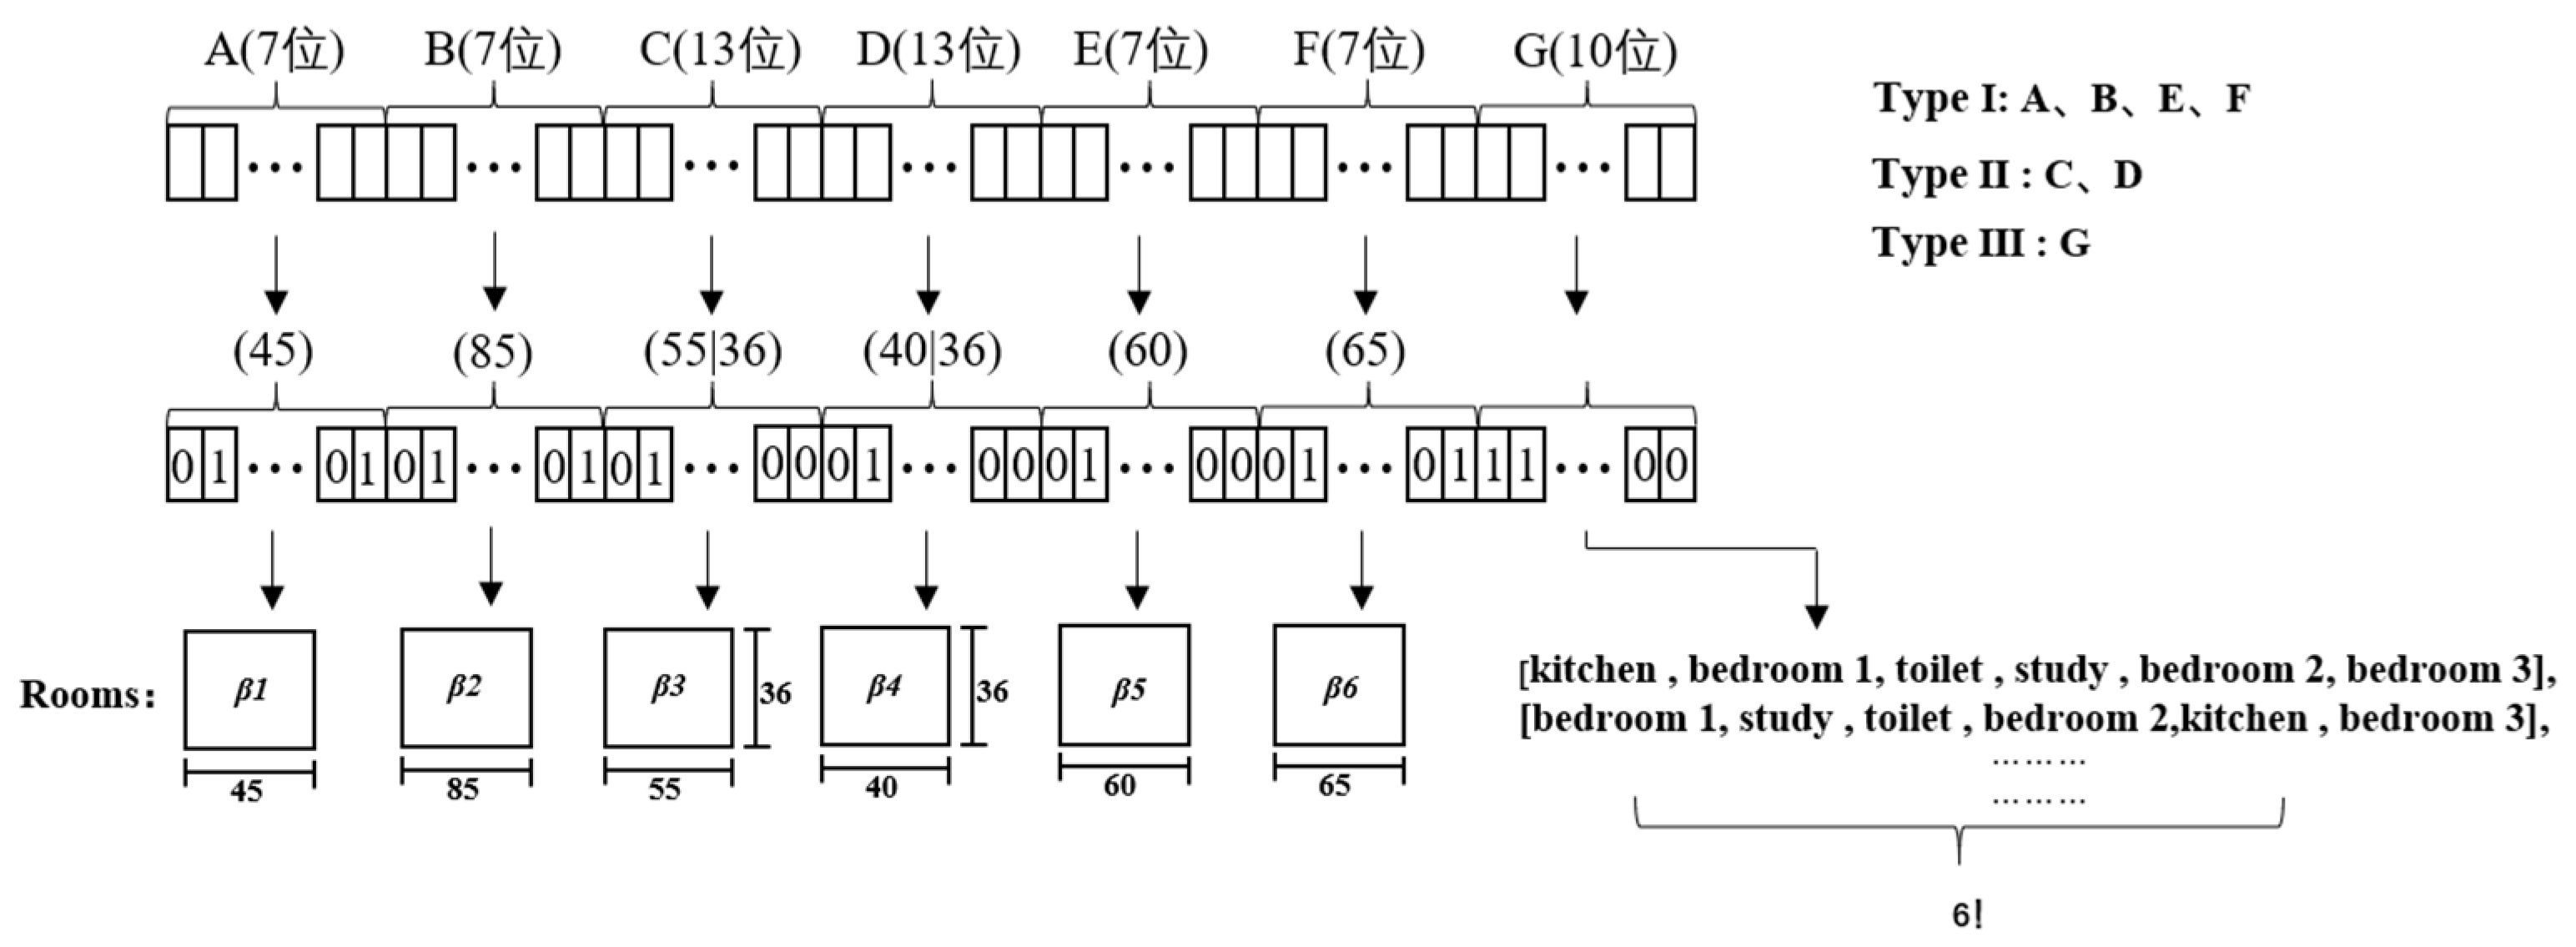
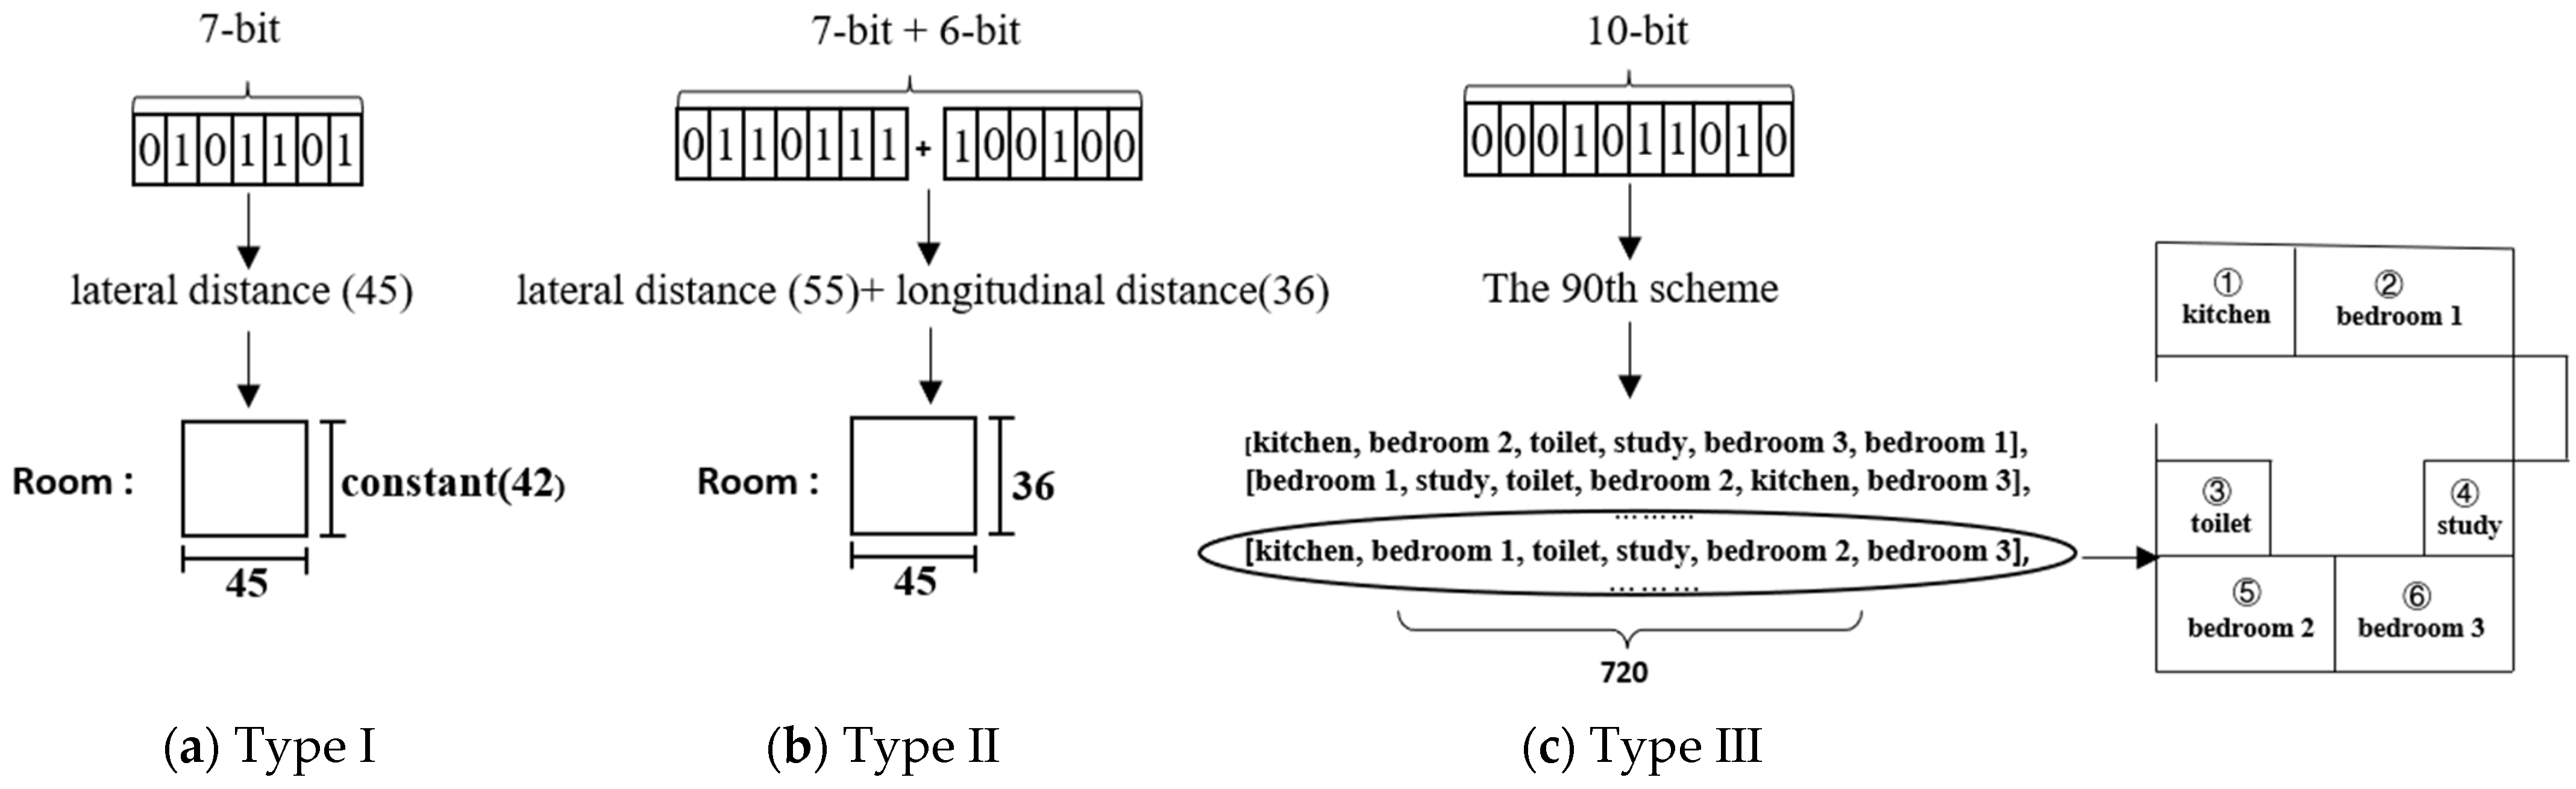
4.2. Coding Mode
4.3. Algorithm Flow
| Algorithm 1 The algorithm flow of IDE with the proposed selection operator |
|
4.4. Interactive Interface
5. Experimental Test
5.1. Test in Simulated Environment
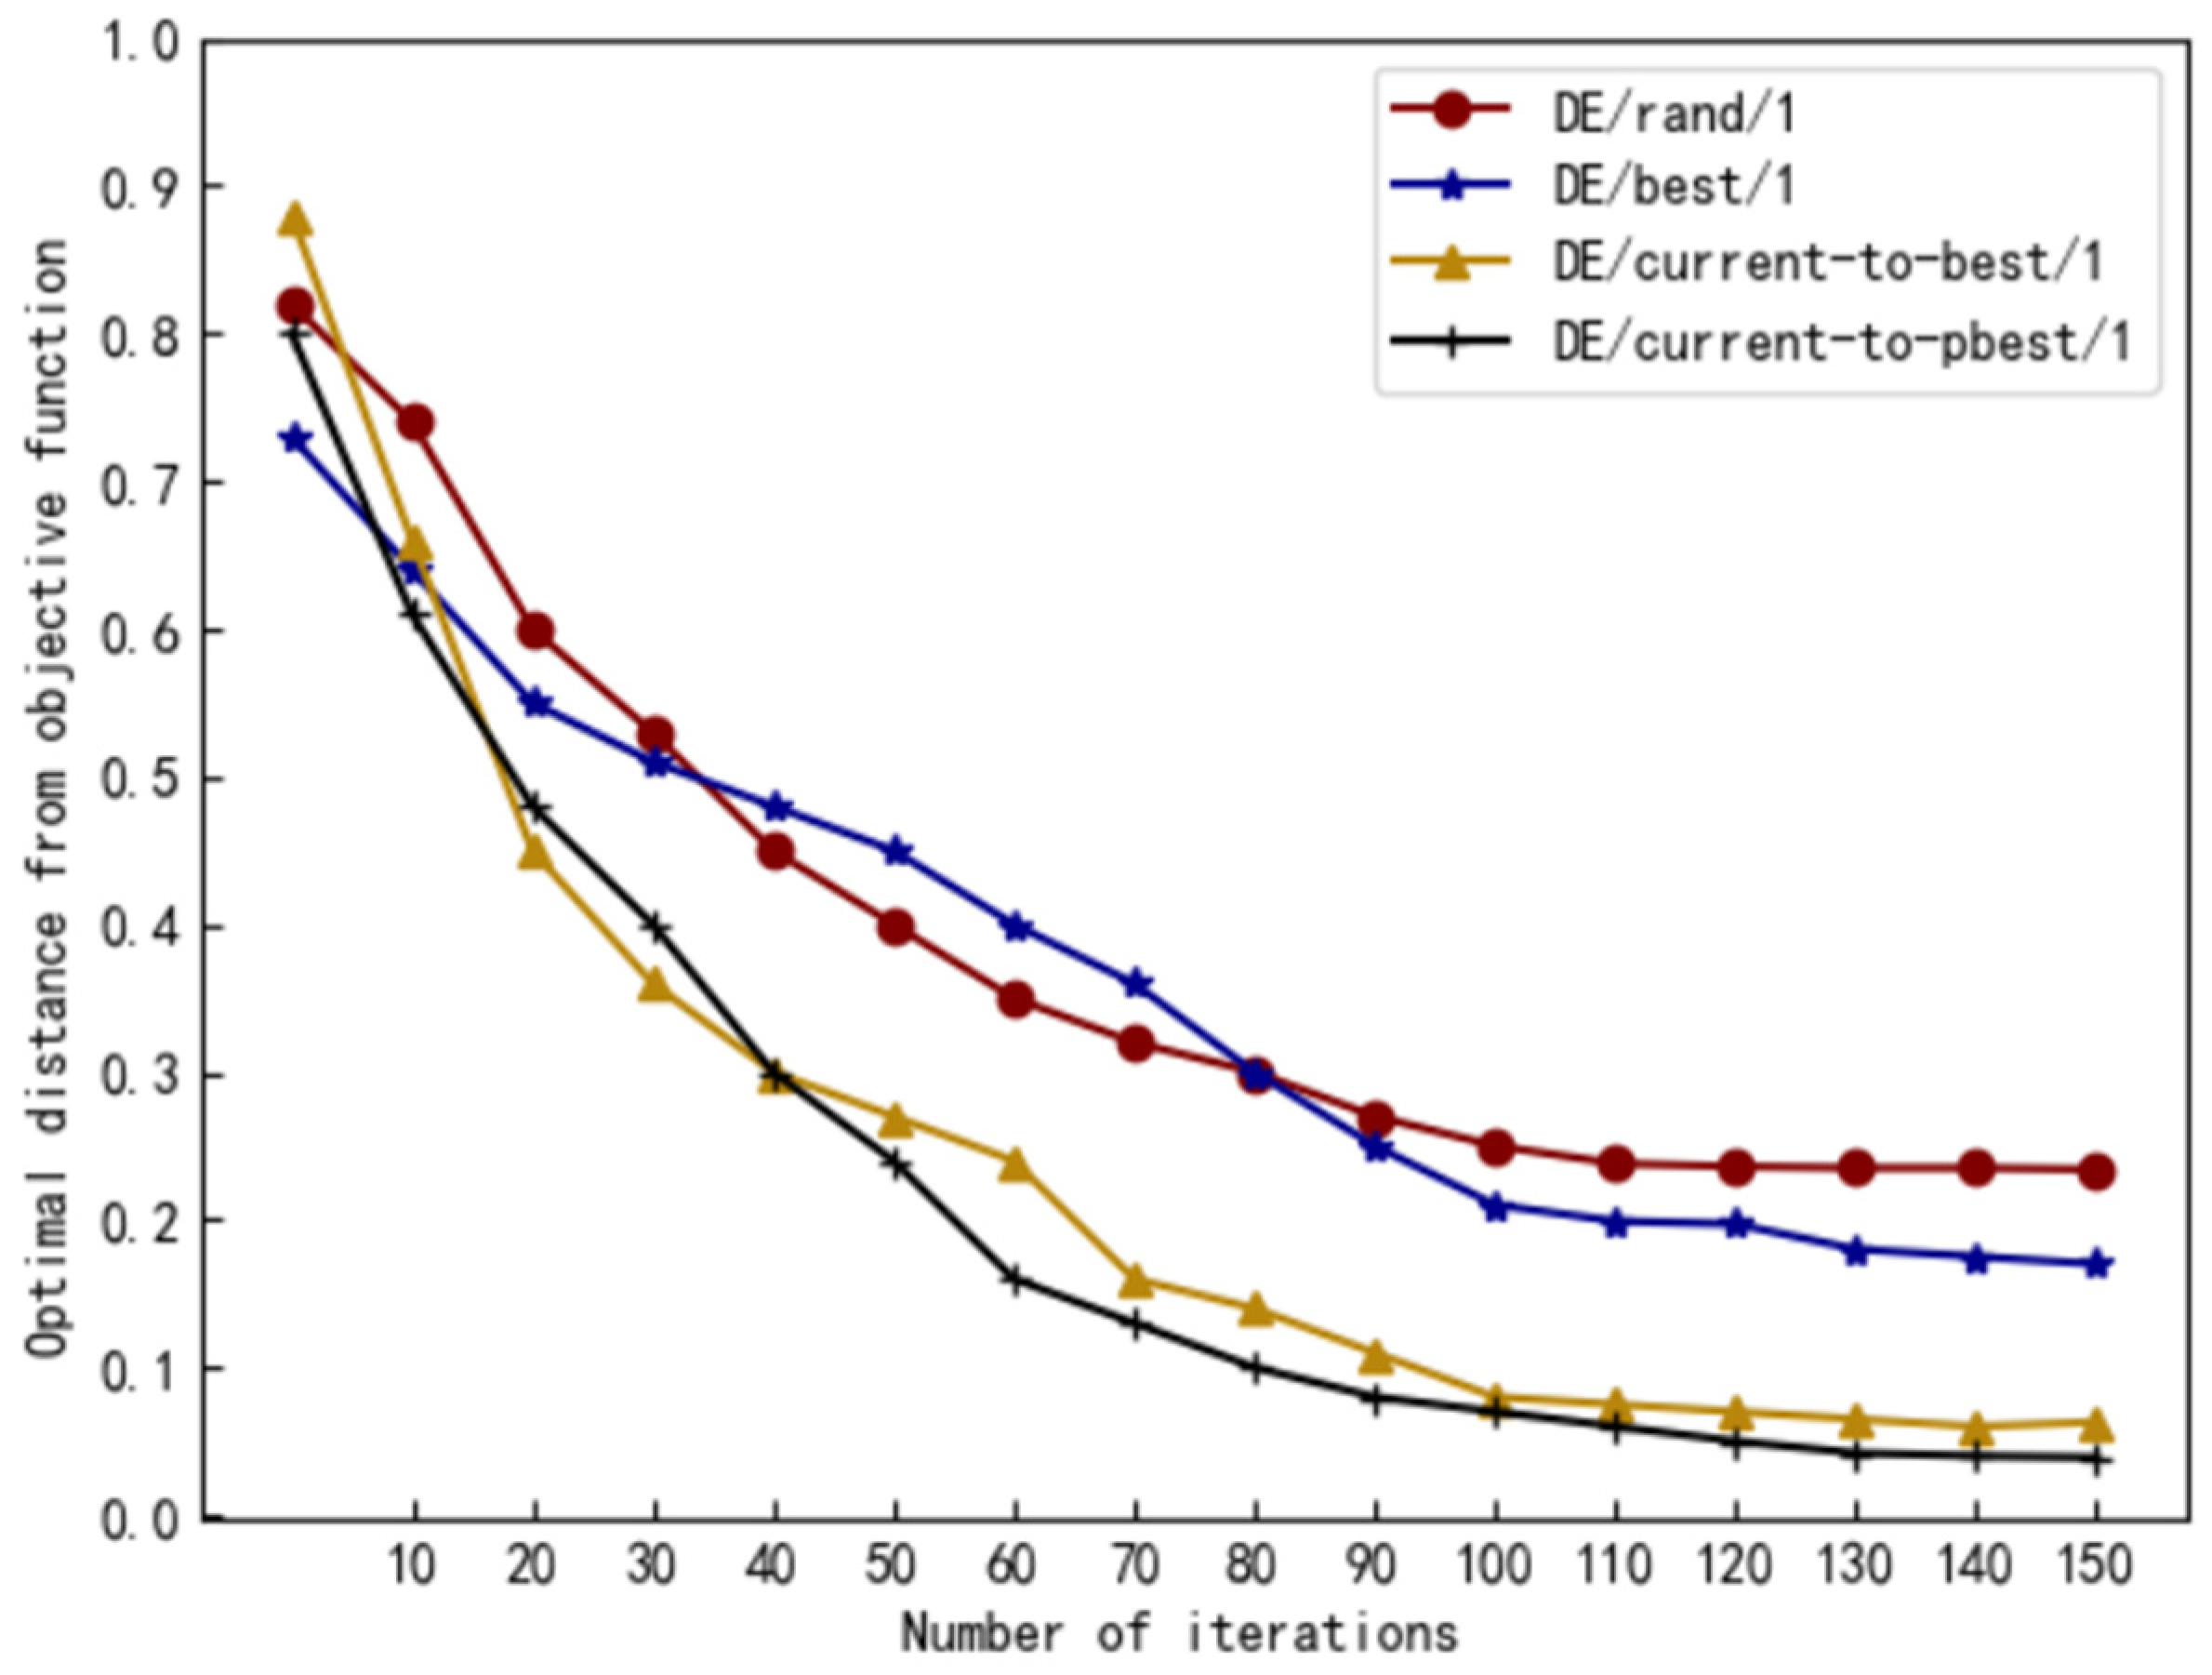
5.1.1. Comparison of Mutation Operators
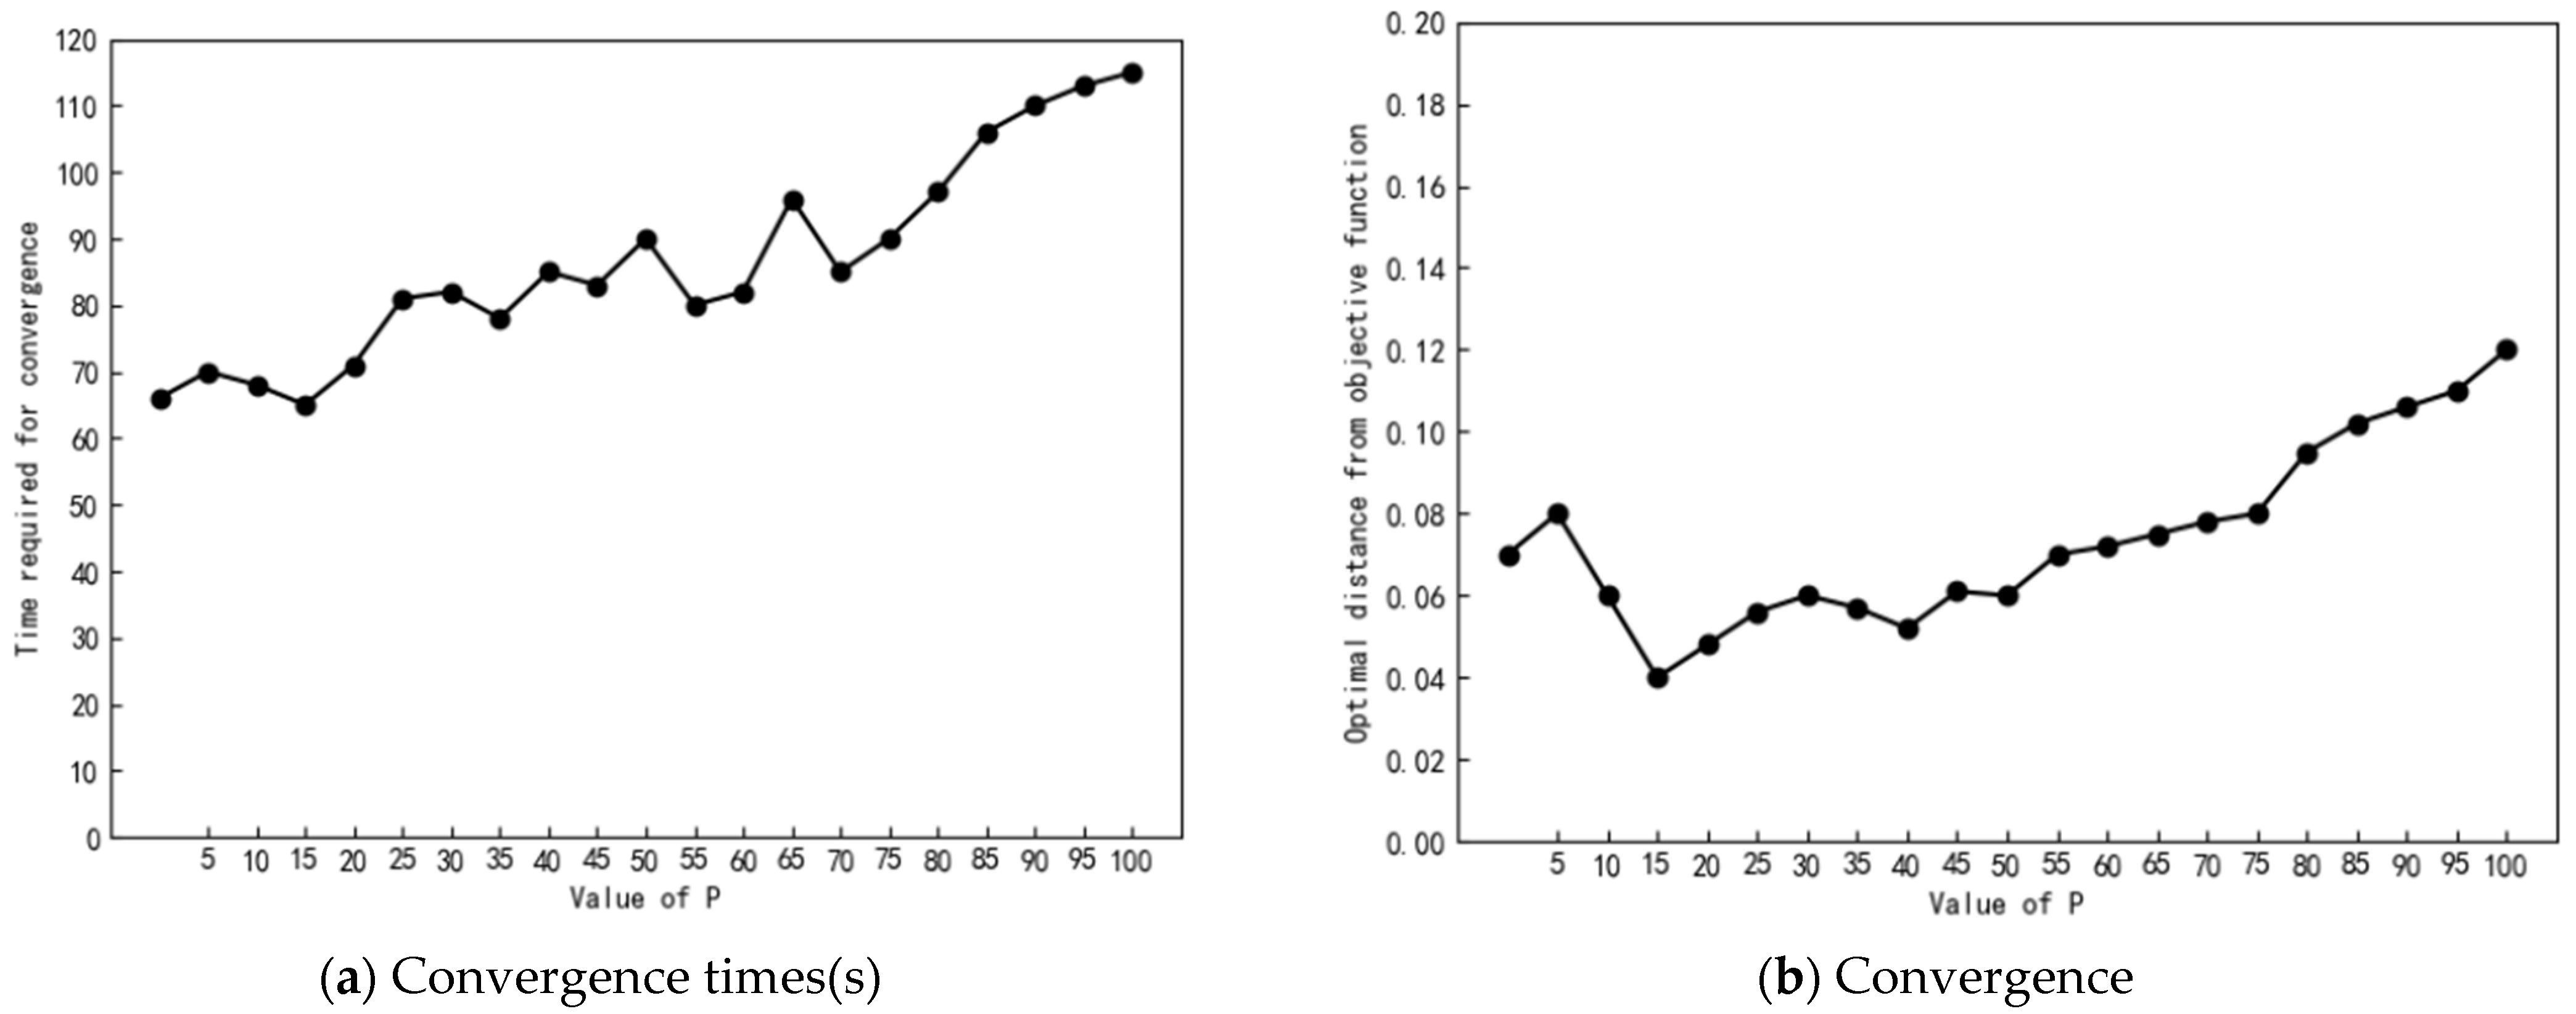
5.1.2. Experiment of Parameter Sensitivity
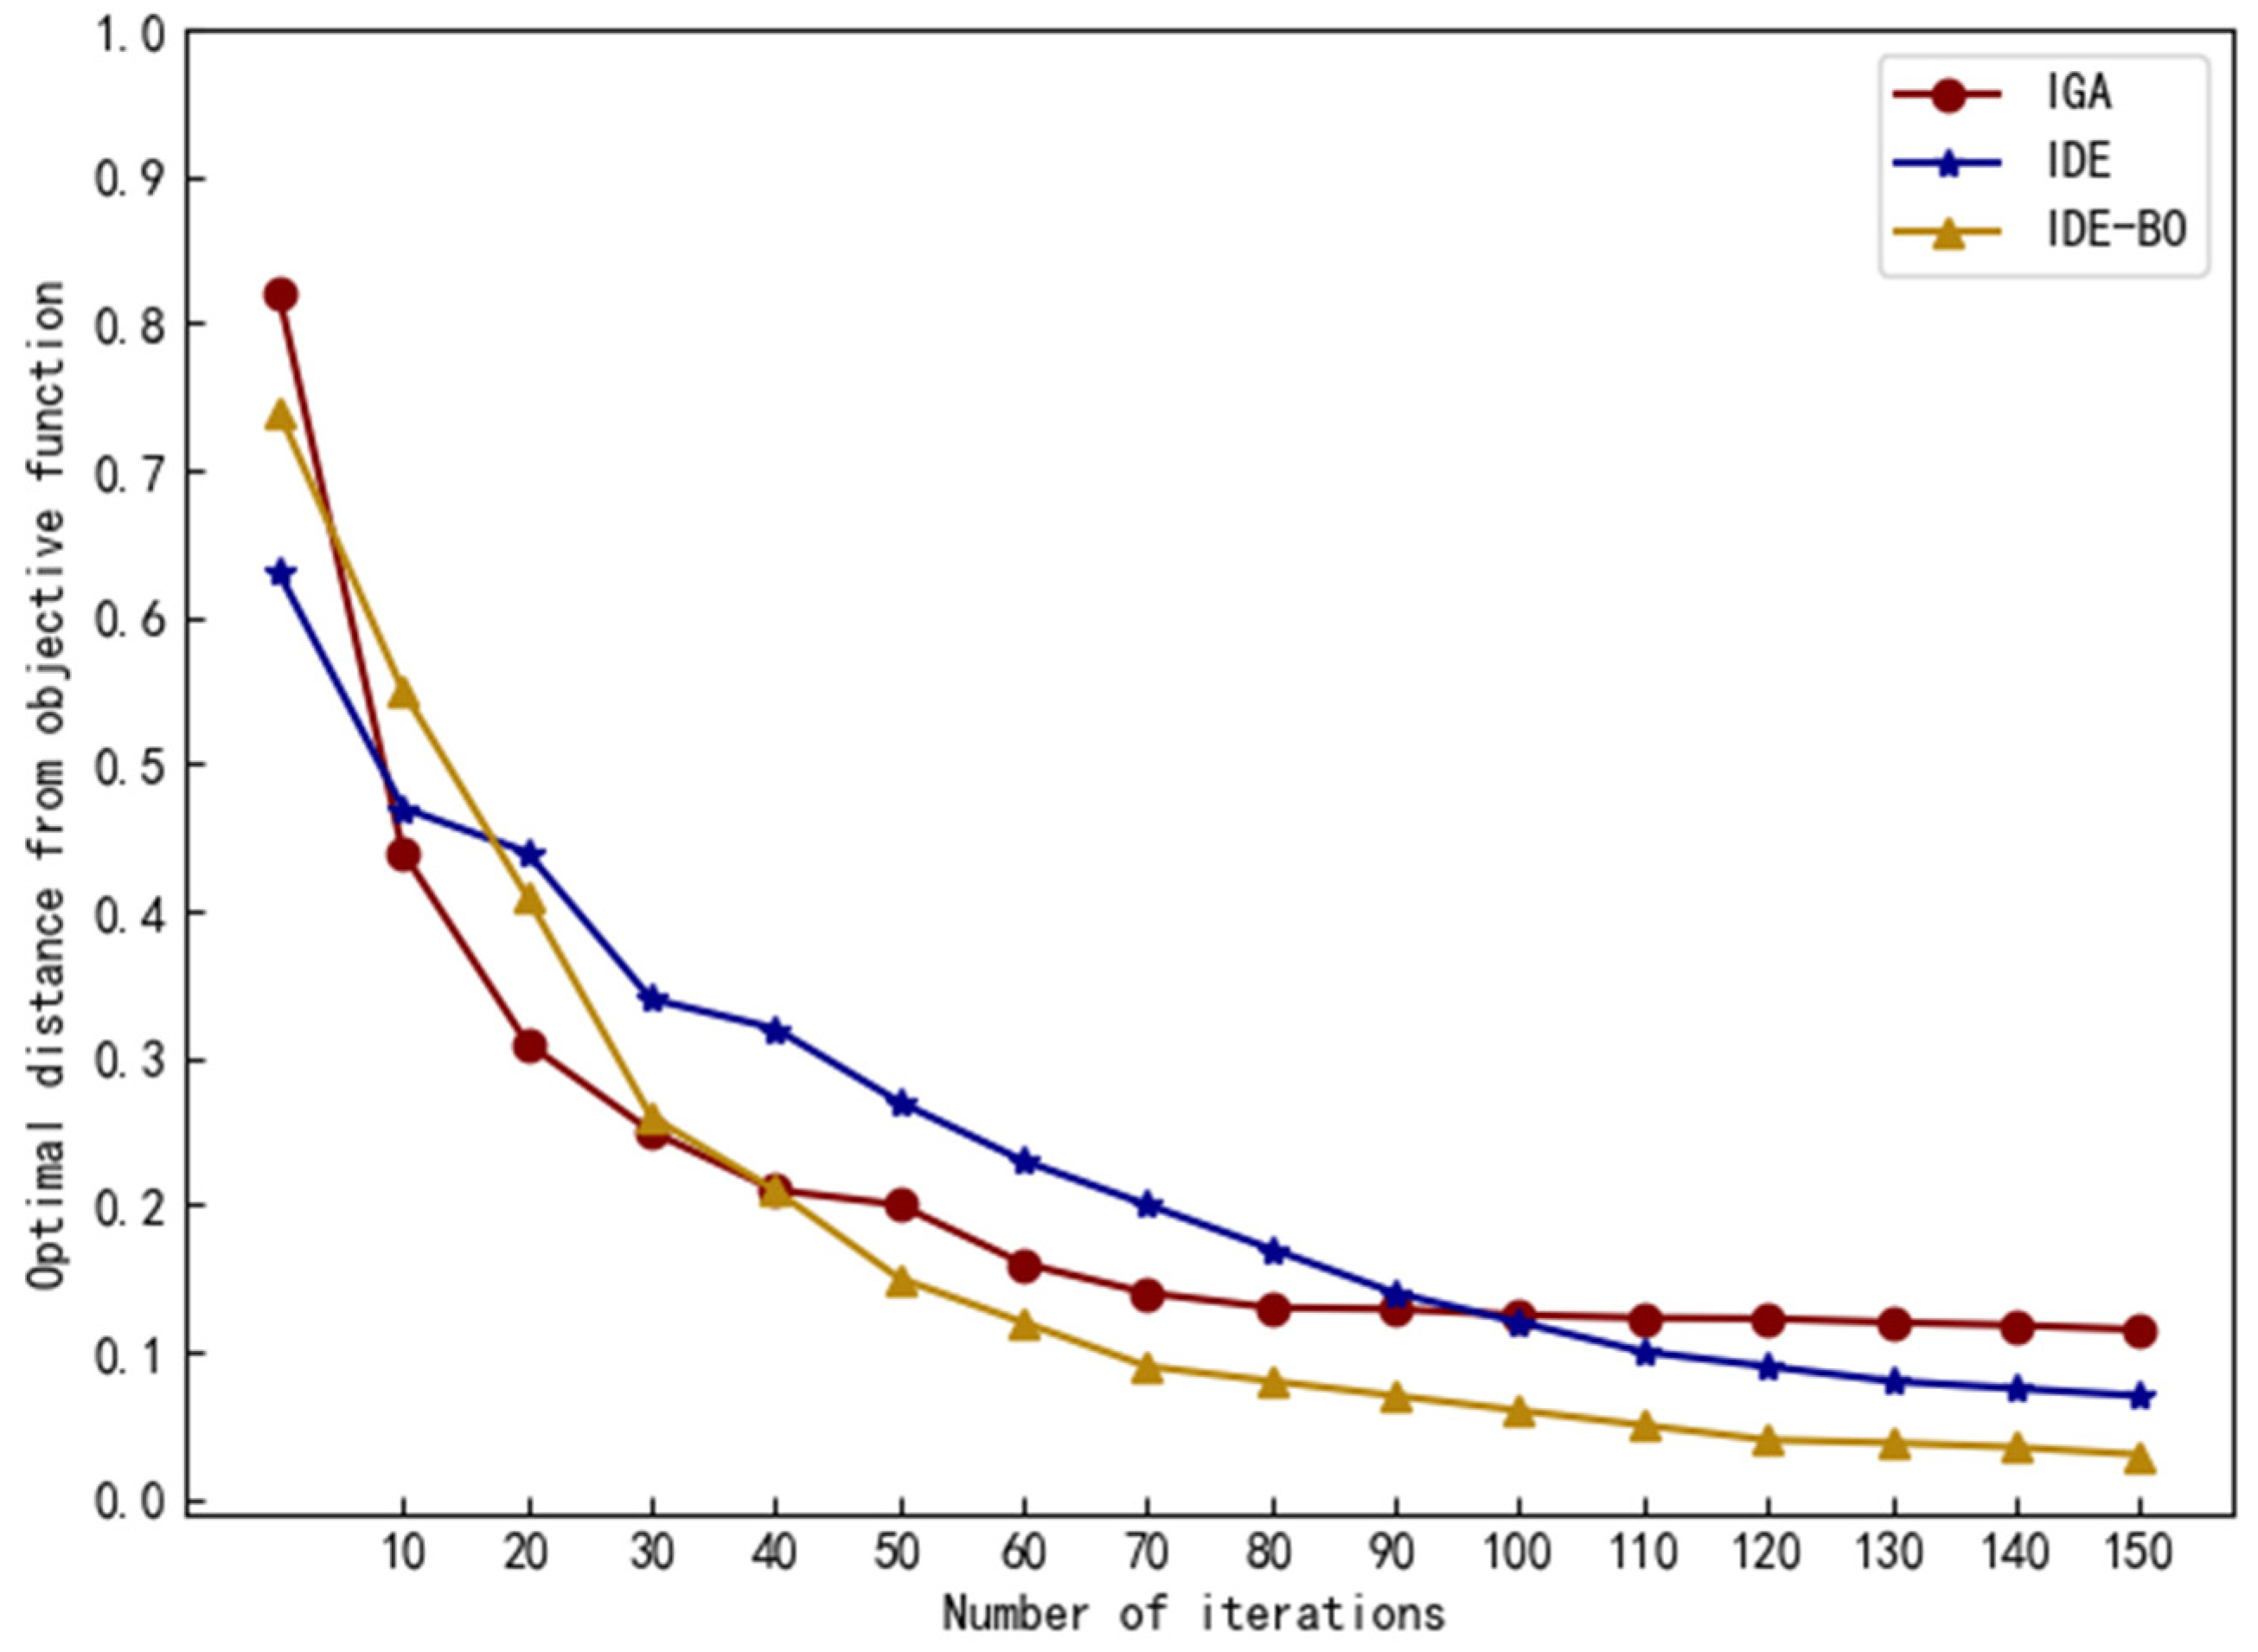
5.1.3. Comparison of Algorithms
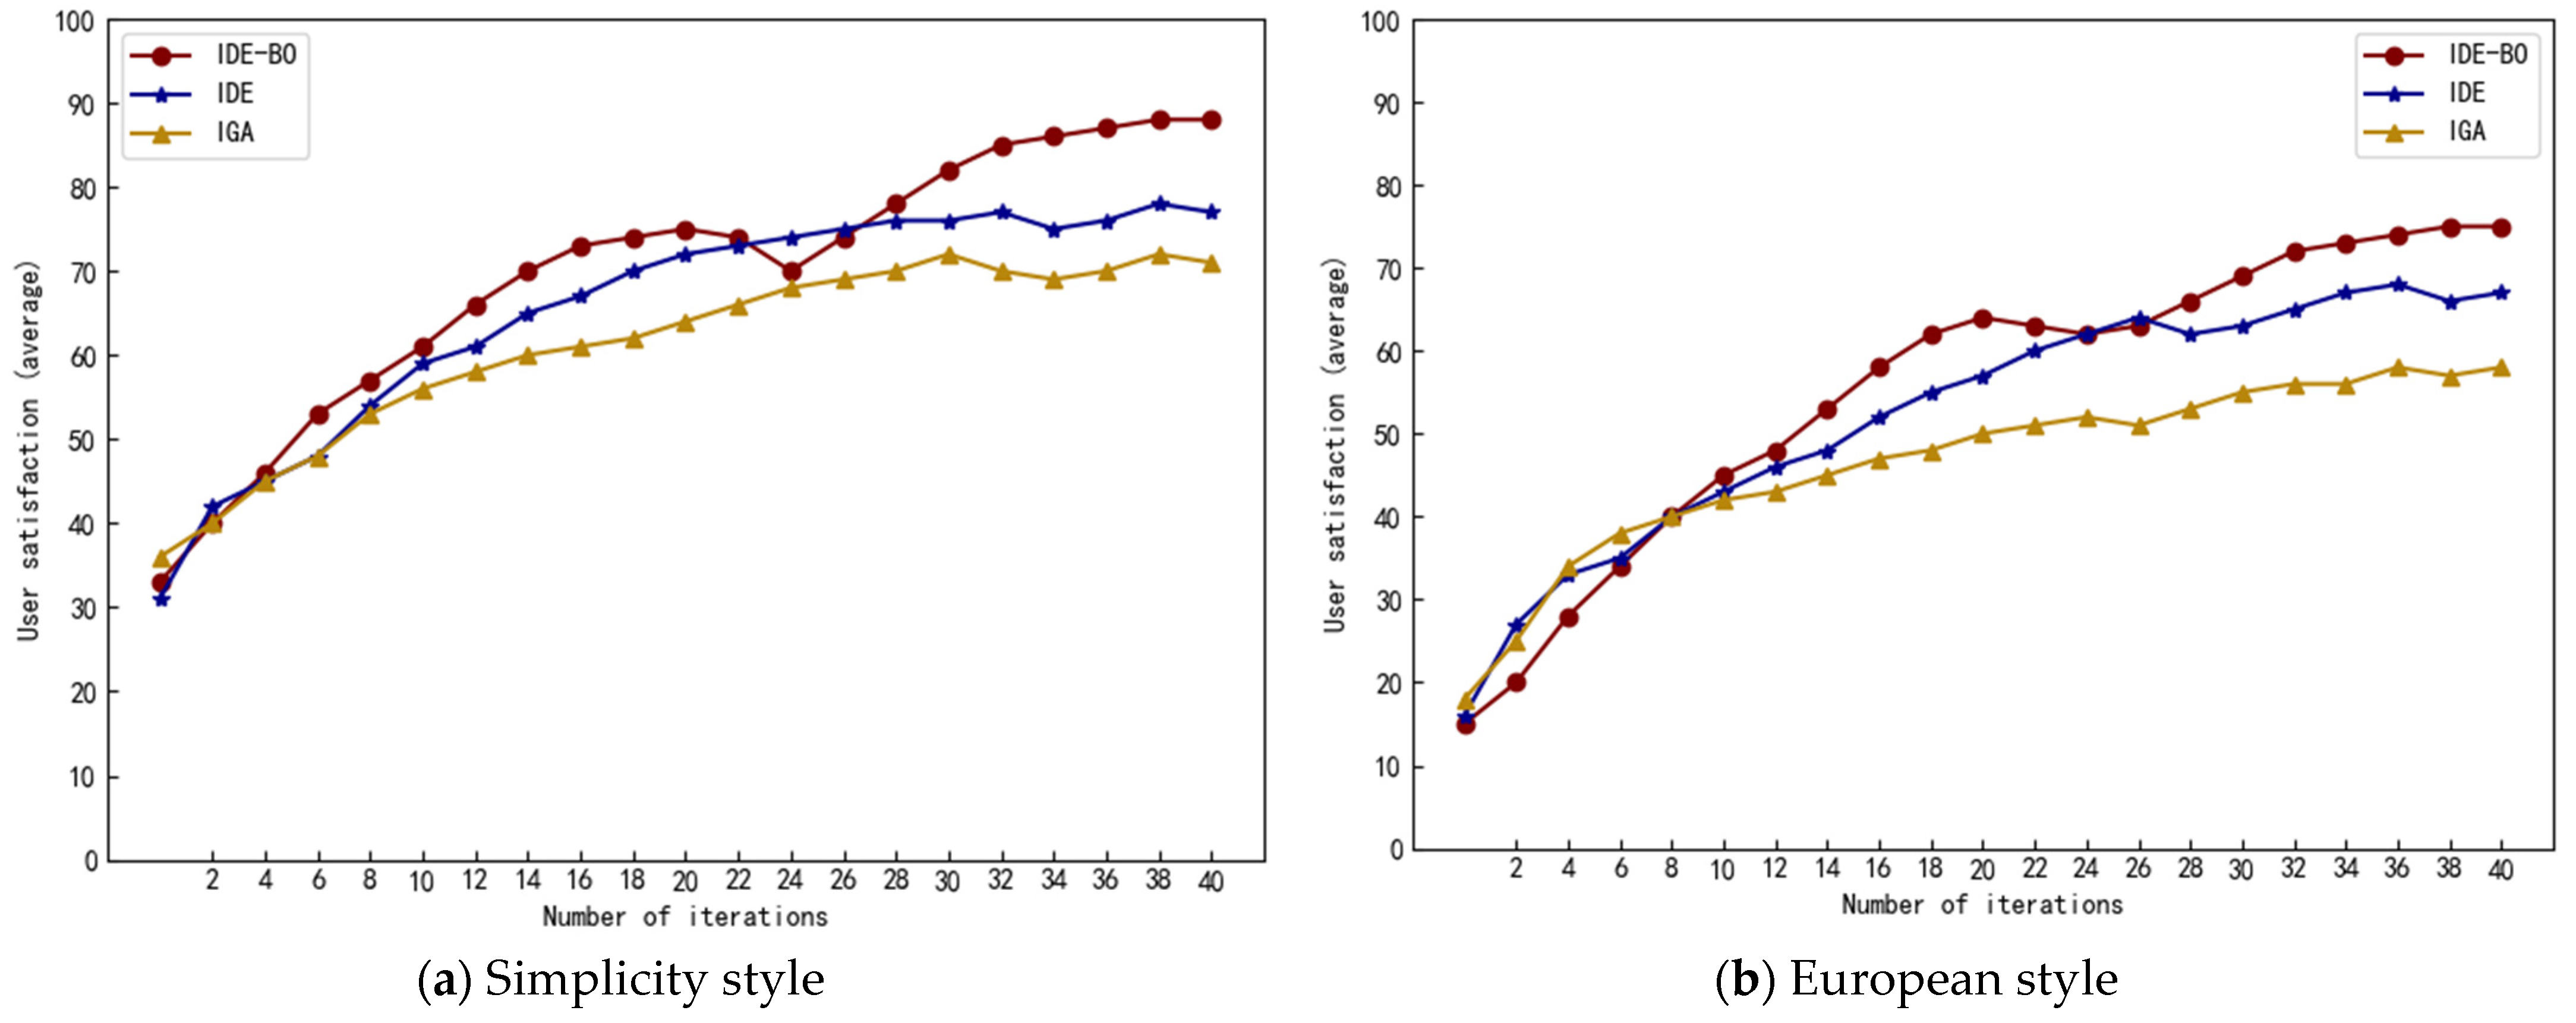
5.2. Subjective Test
6. Summary and Future Work
Author Contributions
Funding
Data Availability Statement
Conflicts of Interest
References
- Thabet, W.Y.; Beliveau, Y.J. SCaRC: Space-constrained resource constrained scheduling system. J. Comput. Civ. Eng. 1997, 11, 48–59. [Google Scholar] [CrossRef]
- Li, H.; Ped, L. Genetic search for solving construction site-level unequal-area facility layout problems. Autom. Constr. 2000, 9, 217–226. [Google Scholar] [CrossRef]
- Merrell, P.; Schkufza, E. Interactive furniture layout using interior design guidelines. ACM Trans. Graph. 2011, 30, 1–10. [Google Scholar] [CrossRef]
- Yu, L.F.; Yeung, S.K. Make it home: Automatic optimization of furniture arrangement. ACM Trans. Graph. 2011, 30, 86. [Google Scholar] [CrossRef]
- He, D.Y.; Cha, J.Z. Research on solution to complex container-loading problem based on genetic algorithm. J. Softw. 2001, 12, 1380–1385. [Google Scholar]
- Yang, W.; Liu, J. Integrated optimization of location assignment and job scheduling in multi-carrier automated storage and retrieval system. Comput. Integr. Manuf. Syst. 2019, 25, 251–259. [Google Scholar]
- Xia, Z.C.; Liu, F. Memory based lamarckian evolutionary algorithm for job shop scheduling problem. J. Softw. 2010, 21, 3082–3093. [Google Scholar] [CrossRef]
- Liu, X.; Liu, Z. Adapted particle swarm optimization algorithm based layout design optimization of passenger car cockpit for enhancing ergonomic reliability. Adv. Mech. Eng. 2019, 11, 1687814019837808. [Google Scholar] [CrossRef]
- Pang, G.; Pang, L.P. Simulation and optimization of air supply system layout for special vehicle cabin. CIESC J. 2020, 71, 335–340. [Google Scholar]
- Tang, X. Research on interior design strategy based on optimization of computer renderings production process. J. Phys. Conf. Ser. 2021, 1992, 032104. [Google Scholar] [CrossRef]
- Liu, H.; Wang, Z. Virtual reality game level layout design for real environment constraints. Graph. Vis. Comput. 2021, 4, 200020. [Google Scholar] [CrossRef]
- Ma, C.; Vining, N. Game level layout from design specification. Comput. Graph. Forum 2014, 33, 95–104. [Google Scholar] [CrossRef]
- Donath, D.; Bohme, L.F.G. Constraint-based design in participatory housing planning. Int. J. Archit. Comput. 2008, 6, 97–117. [Google Scholar] [CrossRef]
- Zawidzki, M.; Tateyama, K. The constraints satisfaction problem approach in the design of an architectural functional layout. Eng. Optim. 2011, 43, 943–966. [Google Scholar] [CrossRef]
- Mirahmadi, M.; Shami, A. A novel algorithm for real-time procedural generation of building floor plans. arXiv 2012, arXiv:1211.5842. [Google Scholar]
- Rosser, J.F.; Morley, G. Modelling of building interiors with mobile phone sensor data. JSPRS Int. J. Geo-Inf. 2015, 2, 989–1012. [Google Scholar] [CrossRef]
- Kamol, K.; Krung, K. Optimizing architectural layout design via mixed integer programming. In Proceedings of the International CAAD (Computer Aided Architectural Design) Futures Conference, Vienna, Austria, 20–22 June 2005. [Google Scholar]
- Martinez, J.; Iglesias, J.E. A multidisciplinary model for floorplan de-sign. Int. J. Prod. Res. 2007, 45, 3457–3476. [Google Scholar]
- Ocheol, K. BIM space layout optimization by space syntax and expert system. Korean J. Comput. Des. Eng. 2017, 22, 18–27. [Google Scholar] [CrossRef]
- Mak, M.Y.; Ng, S.T. The art and science of Feng Shui—A study on architects’ perception. Build. Environ. 2005, 40, 427–434. [Google Scholar] [CrossRef]
- Wu, W.P.; Feng, Y. Interior Space Design and Automatic Layout Method Based on CNN. Math. Probl. Eng. 2022, 2022, 8006069. [Google Scholar] [CrossRef]
- Wu, Y. Architectural Interior Design and Space Layout Optimization Method Based on VR and 5G Technology. J. Sens. 2022, 2022, 7396816. [Google Scholar] [CrossRef]
- Garcia-Hernandez, L.; Pierreval, H. Handling qualitative aspects in unequal area facility layout problem: An interactive genetic algorithm. Appl. Soft Comput. 2013, 13, 1718–1727. [Google Scholar] [CrossRef]
- Koga, S.; Fukumoto, M. A creation of music-like melody by interactive genetic algorithm with user’s intervention. In Proceedings of the International Conference on Human-Computer Interaction, Heraklion, Greece, 22–27 June 2014. [Google Scholar]
- García-Hernández, L.; Arauzo-Azofra, A. Facility layout design using a multi-objective interactive genetic algorithm to support the DM. Expert Syst. 2015, 32, 94–107. [Google Scholar] [CrossRef]
- Lai, C.C.; Chen, Y.C. A user—Oriented image retrieval system based on interactive genetic algorithm. IEEE Trans. 2011, 60, 3318–3325. [Google Scholar] [CrossRef]
- Yu, F.; Li, Y. Interactive differential evolution for user—Oriented image retrieval system. Soft Comput. 2016, 20, 449–463. [Google Scholar] [CrossRef]
- Lee, M.C.; Cho, S.B. Interactive differential evolution for image enhancement application in smart phone. In Proceedings of the 2012 IEEE Congress on Evolutionary Computation, Piscataway, Australia, 10–15 June 2012. [Google Scholar]
- Liu, G.; Peng, J.Z. Image spatial filtering method based on interactive differential evolution strategy. J. Chin. Comput. Syst. 2015, 36, 2090–2095. [Google Scholar]
- Yang, M.; Li, C. Differential evolution with auto-enhanced population diversity. IEEE Trans. Cybern. 2015, 45, 83–89. [Google Scholar] [CrossRef]
- Zhao, F.; Zhao, L. An ensemble discrete differential evolution for the distributed blocking flow shop scheduling with minimizing make span criterion. Expert Syst. Appl. 2020, 160, 113678. [Google Scholar] [CrossRef]
- Zeng, Z.; Zhang, M. A new selection operator for differential evolution algorithm. Knowl. -Based Syst. 2021, 226, 107150. [Google Scholar] [CrossRef]
- Yu, J.; You, X. Dynamic density clustering ant colony algorithm with filtering recommendation backtracking mechanism. IEEE Access 2020, 8, 154471–154484. [Google Scholar] [CrossRef]
- Guo, S.M.; Yang, C.C. Improving differential evolution with a successful parent-selecting framework. IEEE Trans. Evol. Comput. 2015, 19, 717–730. [Google Scholar] [CrossRef]
- Coello, C.A.C. Evolutionary multi-objective optimization. Eur. J. Oper. Res. 2008, 181, 1617–1619. [Google Scholar] [CrossRef]
- Cai, C.S.; Chen, S.R. Chen. Framework of vehicle-bridge-wind dynamic analysis. J. Wind. Eng. Ind. Aerodyn. 2004, 92, 579–607. [Google Scholar] [CrossRef]
- Wen, Z.; Qi, P. Establishing public service system of indemni catory housing. Archit. J. 2013, 4, 106–109. [Google Scholar]
- Zhibo, E.; Shi, R. Multi-satellites imaging scheduling using individual reconfiguration based integer coding genetic algorithm. Acta Astronaut. 2021, 178, 645–657. [Google Scholar]


| Stage | Number of People | Number of Rooms | Type | The Measure of Area |
|---|---|---|---|---|
| Live alone | 1 | 1–2 | One-bedroom | |
| Two people’s word | 2 | 2–4 | One-bedroom~Two-bedroom | |
| A family of three | 3 | 2–5 | Two-bedroom~Three-bedroom | |
| A family of three children | 5 | 3–6 | Two-bedroom~Three-bedroom | |
| Three generations under one roof | 6–10 | 4–7 | Three-bedroom~multi-bedroom |
| Serial Number | ① | ② | ③ | ④ |
|---|---|---|---|---|
| Sketch map |  |  |  |  |
| Total area | 30.41 | 77.79 | 103.79 | 183.4 |
| Type | One-bedroom | Two-bedroom | Three-bedroom | Multi-bedroom |
| Algorithm | |||
|---|---|---|---|
| Group | IDE-BO | IDE | IGA |
| 1 | 122 | 138 | 74 |
| 2 | 116 | 134 | 85 |
| 3 | 122 | 139 | 79 |
| 4 | 125 | 127 | 86 |
| 5 | 125 | 121 | 89 |
| 6 | 118 | 137 | 91 |
| 7 | 132 | 143 | 76 |
| 8 | 119 | 130 | 78 |
| 9 | 118 | 137 | 92 |
| 10 | 127 | 129 | 83 |
| IDE-BO VS | IDE | IGA |
|---|---|---|
| p Values | 0.002 | 0.000 |
| IDE-BO VS | p Values | ||||
|---|---|---|---|---|---|
| t ∈ [1,10] | t ∈ [11,30] | t ∈ [31,40] | t ∈ [1,40] | ||
| simplicity style | IDE | 0.749 | 0.373 | 0.004 | 0.358 |
| IGA | 0.630 | 0.001 | 0.004 | 0.12 | |
| european style | IDE | 0.810 | 0.142 | 0.004 | 0.345 |
| IGA | 0.748 | 0.002 | 0.004 | 0.19 | |
Disclaimer/Publisher’s Note: The statements, opinions and data contained in all publications are solely those of the individual author(s) and contributor(s) and not of MDPI and/or the editor(s). MDPI and/or the editor(s) disclaim responsibility for any injury to people or property resulting from any ideas, methods, instructions or products referred to in the content. |
© 2023 by the authors. Licensee MDPI, Basel, Switzerland. This article is an open access article distributed under the terms and conditions of the Creative Commons Attribution (CC BY) license (https://creativecommons.org/licenses/by/4.0/).
Share and Cite
Yu, F.; Liang, B.; Tang, B.; Wu, H. An Interactive Differential Evolution Algorithm Based on Backtracking Strategy Applied in Interior Layout Design. Algorithms 2023, 16, 275. https://doi.org/10.3390/a16060275
Yu F, Liang B, Tang B, Wu H. An Interactive Differential Evolution Algorithm Based on Backtracking Strategy Applied in Interior Layout Design. Algorithms. 2023; 16(6):275. https://doi.org/10.3390/a16060275
Chicago/Turabian StyleYu, Fei, Bang Liang, Bo Tang, and Hongrun Wu. 2023. "An Interactive Differential Evolution Algorithm Based on Backtracking Strategy Applied in Interior Layout Design" Algorithms 16, no. 6: 275. https://doi.org/10.3390/a16060275