
Comparison of Single-Lane Roundabout Entry Degree of Saturation Estimations from Analytical and Regression Models


Faculty of Civil Engineering, University of Zagreb, 10000 Zagreb, Croatia
*
Author to whom correspondence should be addressed.
Algorithms 2023, 16(3), 164; https://doi.org/10.3390/a16030164
Submission received: 15 February 2023
/
Revised: 14 March 2023
/
Accepted: 15 March 2023
/
Published: 18 March 2023
(This article belongs to the Special Issue Scheduling: Algorithms and Applications)
Abstract
:Roundabout design is an iterative process consisting of a preliminary geometry design, geometry performance checks, and the estimation of intersection functionality (based on the results of analytical or regression models). Since both roundabout geometry design procedures and traffic characteristics vary around the world, the discussion on which functionality estimation model is more appropriate is ongoing. This research aims to reduce the uncertainty in decision-making during this final roundabout design stage. Its two objectives were to analyze and compare the results of roundabout performance estimations derived from one analytical and one regression model, and to quantify the model results’ susceptibility to changes in roundabout geometric parameters. For this, 60 four-legged single-lane roundabout schemes were created, varying in size and leg alignment. Their geometric parameters resulted from the assumption of their location in a suburban environment and chosen design vehicle swept path analysis. To compare the models’ results, the degree of saturation of roundabout entries was calculated based on presumed traffic flows. The results showed that the regression model estimates higher functionality and that this difference (both between the two models and regression models applied on different schemes) is more pronounced as the outer radius and angle between the legs increase.
1. Introduction
Roundabouts are intersections with a one-way circulatory roadway around a central island. In most countries, the vehicles entering the roundabout should give right-of-way to vehicles in the circulatory lane. Consequently, roundabout operational functionality is directly dependent on the traffic conditions in the circulating traffic flow and indirectly dependent on the geometric design of the roundabout. According to [1,2,3], single-lane roundabouts are a very good solution for the following transportation engineering demands: for reduced intersection dimensions; for intersections with five or more legs; when there is even distribution of traffic on the intersection legs; for traffic volumes under 25,000 veh/day; for a decrease in the waiting time at the intersection; as a measure to calm traffic, especially in urban areas; and for lowering levels of traffic noise, emissions of harmful gases, and the risk of accidents (due to the low driving speeds of approaching and circulating traffic, and fewer conflict points than at standard intersections). Additionally, single-lane roundabouts are increasingly popular solutions in suburban areas due to their design that provides an easy transition in road category and type (from a dual to a single roadway, i.e., from rural to the urban environment), and the fact that they do not require the installation, maintenance, and operation of signal lights.
Roundabout design is an iterative process consisting of a (1) preliminary geometry design, (2) geometry performance checks, which include the design vehicle swept path, fastest path, and visibility analysis, and (3) assessments of intersection functionality through capacity analysis. Roundabout geometry is primarily influenced by the design vehicle swept path. The design vehicle is a vehicle identified as the least maneuverable vehicle expected to use the intersection [4]—a vehicle of a certain type and dimensions that characterize a group of vehicles and fully correspond to the legal regulations on vehicle dimensions [5], or international recommendations [6]. Design vehicles are often chosen depending on the position of the intersection in the road network and the composition and category of expected vehicles (trucks in industrial zones, buses in urban and suburban areas, etc.) [7]. After confirming the preliminary design through the geometry performance checks, the iterative design process shifts to capacity analysis, to assure that the roundabout geometry satisfies traffic performance criteria. If the capacity value is too low or too high, the geometry needs to be redesigned and the capacity analysis repeated [8].
Numerous models have been created over years to assist road designers and traffic analysts in the assessments of intersection functionality. These models can be broadly classified into three categories: (1) probabilistic, analytical, gap-acceptance models, (2) deterministic, empirical regression, geometric models, and (3) time-dependent, microsimulation models. The final selection of the most appropriate roundabout design is usually based on the results of the analytical or regression model for entry capacity assessment [9,10,11,12,13].
The analytical models were created based on combining the main postulates of traffic flow theory and field-measured driver behaviors. This approach resulted in an analytic formulation of the relationship between field measurements and theoretical performance parameters [14]. They consider traffic flow composition and conflict between vehicles in the circulatory roadway and vehicles entering the roundabout [15]. Probability theory is used to estimate to what extent the vehicles entering a roundabout will be able to use an acceptable gap between two consecutive vehicles in the circulating traffic stream [9,16]. They do not directly quantify the relationship between the capacity and geometric parameters of the roundabout [11,13].
On the other hand, regression models were generated from extensive traffic data collected at roundabout entries. They have established relationships between capacity and geometric design features through statistical multivariate regression analyses to fit mathematical relationships between measured entry capacity, circulating flow, and other independent variables that have an impact on entry capacity [9,14]. They consider not only the circulating and entering but also the exiting traffic flow. The relationship between entry capacity and circulating flow is linear or exponential, depending on the model [8,11].
Simulation models are based on modeling the movements and interactions of individual vehicles on a network consisting of links and nodes or connectors. Vehicle movements are governed by gap acceptance, car-following, lane-changing, and other models, and are typically calculated for each vehicle at every specified time step [8]. In recent years, vehicle movements along a roundabout have been studied within the master equation formalism for stochastic exclusion processes of many-particle systems, i.e., many-body interactions. The finite dimensions of vehicles introduce a natural “quantization” of space, and developed models simulate the stochastic motion of particles (vehicles) along a roundabout through the (totally) asymmetric exclusion process [17,18].
Although designers and analysts would like to perform estimations as completely and correctly as possible, model performance in predicting roundabout entry capacities is limited [19]. Even today, the discussion between analytical and regression models characterizes the general situation regarding the estimation of entry capacity at roundabouts [9,12]. The main issues address the fact that both roundabout geometric parameters and traffic characteristics (volume, vehicle composition, and driver behavior) vary widely across the world [20]. However, according to [10,21], geometric parameters have a much stronger impact on roundabout entry capacity than geographic location or country of origin, i.e., “regional” non-geometric driver behavior. Additionally, among the different factors influencing entry capacity, only the geometric parameters of roundabouts can be quantified and modified, i.e., entirely manipulated by the designers to improve roundabouts’ operational performance [11].
The two objectives of the research presented in this paper are to (1) analyze and compare the results of roundabout performance estimations derived from analytical and regression models, and (2) quantify the model results’ susceptibility to changes in roundabout geometric parameters. The investigation will be performed on 60 four-legged single-lane roundabouts schemes, varying in size and leg alignment, designed according to the results of the chosen design vehicle swept path analysis. The roundabout performance estimations will be performed under the assumption that the entering traffic at each leg is distributed in three travel directions through the roundabouts, in equal shares. To compare the results of the analytical and regression models, the roundabout entry degree of saturation will be calculated. This is a dimensionless value used as the intersection efficiency indicator in both models. The results of this research will reduce the uncertainty in decision-making during the final roundabout design stage.
2. Materials and Methods
A list of symbols used in the manuscript is given in Table 1.
The geometric parameters of a roundabout are the outer radius (Ro), the central island radius (Ri), the circulatory roadway width (u), the number of legs (j), the angle between the legs (δ), entry width (ej), exit width (ej′), entry radius (Rj), and exit radius (Rj+1′). The selected Ro is influenced by the location of the roundabout (urban, suburban, rural), roundabout task (e.g., traffic calming), spatial constraints, and the number of circulatory lanes. In this investigation, the roundabout geometric parameters, design vehicle used for swept path analysis, and traffic flow characteristics were defined based on the following assumptions: (1) the roundabouts were to be situated in a suburban environment and (2) the roundabouts were to act as single-lane traffic-calming devices along the transition path from the rural to the urban environment.
A plan view of the analyzed 4-legged single-lane roundabouts schemes was created in AutoCAD. The following initial geometric parameters were used (Figure 1a):
- Ro applied in this investigation varied from 13.0 to 20.0 m, with a 0.5 m increment. According to previous research given in [22], these outer radii are commonly used for single-lane roundabouts worldwide. An increment of 0.5 m was chosen to capture the dispersity of the results and to create a sample that is representative, manageable, and easy to present at the same time;
- The roundabout leg alignment was radial, as is standard in the suburban environment [22];
- The axes of legs 1 and 4 intersected at δ = 90°. The axes of legs 1 and 2 intersected at δ ranging from 75° to 90° with 5° increments. This range was defined after considering the condition given in [23], regarding the length of the arc (l) between the adjacent roundabout legs. According to these guidelines, the length of this arc should be longer than 20 m to ensure the efficiency of the roundabout. Namely, a shorter l makes it difficult for drivers to signal the exit of the intersection when turning right due to the very short time to turn on the turn signals;
- There were 15 m long triangular splitter islands designed at each leg with 0.5 m offset from the defined outer edge of the circulatory roadway;
- The initial alignment of 3.25 m wide entry and exit lanes was defined.
The geometric parameters Ri, Rj, Rj+1′, and u resulted from the design vehicle swept path analysis, which was performed in the AutoCAD software add-in Vehicle tracking 2022. The selected design vehicle was a 12 m long bus adopted from the German vehicle library FGSV 2001. The geometric parameters Ri and u (Figure 1b) were defined based on the design vehicle swept path when driving in a full circle [7] while ensuring minimum lateral clearances of 0.5 m [24].
The geometric parameters Rj and Rj+1′ were defined based on the design vehicle swept path when turning right [24], while ensuring minimum lateral clearances of 0.5 m. Where possible, to achieve wider exits, the roundabout’s right roadway edge was designed by considering the condition of Rj+1′ ≥ Rj + 2 m (Figure 2a) [25]. Wider roundabout exits are favorable as they enable higher roundabout exit speeds, help minimize the likelihood of congestion and crashes at the exits, provide ease of navigation for long vehicles, and reduce the potential for trailers to track over the outside curb. At roundabouts where it was not possible to design the right roadway edge with radii Rj and Rj+1′ due to leg alignment, a different procedure was applied. Here, the right roadway edge was designed based on the trajectory of the vehicle’s right turn movement and lateral clearances of 0.5 m in cross-section a–a (Figure 2b). The geometric parameters ej and ej′ were defined as the shortest distance between the intersection point of the drawn line on the edge of the splitter island and the entry line and the right roadway edge on the roundabout entry and exit (Figure 2).
The two observed models for the roundabout entry degree of saturation calculation differ in the utilization of the abovementioned geometric parameters. The analytical HBS 2015 model, given in [26], uses only Ro as an input for calculation. The regression Swiss Bovy model, given in [1], considers the influence of conflicting traffic on the circulatory roadway that is exiting the roundabout at the same leg as the observed entry. The influence of conflicting traffic on the circulatory roadway is defined as the distance between exiting and entering traffic flows along the center of the circulatory lane (bj) [8], i.e., it considers the joint influence of geometric parameters Ro, Ri, and δ.
Parameter bj was defined through the following procedure. First, the lines from the center of the outer radius Ro to the center of the radii Rj and Rj′ were drawn (Figure 3a). At roundabouts where it was not possible to design the right roadway edge with radii Rj and Rj+1′, the line from the center of the outer radius Ro perpendicular to the trajectory of the vehicle’s right turn movement was drawn (Figure 3b). Then, a circle of radius Ro—u/2 was constructed from the Ro center. Traffic stream conflicting points, exiting point (C) and entering point (C′), were defined as intersections of these entities. The distance between exiting and entering traffic streams along the center of the circulatory lane, i.e., the length of the circular arc between conflicting points bj, was then measured.
Once designed, the geometric parameters Ri, u, ej, ej′, and bj were systematized according to the Ro and δ. When designing a roundabout according to the previously described procedure, it should be noted that the results depend on the experience and subjective approach of the designer. Therefore, to better present the influence of the chosen Ro and δ on the designed parameters, regression analysis was performed, and best-fit curves with a coefficient of determination larger than 0.99 were created. Second-degree polynomial curves were used to describe Ri and u as a function of Ro, and third-degree polynomial curves were used to describe ej, ej′, and bj as a function of Ro for different δ. Additionally, the average difference between bj (j = 1, 2, and 3) for δ = 90° and bj (j = 1, 2, and 3) for δ = 85°, 80°, and 75° was calculated.
The entry degree of saturation (xmj) was defined as the ratio of entering traffic flow and entry capacity. According to [14], sustainable values of xmj range from 0.0 to 1.0 (values above 1.0 indicate an excess of entering traffic demand over entry capacity). xmj was calculated for each designed scheme considering the following simplifications and assumptions on traffic flow volume, distribution, and composition:
- Three travel directions through the roundabout were considered at each roundabout entry (j = 1, …, 4): right turn, straight passage, and left turn (i = 1, …, 12).
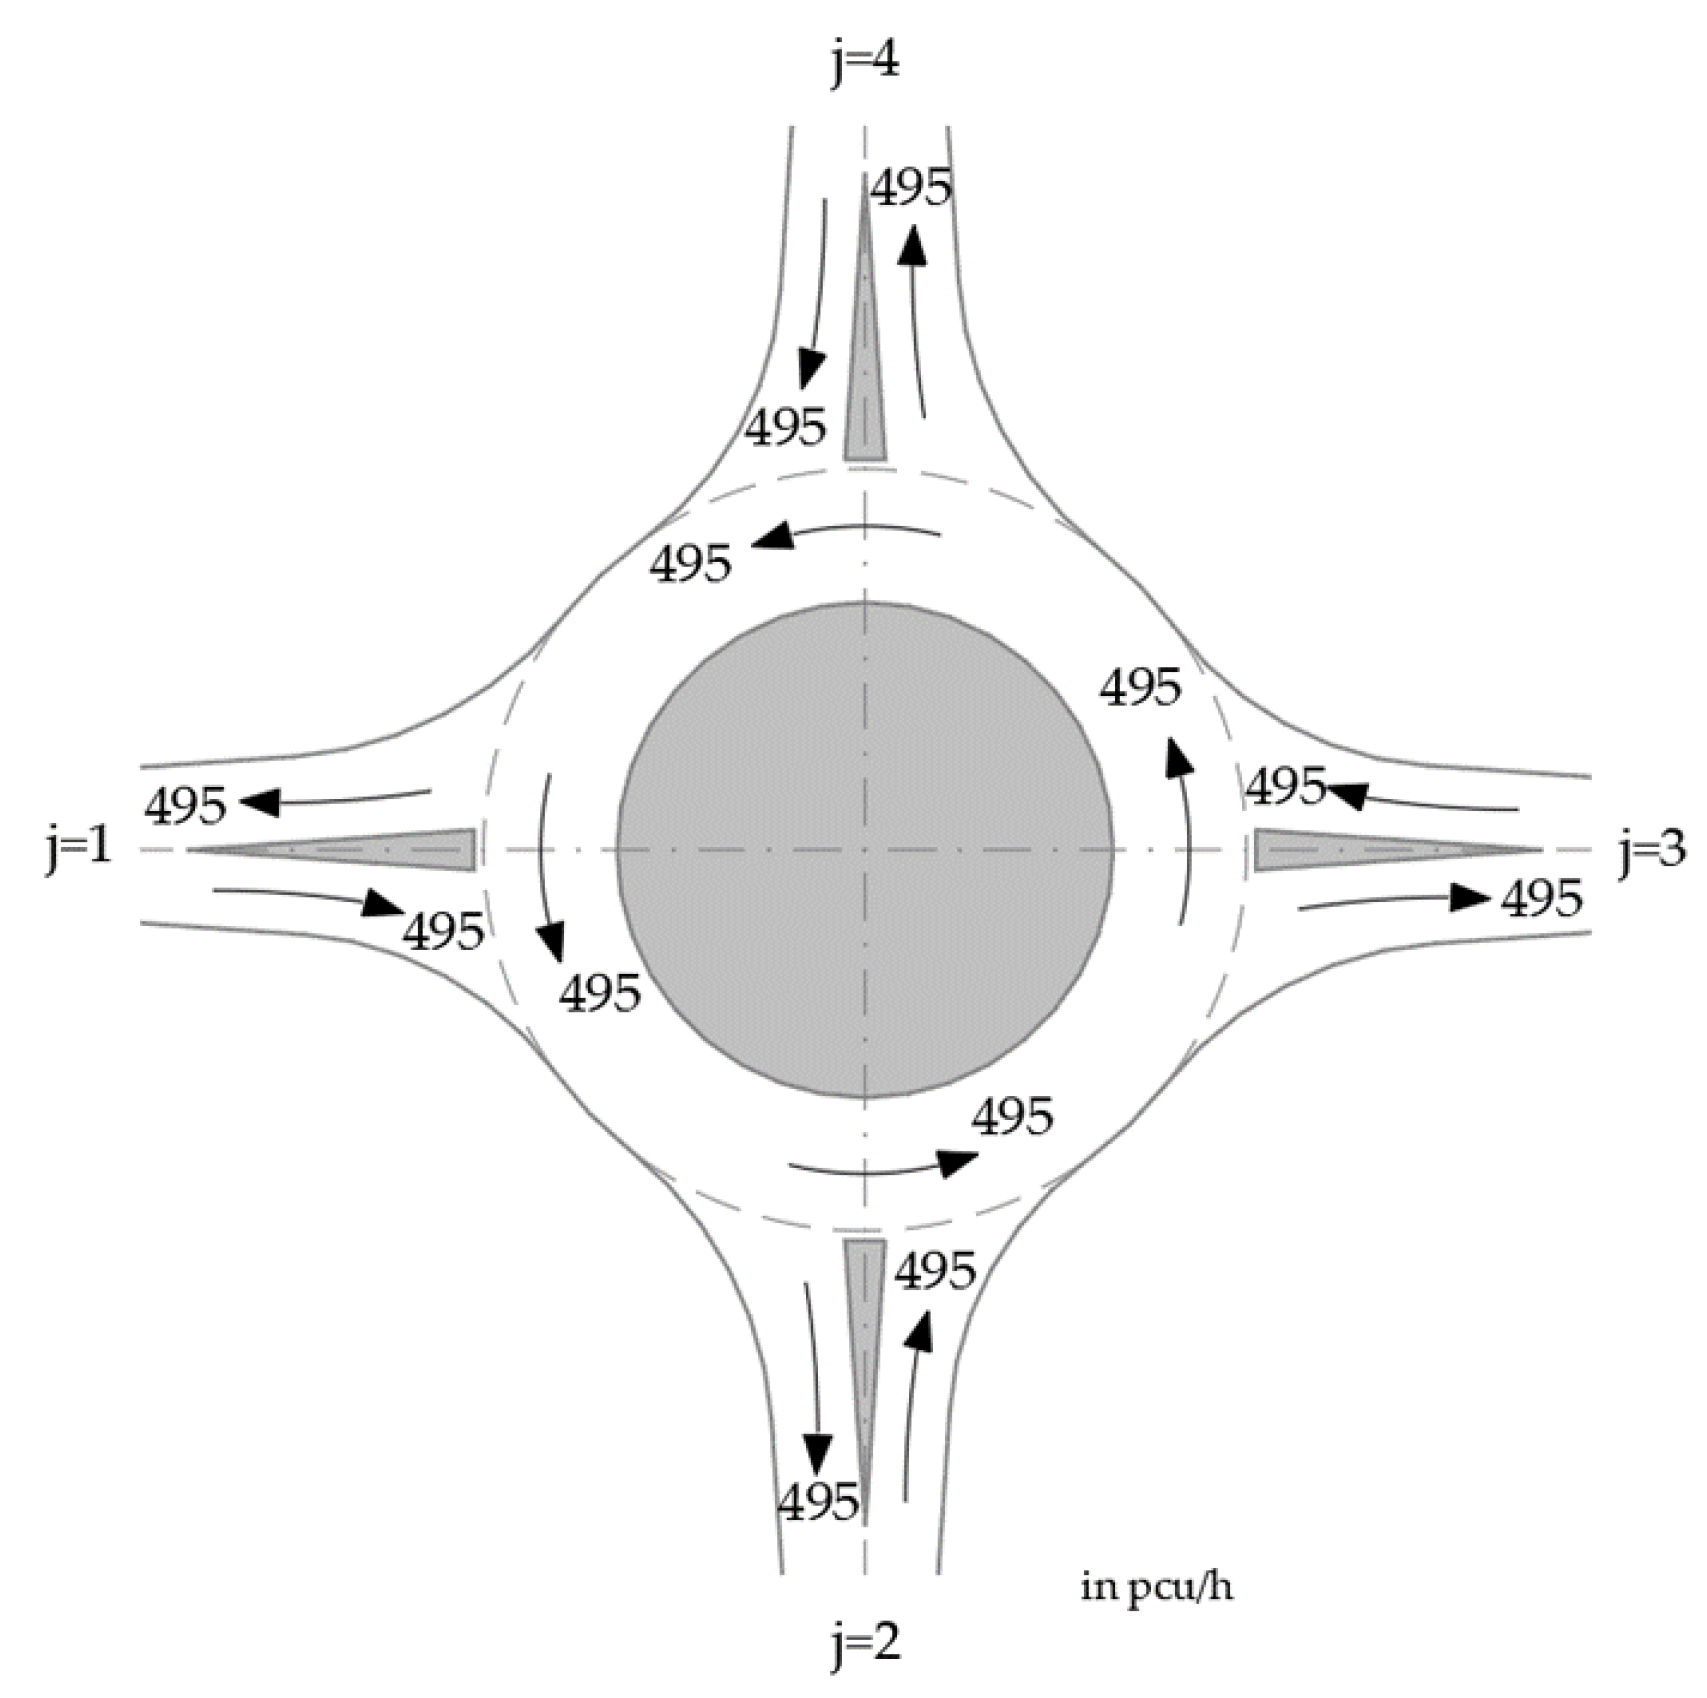
- Traffic flow qi at each entry (j = 1, …, 4) in each travel direction (i = 1, …, 12) was 150 veh/h, adding up to a total of 1800 veh/h passing through the roundabout (Figure 4a).
- The influence of pedestrian and bicycle traffic on roundabout capacity was not considered.
- The influence of heavy vehicles on the traffic flow quality was considered through the homogenization of traffic flows qi. Flat-rate conversions of each qi from vehicles per hour (veh/h) to Qi in passenger car units per hour (pcu/h) were made by using a conversion factor of fT = 1.1, prescribed by [26] in case of lacking real data on flow composition:
Qi = fT · qi,
The same procedure for determining the entering, exiting, and circulating traffic flows given in [26] was used for both the analytical and regression models. Based on assumed traffic conditions, 12 entering and exiting traffic flows Qi for each travel direction (i = 1, …, 12) were calculated. Then, the entering traffic flows QEj, exiting traffic flows QSj, and the circulating traffic flow QCj (traffic flow in the circulatory roadway, i.e., the main flow, which has priority over the ones entering the circulatory roadway) were calculated for each leg (j = 1, …, 4) according to Figure 4b and Table 2.
Once the circulating, entering, and exiting traffic flows were established, the xmj was calculated through the following analytical and regression model procedures.
In the analytical model, the circulating flow QCj was used as an input variable for determining the base capacity of the approach BCj. BCj values for the roundabout with one circulatory lane and the outer radius of roundabout Ro were determined from the chart in Figure 5 [26]. As the chart gave data only for roundabouts with outer radii Ro of 13.5, 15, 17.5, and 20 m, for other investigated Ro values, BCj was defined through interpolation.
Roundabout entry capacity CEj was calculated as
where CEj is roundabout entry capacity considering the impact of pedestrian crossings (pcu/h), BCj is the base entry capacity of the roundabout according to Figure 5 (pcu/h), and fp is the capacity reduction factor for pedestrian and cycling traffic flow at roundabouts. In this investigation, the influence of pedestrian and bicycle traffic on entering traffic flow was neglected and the fp factor was set to 1.0. The value of entry capacity CEj was, therefore, equal to base capacity BCj.
To determine the degree of saturation xmj, it was necessary to back-calculate the entry capacity values CEj from passenger car units to vehicles per hour. The entry capacity Cmj for the mixed traffic flow was then calculated as
where Cmj is the entry capacity for mixed flow (veh/h), CEj is the entry capacity (pcu/h), and fT is the conversion factor for traffic composition set to 1.1 because of the absence of real data on flow composition.
Mixed traffic flow qmj in vehicles per hour was then calculated on each leg’s entry by summing up the three traffic flows qi with different directions of travel (right turn, straight passage, and left turn). xmj,A was calculated as the ratio of entering mixed traffic flow qmj in vehicles per hour and entry capacity Cmj in vehicles per hour:
where xmj,A is the entry degree of saturation according to the analytical model, qmj is mixed traffic flow on legs’ entry (veh/h), and Cmj is entry capacity (veh/h).
In the regression model, entry capacity CEj in passenger car units per hour was defined as [1]
where CEj is entry capacity (pcu/h), QCj is circulating traffic flow in front of the leg being considered (pcu/h), QSj is exiting traffic flow on the same leg as the entry (pcu/h), α is a factor reflecting the impact of exiting traffic on entry capacity by distance bj, β is a factor for adjusting circulating flow depending on the number of circulatory lanes, and γ is a factor for adjusting entry capacity depending on the number of circulatory lanes.
Conflict factor α was determined from the chart in Figure 6 for measured distance bj and middle curve. The factors β and γ were set to 1.0, as single-lane circulatory roadways were investigated [1].
The degree of saturation of entry was defined as
where xmj,R is the entry degree of saturation according to the regression model, γ is a factor for adjusting entry capacity depending on the number of circulatory lanes (set to 1.0), QEj is entering traffic flow (pcu/h), and CEj is entry capacity (pcu/h).
To present the influence of Ro and δ on calculated xmj, regression analysis was performed, and best-fit curves for xmj values were created. Second-degree polynomial curves with a coefficient of determination larger than 0.99 were used to visualize the trend.
To further quantify the impact of the application of different models in the roundabout design process, the reversed calculation of traffic flow at each leg was performed according to the regression model methodology. The calculation was based on the condition that the intersection enables the same level of saturation as previously defined by the analytical model (i.e., for the previously determined values of xmj,A). With this reversed calculation, the potential traffic flow volume in veh/h was determined for each roundabout, summarized, and compared with the input total flow rate of 1800 veh/h.
3. Results
The results of the roundabout geometric design showed that to simultaneously fulfill two roundabout design conditions (regarding preferred arc length and the roundabout’s right roadway edge design, Table 3) values of Ro for different δ should be (1) Ro ≥ 13.5 m for δ = 85°, (2) Ro ≥ 16.5 m for δ = 80°, and (3) Ro ≥ 19.0 m for δ = 75°.
Considering the fulfillment of the abovementioned conditions (Table 3), designing a roundabout with a δ ≤ 75° is not recommended. However, the roundabout design that does not consider these two design conditions could be applied in the suburban environment because of the spatial limitations. Therefore, calculations of the xmj were performed for all 60 designed roundabouts, based on the calculated traffic flow volumes shown in Figure 7.
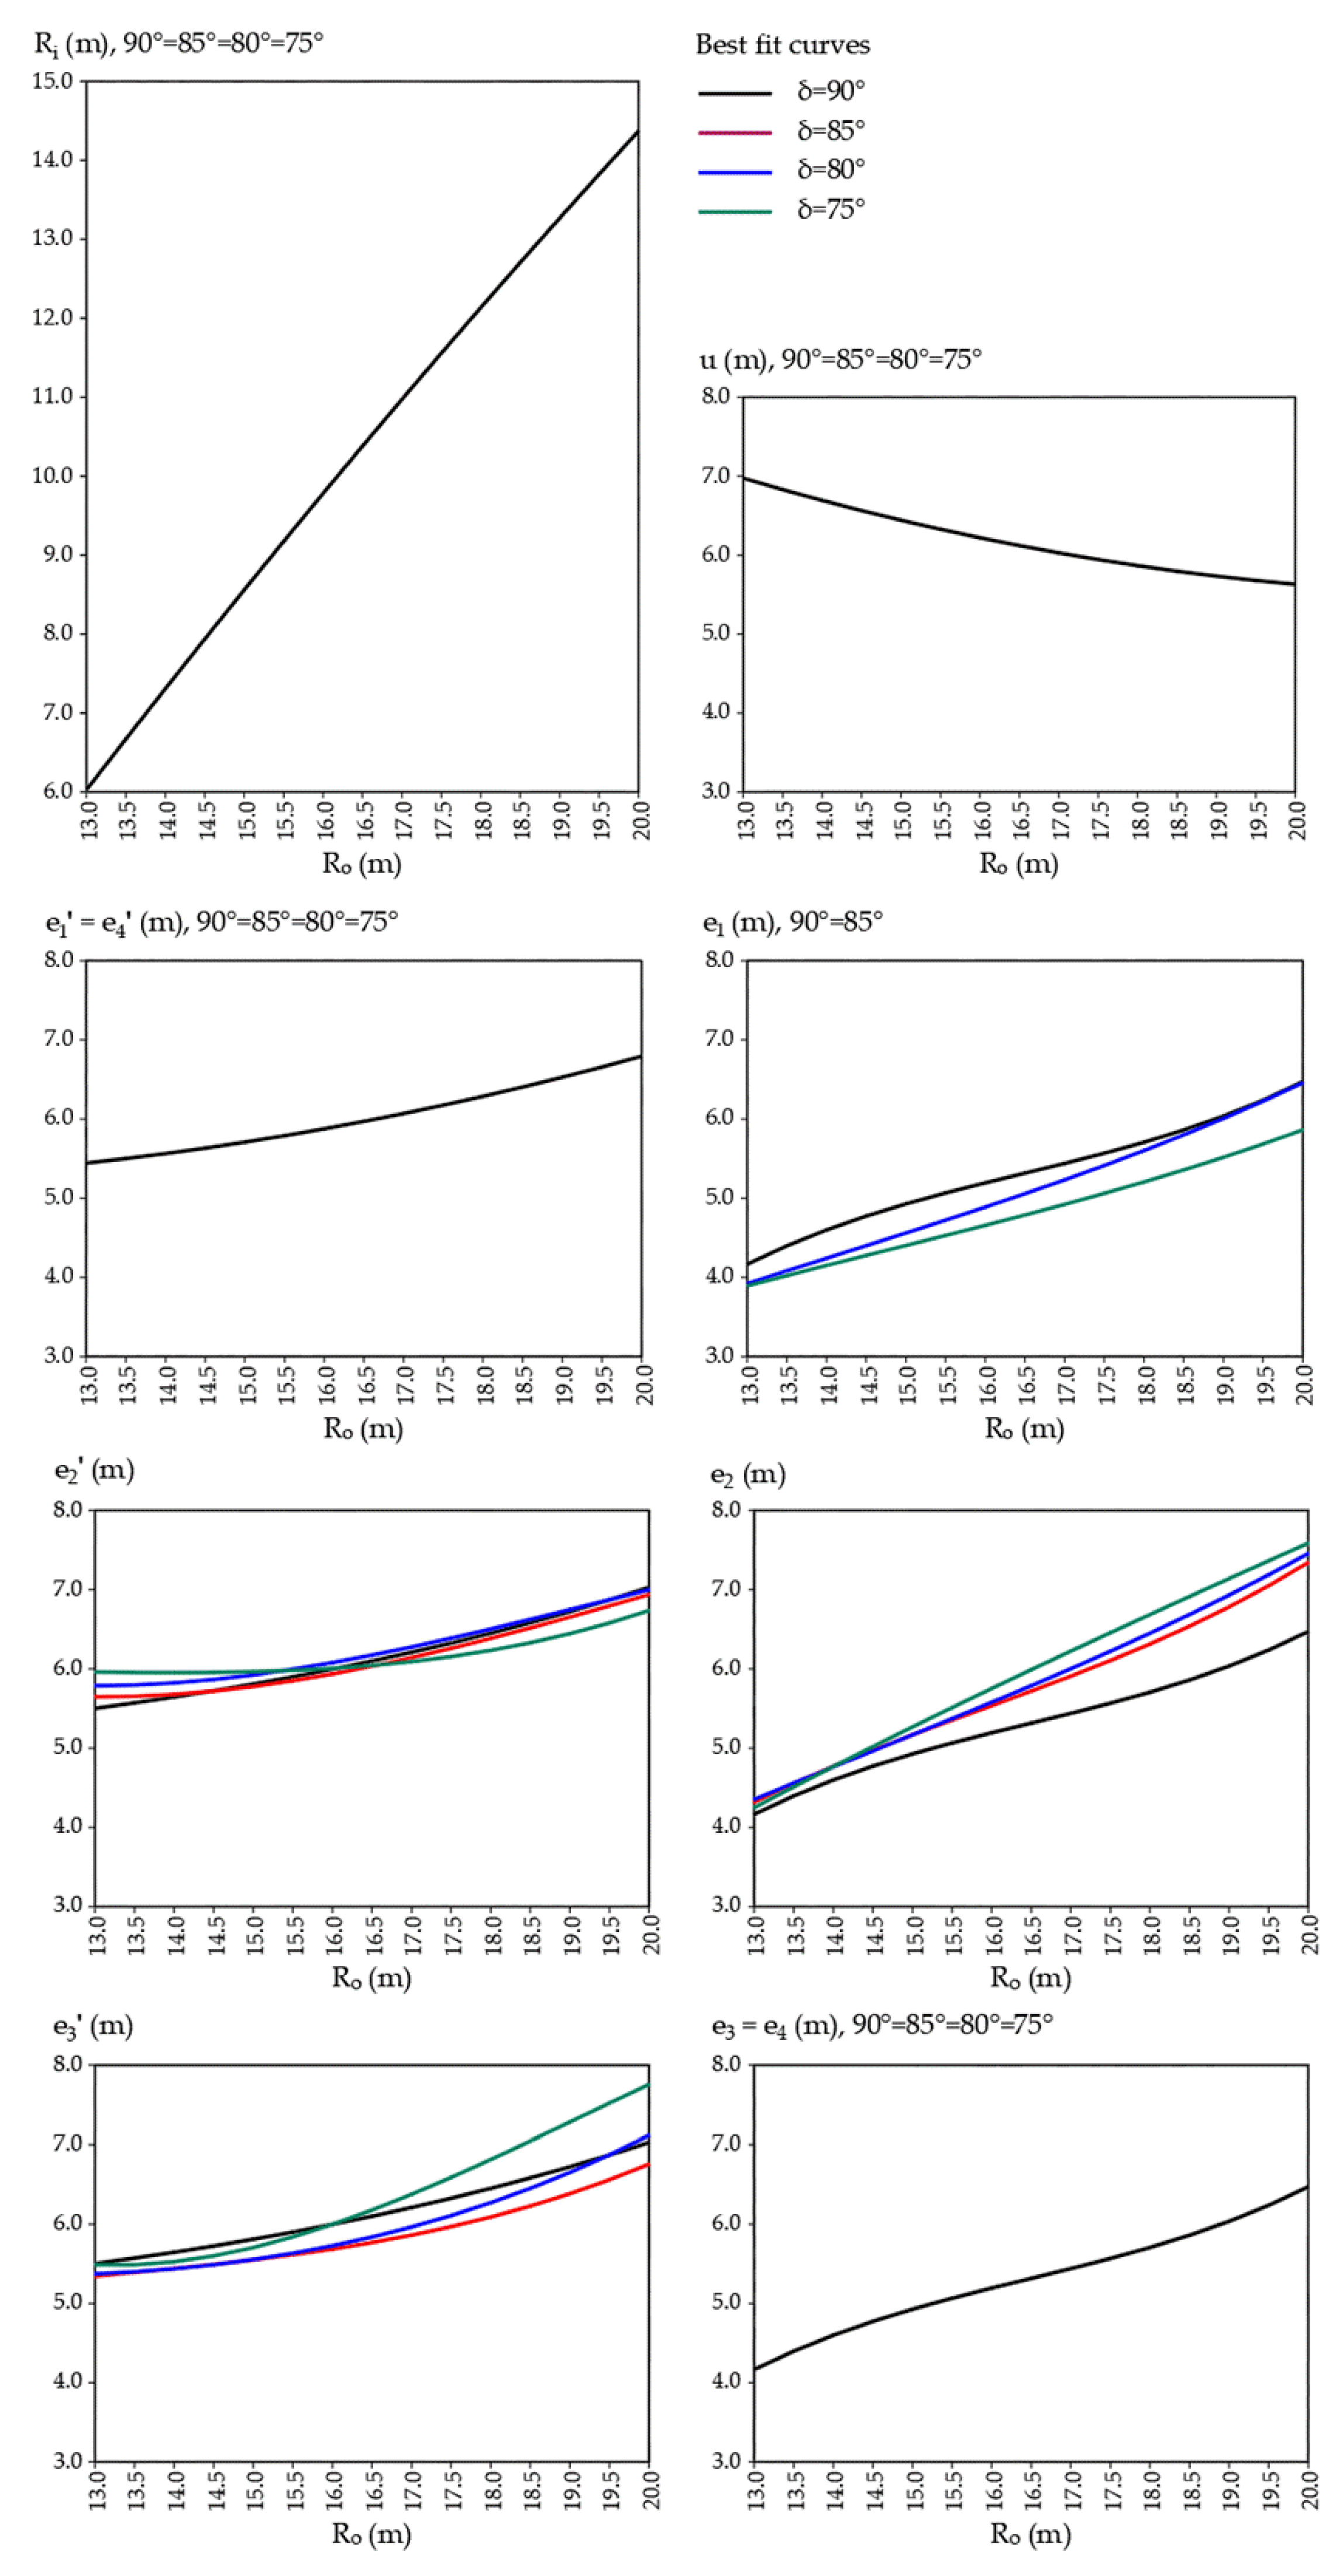
The resulting values of the geometric parameters of the 60 designed roundabouts schemes are shown with their best-fit curves in Figure 8, Figure 9a, Figure 10, Figure 11 and Figure 12a.
As shown in Figure 8, Ri, ej, ej′, and bj were proportional to Ro, and u values were inversely proportional. The change in e1 was (1) proportional to δ, (2) identical for δ = 90 and 85°, (3) identical for δ = 80 and 75° at Ro = 13.0 m, and (4) identical for δ = 90, 85, and 80° at Ro ≥ 19.0 m. The change in e2 was inversely proportional to δ at Ro ≥ 14.0 m. The change in e2′ and e3′ at Ro ≥ 16.0 m showed an uneven trend for different δ. As expected, δ did not affect the entrance and exit widths e3, e4, e1′, and e4′.
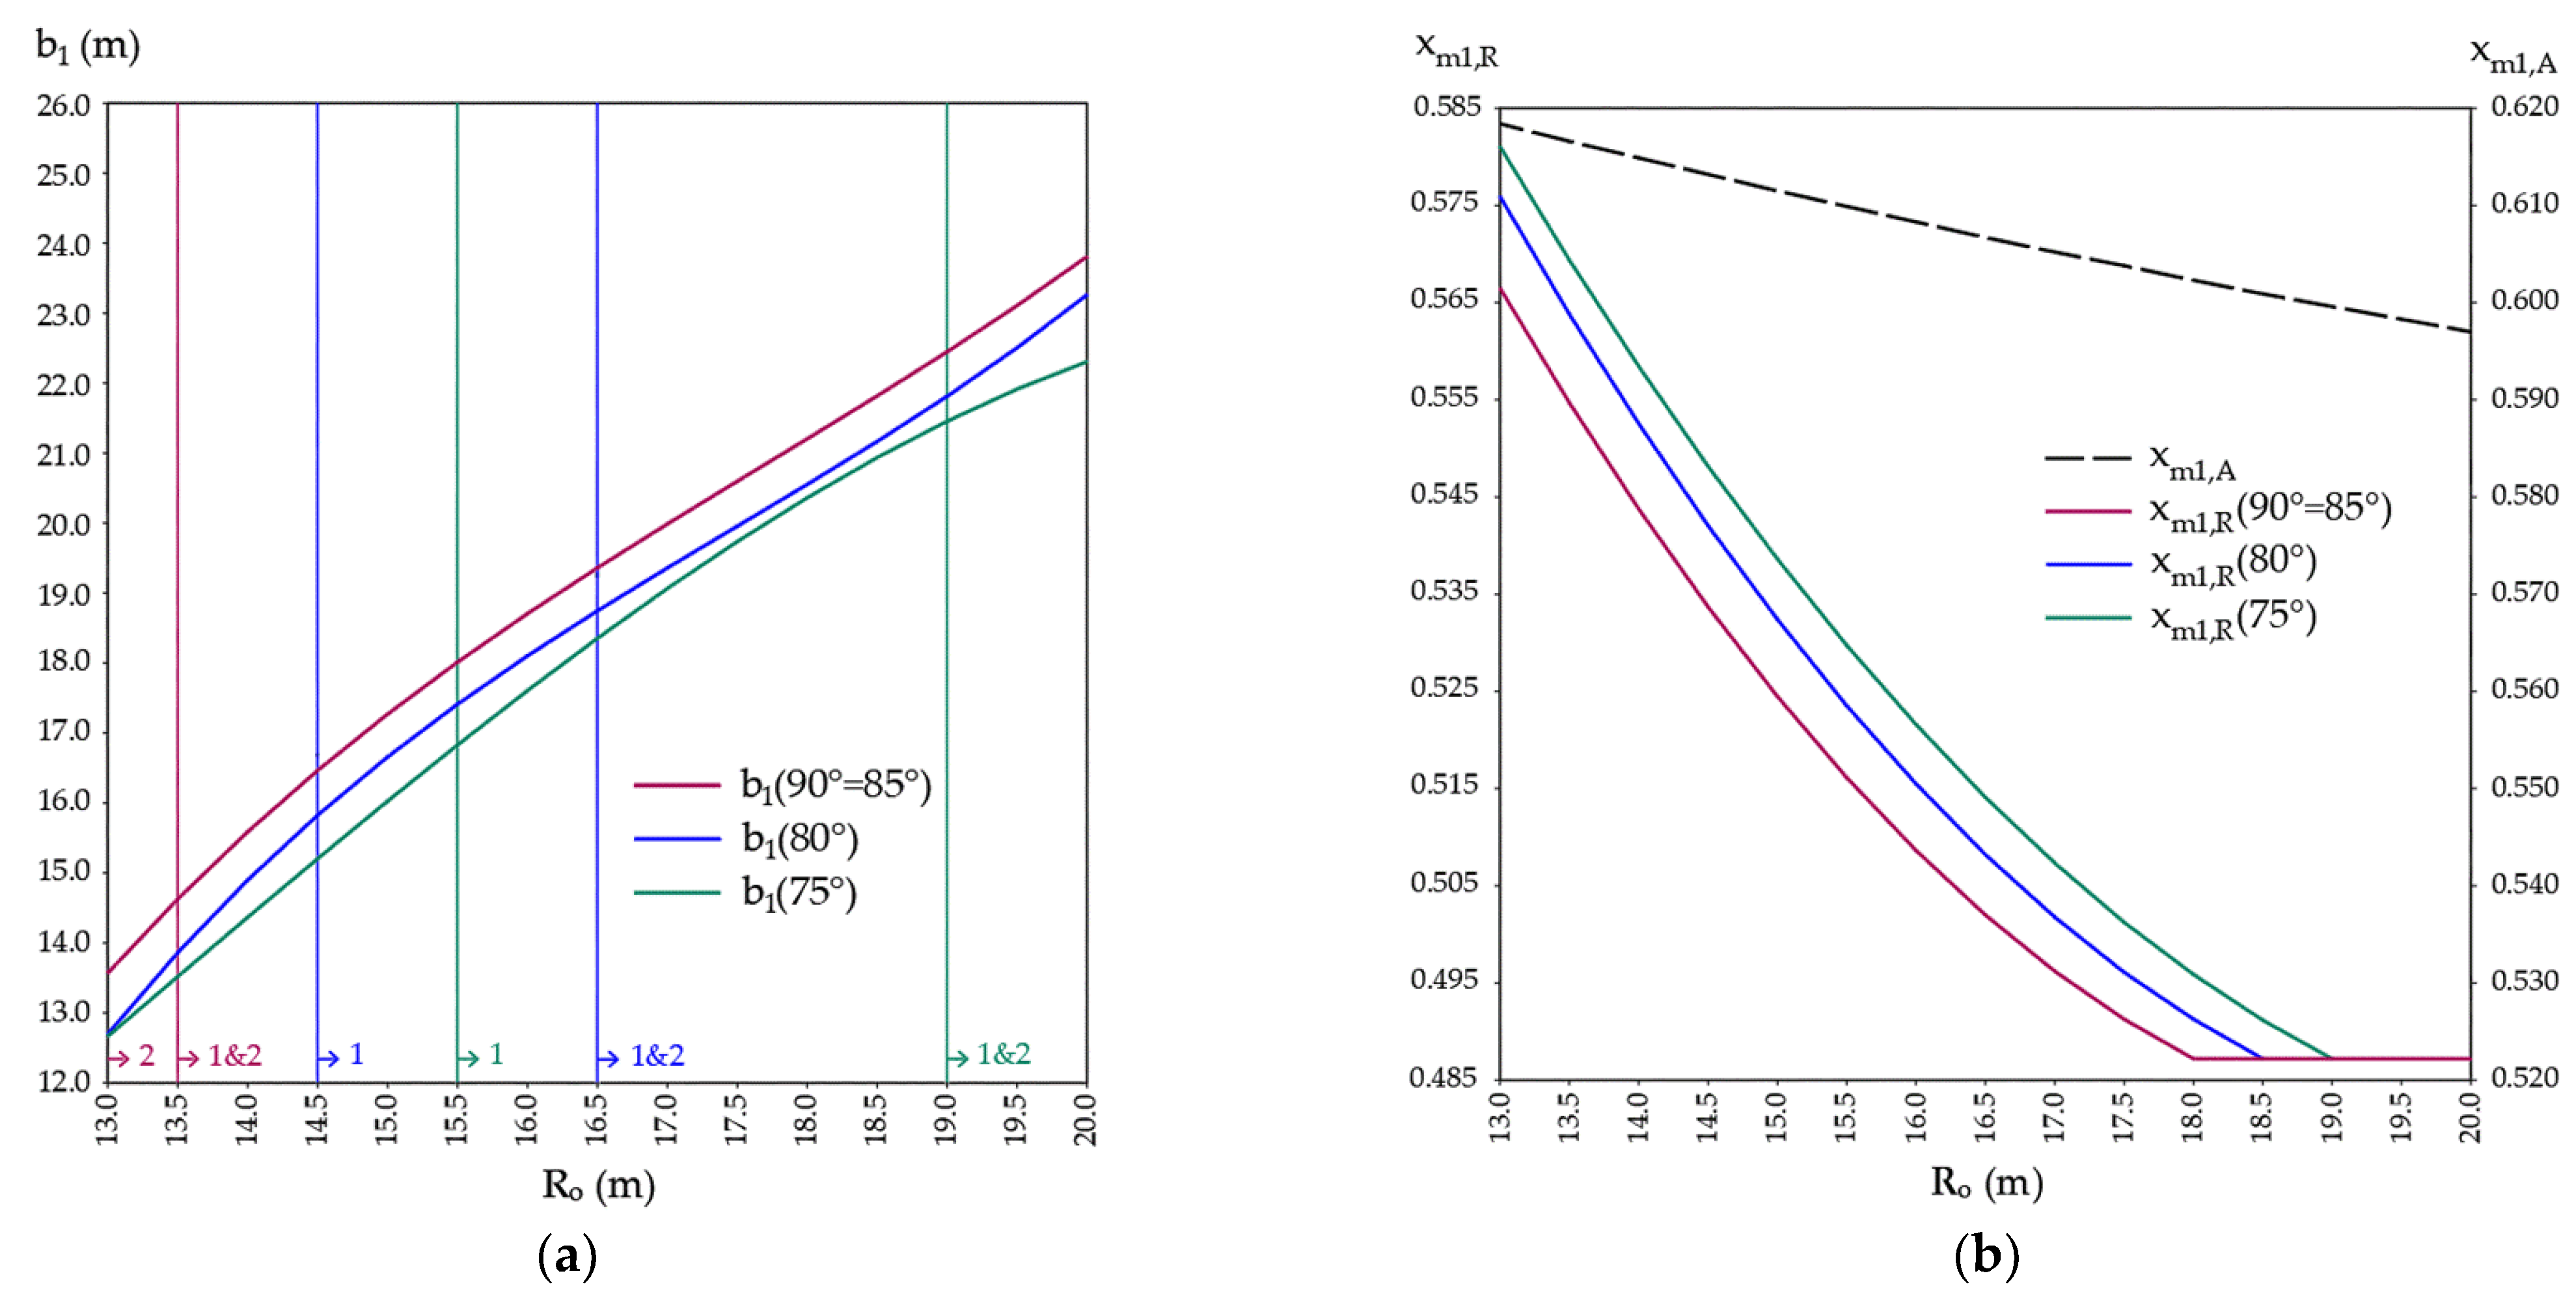
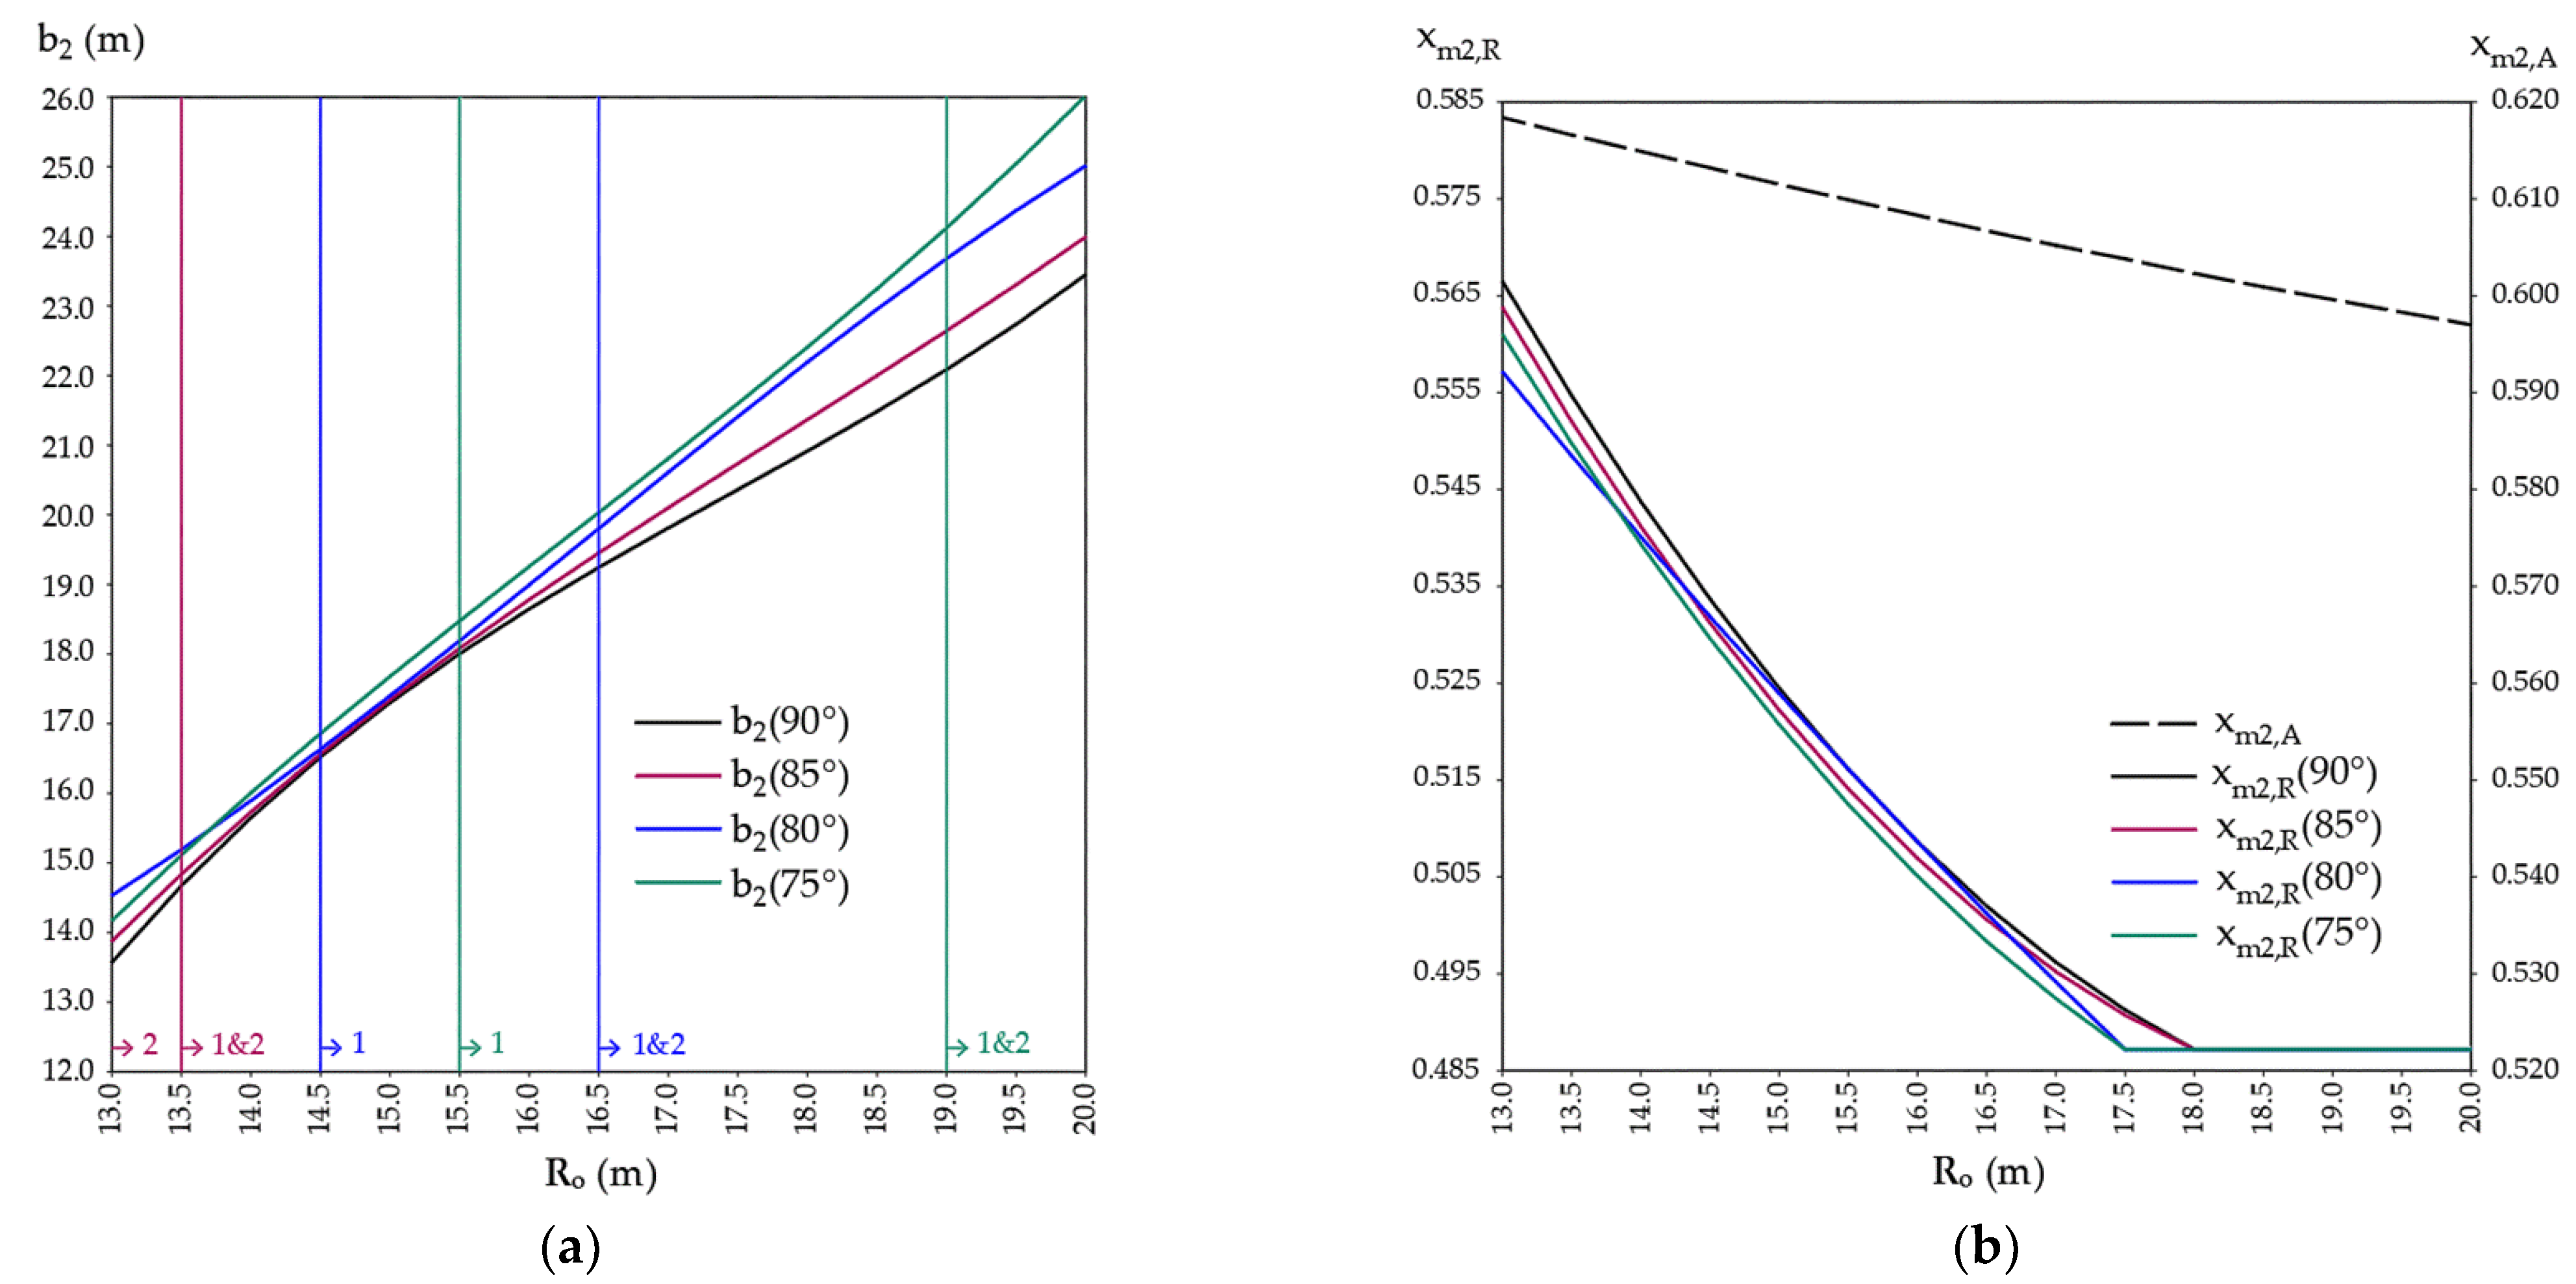
As shown in Figure 9a, Figure 10, Figure 11 and Figure 12a, the trend of bj increasing for different δ corresponded to those of ej and ej′. Thus, the change in b1 (1) was proportional to δ and (2) was identical for δ = 90 and 85°. The change in b2 was inversely proportional to δ at Ro ≥ 14.0 m. δ had a negligible effect on the values of b3 at Ro < 16 m. The change in δ had no effect on the values of b4. Extreme values of bj were observed for δ = 75° and Ro = 13.0 m (b1 = 12.5 m) at leg 1, and Ro = 20.0 m (b2 = 25.7 m) at leg 2.
The results of the calculation of the entry degree of saturation with dependence on the Ro of roundabouts and δ according to the analytical model (xmj,A) and regression model (xmj,R) showed that xmj values were inversely proportional to Ro. xmj,R values followed the observed trend of bj for all analyzed δ at each roundabout leg (Figure 9b, Figure 10, Figure 11 and Figure 12b). For Ro ≤ 16.5 m, an established trend showed a more rapid decrease in bj and, consequently, in xmj,R. On the other hand, for Ro ≥ 19.0 m, it can be stated that the differences in the right roadway edge design, regardless of δ, do not affect xmj,R. The values of xmj,A decreased at a lower and uniform rate as Ro increased. xmj,A values were higher than xmj,R by, on average, 16%. The average difference between xmj,A and xmj,R varied between 0.088 and 0.100. These extreme differences were observed for δ = 75°, at leg 1 and leg 2, respectively. At each leg, the average observed difference between the calculated xmj,R for δ = 90° and xmj,R for the other δ values amounted to (1) 0.3% at leg 2 for δ = 85°, (2) 1.1% at leg 1, and 0.4% at leg 2 for δ = 80°, (3) 1.7% at leg 1, 0.5% at leg 2, and 0.2% at leg 3 for δ = 75°.
Figure 13 shows the average difference between b1, b2, and b3 for δ = 90° and b1, b2, and b3 for δ = 85°, 80°, and 75°, respectively. The change in these differences in bj values is linear. As expected, b1 shortened as δ decreased. The opposite is true for b2 and b3. The main reason for this is the design of the right roadway edge based on the design vehicle swept path analysis. Namely, on the roundabout exit at legs 2 and 3, the body of the design vehicle swept a wider surface than on the roundabout entry at leg 1, and this surface was ever wider as δ decreased. Therefore, the designed exit radii R2′ and R3′ were significantly larger than the recommended ones and, consequently, the distances b2 and b3 were inversely proportional to δ.
The results of the reversed calculation of traffic flow at each leg according to the regression model methodology showed that, at a given roundabout, the application of the regression model gives the same xmj results as the analytical one for 6% to 15% higher traffic flows qi. The difference in traffic flow values obtained through this calculation is shown as a percentage concerning the initial total value of 1800 veh/h (Figure 14).
4. Discussion and Conclusions
The iterative process of roundabout design requires shifting between geometry design and capacity analysis, to ensure that chosen roundabout geometry satisfies the desired traffic performance criteria. The quality of traffic flow on the roundabout is indirectly dependent on its geometric parameters, and should be estimated during roundabout design through calculation models or simulations. In this investigation, a comparison of the analytical and empirical models for single-lane roundabout entry degree of saturation estimation was performed on 60 designed four-legged roundabout schemes.
When designing a single-lane roundabout based on the design vehicle swept path analysis, the choice of geometric parameters and the capacity calculation model influences the roundabout performance evaluation results. The observed models differ in the utilization of the geometric parameters: (1) the analytical model uses only the roundabout outer radius as an input for calculation, while (2) the regression model considers the influence of conflicting traffic on the circulatory roadway defined by the distance between exiting and entering traffic flows along the center of the circulatory lane, i.e., it considers the joint influence of roundabout outer radius, the central island radius, and the angle between the roundabout legs.
The results of the geometric and traffic parameters analysis showed that the central island radius and entry capacity are proportional to the outer radius. At the same time, the circulatory roadway width and the entry degree of saturation are inversely proportional to the outer radius. This is in line with the conclusions given in [27], which state that circulatory roadway width significantly influences capacity. As can be seen from our results, the influence of the circulatory roadway width, derived from the design vehicle swept path, on capacity is counterintuitive; narrower circulatory roadways on roundabouts with a larger outer radius enabled higher entry capacity, i.e., lower entry degree of saturation.
According to [11], entry width has a positive correlation with entry capacity. According to [27], the distance between the entry and exit has a greater impact on the entry capacity than the entry radius. The results of our investigation show that an increase in entry width is directly linked with an increase in outer radius value and the design of the right roadway edge derived from the design vehicle swept path, and that it decreases the roundabout entry degree of saturation in the regression model. A larger outer radius in the analytical model results in a lower degree of saturation. A larger outer radius and a greater distance between the conflicting points (dependent not only on radius but also on the width of the circulatory roadway and entry and exit widths) in the regression model result in a lower degree of saturation.
In general, for all the observed combinations of geometric parameters, the regression model results in lower values of roundabout entry degree of saturation. This difference is more pronounced as the outer radius and angle between the roundabout legs increase. This implies that it is possible to justify the chosen roundabout geometric parameters by choosing the capacity analysis model, which will allow higher traffic flow volumes. Namely, the results of the investigation showed that it is possible to increase the traffic flows that could be processed at a given roundabout from 6% to 15% if the regression model is applied instead of the analytical one during roundabout performance evaluation. From the perspective of the time in which the roundabout is expected to satisfy the desired performance criteria and considering that the average annual increase in motor vehicles’ number in Europe is 2% (according to the European Automobile Manufacturers’ Association), it could be said that the application of the regression model could extend the expected service life of a roundabout by 3 to 7 years.
For further research, the results of this investigation will be compared to and validated by roundabout entry degree of saturation calculations performed with data from field measurements. Additionally, it is planned to reverse-calculate the distance between exiting and entering traffic flows along the center of the circulatory lane for xm,R = 0.85, which is defined as the maximum entrance degree of saturation [28]. This will allow the investigation of how this distance affects other roundabout geometric parameters and traffic flows. The described approach to roundabout capacity model comparison and appropriateness evaluation could be applied to more complex roundabout setups, i.e., to roundabouts with two-lane approaches, two-lane circulatory roadways, different leg numbers and alignments, and the presence of pedestrian and cyclist flow. This investigation could be also conducted for urban areas where spatial and territorial constraints are more stringent, i.e., for roundabouts with minimal outer radii of 6.5 m and with leg alignments defining the minimum distance between exiting and entering traffic flows along the center of the circulatory lane of 9 m.
The investigation presented in this paper has shown that (1) the applied regression model estimates a higher roundabout traffic performance than the analytical one, and (2) this difference (both between the two models and regression models applied on different schemes) is more pronounced as the outer radius and angle between the legs increase. To conclude, the regression model is more suitable for application in suburban roundabout design, i.e., for environments with spatial limitations, and where performance evaluation demands higher traffic flow volumes to be processed through the roundabout. On the other hand, due to its simplicity, the analytical model should be applied in rural areas with more heterogenic and time-variable traffic flows, and for road network planning purposes, preliminary roundabout design, and robust capacity estimations.
Author Contributions
Conceptualization, M.A. and S.A.; methodology, M.A.; formal analysis, A.Č.I. and M.A.; investigation, A.Č.I.; resources, M.A.; data curation, A.Č.I.; writing—original draft preparation, A.Č.I. and M.A.; writing—review and editing, S.A.; visualization, M.A.; supervision, V.D.; project administration, M.A. All authors have read and agreed to the published version of the manuscript.
Funding
This research received no external funding.
Data Availability Statement
Not applicable.
Conflicts of Interest
The authors declare no conflict of interest. The funders had no role in the design of the study; in the collection, analyses, or interpretation of data; in the writing of the manuscript; or in the decision to publish the results.
References
- Ministry of Transport. Roundabouts—Application and Design: A Practical Manual; Ministry of Transport, Public Works and Water Management, Partners for Roads: Amsterdam, The Netherlands, 2009. [Google Scholar]
- Alozi, A.R.; Hussein, M. Multi-criteria comparative assessment of unconventional roundabout designs. Int. J. Transp. Sci. Technol. 2021, 11, 158–173. [Google Scholar] [CrossRef]
- CROW: Eenheid in Rotondes; CROW Publication no.126; CROW: Ede, The Netherlands, 1998; Available online: https://nmfv.dk/wp-content/uploads/2012/06/RDC_Netherlands.pdf (accessed on 15 March 2023).
- Ahac, S.; Ahac, M.; Džambas, T.; Dragčević, V. The Design Vehicle Steering Path Construction Based on the Hairpin Bend Geometry-Aplication in Roundabout Design. Appl. Sci. 2022, 12, 11019. [Google Scholar] [CrossRef]
- Regulation on technical conditions of vehicles in road traffic (Official Gazette, no. 85/16, 24/17, 60/20). Available online: https://narodne-novine.nn.hr/clanci/sluzbeni/2016_09_85_1864.html; https://narodne-novine.nn.hr/clanci/sluzbeni/2017_03_24_547.html; https://narodne-novine.nn.hr/clanci/sluzbeni/2020_05_60_1224.html (accessed on 15 March 2023).
- Directive 96/53/EC and Directive 2002/7/EC. Available online: https://eur-lex.europa.eu/legal-content/EN/TXT/PDF/?uri=CELEX:01996L0053-20150526&from=EN (accessed on 15 March 2023).
- Građevinski fakultet Sveučilišta u Rijeci. Smjernice za Projektiranje Kružnih Raskrižja na Državnim Cestama; Građevinski fakultet Sveučilišta u Rijeci: Rijeka, Croatia, 2014. [Google Scholar]
- Yap, Y.H.; Gibson, H.M.; Waterson, B.J. An International Review of Roundabout Capacity Modelling. Transp. Rev. 2013, 33, 593–616. [Google Scholar] [CrossRef]
- Guiffre, O.; Granà, A.; Tumminello, M.L. Exploring the uncertainty in capacity estimation at roundabouts. Eur. Transp. Res. Rev. 2017, 9, 18. [Google Scholar] [CrossRef] [Green Version]
- Johnson, M.T.; Lin, T. Impact of Geometric Factors on the Capacity of Single-Lane Roundabouts. Transp. Res. Rec. J. Transp. Res. Board 2018, 2672, 10–19. [Google Scholar] [CrossRef]
- Zacharia, A.B.; Madhavan, H.; Anjaneyulu, M.V.L.R. Geometric factors influencing entry capacity of roundabouts under heterogeneous traffic conditions. Arch. Transp. 2019, 49, 87–101. [Google Scholar] [CrossRef] [Green Version]
- Pompigna, A.; Guerrieri, M.; Mauro, R. New Extensions and Applications of the Modified Chumanov Model for for Calculating Entry Capacity of Single-Lane Roundabouts. Sustainability 2020, 12, 6122. [Google Scholar] [CrossRef]
- Žura, M. Roundabout Capacity Estimation Model Considering Driver Behaviour on the Exiting and Entry Flows. Promet – Traffic Transp. 2022, 34, 397–405. [Google Scholar] [CrossRef]
- Transportation Research Board, Roundabouts. In Highway Capacity Manual: A Guide for Multimodal Mobility Analysis; Transportation Research Board (TRB): Amsterdam, The Netherlands, 2016.
- Hamim, O.F.; Hadiuzzaman, M.; Hossain, S. Developing empirical model with graphical tool to estimate and predict capacity of rural highway roundabouts. Int. J. Transp. Sci. Technol. 2021, 11, 726–737. [Google Scholar] [CrossRef]
- Batra, V.; Anand, V.; Prakash, V.; Mangal, V.; Kumar, N. A Review of Capacity, Critical Gap and Follow-up Time on an Unsignalised Intersections in Bangalore City. Int. J. Innov. Sci. Res. Technol. 2020, 5, 912–917. [Google Scholar]
- Foulaadvand, M.E.; Maass, P. Phase transitions and optimal transport in stochastic roundabout traffic. Phys. Rev. E 2016, 94, 012304. [Google Scholar] [CrossRef] [PubMed]
- Nava, A.; Giuliano, D.; Papa, A.; Rossi, M. Traffic models and traffic-jam transition in quantum (N+1)-level systems. SciPost Phys. 2022, Core 5, 022. [Google Scholar] [CrossRef]
- Song, Y.; Hu, X.; Lu, J.; Zhou, X. Analytical approximation and calibration of roundabout capacity: A merging state transition-based modeling approach. Transportation Res. Part B Methodol. 2022, 163, 232–257. [Google Scholar] [CrossRef]
- Anagnostopoulos, A.; Kehagia, F.; Aretoulis, G. Application of Artificial Neural Network for Modelling and Predicting Roundabout Capacity. In Proceedings of the 8th Road Safety & Simulation International Conference, Athens, Greece, 8–10 June 2022. [Google Scholar]
- Johnson, M.T.; Hale, D.K. A Case for Geometrically-Based Roundabout Capacity Equation Modeling. In Proceedings of the 5th International Symposium on Highway Geometric Design, Vancouver, BC, Canada, 22–24 June 2015. [Google Scholar]
- Ahac, S.; Dragčević, V. Geometric Design of Suburban Roundabouts. Encyclopedia 2021, 1, 720–743. [Google Scholar] [CrossRef]
- Plangleiche Knoten–Kreisverkehre; (RVS 03.05.14); Österreichische Forschungsgesellschaft Straße-Schiene-Verkehr (FSV): Wien, Austria, 2010.
- Ahac, S. Design of Suburban Roundabouts Based on Rules of Vehicle Movement Geometry. Ph.D. Thesis, University of Zagreb, Zagreb, Croatia, April 2014. [Google Scholar]
- Rodegerdts, L.; Bansen, J.; Tiesler, C.; Knudsen, J.; Myers, E.; Johnson, M.; Moule, M.; Persaud, B.; Lyon, C.; Hallmark, S.; et al. NCHRP Report 672: Roundabouts: An Informational Guide, 2nd ed.; Transportation Research Board: Washington, DC, USA, 2010. [Google Scholar]
- Voss, T. HBS 2015 Teil S5 Knotenpunkte ohne Lichtsignalanlage, Germany. 2015. [Google Scholar]
- Yap, Y.H.; Gibson, H.M.; Waterson, B.J. Models of Roundabout Lane Capacity. J. Transp. Eng. 2015, 141, 1–12. [Google Scholar] [CrossRef] [Green Version]
- Šurdonja, S.; Deluka-Tibljaš, A.; Babić, S. Optimization of roundabout design elements. Tech. Gaz. 2013, 20, 533–539. [Google Scholar]
Figure 1.
Design of initial geometric parameters: (a) the outer radius, legs, and splitter islands; (b) the central island radius and the circulatory roadway width defined based on the design vehicle swept path when driving in a full circle.
Figure 1.
Design of initial geometric parameters: (a) the outer radius, legs, and splitter islands; (b) the central island radius and the circulatory roadway width defined based on the design vehicle swept path when driving in a full circle.

Figure 2.
Roadway right edge design based on the trajectory of the vehicle’s right-turn movement: (a) defined by entry radius and exit radius; (b) defined by the trajectory of the design vehicle.
Figure 2.
Roadway right edge design based on the trajectory of the vehicle’s right-turn movement: (a) defined by entry radius and exit radius; (b) defined by the trajectory of the design vehicle.

Figure 3.
Defining the distance b along the center of the circulatory lane, for roadway right edge design defined by the: (a) entry and exit radius; (b) design vehicle trajectory.
Figure 3.
Defining the distance b along the center of the circulatory lane, for roadway right edge design defined by the: (a) entry and exit radius; (b) design vehicle trajectory.

Figure 4.
Traffic flows at a four-legged roundabout: (a) each entry in each travel direction, in veh/h; (b) entering, exiting, and circulating the roundabout.
Figure 4.
Traffic flows at a four-legged roundabout: (a) each entry in each travel direction, in veh/h; (b) entering, exiting, and circulating the roundabout.

Figure 5.
Base capacity at single-lane roundabouts as a function of outer radius.

Figure 6.
Conflict factor reflecting the impact of exiting traffic on entry capacity by the distance between exiting and entering traffic streams along the center of the circulatory lane.
Figure 6.
Conflict factor reflecting the impact of exiting traffic on entry capacity by the distance between exiting and entering traffic streams along the center of the circulatory lane.

Figure 7.
Calculated values of entering, exiting, and circulating traffic flow in pcu/h.

Figure 8.
Geometric parameters Ri, ej, ej′, and u as a function of Ro for different δ.

Figure 9.
Investigated parameters at leg 1 as a function of Ro for different δ, considering the application of design conditions 1 and 2: (a) geometric parameter b1; (b) traffic parameter xm1.
Figure 9.
Investigated parameters at leg 1 as a function of Ro for different δ, considering the application of design conditions 1 and 2: (a) geometric parameter b1; (b) traffic parameter xm1.

Figure 10.
Investigated parameters at leg 2 as a function of Ro for different δ, considering the application of design conditions 1 and 2: (a) geometric parameter b2; (b) traffic parameter xm2.
Figure 10.
Investigated parameters at leg 2 as a function of Ro for different δ, considering the application of design conditions 1 and 2: (a) geometric parameter b2; (b) traffic parameter xm2.

Figure 11.
Investigated parameters at leg 3 as a function of Ro for different δ, considering the application of design conditions 1 and 2: (a) geometric parameter b3; (b) traffic parameter xm3.
Figure 11.
Investigated parameters at leg 3 as a function of Ro for different δ, considering the application of design conditions 1 and 2: (a) geometric parameter b3; (b) traffic parameter xm3.

Figure 12.
Investigated parameters at leg 4 as a function of Ro for different δ, considering the application of design conditions 1 and 2: (a) geometric parameter b4; (b) traffic parameter xm4.
Figure 12.
Investigated parameters at leg 4 as a function of Ro for different δ, considering the application of design conditions 1 and 2: (a) geometric parameter b4; (b) traffic parameter xm4.

Figure 13.
The average difference between b1, b2, and b3 for δ = 90° and b1, b2, and b3 for δ = 85°, 80°, and 75°.
Figure 13.
The average difference between b1, b2, and b3 for δ = 90° and b1, b2, and b3 for δ = 85°, 80°, and 75°.

Figure 14.
Results of the reversed calculation of traffic flow—the difference in traffic flow values shown as the percentage of the initial 1800 veh/h.
Figure 14.
Results of the reversed calculation of traffic flow—the difference in traffic flow values shown as the percentage of the initial 1800 veh/h.


Table 1.
List of symbols used in the manuscript.
| Group | Symbol | Parameter |
|---|---|---|
| Geometric parameters | Ro | outer radius (m) |
| Ri | central island radius (m) | |
| u | circulatory roadway width (m) | |
| j | number of roundabout legs, j = 1, …, 4 | |
| δ | angle between the roundabout legs (°) | |
| l | length of the arc between the adjacent roundabout legs (m) | |
| ej | entry width (m) | |
| ej′ | exit width (m) | |
| Rj | entry radius (m) | |
| Rj+1′ | exit radius (m) | |
| bj | distance between exiting and entering traffic flows along the center of the circulatory lane (m) | |
| Traffic parameters | i | direction of travel through roundabout, i = 1, …, 12 |
| qi | traffic flow in the direction i (veh/h) | |
| Qi | traffic flow in passenger car units in the direction i (pcu/h) | |
| fT | conversion factor for traffic composition (pcu/veh) | |
| QCj | circulating traffic flow (pcu/h) | |
| QSj | exiting traffic flows at leg j (pcu/h) | |
| QEj | entering traffic flows at leg j (pcu/h) | |
| BCj | base entry capacity of the roundabout at leg j (pcu/h) | |
| fP | capacity reduction factor for pedestrian and cycling traffic flow at roundabouts (-) | |
| CEj | entry capacity at leg j (pcu/h) | |
| Cmj | entry capacity for mixed traffic flow at leg j (veh/h) | |
| qmj | mixed traffic flow at leg j (veh/h) | |
| xmj,A | degree of saturation of entry at leg j according to analytical model (-) | |
| xmj,R | degree of saturation of entry at leg j according to regression model (-) | |
| α | factor reflecting the impact of exiting traffic on entry capacity by distance b (-) | |
| β | factor for adjusting circulating flow depending on the number of circulating lanes (-) | |
| γ | factor for adjusting entry capacity depending on the number of circulating lanes (-) |
Table 2.
Calculation of entering, exiting, and circulating traffic flow.
| Leg j | QEj (pcu/h) | QSj (pcu/h) | QCj (pcu/h) |
|---|---|---|---|
| 1 | QE1 = Q1 + Q2 + Q3 | QS1 = Q4 + Q8 + Q12 | QC1 = Q7 + Q10 + Q11 |
| 2 | QE2 = Q4 + Q5 + Q6 | QS2 = Q3 + Q7 + Q11 | QC2 = Q1 + Q2 + Q10 |
| 3 | QE3 = Q7 + Q8 + Q9 | QS3 = Q2 + Q6 + Q10 | QC3 = Q1 + Q4 + Q5 |
| 4 | QE4 = Q10 + Q11 + Q12 | QS4 = Q1 + Q5 + Q9 | QC4 = Q4 + Q7 + Q8 |
Table 3.
Overview of two roundabout design conditions’ fulfillment (marked with +): Condition 1 (l ≥ 20 m)/Condition 2 (Rj+1 ≥ Rj + 2 m).
Table 3.
Overview of two roundabout design conditions’ fulfillment (marked with +): Condition 1 (l ≥ 20 m)/Condition 2 (Rj+1 ≥ Rj + 2 m).
| Ro (m) | 13.0 | 13.5 | 14.0 | 14.5 | 15.0 | 15.5 | 16.0 | 16.5 | 17.0 | 17.5 | 18.0 | 18.5 | 19.0 | 19.5 | 20.0 |
|---|---|---|---|---|---|---|---|---|---|---|---|---|---|---|---|
| δ = 90° | +/+ | +/+ | +/+ | +/+ | +/+ | +/+ | +/+ | +/+ | +/+ | +/+ | +/+ | +/+ | +/+ | +/+ | +/+ |
| δ = 85° | −/+ | +/+ | +/+ | +/+ | +/+ | +/+ | +/+ | +/+ | +/+ | +/+ | +/+ | +/+ | +/+ | +/+ | +/+ |
| δ = 80° | −/− | −/− | −/− | +/− | +/− | +/− | +/− | +/+ | +/+ | +/+ | +/+ | +/+ | +/+ | +/+ | +/+ |
| δ = 75° | −/− | −/− | −/− | −/− | −/− | +/− | +/− | +/− | +/− | +/− | +/− | +/− | +/+ | +/+ | +/+ |
Disclaimer/Publisher’s Note: The statements, opinions and data contained in all publications are solely those of the individual author(s) and contributor(s) and not of MDPI and/or the editor(s). MDPI and/or the editor(s) disclaim responsibility for any injury to people or property resulting from any ideas, methods, instructions or products referred to in the content. |
© 2023 by the authors. Licensee MDPI, Basel, Switzerland. This article is an open access article distributed under the terms and conditions of the Creative Commons Attribution (CC BY) license (https://creativecommons.org/licenses/by/4.0/).
Share and Cite
MDPI and ACS Style
Čudina Ivančev, A.; Ahac, M.; Ahac, S.; Dragčević, V. Comparison of Single-Lane Roundabout Entry Degree of Saturation Estimations from Analytical and Regression Models. Algorithms 2023, 16, 164. https://doi.org/10.3390/a16030164
AMA Style
Čudina Ivančev A, Ahac M, Ahac S, Dragčević V. Comparison of Single-Lane Roundabout Entry Degree of Saturation Estimations from Analytical and Regression Models. Algorithms. 2023; 16(3):164. https://doi.org/10.3390/a16030164
Chicago/Turabian StyleČudina Ivančev, Ana, Maja Ahac, Saša Ahac, and Vesna Dragčević. 2023. "Comparison of Single-Lane Roundabout Entry Degree of Saturation Estimations from Analytical and Regression Models" Algorithms 16, no. 3: 164. https://doi.org/10.3390/a16030164
Note that from the first issue of 2016, this journal uses article numbers instead of page numbers. See further details here.