Article

Learning Distributed Representations and Deep Embedded Clustering of Texts

1
School of Computing, Macquarie University, Sydney, NSW 2109, Australia
2
School of Computer Science and Engineering, Southeast University, Nanjing 211189, China
3
ITIC Pty Ltd., Sydney, NSW 2000, Australia
4
The Graduate School of Biomedical Engineering, UNSW, Sydney, NSW 2052, Australia
*
Authors to whom correspondence should be addressed.
Algorithms 2023, 16(3), 158; https://doi.org/10.3390/a16030158
Submission received: 27 January 2023 / Revised: 23 February 2023 / Accepted: 8 March 2023 / Published: 13 March 2023
(This article belongs to the Special Issue Nature-Inspired Algorithms in Machine Learning)

Abstract

:
Instructors face significant time and effort constraints when grading students’ assessments on a large scale. Clustering similar assessments is a unique and effective technique that has the potential to significantly reduce the workload of instructors in online and large-scale learning environments. By grouping together similar assessments, marking one assessment in a cluster can be scaled to other similar assessments, allowing for a more efficient and streamlined grading process. To address this issue, this paper focuses on text assessments and proposes a method for reducing the workload of instructors by clustering similar assessments. The proposed method involves the use of distributed representation to transform texts into vectors, and contrastive learning to improve the representation that distinguishes the differences among similar texts. The paper presents a general framework for clustering similar texts that includes label representation, K-means, and self-organization map algorithms, with the objective of improving clustering performance using Accuracy (ACC) and Normalized Mutual Information (NMI) metrics. The proposed framework is evaluated experimentally using two real datasets. The results show that self-organization maps and K-means algorithms with Pre-trained language models outperform label representation algorithms for different datasets.

1. Introduction

Over the past years, different solutions have been proposed to reduce instructors’ workload and facilitate the interaction between teachers and students [1]. An early example of such a technique is one-to-one interaction models, which are well suited for courses with a small number of students. However, assessment clustering becomes challenging when large classes with hundreds of students, or massive online open online courses, are involved. Accordingly, reducing instructors’ workloads in the above situations becomes important in educational systems. To address this challenge, Artificial Intelligence (AI) has been used in intelligent tutoring systems to cluster similar texts. Examples of such systems can be seen in computer science courses, programming courses, or detecting plagiarism [2,3].
Unsupervised clustering is an important research topic in data science, machine learning and artificial intelligence. It has been used in a wide range of applications, ranging from document analysis [4] to image retrieval [5], for various systems. During the past few decades, a lot of clustering algorithms have been proposed, such as Kmeans [6], Gaussian mixture model [5], and Self Organising Map (SOM) [7]. Although unsupervised clustering algorithms have been studied widely, the performance of these traditional clustering methods generally deteriorate when the data dimensionality is high, due to unreliable similarity metrics. The assumptions underlying the dimensionality reduction techniques are generally independent of the assumptions of the clustering techniques, which is known as the curse of dimensionality. To solve this problem, a common way is to transform data from high dimensionality to lower dimensionality by applying dimension reduction techniques, like principle component analysis (PCA) [8] or feature selection methods [9]. Then, clustering is performed in the lower dimensional feature space. However, this scheme ignores the interconnection between feature learning and clustering. To address this issue, with the development of deep learning, such feature transformation can be achieved by using Deep Neural Networks (DNNs), referred to as deep clustering. There are two different stages for deep clustering, representation and clustering, which can be combined by two strategies. On the one hand, the clustering stage can be adopted after the representation stage [10]. On the other hand, the representation and clustering stages can be jointly combined [11].
Deep Embedded Clustering (DEC) [12] has been proposed to improve the deep feature representation results by simultaneously learning feature representations and cluster assignments. However, DEC does not make use of prior knowledge to guide the learning process. Semi-supervised Deep Embedded Clustering (SDEC) is proposed to overcome this limitation [13,14]. Some pioneering work proposes to simultaneously learn embedded features and perform clustering by explicitly defining a clustering-oriented loss. Though promising performance has been demonstrated in various applications, a vital ingredient has been overlooked, which is that the defined clustering loss may corrupt feature space. This, then, leads to non-representative meaningless features, and this, in turn, hurts clustering performance. To address this issue, an Improved Deep Embedded Clustering (IDEC) algorithm is proposed to take care of data structure preservation [15].
To cluster similar features, the Kmeans clustering algorithm was used in [12,13,15]. Although Kmeans is a simple and effective clustering algorithm, it is especially sensitive to the choice of K and the initial starting conditions [16]. With its natural property of the neural network, SOM can solve these problems. When combining the Kmeans algorithm with representation, the centres are determined which cannot adjust when training [12,13,15]. This kind of alternation learning method would suffer from the error accumulated during the alternation between the stages of representation learning and clustering, which results in sub-optimal clustering performance. Moreover, the aforementioned methods can only deal with offline tasks, i.e., the clustering is based on the whole dataset, which limits their application on large-scale online learning scenarios [17]. To conquer the aforementioned offline limitation, a one-stage online deep clustering method called Contrastive Clustering is proposed [17,18].
In this paper, we present a novel model by considering the contrastive learning loss and clustering loss to enable learning distributed representations of assessments with deeply embedded clustering to cluster similar assessments. Compared to  [19,20], we propose using Pre-trained language models (PLMs) to represent assessment content as vectors because PLMs have been shown to be effective in improving natural language processing (NLP) tasks [21,22]. Specifically, we use BERT (Bidirectional Encoder Representation from Transformers) [23] for this purpose. In this context, Instance-wise Contrastive Learning (Instance-CL) has recently achieved remarkable success in self-supervised learning. Supervised Contrastive Learning (SCL) [24] term fine-tuned to the objective can significantly improve the performance on natural language understanding tasks from the GLUE benchmark [25]. Compared to  [12,13,15], the effectiveness of SCL is studied in this paper. How to use SCL, however, can be challenging to cluster assessments. To address these challenges, we propose a general clustering framework that transforms assessments into vectors in terms of SCL loss and clustering assessments. The major contributions of the paper are summarized as follows:
  • A deep embedding strategy is used jointly to cluster similar texts, which can improve the representation of texts.
  • A loss, based on supervised contrastive learning and Kullback Leibler (KL) divergence [15], is used on clustering texts, which can not only cluster similar texts, but also distinguish the difference in a cluster.
  • A general framework for clustering is proposed, which compares different clustering algorithms. SOM is first combined with deep representation. The results show the effectiveness of our proposed models in clustering texts which can significantly reduce instructor workload in marking assessments.
The rest of the paper is organized as follows. In Section 2, we discuss the related work, and in Section 3 we detail the problem descriptions and proposed models. The general framework is proposed in Section 4. Finally, the experimental results are reported in Section 5, followed by conclusions and future research directions in Section 6.

2. Related Work

To reduce instructors’ workload, a series of text techniques such as text mining [26,27,28,29], text clustering [12,13,15], and text representation [23,30] were studied. Natural language processing (NLP) has been used widely in different applications. Neural models have become a dominant approach in NLP. For encoding texts, bi-directional LSTMs (BiLSTMs) [30] have been a dominant method among various neural networks, in terms of state-of-the-art studies in language modeling [31], machine translation [32], syntactic parsing [33] and question answering [34]. Sequential information flow for LSTM leads to relatively weaker power in capturing long-range dependencies, which results in lower performance during encoding longer sentences. To solve the problem, the sentence similar function was studied, based on word2vector similar elements [35], while word2vector only represented static word information. Sentence2vector considers information in a sentence while it ignores the information in assessments. Pre-trained BERT is easily fine-tuned with an additional output layer to create a state-of-the-art model for a wide range of tasks which suggests that BERT representations are potential universal text embedding. BERT [23] was applied to short answer grading. A python-based RESTful service, that utilizes the BERT model for text embedding, and Kmeans clustering, to identify sentences closest to the centroid for summary selection [36,37,38], provides students with a utility that could summarize lecture content, based on the desired number of sentences. A Sentence-BERT (SBERT), a modification of the pre-trained BERT network, that uses siamese and triplet network structures, was proposed to derive semantically meaningful sentence embedding that can be compared using cosine-similarity [39].
Deep Embedded Clustering. To improve the representation performance for clustering, there are two categories of deep clustering algorithms in existing studies: (i) clustering applied after having learned a representation, and (ii) approaches jointly optimized by feature learning and clustering. The first category of algorithms takes advantage of existing unsupervised deep learning frameworks and techniques. For example, autoencoder is used to learn low dimensional features of an original graph [40], and then runs the Kmeans algorithm to get clustering results [41]. A clustering loss is defined in the second category of algorithms, which simulates classification error in supervised deep learning. DEC [12] learns a mapping from the observed space to a low-dimensional latent space with deep neural networks, which can obtain feature representations and cluster assignments simultaneously and starts with pre-training an autoencoder and then removing the decoder. Existing deep embedded clustering algorithms only consider Kmeans algorithms and only work for offline tasks [17]. To solve this problem, the SOM algorithm was used in this paper, which has never before been considered for text representation in existing studies.
SOM Algorithms. SOM has the special property of effectively creating spatially organized internal representations of various features of input signals and their abstractions [42]. SOM is an automatic data analysis method that is widely applied to clustering problems and data exploration in industry, finance, natural sciences, and linguistics [43,44]. A SOM-similar network is designed to simultaneously implement encoding and clustering purposes on data samples, which are jointly trained with a Generative Adversarial Network (GAN) to optimize a newly defined clustering loss [45]. Principal Component Analysis (PCA) was combined with a SOM to determine the pull-off adhesion between concrete layers [46]. SOM algorithms have been used widely to cluster similar tasks [19,20,47]. However, there are no existing studies that combine SOM with BERT in text representation and clustering.
Contrastive Learning. Contrastive learning has recently become a dominant component in self-supervised learning for natural language processing. It aims to embed augmented versions of the same sample close to each other, while trying to distinguish embedding from different samples [48,49]. Therefore, different instances are isolated in the learned embedding space with local invariance, which is preserved for each instance. Contrastive learning at a particular instance, considers the level  [48,49] while performing, whereas the method simultaneously conducts contrastive learning at both the instance- and cluster-level following the observation of label as representation [17]. Existing works aimed to learn a general representation, which is off-the-shelf for the downstream tasks. On the contrary, the method is specifically designed for clustering, which could be the first successful attempt at task-specified contrastive learning. In this paper, contrastive learning loss was first used on clustering texts with SOM, which has never before been considered in existing studies [23,50,51,52,53,54].
In this paper, we first combine text representation and contrastive learning with SOM algorithms in deep-embedded clustering, which has never been considered in the existing studies.

3. Problem Description and the Models

In this section, we first describe problem definitions and model building blocks. After that, contrastive learning is used to improve the performance of deep clustering.

3.1. Problem Description

The task in this paper is to cluster texts automatically. Formally, there are different texts, and our model should output the clustering result for it. To cluster similar assessments, BERT was studied to transform texts into vectors. To improve deep feature representations, a deeply embedded clustering technique was adopted. To improve the performance on clustering, Kullback Leibler (KL) divergence [15] and contrastive learning loss were calculated simultaneously.

3.2. The Framework

To cluster similar texts, the overall framework of our proposed model is shown in Figure 1. Firstly, the texts are represented as vectors PLMs. After that, the clustering technique is used to cluster vectors without the pre-defined number of clusters. To improve the representation performance, contrastive instances for texts are generated by vector representation models. For example, assume that there is assessment evaluation for the topic “Environmental protection” in a middle school. There are hundreds of assessments to mark which is a huge workload for instructors. To solve the problem, these assessments are first processed by the data augmentation technique, which can increase the diversity of an assessment. The contrastive learning loss is calculated either after vector representation or clustering, which improves the representation in future.
In this paper, we used pre-trained BERT [55] to represent words and sentences in the given answers. We also explored the usage of the BiLSTM model [30] for learning word-level and sentence-level information when we had few resources to fine-tune the whole BERT model. The procedure of text clustering, including representation and clustering, is shown in Figure 2.

Vector Representation

BERT. In the input, BERT adds a special leading token [cls] at the beginning of the input text (e.g., [cls] Artificial Intelligence is useful in education). The [cls] is used for sentence-level classification tasks during its pre-training stage, and its corresponding hidden vector is used as the sentence-level representation. All input tokens are represented as the additive combination of word embedding and positional embedding. Its core module is multi-head self-attention [56], where input tokens are represented as queries ( Q i = X W i Q ), keys ( K i = X W i K ) and values ( V i = X W i V ) in the ith head. We have:
SelfAttention ( Q i , K i , V i ) = s o f t m a x ( Q i K i T d i k ) V i
MultiHead ( Q , K , V ) = cat ( S e l f A t t e n t i o n ( Q i , K i , V i ) ) W C
where W i Q d × d i k , W i K d × d i k , W i V d × d i v W C i = 1 N h d i v × d are the trainable parameters. Finally, BERT has residual connection followed by layer-normalization [57]. A fully connected feed-forward network is applied to the matrix Z 1 as follows
F F ( Z 1 ) = m a x ( 0 , Z 1 W 1 F + b 1 F ) W 2 F + b 2 F
where W 1 F , b 1 F , W 2 F , b 2 F are parameter matrices. After feed-forward, Add&Norm is reused in the layer.
BERT performs well in transforming texts to vectors, although it consumes lots of server resources. To solve the problem, DistilBERT was adopted in this paper, which has the same general architecture as BERT [39]. The token-type embedding and the pooler are removed, while the number of layers is reduced by a factor of 2. Most of the operations used in the Transformer architecture (linear layer and layer normalization) are highly optimized in modern linear algebra frameworks and our investigations showed that variations on the last dimension of the tensor (hidden size dimension) had a smaller impact on computation efficiency (for a fixed parameter budget) than variations on other factors, like the number of layers.

3.3. Contrastive Learning

Contrastive learning aims to maximize the similarities of positive pair instances, and it can maximize the difference of negative pair ones. The characteristics of pair instances are defined by various rules. For example, when the pairs are within the same class, it is a positive pair. Otherwise, it is a negative pair. In this paper, the positive and negative pairs were constructed at the instance-level by data augmentations and embedding. In addition, the positive pairs consisted of samples either augmented or embedded from the same instance, while the negative pairs were from different instances.
Considering a mini-batch S, the instance contrastive learning loss is defined in terms of the augmented pairs S a , while for a mini-batch S v , the instance contrastive learning loss is defined in terms of the representation vectors. i { 1 , , M } is denoted as the index of an arbitrary instance in set S. j { 1 , , M } is the index of the other instance in S a augmented from the same instance in the original set S. For pairs ( x i , x j a ) , there are 2M pairs in total. For a specific sample x i S , there are 2M-1 pairs in total where ( x i , x i a ) is a positive pair and others are negative pairs. Similarly, x j v { 1 , , 2 M } is the embedding sample of the other instance in S v embedded from the same instance in the original set S. To alleviate the information loss induced by contrastive loss, we did not directly conduct contrastive learning on the feature matrix. Let z i and z j be the corresponding outputs of the head g, i.e., z i = g ( φ ( x i ) ) , j = i 1 , i 2 . Then, for x i 1 , we tried to separate x i 2 apart from all negative instances in S a by minimizing the following applied. The pair-wise similarity was measured by cosine distance:
s ( z i , z j ) = z i T z j | | z i | | 2 | | z j | | 2
To optimize pair-wise similarities, without loss of generality, the loss for a given sample x i a is described as follows  [17]:
l o s s i c o = l o g e x p ( s ( z i , z i 1 ) · τ 1 ) j = 1 N 1 j i · e x p ( s ( z i , z j ) · τ 1 )
where τ is the temperature parameter which controls the scale of the difference. According to Equation (5) and the mini-batch S, the contrastive loss is calculated using:
l o s s c o = i = 1 S l o s s i c o S

3.4. Clustering

To cluster similar instances together, there are different methods, such as Label as representation and Kmeans algorithm in existing studies for deeply embedded clustering. Label as representation is defined when projecting a data sample into a space where the dimensionality equals the number of clusters with the ith element interpreted as the probability of belonging to the ith cluster, and the feature vector denotes its soft label accordingly. Kmeans algorithms have been used in  [12,17,36], while the SOM algorithm with BERT has never been used in existing studies.
A Self Organizing Map [42] is a classic unsupervised learning algorithm that follows the principle of topological mapping. The main aim of SOM is to convert input signals of arbitrary dimension into one-dimensional or two-dimensional discrete mapping and the spatial position of the output layer neurons in the topological mapping corresponds to a specific feature of input space. The original idea of SOM is to simulate the way that vision systems work in the human brain, which is used for the organization and visualization of complex data. In general, SOM can capture the topology map structure which distinguishes the distances among different clusters and distribution of the input data to provide a clustering analysis. In this paper, a M × N self-organizing map is constructed. The architecture of SOM includes two layers: the input layer and the Kohonen output layer.
To describe SOM clearly, x is denoted as the input vector, while W i j ( i { 1 , , M } , j { 1 , , N } ) is one of the neurons in the self-organisation map which is a unit vector. In addition, the shape of weights neurons is the same as the input vector z k . To calculate the distance from z k to the weights neurons, z k is reduced to as a unit vector where z k j is described as follows:
z k j = z k j j = 1 d z k j
For each sample z k , the distance d i j from a neurons W i j is calculated by:
d i j = | | z k W i j | | 2
The corresponding neuron which has the minimum distance is called the winner. The rates of the modifications at different nodes depend on the mathematical form of the function h c i ( t ) , which is described as follows [43]:
h c i ( t ) = a ( t ) e x p ( s q d i s t ( c , i ) 2 δ ( t ) )
where α ( t ) is the learning rate at time t, s q d i s t ( c , i ) is the square of the geometric distance between the nodes c and i in the grid, and δ ( t ) is a monotonically decreasing function of t which controls the number of neighborhood nodes.

3.5. Clustering Loss

Suppose our data consists of M × N semantic categories and each category is characterized by its centroid in the M × N representation space, denoted as μ i j ( i { 1 , 2 , , M } , j { 1 , 2 , , N } ) . e j = g ( x j ) is denoted as the representation of the instance x j in the original set S v . According to [58], the student’s t-distribution is used to compute the probability q i j of assigning x j to one of the neurons W i j :
q j i = ( 1 + | | e j μ i | | 2 2 α ) α + 1 2 k = 1 M × N ( 1 + | | e j μ k | | 2 2 α ) α + 1 2
where α denotes the degree of freedom of the Student’s t-distribution and α = 1 by default [58]. According to SOM, the neurons are obtained. The neurons are refined by leveraging an auxiliary distribution proposed by [12]. p j i is denoted as the auxiliary distribution which is described as follows:
p j i = q j i f i i q j i f i
where f i = i = 1 M q j k , k { 1 , , K } is the interpreted as the soft cluster frequencies approximated within a mini-batch. The target distribution first sharpens. The soft-assignment probability q j i is sharpened by raising it to the second power, and it is normalized by the associated cluster frequency. Learning is encouraged between high confidence cluster assignments and the bias which is simultaneously combated by imbalanced clusters.
To optimize the KL divergence between the cluster assignment probability and the target distribution, the cluster loss for each instance is described as follows:
l o s s i c = K L [ p j | | q j ] = i = 1 K p j i l o g p j i q j i
Since mini-batch instances were studied in this paper, the cluster loss for each mini-batch was obtained as follows, in terms of Equation (12):
l o s s c = i = 1 M l o s s i c M
The overall loss function was obtained by Equations (6) and (13) which is described as follows:
l = l o s s c o + l o s s c

4. Algorithms

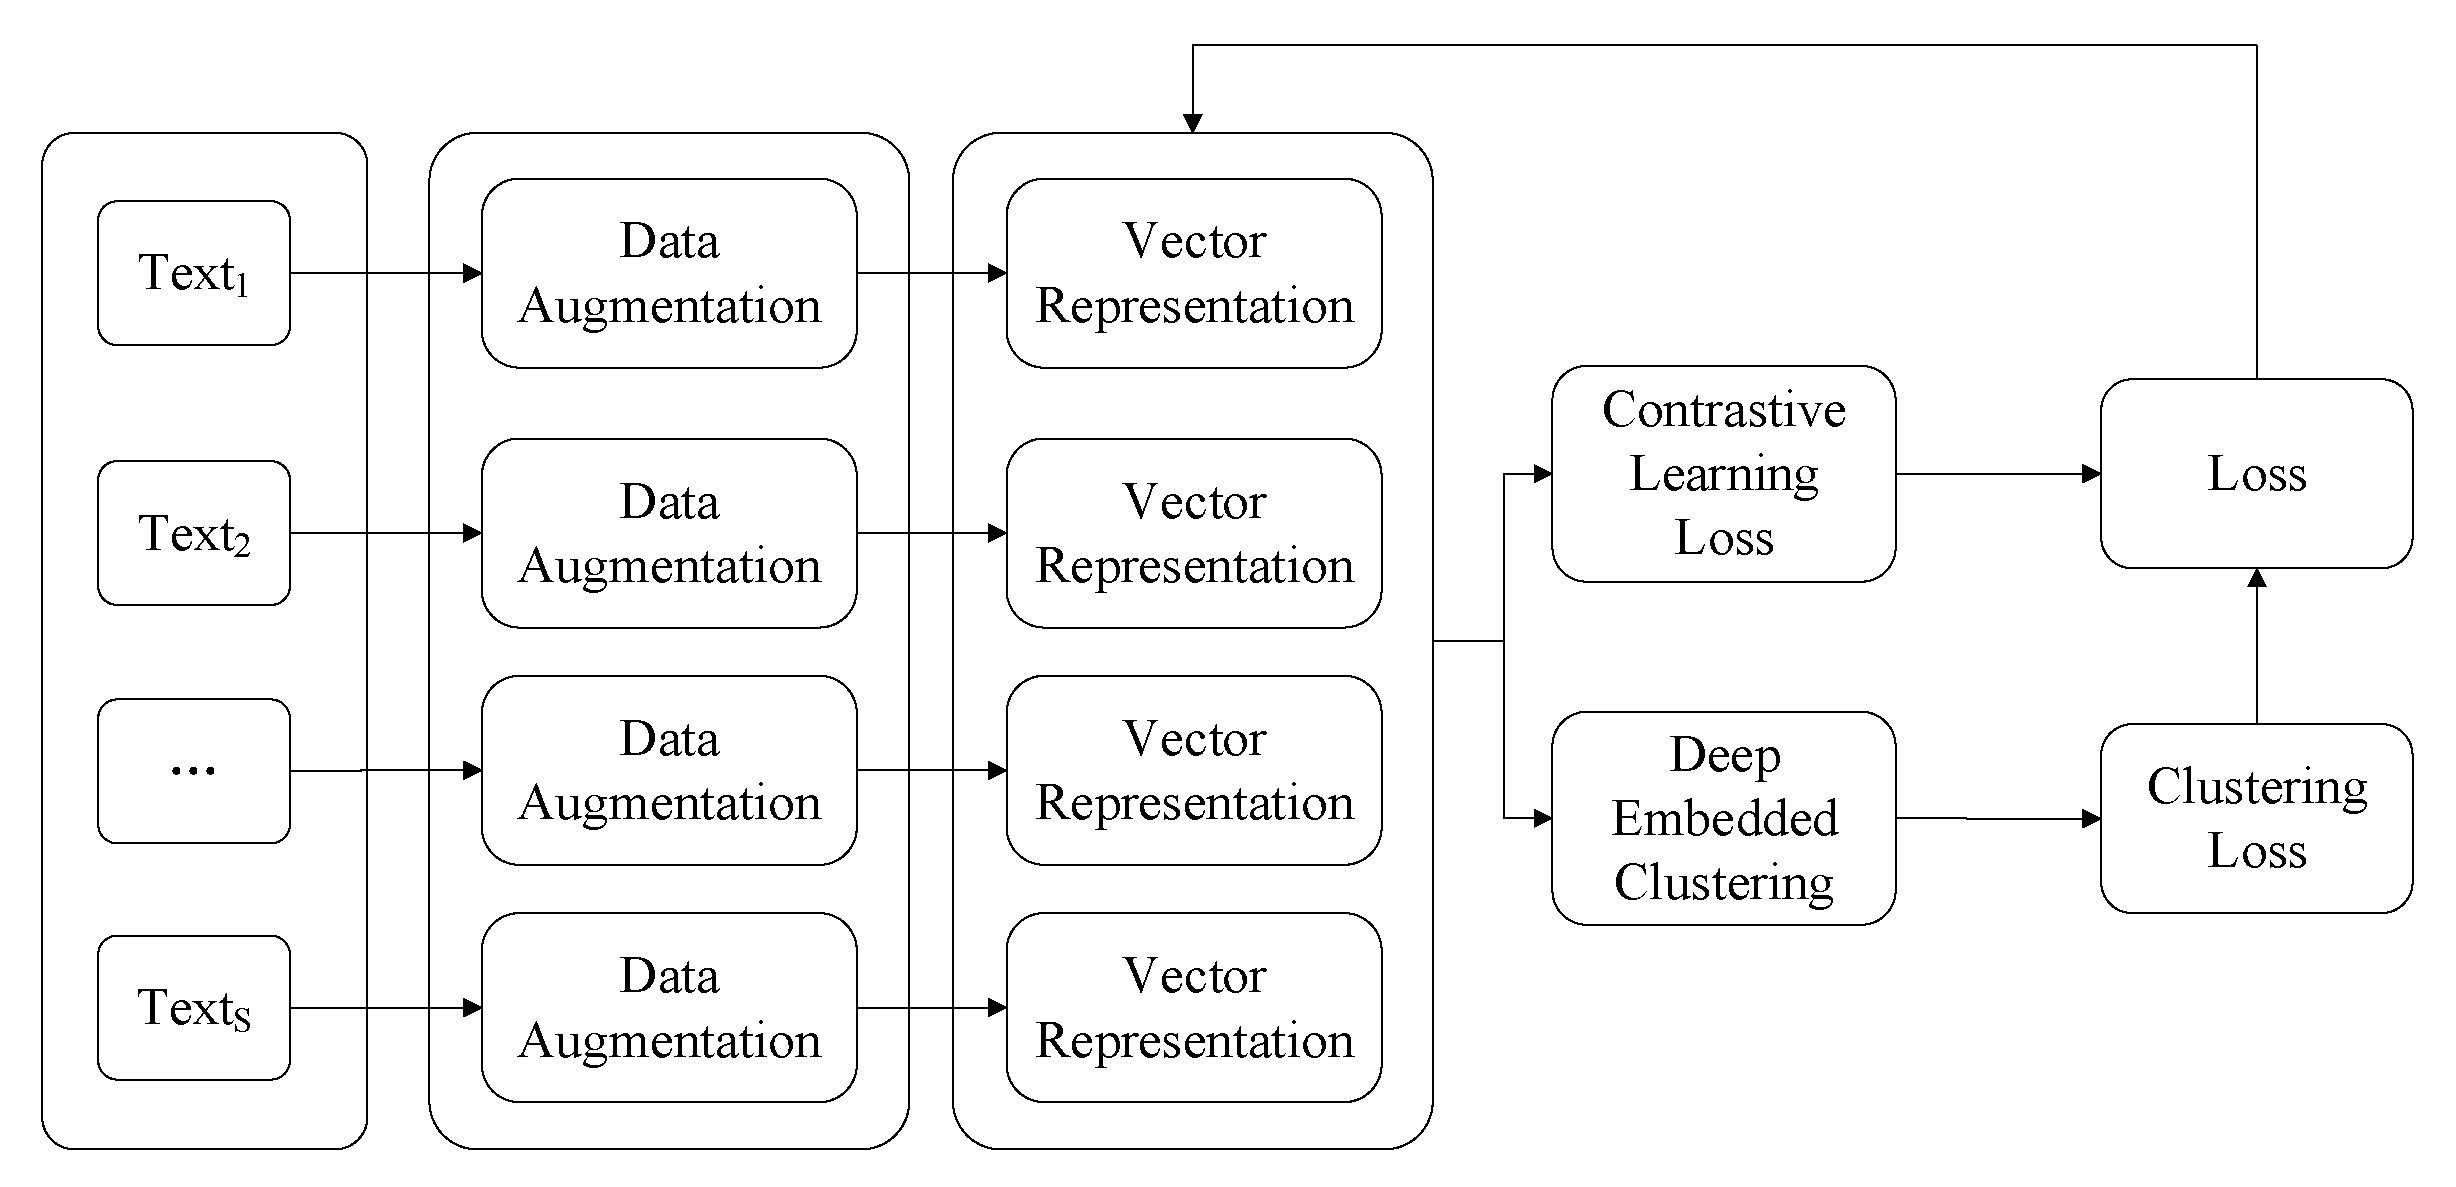
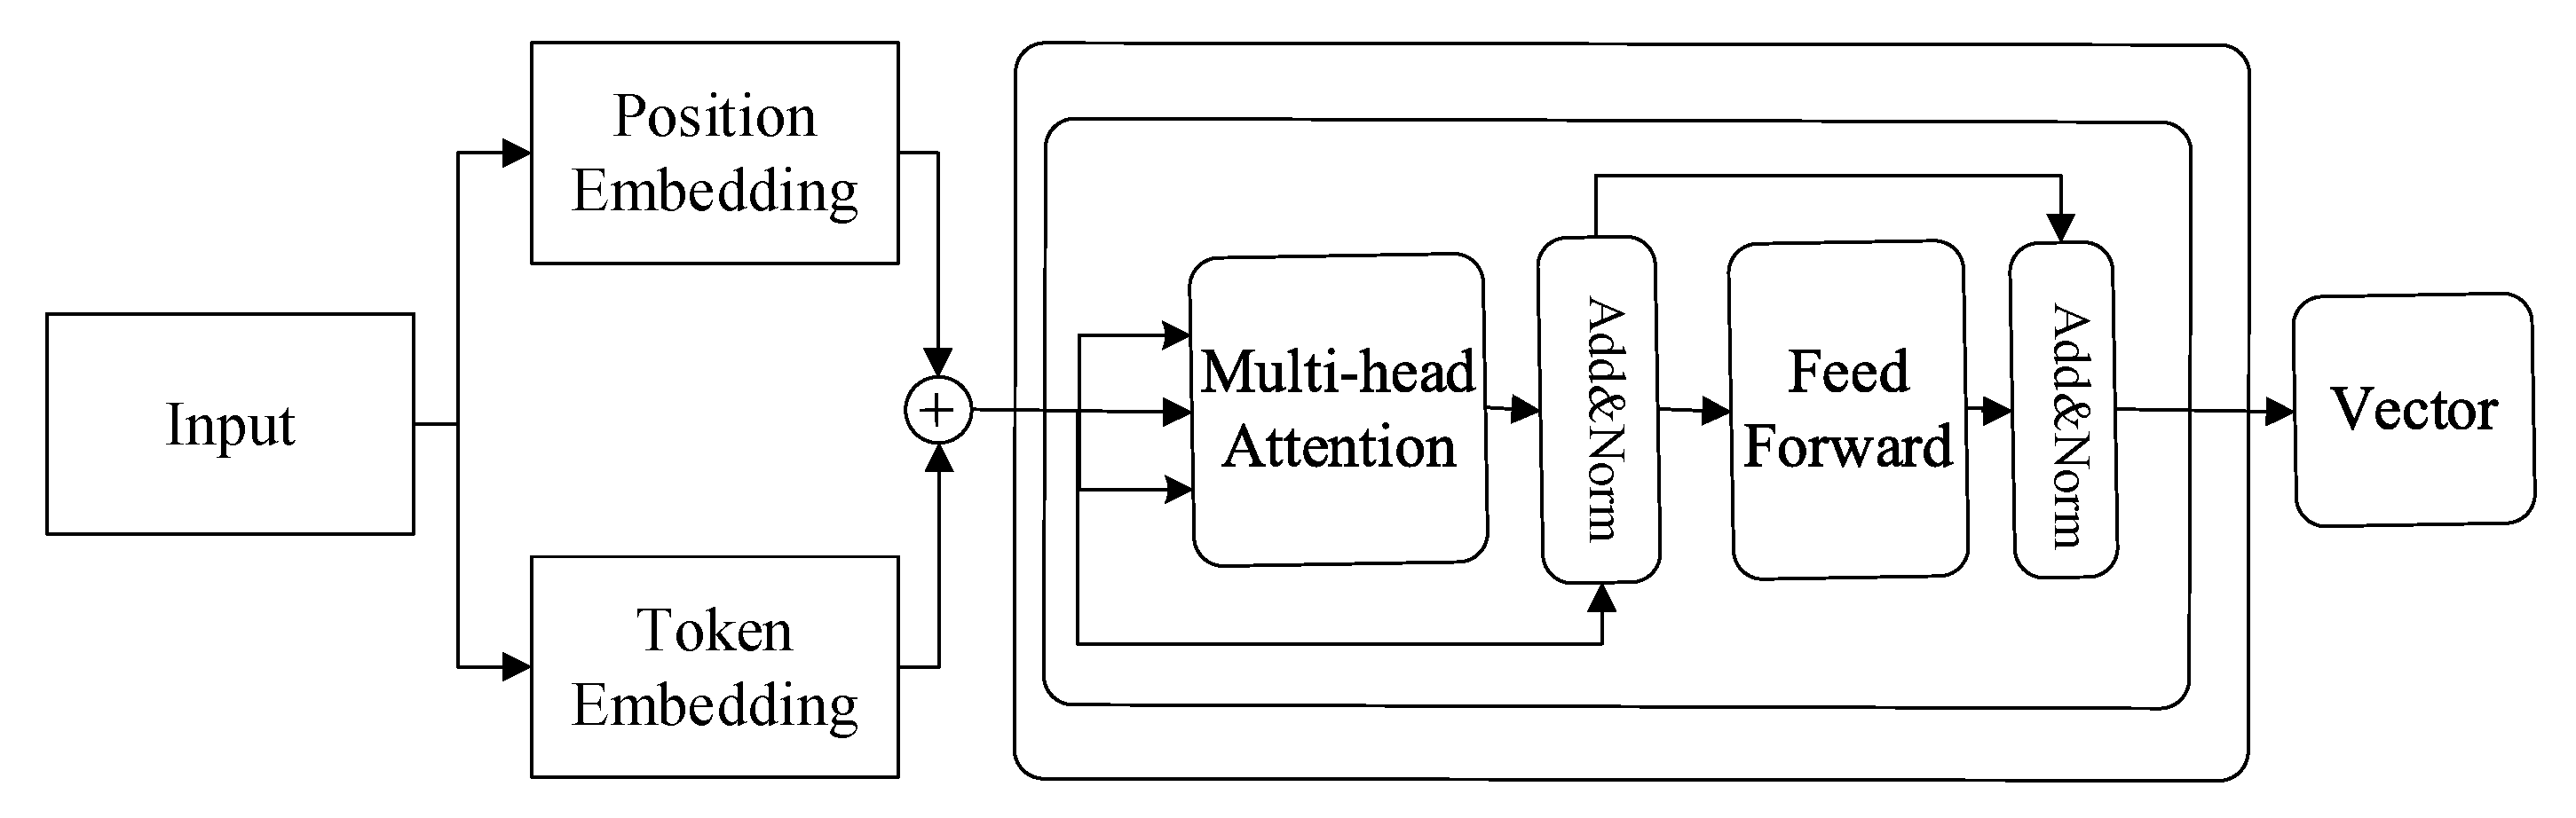
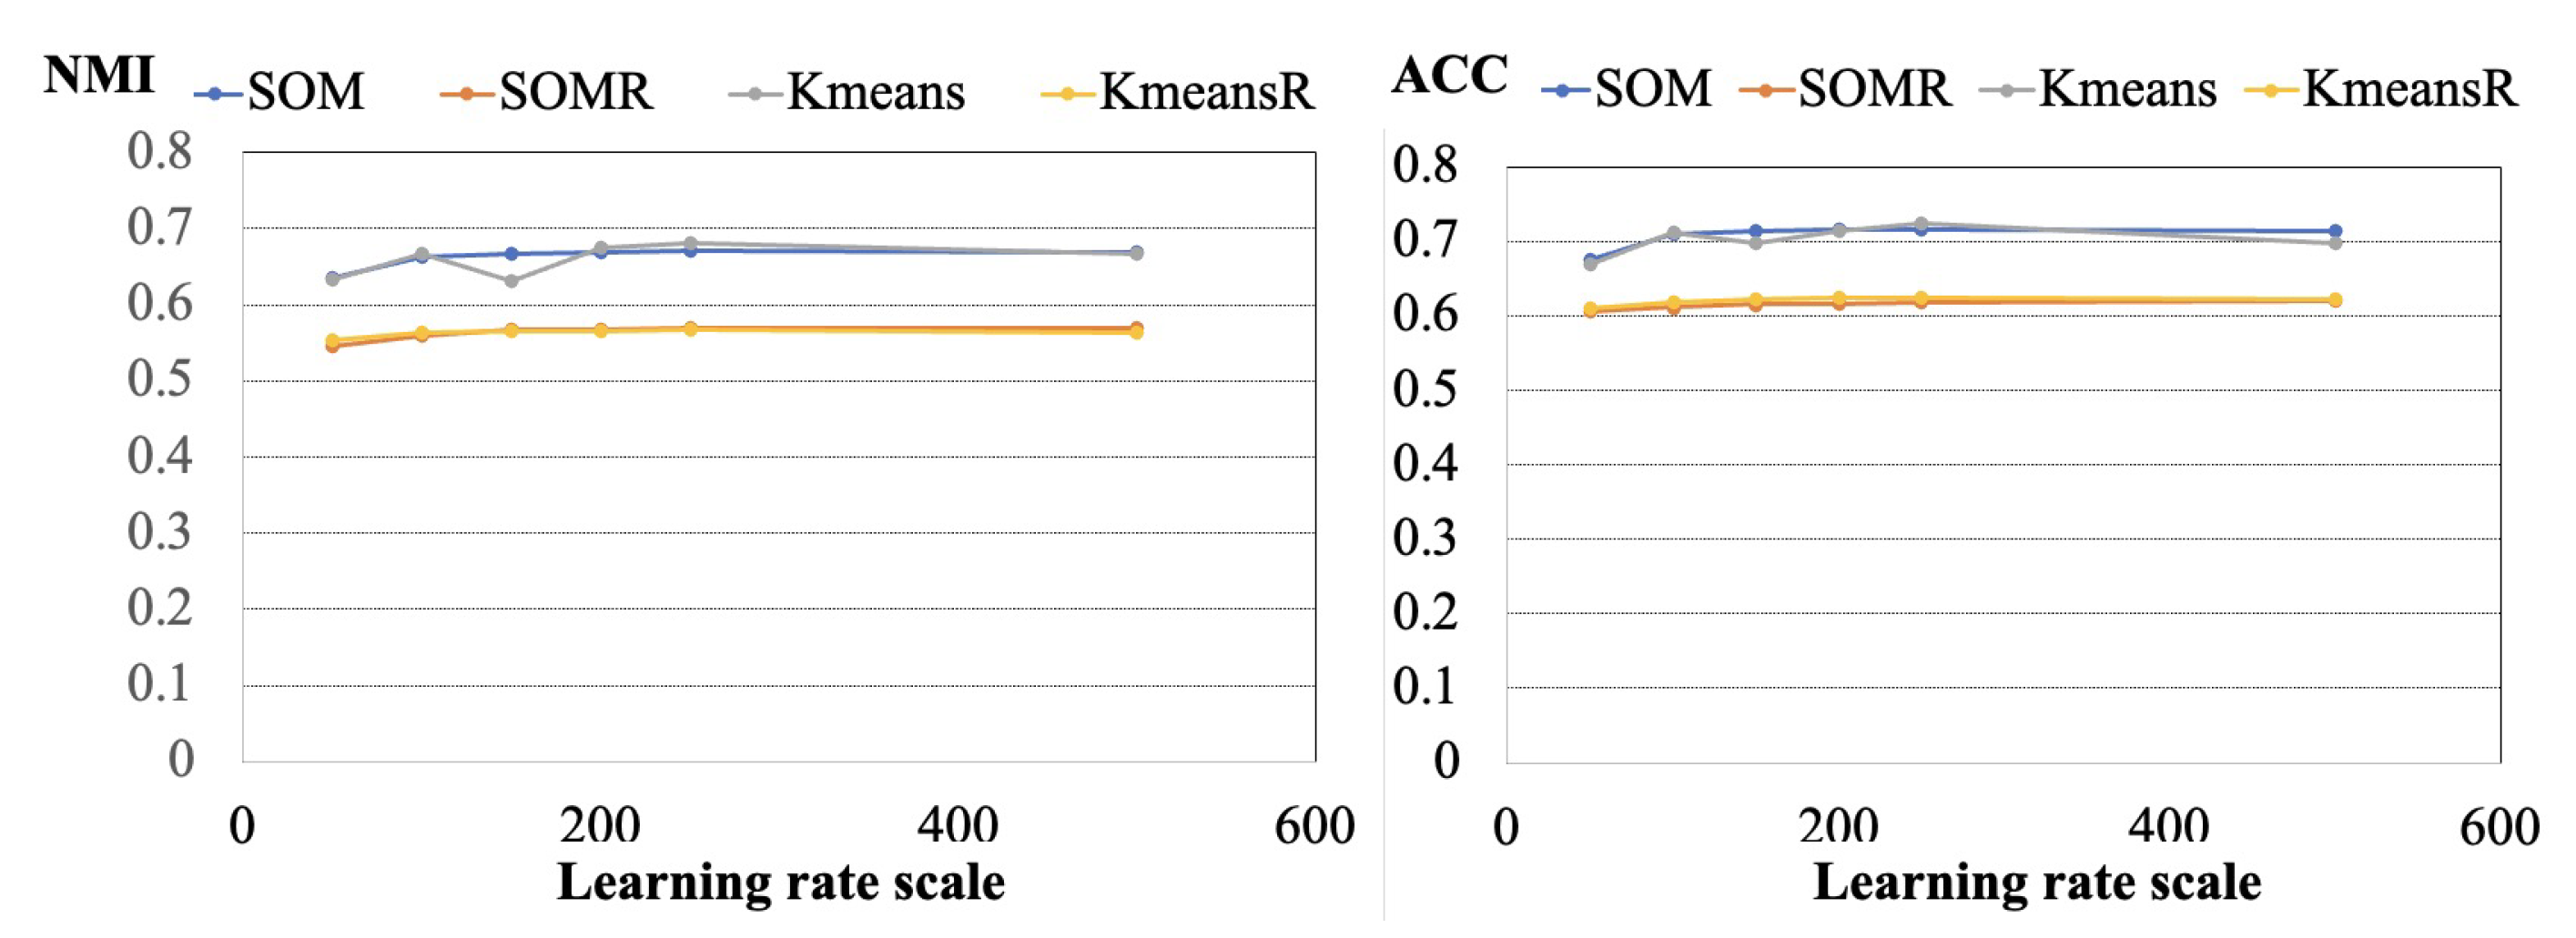
To cluster similar assessments, Distill BERT was first used to transform texts into vectors with a text augmentation technique. After augmentation, contrastive learning and clustering techniques were adopted to cluster similar texts. Since for different clustering algorithms the efficiency is different. We propose three different clustering algorithms with the proposed model. The proposed algorithm framework is described in Algorithm 1. To calculate the efficiency of Algorithm 1, the adopt Accuracy (ACC) and Normalized Mutual Information (NMI) are measured. NMI is calculated by NMI ( Y , C ) = 2 × I ( Y ; C ) H ( Y ) + H ( C ) where Y is the real label, C is the clustering label, H(.) is the cross entropy, and I(.;.) is the mutual information.
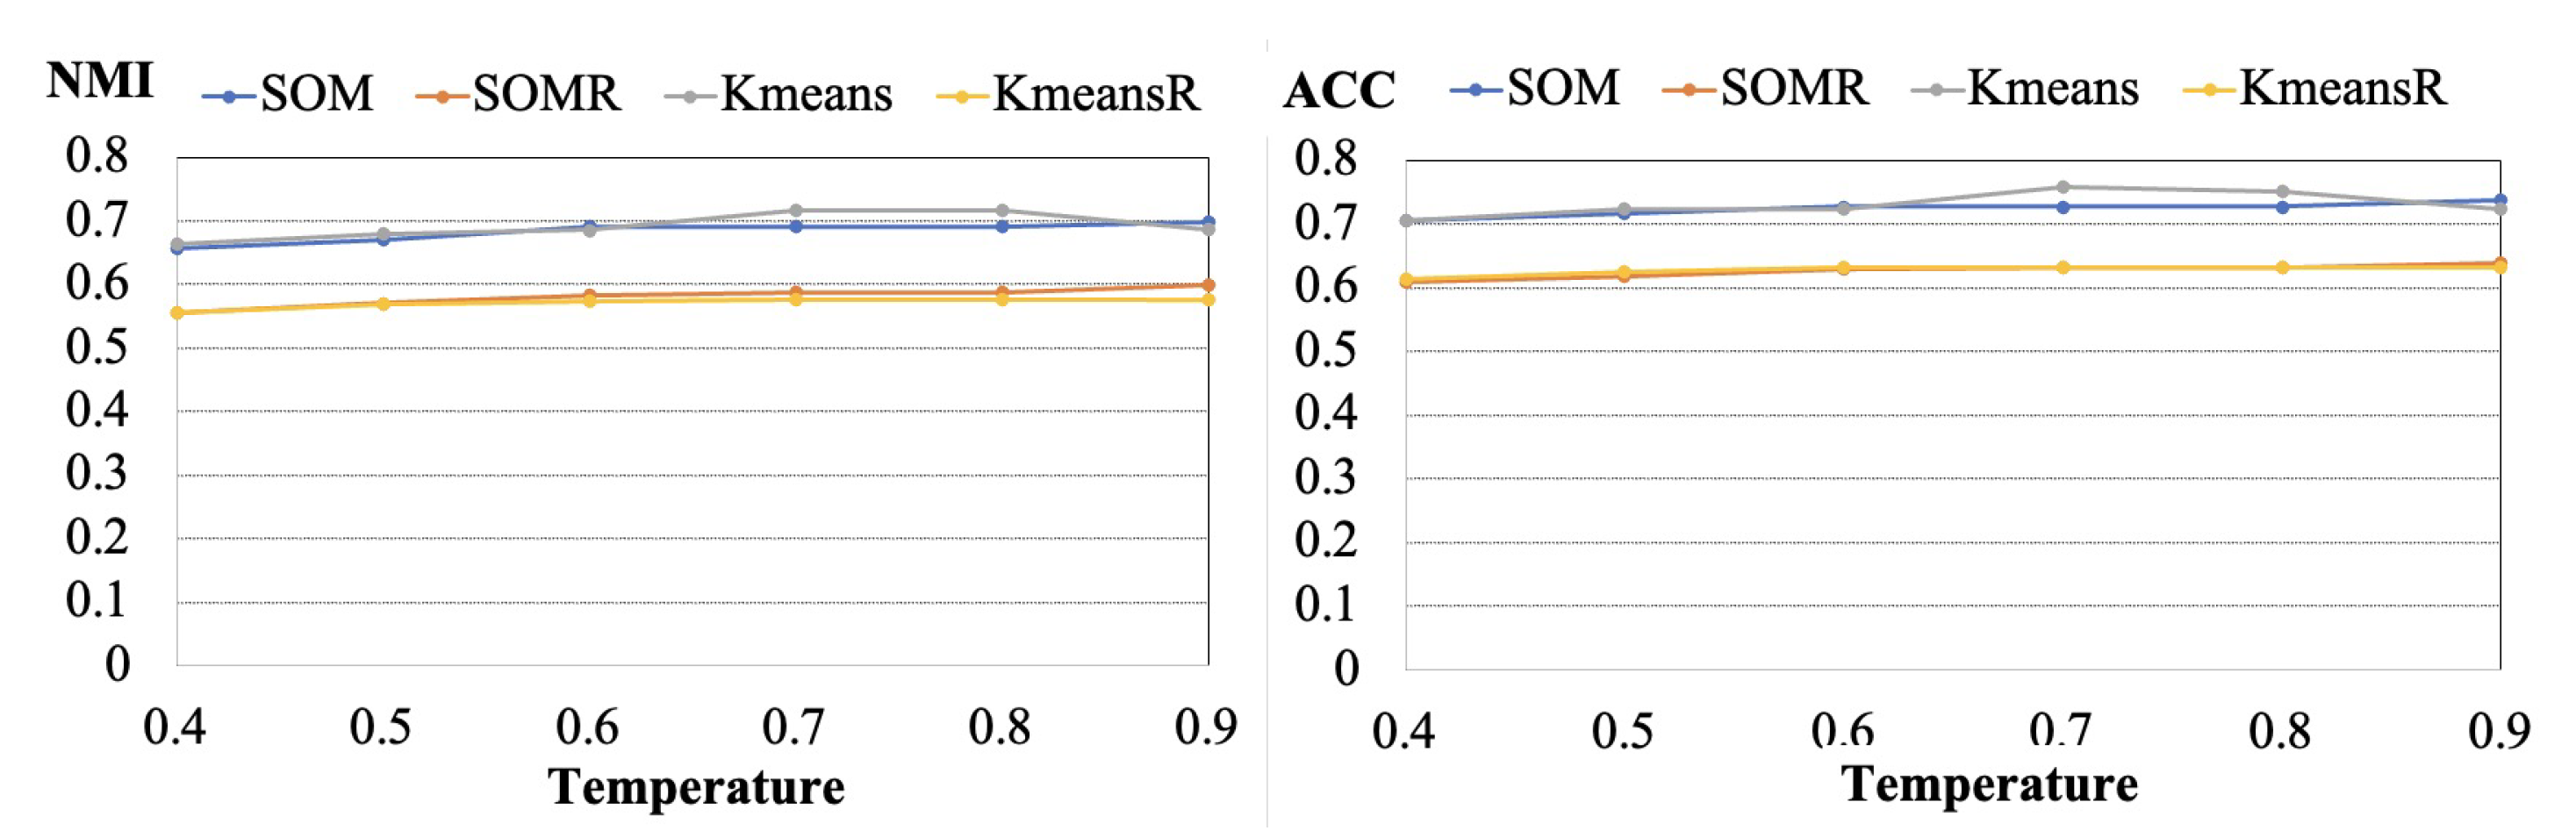
To describe the algorithm framework clearly in Algorithm 1, the input data contains dataset S, training epochs E, temperature τ in contrastive learning and the structure of augmentation, while the output results are ACC and NMI. A mini-batch { x i } of texts is selected from dataset S. For each input sample x i , two random augmentations are generated where x i a = A j S ( x i ) ( j = 1 , 2 ) , which represents a different view of the text and contains some subset of the information in the original sample. x i 1 , x i 2 ( i { 1 , 2 , , | S | } ) are denoted as the augmented text of an assessment x i . After text augmentation, the contrastive loss is calculated according to the temperature τ . Texts are transformed into vectors by DistilBERT. The predicted labels are obtained after the clustering algorithms. By comparing predicted labels to ground truth labels, the clustering loss is calculated. According to the instance loss and clustering loss, the overall loss is obtained. The ACC and NMI metrics are calculated.
The deeply embedded clustering framework is described in Algorithm 1. For vector clustering techniques, there are three different strategies: label as representation, Kmeans algorithm, and SOM algorithm. For label as representation, the dimension of vectors is projected to the number of clusters by multiple neuron networks. The index of the maximum values of the vector is represented as the label of clusters. After all of the vectors are projected to the fixed dimensions, Kmeans and SOM algorithms are used to cluster similar vectors together, respectively. To calculate the clustering centers for the label as representation algorithms, Kmeans and SOM algorithms are adopted, respectively.
The label as a representation algorithm is shown in Algorithm 2. The input of the algorithm is the matrices Z , Z 1 , and Z 2 which are made up of z i , z i 1 , z i 2 ( i { 1 , , | S | } ) where z i , z i 1 , z i 2 are represented by DistilBERT. The labels L , L 1 , L 2 are initialized first. According to the idea of the label as representation, all the represented vectors are projected to K dimensions. The index of the maximum value selects the label for the projected vectors. The time complexity of the Algorithm 2 is O ( K | S | ) .
The Kmeans clustering algorithm is described in Algorithm 3. To describe Algorithm 3 clearly, c 1 , , c k are denoted as the initial centroids. All the vectors in Z are compared with K centroids. The vector with the minimum distance to the centroid c i is assigned to C i . After all the vectors are assigned, new centroids are calculated in terms of new C i ( i { 1 , , K ). The procedure is repeated until the conditions are not satisfied. The label L for Z is obtained with the final centroids. The labels L 1 , L 2 for Z 1 and Z 2 are obtained, similarly. The time complexity for Algorithm 3 is O ( | S | K t ) .
Algorithm 1: Deep Embedded Clustering Framework
Algorithms 16 00158 i001
Algorithm 2: Label as Representation Algorithm
Algorithms 16 00158 i002
The SOM clustering algorithm is described in Algorithm 4. The input data includes parameters M , N for the map, the input matrix Z, the iteration times T, and the parameter α . The weight matrix W is initialized where each raw is a unit vector. To compare the input matrix W to Z, each raw of Z is normalized to a unit vector. By comparing Z to W, the distance from z i to all the neurons is calculated. The neuron with the minimum distance is selected as the winner. The label of z i is determined. The learning rate is updated. After that, h c i ( t ) is calculated by Equation (9) with new δ ( t ) . The weights are updated by the new h c i ( t ) . The procedure is repeated until t = T . The time complexity of Algorithm 4 is O ( M N | S | T ) .
Algorithm 3: Kmeans Clustering Algorithm
Algorithms 16 00158 i003
Algorithm 4: SOM Clustering Algorithm
Algorithms 16 00158 i004

5. Experiments

In this section, the experimental setup is described and different clustering strategies are compared.

5.1. Experimental Setup

In the proposed deep-embedded clustering algorithm, there are different parameters and clustering components and we present our experiments to calibrate the parameters and components using different datasets, which include the AgNews dataset [59], and StackOverflow dataset [60]. The AgNews dataset is a subset of news titles that contains 4 topics. AgNews is a collection of more than 1 million news articles gathered from more than 2000 news sources. The dataset is used in data mining, including clustering, classification, information retrieval and so on. StackOverflow is a subset of the challenge data published by Kaggle, which contains 20,000 question titles associated with 20 different categories [60]. For each question, it includes: Question ID, Creation date, Closed date, Number of answers and so on. We then present experimental results to compare the proposed deep-embedded clustering algorithm against three existing algorithms using real-life instances. Different algorithms are implemented in the Python programming language with the Pytorch library on a single NVIDIA P100 GPU with 16G memory.
The Adam optimizer, with a batch size of 400, the distilbert-base-nli-stsb-mean-tokens, and the maximum input length are used the same as in [61,62]. The distilbert-base-nli-stsb-mean-tokens in the Sentence Transformers library was used as the backbone [39], and we set the maximum input length to 32. Different learning rates were conducted to optimize the Clustering head and we set α = 1 for the dataset. As mentioned in Section 3, different τ were used to optimize the contrastive loss. We tried different τ values in the range of (0, 1]. For fair comparison between the deeply embedded clustering framework and its components or variants, the clustering performance was analyzed for each of them by applying Kmeans, labeled as a representation with clustering centers by Kmeans (KmeansR), and SOM (SOMR), labeled as representations with clustering centers by SOM, and SOM, respectively.

5.2. Algorithm Comparison

To analyze the experimental results on the Agnews and StackOverflow datasets, different parameters, such as learning rates, learning rate scale (lr scale), and the temperature τ , were calibrated and compared with different values on these different algorithm components.

5.2.1. Experimental Results on Learning Rates

To calibrate the learning rates, the values were set from 10 7 to 10 3 for the Avgnews dataset. The experimental results are shown in Table 1. According to Table 1, With NMI metrics, when the learning rate was 10 5 , the NMI was the highest, with 0.824, while for SOMR, the highest NMI was 0.743 with learning rate 10 3 . For Kmeans algorithm, the highest NMI was 0.822 with a learning rate 10 5 while for KmeansR, the highest NMI was 0.731 with a learning rate 10 6 . Comparing SOM, SOMR, Kmeans, and KmeansR, the highest NMI was 0.824, obtained by SOM, followed by 0.822 obtained by Kmeans. For ACC, the highest value of SOM was 0.947 with the learning rate 10 5 while it was 0.915 of SOMR with the learning rate 10 3 . For Kmeans, the highest value of ACC was 0.944 with the same learning rate 10 5 as SOM, while for SOMR, the highest ACC was 0.904 with the learning rate 10 6 . Comparing all algorithm components, the highest value was 0.947, obtained by SOM.
In regard to calibrating the learning rates for the StackOverflow dataset, the experimental results are shown in Figure 3. According to Figure 3, the SOM and SOMR algorithms were affected by the learning rates, while the Kmeans and KmeansR algorithms had little effect on the learning rates. With NMI metrics, when the learning rate was 10 6 , the NMI was the highest, with 0.662, while for SOMR, the highest NMI was 0.564 with learning rate 10 5 . For the Kmeans algorithm, the highest NMI was 0.667 with learning rates 10 6 , 10 4 , and 10 3 , while for KmeansR, the highest NMI was 0.564 with the same corresponding learning rates. Comparing SOM, SOMR, Kmeans, and KmeansR, the highest NMI was 0.667, obtained by Kmeans, followed by 0.662, obtained by SOM. For ACC, the highest value of SOM was 0.710 with the learning rate 10 6 , while it was 0.611 of SOMR, with the learning rate 10 6 . For Kmeans, the highest value of ACC was 0.711 with the same learning rate 10 6 as SOM, while for SOMR, the highest ACC was 0.619, with the learning rate 10 6 , 10 5 , and 10 3 . Comparing all algorithm components, the highest value was 0.711, obtained by the Kmeans algorithm.

5.2.2. Experimental Results on Learning Rate Scales

To calibrate the learning rate scale on different clustering algorithms for the Avgnews dataset, the values were set from 50 to 500. The experimental results are shown in Table 2. According to Table 2, with NMI metrics, when the learning rate scale was 500, the NMI for the Avgnews dataset was the highest with 0.883 for SOM, and for SOMR, the highest NMI was 0.712. For the Kmeans algorithm, the highest NMI was 0.904, with a learning rate scale of 500, and for KmeansR, the highest NMI was 0.744, with the same learning rate scale. Comparing SOM, SOMR, Kmeans, and KmeansR, the highest NMI was 0.904, obtained by K m e a n s , followed by 0.883, obtained by SOM. According to Table 2, with ACC metrics, when the learning rate scale was 500, the NMI was the highest, with 0.968, for SOM and for SOMR, the highest NMI was 0.891. For the Kmeans algorithm, the highest ACC was 0.974, with a learning rate scale of 500, and for KmeansR, the highest ACC was 0.905 with the same learning rate scale. Comparing SOM, SOMR, Kmeans, and KmeansR, the highest NMI was 0.974, obtained by Kmeans, followed by 0.968, obtained by SOM.
According to Figure 4, the SOM algorithm was a little better than Kmeans algorithm in NMI and ACC metrics. Similarly, SOMR was slightly better than KmeansR. For the StackOverflow dataset, with NMI metrics, when the learning rate scale was 250, the NMI for the StackOverflow dataset was the highest, with 0.670 for SOM, and for SOMR, the highest NMI was 0.570.
For the Kmeans algorithm, the highest NMI was 0.680 with a learning rate scale of 250, and for KmeansR, the highest NMI was 0.568, with the same learning rate scale. Comparing SOM, SOMR, Kmeans, and KmeansR, the highest NMI was 0.680, obtained by Kmeans, followed by 0.670, obtained by SOM. According to Figure 4, with ACC metrics, when the learning rate scale was 250, the NMI was the highest, with 0.716, for SOM and for SOMR, the highest NMI was 0.620, with a learning rate scale of 500. For the Kmeans algorithm, the highest ACC was 0.724 with a learning rate scale of 500 and for KmeansR, the highest ACC was 0.624 with the same learning rate scale. Comparing SOM, SOMR, Kmeans, and KmeansR, the highest NMI was 0.724, obtained by Kmeans, followed by 0.716, obtained by SOM.

5.2.3. Experimental Results on Temperature

To calibrate the temperature τ , the values were set from 0.4 to 0.9 . The experimental results are shown in Table 3. According to Table 3, with NMI metrics, when the temperature was 0.9, the NMI was the highest, with 0.966, for SOM and for SOMR, the highest NMI was 0.821. For the Kmeans algorithm, the highest NMI was 0.909, with a temperature of 0.9, and for KmeansR, the highest NMI was 0.907, with the same temperature. Comparing SOM, SOMR, Kmeans, and KmeansR, the highest NMI was 0.966, obtained by Kmeans, followed by 0.953, obtained by Kmeans. According to Table 3, with ACC metrics, when the temperature was 0.9, the ACC was the highest, with 0.992, for SOM and for SOMR, the highest NMI was 0.949. For the Kmeans algorithm, the highest ACC was 0.989, with a temperature of 0.9, and for KmeansR, the highest ACC was 0.939, with the same temperature. Comparing SOM, SOMR, Kmeans, and KmeansR, the highest ACC was 0.992, obtained by SOM, followed by 0.989, obtained by Kmeans.
The experimental results are shown in Figure 5 for the StackOverflow dataset. According to Figure 5, parameter temperature had little effect on SOM, SOMR, Kmeans, and KmeansR algorihtms. With NMI metrics, when the temperature was 0.9, the NMI was the highest, with 0.699. for SOM and for SOMR, the highest NMI was 0.598. For the Kmeans algorithm, the highest NMI was 0.716, with a temperature of 0.7, and for KmeansR, the highest NMI was 0.577 with the same temperature. Comparing SOM, SOMR, Kmeans, and KmeansR, the highest NMI was 0.716, obtained by Kmeans, followed by 0.699, obtained by SOM. According to Figure 5, with ACC metrics, when the temperature was 0.9, the ACC was the highest, with 0.737, for SOM and for SOMR, the highest NMI was 0.639. For Kmeans algorithm, the highest ACC was 0.757, with a temperature of 0.7, and for KmeansR, the highest ACC was 0.632, with the same temperature. Comparing SOM, SOMR, Kmeans, and KmeansR, the highest ACC was 0.757, obtained by Kmeans, followed by 0.737, obtained by SOM.
According to the above experiments, Kmeans and SOM algorithms were always better than SOMR and KmeansR. For the Avgnews dataset, SOM performed the best, while for the StackOverflow dataset, Kmeans performed the best.

6. Conclusions

There are various kinds of texts in education and news systems. To increase efficiency, how to cluster these texts is important. In this paper, a text clustering problem is considered which combines BERT with different clustering techniques and contrastive learning. To solve the problem, we proposed a general framework that uses constructive learning on deep embedding to cluster similar texts. The NLP technique is used to represent texts to vectors. Different clustering algorithm components, which include label as representation, Kmeans, and SOM (Self Organizing Map) algorithms, are used. By combining contrastive learning with representation and clustering algorithms, similar texts in the same group can be distinguished. Different experiments were conducted to compare the NMI (Normalized Mutual Information) and ACC (Accuracy) for different datasets. The results showed the effectiveness of our proposed model in clustering texts, which implies that the performance of SOM is better than SOM and the performance of Kmeans is better than KmeansR. In future, we will further study the relationship among different texts in a cluster. In addition, we also plan to construct and study different relationship graphs for texts.

Author Contributions

Conceptualization, S.W. and A.B.; methodology, A.B. and S.E.; validation, Y.W. and J.L.; formal analysis, Q.Z.S. and H.A.-R.; investigation, H.A.-R.; resources, S.E.; writing—original draft preparation, S.W.; writing—review and editing, A.B. and Q.Z.S.; supervision, A.B.; project administration, A.B.; funding acquisition, S.E. and A.B. All authors have read and agreed to the published version of the manuscript.

Funding

We acknowledge the Centre for Applied Artificial Intelligence at Macquarie University and ITIC Pty Ltd. for funding this research. The paper is supported by the Natural Science Foundation of Jiangsu Province of China (Grants No. BK20220803).

Data Availability Statement

The experimental code is available on the https://www.researchgate.net/publication/367284597_DEC_som (accessed on 30 January 2023).

Conflicts of Interest

The authors declare that there are no conflict of interests, we do not have any possible conflicts of interest.

References

  1. Wang, S.; Beheshti, A.; Wang, Y.; Lu, J.; Sheng, Q.Z.; Elbourn, S.; Alinejad-Rokny, H.; Galanis, E. Assessment2Vec: Learning Distributed Representations of Assessments to Reduce Marking Workload. In Proceedings of the International Conference on Artificial Intelligence in Education, Utrecht, The Netherlands, 14–18 June 2021; Springer: Cham, Switzerland, 2021; Volume 12749, pp. 384–389. [Google Scholar]
  2. Singh, A.; Karayev, S.; Gutowski, K.; Abbeel, P. Gradescope: A fast, flexible, and fair system for scalable assessment of handwritten work. In Proceedings of the Fourth (2017) ACM Conference on Learning @ Scale, Cambridge, MA, USA, 20–21 April 2017; pp. 81–88. [Google Scholar]
  3. Piech, C.; Gregg, C. BlueBook: A computerized replacement for paper tests in computer science. In Proceedings of the 49th ACM Technical Symposium on Computer Science Education, Baltimore, MD, USA, 21–24 February 2018; pp. 562–567. [Google Scholar]
  4. Pessutto, L.R.C.; Vargas, D.S.; Moreira, V.P. Multilingual aspect clustering for sentiment analysis. Knowl.-Based Syst. 2020, 192, 105339. [Google Scholar] [CrossRef]
  5. Dilokthanakul, N.; Mediano, P.A.; Garnelo, M.; Lee, M.C.; Salimbeni, H.; Arulkumaran, K.; Shanahan, M. Deep unsupervised clustering with gaussian mixture variational autoencoders. arXiv 2016, arXiv:1611.02648. [Google Scholar]
  6. MacQueen, J. Some methods for classification and analysis of multivariate observations. In Proceedings of the Fifth Berkeley Symposium on Mathematical Statistics and Probability, Oakland, CA, USA, 21 June–18 July 1965 and 27 December 1965–7 January 1966; Volume 1, pp. 281–297. [Google Scholar]
  7. Vesanto, J.; Alhoniemi, E. Clustering of the self-organizing map. IEEE Trans. Neural Netw. 2000, 11, 586–600. [Google Scholar] [CrossRef]
  8. Wold, S.; Esbensen, K.; Geladi, P. Principal component analysis. Chemom. Intell. Lab. Syst. 1987, 2, 37–52. [Google Scholar] [CrossRef]
  9. Ren, Y.; Zhang, G.; Yu, G.; Li, X. Local and global structure preserving based feature selection. Neurocomputing 2012, 89, 147–157. [Google Scholar] [CrossRef]
  10. Li, Y.; Cai, J.; Wang, J. A Text Document Clustering Method Based on Weighted BERT Model. In Proceedings of the 2020 IEEE 4th Information Technology, Networking, Electronic and Automation Control Conference (ITNEC), Chongqing, China, 12–14 June 2020; Volume 1, pp. 1426–1430. [Google Scholar]
  11. Fard, M.M.; Thonet, T.; Gaussier, E. Deep k-means: Jointly clustering with k-means and learning representations. Pattern Recognit. Lett. 2020, 138, 185–192. [Google Scholar] [CrossRef]
  12. Xie, J.; Girshick, R.; Farhadi, A. Unsupervised deep embedding for clustering analysis. In Proceedings of the International Conference on Machine Learning, PMLR, New York, NY, USA, 20–22 June 2016; pp. 478–487. [Google Scholar]
  13. Ren, Y.; Hu, K.; Dai, X.; Pan, L.; Hoi, S.C.; Xu, Z. Semi-supervised deep embedded clustering. Neurocomputing 2019, 325, 121–130. [Google Scholar] [CrossRef]
  14. Beheshti, A. Knowledge base 4.0: Using crowdsourcing services for mimicking the knowledge of domain experts. In Proceedings of the 2022 IEEE International Conference on Web Services (ICWS), Barcelona, Spain, 10–16 July 2022; pp. 425–427. [Google Scholar]
  15. Guo, X.; Gao, L.; Liu, X.; Yin, J. Improved Deep Embedded Clustering with Local Structure Preservation. In Proceedings of the IJCAI, Melbourne, Australia, 19–25 August 2017; pp. 1753–1759. [Google Scholar]
  16. Pena, J.M.; Lozano, J.A.; Larranaga, P. An empirical comparison of four initialization methods for the k-means algorithm. Pattern Recognit. Lett. 1999, 20, 1027–1040. [Google Scholar] [CrossRef]
  17. Li, Y.; Hu, P.; Liu, Z.; Peng, D.; Zhou, J.T.; Peng, X. Contrastive Clustering. In Proceedings of the 35th AAAI Conference on Artificial Intelligence, Online, 2–9 February 2021; Volume 35, pp. 8547–8555. [Google Scholar]
  18. Debnath, T.; Reza, M.M.; Rahman, A.; Beheshti, A.; Band, S.S.; Alinejad-Rokny, H. Four-layer ConvNet to facial emotion recognition with minimal epochs and the significance of data diversity. Sci. Rep. 2022, 12, 6991. [Google Scholar] [CrossRef]
  19. Stefanovič, P.; Kurasova, O. Approach for Multi-Label Text Data Class Verification and Adjustment Based on Self-Organizing Map and Latent Semantic Analysis. Informatica 2022, 33, 109–130. [Google Scholar] [CrossRef]
  20. Stefanovič, P.; Kurasova, O.; Štrimaitis, R. The N-Grams Based Text Similarity Detection Approach Using Self-Organizing Maps and Similarity Measures. Appl. Sci. 2019, 9, 1870. [Google Scholar] [CrossRef] [Green Version]
  21. Dai, A.M.; Le, Q.V. Semi-supervised sequence learning. Adv. Neural Inf. Process. Syst. 2015, 28, 3079–3087. [Google Scholar]
  22. Peters, M.E.; Neumann, M.; Iyyer, M.; Gardner, M.; Clark, C.; Lee, K.; Zettlemoyer, L. Deep contextualized word representations. In Proceedings of the NAACL-HLT 2018, New Orleans, LA, USA, 1–6 June 2018; pp. 2227–2237. [Google Scholar]
  23. Uto, M.; Xie, Y.; Ueno, M. Neural Automated Essay Scoring Incorporating Handcrafted Features. In Proceedings of the 28th International Conference on Computational Linguistics; International Committee on Computational Linguistics, Online, 8–13 December 2020; pp. 6077–6088. [Google Scholar]
  24. Khosla, P.; Teterwak, P.; Wang, C.; Sarna, A.; Tian, Y.; Isola, P.; Maschinot, A.; Liu, C.; Krishnan, D. Supervised Contrastive Learning. In Proceedings of the Advances in Neural Information Processing Systems, Online, 6–12 December 2020; Curran Associates, Inc.: Red Hook, NY, USA, 2020; Volume 33, pp. 18661–18673. [Google Scholar]
  25. Wang, A.; Singh, A.; Michael, J.; Hill, F.; Levy, O.; Bowman, S. GLUE: A Multi-Task Benchmark and Analysis Platform for Natural Language Understanding. In Proceedings of the 2018 EMNLP Workshop BlackboxNLP: Analyzing and Interpreting Neural Networks for NLP; Association for Computational Linguistics, Brussels, Belgium, 1 November 2018; pp. 353–355. [Google Scholar]
  26. Pejić Bach, M.; Krstić, Ž.; Seljan, S.; Turulja, L. Text Mining for Big Data Analysis in Financial Sector: A Literature Review. Sustainability 2019, 11, 1277. [Google Scholar] [CrossRef] [Green Version]
  27. Nguyen, B.V.; Nguyen, V.H.; Ho, T.P. Sentiment Analysis of Customer Feedback in Online Food Ordering Services. Bus. Syst. Res. J. 2021, 12, 46–59. [Google Scholar] [CrossRef]
  28. Isada, F. An Empirical Study on Inter-Organisational Network Structures for Connected Cars. In Proceedings of the ENTRENOVA-ENTerprise REsearch InNOVAtion Conference, Hybrid Conference, Zagreb, Croatia, 9–10 September 2021; IRENET–Society for Advancing Innovation and Research in Economy: Zagreb, Croatia, 2021; Volume 7, pp. 324–334. [Google Scholar]
  29. Asgari, T.; Daneshvar, A.; Chobar, A.P.; Ebrahimi, M.; Abrahamyan, S. Identifying key success factors for startups with sentiment analysis using text data mining. Int. J. Eng. Bus. Manag. 2022, 14, 18479790221131612. [Google Scholar] [CrossRef]
  30. Hochreiter, S.; Schmidhuber, J. Long short-term memory. Neural Comput. 1997, 9, 1735–1780. [Google Scholar] [CrossRef]
  31. Sundermeyer, M.; Schlüter, R.; Ney, H. LSTM neural networks for language modeling. In Proceedings of the Thirteenth Annual Conference of the International Speech Communication Association, Portland, OR, USA, 9–13 September 2012; pp. 194–197. [Google Scholar]
  32. Bahdanau, D.; Cho, K.; Bengio, Y. Neural machine translation by jointly learning to align and translate. arXiv 2014, arXiv:1409.0473. [Google Scholar]
  33. Dozat, T.; Manning, C.D. Deep biaffine attention for neural dependency parsing. In Proceedings of the 5th International Conference on Learning Representations, ICLR, Toulon, France, 24–26 April 2017; pp. 1–8. [Google Scholar]
  34. Tan, M.; dos Santos, C.; Xiang, B.; Zhou, B. LSTM-based deep learning models for non-factoid answer selection. arXiv 2015, arXiv:1511.04108. [Google Scholar]
  35. Yuan, X.; Wang, S.; Wan, L.; Zhang, C. SSF: Sentence similar function based on Word2vector similar elements. J. Inf. Process. Syst. 2019, 15, 1503–1516. [Google Scholar]
  36. Miller, D. Leveraging BERT for extractive text summarization on lectures. arXiv 2019, arXiv:1906.04165. [Google Scholar]
  37. Ghodratnama, S.; Beheshti, A.; Zakershahrak, M.; Sobhanmanesh, F. Intelligent narrative summaries: From indicative to informative summarization. Big Data Res. 2021, 26, 100257. [Google Scholar] [CrossRef]
  38. Ghodratnama, S.; Zakershahrak, M.; Beheshti, A. Summary2vec: Learning semantic representation of summaries for healthcare analytics. In Proceedings of the 2021 International Joint Conference on Neural Networks (IJCNN), Shenzhen, China, 18–22 July 2021; pp. 1–8. [Google Scholar]
  39. Reimers, N.; Gurevych, I. Sentence-bert: Sentence embeddings using siamese bert-networks. arXiv 2019, arXiv:1908.10084. [Google Scholar]
  40. Wang, S.; Hu, L.; Wang, Y.; He, X.; Sheng, Q.Z.; Orgun, M.A.; Cao, L.; Ricci, F.; Yu, P.S. Graph learning based recommender systems: A review. In Proceedings of the 30th International Joint Conference on Artificial Intelligence, Montreal, QC, Canada, 19–27 August 2021; AAAI Press: Palo Alto, CA, USA, 2021; pp. 1–9. [Google Scholar]
  41. Tian, F.; Gao, B.; Cui, Q.; Chen, E.; Liu, T.Y. Learning deep representations for graph clustering. In Proceedings of the AAAI Conference on Artificial Intelligence, Montreal, QC, Canada, 27–31 July 2014; Volume 28, pp. 1293–1299. [Google Scholar]
  42. Kohonen, T. The self-organizing map. Proc. IEEE 1990, 78, 1464–1480. [Google Scholar] [CrossRef]
  43. Kohonen, T. Essentials of the self-organizing map. Neural Netw. 2013, 37, 52–65. [Google Scholar] [CrossRef]
  44. Yang, J.; Tang, Y.; Beheshti, A. Design methodology for service-based data product sharing and trading. In Next-Gen Digital Services. A Retrospective and Roadmap for Service Computing of the Future: Essays Dedicated to Michael Papazoglou on the Occasion of His 65th Birthday and His Retirement; Springer: Cham, Switzerland, 2021; pp. 221–235. [Google Scholar]
  45. Ni, M.; Cheng, H.; Lai, J. GAN–SOM: A clustering framework with SOM-similar network based on deep learning. J. Supercomput. 2021, 77, 4871–4886. [Google Scholar] [CrossRef]
  46. Sadowski, Ł.; Nikoo, M.; Nikoo, M. Principal component analysis combined with a self organization feature map to determine the pull-off adhesion between concrete layers. Constr. Build. Mater. 2015, 78, 386–396. [Google Scholar] [CrossRef]
  47. Stefanovič, P.; Kurasova, O. Creation of Text Document Matrices and Visualization by Self-Organizing Map. Inf. Technol. Control. 2014, 43, 37–46. [Google Scholar] [CrossRef]
  48. Jaiswal, A.; Babu, A.R.; Zadeh, M.Z.; Banerjee, D.; Makedon, F. A survey on contrastive self-supervised learning. Technologies 2021, 9, 2. [Google Scholar] [CrossRef]
  49. Fang, H.; Xie, P. Cert: Contrastive self-supervised learning for language understanding. arXiv 2020, arXiv:2005.12766. [Google Scholar]
  50. Dasgupta, T.; Naskar, A.; Dey, L.; Saha, R. Augmenting textual qualitative features in deep convolution recurrent neural network for automatic essay scoring. In Proceedings of the 5th Workshop on Natural Language Processing Techniques for Educational Applications, Melbourne, Australia, 19 July 2018; pp. 93–102. [Google Scholar]
  51. Sung, C.; Dhamecha, T.I.; Mukhi, N. Improving short answer grading using transformer-based pre-training. In Proceedings of the International Conference on Artificial Intelligence in Education, Chicago, IL, USA, 25–29 June 2019; Springer: Cham, Switzerland, 2019; pp. 469–481. [Google Scholar]
  52. Taghipour, K.; Ng, H.T. A neural approach to automated essay scoring. In Proceedings of the 2016 Conference on Empirical Methods in Natural Language Processing, Austin, TX, USA, 1–5 November 2016; pp. 1882–1891. [Google Scholar]
  53. Uto, M.; Okano, M. Robust Neural Automated Essay Scoring Using Item Response Theory. In Proceedings of the Artificial Intelligence in Education, Ifrane, Morocco, 6–10 July 2020; Bittencourt, I.I., Cukurova, M., Muldner, K., Luckin, R., Millán, E., Eds.; Springer International Publishing: Cham, Switzerland, 2020; pp. 549–561. [Google Scholar]
  54. Wang, Y.; Wei, Z.; Zhou, Y.; Huang, X.J. Automatic essay scoring incorporating rating schema via reinforcement learning. In Proceedings of the 2018 Conference on Empirical Methods in Natural Language Processing, Brussels, Belgium, 31 October–4 November 2018; pp. 791–797. [Google Scholar]
  55. Devlin, J.; Chang, M.W.; Lee, K.; Toutanova, K. Bert: Pre-training of deep bidirectional transformers for language understanding. In Proceedings of the 2019 Conference of the North American Chapter of the Association for Computational Linguistics: Human Language Technologies, Volume 1 (Long and Short Papers); Association for Computational Linguistics, Minneapolis, MN, USA, 2–7 June 2019; pp. 4171–4186. [Google Scholar]
  56. Vaswani, A.; Shazeer, N.; Parmar, N.; Uszkoreit, J.; Jones, L.; Gomez, A.N.; Kaiser, L.; Polosukhin, I. Attention is all you need. In Proceedings of the 31st International Conference on Neural Information Processing Systems, NIPS’17, Long Beach, CA, USA, 4–9 December 2017; pp. 6000–6010. [Google Scholar]
  57. Ba, J.L.; Kiros, J.R.; Hinton, G.E. Layer normalization. arXiv 2016, arXiv:1607.06450. [Google Scholar]
  58. Van der Maaten, L.; Hinton, G. Visualizing data using t-SNE. J. Mach. Learn. Res. 2008, 9, 2579–2605. [Google Scholar]
  59. Zhang, X.; LeCun, Y. Text understanding from scratch. arXiv 2015, arXiv:1502.01710. [Google Scholar]
  60. Xu, J.; Xu, B.; Wang, P.; Zheng, S.; Tian, G.; Zhao, J.; Xu, B. Self-Taught convolutional neural networks for short text clustering. Neural Netw. 2017, 88, 22–31. [Google Scholar] [CrossRef] [Green Version]
  61. Zhang, D.; Nan, F.; Wei, X.; Li, S.; Zhu, H.; McKeown, K.; Nallapati, R.; Arnold, A.; Xiang, B. Supporting Clustering with Contrastive Learning. In Proceedings of the 2021 Conference of the North American Chapter of the Association for Computational Linguistics: Human Language Technologies; Association for Computational Linguistics, Online, 10–15 July 2021; pp. 5419–5430. [Google Scholar]
  62. Schiliro, F.; Moustafa, N.; Beheshti, A. Cognitive privacy: AI-enabled privacy using EEG signals in the internet of things. In Proceedings of the 2020 IEEE 6th International Conference on Dependability in Sensor, Cloud and Big Data Systems and Application (DependSys), Nadi, Fiji, 14–16 December 2020; pp. 73–79. [Google Scholar]
Figure 1. The proposed overall framework.
Algorithms 16 00158 g001
Figure 2. The procedure of text clustering.
Algorithms 16 00158 g002
Figure 3. Algorithm Component Comparison with StackOverflow for NMI and ACC.
Algorithms 16 00158 g003
Figure 4. Learning Rate Scale Calibration and Algorithm Component Comparison with StackOverflow for NMI and ACC.
Algorithms 16 00158 g004
Figure 5. Learning Rate Scale Calibration and Algorithm Component Comparison with StackOverflow for NMI and ACC.
Algorithms 16 00158 g005
Table 1. Learning rate Calibration and Algorithm Component Comparison ( 10 7 10 3 ).
DatasetMetricsAlgorithm 10 7 10 6 10 5 10 4 10 3
NMISOM0.7630.7390.8240.5650.625
NMISOMR0.7240.7290.6960.4910.743
NMIKmeans0.7670.7440.8220.7310.454
NMIKmeansR0.7270.7310.6850.7180.296
AvgnewsACCSOM0.9220.9090.9470.8040.836
ACCSOMR0.8990.9030.8870.7670.914
ACCKmeans0.9230.9260.9440.8990.694
ACCKmeansR0.9010.9040.8810.8650.494
Bold implies the best values for the NMI and ACC metrics.
Table 2. Learning Rate Scale Calibration and Algorithm Component Comparison (50–500).
DatasetAlgorithmsMetrics50100150200250500
SOMNMI0.7110.8240.8270.8290.8620.883
SOMRNMI0.6090.6940.6700.6620.6620.712
AvgNewsKmeansNMI0.8230.8220.8360.8440.8560.904
KmeansRNMI0.6990.6850.6640.6630.6690.744
SOMACC0.9010.9470.9470.9470.9610.968
SOMRACC0.8820.8370.8730.8710.8710.891
KmeansACC0.9440.9440.9500.9530.9580.974
KmeansRACC0.8880.8810.8700.8700.8680.905
Bold implies the best values for the NMI and ACC metrics.
Table 3. Temperature Calibration and Algorithm Component Comparison. (0.4–0.9).
DatasetTemperatureMetrics0.40.50.60.70.80.9
SOMNMI08820.8830.8810.9480.9580.966
SOMRNMI0.6790.7120.7350.7840.8210.844
KmeansNMI0.8810.9040.9050.9050.9090.953
AvgnewsKmeansRNMI0.7650.7440.7640.7840.8070.819
SOMACC0.9670.9680.9670.9870.9900.992
SOMRACC0.8740.8910.9020.9200.9380.949
KmeansACC0.9660.9740.9750.9750.9760.989
KmeansACCR0.8850.9050.9140.9220.9310.939
Bold implies the best values for the NMI and ACC metrics.
Disclaimer/Publisher’s Note: The statements, opinions and data contained in all publications are solely those of the individual author(s) and contributor(s) and not of MDPI and/or the editor(s). MDPI and/or the editor(s) disclaim responsibility for any injury to people or property resulting from any ideas, methods, instructions or products referred to in the content.

