
A Cognitive Model for Technology Adoption
by
 ,
,
Fariborz Sobhanmanesh
1,*, 
Amin Beheshti
1,*,
Nicholas Nouri
2,
Natalia Monje Chapparo
2,
Sandya Raj
2 and
Richard A. George
1,2,* 1
School of Computing, Macquarie University, Sydney, NSW 2109, Australia
2
Faethm by Pearson, Sydney, NSW 2000, Australia
*
Authors to whom correspondence should be addressed.
Algorithms 2023, 16(3), 155; https://doi.org/10.3390/a16030155
Submission received: 28 January 2023
/
Revised: 5 March 2023
/
Accepted: 6 March 2023
/
Published: 10 March 2023
(This article belongs to the Special Issue AI-Based Algorithms in IoT-Edge Computing)
Abstract
:The widespread adoption of advanced technologies, such as Artificial Intelligence (AI), Machine Learning, and Robotics, is rapidly increasing across the globe. This accelerated pace of change is drastically transforming various aspects of our lives and work, resulting in what is now known as Industry 4.0. As businesses integrate these technologies into their daily operations, it significantly impacts their work tasks and required skill sets. However, the approach to technological transformation varies depending on location, industry, and organization. However, there are no published methods that can adequately forecast the adoption of technology and its impact on society. It is essential to prepare for the future impact of Industry 4.0, and this requires policymakers and business leaders to be equipped with scientifically validated models and metrics. Data-driven scenario planning and decision-making can lead to better outcomes in every area of the business, from learning and development to technology investment. However, the current literature falls short in identifying effective and globally applicable strategies to predict the adoption rate of emerging technologies. Therefore, this paper proposes a novel parametric mathematical model for predicting the adoption rate of emerging technologies through a unique data-driven pipeline. This approach utilizes global indicators for countries to predict the technology adoption curves for each country and industry. The model is thoroughly validated, and the paper outlines highly promising evaluation results. The practical implications of this proposed approach are significant because it provides policymakers and business leaders with valuable insights for decision-making and scenario planning.
1. Introduction
Understanding how individuals make decisions about technology adoption is crucial for designing technologies that maximize the chances of a successful adoption. A cognitive model that can explain the complex decision-making process that individuals undergo when evaluating and deciding to adopt new technologies is particularly valuable. Despite the importance of this, the existing approaches to understanding technology adoption fall short of adequately addressing the cognitive processes involved. A well-designed cognitive model can inform the design of new technologies and the way they are presented to users to increase the likelihood of adoption. Moreover, by identifying potential barriers to adoption, such as misconceptions and biases, cognitive models can aid in addressing these issues and ultimately enhance the success of the technology [1,2,3,4]. For example, cognitive models can shed light on how individuals process and make sense of new information about a technology, how it is integrated with their prior knowledge and experiences, and how it ultimately influences their decision-making.
The rapid growth in advanced technologies such as Artificial Intelligence (AI), Machine Learning, and Robotics is transforming the nature of work in every industry globally [5]. The impact of this fourth industrial revolution, or Industry 4.0, is significant, leading to the automation or augmentation of work tasks that once required human skills and activities [6]. However, the current approach to technology adoption falls short in addressing the skills shock that can arise from this transformation, where workers are not up-skilled or re-skilled in time to perform new tasks and jobs [7]. To prepare for the future impact of Industry 4.0 on job markets, policymakers and firms need better models for future scenario planning. A deeper understanding of technology adoption will enable governments, firms, and individuals to better transition to a new future of work [8]. For instance, identifying when Robotic Process Automation could automate many back-office functions within an organization can help Human Resource teams re-skill their employees into new careers with better prospects. Despite the importance of technology adoption models, the current approach is limited in addressing the skills shock and the overall impact of Industry 4.0 [7,8]. There is a lack of comprehensive, global models that can account for the diversity of locations, industries, and organizations. This shortcoming highlights the need for better models that can help policymakers and firms to prepare for the future impact of Industry 4.0 on job markets, and ultimately, to better manage the transition toward a new future of work.
The existing literature on technology adoption has discussed various theoretical perspectives and empirical findings related to the need for a cognitive model for technology adoption [2,9,10]. For example, the Diffusion of Innovation (DOI) theory [11]—which explains how new ideas, products, or technologies spread through a population or social system—highlights that the technology adoption is influenced by individual perceptions of the innovation’s relative advantage, compatibility, complexity, trialability, and observability. As another example, the Technology Acceptance Model (TAM) [1]—which focuses on the user’s perceptions of the technology’s usefulness and ease of use—highlights that the user’s attitude towards the technology and its perceived usefulness and ease of use determine their intention to use the technology. However, these existing approaches have some shortcomings. For example, the DOI theory does not account for individual differences in perceptions and decision-making processes, and the TAM does not consider the social and organizational factors that influence technology adoption. Additionally, these approaches focus primarily on the adoption of individual technologies and do not provide a comprehensive framework for understanding the adoption of multiple technologies and their interactions within an organizational context.
Therefore, there is a need for a cognitive model for technology adoption that integrates individual, social, and organizational factors and considers the adoption of multiple technologies within an organizational context. This model should account for individual differences in cognitive processes and decision-making and provide a more comprehensive understanding of technology adoption in organizations [12,13]. This is important as in the era of Industry 4.0, the adoption of new products can take place through various recommendation pipelines. However, the adoption of new technologies by firms depends on a range of factors, and several firm-level technology adoption models exist in both scientific and management literature [8]. Despite this, technology adoption does not happen simultaneously across all firms, but rather is a process where some industries or countries are more willing and capable of adopting new technologies than others. Another shortcoming of the existing approach is that while it explains the process of technology adoption, it does not fully address the reasons for differences in the willingness and ability of firms and industries to adopt new technologies. This highlights the need for further research to develop a more comprehensive understanding of the factors that influence technology adoption by firms.
To address these challenges, in this paper, we introduce a new approach to enhance the prediction of future impacts of emerging technology on job markets. The proposed approach offers several unique contributions that are significant improvements compared to the existing state of the art:
- We first present a novel data-driven pipeline and machine learning algorithms to model the extent and rate of technology adoption for each country and industry. This contributes to a more accurate and precise prediction of technology adoption rates, which can help policymakers, firms, and researchers better plan for future technological changes.
- Our proposed approach derives global indicators as features to determine technology adoption curves for a country and industry. This novel approach provides valuable insights into a firm’s maturity on the adoption curve, which can help firms better plan for technological changes.
- We apply global indicators to validate the prediction model and provides a detailed analysis of country and industry technology adoption rates. This contributes to the development of a more comprehensive understanding of the factors that influence technology adoption by firms and provides insights into the differences in the willingness and ability of firms and industries to adopt new technologies.
The practical implications of this proposed approach are significant because it provides policymakers and business leaders with valuable insights for decision-making and scenario planning. By predicting the adoption rate of emerging technologies, organizations can better prepare for the future, make informed decisions about technology investments, and develop appropriate strategies to ensure the skills and competencies of the workforce align with emerging technology requirements. The rest of the paper is organized as follows: We present the background and the related work in Section 2. In Section 3, we introduce our data-driven pipeline for technology adoption prediction with a detailed explanation for all the stages. We propose a novel mathematical model for predicting the adoption of emerging technologies in Section 4 along with the obtained results. Finally, we conclude the paper in Section 5.
2. Background and Related Work
A cognitive model can help to understand how individuals perceive and evaluate the risks and benefits of new technology, and how this influences their decision to adopt or not. This can inform the design of privacy-enhancing features, making it more likely that individuals will adopt the technology, and also help to identify potential biases or misconceptions that individuals may have about privacy, which can be addressed to increase trust and adoption. For example, a cognitive model can help to understand how individuals process recommendations from their social network, which can inform the design of recommender systems to better align with those processes, making it more likely that individuals will adopt the technologies being recommended.
One use case that highlights the need for a cognitive model for technology adoption is the adoption of new medical technologies by healthcare professionals. Medical technologies such as electronic health records, telemedicine, and remote patient monitoring are rapidly emerging in the healthcare industry. However, the adoption of these technologies has been slow and uneven across healthcare providers, with some embracing the new tools while others resist their implementation. A Cognitive Model for Technology Adoption can help to explain why some healthcare professionals are more willing to adopt these new technologies than others. For example, the model can explore how cognitive factors such as perception, beliefs, attitudes, and decision-making influence the adoption process. Additionally, the model can examine how individual differences in cognitive abilities, such as cognitive load and mental workload, impact technology adoption. By understanding the cognitive factors that influence technology adoption in the healthcare industry, we can develop interventions and strategies that facilitate the adoption of new medical technologies. This can help to improve patient care and outcomes, reduce healthcare costs, and enhance the overall efficiency of the healthcare system.
Much research has been conducted to explore the behavior of technology adoption by firms. In one of the models known as the Technology Acceptance Model (TAM), ‘Perceived Usefulness’ and ‘Perceived Ease of Use’ of the technology are considered the main factors in technology adoption. These two variables were found to consistently explain 40% of the variance in an individual’s intention to use and implement a technology [14]. In Roger’s Innovation Diffusion Theory (IDT) [11], the most well-known of the models, the focus is on how new technology will be adopted by members of a population through communication by human-interpersonal networks. Based on this model, the demand for innovation is a function of time, and the cumulative form of innovation diffusion among the population versus time follows an S-shaped curve, with an early minority leading to a tipping point of mass take-up, followed by a plateau. Using Rogers’s terminology, the technology adopters fall into five different categories named Innovators (2.5%), Early adopters (13.5%), which lead the trend, followed by Early majority (34%), then Late majority (34%), and, finally, Laggards (16%) [11].
At the organizational level, the “Technology, Organisation and Environment” (TOE) framework developed by DiPietro et al. in 1990 [15] has identified the three following constructs that influence the adoption of technology by an organization: (i) The internal and external technological context, such as availability, best practices, and equipment; (ii) The organizational context such as firm size, slack, communication processes, and managerial structure; and (iii) The environmental context of industry characteristics, market characteristics, technology support structures, and government regulations. Oliveira and Martins [9] showed that IDT constructs are identical to the technology and organization context of the TOE framework, but as TOE includes additional constructs, the TOE framework is found superior to IDT to explain technology adoption. Finally, Electronic Data Interchange (EDI) [16] adoption model, which was developed in a multiple case-study research program by Lacovo et al. in 1995, explains that ‘perceived benefits’, ‘organizational readiness: available financial and technological resources’, and ‘external pressure’ (competition) predict the speed of technology adoption by firms.
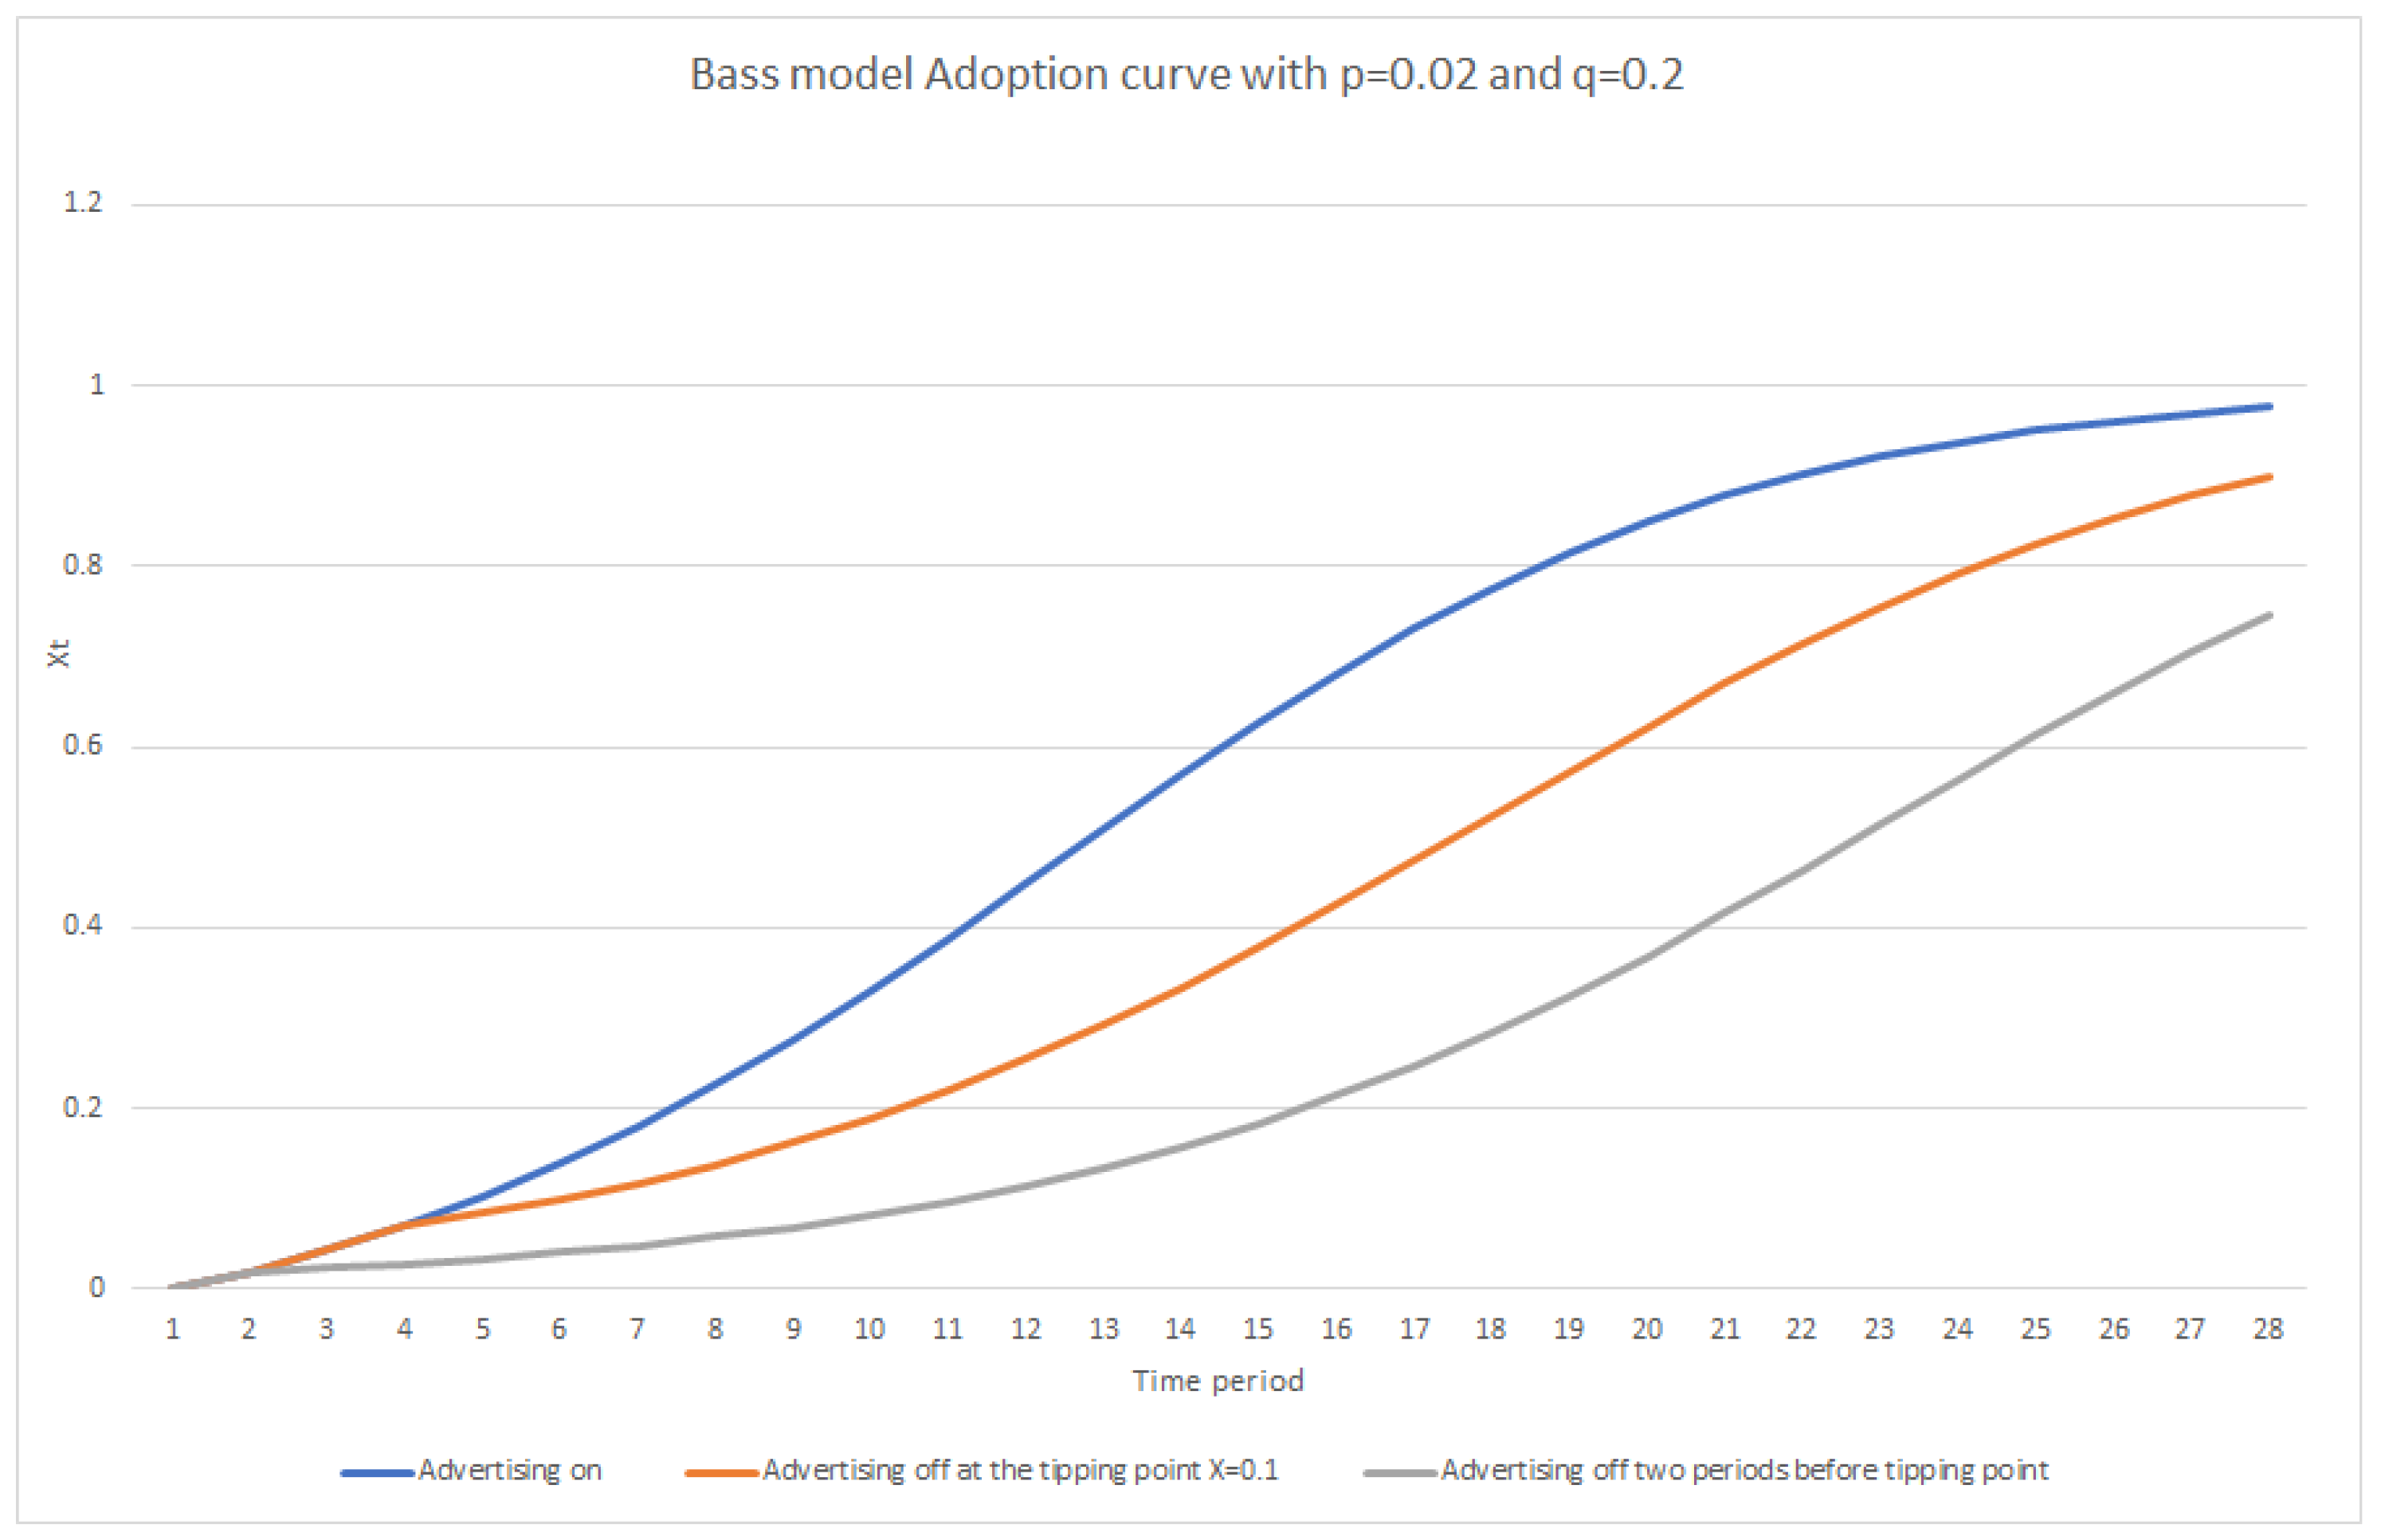
Table 1 illustrates a comparison of Related Work in the field, summarizing the main focus, Key constructs/variables, and key findings. Almost all diffusion models are based on differential or difference equations which provide the analytical solution of the penetration of technological products over time [17,18,19,20,21,22,23,24]. Based on the Bass Model [25], the finite difference of the cumulative market penetration of a new product or technology can be expressed as in Equation (1) where the incremental growth of the adopters in each time interval is made of two terms. The first term is the remaining non-adopters who are susceptible to external effects like advertising, and the second term shows the number of remaining non-adopters who are affected by the internal effects like an imitation of earlier adopters.
Understanding this equation is important in developing a cognitive model for technology adoption as it provides a theoretical framework for understanding the diffusion of new products and technologies in a population. This simple differential equation describes the dynamics of adoption and the roles of innovators and imitators in the process. By using the model, researchers can better predict how quickly a technology or product will be adopted and by whom. This information can be used to develop targeted marketing strategies, estimate future sales, and identify potential roadblocks to adoption. In this equation, p is the coefficient of external influence, and q is the coefficient of internal influence and exerts an effect proportional to the number of earlier adopters. The impact of advertising on the Bass model adoption curves is shown in Figure 1 for p = 0.02 and q= 0.2. As shown in this figure, stopping the advertisement of new products and technologies would result in delayed and slower adoption by the target societies.
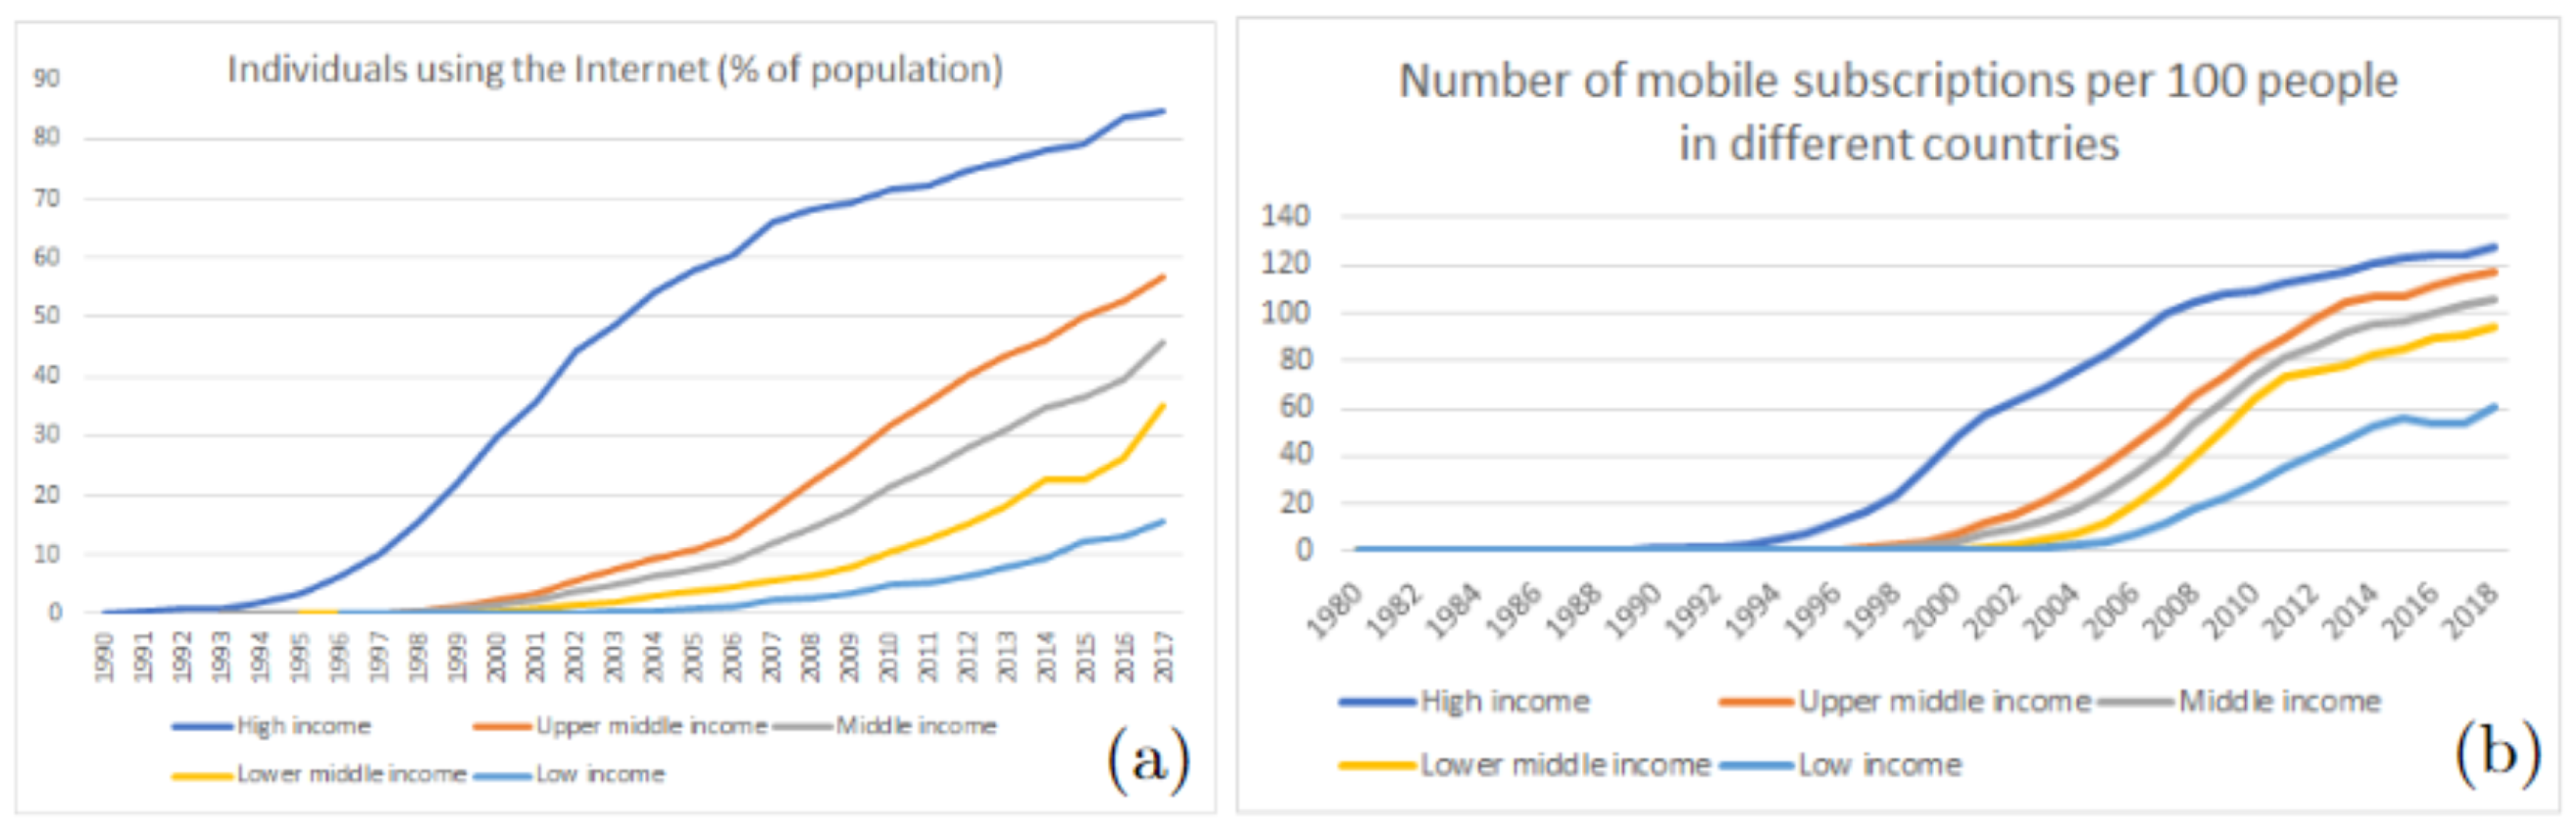
The adoption statistics of two emerging technologies in the past 25 years, individuals using the internet and the number of mobile subscriptions, published by World Bank [26] are shown in Figure 2. These statistics would support the S shape of the adoption curve for emerging technologies. As shown in the figures, the tipping point and the speed of adoption would depend on the economy and the financial situation of the countries and individuals.
Marikyan et al. [27] proposed to apply cognitive dissonance theory to examine how dissonance resulting from negative disconfirmation of expectations may translate into a positive outcome. One of the main shortcomings of this approach is that it focuses solely on the reactions of users to negative disconfirmation of technology performance, without taking into account other factors that may contribute to technology adoption and use. For example, the study does not examine the role of contextual factors, such as social influence or perceived usefulness and ease of use, that may affect technology adoption and use. Barham et al. [28] provided a model of technology adoption that considers both cognitive ability and receptiveness to advice as factors that influence the speed of adoption. One potential shortcoming of this research is that it focuses on a specific technology adoption case (GM corn seeds among US farmers), and it is unclear if the findings can be generalized to other technologies and contexts. Additionally, the study only considers cognitive ability and receptiveness to advice as factors influencing adoption and does not account for other important factors, such as social and economic factors. Marikyan et al. [29] proposed to shift the focus from technological sophistication to the cognitive factors that affect blockchain adoption. One potential shortcoming of this research is that the sample may not be representative of the broader population of potential blockchain users. The study recruited participants from a specific geographic region or demographic group, which may limit the generalizability of the findings. Kai-ming et al. [30] identified six beliefs that affect the cognitive process of forming an attitude toward technology adoption. The study suggests that these factors play a crucial role in determining whether an individual will adopt new technology. The study only examines the impact of six beliefs on the formation of a behavioral intention to adopt, and there may be other important factors that were not included in the analysis. Additionally, the study only focuses on the formation of behavioral intentions and does not investigate actual adoption behavior or the subsequent diffusion process.
Sangaiah et al. [31] introduced a new hybrid fuzzy multi-objective optimization algorithm to optimize the E-projects portfolio selection (EPPS) problem on social media, which involves choosing a set of investment projects that maximize return while minimizing risk. This research integrates big data analytics and cognitive computing to provide a new model that can help resolve failures faced during big data analytics and improve decision-making processes in the industry. The study focuses on optimizing the EPPS problem on social media and does not explore other aspects of big data analytics and cognitive computing. Moreover, the study only focuses on the E-projects portfolio selection problem in a specific Iranian web development company, and it is unclear whether the proposed algorithm would work well in other contexts or industries. In another work, Sangaiah et al. [31] developed a system for early detection of elephants crossing forest borders, using a combination of multi-sensor data fusion, cognition theories, and computational intelligence techniques. This system provides a three-level detection of the target and its related outputs, along with interesting features about the target obtained through cognition theory. The study is focused only on the detection of a specific species, i.e., elephants in the Hosur forest region. Thus, the results may not be generalizable to other regions or animal species.
A cognitive model for technology adoption may also be linked to data summarization because it allows for an understanding of how individuals process and make decisions about new technologies based on the information they receive. By summarizing data, it can provide a clear and concise representation of the information needed for individuals to make informed decisions about adoption, which can ultimately affect the success or failure of the technology in question [32,33,34]. It is also important to consider that a cognitive model for technology adoption could be linked to cognitive privacy because it can help understand how individuals perceive and make decisions about privacy risks when adopting new technologies. Understanding how individuals cognitively process privacy risks can inform the design of privacy-enhancing features, making it more likely that individuals will adopt the technology. Additionally, understanding how individuals make decisions about privacy can also identify potential biases or misconceptions that individuals may have about privacy, which can be addressed to increase trust and adoption.
3. Methodology
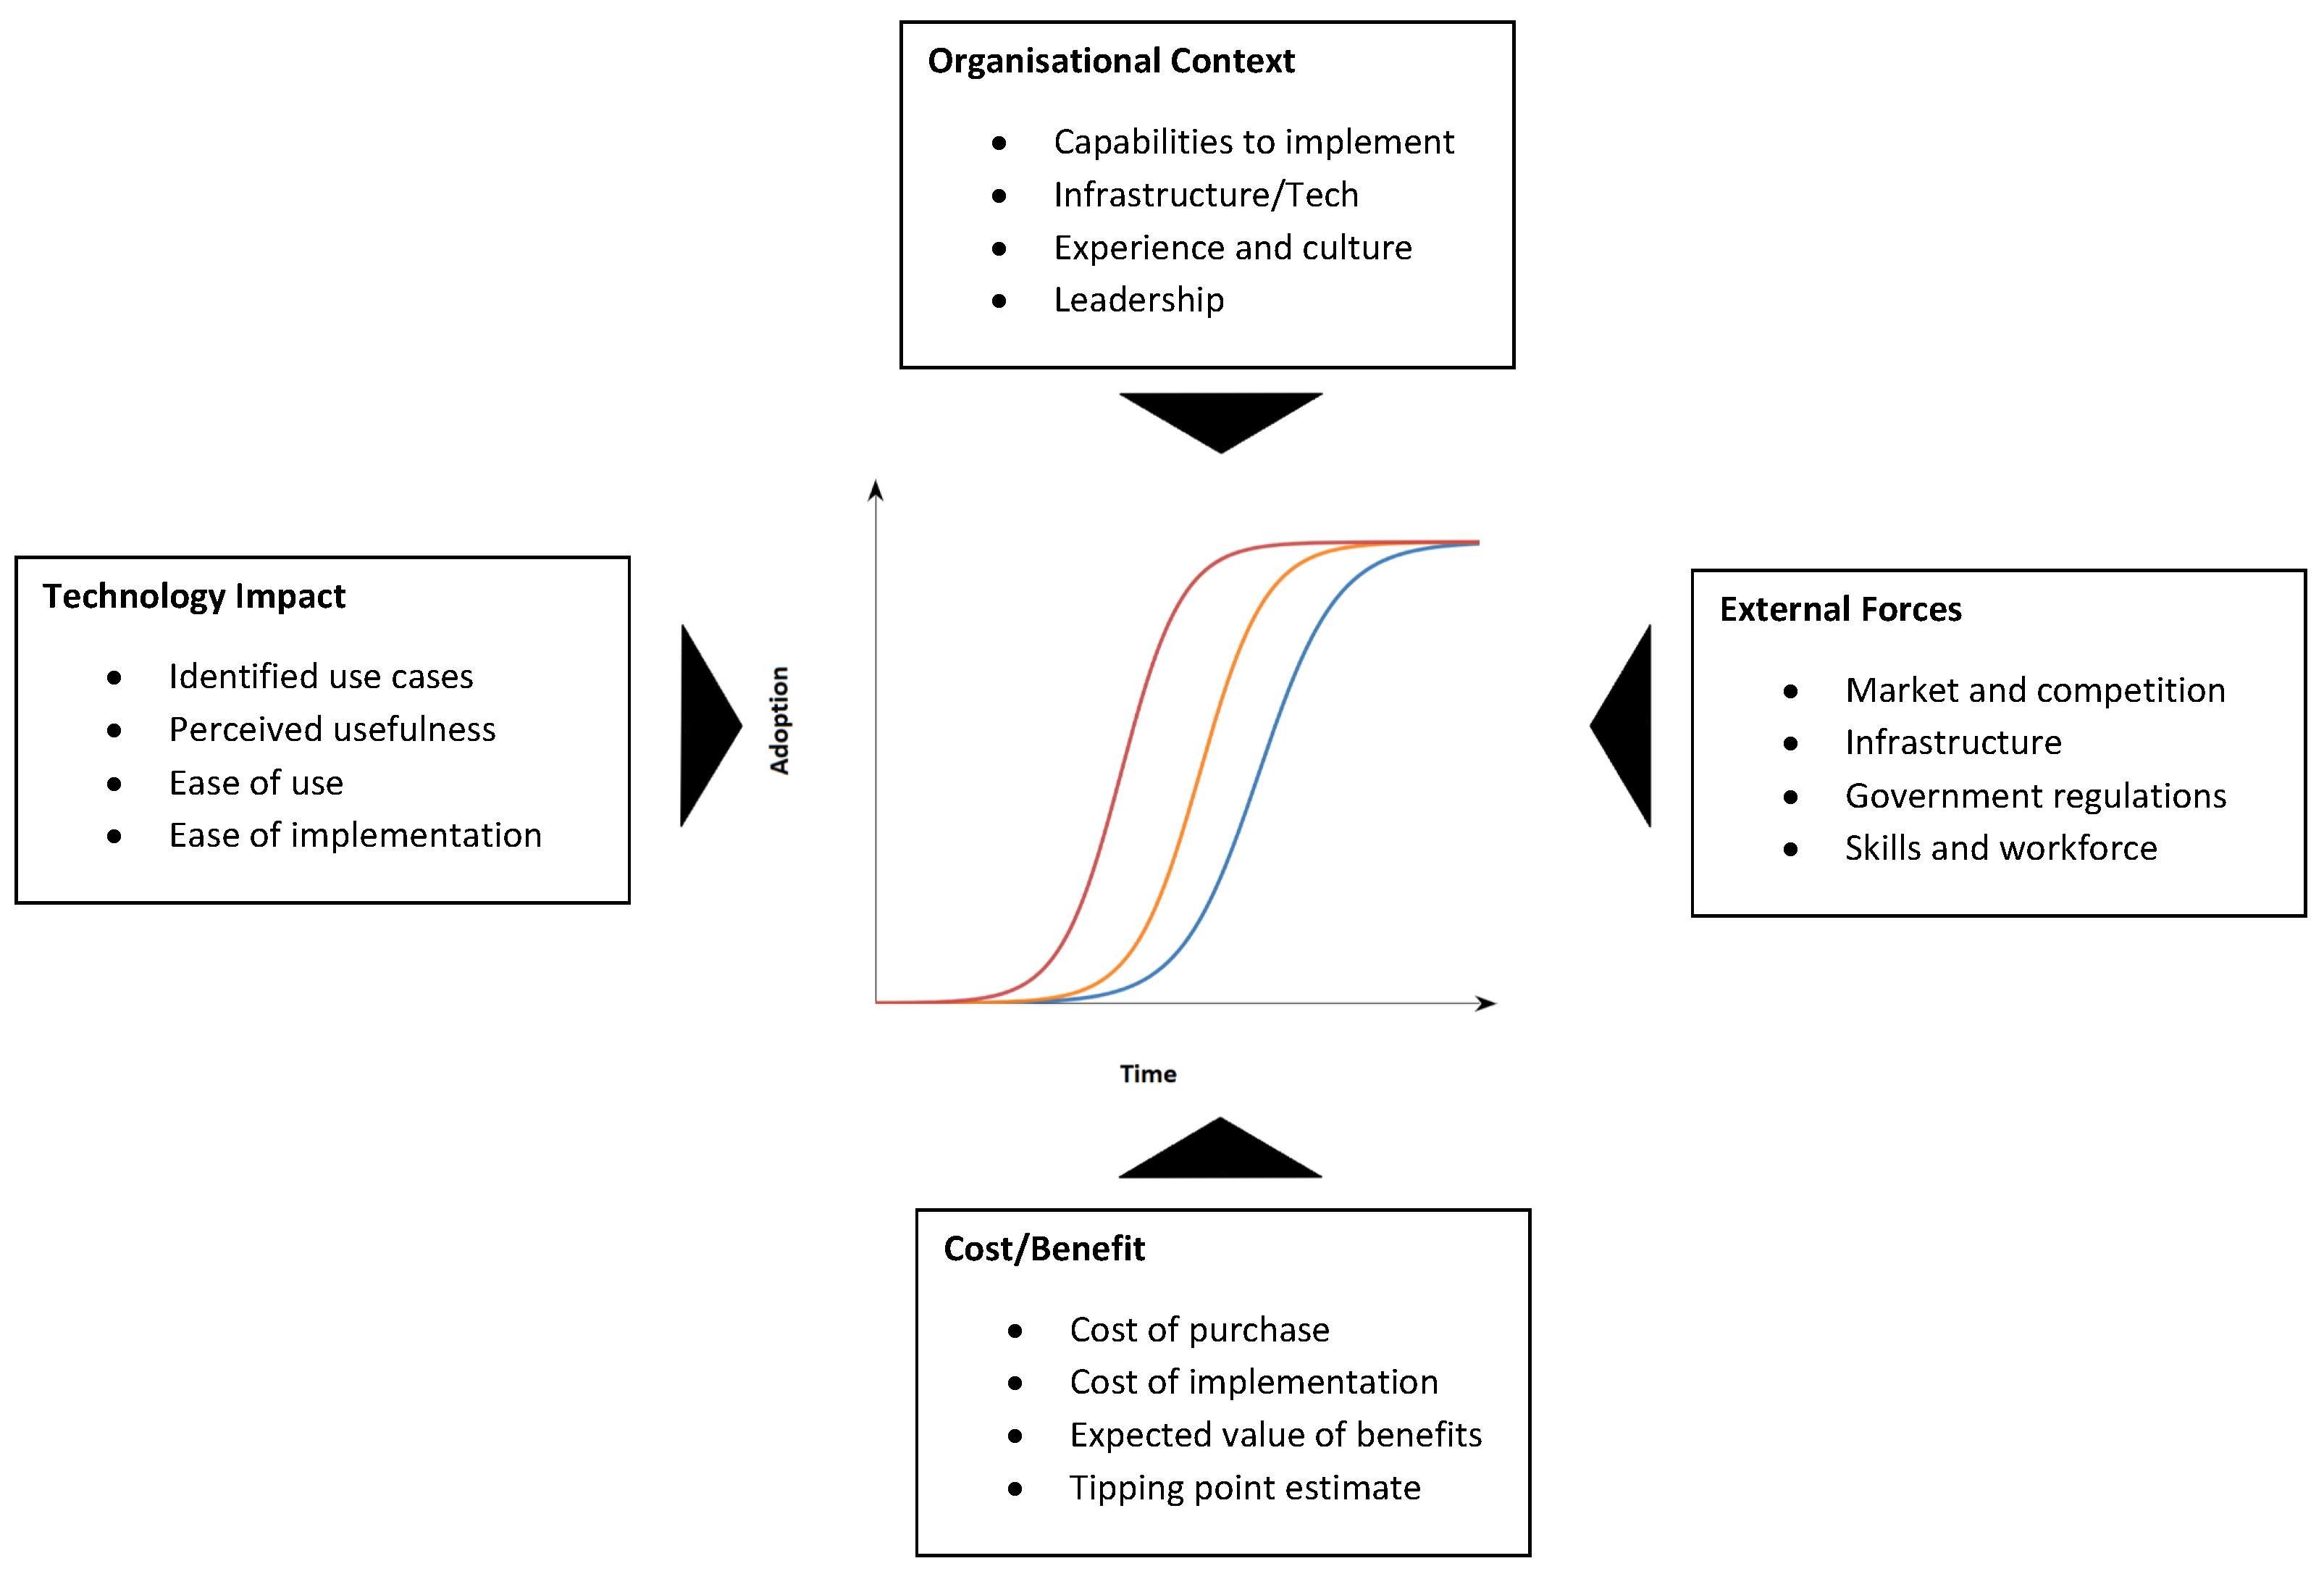
Emerging Technology Adoption S-Curve, (ETASC). Our technology adoption model, referred to as Emerging Technology Adoption S-Curve (ETASC), is an extension of all the above prior models (see Section 2) and is used to determine the adoption of technology specific to a country, industry, and organization. A typical technology adoption S-Curve with all its influencing factors is shown in Figure 3. The tipping point of the curve corresponds to the time when the costs are reduced over time, and the value would be realized. The output of the adoption model will help enterprises in making optimal decisions and policies and also in market planning [35].
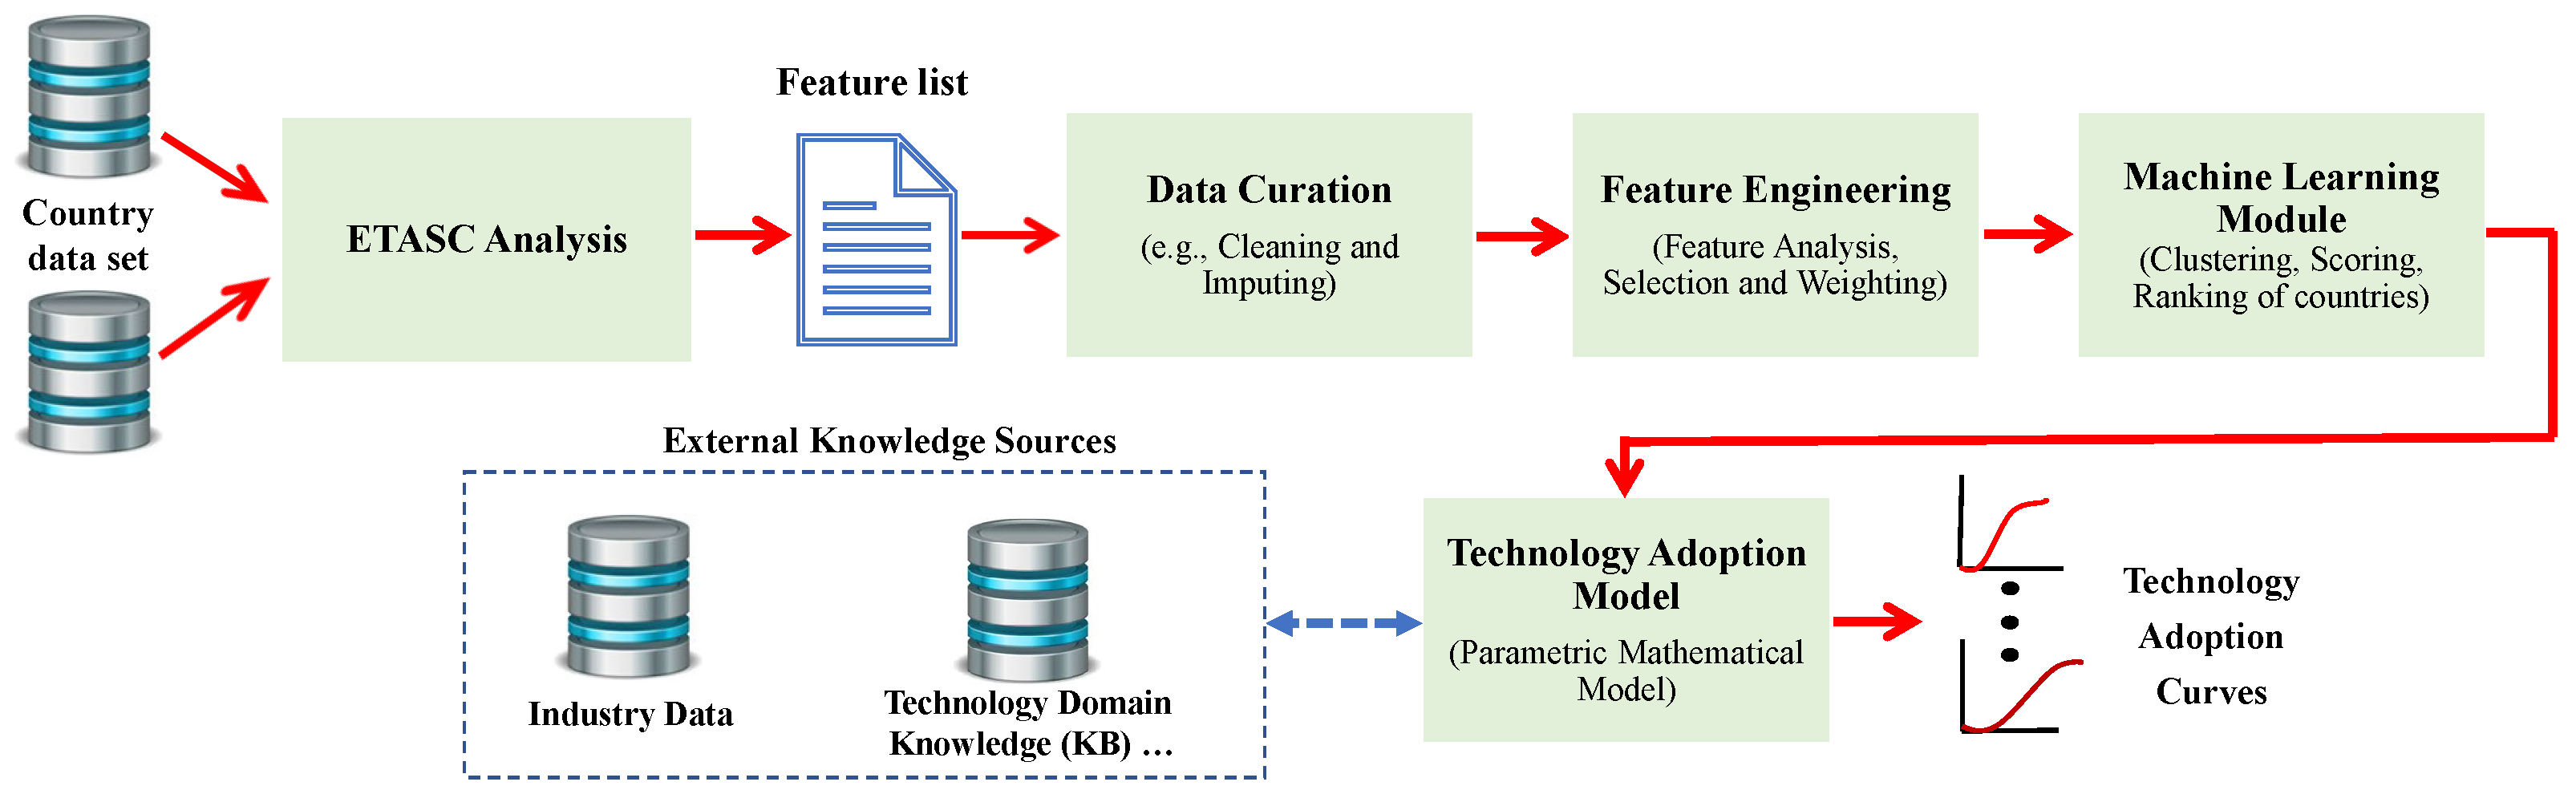
The methodology for predicting the impact of emerging technologies using the ETASC model can be formulated using the framework illustrated in Figure 4. The framework consists of four stages:
- Data Curation: In the first stage, the ETASC analysis is performed to gather performance indicators for each country from multiple data sources, which include patent databases, scientific publications, and technological news sources. The data is then preprocessed to ensure consistency and completeness, after which missing values are imputed using statistical techniques such as mean imputation or regression imputation.
- Feature Engineering: In this stage, a novel method is used to extract and weigh the countries’ influencing features. This involves identifying the key factors that impact technology adoption, such as economic development, regulatory environment, cultural norms, and infrastructure. The features are then assigned weights based on their relative importance in predicting adoption.
- Clustering: In this stage, a machine learning-based algorithm is used to group countries based on their weighted features and rank them. This involves selecting an appropriate clustering method, such as k-means or hierarchical clustering, and determining the optimal number of clusters using techniques such as the elbow method or silhouette analysis. The resulting clusters are then ranked based on their adoption potential.
- Adoption Modelling: in the fourth stage, the ETASC model combines the country rankings with the industry adoption data to estimate the impact of the emerging technology for each Country-Industry pair and companies. The model uses a novel parametric mathematical adoption model enriched by technology domain knowledge.
This framework provides a structured and systematic approach for predicting the impact of emerging technologies, ensuring a high level of accuracy and reliability in the prediction results.
ETASC Analysis. The ETASC model requires an adoption curve describing the fastest possible technology adoption by a country and industry. This ‘base’ curve is then adjusted to the likely adoption of the same technology by other countries and industries based on the collected global indicators. The initial base curve is determined through bottom-up research like the one for RPA in Section 4. We have evaluated each country’s technology acceptance and readiness on five different pillars. These pillars on our ETASC analysis platform are grouped as: Professionals and human resources, Market and competition, Finance and Economy, Infrastructure, and Societal attributes. Each pillar of our ETASC analysis could be divided into some subcomponents or productivity drivers, which are the basis of the countries’ assessment and scoring. This grouping schema and some attributes of each group are presented in Table 2.
Countries are assessed annually on their productivity drivers by international organizations such as World Bank, World Economic Forum (WEF), UNESCO, and even Central Intelligence Agency (CIA). Among these, WEF annual reports and datasets are the most comprehensive and up-to-date, including twelve productivity drivers or pillars of the countries. The twelve pillars of WEF have more than one hundred indicators, sourced from international organizations, academic institutions, and non-governmental organizations. The values of 169 indicators for 130 countries in 2017–2019, collected from WEF, CIA factbook, Worldbank, and UNESCO, are used as our main data source. These indicators are used as the countries’ attributes in our Machine Learning based model. This schema and associated attributes reflect the motivation and ability of a country’s public and private sectors to adopt new and emerging technologies.
Feature Selection and Weighting. In the feature engineering phase, the goal was to identify the most relevant and non-redundant attributes for the technology adoption topic. This involved a two-step process of data cleaning and feature selection. In order to select the optimal features for this approach, a two-step process of data cleaning and feature selection was performed. The data cleaning phase involved imputing missing values using regression models and normalizing and standard scaling to ensure all attributes were on the same scale. The feature selection step was performed using correlation analysis, with a focus on identifying attributes that were highly correlated with the Mobile broadband subscription per 100 population attribute. This step ensured that only attributes that were strongly correlated with technology adoption were retained for further analysis. The use of multiple regression models for imputing missing values and correlation analysis for feature selection ensures that the dataset is accurate, relevant, and useful for subsequent analysis and modeling techniques. Feature selection is a critical step in the data analysis process as it reduces the dimensionality of the dataset and improves the accuracy and efficiency of the subsequent analysis or modeling techniques.
Having collected all available country data, the data required cleaning. In this data cleaning phase, some data points were imputed by projecting their corresponding values from prior years, if available, otherwise predicted by the best-fit regression model. Three regression models, including linear, random forest, and XGBoost, were fitted, and the best-fit model was selected for each missing attribute. Normalizing and standard scaling was applied to this clean dataset before doing any more analysis or processing.
Among those 169 normalized attributes, some could be redundant, and another part could be less relevant to the technology adoption topic. Feature selection for eliminating redundant or non-relevant attributes is made by running the correlation analysis between each pair of attributes, including the countries’ Mobile broadband subscription per 100 population attribute. “Mobile broadband subscription per 100 population” is one of the WEF indicators that could be considered a measure and benchmark for technology acceptance and adoption in different countries. The Pearson correlation coefficient is calculated as in Equation (2) where X = (, , …, ) is a typical attribute in the set of all 169 attributes of 130 countries, and Y = (, , …, ) is the “Mobile broadband subscription per 100 population” attribute of all 130 countries. and are the means of the values of the x-variable and y-variable, respectively.
After doing this correlation analysis, attributes with an absolute correlation score of less than 0.2 with the Mobile broadband subscription attribute or an absolute correlation of greater than 0.95 with other attributes but Mobile broadband subscription were removed from the list, and finally, 137 attributes left for the countries clustering, scoring, and model training purposes. The correlation score of each attribute is used to weigh the attributes before using them as input to our machine-learning algorithm. A machine learning clustering technique that optimizes the K-means objective function was applied to these weighted features. All 130 countries were grouped into 3 clusters based on their new technology adoption capabilities. These three groups are labeled as (fast, average, and slow) in technology adoption, and the number of countries that fall in each group is 28, 57, and 45, respectively. After this clustering step, a score is calculated for each country in the clusters, which is the sum of all the weighted features. Finally, the countries in each cluster are ranked based on this final score. The list of some countries in each cluster and their scores are presented in Table 3.
Discussion. In the machine learning step, after the attribute selection process based on correlation analysis, the remaining 137 attributes were used as input features for the machine learning algorithm. It is important to note that the correlation score of each attribute was used to weigh the attributes before using them as input to the machine learning algorithm. This means that attributes with a higher correlation score would have a higher weight in the model, and vice versa. The clustering technique used in this study was K-means clustering, which is an unsupervised learning algorithm that partitions data points into K clusters based on their similarity. In this case, K was set to 3 to group countries based on their technology adoption capabilities. K-means clustering was chosen as it is a commonly used technique for clustering analysis and is suitable for large datasets. To optimize the K-means objective function, an appropriate value of K was chosen that resulted in the most meaningful and interpretable clusters. This value was determined through an iterative process of evaluating the within-cluster sum of squares (WCSS) and silhouette score for different values of K. Once the clustering was performed, a score was calculated for each country in the clusters by summing the weighted features. This score represents the overall technology adoption capability of the country based on the selected attributes. Finally, the countries in each cluster were ranked based on this final score. It is important to note that the selection of the attributes and the choice of the machine learning algorithm can significantly impact the results of the clustering analysis. Therefore, it is essential to carefully evaluate the performance of different algorithms and attribute selection techniques to ensure that the resulting clusters are meaningful and reliable.
Sectoral Dependency. Adopting emerging technology not only depends on the country and its features, but also on the maturity of the different sectors. Recent research from McKinsey Global Institute (MGI) has found a large and growing gap between various industries in the U.S. economy [36]. To the best of the author’s knowledge, the most comprehensive research on the digital intensity of the sectors has been carried out by OECD (Organization for Economic Cooperation and Development), which covers 36 ISIC Rev.4 sectors over the period 2001–2015 in its member countries [37]. Due to the multidimensionality of the collected information from a wide spectrum of industries and countries, this research is called a global sector taxonomy. The digital intensity of the sectors has been studied from three main aspects: Technological components, Human capital, and how digital technology would change the sector’s impact on the economy. Then the indicators used in the classification of the industries’ digital intensity in OECD global taxonomy were selected as the share of ICT tangible and intangible (e.g., software) investment, the share of purchases of intermediate ICT goods and services, the stack of robots per hundreds of employees, the share of ICT specialists in total employment, and the share of turnover from online sales in each industry. These attributes would help us better understand the digital transformation’s sectoral heterogeneity. Hence, we decided to use this global sector taxonomy results in classifying the technology adoption of each industry in our method. The list of some industries and their technology adoption rates resulting from the global sector taxonomy is presented in Table 4.
4. Technology Adoption Curve Prediction
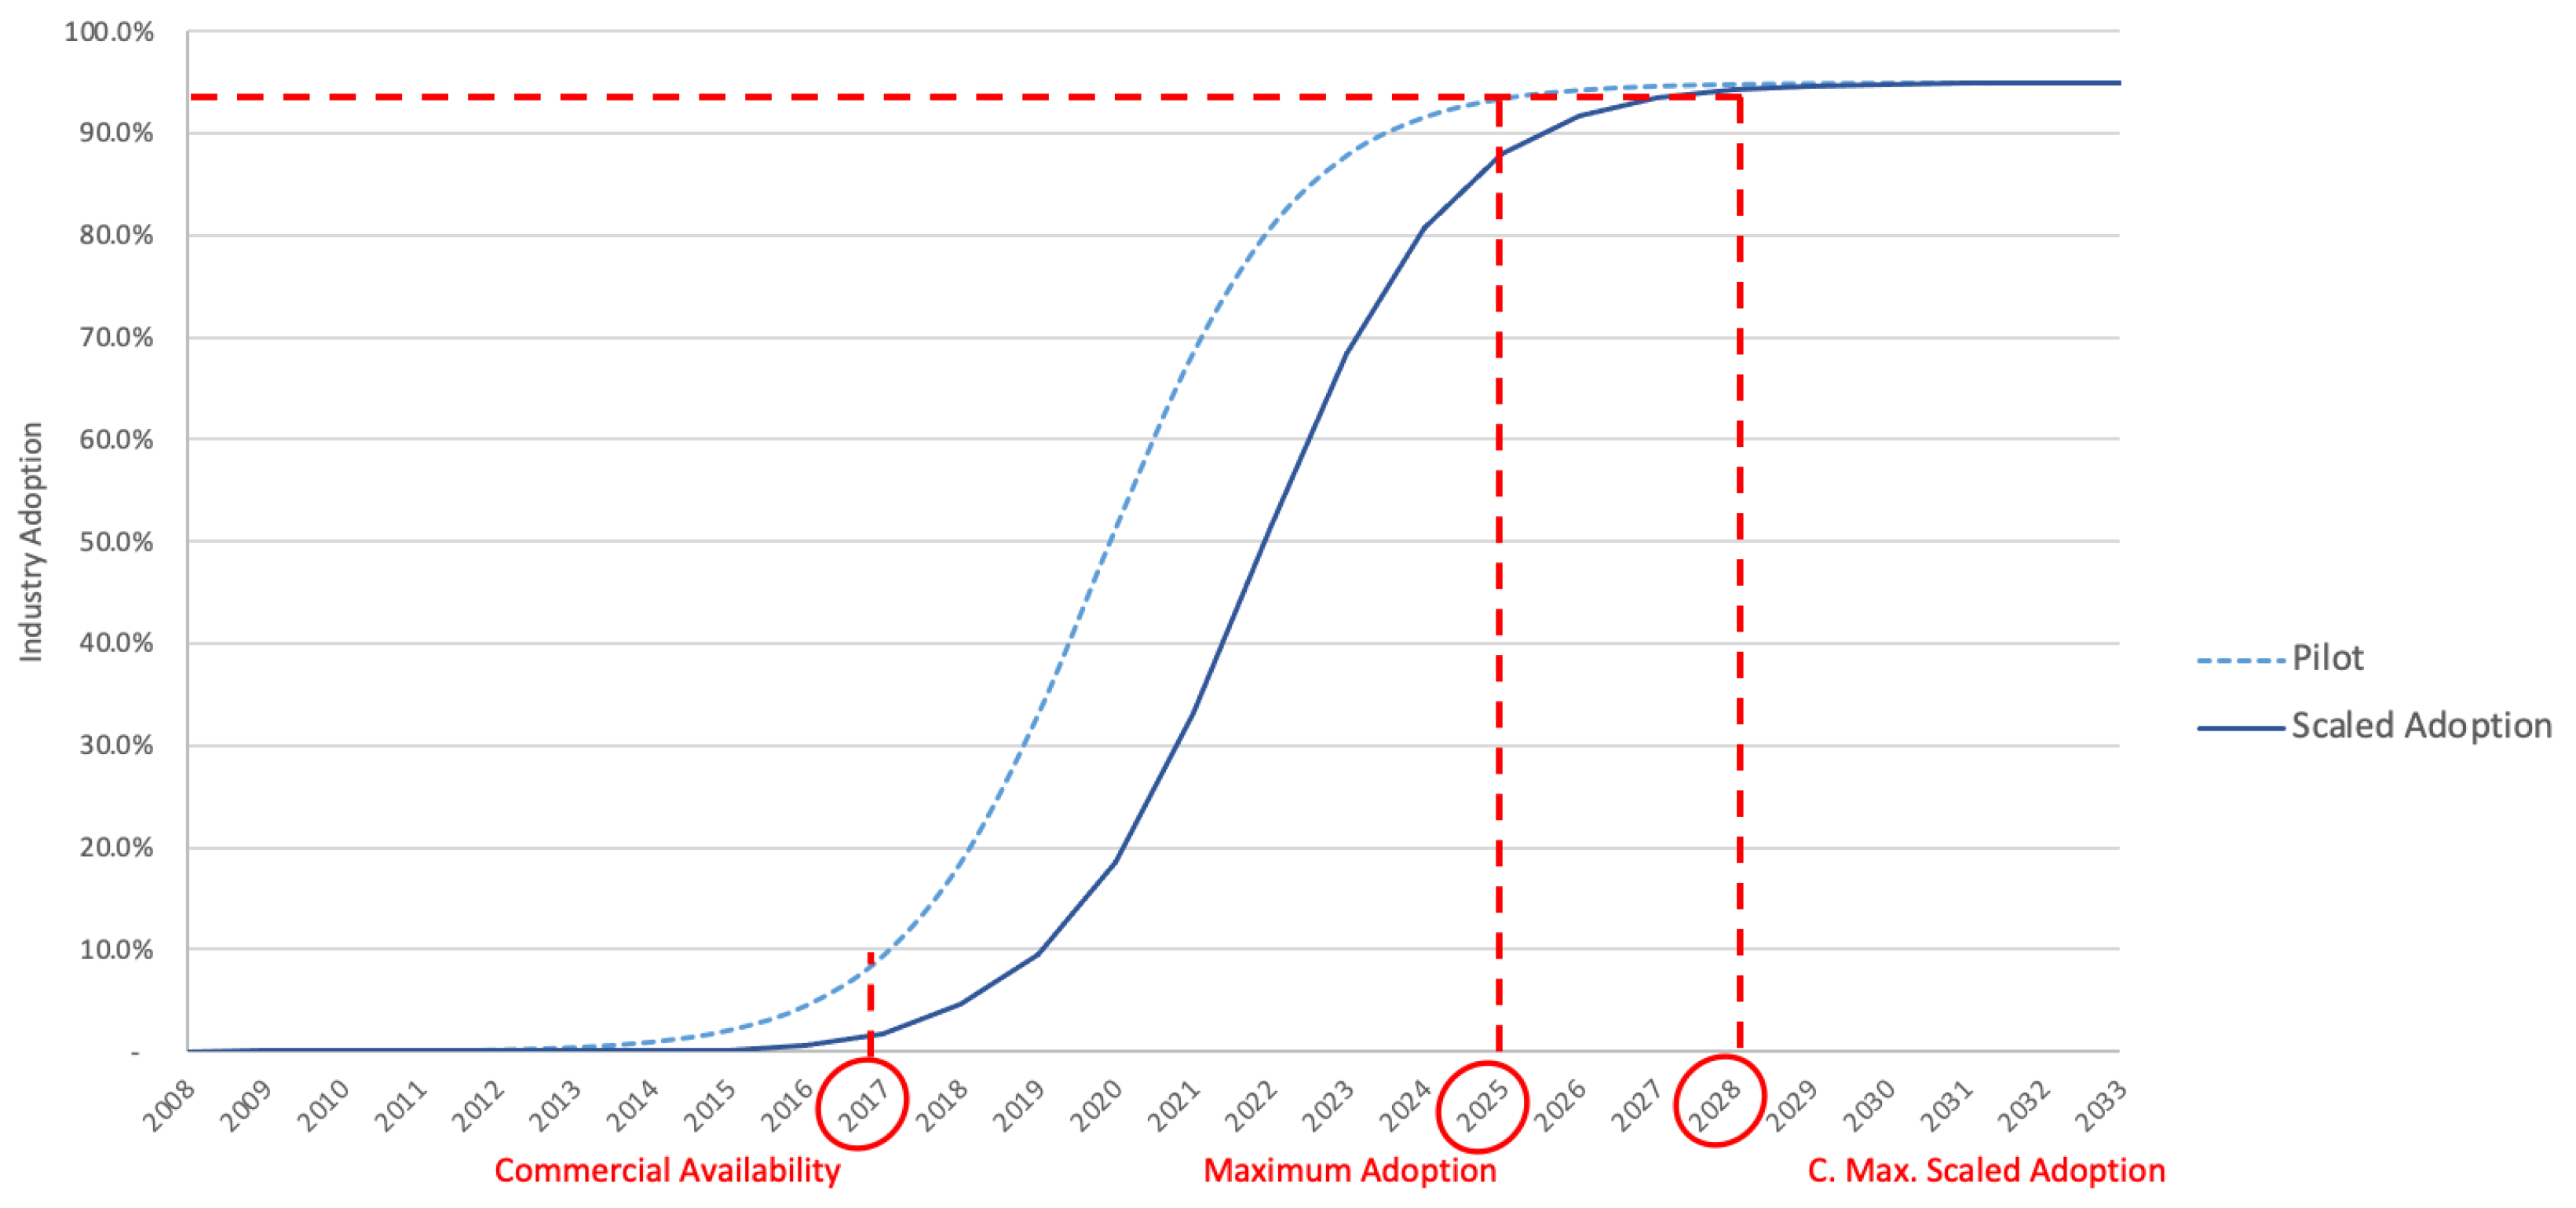
Base Adoption Curve To seed the ETASC model, we first model the fastest possible S-curve for emerging technology. Here we develop a curve for Robotic Process Automation (RPA). RPA is software commonly known as a “robot” or bot. RPA technology can perform rule-based processes. Looking at Google trends, VC fundings, start-ups, and patents statistics on RPA since 2010 till now and also Deloitte’s global RPA survey [38], has identified that the technology was commercially available in 2017, as shown in Figure 5. RPA is a cost-saving technology, and it’s estimated that its adoption will be over 90%. Based on our research and study of the trends, we estimate that 90% of organizations in a fast-adopting industry will have completed a pilot project for RPA technologies by 2024, and the mass-scaled adoption will be reached in 2028 in a fast-adopting country like Singapore or the United States as shown in Figure 6.
Mathematical Adoption Model The parametric hyperbolic trigonometric function is a mathematical equation proposed in Equation (3) to model the S-shaped adoption curves in the Bass model, which is a widely used model to describe the diffusion of new products or technologies in a population. The equation takes into account four parameters: , , , and , where the likelihood of adoption is a function of time (t) and these parameters. Specifically, the equation is of the following form:
where is the hyperbolic tangent function.
To apply this equation to specific countries and industries, we use the ranking scores obtained in the previous section to interpolate the k parameters for each (Country, Industry) pair. The ranking scores are based on factors such as the country’s level of economic development, technological infrastructure, and social and cultural characteristics, as well as the industry’s level of competitiveness, market size, and regulation.
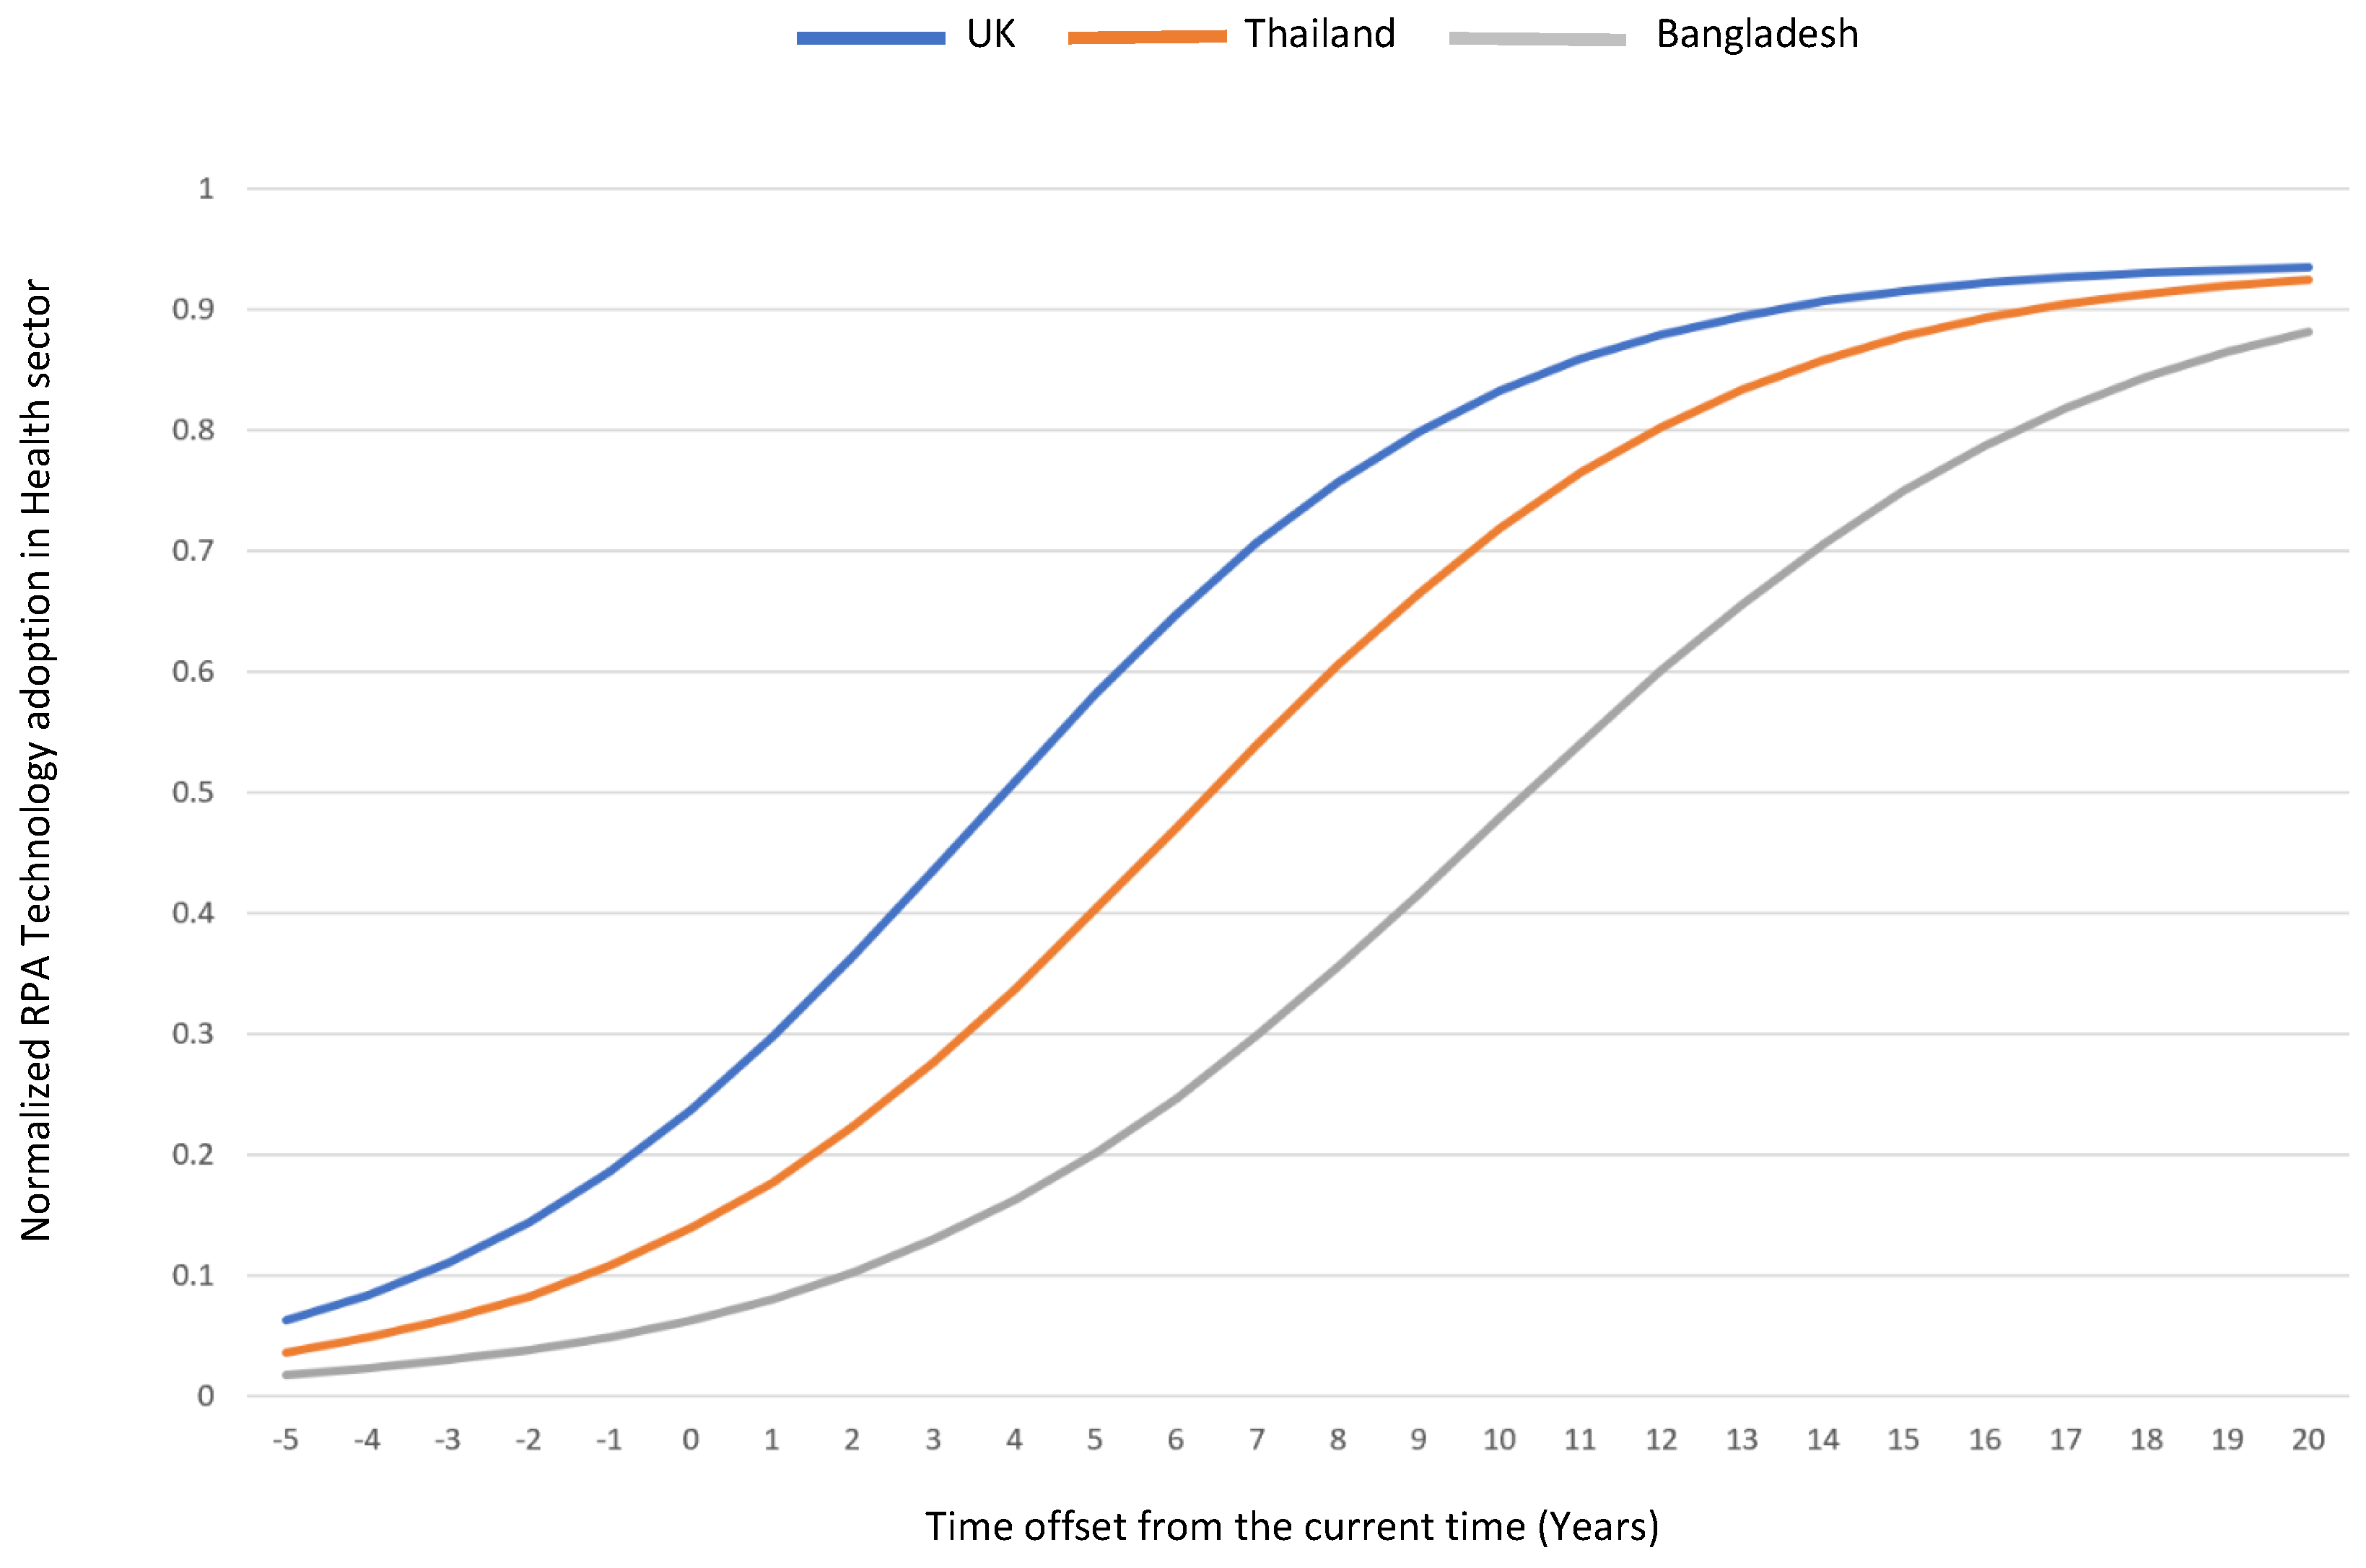
Once we have these interpolated k parameters, we can predict the likelihood of technology adoption over a time interval of 20 years using the resulting S-shaped curve. This allows us to estimate how quickly or slowly a particular technology will diffuse in a given country and industry, taking into account its specific characteristics. As an example, we applied our model to RPA (Robotic Process Automation) technology adoption in the finance and insurance industry in three sample countries: Singapore, Indonesia, and Zimbabwe. These countries were chosen to represent fast, average, and slow adopters within their respective clusters. The resulting k parameters for each country and industry pair are listed in Table 5, and the corresponding adoption curves are shown in Figure 7. These curves illustrate the predicted likelihood of adoption over time for each country and industry, based on their unique characteristics and the parameters of the hyperbolic trigonometric function.
Discussion. The proposed model would facilitate the prediction of emerging technologies’ impact on each country and industry. This novel method can help public and private sector policymakers to make timely and accurate decisions about the future job market. In this way, organizations could control the unemployment rate and minimize the related costs. Governments and business owners would implement this control in various forms, such as reshaping their organizational structures, cultures, and processes to fit these changing developments. The up-skilling program for the current employees also would prepare them for the inevitable job transitions. All these insightful results have been obtained by leveraging AI and ML technologies on the available data on the job market and emerging technologies. The accuracy of our model prediction depends on the accuracy and regular update of both the countries and the industries’ data sets. More research is also needed to provide more validation and accuracy of the basis adoption curves provided by external knowledge sources.
A Cognitive Model for Technology Adoption can address the influence of external and internal factors on the Bass model adoption curve by considering the cognitive processes and decision-making of individuals. The model can incorporate variables such as beliefs, attitudes, and expectations, which are shaped by factors such as advertising and perceived usefulness, and determine their impact on the adoption curve. For instance, the cognitive model can explore how advertising messages are processed by potential adopters and how these messages influence their beliefs and attitudes towards the technology. It can also consider how individuals perceive the usefulness of the technology based on their prior experiences and expectations. By integrating cognitive processes and decision-making into the Bass model, the Cognitive Model for Technology Adoption can provide a more comprehensive understanding of the factors that shape the adoption curve. This can enable technology providers to design more effective strategies for promoting and encouraging adoption by tailoring their messages and interventions to the specific cognitive processes and decision-making of potential adopters.
5. Conclusions, Future Work, and Research Directions
Using country and industry attributes, we succeeded in applying our machine learning approach to cluster countries and industries in terms of their technology adoption rate and then calculated a ranking score for each country. Then a parametric mathematical model is proposed based on the Bass adoption tech curve model, which could be fitted to all adoption rate classes. The parameters of this mathematical model was adjusted for each specific (country-industry) pair using the outputs of our machine-learning model. Finally, from the adjusted mathematical model, the technology adoption extent of each country-industry pair to a specific emerging technology was calculated for the next 15 years. As an example, the adoption of RPA was modeled for several countries. Governments and firms could use these adoption scenarios to better prepare their workforce for the future of work, where many tasks are performed by technology.
5.1. Future Work
The emergence of Generative Artificial Intelligence (AI) and Industrial Revolution 4.0 presents a significant opportunity to enhance the cognitive model for technology adoption. In future work, we explore how these technologies can be integrated into the model to provide personalized recommendations and automate tasks. Additionally, these technologies can be leveraged to gain insights into consumer behavior, which can help companies design and market products that better align with the needs of their target audience. As an ongoing work, we are investigating how the integration of Generative AI and Industrial Revolution 4.0 can impact the coefficients of the Bass model and other mathematical models that are commonly used to model technology adoption. This research can provide valuable insights into how these technologies can shape the adoption curve and inform marketing strategies. Another area of future research is to explore how the cognitive model for technology adoption can be adapted to account for the impact of emerging technologies, such as Augmented Reality (AR) and Virtual Reality (VR). These technologies have the potential to significantly alter the way individuals interact with technology and may require a re-evaluation of the current cognitive model.
In future work, we also aim to conduct a sensitivity analysis and simulation to ensure a robust analysis of the proposed approach for developing a Cognitive Model for Technology Adoption. This will enable us to identify and address potential weaknesses or limitations in the model and ensure its effectiveness in practical applications. By undertaking this additional step, we can strengthen the validity and reliability of our findings and contribute to the development of a more comprehensive understanding of the factors that influence technology adoption. Our focus also extends to establishing a connection between the cognitive model for technology adoption and recommender systems [13]. This is important as it can help understand how individuals process and make decisions about technology recommendations. By understanding the cognitive processes that individuals use when evaluating recommendations, recommender systems can be designed to better align with those processes, making it more likely that individuals will adopt the technologies being recommended. Additionally, by understanding how individuals make decisions about technology recommendations [13], it can also identify potential biases or misconceptions that individuals may have, which can be addressed to increase trust and adoption. Other future works may include Investigating the effectiveness of different design strategies for increasing technology adoption, such as user-centered design, gamification, and persuasive design. Exploring the role of trust in technology adoption, such as how to trust in the technology, the company, and the government influences adoption decisions, could be another future work.
5.2. Research Direction
In the following, we discuss a few research directions that can be pursued in developing a cognitive model for technology adoption: (i) Exploring the impact of cognitive factors on technology adoption: This research direction involves examining how cognitive factors such as perception, beliefs, attitudes, and decision-making influence the adoption process. For example, researchers can investigate how individuals’ perception of the benefits and risks of technology affects their willingness to adopt it; (ii) Investigating individual differences in cognitive abilities and technology adoption: This research direction involves examining how individual differences in cognitive abilities, such as cognitive load and mental workload, impact technology adoption. For example, researchers can explore how individuals with high cognitive load may be less likely to adopt new technology due to their limited attentional resources; (iii) Examining the role of emotions in technology adoption: This research direction involves exploring how emotions, such as anxiety or excitement, impact technology adoption; (iv) Developing interventions to facilitate technology adoption: This research direction involves developing interventions and strategies that facilitate the adoption of new technologies. (v) Applying the model to different contexts: This research direction involves applying the Cognitive Model for Technology Adoption to different contexts, such as healthcare or education, to determine its generalizability and effectiveness in predicting and explaining technology adoption patterns in different populations.
Author Contributions
Conceptualization, F.S., R.A.G. and A.B.; methodology, F.S., A.B. and R.A.G.; validation, N.N., N.M.C. and S.R.; formal analysis, F.S. and R.A.G.; writing—original draft preparation, F.S.; writing—review and editing, All authors; supervision, R.A.G. and A.B.; project administration, F.S.; funding acquisition, R.A.G. and A.B. All authors have read and agreed to the published version of the manuscript.
Funding
We acknowledge the Centre for Applied Artificial Intelligence at Macquarie University and Faethm by Pearson for funding this research.
Data Availability Statement
Not applicable.
Conflicts of Interest
The authors declare no conflict of interest.
References
- Venkatesh, V.; Bala, H. Technology acceptance model 3 and a research agenda on interventions. Decis. Sci. 2008, 39, 273–315. [Google Scholar] [CrossRef] [Green Version]
- Straub, E.T. Understanding technology adoption: Theory and future directions for informal learning. Rev. Educ. Res. 2009, 79, 625–649. [Google Scholar] [CrossRef] [Green Version]
- Featherman, M.; Jia, S.J.; Califf, C.B.; Hajli, N. The impact of new technologies on consumers beliefs: Reducing the perceived risks of electric vehicle adoption. Technol. Forecast. Soc. Chang. 2021, 169, 120847. [Google Scholar] [CrossRef]
- Montes de Oca Munguia, O.; Pannell, D.J.; Llewellyn, R. Understanding the adoption of innovations in agriculture: A review of selected conceptual models. Agronomy 2021, 11, 139. [Google Scholar] [CrossRef]
- Agrawal, A.; Gans, J.; Goldfarb, A. The Economics of Artificial Intelligence: An Agenda; University of Chicago Press: Chicago, IL, USA, 2019. [Google Scholar]
- Koh, L.; Orzes, G.; Jia, F.J. The fourth industrial revolution (Industry 4.0): Technologies disruption on operations and supply chain management. Int. J. Oper. Prod. Manag. 2019, 39, 817–828. [Google Scholar] [CrossRef]
- West, D.M. The Future of Work: Robots, AI, and Automation; Brookings Institution Press: Washington, DC, USA, 2018. [Google Scholar]
- Alsheibani, S.; Cheung, Y.; Messom, C. Artificial Intelligence Adoption: AI-readiness at Firm-Level. PACIS 2018, 4, 231–245. [Google Scholar]
- Oliveira, T.; Fraga, M. Literature Review of Information Technology Adoption Models at Firm Level. Electron. J. Inf. Syst. Eval. 2011, 14, 110–121. [Google Scholar]
- Salahshour Rad, M.; Nilashi, M.; Mohamed Dahlan, H. Information technology adoption: A review of the literature and classification. Univers. Access Inf. Soc. 2018, 17, 361–390. [Google Scholar] [CrossRef]
- Rogers, E.M.; Singhal, A.; Quinlan, M.M. Diffusion of Innovations; Taylor & Francis: Oxfordshire, UK, 2014; pp. 432–448. [Google Scholar]
- Huang, C.C. Cognitive factors in predicting continued use of information systems with technology adoption models. Inf. Res. Int. Electron. J. 2017, 22, n2. [Google Scholar]
- Beheshti, A.; Yakhchi, S.; Mousaeirad, S.; Ghafari, S.M.; Goluguri, S.R.; Edrisi, M.A. Towards Cognitive Recommender Systems. Algorithms 2020, 13, 176. [Google Scholar] [CrossRef]
- Autry, C.W.; Grawe, S.J.; Daugherty, P.J.; Richey, R.G. The effects of technological turbulence and breadth on supply chain technology acceptance and adoption. J. Oper. Manag. 2010, 28, 522–536. [Google Scholar] [CrossRef]
- Baker, J. The technology–organization–environment framework. In Information Systems Theory; Springer: New York, NY, USA, 2012; pp. 231–245. [Google Scholar]
- Iacovou, C.L.; Benbasat, I.; Dexter, A.S. Electronic data interchange and small organizations: Adoption and impact of technology. In MIS Quarterly; Management Information Systems Research Center, University of Minnesota: Minneapolis, MN, USA, 1995; pp. 465–485. [Google Scholar]
- Panwar, S.; Kapur, P.; Singh, O. Modeling technology diffusion: A study based on market coverage and advertising efforts. Int. J. Syst. Assur. Eng. Manag. 2020, 11, 154–162. [Google Scholar] [CrossRef]
- Shamout, M.; Ben-Abdallah, R.; Alshurideh, M.; Alzoubi, H.; Kurdi, B.a.; Hamadneh, S. A conceptual model for the adoption of autonomous robots in supply chain and logistics industry. Uncertain Supply Chain Manag. 2022, 10, 577–592. [Google Scholar] [CrossRef]
- Belezas, F.; Daniel, A.D. Innovation in the sharing economy: A systematic literature review and research framework. Technovation 2022. pre-print. [Google Scholar] [CrossRef]
- Ramdani, B.; Raja, S.; Kayumova, M. Digital innovation in SMEs: A systematic review, synthesis and research agenda. Inf. Technol. Dev. 2022, 28, 56–80. [Google Scholar] [CrossRef]
- Mariani, M.M.; Machado, I.; Magrelli, V.; Dwivedi, Y.K. Artificial intelligence in innovation research: A systematic review, conceptual framework, and future research directions. Technovation 2022. pre-print. [Google Scholar] [CrossRef]
- Huang, M.H.; Rust, R.T. A strategic framework for artificial intelligence in marketing. J. Acad. Mark. Sci. 2021, 49, 30–50. [Google Scholar] [CrossRef]
- Xu, L.; Jia, F.; Lin, X.; Chen, L. The role of technology in supply chain decarbonisation: Towards an integrated conceptual framework. Supply Chain. Manag. Int. J. 2023. ahead-of-print. [Google Scholar]
- Guidolin, M.; Manfredi, P. Innovation Diffusion Processes: Concepts, Models, and Predictions. Annu. Rev. Stat. Its Appl. 2023, 10, 1–25. [Google Scholar] [CrossRef]
- Bass, F.M. A new product growth for model consumer durables. Manag. Sci. 1969, 15, 215–227. [Google Scholar] [CrossRef]
- The World Bank Data. Available online: https://data.worldbank.org/indicator/IT.CEL.SETS.P2 (accessed on 23 January 2021).
- Marikyan, D.; Papagiannidis, S.; Alamanos, E. Cognitive dissonance in technology adoption: A study of smart home users. Inf. Syst. Front. 2020, 1–23. [Google Scholar] [CrossRef]
- Barham, B.L.; Chavas, J.P.; Fitz, D.; Schechter, L. Receptiveness to advice, cognitive ability, and technology adoption. J. Econ. Behav. Organ. 2018, 149, 239–268. [Google Scholar] [CrossRef] [PubMed]
- Marikyan, D.; Papagiannidis, S.; Rana, O.F.; Ranjan, R. Blockchain adoption: A study of cognitive factors underpinning decision making. Comput. Hum. Behav. 2022, 131, 107207. [Google Scholar] [CrossRef]
- Kai-ming Au, A.; Enderwick, P. A cognitive model on attitude towards technology adoption. J. Manag. Psychol. 2000, 15, 266–282. [Google Scholar] [CrossRef]
- Sangaiah, A.K.; Goli, A.; Tirkolaee, E.B.; Ranjbar-Bourani, M.; Pandey, H.M.; Zhang, W. Big data-driven cognitive computing system for optimization of social media analytics. IEEE Access 2020, 8, 82215–82226. [Google Scholar] [CrossRef]
- Yang, J.; Tang, Y.; Beheshti, A. Design methodology for service-based data product sharing and trading. In Next-Gen Digital Services. A Retrospective and Roadmap for Service Computing of the Future: Essays Dedicated to Michael Papazoglou on the Occasion of His 65th Birthday and His Retirement; Springer: New York, NY, USA, 2021; pp. 221–235. [Google Scholar]
- Beheshti, A.; Ghodratnama, S.; Elahi, M.; Farhood, H. Social Data Analytics; CRC Press: Boca Raton, FL, USA, 2022. [Google Scholar]
- Beheshti, A. Knowledge base 4.0: Using crowdsourcing services for mimicking the knowledge of domain experts. In Proceedings of the 2022 IEEE International Conference on Web Services (ICWS), Barcelona, Spain, 10–16 July 2022; IEEE: New York, NY, USA, 2022; pp. 425–427. [Google Scholar]
- Norton, J.A.; Bass, F.M. A diffusion theory model of adoption and substitution for successive generations of high-technology products. Manag. Sci. 1987, 33, 1069–1086. [Google Scholar] [CrossRef] [Green Version]
- Manyika, J.; Ramaswamy, S.; Khanna, S.; Sarrazin, H.; Pinkus, G.; Sethupathy, G.; Yaffe, A. Digital America: A Tale of the Haves and Have-Mores; McKinsey Global Institute: Washington, DC, USA, 2015; pp. 1–120. [Google Scholar]
- Calvino, F.; Criscuolo, C.; Marcolin, L.; Squicciarini, M. A Taxonomy of Digital Intensive Sectors; OECD: Paris, France, 2018. [Google Scholar]
- Deloitte Global RPA Survey. Available online: https://www2.deloitte.com/ro/en/pages/technology-media-and-telecommunications/articles/deloitte-global-rpa-survey.html. (accessed on 8 June 2021).
Figure 1.
Bass model adoption curves.The external and internal influencing factors such as advertising and perceived usefulness would shape the adoption curve through its mathematical models’ coefficients.
Figure 1.
Bass model adoption curves.The external and internal influencing factors such as advertising and perceived usefulness would shape the adoption curve through its mathematical models’ coefficients.

Figure 2.
Internet (a) and Mobile phone (b) users adoption curves, two examples that support/validate the S-shape property of the technology adoption curve.
Figure 2.
Internet (a) and Mobile phone (b) users adoption curves, two examples that support/validate the S-shape property of the technology adoption curve.

Figure 3.
Technology Adoption S-Curve and influencing factors.

Figure 4.
A snapshot of our Data-Driven pipeline for Technology adoption curve prediction with five stages, including the Machine Learning module and a novel parametric mathematical model stages.
Figure 4.
A snapshot of our Data-Driven pipeline for Technology adoption curve prediction with five stages, including the Machine Learning module and a novel parametric mathematical model stages.

Figure 5.
The trends of RPA technology’s attributes, including Google trend, VC Funding, Start-ups, and Patents trends in the past decade.
Figure 5.
The trends of RPA technology’s attributes, including Google trend, VC Funding, Start-ups, and Patents trends in the past decade.

Figure 6.
Fastest RPA adoption by firms in a fast adopting industry/country.

Figure 7.
Normalized RPA Technology adoption curves in the health sector of three sample countries, the UK, Thailand, and Bangladesh, represent the fast, average, and slow adoption groups, respectively. The horizontal axis represents Normalized RPA Technology adoption in the Health sector, and the vertical axis represents Time offset from the current time in years.


Table 1.
Comparison of Related Work in the field summarizing the main focus, Key constructs/variables, and key findings.
Table 1.
Comparison of Related Work in the field summarizing the main focus, Key constructs/variables, and key findings.
| Model/Approach | Main Focus | Key Constructs/Variables | Key Findings |
|---|---|---|---|
| Technology Acceptance Model (TAM) | Individual-level technology adoption | Perceived Usefulness, Perceived Ease of Use | Perceived Usefulness and Perceived Ease of Use consistently explain 40% of variance in an individual’s intention to use and implement technology. |
| Innovation Diffusion Theory (IDT) | Population-level technology adoption | Five adopter categories: Innovators, Early Adopters, Early Majority, Late Majority, Laggards | Demand for innovation follows an S-shaped curve, with an early minority leading to a tipping point of mass take-up, followed by a plateau. |
| Technology, Organisation and Environment (TOE) Framework | Organisational-level technology adoption | Internal and external technological, organisational, and environmental context | TOE framework is found superior to IDT to explain technology adoption. |
| Electronic Data Interchange (EDI) adoption model | Organisational-level technology adoption | Perceived benefits, organizational readiness (available financial and technological resources), external pressure (competition) | Perceived benefits, organizational readiness, and external pressure predict the speed of technology adoption by firms. |
| Bass Model | Market-level technology adoption | Coefficient of external influence, coefficient of internal influence | The finite difference of the cumulative market penetration of a new product or technology can be expressed by the Bass Model equation. The impact of advertising on adoption curves can be observed, and stopping the advertisement of new products and technologies would result in delayed and slower adoption by the target societies. |
| Cognitive Model | Individual-level technology adoption | Cognitive processes, perceptions, decision-making | A cognitive model can help to understand how individuals perceive and evaluate the risks and benefits of new technology, and how this influences their decision to adopt or not. It can also help understand how individuals perceive and make decisions about privacy risks when adopting new technologies. |
Table 2.
Some indicators of the countries and their grouping.
| Attribute | Group | |
|---|---|---|
| 1 | Digital skills among active population | Professionals and Human resources |
| 2 | Technicians and associate professionals | Professionals and Human resources |
| 3 | Senior officials and managers | Professionals and Human resources |
| 4 | Extent of market dominance | Market and Competition |
| 5 | Competition in professional services | Market and Competition |
| 6 | Collaboration between companies | Market and Competition |
| 7 | R&D expenditures | Financial and economy |
| 8 | Domestic credit to private sector | Financial and economy |
| 9 | Financing of SMEs | Financial and economy |
| 10 | E-Participation | Infrastructure |
| 11 | Mobile-broadband subscriptions | Infrastructure |
| 12 | Fibre internet subscriptions | Infrastructure |
| 13 | societal capital | societal |
| 14 | Efficiency of the legal framework in challenging regulations | societal |
| 15 | Conflict of interest regulation | societal |
Table 3.
List of some countries, their clusters, and scores.
| Country | Adoption Speed | Cluster | Score | |
|---|---|---|---|---|
| 1 | Singapore | Fast | 0 | 111.6559803 |
| 2 | Switzerland | Fast | 0 | 104.4918966 |
| 3 | United States | Fast | 0 | 101.4976655 |
| 4 | Netherlands | Fast | 0 | 96.44233507 |
| 5 | Finland | Fast | 0 | 95.98025303 |
| 6 | Spain | Average | 1 | 43.82418314 |
| 7 | Portugal | Average | 1 | 40.71621859 |
| 8 | Slovenia | Average | 1 | 37.04722678 |
| 9 | Czech Republic | Average | 1 | 36.92720008 |
| 10 | Lithuania | Average | 1 | 35.76320354 |
| 11 | Botswana | Slow | 2 | −17.68696894 |
| 12 | Kenya | Slow | 2 | −19.30727184 |
| 13 | Rwanda | Slow | 2 | −19.33175194 |
| 14 | Tajikistan | Slow | 2 | −25.03134229 |
| 15 | Ghana | Slow | 2 | −25.41625821 |
Table 4.
List of industries and their adoption rate.
| Industry | Adoption Rate | |
|---|---|---|
| 1 | Information and communication | Fast |
| 2 | Financial and insurance activities | Fast |
| 3 | Professional, scientific and technical activities | Fast |
| 4 | Administrative and support service activities | Fast |
| 5 | Manufacturing | Fast |
| 6 | Wholesale and retail trade; repair of motor vehicles and motorcycles | Fast |
| 7 | Public administration and defence; compulsory social security | Average |
| 8 | Education | Average |
| 9 | Human health and social work activities | Average |
| 10 | Arts, entertainment and recreation | Average |
| 11 | Other service activities | Average |
| 12 | Transportation and storage | Average |
| 13 | Accommodation and food service activities | Average |
| 14 | Mining and quarrying | Average |
| 15 | Agriculture, forestry and fishing | Slow |
| 16 | Electricity, gas, steam, and air conditioning supply | Slow |
| 17 | Water supply; sewerage, waste management and remediation activities | Slow |
| 18 | Construction | Slow |
| 19 | Real estate activities | Slow |
| 20 | Activities of households as employers | Slow |
| 21 | Activities of extraterritorial organizations and bodies | Slow |
Table 5.
Parameters of RPA Technology adoption curves, illustrating the typical K parameters for a sample country from each adoption group.
Table 5.
Parameters of RPA Technology adoption curves, illustrating the typical K parameters for a sample country from each adoption group.
| Country | ||||
|---|---|---|---|---|
| Singapore (Fast) | 47 | 47 | 18 | 1 |
| Indonesia (Average) | 47 | 47 | 14 | 6 |
| Zimbabwe (Slow) | 47 | 47 | 17 | 8 |
Disclaimer/Publisher’s Note: The statements, opinions and data contained in all publications are solely those of the individual author(s) and contributor(s) and not of MDPI and/or the editor(s). MDPI and/or the editor(s) disclaim responsibility for any injury to people or property resulting from any ideas, methods, instructions or products referred to in the content. |
© 2023 by the authors. Licensee MDPI, Basel, Switzerland. This article is an open access article distributed under the terms and conditions of the Creative Commons Attribution (CC BY) license (https://creativecommons.org/licenses/by/4.0/).
Share and Cite
MDPI and ACS Style
Sobhanmanesh, F.; Beheshti, A.; Nouri, N.; Chapparo, N.M.; Raj, S.; George, R.A. A Cognitive Model for Technology Adoption. Algorithms 2023, 16, 155. https://doi.org/10.3390/a16030155
AMA Style
Sobhanmanesh F, Beheshti A, Nouri N, Chapparo NM, Raj S, George RA. A Cognitive Model for Technology Adoption. Algorithms. 2023; 16(3):155. https://doi.org/10.3390/a16030155
Chicago/Turabian StyleSobhanmanesh, Fariborz, Amin Beheshti, Nicholas Nouri, Natalia Monje Chapparo, Sandya Raj, and Richard A. George. 2023. "A Cognitive Model for Technology Adoption" Algorithms 16, no. 3: 155. https://doi.org/10.3390/a16030155
Note that from the first issue of 2016, this journal uses article numbers instead of page numbers. See further details here.