

Fusion of CCTV Video and Spatial Information for Automated Crowd Congestion Monitoring in Public Urban Spaces

Abstract
:1. Introduction
2. Related Work
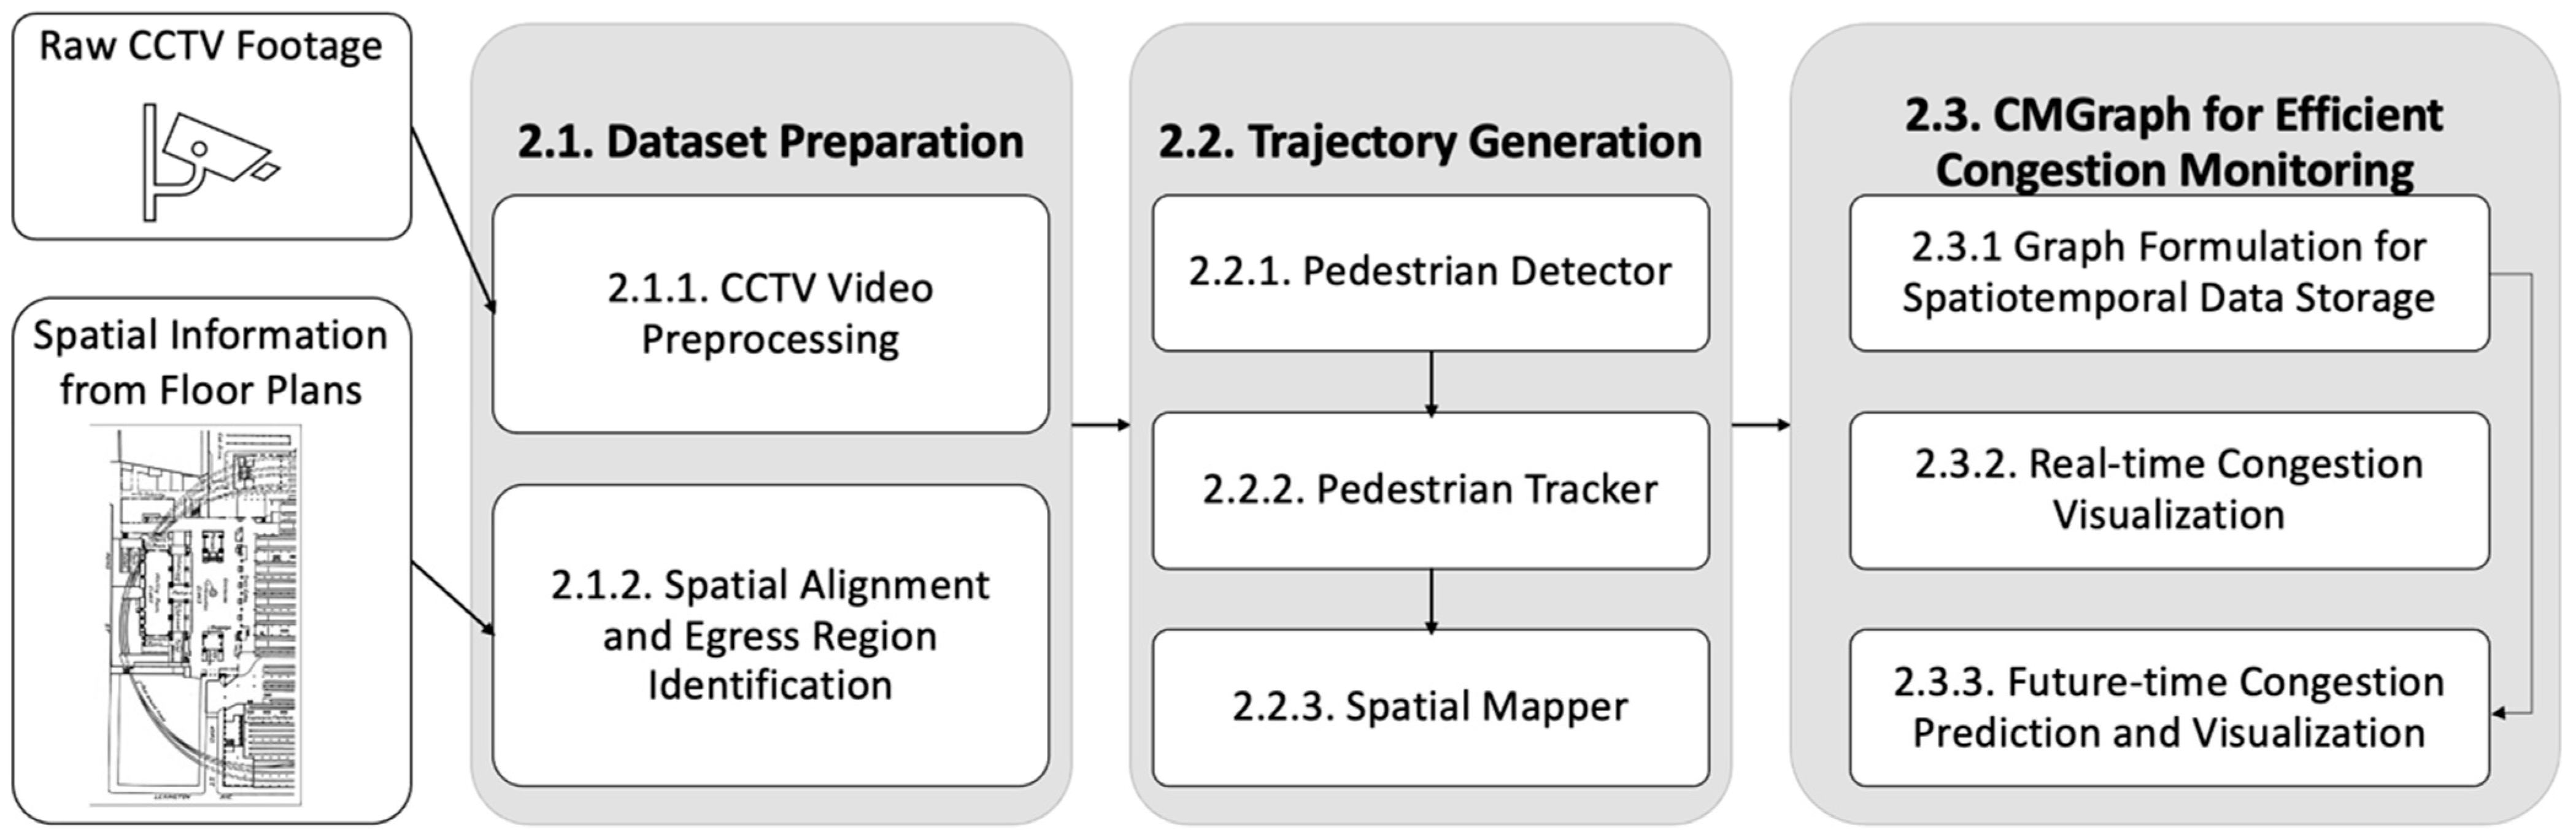
3. Methodologies
3.1. Dataset Preparation
- (1)
- Padding CNN networks for human detection frequently extract a visual feature map from an input image. The feature map can be viewed as a downsampled tensor of the original input. For instance, models belonging to the YOLO family are designed such that input images are downsampled by a factor of 32 [6]. To ensure compatibility with most open-source detector networks, input videos are required to be padded with zero-value pixels such that their width and height are multiples of 32. In our case study of New York’s Grand Central Station, the original video resolution is . Padding transforms the video to . In the other case study of a football stadium, the original video’s resolution is and padded to .
- (2)
- Optional frame rate reduction We note that there is a trade-off between data efficiency and tracking precision, as videos with a high frame rate capture motion in shorter intervals, which can improve tracking performance. However, a high frame rate increases data storage and processing costs. Therefore, we advise optionally lowering the frame rate of the input video to adjust to storage and tracking precision needs, particularly when there is a constraint on video storage and computational capacity. In our case study of Grand Central Station, we demonstrate that even with 1.25 frames per second (FPS) and low resolution, our approach provides relatively good detection and tracking performance to sufficiently capture trends in crowd mobility.
- (3)
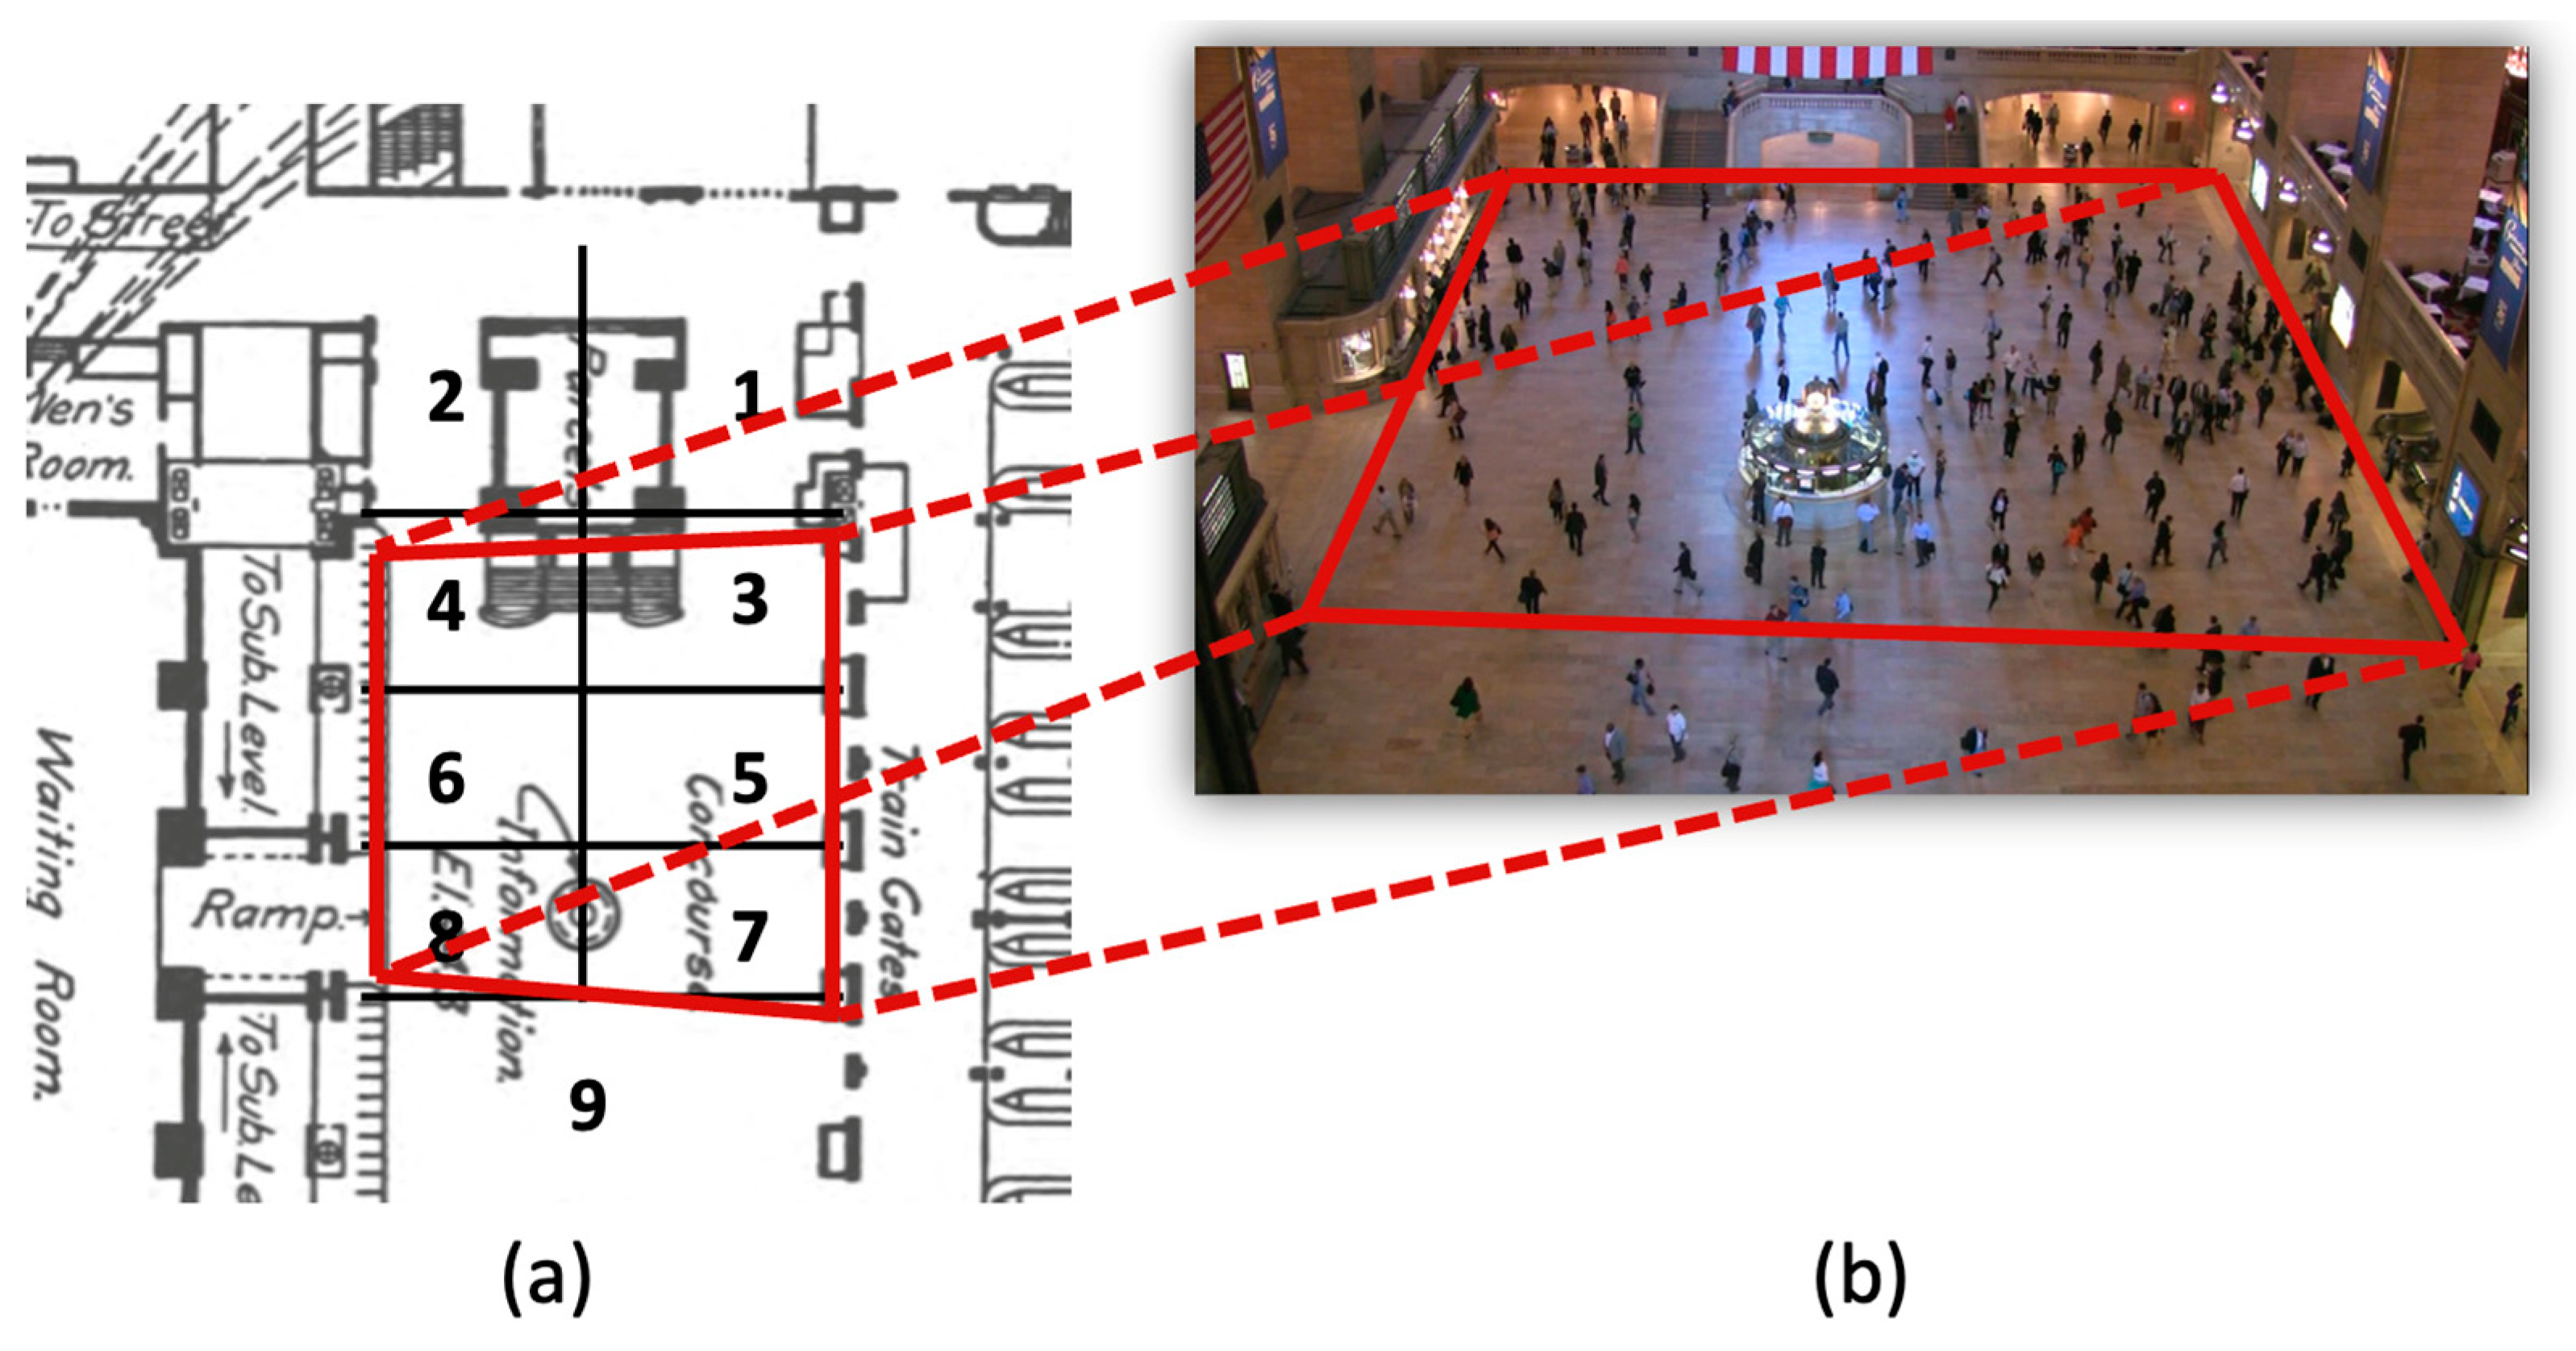
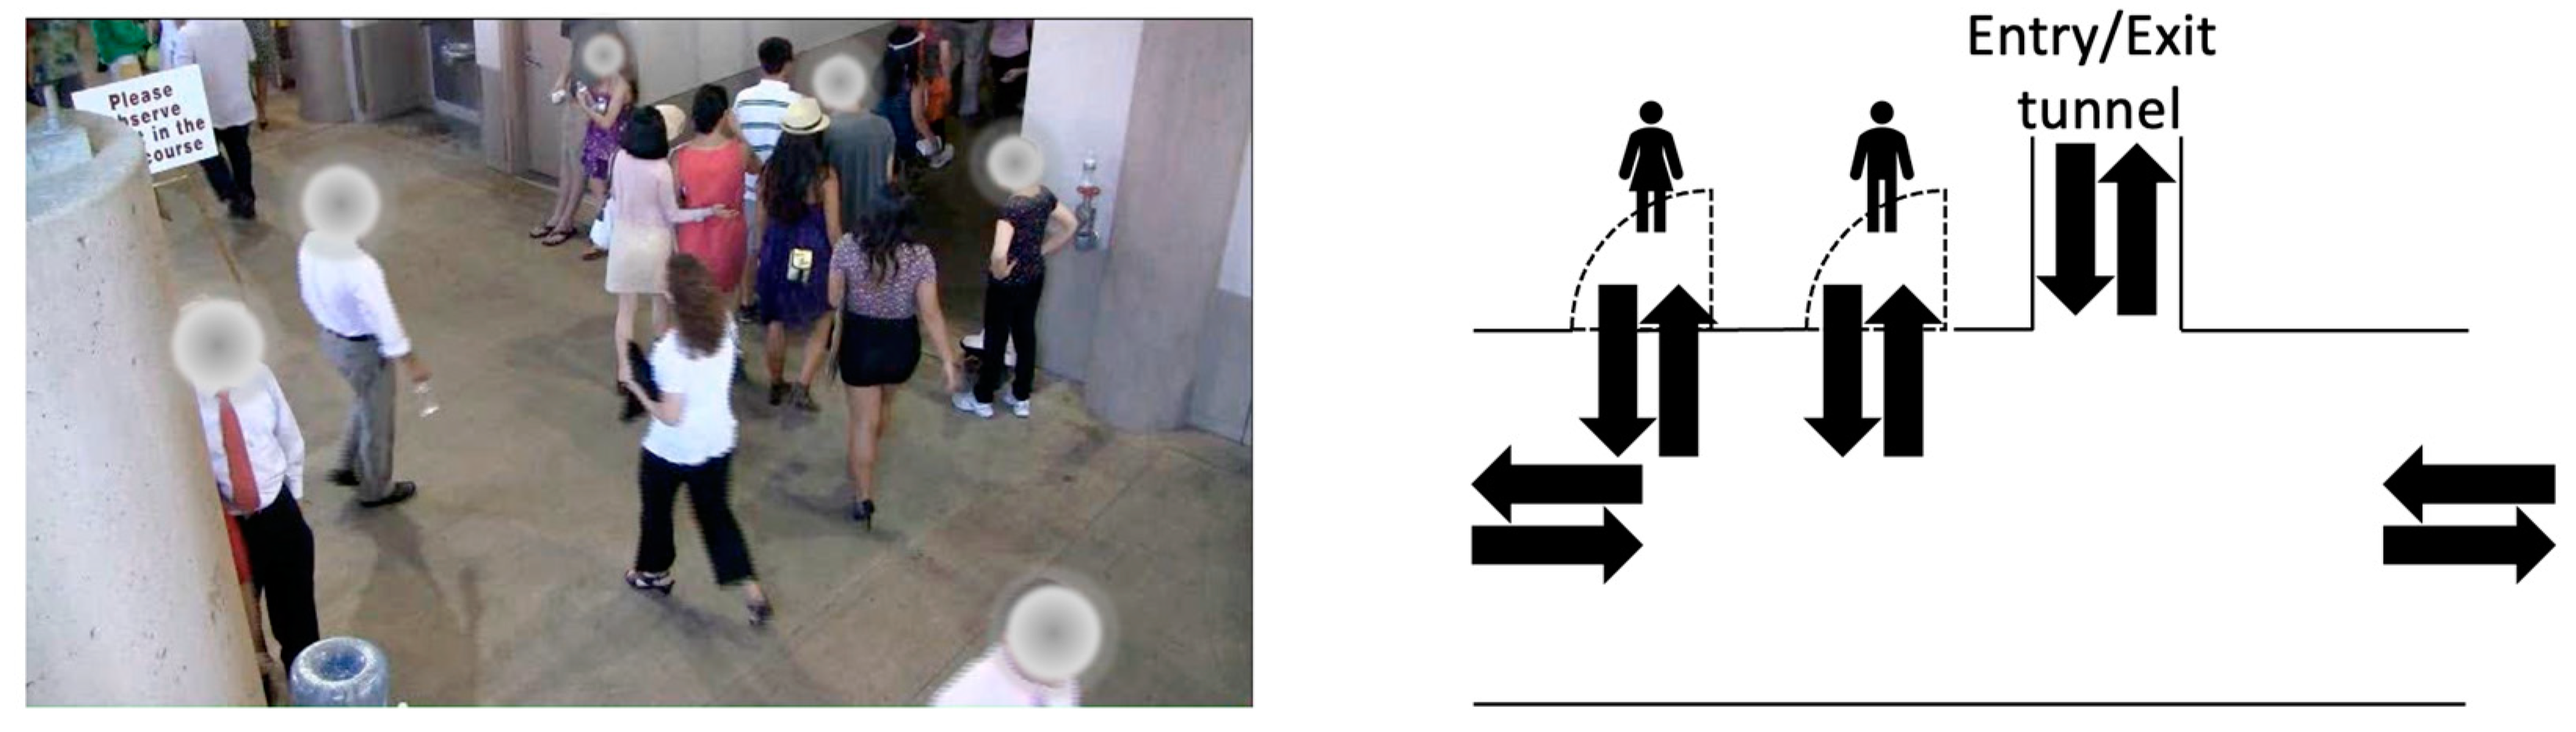
- Spatial alignment Fusion of video and spatial information requires the alignment of the video’s image-plane coordinate system with the physical world’s coordinate system. This can be viewed as obtaining a projection from a plane in the image to a plane on the floor plan. Nevertheless, the coordinate systems of the two planes are often initially unknown. An important step of preparing a dataset is therefore to define the two planes. Therefore, we manually identify four key points in the surveillance video and on the floor plan, consistent in order and winding. An illustration of this step is shown in Figure 2, where in the Grand Central Station, the plane in the floor plan coordinate system is drawn on the left (Figure 2a), and the plane in the video frame’s coordinate system is drawn on the right (Figure 2b).
- (4)
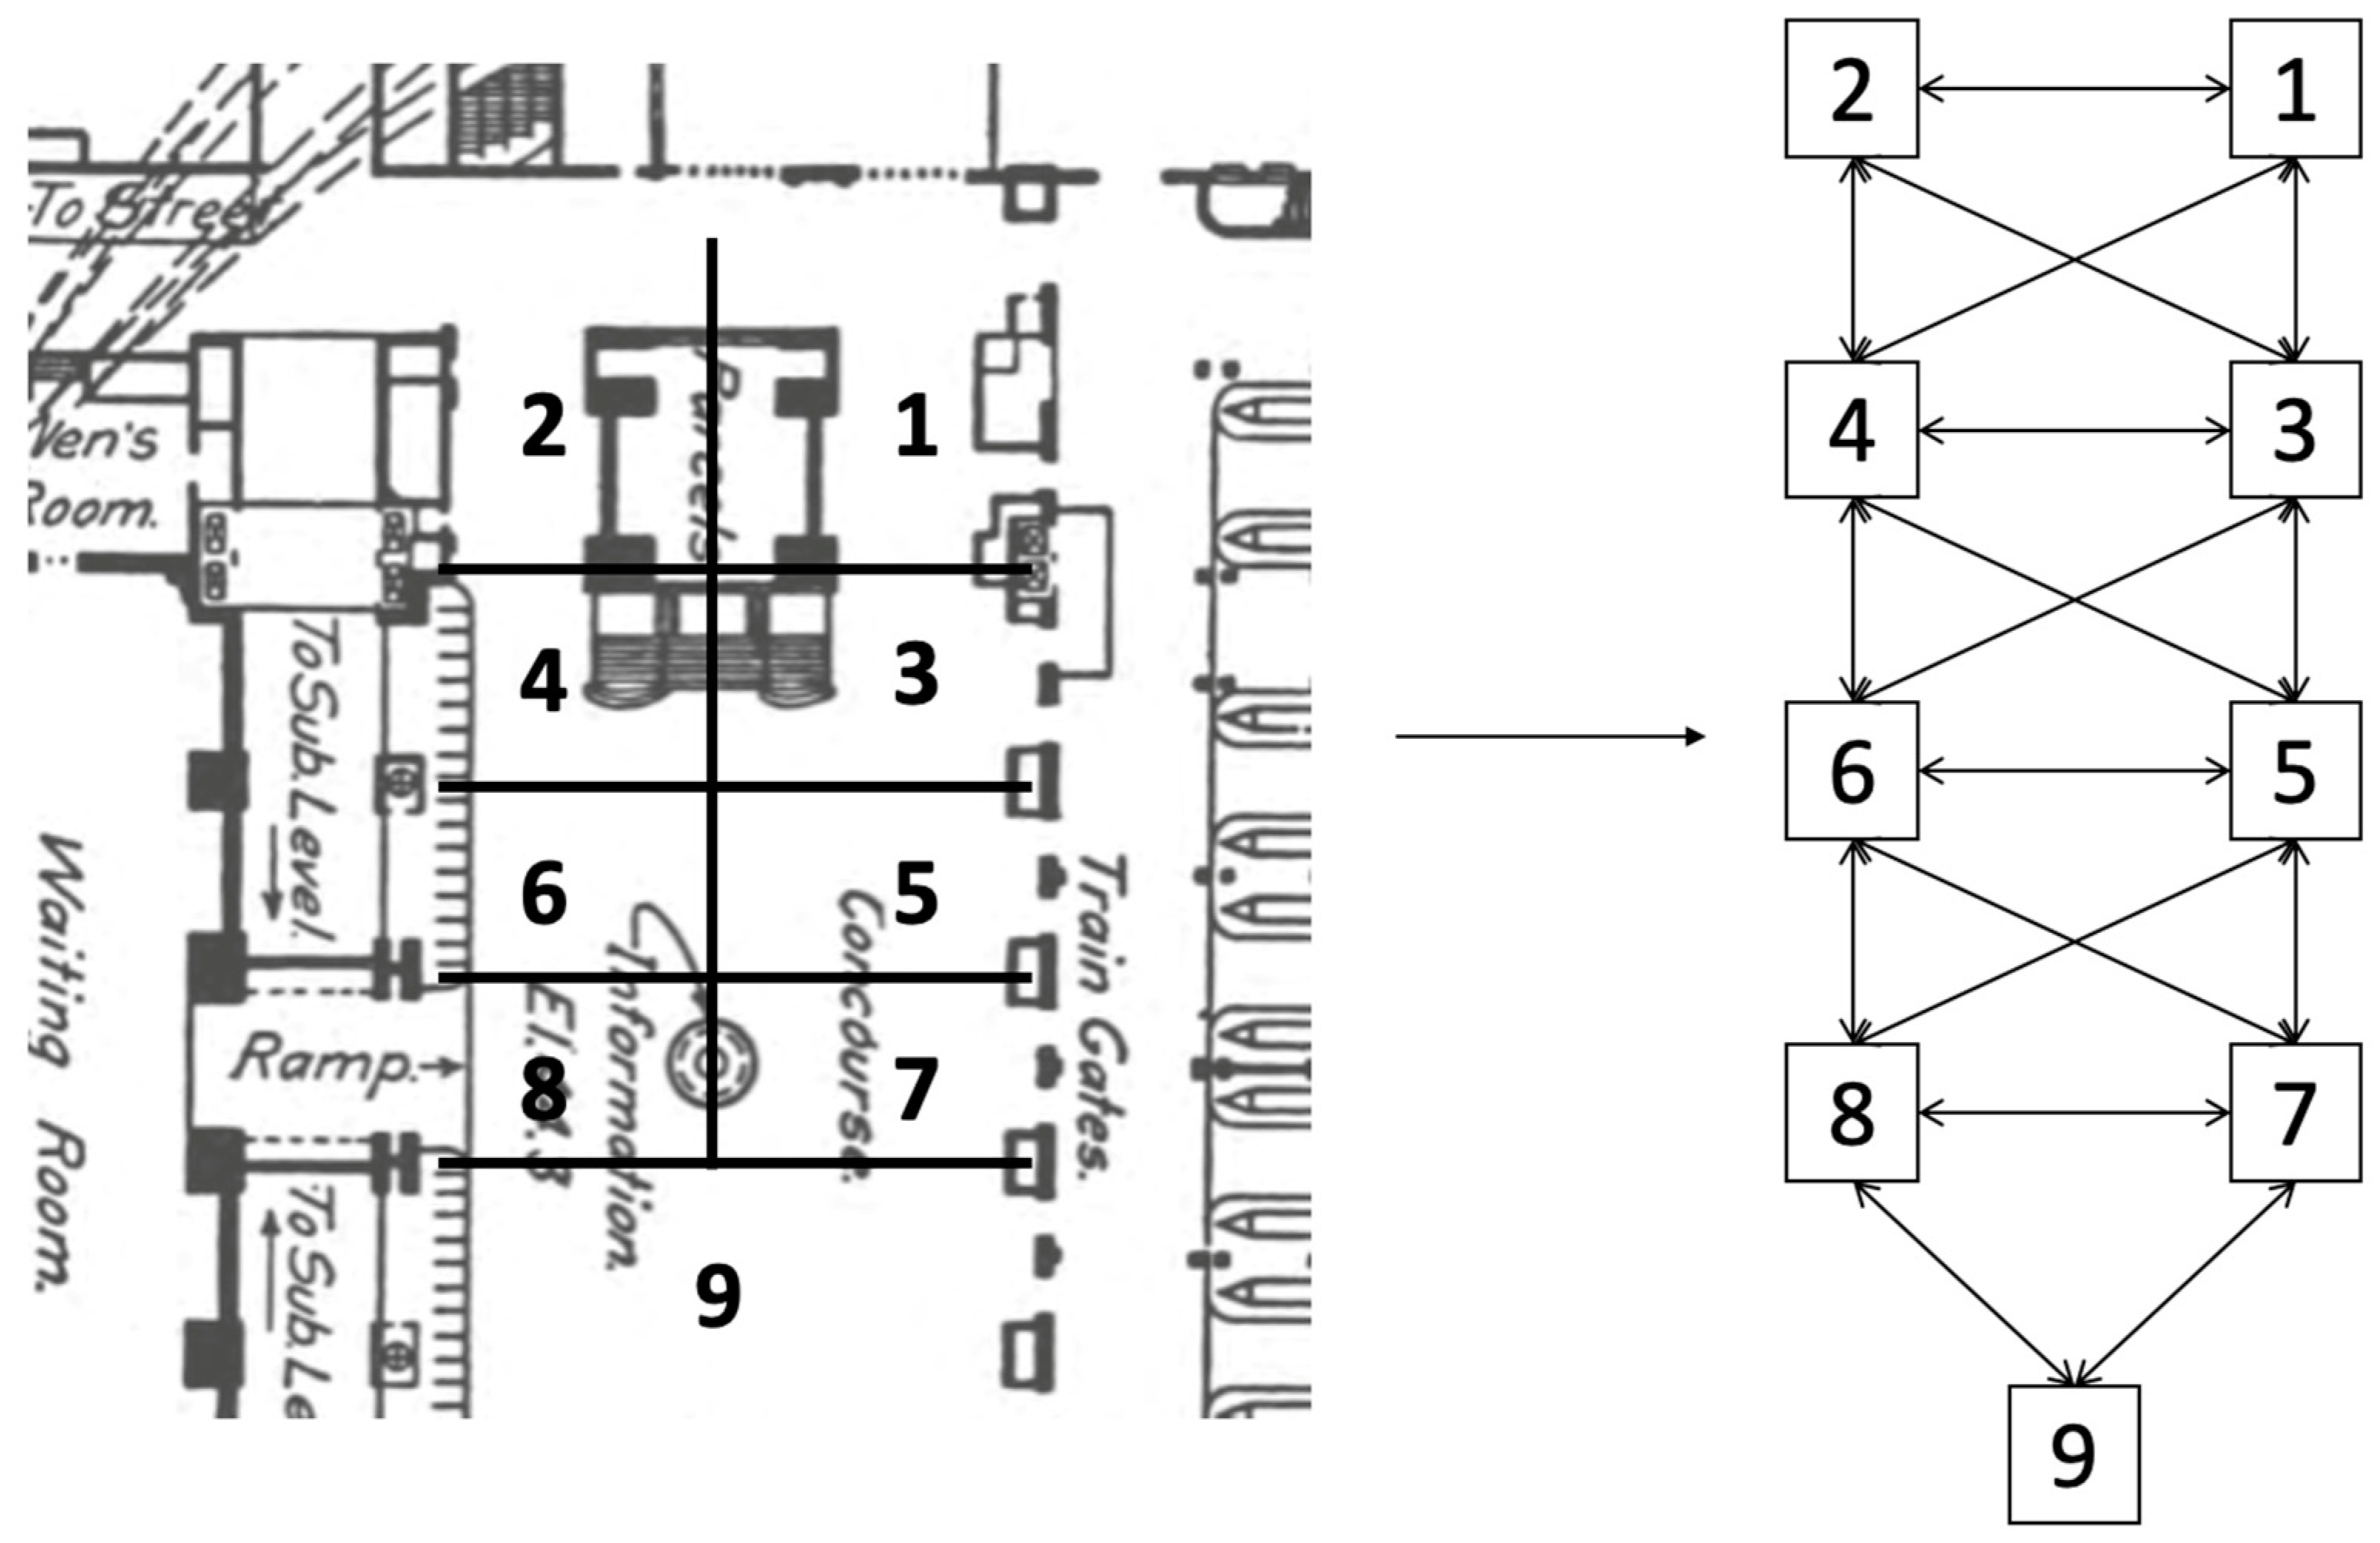
- Egress region identification The floor plan provides locations of entrances and exits, which are key locations that are vital for crowd congestion analysis. In a crowded, urban space, people naturally flow from one entrance to another exit. To better model crowd flow, all floor plans are processed such that they are divided into egress regions based on the locations of the entrances and exits of the floor plan, thereby requiring manual attention to read the floor plans. For example, Figure 2a shows the nine egress region divisions based on the floor plan information of the Grand Central Station.
3.2. Trajectory Generation
3.2.1. Pedestrian Detector
3.2.2. Pedestrian Tracker
- (1)
- Low frame rate
- (2)
- Lack of associated bounding box annotation
3.2.3. Spatial Mapper
3.3. CMGraph for Efficient Congestion Monitoring
3.3.1. Graph Representation for Spatiotemporal Data
3.3.2. Real-Time Congestion Visualization
- (1)
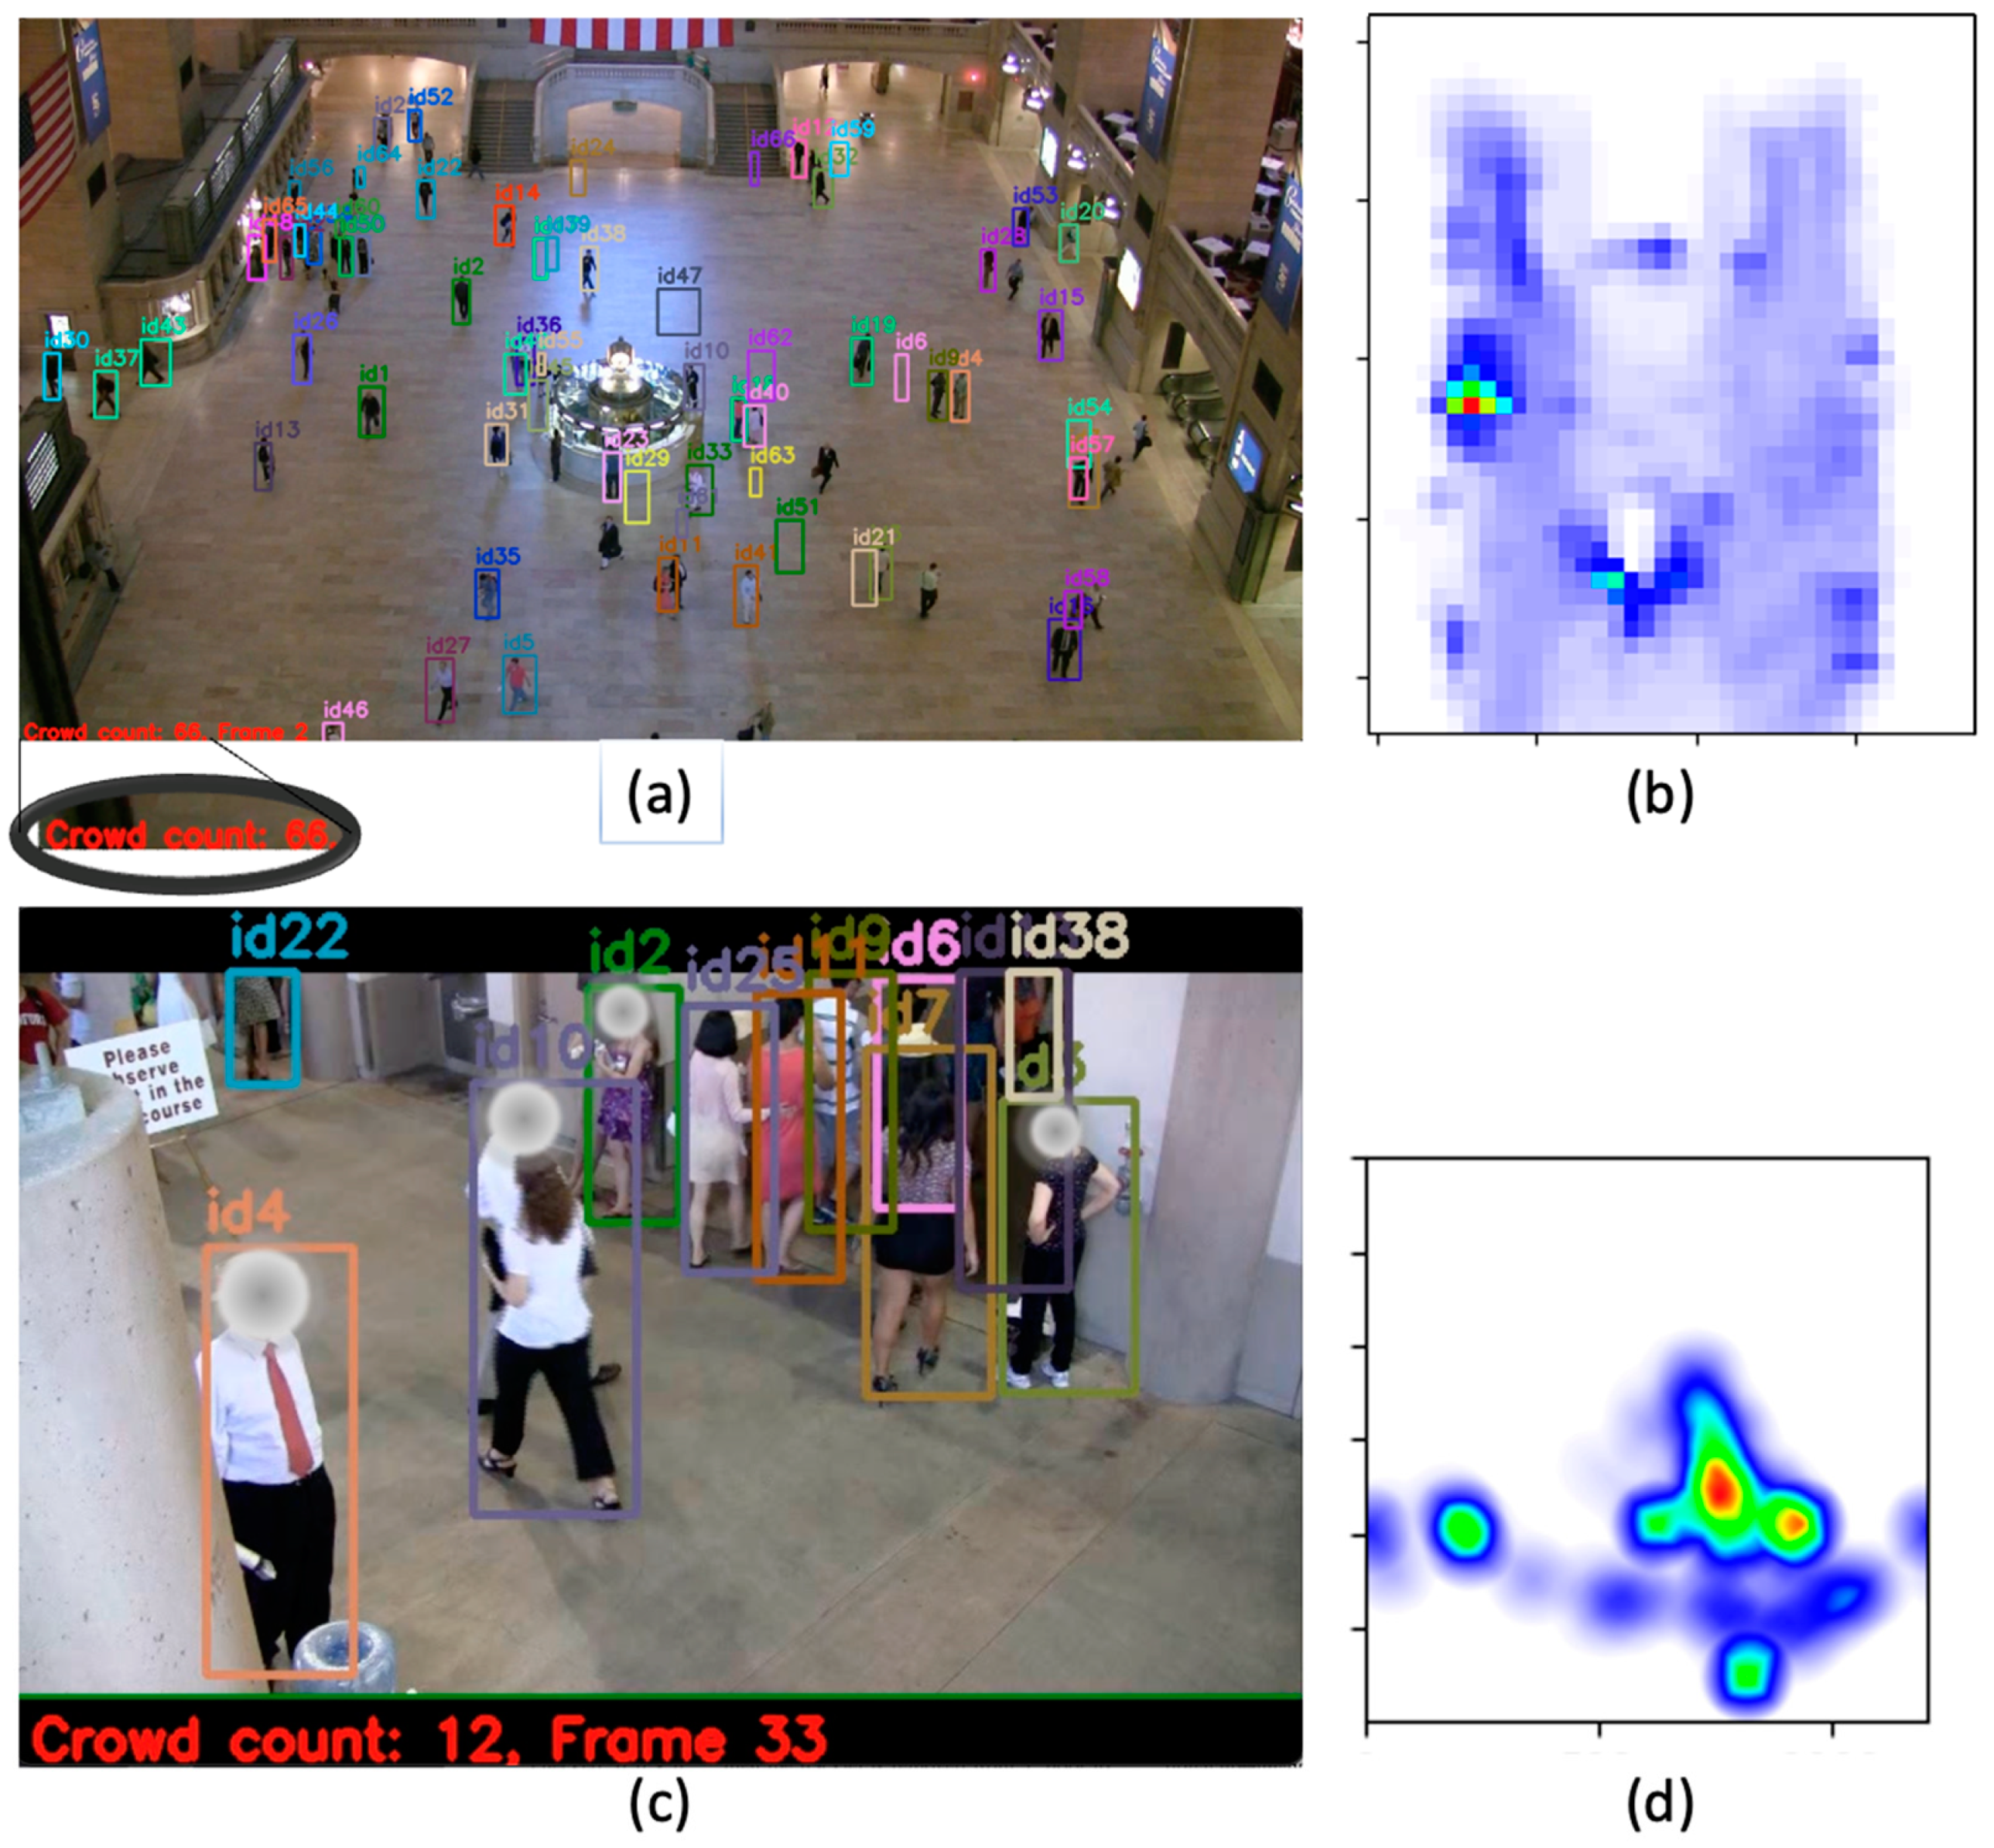
- Crowd count and individual monitoring The objective of the first data visualization tool is to reduce the amount of human effort required for surveillance video observation. We add a crowd count and assign a unique identifier to each pedestrian so that surveillance operators may simply determine the general crowd size and identify individuals who may require particular attention. This is especially beneficial in crowded areas when it is difficult to quantify the number of people and to locate an individual. Figure 5a depicts the visualization that was implemented.
- (2)
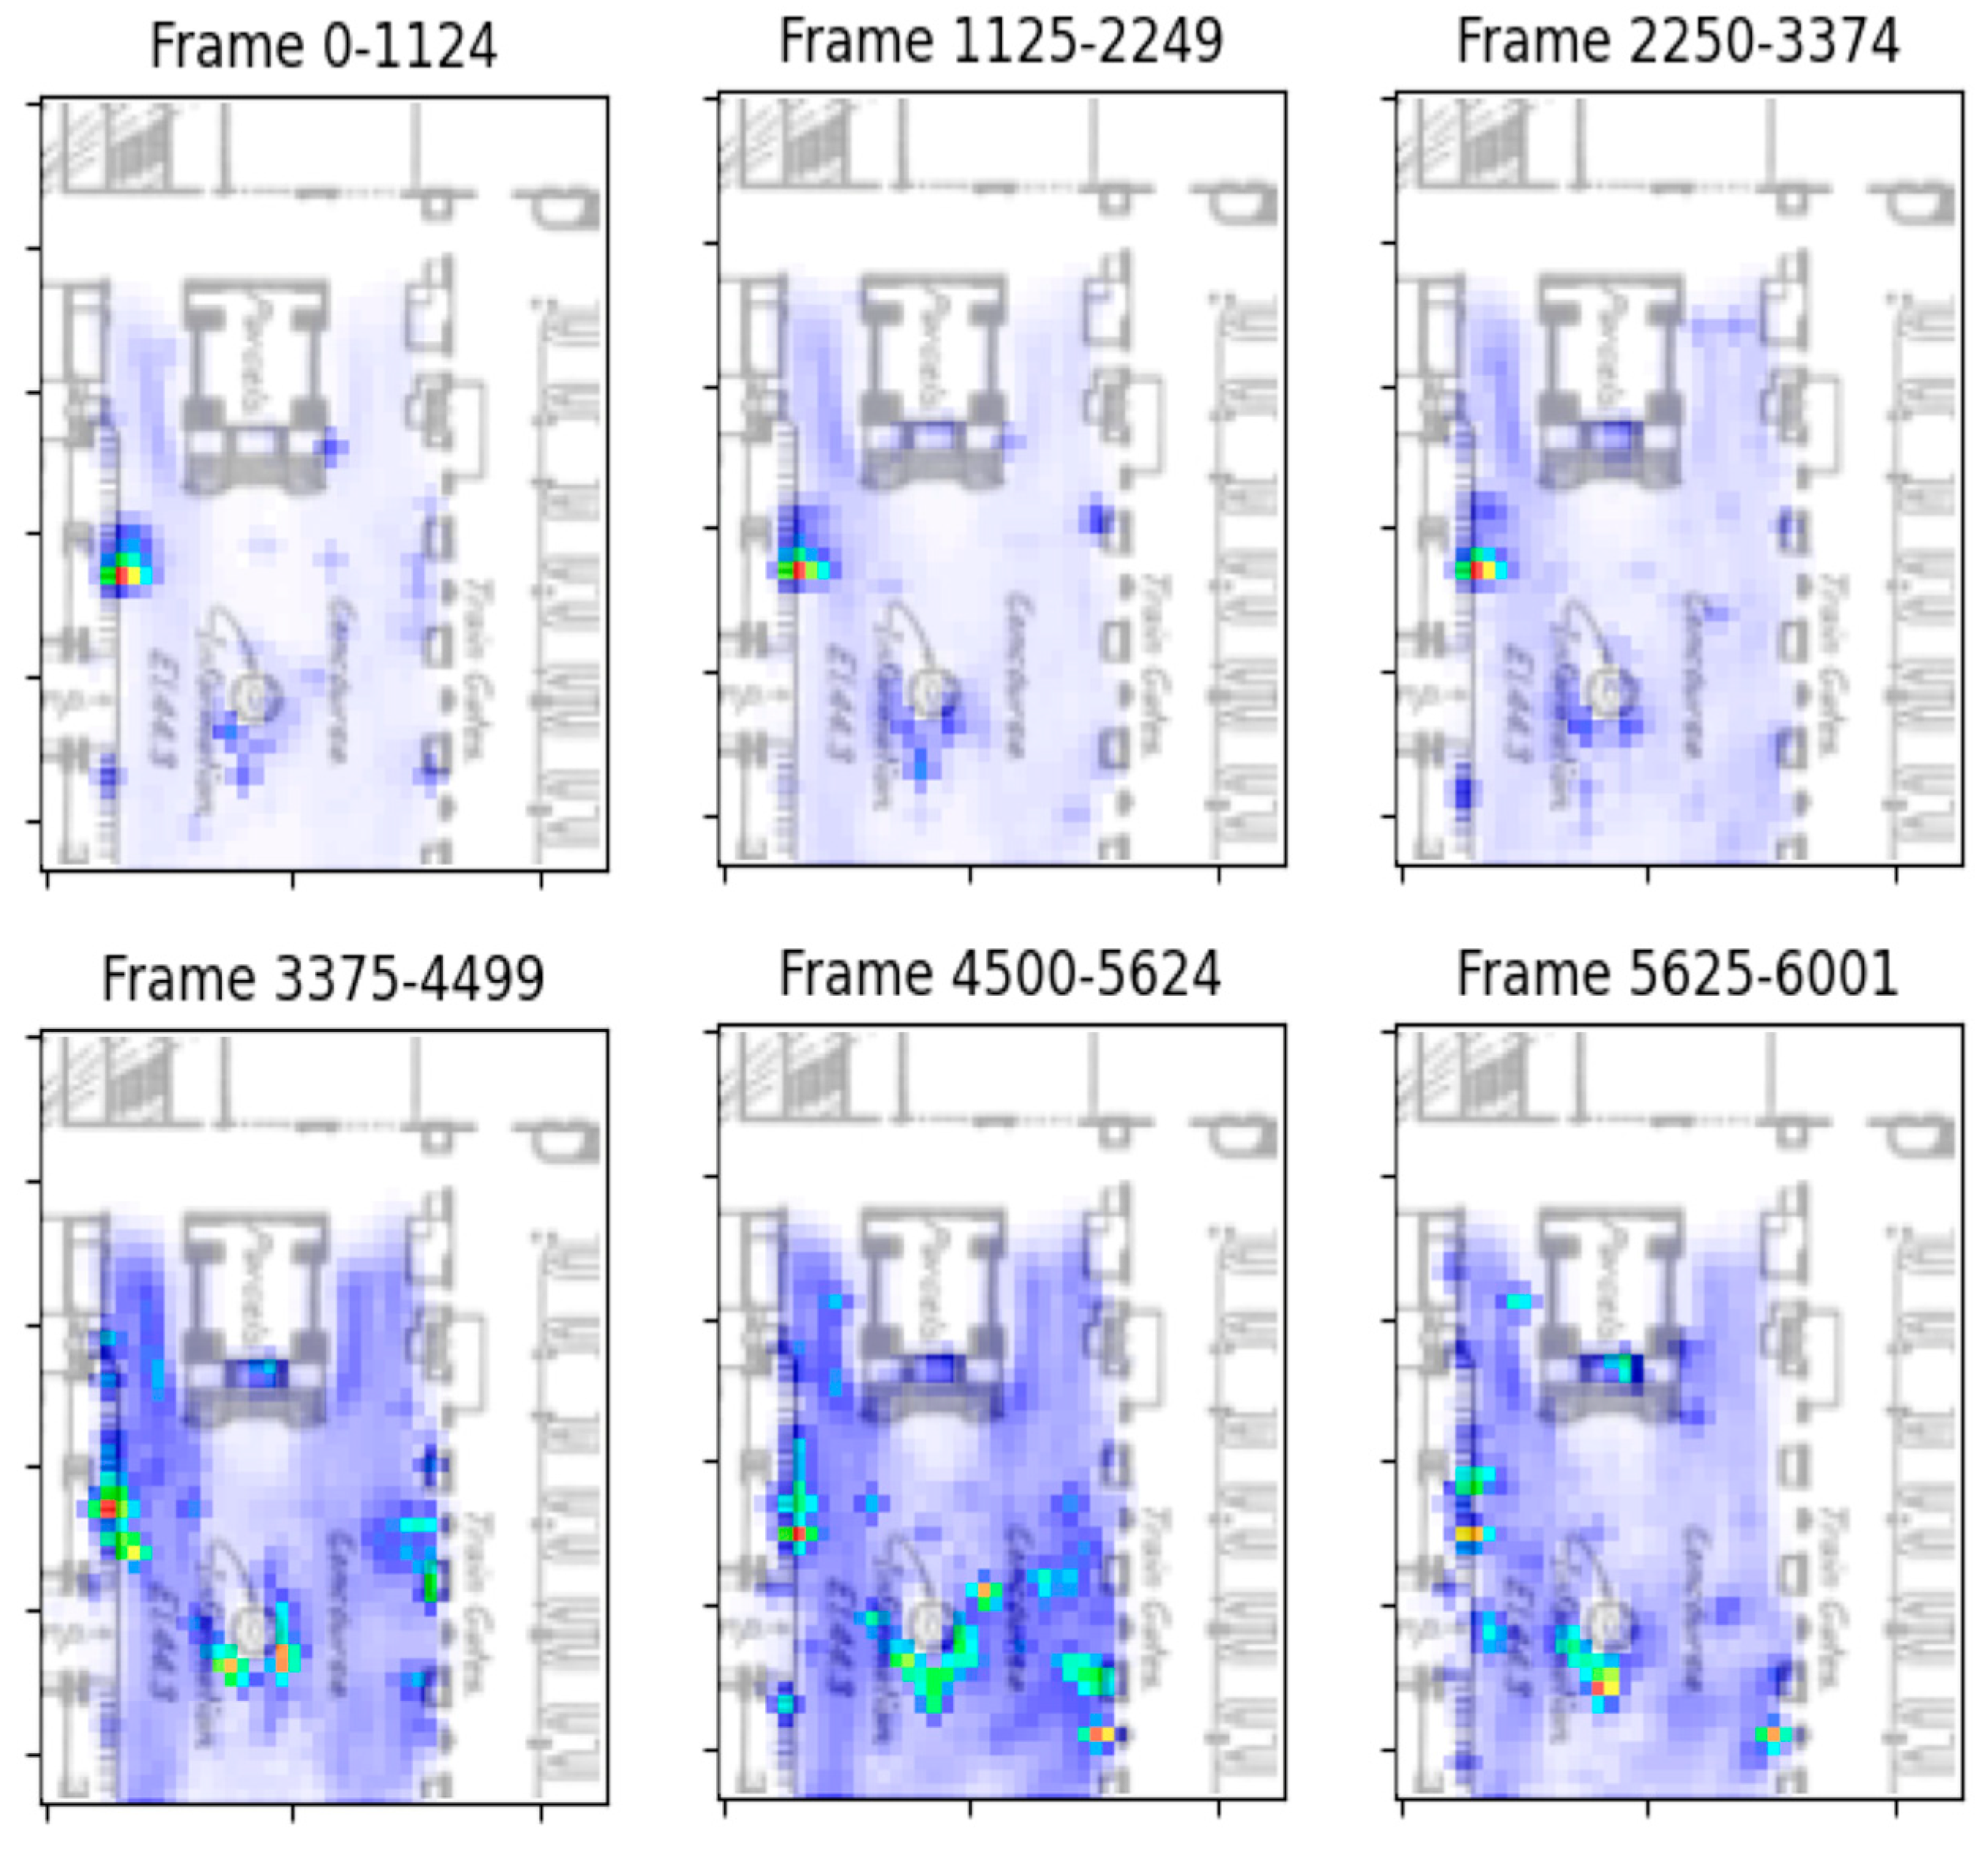
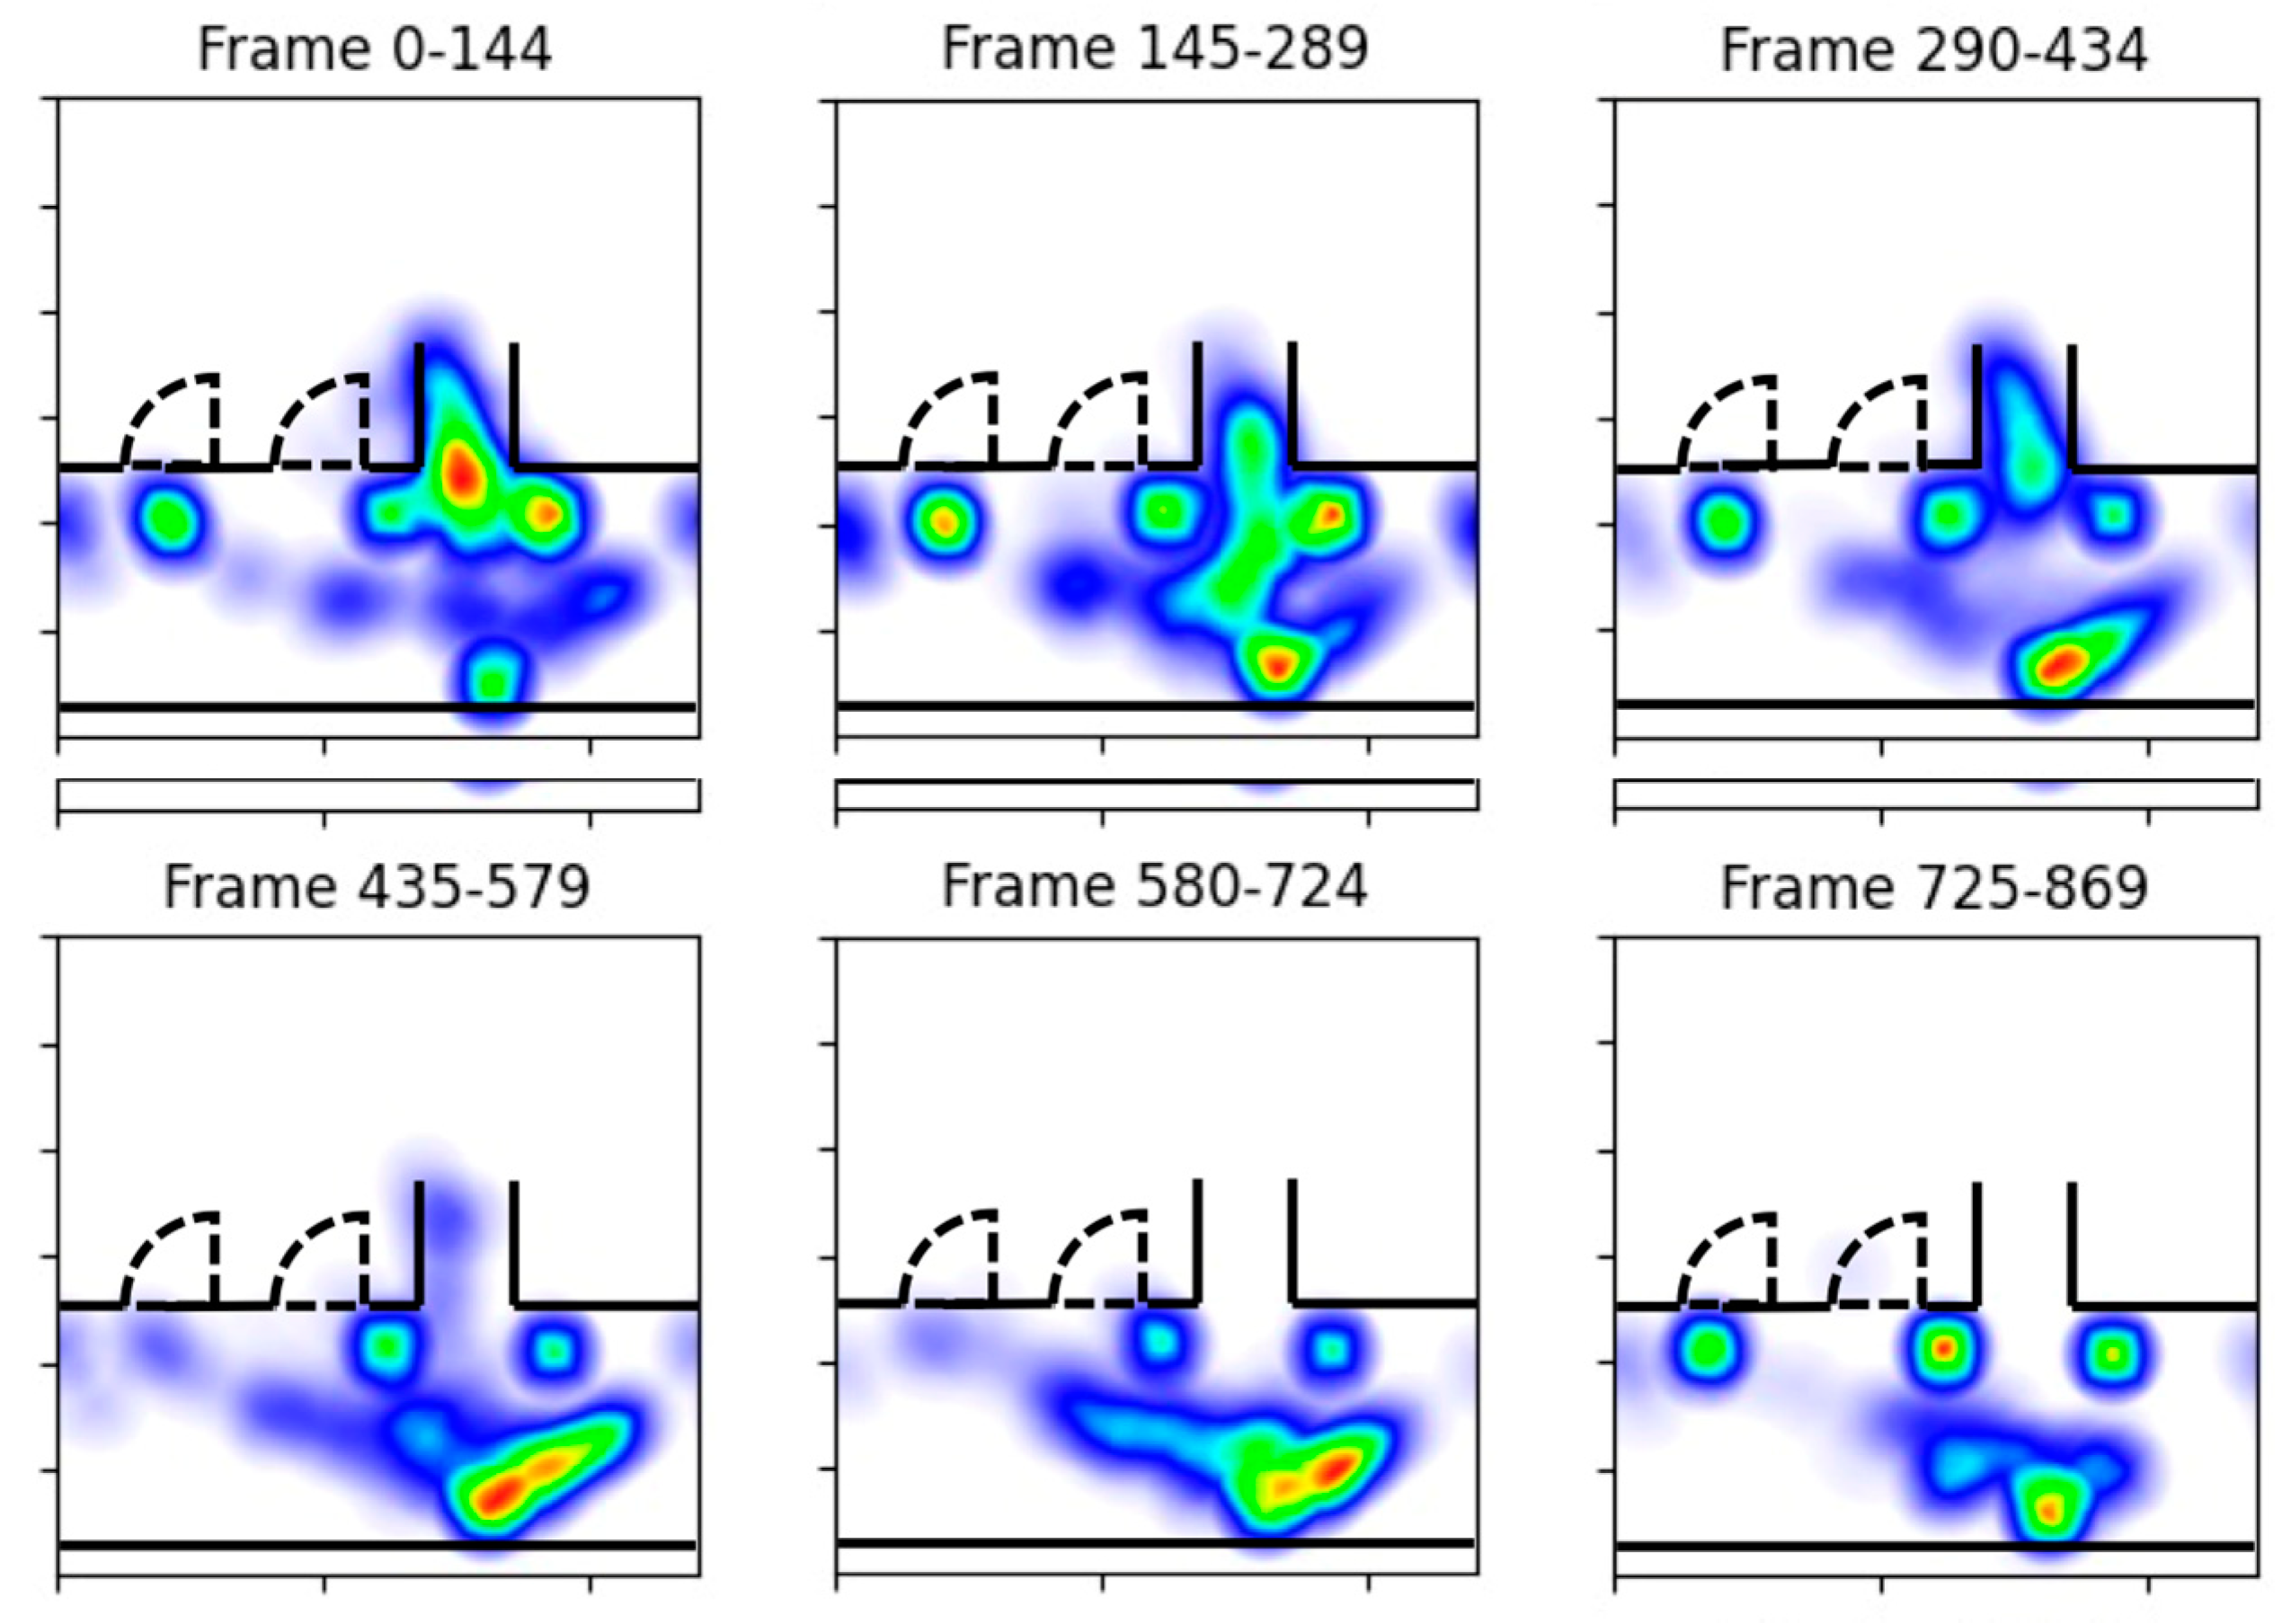
- Real-time congestion alert The second tool is designed to notify the operator of probable congestion hotspots. To do this, a density heatmap is constructed to indicate busy areas from a bird’s-eye view of the physical space. The color automatically alters dependent on a region’s congestion level. Figure 5b illustrates a congested egress in the Stanford Stadium. In order to be alerted about overcrowding and to prevent hazards such as stampedes from occurring, operators can continuously use the heatmap to monitor crowded areas.
3.3.3. Future-Time Congestion Prediction
Problem Definition
Spatial Representation Learning with GCN
Temporal Representation Learning with GRU
4. Experiments and Results
4.1. Quantitative Performance Evaluation of the Framework
4.1.1. Trajectory Generation
Evaluation Metrics
Implementation Details
Experimental Results
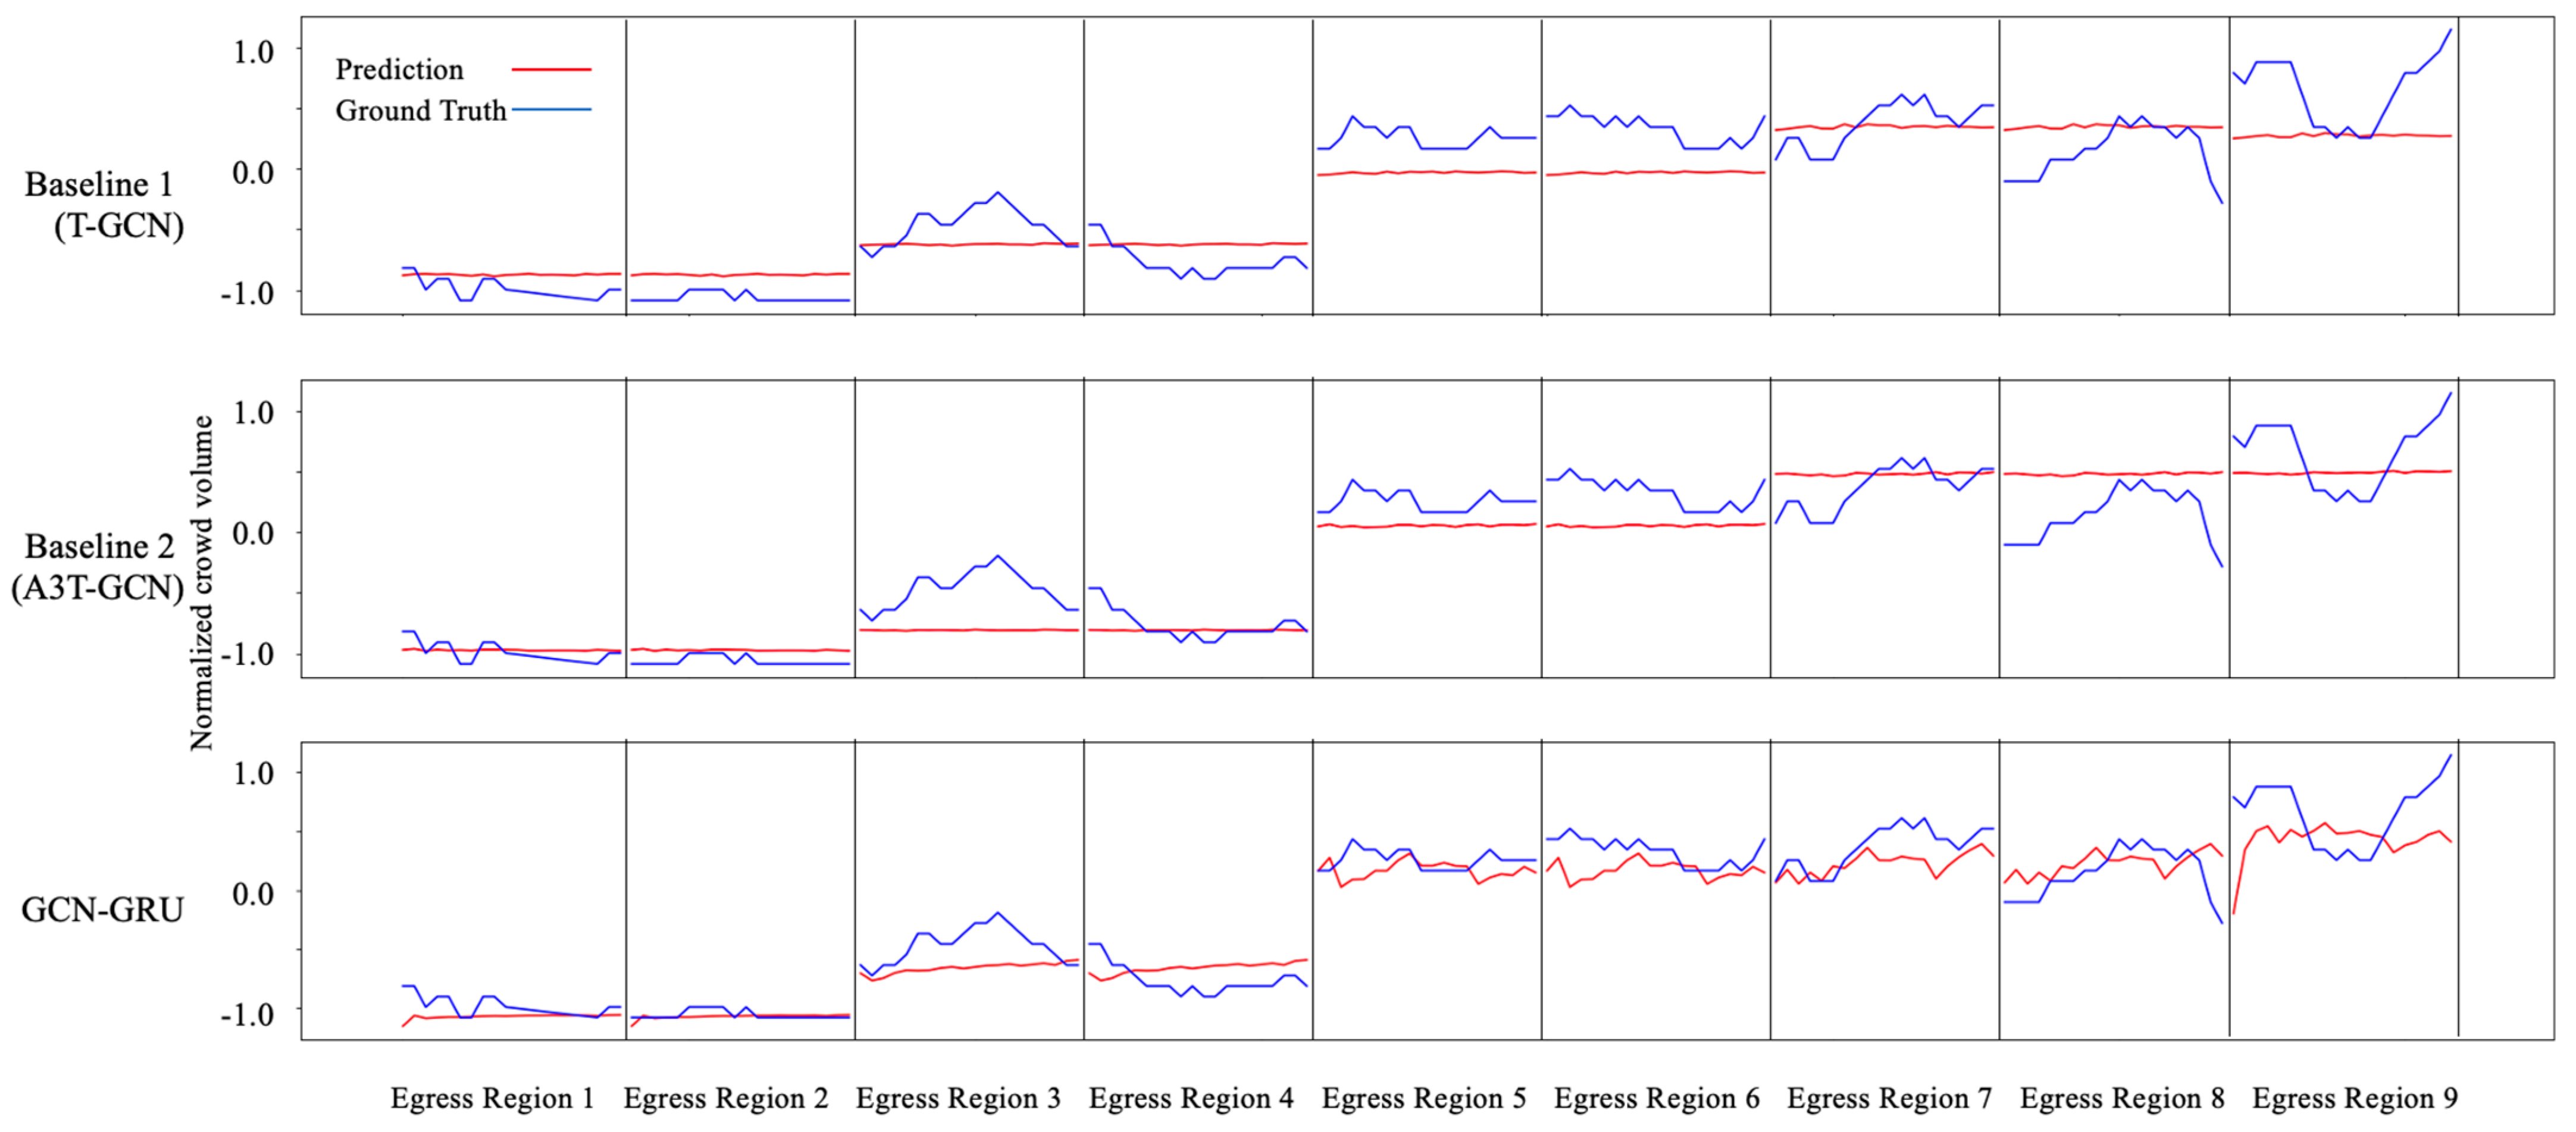
4.1.2. Congestion Prediction
Evaluation Metrics
Implementation Details
Experimental Results
4.1.3. Congestion Visualization
4.2. Qualitative Performance Evaluation of the Framework
5. Conclusions
Author Contributions
Funding
Data Availability Statement
Conflicts of Interest
References
- Wang, J.; Ding, Y.N.; Liu, D.D. The Research on Early Warning of Preventing the Stampede on Crowded Places and Evacuated Technology. In Proceedings of the 2015 International Forum on Energy, Environment Science and Materials, Shenzhen, China, 25–26 September 2015; Atlantis Press: Paris, France, 2015; pp. 1544–1551. [Google Scholar]
- Sindagi, V.A.; Patel, V.M. A Survey of Recent Advances in CNN-Based Single Image Crowd Counting and Density Estimation. Pattern Recognit. Lett. 2018, 107, 3–16. [Google Scholar] [CrossRef] [Green Version]
- Lo, B.P.L.; Velastin, S.A. Automatic Congestion Detection System for Underground Platforms. In Proceedings of the 2001 International Symposium on Intelligent Multimedia, Video and Speech Processing, ISIMP 2001 (IEEE Cat. No.01EX489), Hong Kong, China, 2–4 May 2001; pp. 158–161. [Google Scholar]
- Martella, C.; Li, J.; Conrado, C.; Vermeeren, A. On Current Crowd Management Practices and the Need for Increased Situation Awareness, Prediction, and Intervention. Saf. Sci. 2017, 91, 381–393. [Google Scholar] [CrossRef]
- Kizrak, M.A.; Bolat, B. Crowd Density Estimation by Using Attention Based Capsule Network and Multi-Column CNN. IEEE Access 2021, 9, 75435–75445. [Google Scholar] [CrossRef]
- Redmon, J.; Divvala, S.; Girshick, R.; Farhadi, A. You Only Look Once: Unified, Real-Time Object Detection. In Proceedings of the 2016 IEEE Conference on Computer Vision and Pattern Recognition (CVPR), Las Vegas, NV, USA, 27–30 June 2016; pp. 779–788. [Google Scholar]
- Ren, S.; He, K.; Girshick, R.; Sun, J. Faster R-CNN: Towards Real-Time Object Detection with Region Proposal Networks. IEEE Trans. Pattern Anal. Mach. Intell. 2017, 39, 1137–1149. [Google Scholar] [CrossRef] [PubMed] [Green Version]
- He, K.; Gkioxari, G.; Dollar, P.; Girshick, R. Mask R-CNN. IEEE Trans. Pattern Anal. Mach. Intell. 2020, 42, 386–397. [Google Scholar] [CrossRef] [PubMed]
- Zhou, B.; Wang, X.; Tang, X. Random Field Topic Model for Semantic Region Analysis in Crowded Scenes from Tracklets. In Proceedings of the IEEE Conference on Computer Vision and Pattern Recognition (CVPR) 2011, Colorado Springs, CO, USA, 20–25 June 2011; pp. 3441–3448. [Google Scholar] [CrossRef] [Green Version]
- Zhang, C.; Li, H.; Wang, X.; Yang, X. Cross-Scene Crowd Counting via Deep Convolutional Neural Networks. In Proceedings of the 2015 IEEE Conference on Computer Vision and Pattern Recognition (CVPR), Boston, MA, USA, 7–12 June 2015; pp. 833–841. [Google Scholar]
- Zhang, Y.; Zhou, D.; Chen, S.; Gao, S.; Ma, Y. Single-Image Crowd Counting via Multi-Column Convolutional Neural Network. In Proceedings of the 2016 IEEE Conference on Computer Vision and Pattern Recognition (CVPR), Las Vegas, NV, USA, 27–30 June 2016; pp. 589–597. [Google Scholar]
- Boominathan, L.; Kruthiventi, S.S.S.; Babu, R.V. CrowdNet: A Deep Convolutional Network for Dense Crowd Counting. In Proceedings of the 24th ACM International Conference on Multimedia, Bangalore, India, 20–24 October 2021; ACM: Amsterdam, The Netherlands, 2016; pp. 640–644. [Google Scholar]
- Sindagi, V.A.; Patel, V.M. CNN-Based Cascaded Multi-Task Learning of High-Level Prior and Density Estimation for Crowd Counting. In Proceedings of the 2017 14th IEEE International Conference on Advanced Video and Signal Based Surveillance (AVSS), Lecce, Italy, 29 August–1 September 2017; pp. 1–6. [Google Scholar]
- Zeng, L.; Xu, X.; Cai, B.; Qiu, S.; Zhang, T. Multi-Scale Convolutional Neural Networks for Crowd Counting. In Proceedings of the 2017 IEEE International Conference on Image Processing (ICIP), Beijing, China, 17–20 September 2017; pp. 465–469. [Google Scholar]
- Yan, R.; Gong, S.; Zhong, S. Crowd Counting via Scale-Adaptive Convolutional Neural Network in Extremely Dense Crowd Images. IJCAT 2019, 61, 318. [Google Scholar] [CrossRef]
- Gündüz, M.Ş.; Işık, G. A New YOLO-Based Method for Real-Time Crowd Detection from Video and Performance Analysis of YOLO Models. J. Real-Time Image Process. 2023, 20, 5. [Google Scholar] [CrossRef]
- Magoo, R.; Singh, H.; Jindal, N.; Hooda, N.; Rana, P.S. Deep Learning-Based Bird Eye View Social Distancing Monitoring Using Surveillance Video for Curbing the COVID-19 Spread. Neural Comput. Appl. 2021, 33, 15807–15814. [Google Scholar] [CrossRef]
- Chen, J.; Su, W.; Wang, Z. Crowd Counting with Crowd Attention Convolutional Neural Network. Neurocomputing 2020, 382, 210–220. [Google Scholar] [CrossRef]
- Suarez, S. Grand Central Terminal’s Original Lighting: Its Significance, Its Relationship with the Current Scheme, and Recommendations for Alternate Considerations. Master’s Thesis, Columbia University, New York, NY, USA, 20 July 2015. [Google Scholar]
- Sreenu, G.; Saleem Durai, M.A. Intelligent Video Surveillance: A Review through Deep Learning Techniques for Crowd Analysis. J. Big Data 2019, 6, 48. [Google Scholar] [CrossRef]
- Fujiyoshi, H.; Hirakawa, T.; Yamashita, T. Deep Learning-Based Image Recognition for Autonomous Driving. IATSS Res. 2019, 43, 244–252. [Google Scholar] [CrossRef]
- Belhadi, A.; Djenouri, Y.; Srivastava, G.; Djenouri, D.; Lin, J.C.-W.; Fortino, G. Deep Learning for Pedestrian Collective Behavior Analysis in Smart Cities: A Model of Group Trajectory Outlier Detection. Inf. Fusion 2021, 65, 13–20. [Google Scholar] [CrossRef]
- Du, H.; Jin, T.; Song, Y.; Dai, Y.; Li, M. A Three-Dimensional Deep Learning Framework for Human Behavior Analysis Using Range-Doppler Time Points. IEEE Geosci. Remote Sens. Lett. 2020, 17, 611–615. [Google Scholar] [CrossRef]
- Lin, T.-Y.; Goyal, P.; Girshick, R.; He, K.; Dollar, P. Focal Loss for Dense Object Detection. IEEE Trans. Pattern Anal. Mach. Intell. 2020, 42, 318–327. [Google Scholar] [CrossRef] [Green Version]
- Liu, W.; Anguelov, D.; Erhan, D.; Szegedy, C.; Reed, S.; Fu, C.-Y.; Berg, A.C. SSD: Single Shot MultiBox Detector. In Computer Vision–ECCV 2016; Leibe, B., Matas, J., Sebe, N., Welling, M., Eds.; Lecture Notes in Computer Science; Springer International Publishing: Cham, Switzerland, 2016; Volume 9905, pp. 21–37. ISBN 978-3-319-46447-3. [Google Scholar]
- Girshick, R.; Donahue, J.; Darrell, T.; Malik, J. Rich Feature Hierarchies for Accurate Object Detection and Semantic Segmentation. In Proceedings of the 2014 IEEE Conference on Computer Vision and Pattern Recognition, Columbus, OH, USA, 23–28 June 2014; pp. 580–587. [Google Scholar]
- Wang, C.-Y.; Bochkovskiy, A.; Liao, H.-Y.M. YOLOv7: Trainable Bag-of-Freebies Sets New State-of-the-Art for Real-Time Object Detectors. arXiv 2022, arXiv:2207.02696. [Google Scholar] [CrossRef]
- Bewley, A.; Ge, Z.; Ott, L.; Ramos, F.; Upcroft, B. Simple Online and Realtime Tracking. In Proceedings of the 2016 IEEE International Conference on Image Processing (ICIP), Phoenix, AZ, USA, 25–28 September 2016; pp. 3464–3468. [Google Scholar]
- Wojke, N.; Bewley, A.; Paulus, D. Simple Online and Realtime Tracking with a Deep Association Metric. In Proceedings of the 2017 IEEE International Conference on Image Processing (ICIP), Beijing, China, 17–20 September 2017; pp. 3645–3649. [Google Scholar]
- Kuhn, H.W. The Hungarian Method for the Assignment Problem. Nav. Res. Logist. 1955, 2, 83–97. [Google Scholar] [CrossRef] [Green Version]
- Zheng, L.; Bie, Z.; Sun, Y.; Wang, J.; Su, C.; Wang, S.; Tian, Q. MARS: A Video Benchmark for Large-Scale Person Re-Identification. In Proceedings of the Computer Vision–ECCV 2016, Amsterdam, The Netherlands, 11–14 October 2016; Leibe, B., Matas, J., Sebe, N., Welling, M., Eds.; Springer International Publishing: Cham, Switzerland, 2016; pp. 868–884. [Google Scholar]
- Dendorfer, P.; Osep, A.; Milan, A.; Schindler, K.; Cremers, D.; Reid, I.; Roth, S.; Leal-Taixé, L. MOTChallenge: A Benchmark for Single-Camera Multiple Target Tracking. Int. J. Comput. Vis. 2021, 129, 845–881. [Google Scholar] [CrossRef]
- Dendorfer, P.; Rezatofighi, H.; Milan, A.; Shi, J.; Cremers, D.; Reid, I.; Roth, S.; Schindler, K.; Leal-Taixé, L. MOT20: A Benchmark for Multi Object Tracking in Crowded Scenes. arXiv 2020, arXiv:2003.09003. [Google Scholar] [CrossRef]
- Su, H.; Deng, J.; Fei-Fei, L. Crowdsourcing Annotations for Visual Object Detection. In Proceedings of the Workshops at the Twenty-Sixth AAAI Conference on Artificial Intelligence, Toronto, ON, Canada, 15 July 2012; Volume WS-12-08, pp. 40–46. [Google Scholar]
- Ma, Y.; Soatto, S.; Košecká, J.; Sastry, S.S. An Invitation to 3-D Vision; Interdisciplinary Applied Mathematics; Springer: New York, NY, USA, 2004; Volume 26, ISBN 978-1-4419-1846-8. [Google Scholar]
- Bazargani, H.; Bilaniuk, O.; Laganière, R. A Fast and Robust Homography Scheme for Real-Time Planar Target Detection. J. Real-Time Image Proc. 2018, 15, 739–758. [Google Scholar] [CrossRef]
- Panagopoulos, G.; Nikolentzos, G.; Vazirgiannis, M. Transfer Graph Neural Networks for Pandemic Forecasting. In Proceedings of the AAAI Conference on Artificial Intelligence 2021, Online, 2–9 February 2021; Volume 35, pp. 4838–4845. [Google Scholar] [CrossRef]
- Bai, J.; Zhu, J.; Song, Y.; Zhao, L.; Hou, Z.; Du, R.; Li, H. A3T-GCN: Attention Temporal Graph Convolutional Network for Traffic Forecasting. ISPRS Int. J. Geo-Inf. 2020, 10, 485. [Google Scholar] [CrossRef]
- Pareja, A.; Domeniconi, G.; Chen, J.; Ma, T.; Suzumura, T.; Kanezashi, H.; Kaler, T.; Schardl, T.B.; Leisersen, C.E.; Leiserson, C.E. EvolveGCN: Evolving Graph Convolutional Networks for Dynamic Graphs. AAAI 2020, 34, 5363–5370. [Google Scholar] [CrossRef]
- Zhao, L.; Song, Y.; Zhang, C.; Zhang, C.; Liu, Y.; Wang, P.; Lin, T.; Deng, M.; Deng, M.; Deng, M.; et al. T-GCN: A Temporal Graph Convolutional Network for Traffic Prediction. IEEE Trans. Intell. Transp. Syst. 2019, 21, 3848–3858. [Google Scholar] [CrossRef] [Green Version]
- Kipf, T.; Welling, M. Semi-Supervised Classification with Graph Convolutional Networks. In Proceedings of the International Conference on Learning Representations (ICLR), Toulon, France, 24–26 April 2017. [Google Scholar]
- Cho, K.; van Merriënboer, B.; Bahdanau, D.; Bengio, Y. On the Properties of Neural Machine Translation: Encoder–Decoder Approaches. In Proceedings of the SSST-8, Eighth Workshop on Syntax, Semantics and Structure in Statistical Translation, Doha, Qatar, 25 October 2014; Association for Computational Linguistics: Doha, Qatar, 2014; pp. 103–111. [Google Scholar]
- Yi, S.; Li, H.; Wang, X. Understanding Pedestrian Behaviors from Stationary Crowd Groups. In Proceedings of the IEEE Conference on Computer Vision and Pattern Recognition (CVPR) 2015, Boston, MA, USA, 7–12 June 2015. [Google Scholar] [CrossRef]
- Bernardin, K.; Stiefelhagen, R. Evaluating Multiple Object Tracking Performance: The CLEAR MOT Metrics. EURASIP J. Image Video Process. 2008, 2008, 1–10. [Google Scholar] [CrossRef] [Green Version]
- Deng, J.; Dong, W.; Socher, R.; Li, L.-J.; Li, K.; Fei-Fei, L. ImageNet: A Large-Scale Hierarchical Image Database. In Proceedings of the 2009 IEEE Conference on Computer Vision and Pattern Recognition, Miami, FL, USA, 20–25 June 2009; pp. 248–255. [Google Scholar]
- Github Repository. Available online: https://github.com/vivian-wong/pedestrian-test (accessed on 23 February 2023).
- Jiang, W.; Luo, J. Graph Neural Network for Traffic Forecasting: A Survey. Expert Syst. Appl. 2022, 207, 117921. [Google Scholar] [CrossRef]
- Gwynne, S.M.V.; Hunt, A.L.E.; Thomas, J.R.; Thompson, A.J.L.; Séguin, L. The Toilet Paper: Bathroom Dwell Time Observations at an Airport. J. Build. Eng. 2019, 24, 100751. [Google Scholar] [CrossRef]
- Li, H.; Dong, N.; Yu, Z.; Tao, D.; Qi, G. Triple Adversarial Learning and Multi-View Imaginative Reasoning for Unsupervised Domain Adaptation Person Re-Identification. IEEE Trans. Circuits Syst. Video Technol. 2022, 32, 2814–2830. [Google Scholar] [CrossRef]
- Tao, D.; Guo, Y.; Yu, B.; Pang, J.; Yu, Z. Deep Multi-View Feature Learning for Person Re-Identification. IEEE Trans. Circuits Syst. Video Technol. 2018, 28, 2657–2666. [Google Scholar] [CrossRef]
- Xu, Y.; Jiang, Z.; Men, A.; Wang, H.; Luo, H. Multi-View Feature Fusion for Person Re-Identification. Knowl.-Based Syst. 2021, 229, 107344. [Google Scholar] [CrossRef]


| Detector | Tracker | MOTA | MODA | Recall | Precision |
|---|---|---|---|---|---|
| YOLOv7-tiny | SORT | 62.8 | 70.8 | 72.2 | 98.2 |
| Faster R-CNN | SORT | 58.8 | 66.5 | 71.0 | 94.0 |
| Detector | Tracker | MOTA | MODA | Recall | Precision |
|---|---|---|---|---|---|
| YOLOv7-tiny | DeepSORT | 73.7 | 81.2 | 86.2 | 94.6 |
| Faster R-CNN | DeepSORT | 64.2 | 71.3 | 82.2 | 88.2 |
| Predictor | MSE | MAE |
|---|---|---|
| Baseline 1 (T-GCN) | 0.329 | 0.417 |
| Baseline 2 (A3T-GCN) | 0.320 | 0.403 |
| GCN-GRU | 0.258 | 0.354 |
Disclaimer/Publisher’s Note: The statements, opinions and data contained in all publications are solely those of the individual author(s) and contributor(s) and not of MDPI and/or the editor(s). MDPI and/or the editor(s) disclaim responsibility for any injury to people or property resulting from any ideas, methods, instructions or products referred to in the content. |
© 2023 by the authors. Licensee MDPI, Basel, Switzerland. This article is an open access article distributed under the terms and conditions of the Creative Commons Attribution (CC BY) license (https://creativecommons.org/licenses/by/4.0/).
Share and Cite
Wong, V.W.H.; Law, K.H. Fusion of CCTV Video and Spatial Information for Automated Crowd Congestion Monitoring in Public Urban Spaces. Algorithms 2023, 16, 154. https://doi.org/10.3390/a16030154
Wong VWH, Law KH. Fusion of CCTV Video and Spatial Information for Automated Crowd Congestion Monitoring in Public Urban Spaces. Algorithms. 2023; 16(3):154. https://doi.org/10.3390/a16030154
Chicago/Turabian StyleWong, Vivian W. H., and Kincho H. Law. 2023. "Fusion of CCTV Video and Spatial Information for Automated Crowd Congestion Monitoring in Public Urban Spaces" Algorithms 16, no. 3: 154. https://doi.org/10.3390/a16030154